1. Introduction
Coastal zones are areas where land and sea interact and are rich in natural resources [
1]. In addition to acting as complex and dynamic natural systems, these areas are subjected to high-intensity human activities and are impacted by global climate change [
2]. Coastal zones have a flat terrain and a pleasant climate and are thus generally highly populated with a well-developed socio-economic system [
3]; for example, more than one-third of the world’s population lives within 150 km of a coastal zone [
4,
5]. The coastal zone of mainland China accounts for approximately 13% of the country’s land area, hosts 42% of the population, and produces more than 60% of the country’s GDP. Thus, it become a crucial area and a “golden zone” in China’s economic development [
2,
6]. However, shocks can have adverse effects on coastal zones. With respect to land-based pressures, industrial, agricultural, and domestic wastewater is discharged in such areas, solid waste is disposed of, water conservation projects are constructed, and sea sand is mined, among other factors adversely affecting these zones. Coastal zones are also subjected to various forms of natural disasters [
7], such as storm surges, tsunamis, and typhoons (hurricanes), resulting in human casualties, the destruction of towns, coastal erosion, the salinization of estuaries and coastal plains, and other adverse events that affect coastal zone eco-systems and human lives. Furthermore, increases in the sea level due to global temperature changes severely affect coastal zones. There are also effects associated with interactions between the land and sea, such as those associated with sea farming, urban construction, and the construction of seawall protection projects, which can result in water pollution, ecosystem pattern changes, and coastal wetland loss. Intense human use and development activities have greatly affected coastal zones [
8,
9]. After years of anthropogenic interventions, the coastal zone has formed a nonlinear, complex land–sea interaction system influenced by multiple factors associated with both land and sea, and all aspects and elements within the system are coupled with and have adapted to each other. Therefore, coastal zones form various developmental states (economic, social prosperity and poor ecological environment, and superior ecological environment with lagging economic and social development), that directly affect the overall developmental quality of the coastal zone.
To identify the factors influencing coastal zone development, we conducted a literature review. In studies of coastal zones or regional sustainable development, coupled coordination methods are frequently used to treat the study object as a composite system and to explore the interactions and collaborations between different subsystems or elements of the coastal zone [
10,
11,
12,
13,
14]. The indicators used to evaluate the developmental quality of different subsystems within the coastal zone are mainly selected in relation to the natural environment, population, economy, government management, and social development [
15,
16,
17,
18]. Xiao et al. [
18] established an evaluation indicator system for a coupled marine industry cluster and city development based on input–output data and marine enterprise data of coastal cities and explored the coupled development relationship. Qv et al. [
16] used the technical method of similarity ranking with an ideal solution to improve the coupled coordination model, and analyzed the coupled and coordinated development relationship between the two subsystems in 10 coastal cities. In addition, Shang and Liu. [
17] proposed countermeasures for the sustainable development of Chinese coastal zone cities using the coupling coordination degree model. Lin et al. [
15] quantitatively analyzed the land–sea coordination degree of the Xiamen coastal zone by shore section and proposed spatial planning guidelines for different shore sections with the goal of land–sea integration.
To alleviate the ecological, environmental and social problems arising from the coastal zone, various countries and international organizations have adopted integrated coastal zone management approaches to achieve sustainable and coordinated coastal zone development [
19]. As early as 1972, the United States proposed managing coastal zones through "integrated development, rational protection and optimal decision-making". In 1992, the United Nations Agenda 21 proposed a framework for integrated coastal zone management, which involves the marine and terrestrial sectors and multiple interests [
20]. In 1998, the Australian government issued the ‘Australian Oceans Policy’, the implementation of which covers biological, navigational, environmental, and marine law enforcement [
21]. In 2003, the EU developed a system of progress indicators for coastal zone management, covering economic, social and environmental aspects [
22]. Many countries and international organizations have recognized that coastal zone management requires coordination among multiple parties and the application of an integrated perspective for its development.
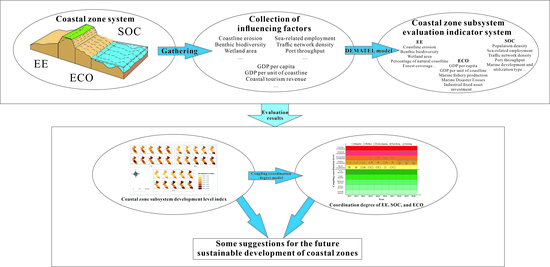
Numerous studies as well as government management have shown that the coastal zone system is divided into three major categories: the ecological environment, the economy, and society. We selected the evaluation indicators based on the attribute characteristics of these three aspects, which were used as a reference for designing the evaluation indicator system for the coastal zone subsystems. However, we found two main limitations associated with previous studies: (1) the spatial evaluation scope of the coastal zone is relatively broad, and the concept and scope of the actual needs and management responsibilities of coastal area development have not been clearly defined, and (2) the selection of the evaluation indicators for the coastal zone subsystem was highly subjective, and no indicator screening was conducted based on objective analytical methods. Therefore, this study was conducted to (1) define the evaluation scope of the coastal zone in terms of the administrative boundaries between land and sea to enable effective coastal zone management; (2) apply the DEMATEL model to identify key factors affecting coastal zone development; construct an indicator evaluation system based on three subsystems: the ecological environment (EE), society (SOC), and economy (ECO) subsystems, and evaluate the developmental level of each subsystem; and (3) we use the coupled coordination degree model to study the ten-year correlation mechanism among the coastal zone subsystems of China’s Yellow Sea coast and explore the detailed mechanisms involved in the mutual influences and collaborations between the subsystems. The goal of this study was to better reflect dynamic changes in the developmental levels of the EE, SOC, and SOC subsystems within the coastal zone in different periods.
2. Materials and Methods
2.1. Study Scope
Since China’s reform and opening up, there has been a large influx of capital, labor, and technology in the eastern coastal region, leading to great achievements [
23].To examine the coordinated development of the EE, SOC, and ECO subsystems in the coastal zone, five cities along the Yellow Sea were selected as the study areas: Qingdao, Rizhao, Lianyungang, Yancheng, and Nantong (
Figure 1).These cities are in the middle part of the eastern coast, where the water quality is excellent and the climate is pleasant. The area is rich in tourism and marine biological resources. Large wetland tidal flats lie in the center and to the south (
Figure 1) and are important for the migration and roosting of birds; these regions have both high scientific research and tourism value. With a large population and economic volume, the five cities are important development engines for China. The sea is mostly open and the coast is only 500 km from the Korean Peninsula. Relying on the natural advantages of Jiaozhou Bay, Haizhou Bay, and Tongzhou Bay, many foreign trade ports have been built, including Qingdao Port, Lianyungang Port, and Nantong Port, which are hubs for foreign sea transportation and national transport inland. This region was selected as the study area because of its important role in the economy of China’s coastal area and its large impact on the ecological environment of the eastern coastal region.
The definitions used in this study are mainly based on both the natural tidal or wave activity law and human demand for using the coastal zone [
24] and those for the coastal zone are based on the coastline extending landward and seaward over a certain range of areas [
2,
25]. Development of coastal zones must involve consideration of human–land relationships [
26], and human activities should be controlled based on clearly defined management strategies. In China, municipal administrative regions are generally used as the main control unit for unified marine development and management. For the convenience of data acquisition and the practical needs of this study, we define the coastal zone as an area extending to the administrative unit of the prefecture-level city on the landward side, and all sea areas under the jurisdiction of the administrative unit on the seaward side (
Figure 1).
2.2. Key Factors Influencing the Identification Method
Coastal zones are complex and nonlinear systems in which elements are interconnected and interact. The material circulation, energy flow, and information transferred within the system depend on the interaction and collaboration among the elements and subsystems, and effective processes are key to the sustainable operation of the entire system. Numerous and complex internal elements affect the development of the system. To eliminate weaker factors, we selected the key elements from among the many influential factors with an obvious influence on the system and a greater influence on other elements to build an evaluation index system of the coastal zone subsystem and provide a research basis for the subsequent coupling and coordination association mechanism of each subsystem.
The DEMATEL (Decision making trial and evaluation laboratory) model was used to analyze and identify the key factors affecting coastal zone development. This model was proposed by Professors Gabus and Fontela of Battelle Laboratories in the United States at a conference in Geneva in 1971 and was developed to solve complex and difficult problems in the real world. This systematic analysis method uses graphical and matrix tools [
27,
28] to determine the strength of an influential relationship between elements in a complex system, establish a judgment matrix, and perform corresponding matrix operations to derive the row sum (
) and column sum (
) of each element and each element of the complex system. The sum and difference relationship of each element
and
are the prominence (
) and relation (
) of each element with respect to the complex system. Key factors were identified through a comprehensive analysis of the
and
indicators of the system factors.
The specific calculation steps of the DEMATEL model are described below:
Step 1. System information was collected. All factors influencing the study system were collected, including those influencing the internal and external environments. Based on the collected system information, the n elements contained in the system were denoted as
Step 2. A direct influence matrix was generated. Experts in related fields were invited to judge the influence of the strength relationship between factors within a complex system on a scale of 0, 1, 2, 3, and 4, where 0 means no influence, 1 means very little influence, 2 means some or little influence, 3 means great influence, and 4 means great influence. The direct-influence matrix,
Z, was then obtained,
where
indicates the degree of direct influence of factor
on factor
. If
, then
.
Step 3. The normalized direct-influence matrix was established. Each row and column factor of the direct-influence matrix, Z, was summed, and the maximum value was selected (Equation (1)). Each value of the matrix, Z, was then divided by the maximum value (Equation (2)) to obtain the normalized direct-influence matrix, X =
where
is a unit matrix.
Step 5. , , , and were calculated for each factor using the following formula,
is the sum of the values of the influence of factor
on other factors:
is the sum of the values of factor
influenced by the other factors:
is the sum of
and
for factor
(and the larger the
, the more significant the influence of the factor on the system):
is the difference between
and
for factor
(where a larger
indicates that the other factors are susceptible to the influence of that factor):
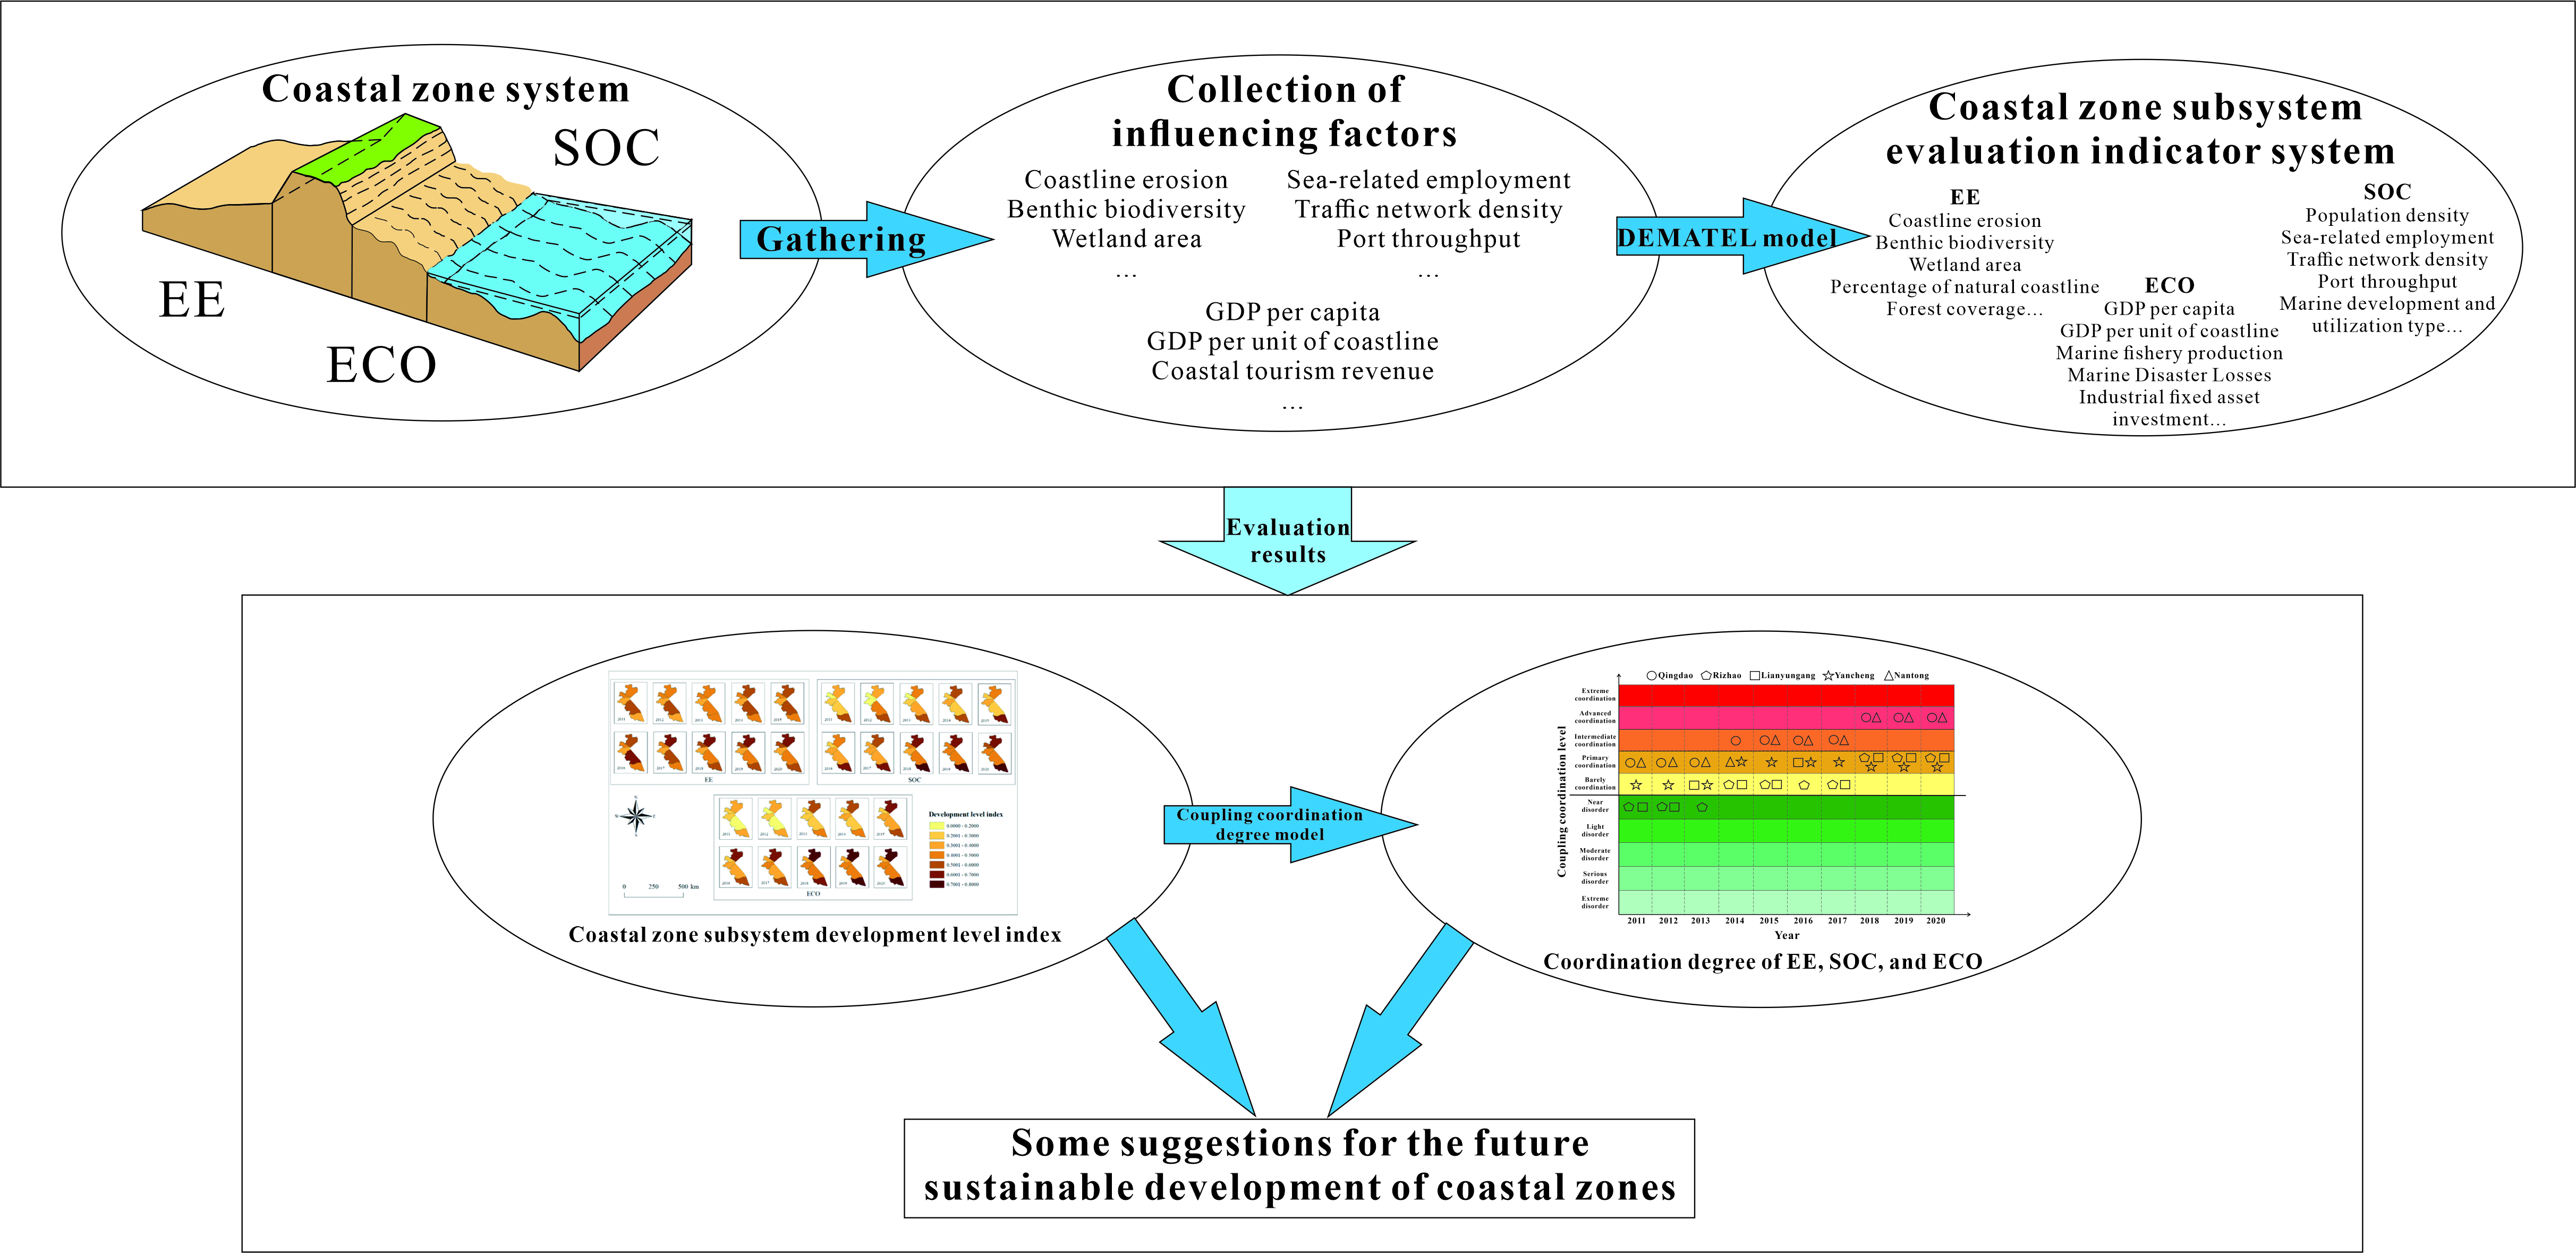
Step 6. The system’s key factors were identified. With as the horizontal axis, as the vertical axis, and (, ) as the coordinates, an influence correlation diagram was drawn to comprehensively analyze the cause-effect relationship of the factors within the complex system and to then identify the key factors.
2.3. Weight Determination Method
To avoid unpredictable effects from differences between dimensions, the initial matrix was first formed using all data, X = (xij)mn, i = 1,2, ⋯, n; j = 1,2, ⋯, m, where m is the number of indicators, n is the number of studies, and xij is the j-th indicator value of the i-th city. The indicators were divided into benefit and cost indicators, based on the needs of the study. The formulas for standardizing both types of indicators are as follows:
For the benefit indicator:
To overcome the influence of subjective evaluation and reduce error, the indicator information entropy
ei was used to determine the indicator weights [
29], and the formula for indicator information entropy is as follows:
where,
n is the number of indicators, and
is the indicator weights.
The coastal zone subsystem evaluation index was used to represent the level of subsystem development in accordance with the following formula,
where
is the sum of the product of all indicator weights (
) and standardized values (
) within the subsystem.
2.4. Coupling Coordination Degree Model
Coupling and coordination degree models are used to reflect the interdependence and constraints between systems and have been widely used in research within the socioeconomic, biological, agricultural, and ecological domains [
17]. Coupling was derived from a physical concept [
30] to describe the interaction between systems or elements, their influence on each other, and the degree of interaction [
10].The degree of coordination reflects whether there is orderly development between two or more systems, or elements within the system and whether the interaction between them is benign [
31,
32]. Coupling and coordination between the EE, SOC, and ECO subsystems in the coastal zone were analyzed to illustrate the degree of interconnection and interaction among the subsystems in the development process and to reflect trends in the system interactions from disorder to order. In this respect, a greater degree of coordination indicates that the coastal zone system has a higher level of development, good adaptation, benign interaction between subsystems, and a good degree of coordination.
The capacity coupling coefficient model in physics was used to calculate the coupling degree of the coastal zone to construct the coordination evaluation model of the land–sea interaction process as follows,
where
denotes the coupling degree. The larger the value, the better the coupling degree, and a large value indicates that the systems influence each other and are closely related.
is the coastal zone comprehensive evaluation index and ,,∈[0, 1], and ++=1. Considering that each subsystem is equally important, α = β = γ = 1/3.
The coordination model is calculated as:
where
is the coordination degree. The larger the value of
, the better it reflects a benign interaction relationship and a collaborative orderliness between systems.
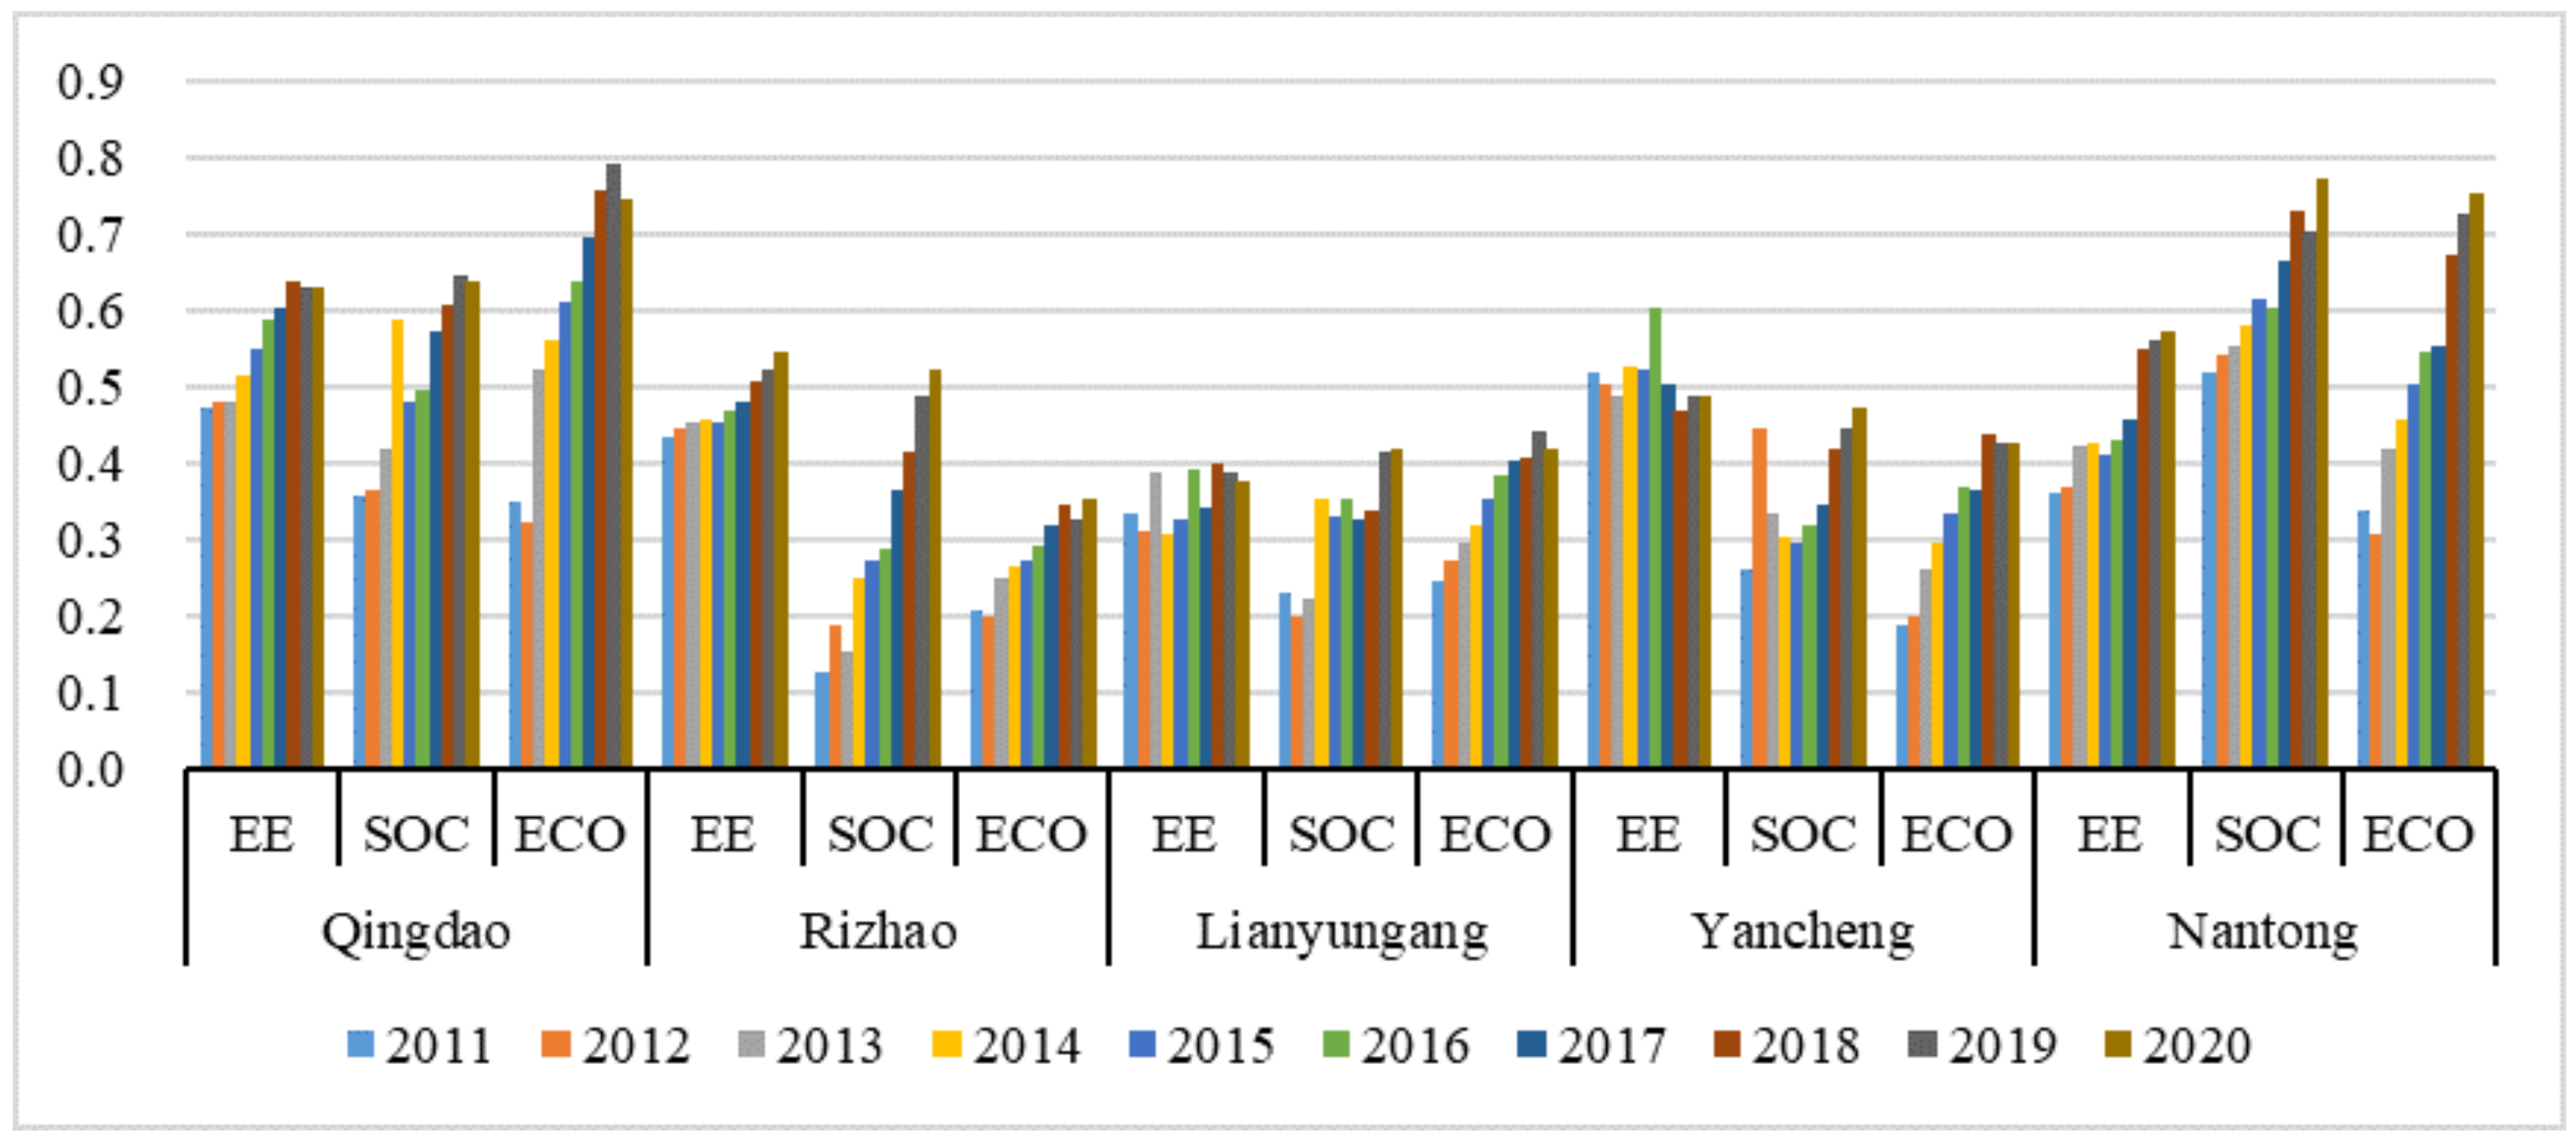
To describe the coordination levels of the three subsystems EE, SOC, and ECO of the coastal zone system [
16,
17], we divided the calculation results into ten levels (
Table 1).
3. Results
To determine the quantitative relationship between the EE, SOC, and ECO subsystems for the five coastal cities along the Yellow Sea, data from 2011 to 2020 were collected. The initial indicator values were collected from the China Marine Statistical Yearbook (2011–2017), China Marine Disaster Bulletin (2011–2020), Jiangsu Statistical Yearbook (2011–2020), Shandong Statistical Yearbook (2011–2020), Jiangsu Marine Environmental Quality Bulletin (2011–2020), Jiangsu Marine Disaster Bulletin (2011–2020), Qingdao Marine Environment Bulletin (2012–2017), Qingdao Statistical Yearbook (2011–2020), Rizhao Statistical Yearbook (2011–2020), Lianyungang Statistical Yearbook (2011–2020), Yancheng Statistical Yearbook (2011–2020), and Nantong Statistical Yearbook (2011–2020 ).
3.1. Key Influencing Factors Identification Results
We combined the analysis of the literature on the coupling and coordination of coastal zones and urban sustainable development with relevant expert opinions and practical experience. We summarized 24 influencing factors from three major aspects– ecological environment, society, and the economy, and formed a collection of influencing factors for coastal zone development (
Table 2).
The DEMATEL model was used to calculate the
and
of each factor for the coastal zone system and to establish a causal coordinate system (with
and
as the horizontal axis and the vertical axis, respectively) (
Figure 2) to identify the key influential factors affecting coastal zone development. These key influential factors were organized and combined with the data used to establish the coastal zone subsystem evaluation indicator system (
Table 3).
We identified 20 key factors affecting the development of the coastal zone. The final evaluation indicator system included seven EE, six SOC, and seven ECO indicators (
Table 3).
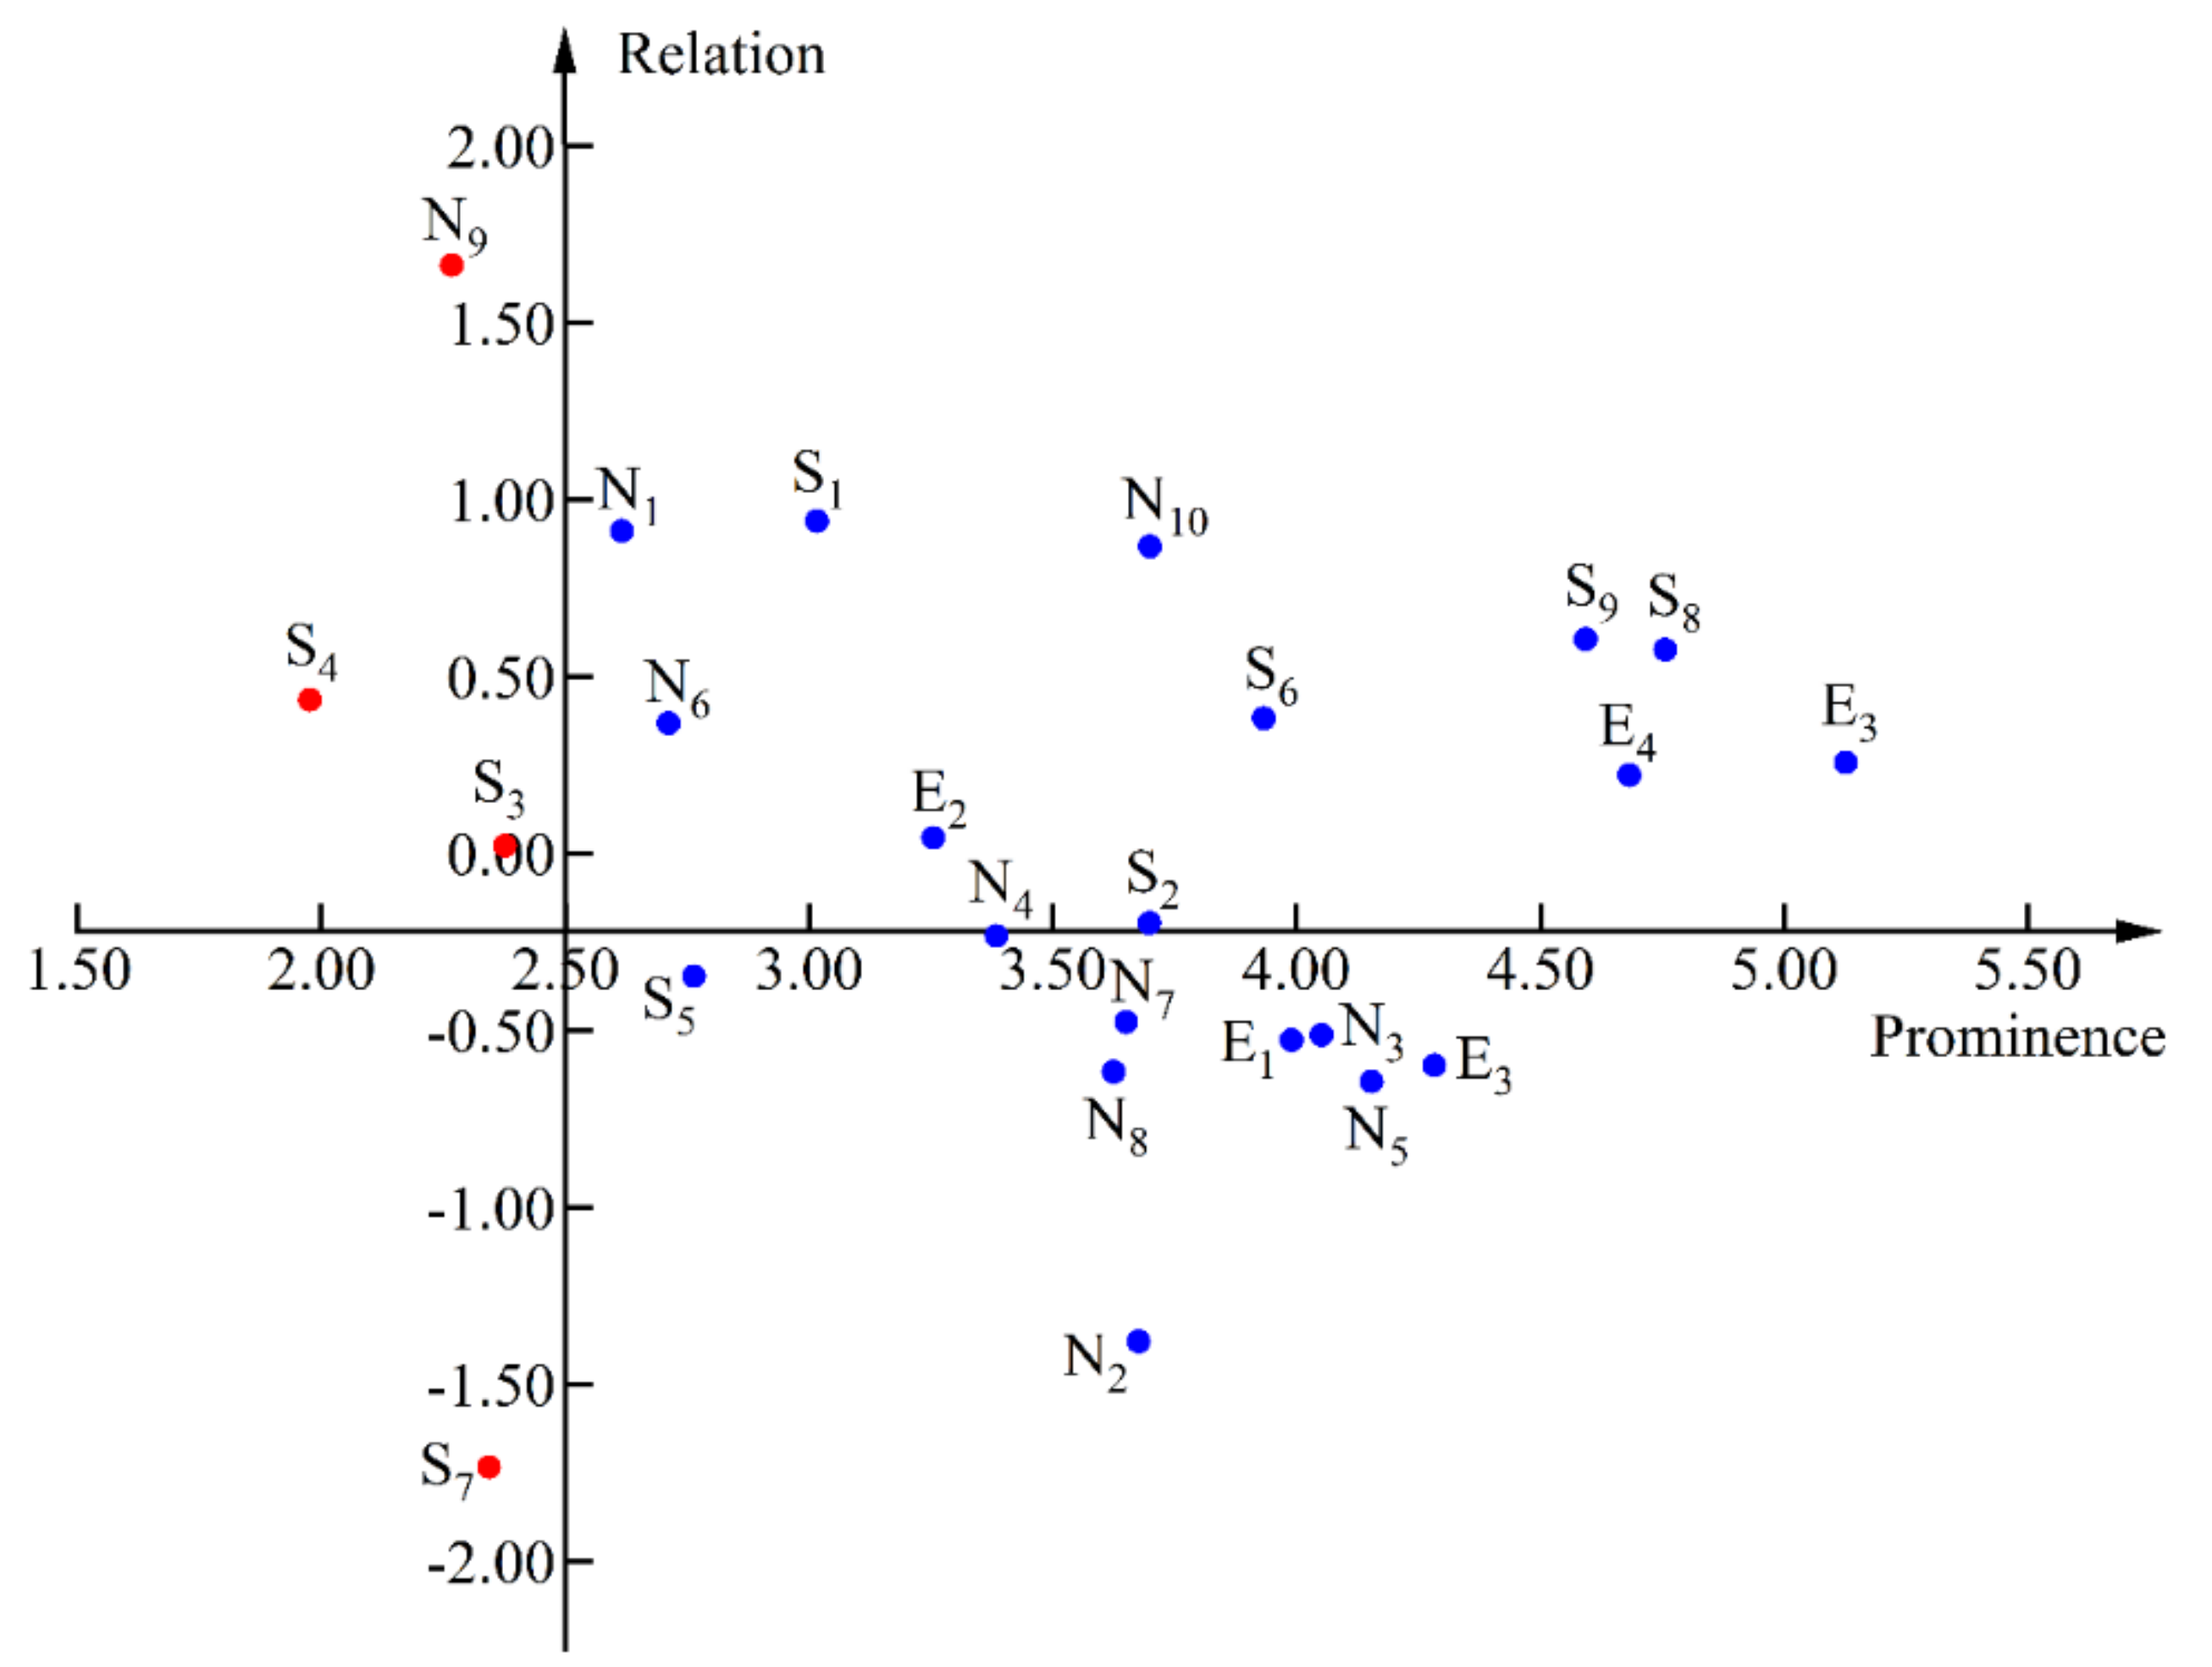
3.2. Results of the Subsystem Development Level
Equations (8) and (9) were used to calculate the standardized values of the indicators, Equations (10) and (11) were used to calculate the indicator weights (as shown in the final column in
Table 3), and Equation (12) was used to obtain the evaluation index of each subsystem (
Figure 3).
In general, the Qingdao and Nantong coastal zones showed high mean indices for the EE, SOC, and ECO subsystems, whereas Yancheng and Rizhao also showed high levels for EE the subsystem. In terms of the annual growth rate, Rizhao’s SOC subsystem achieved high growth (15.47%), whereas Yancheng’s EE subsystem underwent negative growth (
Figure 3;
Table 4). The three subsystems in Qingdao had a high level of development and good synergy (mean value of the subsystems was 0.5–0.6), mainly because of the region’s expertise in marine disaster management, biological habitat protection, sea water quality improvement, marine utilization transformation and utilization rates, real economy investment, coastal tourism, and technological progress. The exponential growth in the SOC subsystem in Rizhao was highly related to the contribution from the EE subsystem, which in turn led to improvements in the ECO subsystem. Implementation of an ecological priority strategy has increased infrastructure within the region, transformed the marine utilization mode, and improved the utilization rate of resources. In addition, Rizhao has attracted foreign investment and technical talent and its overall coastal zone development level has improved. The EE subsystem of Yancheng showed negative growth, whereas the SOC and ECO subsystems achieved high growth rates. It is possible that the area developed with a preference for economic and social benefits, resulting in ecological and environmental protection being neglected. The local government should conduct appropriate ecological restoration work to address specific environmental problems. The developmental levels of the three subsystems in Lianyungang were the lowest, indicating certain constraining relationships and conflicts with coastal zone development. Although the annual growth rates of the three subsystems have been positive for the last decade, EE and SOC showed fluctuations(
Figure 3). These results are related to the increased artificiality of natural coastlines due to regional economic development needs and the wastage of marine resources due to extensive marine utilization practices. Although certain ECO and SOC benefits have been achieved, deficiencies in the developmental approach have not been fundamentally resolved, ultimately resulting in collective low-level subsystems.
The time series (
Figure 3) showed an increasing trend for the evaluation level of the five regional coastal zone subsystems in most years, indicating improvements in the SOC, ECO, and EE subsystems within the Yellow Sea coastal area over the last decade. In terms of spatial characteristics (
Figure 4), we found that in the early period, Yancheng in the center had the highest EE level, but this was overtaken by Qingdao in the north and Nantong in the south after 2018. This trend of high levels in the north and south and low levels in the central area was maintained until 2020. Overall, the SOC and ECO subsystems showed a trend of being high in the north and south and low in the central region. Therefore, the spatial characteristics of the three subsystems were as follows: the EE subsystems were superior in the northern and central parts throughout the early-stage development period, whereas the SOC and ECO subsystems were better developed in the north and south. In the later period, the development of the north and south was rapid, and the three subsystems show the north and south poles, whereas the development gap with the central region has gradually widened. The main reasons for this spatial disparity are that Qingdao in the north and Nantong in the south have their own economic foundations, investment in environmental protection and society in the later processes have gradually increased, and the quality of the EE subsystem level has significantly improved. In contrast, the ECO levels of Rizhao, Yancheng, and Lianyungang in the central region have become relatively poor because capital, technology, and talent are lacking and some cities have had to rely on, or sacrifice, some of the EE to ensure their continued development.
3.3. Results of Coupling Coordination between Subsystems
The degrees of coupling and coordination (
and
) between the EE, SCO, and ECO subsystems were calculated using Equations (5)–(7). The
represents the extent to which the subsystems interact and influence each other and how closely they interact, regardless of their associated benefits or disadvantages. The
reflects whether development among the subsystems is orderly and how well the subsystems collaborate. The results showed that the
was high between the subsystems of the coastal zone in each region (mean value > 0.9) (
Table 5), demonstrating that the subsystems in the study area interact well and are closely connected. The
between the subsystems in each regional coastal zone was relatively low (
Table 6), but the
trend increased over time, indicating that the coordination between the subsystems is developing and mutual adaptation and positive interaction among the systems are gradually improving.
With respect to the
and
relationships, the following observations were made: (1) When the
of each subsystem was low, the
was also low. In this respect, coupling between Rizhao and Yancheng was weak in the early years and the
was relatively low, suggesting that each subsystem was at a low developmental level in these two regions during the early years. In addition, the coupling ability between the systems was poorer than that of the other cities, and there was a lack of positive interaction between the subsystems, resulting in poor coordination. Thus, the
can be based on the
and the
is limited by the
. (2) When the
of each subsystem was high (mean value > 0.9878), there were differences between the
. High
levels have been maintained in Qingdao, Lianyungang, and Nantong over the past decade. The levels of Qingdao and Nantong were greater than 0.7 in most years, whereas that of Lianyungang was relatively low with a maximum
of less than 0.65 (
Table 6). These results indicate that the subsystems in Qingdao and Nantong are closely interconnected with positive interactions and adaptability between the systems, and each subsystem contributed to coastal zone coherence. Lianyungang showed a high
, but it was less coordinated, and there were fewer positive interactions between the sub-systems. These results are related to the conflict between the ecological environment and the development approach arising from the development of the subsystems in the region.
During the last 10 years, the
between the coastal zone subsystems of the five cities has increased, and coordination between the systems has improved. The year-by-year coordination levels of the five cities show that Qingdao and Nantong had the highest original levels in 2011 and reached the primary coordination level. Yancheng had the next highest level and reached a barely coordinated level (
Figure 5). Lianyungang and Rizhao were ranked lowest (Near disorder) and were in a disordered state. All five cities entered a coordinated state after 2014. From a regional perspective, Qingdao and Nantong maintained a high
level and an advanced coordination level after 2018. A higher level of coupling coordination was achieved among the EE, SOC, and ECO subsystems. After 2018, both
levels advanced (
Figure 5), which was related to a two-level leap between the two cities in a decade. Although Rizhao and Lianyungang did not show a high original coordination level, they achieved a two-level leap from near disorder to primary coordination after many years of development. However, Yancheng has remained at a primary coordination level since 2014, and coordination among the EE, SOC, and ECO subsystems has developed more slowly.
4. Discussion
We investigated the level of development and the mechanism of coordinated interactions among subsystems of the coastal zone. Previous coordination studies also focused on coastal areas, but mostly focused on land areas [
10,
16]. The selection of the evaluation indicators is often set based on experience and relevant previous literature [
11] and no appropriate model has been adopted to screen the indicators. We considered the coastal zone as a whole and examined the land and sea areas in one evaluation system to explore the coordinated development between the subsystems, which is in line with the concept of land–sea coordination currently advocated by China in marine management. In addition, the DEMATAL model was used to select evaluation indices, eliminate factors with little impact on the system, and construct a coastal zone evaluation index system based on the key factors. Compared with previous studies, the determination of the spatial scope of the study area is closer to the needs of coastal zone management, the design of the evaluation indicators is more reasonable and objective, and the evaluation results reflect the actual situation of the interactions and collaborations among the coastal zone subsystems in the study area.
According to Equation (15), the is a function of the and the coastal zone comprehensive evaluation index and is positively correlated with both. The comprehensive evaluation index of the coastal zone was influenced by the level of the evaluation index of each subsystem, which showed a positive correlation. Thus, the development of the subsystems in the coastal zone may directly affect the . Therefore, effective paths to the future coordinated development of coastal zones can be explored by examining the developmental law and coupled coordination mechanism of each regional coastal zone subsystem. In this respect, (1) the development of each subsystem in Qingdao and Nantong underwent rapid growth over the last decade, with minimal changes in the but a significant increase in the , indicating that improvement in the development level of each subsystem was the fundamental factor affecting the in the two regions. Qingdao’s “Qingdao City Sea Coastal Zone Protection and Utilization Plan”, which was initiated in 2015, and Nantong’s “Nantong Three-Year Action Plan for Coastline Remediation and Restoration (2018–2020)”, which was initiated in 2018, have directly enhanced the EE subsystem, and a large amount of capital investment and the introduction of technology have led to the development of the SOC subsystem and the consequent enhancement of the ECO subsystem. This has increased the positive interaction between the subsystems, resulting in effective coastal zone development. These results also confirm that improvements in the quality of the EE subsystem have a large positive effect on the SOC and ECO subsystems. However, Qingdao has experienced a slight decline in the EE subsystem in recent years, and thus it is necessary to focus on protecting the ecological environment and particularly marine life protection in the future. In addition, in Qingdao in 2020, the development of the SOC and ECO subsystems decreased because of the impact of COVID-19, mainly via decreases in marine development activities, coastal tourism revenue, and technological investment. Thus, the local government should increase the input of funds to ensure that work and production resume in accordance with epidemic prevention policies. Furthermore, the developmental level of the EE subsystem in Nantong is lower than that of the SOC and ECO subsystems, and measures are needed to improve the development level of this subsystem and raise the . (2) Rizhao showed a good EE foundation, and the annual evaluation level index of the EE subsystem was higher than that of the SOC and ECO subsystems in the current year. The EE annual growth rate, although not as large as that of ECO, developed rapidly after 2018. The SOC has also grown exponentially, and its development levels have quadrupled over the last decade. Superficially, the Rizhao coastal zone subsystem appears to have been unevenly developed, and the is not as good as that of other regions. However, the region is actively developing the natural ecological environment, tourism, and eco-industry, driving population mobility and employment and making economic and social progress, thus improving the among the subsystems. If Rizhao further deepens its ecological priority strategy, its SOC and ECO subsystems will benefit and the coordination level will be greatly improved. (3) The low of Yancheng in the early years was related to the large gap in the EE, SOC, and ECO development levels. Because of the need for regional development, Yancheng developed the SOC and ECO subsystems by maximizing its unique ecological environment potential and exploiting mudflats. The development levels among the subsystems gradually synergized and the and improved. Although certain achievements have been made in Yancheng, the natural ecological environment has been negatively impacted. This area should focus on protecting the ecological environment. (4) The of Lianyungang fluctuates and is closely related to the fluctuating development of each subsystem. Among the subsystems, there has been a greater fluctuation in the EE evaluation index, whereas that of SOC has undergone cyclical fluctuations of 3–4 years; however, both subsystems have maintained a generally upward trend and the ECO subsystem has maintained an increasing trend. The fluctuating processes of the EE and SOC subsystems caused the to fluctuate significantly, which also resulted in the showing a fluctuating upward trend. This fluctuation may have resulted from the conflict between the EE, SOC, and ECO subsystems, which competing by each subsystem, wax and wane , or increase and decrease in the development process. The upward trend may also be related to continuous regulations enforced by the local government to maintain subsystem stability.
Based on the analysis of the evaluation results, we found three types of coordinated interactions among the subsystems: (1) The subsystems progress simultaneously and interact positively, creating a coordinated development trend. (2) The subsystems compete with each other and fluctuate during development; and (3) The focus is on developing ECO and SOC and neglecting environmental protection. The three approaches reflect the different development paths of the coastal zone in the study area, which reminds us that the government should coordinate the development interests of all parties, and that the quality of the coastal zone development can be improved if all subsystems interact in a benign manner and make concerted progress in the future.
5. Conclusions and Suggestions
We assessed the coordinated developmental levels of the EE, SOC, and ECO subsystems in five regions of the Yellow Sea coast of China. The DEMATEL model was employed to identify 20 key factors influencing coastal zone development, and an indicator system for evaluating coastal zone subsystems was constructed. The indicator weights of the different subsystems were determined using the entropy method, which reduced the influence of subjective opinions to some extent. The and of the EE, SOC and ECO subsystems were calculated using the coupling coordination degree model to characterize the level of coordinated coastal zone development. The main results are as follows: (1) The levels of development of the three subsystems in the coastal zones within the study area have all improved over the past decade, and the between them has generally remained at a high level, with the between them progressing enormously. (2) Qingdao and Nantong are at a “high coordination” level, with not only a high level of subsystem development but also a high level of coupling and coordination. (3) Rizhao, Yancheng and Lianyungang are at a "primary coordination" level and show uneven development of subsystems; each region should adjust its specific development policies according to its reality and coordinate the development of each subsystem.
The contributions of this study are as follow: (1) it defines the scope of the coastal zone based on coastal zone management and combines the coastal land and sea areas into one evaluation system to explore the development trends and coordinated interaction mechanisms of the subsystems; and (2) it identifies three different interaction mechanisms for coordinated development among the subsystems from the evaluation results. The implementation of different development strategies under different mechanisms will be beneficial for the sustainable development of the coastal zone.
The following recommendations are made based on the mechanisms of coordinated interaction of the different subsystems in the study area: (1) The overall development level of the Qingdao and Nantong coastal zones is better than that of the other study areas; the has been maintained within a high-level range and the has greatly improved with the development of the subsystems. In the future, these two regions should continue to implement relevant coastal zone development and protection plans to emphasize and improve the quality of marine and nearshore ecological environments, enhance the development of the marine economy and marine scientific research, and strive to build a marine center city; (2) Rizhao and Yancheng have relied on their own specific ecological advantages to achieve development; Rizhao has developed by further improving the EE, whereas Yancheng’s development has been achieved by sacrificing part of its EE. Rizhao improved its by two levels and Yancheng improved this degree by only one level. These results demonstrate that implementing strategies that prioritize ecological development is superior to those that encourage development at the expense of the ecological environment. In the future, Rizhao should continue implementing an ecological priority strategy to promote the development of the SOC and ECO subsystems along with the EE subsystem. Yancheng should learn from Rizhao’s coastal zone development experience and increase forest coverage within the coastal zone, improve the near-shore seawater quality and the ability to withstand marine disasters, reduce economic losses, and implement ecological restoration projects in areas that have experienced considerable ecological damage. In addition, the government should actively introduce foreign investment, technology, and highly qualified personnel and adopt a more scientific and rational approachto developing marine resources. (3) the Lianyungang coastal zone is highly coupled; however, the quality of its subsystem development is low, which is related to irrational marine development activities in the area. In the future, Lianyungang should protect marine life and the near-shore ecological environment, as well as improve forest coverage and marine development and utilization. The government should conduct macro-controls to regulate contradictions and conflicts in the development process among the subsystems to improve the stability and quality of subsystem development.


