Review

Coastal Sensitivity/Vulnerability Characterization and Adaptation Strategies: A Review

1
Departamento de Ciencias de la Tierra, Facultad de Ciencias del Mar y Ambientales, Universidad de Cádiz, 11510 Puerto Real, Spain
2
Department of Civil and Building Engineering and Architecture, Università Politecnica delle Marche, 60131 Ancona, Italy
3
Department of Science and Technologies, University of Naples “Parthenope”, 80100 Naples, Italy
4
Department od Engineering, University of Naples “Parthenope”, 80100 Naples, Italy
*
Author to whom correspondence should be addressed.
J. Mar. Sci. Eng. 2021, 9(1), 72; https://0-doi-org.brum.beds.ac.uk/10.3390/jmse9010072
Submission received: 6 December 2020 / Revised: 30 December 2020 / Accepted: 4 January 2021 / Published: 12 January 2021
(This article belongs to the Special Issue Feature Reviews in Marine Science and Engineering)

Abstract

:
Coastal area constitutes a vulnerable environment and requires special attention to preserve ecosystems and human activities therein. To this aim, many studies have been devoted both in past and recent years to analyzing the main factors affecting coastal vulnerability and susceptibility. Among the most used approaches, the Coastal Vulnerability Index (CVI) accounts for all relevant variables that characterize the coastal environment dealing with: (i) forcing actions (waves, tidal range, sea-level rise, etc.), (ii) morphological characteristics (geomorphology, foreshore slope, dune features, etc.), (iii) socio-economic, ecological and cultural aspects (tourism activities, natural habitats, etc.). Each variable is evaluated at each portion of the investigated coast, and associated with a vulnerability level which usually ranges from 1 (very low vulnerability), to 5 (very high vulnerability). Following a susceptibility/vulnerability analysis of a coastal stretch, specific strategies must be chosen and implemented to favor coastal resilience and adaptation, spanning from hard solutions (e.g., groins, breakwaters, etc.) to soft solutions (e.g., beach and dune nourishment projects), to the relocation option and the establishment of accommodation strategies (e.g., emergency preparedness).

1. Introduction

Coastal vulnerability, defined as the susceptibility of a coastal area to be affected by either inundation or erosion processes, due to storms [1,2,3,4], post-tropical cyclones [5], hurricanes [6,7,8,9,10] and tsunamis [11,12,13,14], is a huge problem that affects the majority of coasts worldwide and can be reflected by the destruction of property and infrastructure [15]. A more precise definition provided by Rizzo et al. [16], states that coastal susceptibility deals with natural environments such as dunes and beaches sensitivity to erosion/flooding, while coastal vulnerability deals with human activities/uses, reason also the socio-economic aspect should be involved in coastal vulnerability studies.
There are different ways to check the susceptibility or vulnerability of a coastal area. Specifically, four different approaches can be recognized for such purpose, i.e., existing methods can be grouped into the following clusters: (1) index/indicators-based methods, (2) methods based on dynamic computer models, (3) GIS-based decision support tools, (4) visualization tools [17]. Methods falling into the first group allow one to easily compare the vulnerability of different areas, and this makes them the most applied approaches [18].
Since the evaluation of coastal susceptibility/vulnerability is of major importance, a number of indexes that try to establish beach sensitivity to the different processes involved in the coastal zone have been conceived in the last 30 years. Due to the large number of coastal processes involved, their relative importance, and their highly varying (in time and space) dynamic characteristics, many indexes have been developed so the establishment of a concise classification is not an easy task. Therefore, several approaches exist to determine coastal sensitivity/vulnerability that, besides the characterization of physical elements, require different types of data within different ranges and formulas as well as the determination of socio-economic variables (Figure 1).
The present work analyses morphological and forcing variables considered in both coastal sensitivity and vulnerability studies, but no attention is paid to aspects such as population density, the total non-local population, poverty levels, municipal wealth, etc. [19,20], which are considered in vulnerability studies. One of the most commonly used methods worldwide for assessing coastal vulnerability is the Coastal Vulnerability Index (CVI) [21,22,23], which classifies the relative susceptibility of a coastline combining different classes of vulnerability related to coastal characteristics (i.e., mean elevation, geology, coastal landforms, etc.), and to external forcing (wave height, tidal range, etc.). The CVI approach proposed by Gornitz [22] and Gornitz et al. [23], has been applied and/or adapted by numerous researchers to assess coastal vulnerability along the worldwide coastlines (e.g., [24,25,26,27,28,29,30,31,32,33,34]).
Some general considerations can be done on the more comprehensive structure of the susceptibility/vulnerability indexes. There is no “one size fits all” index of coastal vulnerability that can be applied at all scales. The components that contribute to vulnerability and the utility of an index approach vary with scale and data type and availability, which are important factors in the selection of parameters to depict vulnerability at each scale. Furthermore, an index should be based on data that have to be easily available at any given area without requiring exhaustive survey work [35]. The time taken to process data is also a consideration when data must be extracted from larger datasets or secondary data are to be derived. Another point is the index robustness [36], which means that the classification must be less influenced by subjective choices. This feature is strictly related to the frequent need for an expert opinion/judgement in the computation of vulnerability indexes and/or in the weighting of the variables that contribute to coastal vulnerability. One of the most common weighting methods is the analytical hierarchy process (AHP) that, although developed in the 1970s [37], is lately becoming more frequently used in coastal vulnerability studies [17,38]. The scores are usually assigned by experts and a comparison matrix is produced, reflecting the importance of each variable relative to all other variables. Other important points are the type and number of variables. Although Sekovski et al. [17] included only geomorphological and geological variables in their own CVI approach, arguing that the calculations should be retrieved or produced also for data-poor coastal areas, the authors stated that forcing components (e.g., sea-level change, significant wave height and tidal range) are the basis of the hydrodynamic forcing to be preferably included in CVI studies.
Regarding the variable number, Balica et al. [39] argued that an index using few variables is less reliable than one based on the use of many and more complex variables, since a large variation in one variable can have a strong influence on the overall index. However, the use of few relevant variables can be simpler because the assessment can also be performed in conditions where there are few different types of available data. In addition, choosing fewer variables can reduce redundancy (in terms of avoiding closely related variables reflecting the same processes) and help to obtain a simple, feasible index [40].
Studies of coastal vulnerability using an index approach are most commonly undertaken from global and regional perspectives. Coastal vulnerability indexes are sometimes difficult to calculate because the absence of basic data on the coastal sector that has to be analyzed, especially in developing countries and usually concerning: (i) coastal trend evolution, due to the absence of (or the difficulty of obtain) aerial photographs, their elevated costs, accuracy and limited temporal and spatial distribution, and (ii) wave energy characteristics, due to the absence of waves’ buoys records or equivalent data sets. Furthermore, coastal vulnerability indexes usually cover large areas, this way representing very useful management tools for coastal managers and researchers to have a general idea of coastal sensitivity/vulnerability, e.g., to produce inundation/erosion maps, but further and detailed studies at adequate spatial and temporal scales have than to be carried out to decide best adaptation strategies and/or each protection measure at a specific place.
Regarding the final results of the coastal vulnerability assessment, an important issue is the validation of the classification [40]. In other words, the study must verify if the area assigned with the highest vulnerability level is actually the most vulnerable to marine processes via the comparison with the results obtained through other relevant studies in that area, i.e., previously published flood-hazard maps or damage information detected from different sources, such as newspapers and TV reports, properly validated with field surveys [41].
The manuscript is structured as follows. Section 2 describes the variables used in numerous susceptibility/vulnerability indexes, while coastal adaptation strategies and government policies are illustrated in Section 3 and Section 4, respectively. Discussion and conclusions are provided in Section 5.

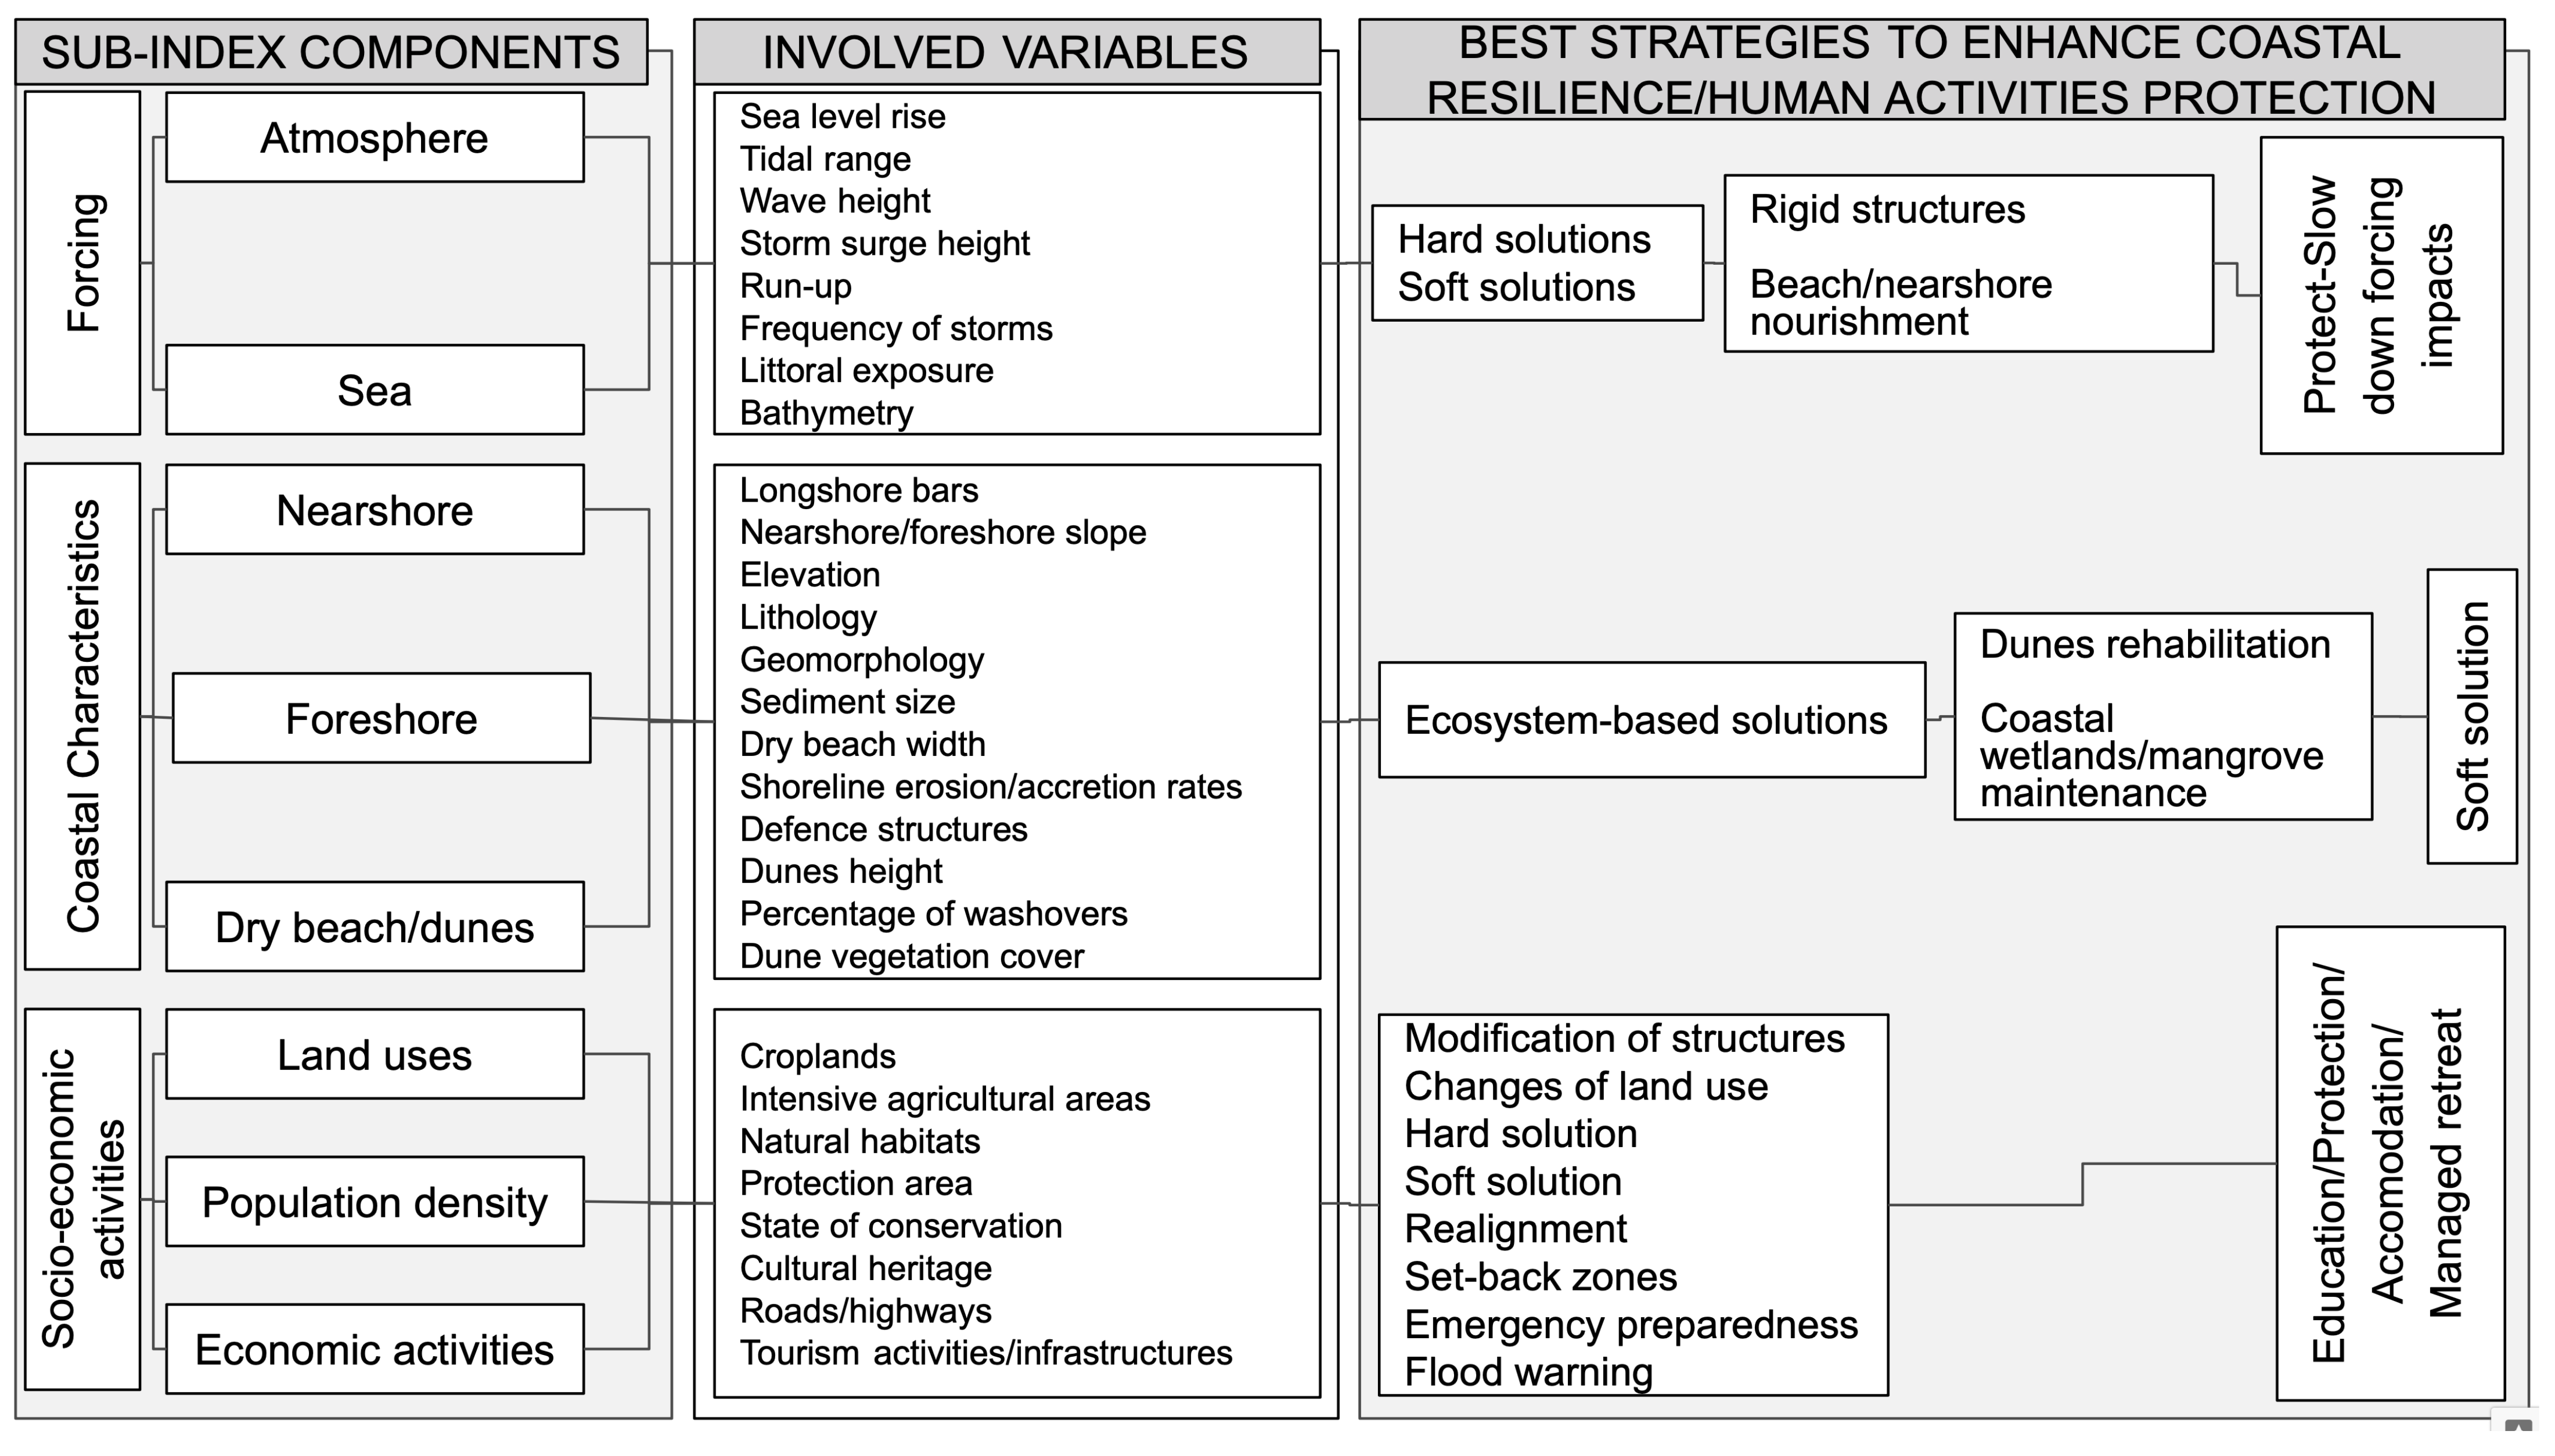
2. Susceptibility/Vulnerability Characterization

Among the index-based methods, one of the most important and diffused methodologies to assess coastal sensitivity/vulnerability is based on CVI (e.g., Gilbert and Vellinga [21], Gornitz [22]), which is considered in the present review work. Another type-1 method is based on the “Coastal-Erosion Risk Index”, which is given by the combination of the sub-indexes that describes, respectively, coastal hazard and vulnerability. The hazard sub-index is, in turn, composed of variables related to both forcing actions and morphological characteristics, while the vulnerability sub-index deals with socio-economic, ecological and cultural aspects [18,42]. Furthermore, more complex models have been recently developed and account for several separate modules and equations, e.g., the index-based method called CERA2.0, which follows a Source-Pathway-Receptor-Consequence approach and links all components of the system to well identify the risk propagation path [43].
CVI method takes into account several variables that characterize coastal environment, with the aim to describe the vulnerability of a specific coastal stretch (Table A1). Following the CVI approach, each variable is evaluated at each portion of the considered coastal area. Then, the value of each variable is associated with a specific vulnerability level, which ranges from 1, corresponding to very low vulnerability, to 5, corresponding to very high vulnerability. One of the first applications of CVI concerned the U.S. coastline [22] and was based on seven variables, although many researchers opted for a different number and different types of variables. Basically, CVI is described by the equation
CVI = i = 1 n a i n
where the Π operator represents the product among the n considered variables (n = 7, following Gornitz [22]), each defined by the term a i . In other words, CVI is the square root of the product among all variables divided by the number of variables themselves. Based on recent applications of the CVI approach all over the world (e.g., Sekovski et al. [17] Koroglu et al. [36], Díaz-Cuevas et al. [38], Rangel-Buitrago et al. [42], Narra et al. [43], Hoque et al. [44], Mohd et al. [45]), three different groups are here used to cluster all variables considered in the susceptibility/vulnerability analysis, i.e., forcing-related aspects, coastal characteristics, and socio-economic activities. Such groups and relevant variables are detailed in the following subsections.

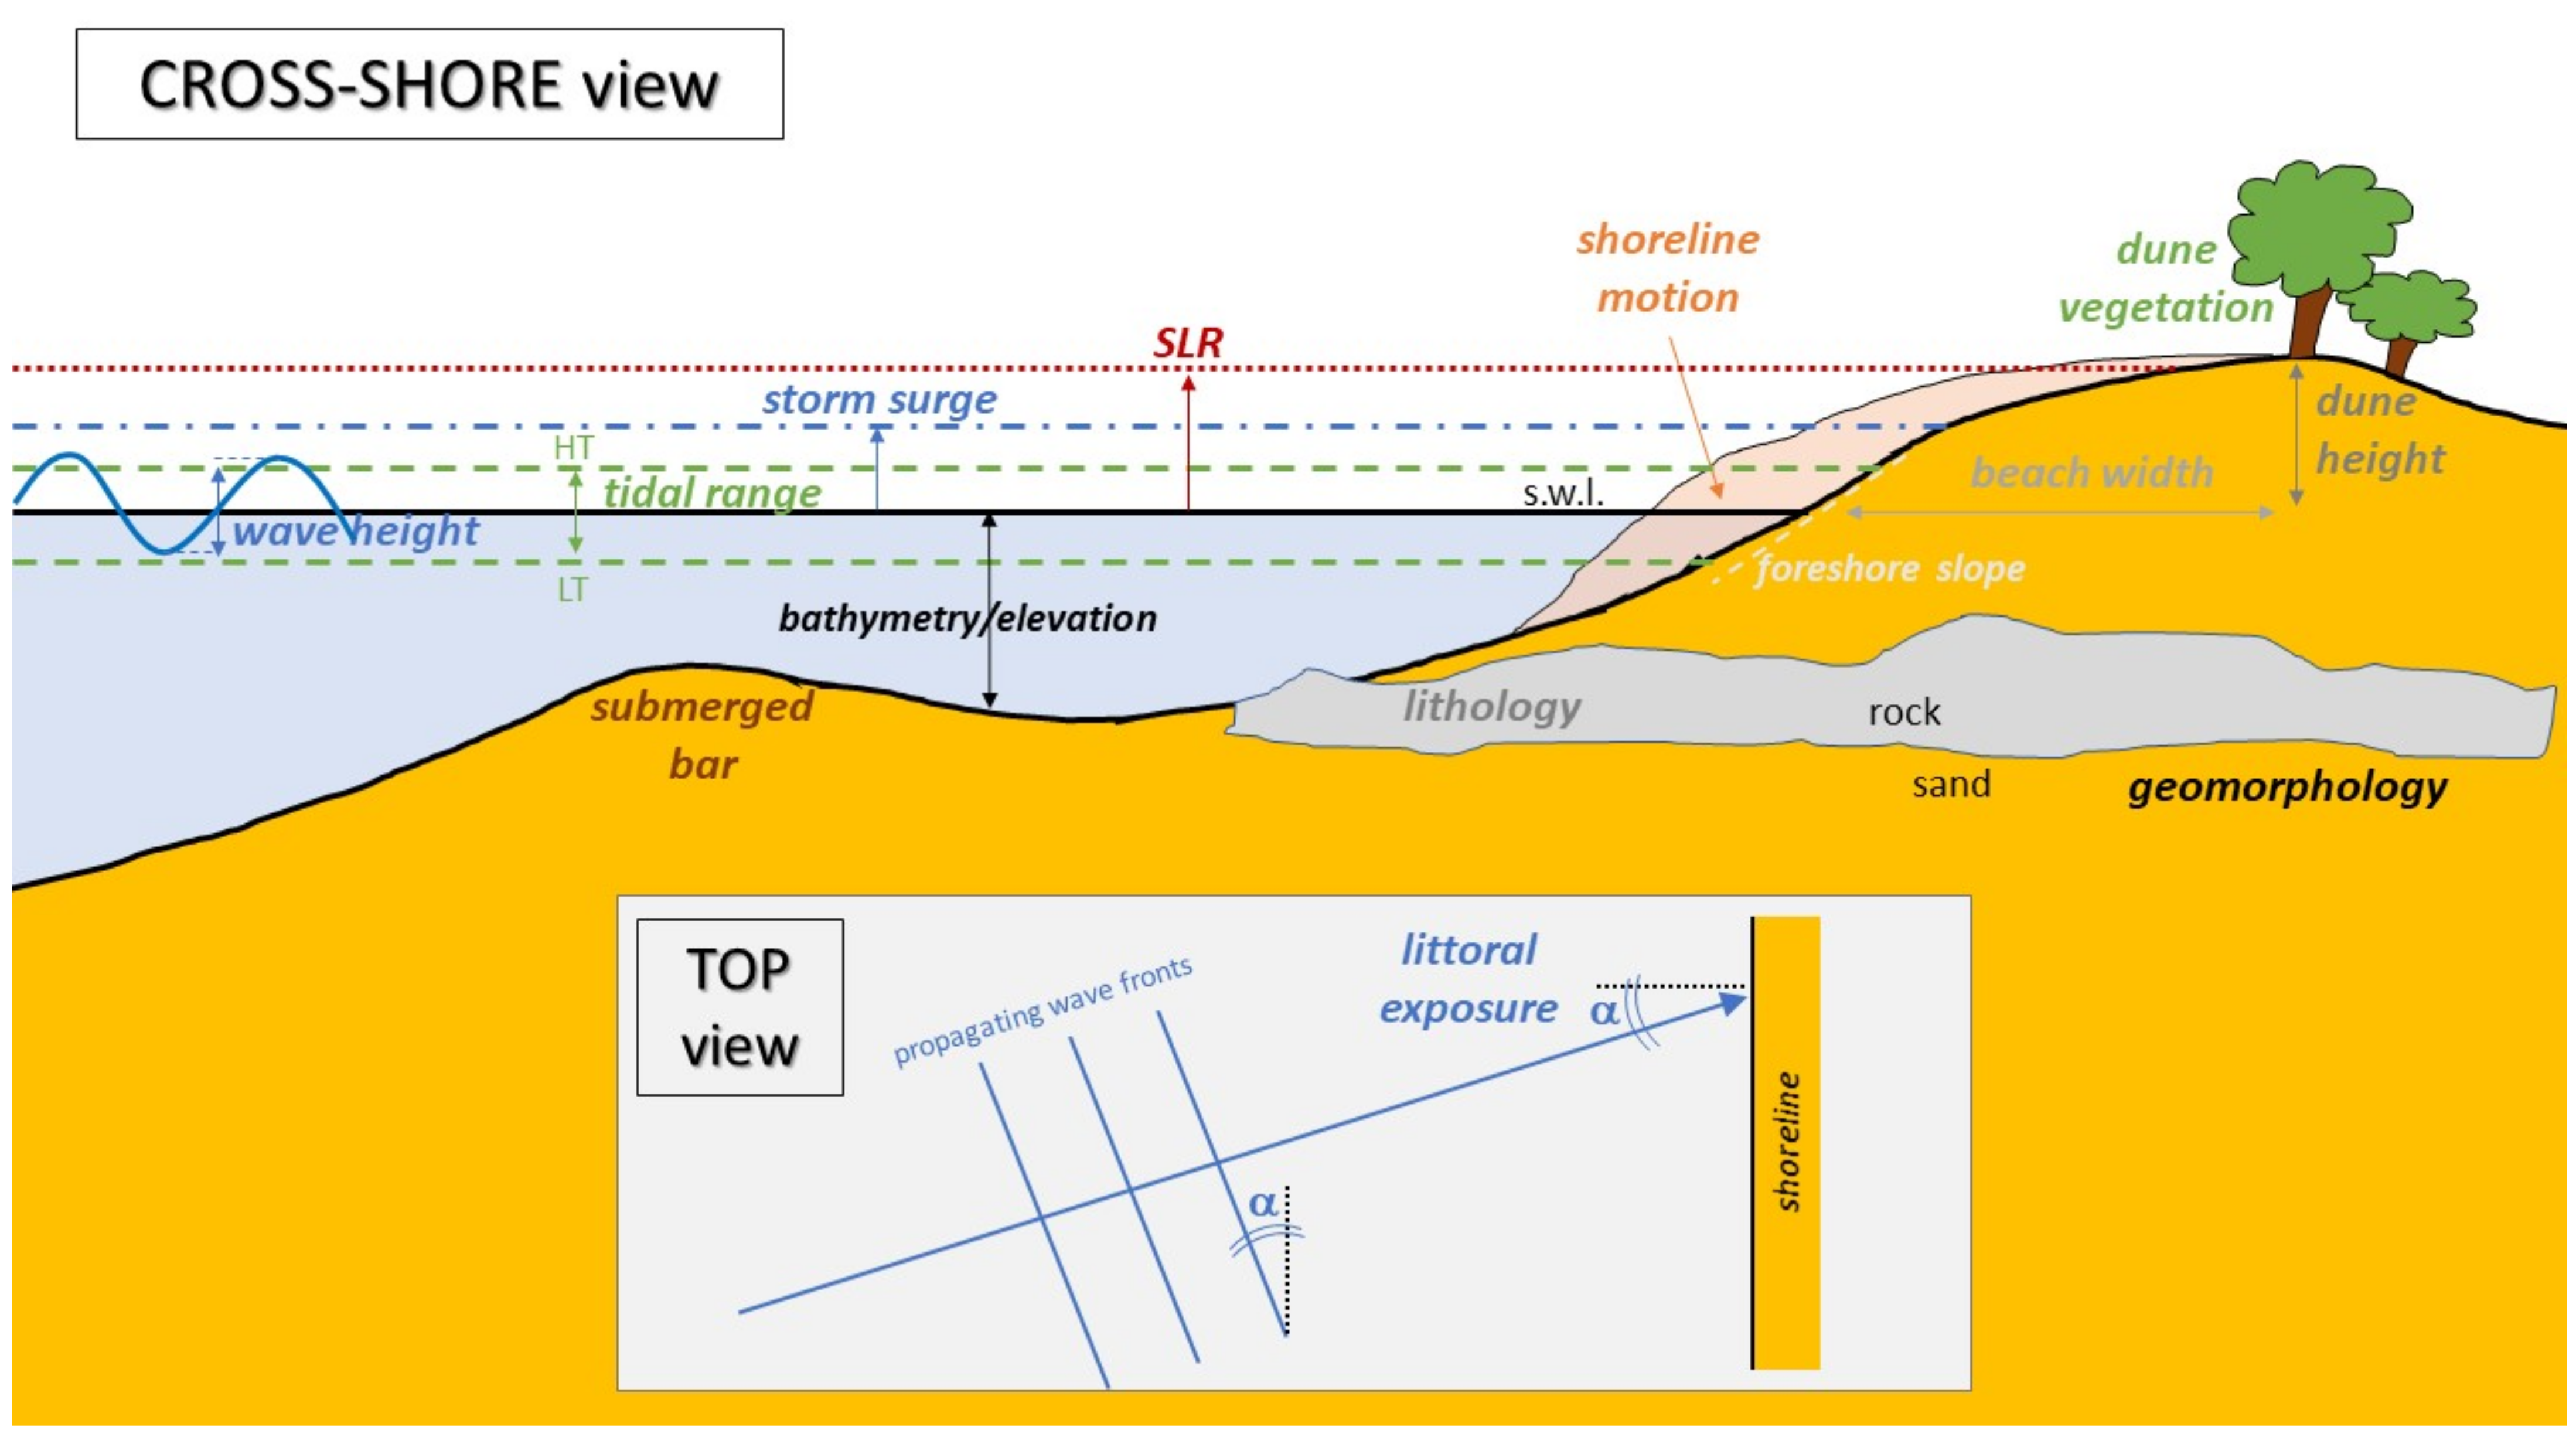
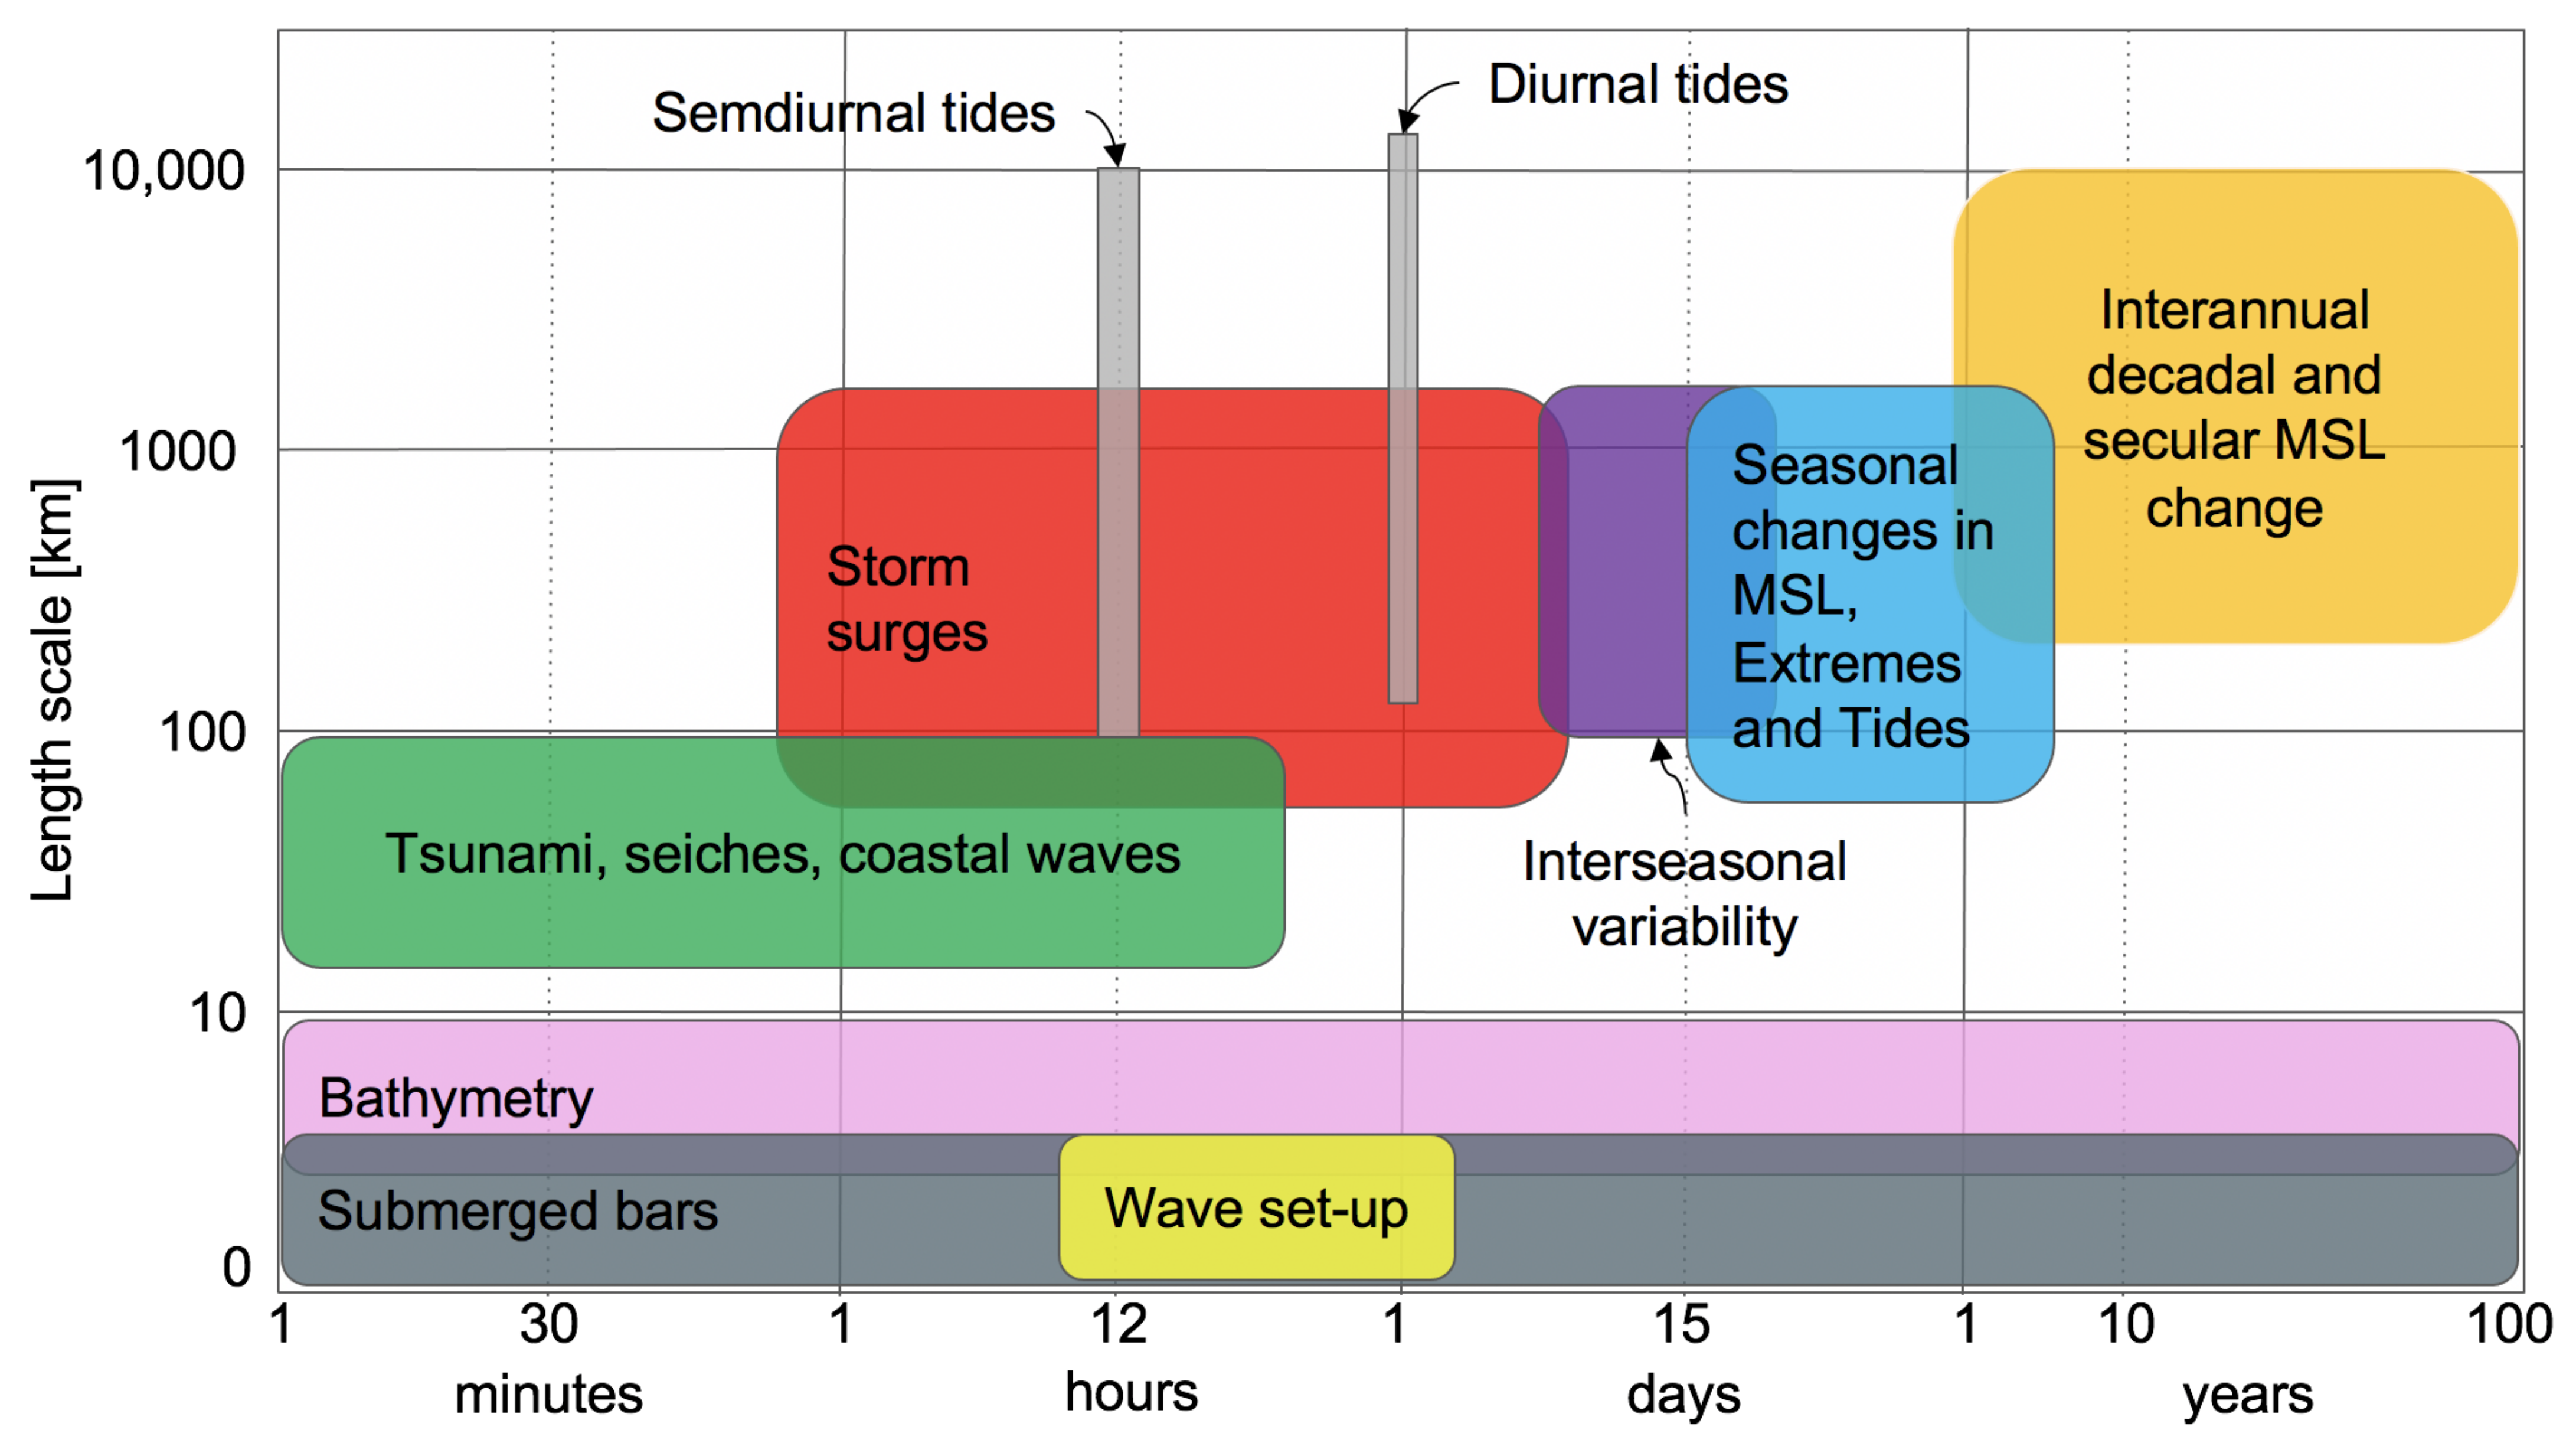
2.1. Forcing Characteristics

The typical forcing actions (Figure 1) considered in CVI analyses aim at describing the main coastal processes that strongly affect beach susceptibility in terms of inundation and flooding, but also coastal erosion (Figure 2). The nearshore dynamics is made of many components and processes [46]; thus, it is fundamental to be acquainted with all such actors, with the aim to get a synthesis for a complete, but not redundant, CVI analysis. The forcing actions are thus associated with the variables described here in the following lines, which mainly deal with both sea actions affecting the coastal region (i.e., tides and sea storms) and evolution of the hydrodynamics in time (i.e., sea-level rise) and space (i.e., bathymetry), as shown in Figure 3.
The role of the storm surge is directly linked to the coastal susceptibility, since the most relevant response of a beach in terms of sensitivity is linked to severe extreme events that are typically associated with low-pressure weather systems characterized by geographic-related features, such as wintertime and summertime storms [47,48], tropical typhoons [44,49], and hurricanes [50,51]. Under the susceptibility viewpoint, the larger is the storm-surge height, the stronger and more severe is the impact on the beach. Since the storm surge controls coastal inundation and erosion, intense and sudden beach flooding often leads to destruction and loss of lives in coastal areas. Although many works use class limits based on absolute storm-surge values (typically in mm), some works use absolute values percentages of the maximum value obtained in the considered area with the aim to have a more representative and objective idea of the storm-surge distribution [18,42]. Historical data are commonly analyzed and used for frequency analyses (e.g., exploiting Gumbel distribution) aimed at finding a reference surge height linked to a specific return period (e.g., 50 years). Databases of storm-surge events might also be used, e.g., SURGEDAT [43]. In the CVI perspective, small storm-surge heights (e.g., less than 0 m) mean very low vulnerability (rank 1), while large heights (e.g., more than 9 m) mean very high vulnerability (rank 5). Sometimes, the storm-surge contribution is combined to the topography (information obtained, e.g., through a digital elevation model, DEM) of the investigated area. This leads to a single index that accounts for both aspects and is needed to define the coastal exposure (e.g., see the exposure module in the work by Narra et al. [43]).
Another factor that strongly affects the coastal susceptibility is the bathymetry, especially in terms of seafloor depth in the nearshore region, which varies more or less significantly when moving from the shoreline towards the deep sea (Figure 2). The seafloor of sandy beaches is typically characterized by arrays of submerged or intertidal bars [52], which largely affect wave transformation. In addition, mutual feedbacks exist between the hydrodynamics and the morphological bed variations, hence the bathymetry may undergo significant changes, in terms of erosion/accretion patterns, both in the short term and in the medium to long term (Figure 3). However, although the data to be used in the analysis should be carefully selected, to well combine bathymetric data with a consistent wave climate, it has been demonstrated that the use of a simplified bathymetry, based on Dean’s equilibrium profile, in place of the actual barred beach leads to sound predictions of coastal inundation [53]. Bathymetric maps/surveys are typically used to get the required information, also in view of additional susceptibility evaluations, e.g., the estimate and ranking of coastal slopes (see Section 2.2). With the aim to precisely characterize the bathymetry in the coastal region, remote sensing is a tool that, when and where available, allows the correct reconstruction of the seafloor depth once a proper calibration is performed [53,54,55]. Previous authors stated that coastal areas characterized by more than 4 m depth have a very low vulnerability (rank 1), while depths smaller than 1 m present a very high vulnerability (rank 5), although the distance from shore at which the water depth is chosen is not completely clear.
The sea-level rise (Figure 1 and Figure 2) is of paramount importance for all coastal communities and is one of the main consequences of the climate change [56,57]. Since the change in the sea level is slow compared to the scales of typical coastal processes (Figure 3), all physical impacts of sea-level rise will manifest in the long term, when the upper part of many mildly sloping and unprotected beaches will be permanently inundated [58,59]. The most recent probabilistic projections [58] span between a level increase in 2100 of 34–76 cm under a moderate-emission-mitigation-policy scenario (RCP4.5) and an increase of 58–172 cm under a business-as-usual scenario (RCP8.5). In such context and following a more practical purpose, optimistic/”low-end” sea-level projections may be used by scientists and practitioners to explore basic solutions to guarantee a minimum adaptation to coastal communities, although ”low-end” projections still show an acceleration of sea-level rise during the 21st century under RCP8.5, such as classical or “high-end” scenarios do [60]. Furthermore, extreme and long-term conditions will be worsened by the more frequent and intense wave conditions and storm surges associated with the climate change. A further outcome of the sea-level rise is the coastline retreat, with recessions being 50–100 times the amount of the rise along many sandy coastlines [56]. To analyze the sea-level rise behavior, long data series of tide gauges located close to the investigated coastal area are typically used, though satellite altimetry can also be considered a suitable tool [45]. Mean high tide values can be used to assess the sea-level change, while the yearly rate of sea-level change is found through application of the least square method [44]. Other authors estimate an overall sea-level change that includes the global eustatic sea-level rise, as well as the local isostatic and tectonic land motion (subsidence); this is evaluated as the variation of the annual mean water elevation [36]. Yearly rate of sea-level rise smaller than 1 mm/year are linked to a very low vulnerability (rank 1), whereas values larger than 4 mm/year mean a very high vulnerability (rank 5). Some works combine the yearly rate of the sea-level rise to other variables related to the coastal erosion, e.g., see Narra et al. [43], where the sea-level rise contributes only a little to the complete index which describes the coastal-erosion hazard module.
Another factor largely affecting coastal vulnerability is the tidal action (Figure 1 and Figure 2). Following the conventional classifications, micro-tidal environments are those characterized by a tide range smaller than 2 m, while meso-tidal environments deal with tide ranges between 2 m and 4 m. Macro-tidal environments are those areas where the tide range is higher than 4 m [61]. In the perspective of evaluating the beach response of a coastal area (e.g., inundation, erosion) in a simplified fashion, the wave-tide interplay may be better accounted for using a dimensionless number, i.e., the relative tide range RTR [62] defined as the ratio between tide range and height of the breaking wave.
Similar to the analysis of the sea-level rise, long data series from available tide gauges are required to estimate a reference tide range of the investigated coastal area. A mean tide range can be derived from the distinction between the yearly mean of low and high tides [44]. On one hand, some authors state that higher tidal ranges are associated with both stronger tidal currents and flooding-frequency increase, thus causing large erosion and transportation of sediment [22,24]. Hence, such authors link macro-tidal coasts to more vulnerable conditions than micro-tidal coasts, e.g., tide ranges smaller than 1 m mean a very low vulnerability (rank 1) and tide ranges larger than 6 m mean a very high vulnerability (rank 5) [22,36,45]. On the other hand, other authors consider micro-tidal coasts of higher vulnerability if compared to macro-tidal ones, mainly because the sea level is always close to the high tide in a micro-tidal environment. Hence, during a storm event, coastal flooding more easily happens over a micro-tidal than over a macro-tidal beach [26,36,44]. Such approach links large tide ranges (e.g., larger than 6 m) to a very low vulnerability (rank 1) and small ranges (e.g., smaller than 1 m) to very high vulnerability (rank 5). Simpler classifications are given by other authors [42]), who just distinguish between macro-tidal (rank 1), meso-tidal (rank 3) and micro-tidal (rank 5) environments.
Storms are of paramount importance in coastal erosion and climate change studies, although their definition is not unique (Figure 1). Coastal engineers typically define a storm as a sequence of sea states characterized by significant heights H s exceeding a threshold, e.g., 1.5 times the mean H s value, during a specific amount of time, e.g., 12 h [63]. Meteorologists use the number of storm systems, which is related to wind speed values over (or central air pressure below) a threshold [64,65,66]; for instance, winds exceeding 30 knots and lasting more than 1 h are defined as storms [65]. So, winds are a further element that typically impacts the coastal area, both directly and indirectly. As a matter of fact, wind speed and direction are more or less intrinsically included in many parameters that provide a direct measure of coastal sensitivity/vulnerability, e.g., storm surge, storm frequency, littoral exposure [16,20]. Further researchers relate the storm concept to a specific water level threshold [67,68,69]. The analysis of storm events requires an amount of data covering at least 20–30 years, this allowing one to observe wave height trends, presence of climate-controlled cycles and wave height annual variations due to climate events [7].
Although some authors define the storms as rare events constituting only 8 % of records over the investigated period [70], the mentioned threshold estimated as 1.5 times H s has the advantage to be adaptable to different energetic environments [43]. A small or negligible number of storms (e.g., zero events per year) means very low vulnerability (rank 1), while large numbers (e.g., more than 15 events) correspond to very high vulnerability (rank 5). Sometimes, the number of storms and the wave height parameters are combined, e.g., to provide a wave-climate indicator (see the coastal-erosion hazard module in Narra et al. [43]), and often erosion magnitude is linked to storms’ grouping more than to the effects of a single storm [71,72,73].
Furthermore, the incoming waves are subjected to several processes that span from the shoaling to the breaking. Such energetic phenomenon provides sediment mobilization and is one of the main drivers of the morphological changes of a beach (Figure 2). Wave breaking is considered one of the main mechanisms responsible for the generation of submerged bars in sandy beaches [52]. In turn, bars represent a preferential point of breaking-induced energy dissipation during energetic events such as sea storms, thus representing a form of beach protection that strongly affects beach erosion and shoreline motion. Furthermore, the dynamic equilibrium existing in the nearshore region is such that the wave features (in particular the wave height) strongly affect the shoreward/seaward bar migration [74,75,76]. The wave height is thus included in CVI applications as an indicator of the wave energy, although there is not a sole way to define such variable. Although some researchers opt for a specific wave height value along the coast, a recent approach suggests the use of a normalized value to better account the incoming wave energy. The most common approaches are thus based on the following terms:
  • H s : mean wave height along the coast, e.g., the average height of the one-third highest waves during a 12-h period [36,45] or the yearly mean wave height [43].
  • H s , m a x : maximum wave height along the coast [36].
  • H s , o n / H s , o f f , where the denominator is the offshore wave height (e.g., the 92nd percentile value, which is related to the erosion of the considered coast) and H s , o n is the height obtained from propagation of H s , o f f from the offshore to the coastal region [18,42].
  • H s , 95 % 2 / H s , t h r e s h o l d 2 , i.e., the ratio between the 95th percentile wave height along the coast and a locally adopted threshold for storm definition [34,36].
Wave height data can be obtained in several ways. One can be the use of datasets collected by offshore wave buoys, then properly elaborated to get the required statistical value (e.g., mean or maximum value), and finally propagated towards the coast. This step can be accomplished using numerical wave-averaged models such as SWAN [18,42,45]. Other methods are based on the use of wave forecasting/hindcasting systems (e.g., EU Copernicus programme1), which provide wave height datasets at different locations, both offshore and close to the coast [77,78,79,80]. A further method concerns the use of remote sensors (e.g., X-band or high-frequency radars, video-monitoring systems), which can estimate both wave characteristics, seafloor depth and shoreline changes [53,79]. In any case, small values of mean wave height, maximum wave height or normalized wave energy correspond to very low vulnerability (rank 1), while large values correspond to very high vulnerability (rank 5).
In addition to the above-mentioned wave-climate features, the approaching direction of the dominant waves is of high importance for the beach susceptibility analysis. Such parameter is evaluated as the incidence angle existing between the coastline and the wave front (Figure 1 and Figure 2). Specifically, a 0° angle means a storm perpendicular to the beach, which provides a strong impact in terms of both inundation and erosion, thus leading to a very high vulnerability (rank 5). On the other hand, relatively large angles, e.g., 10–45°, are linked to a very low vulnerability (rank 1). A medium vulnerability (rank 3) is given by little angles, e.g., 0–10° [18,42].
Tsunami hazard represents another important element to be considered in coastal areas more exposed to such an event. Specifically, recent studies look at the water depth as the key parameter to account for the coastal inundation risk in the presence of an incoming tsunami, with shallow depths associated with a reduced risk and deeper regions associated with a greater risk [12].

2.2. Coastal Characteristics

Coastal characteristics were considered in different CVI devoted to evaluating coastal sensitivity/vulnerability at local and regional scales ([18,36], Figure 1, Table A1). Most of them were based on the pioneer works of Gilbert and Vellinga [21], Gornitz [22], Gornitz et al. [23], Gornitz [81] to assess the vulnerability of large portions of the USA coast to erosion and flooding processes due to Sea-Level Rise (SLR) and the impacts of hurricanes and storms. Previous authors considered several variables related to coastal characteristics (e.g., coastal relief, rocky type, landform, vertical and horizontal movements, shoreline displacement) and forcing agents (e.g., tidal range, wave height, probability of occurrence of storms and hurricanes), as shown in Figure 2.
Coastal relief determines the sensitivity of an area to be affected by flooding processes meanwhile resilience to erosion processes is reflected by rocky type, being magmatic and metamorphic rocks usually more resistant than sedimentary rocks [82]. Landform is also a relevant parameter at regional studies since a great difference in coastal landforms can be observed, e.g., cliffed sectors will be much more resistant to erosion processes than sectors presenting dunes’ system. Vertical and horizontal land movement can be relevant at places, e.g., in the coast of Naples (Italy) small but constant tectonic movements due to volcanic activity can produce important topographic changes that favor coastal submersion [83]. Shoreline erosion/accretion rates are also considered in many CVI and can be used to predict future shoreline evolution, i.e., the predicted shoreline position in a given timespan [84], or the extension of the Imminent Collapse Zone (ICZ, Crowell et al. [84]). This is the area subject to imminent erosion, adjacent to the coastline, and within a distance equal to 10 feet (3 m) plus five times the average, annual erosion rate calculated at medium- (10–60 years) or long-term time spans (>60 years, [85]). Such data are usually available from previous studies or obtained by means of aerial photographs and satellite images [86,87]. According to the data availability, medium- or long-term time span studies will be chosen because projected coastline position should be preferably applicable to a time prediction equivalent to one half of the period recorded by the photogrammetric flights [85]. Indeed, data on coastal erosion/accretion constitute reliable information on the spatial distribution of erosive processes and associated hazard and can valuably substitute numerous secondary parameters at some place difficult to calculate and/or overlapping among them [88].
Erosion/accretion rates, coastal geomorphology, relief and coastal slope were also considered in more recent regional studies carried out in Catalonia and Andalusia (Spain) [36,38], Bangladesh [89], Portugal [43], Italy and Brazil [90]. Different studies concerning coastal sensitivity/vulnerability considered a large and specific number of coastal morphological parameters. In studies carried out in Italy, Dal Cin and Simeoni [91] proposed the use of 15 variables including longshore transport, evolution rates, width of the foreshore, sediment size, beach and nearshore slope, presence of defense structures and ports, etc. Simeoni et al. [92], to characterize coastal resilience, considered cliff characteristics, presence of dunes, etc., and Anfuso and Martínez Del Pozo [93] used and combined among them a limited, easy to calculate number of parameters, i.e. beach width and coastal erosion/accretion rates. In a study carried out in Australia, Abuodha and Woodroffe [94] considered morphological variables such as dune height, barrier types, beach types and erosion/accretion rates. In Turkey, Özyurt and Ergin [95,96] evaluated coastal sensitivity to SLR considering coastal erosion and flooding due to storm surge, and inundation at long-term scale. Recently, several studies focused on the analysis of specific morphological aspects relevant in coastal susceptibility, e.g., [16,18,97], by defining susceptibility sub-indexes to erosion estimated as a function of the intrinsic coastal characteristics. Rangel-Buitrago and Anfuso [18] considered a susceptibility sub-index including 5 and 7 morphological variables respectively chosen for sandy and rocky coastlines. The election of such variables was essentially based on previous works carried out in sandy and rocky coasts (e.g., [98,99,100,101], etc.). Such variables were classified by Rangel-Buitrago and Anfuso [18] on a 1–5 scale according to Gornitz [22], Gomitz et al. [102], Hammar-Klose and Thieler [103], with 1 indicating a low contribution to specific key variable for the studied sector, while 5 indicating a high contribution. A numerical base was used to set classes and an ordinal scale approach was assumed for semi-quantitative variables that were difficult to quantify [97]. In a following step, Rangel-Buitrago and Anfuso [18] divided the investigated areas, according to data availability and coastal uniformity, into sectors of 500 × 500 m2 and the different morphological variables used were calculated for each coastal sector. The ArcGis 10 extension Digital Shoreline Analysis System (DSAS), v.4.2 USGS Woods Hole-Massachusetts [104], was used to quantify shoreline evolution, determine the dry beach/cliff edge width, and to validate the proposed Index according to Cooper and McLaughlin [97].
Concerning morphological variables used in the sub-index regarding sandy coasts, relevance was given to significant features in coastal stability and protection such as beach and dune systems that constitute the final defense line against high water levels and waves during severe storms [88,105]. Backshore and accommodation space widths were considered by Díaz-Cuevas et al. [38] and distance of structures from the shoreline was considered by Narra et al. [43]. Beach width is usually expressed by means of absolute values of coastal erosion rate [23,106] but this is very subjective since both beach width and erosion rates can range a lot from coast to coast. To solve this problem, Rangel-Buitrago and Anfuso [18] and Anfuso et al. [107] expressed beach/cliff edge width in a more objective way, i.e., as a multiple of the Imminent Collapse Zone [84]. They also related beach sensibility to beach morphodynamic state and foreshore slope according to the Wright and Short [108] classification. Such parameters are very important because determine flooding associated with storm surges [26] and the potential velocity of shoreline erosion during a storm [109]. Dissipative beaches are characterized by gentle slopes and present fine sediments, low permeability and usually small morphological seasonal changes. Reflective beaches, present steeper-sloping foreshores, are composed by coarser sediments with greater permeability and usually major morphological changes. The latter are considered to be highly susceptible beaches, as in general the higher the slope, the greater is the eroded sediment volume [94]. Such variables were considered in local and regional studies by means of absolute values [32,95,110] or in regional studies by qualitative observations [94].
Dunes’ system protects backing natural ecosystems and human activities/settlements against flooding and erosion processes and represents a beach sediment reservoir [61]. This protection function is strictly related to their height, width and, especially, longshore continuity that is often interrupted by washover fans that constitute hot spots sensible to coastal erosion [111]. Hence, dune height and percentage of washovers, which reflect the dunes’ system fragmentation, were considered and categorized in numerous local and regional studies using qualitative and semi-qualitative observations or absolute values [82,94,110,112,113]. Rangel-Buitrago and Anfuso [18] categorized dune height and spatial density of washovers by means of absolute values according to the classes proposed by García-Mora et al. [98] and Gracia et al. [99]. In a recent study, Molina et al. [114] proposed a Fragmentation Index to express in an objective and reliable way the level of dune toe fragmentation along the Mediterranean coast of Andalusia, Spain.
Concerning the presence of coastal defense structures, McLaughlin and Cooper [20] considered them as indicators of erosion processes that rise the economic costs of protecting the site to exceed the actual value of the land and therefore the site is abandoned and its value declines rapidly, hence sites with coastal defense structures were considered very sensible/vulnerable. Rangel-Buitrago and Anfuso [18] focused on the prediction of coastal sensitivity at a decadal time span, considering coastal sectors protected by structures being less sensible to erosion processes with respect to non-protected sectors, since structures—at decadal scale—should not need any maintenance works and protect backing structures and/or human activities in a reliable and effective way. The same view was expressed by Ozyurt et al. [115] and Di Paola et al. [116] that associated the presence of protection structures with a low level of vulnerability. Rizzo et al. [16], Rangel-Buitrago and Anfuso [18], for evaluating the level of coastal protection and density of structures, i.e., the armoring, used the so-called coefficient of technogenous impact “K” [117]. This coefficient is the relation, at a certain coastal sector, between the total length (l) of all protection structures (i.e., jetties, groins, breakwaters, etc.) and the length (L) of the investigated sector.
Concerning tidal range, it has been linked to both permanent and episodic inundation hazards [23], but different opinions exist on its importance. In studies carried out at a local scale, this variable is usually not considered because no spatial variations are observed. Gornitz et al. [23], Coelho et al. [82], Abuodha and Woodroffe [94] considered micro-tidal areas less vulnerable to erosion/inundation processes and SLR. Other authors, e.g., McLaughlin and Cooper [20], Ozyurt et al. [115], Di Paola et al. [116], considered micro-tidal environments as more vulnerable areas because erosion processes take place in a narrow littoral zone, and this was the posture adopted by Rangel-Buitrago and Anfuso [18], and McLaughlin and Cooper [20].
Where present, rivers are additional elements to be considered within the CVI approach, especially for the significant erosion typically occurring in the estuarine area because of the generally lower bed elevation [20]. Rivers increase the coastal susceptibility also because of the interplay among multiple actions at the estuary (river current, tide, sea waves, nearshore currents), that may also lead to potential instability of existing artificial structures (e.g., levees), with additional negative impact on the coastal communities. Vulnerability is thus associated with the river presence/absence, as well as with physical characteristics such as watershed extension, mean discharge, river size (their increase leading to the increase of coastal vulnerability), distance between the river mouth and the coastal area (this being inversely related to the coastal vulnerability) [16].
Last, concerning the relevance of coastline length, many small island states are also particularly vulnerable. This is reflected in their very high ratios of coastline length to land area [21].

2.3. Complementary Information

In addition to the basic geomorphological and forcing characteristics, the socio-economic context reaches more importance in any vulnerability assessment because the changes of coastal systems due to social, economic, and built-environment variables occur frequently and rapidly, even more than those due to physical processes [118,119] (Figure 1). For example, Narra et al. [43] proposed the coastal-erosion risk assessment methodology CERA2.0 that considers indicators as population density, infrastructures, and ecology, together with geomorphology, coastal defenses, and short- and long-term shoreline erosion due to extreme events. Rangel-Buitrago et al. [42] in the calculation of Coastal-Erosion Risk Index considered a range of variables including forcing processes, coastal susceptibility, as well as socio-economic, ecological, and cultural factors.
As discussed by McLaughlin et al. [19], there are many potential indicators of socio-economic value (e.g., land use, percent urbanized, population density, infrastructure, cultural heritage, tourism, etc.), so the desirability of including a parameter in CVI calculation must be balanced against the availability of up-to-date data. Due to difficulties in obtaining and ranking the data, the socio-economic aspect is often omitted from CVI calculation.
The ecological vulnerability (e.g., habitat loss, and climate change) can be quantified at different levels of aggregate or not spatial measure, as organisms, populations, communities, ecosystems, and landscapes, to explaining its spatial effects [120], and identifying spatial clustering and patterns as demonstrated by Bevacqua et al. [121].
This type of information on a large scale can be collected with the use of remote sensing [122,123,124] and aerial photography [125,126] that are cost-effective and efficient compared to in situ survey data collection, but often the low spatial and temporal resolution of the dataset limit their application on a local scale. A co-location of multidimensional dataset acquiring with diverse and different approaches play an important role in the definition of an exhaustive coastal vulnerability index. In this context, Jankowski [127] proposed the Participatory GIS (PGIS), a tool crowdsourcing-based to help the public participation in decision-making processes affecting the communities. With the crowdsourcing, the citizens support the data collection processes in different planning/decision-making contexts, i.e., atmospheric and marine environment [128,129], social science [130], economy [131], city governance [132,133], etc.
No less important than the others are the social and cultural characteristics of the study area. As demonstrated by Mukhopadhyay et al. [134], it is crucial that any vulnerability assessment considers local culture along with the physical and socio-economic attributes [135] because, often, traditions, customs, and communities organization make people more or less vulnerable to natural hazards [136,137], influencing their level of hazard perception [138].

3. Coastal Adaptation Strategies Approaches

Adaptation technologies can be defined as the equipment, techniques, practical knowledge, skills or institutional instruments required to reduce the impacts of coastal hazards, including climate change. To date, adaptation has a widespread benefit in reducing society’s vulnerability to coastal hazards [139,140,141].
According to Gilbert and Vellinga [21], three generic options for adaptation exist (see Table 1): (i) Protect: defend vulnerable areas, especially population centers, economic activities and natural resources; (ii) Accomodate: continue to occupy vulnerable areas, but accept the greater degree of flooding by changing land use, construction methods and/or improving preparedness; (iii) (Planned) retreat: abandon structures in currently developed areas, resettle inhabitants and require that new development be set back from the shore, as appropriate.
At places with a high capital use and characterized by relevant forcing agents such as areas affected by a significant sea-level rise trend, high energetic waves and storm impacts, among others (Figure 1), the protect solution is probably the best option [142]. A protect approach involves defensive measures and other activities to protect areas against inundation, tidal flooding, infrastructures damage, shore erosion, salinity intrusion and the loss of natural resources. The measures may be drawn from an array of “hard” and “soft” structural solutions [143] (Figure 1).
According to Foti et al. [144], they can be distinguished in active methods, based on the reduction of the incident wave energy, and passive methods, consisting of increase in overtopping resistance of dikes, improvement of resilience of breakwaters against failures, and use of beach nourishment.
The hard engineering defenses (e.g., breakwaters, groins, seawalls, dikes, gabions or other rock-armored structures) have proliferated in the 1950s and 1960s, but their use started to descry since the 1970s. In fact, such measures led to severe “hardening” of coastal areas and changes in sediment structure [145]. Coastal armoring alters local hydrodynamic regimes, which in-turn affects sediment supply, deposition and grain size, with concomitant impacts on adjacent soft-bottom sub-littoral ecosystems [146,147] and beaches [148,149]. Groins interrupt the littoral drift of sediment driven by longshore currents, thus allowing up-drift deposition of sediment and the increase of beach width. Segmented or shore parallel breakwaters predominantly modify the wave processes, reducing, diffracting and refracting incident wave fields behind them, thus creating sandy tombolo or salient features, which may increase beach width, but can also interrupt longshore transport of sediment [150] producing erosion in downdrift areas according to the “Domino” effect [151].
The most used soft engineering approach to coastal protection is beach nourishment (also referred to in the literature as beach recharge, replenishment, restoration, reconstruction, or fill), i.e., to increase artificially the quantity of material on a beach that is experiencing sediment loss by erosion to allow it to provide adequate storm protection or enlarge the dry beach width for recreational uses.
This approach is mainly used on sandy beaches but shingle or even cobbles can be used. The aim, however, should be to ensure that nourishment material is compatible with the existing natural (or native) beach material [152]. The benefit of beach nourishment comes from wave energy dissipation: the cross-sectional shape of a beach affects its ability to attenuate wave energy. A ”dissipative” beach–one that dissipates considerable wave energy—is wide and shallow while a “reflective” beach—one that reflects incoming wave energy seawards—is steep and narrow and achieves little wave energy attenuation. The logic behind beach nourishment is to turn an eroding, reflective beach into a wider, dissipative beach, which increases wave energy attenuation [153,154]. This is achieved by introducing large quantities of beach material to the coastal sediment budget from an external sediment source, also referred to as a borrow site. In Barnard et al. [155] evidence is given of monitoring and modelling of a shoreface nourishment, with a positive shoreline response in terms of dissipating wave energy when the placing of sediments occurs in water less than 5 m. In fact the placement material provides a buffer in the form of energy dissipation and a potential source for onshore transport of sediments.
The importance of using grain-size-compatible sediment, i.e., sediment that has the same grain size as the original beach sediment, is consistently underlined. In its simplest form, lower energy tide-dominated environments are typified by muddy and silty sediments, while higher energy wave-dominated environments are typified by sand and gravel.
Krumbein and James [156] proposed an equation to calculate the volume of borrow material needed to obtain a unit volume of sediments with the same grainsize distribution of the native one. Later, considering that wave winnowing action is stronger on the finer sediment fractions than on the coarser ones, other researchers modified the previous equation and proposed a Fill Factor and an Overfill Factor [157]. These methods rely on the assumption of sediment lognormality. A modified method that does not require sediment lognormality and can be applied to any borrow/native combination (not only when borrow sediment is finer than the native one) was presented by Pranzini et al. [158].
An important issue to evaluate the performance of the nourished material is the realization of a monitoring program. The recent Italian law 173/2016 states that nourishment must be accompanied by a monitoring campaign to guarantee that the replenishment activity will not produce significant impacts on the marine environment. To this aim, the monitoring campaign must be performed in three distinct temporal phases: ante, during and post operam. In particular, the monitoring must be focused on the turbidity levels and on the health state of the benthic environment. Moreover, bioaccumulation tests must be conducted on mussels, to check for the impact on the biota compartment.
Concerning coastal environments, the characterization of their sensitivity is based on several morphological features located in the nearshore, foreshore and the beach/dune system [159]. To protect, maintain or enhance coastal environment resilience and ecological functions, ecosystems-based solutions must be implemented, namely also referred to as natural and nature-based solutions [160] (Figure 1). They include wetlands and mangrove maintenance, beach-dune nourishment and replenishment or formation of artificial dunes. Natural sand dunes are an effective defense against coastal flooding and erosion. However, natural sand dunes are in decline and at risk, caused by SLR and the increasing impact of energetic events, as well as human actuation/urbanization.
The activities required to achieve dune rehabilitation are often the modification of aeolian processes and sediment dynamics by using sand fences and/or vegetation planting. In addition, the negative impact of human actions needs to be controlled by means of limiting beach goer affluence [161].
Other nature-based coastal risk reduction strategies are based on the maintenance of barrier islands, coastal wetlands, mangrove forests and reefs that may reduce coastal storm hazards by attenuating wave energy and storm surge and stabilizing sediment. Such ecosystem-based management (EBM) programs were ranked by Van der Nat et al. [162] based on its contribution to maintain the ecosystem in a healthy, productive and resilient condition. This is quite complicate and complex since it is required a capability of (i) leaving the feedback mechanisms between the flood protection design and the ecosystem, (ii) incorporating the dynamic character of the local ecosystem, (iii) incorporating the ecological processes on spatial scales.
According to McIvor et al. [163], mangrove swamp has a great importance in coastal defense, as an example, during an hurricane, they can reduce swell waves in height by between 50 and 100% over a length of 500 m of mangroves. Wave reduction largely depends on water depth and vegetation structure and density. Furthermore, storm-surge water levels are reduced by 5 to 50 cm per kilometer of mangrove [164,165]. In hybrid engineering, the use of mangroves reduces flood risk such is the case of a mangrove foreshore in front of a sea wall/dike: the likelihood of waves breaching or overtopping the sea wall is thus reduced and, therefore, sea defense maintenance costs are also reduced [166]. Mangrove conservation and restoration is consequently of paramount importance but few restoration projects have been carried out yet in Florida, USA [167], Indonesia [168], India and Bangladesh [169] and Colombia [170].
Last, the hard solution is usually not used to maintain and protect natural environment since the elevated costs of construction/maintenance versus the low or null economic values of areas to protect and the great impact of hard protection structures on the environment, e.g., in coastal dynamic and landscape [93].
Concerning human environments, i.e., areas with any kind of human activity or infrastructure including agriculture-devoted areas, village/urban settlements, roads and highways, tourist infrastructures and areas of cultural/heritage interest, among others (Figure 1), several adaptation strategies exist.
One of them is the accommodate approach, which includes strategies to reduce the consequences of an event, referred also as non-structural mitigation options, such as flood warning and emergency preparedness programs, flood insurance, land-use regulations, restrictions on development in areas of severe flood hazard, and property acquisition and relocation programs [171]. The adaptation technologies can be either technologies that comprise physical changes to accommodate increased flooding and erosion, and information systems that enhance the understanding and awareness of coastal risks and enable coastal populations to undertake appropriate responses to minimize the impact of these events. The first ones may include elevating structures above the floodplain, employing designs and building materials that make structures more resilient to flood damage and preventing floodwaters from entering structures in the flood zone. The second ones act as an information system to enhance our understanding and awareness of coastal risk. Flood hazard mapping is a vital component for appropriate land-use planning in flood-prone areas, because it creates easily read, rapidly accessible charts and maps that facilitate the identification of areas at risk of flooding and helps prioritize mitigation and response efforts [172]. In addition, flood warnings are a highly important adaptive measure where protection through large scale, hard defenses, is not desirable or possible, which requires constant monitoring of meteorological conditions and detection of threatening events to take place before it hits a community. After the population at risk have been warned, the communities in the hazard zone are required to take action to minimize their exposure to the hazard and to reduce the consequences of flooding [173], also with the help of numerical approaches based on pedestrians’ behavior in flood conditions [174].
Another option for adaptation is the retreat, which relates to the reduction of the risk of an erosional or flood event by limiting its potential effects. An alternative may be the managed realignment, which is the deliberate process of altering flood defenses to allow flooding of a presently defended area. Schemes described as managed realignment are most commonly implemented in low-lying estuarine or open coastal sites often including breaching or removal of existing defenses to construct a new line of defenses further inland [175].
The managed realignment approach is frequently coupled with several other planning and regulatory techniques. Set back zones are sometimes synonymous with buffer zones that provide a highly effective method of minimizing property damage due to coastal flooding and erosion by removing structures from the hazard zone [143]. Two kinds of setbacks occur:
  • Vertical, which establishes a height above a sea-level benchmark to prevent infrastructures from inundation.
  • Horizontal, a horizontal distance from a seaward benchmark to define an area at greatest risk of coastal hazards; the horizontal distance varies according to country.
Concerning no structural activities such as agricultural ones, one of the major threats to crops is salinity intrusion and water scarcity. The most common adaptation strategy to salinity intrusion is the use of salt-tolerant varieties and the adjustment of cropping calendars, or through the change of land use, e.g., substituting agricultural land in favor of fish farms.
Last, concerning areas with a very high capital use, i.e., urban areas with very high concentration of population, a great built-environment density and associated economic value, the most appropriate mitigation option is the construction of hard defenses. As observed by Ruol et al. [176] at urbanized coasts, coastal managers have the need to defend urban and tourist activities, possibly preserving a large beach, while at the non-urbanized coasts, which are natural littorals, managers have the need to preserve the environmental value. For the first kind of coasts, hard protection structures previously described, must be implemented despite their elevated construction and maintenance costs and impacts on sediment transport and coastal landscape. At places where erosion rates are not significantly elevated, beach nourishments are adopted, possibly combined with structures (e.g., submerged barrier, low-crested structure, groins).
A similar approach was applied by Molina et al. [177], who determined coastal sensitivity calculating the spatial distribution of wave forcing and the existence of a buffer zone, namely the dry beach width expressed as a multiple of the 20-year predicted shoreline position. In order to determine the best mitigation strategies to cope with erosion processes, coastal sensitivity was related to land uses. In case of a low-value coastal area with a low sensitivity, the area was not considered at risk and hence no action was required. In case of a high-value coastal area with high sensitivity, the area was considered at the highest risk and hence protection measures were mandatory. All situations in between the two cases were considered at a medium level of risk and hence needed further local scale studies.

4. Government Policies

Government policies and laws dealing with erosion/flooding mitigation are almost nonexistent, scarce and usually unsustainable. Coastal erosion is a natural process that turns into a risk when affects human activities and infrastructures. According to Cooper and McKenna [178], several studies have demonstrated a low awareness among coastal residents of the risks associated with coastal erosion and an expectation that publicly funded engineering structures can and should be emplaced to protect property [179,180]. When private property is threatened by coastal erosion, local owners pretend that society (the state) should intervene in some way because such position was adopted in past decades when much coastal defense has been undertaken at public expense. In Great Britain, coastal defense is carried out by public authorities [178] but there is no legal obligation for public funding of sea defenses except in a few specific cases. The decision-making process is based on economic aspects by the comparison of the value of resources at risk versus the costs of their protection. Not much account is devoted to whether the assets are privately owned or of other unquantifiable social dimensions. In general, public support can have different forms (hard/soft defenses or financial compensation). The benefit for property owners of hard defenses is the ability to continue living at the coast and the retention of capital possessions since the construction of sea defenses at public expense enhances the value of their property. From the public perspective, the emplacement of hard defenses is expensive and involves the public paying to assist a small number of individuals. Furthermore, hard protection structures have negative impacts on coastal environments that include loss of scenic quality [181], loss/difficulty of access [182], diminution of resilience to storm attack and decrease of sediment supply to the coast [183]. Impacts on coastal environment are less important when coastal defense is carried out by means of nourishment works. Another form of public intervention is the possibility of economically finance property owners in some way, e.g., by paying them for their loss or paying to have their residences physically relocated. Such actuations favor a retreat from vulnerable zones and have no negative impacts on the coast enabling it to respond to natural perturbations. The alternative to state intervention is that the property owners accept the costs related to land loss, relocating their property physically, abandoning it or constructing their own defenses. Individuals who were protected in the past by public sea defenses benefited considerably at the taxpayer’s expense and DEFRA [184] observed that those who enjoyed such benefits cannot assume that they will continue to do so into the future. This was the case in some areas of north Norfolk (UK, Cooper and McKenna [178]) and is very likely to become more common in future as government is unable to afford the maintenance of sea defenses particularly in the face of rising sea levels and increased storminess [184]. In the UK [143], Shoreline Management Plans (SMPs) represent high level strategies, non-statutory policy documents that offer large-scale valuation of the risks associated with coastal processes and the consequences of climate change [185]. The content of such plans influences functioning authorities and private landowners on any Local Development Plans to prevent loss of 5000 (over 20 years) and 28,000 (over 50 years) properties [186].
Leatherman [187] described as in U.S. the National Flood Insurance Program of Federal Emergency Management Agency provided a measure of coastal protection by providing incentives for new homes to be elevated above surge levels and to strengthen buildings against windstorm damage but no actions to cope with ongoing shoreline erosion processes, i.e., accommodate structures to the accelerating rate of sea-level rise, beach erosion, and likelihood of more intense hurricanes. The lack of coordinated federal programs and policies is clear: despite the prevalence of erosive trends observed along most part of the U.S. coastline, beachfront developments are exponentially growing under a collision of coastal management policies of the three principal federal agencies with statutory authority, namely the U.S. Army Corps of Engineers, the Coastal Zone Management Program of the National Oceanic and Atmospheric Administration (NOAA), and the Federal Emergency Management Agency (FEMA) National Flood Insurance Program [188]. Despite national competences of aforementioned agencies and programs, building licenses are controlled at the city and/or county level. Therefore, local authorities determine the level of development and the principal measure for states to deal with coastal erosion is the implementation of building setback lines. The U.S. Congress aimed to instruct FEMA to develop erosion hazard maps and include the cost of expected erosion damages but, unfortunately, such recommendations have not been adopted, this corresponding to a substantial subsidy for beachfront property owners that pay in erosion-prone areas the same amount for flood insurance as policyholders in non-eroding areas. In 1968, the U.S. Congress created the National Flood Insurance Program (NFIP) because house insurance policies typically did not concern flood damage, and rebuild after an erosive event was too expensive for many homeowners. The NFIP required community adoption of minimum standards for new construction to minimize the future risk of flood damage. In last decades flood damage enlarged dramatically, and FEMA payouts have far exceeded homeowner premiums. To transform the NFIP in a more actuarially tool, the Biggert-Waters Flood Insurance Reform Act of 2012, which went into effect in 2016, was ratified to make the program more financially stable and required the NFIP to raise rates to reflect true flood risk. Therefore, the Flood Insurance Reform Act of 2012 is a major step in making the program financially sound, but much more work must be carried out. Paradoxically, coastal development is controlled by local authorities and coastal urbanization is still increasing. The higher is the level of coastal occupation, the higher is the possibility to be protected by beach nourishment projects through the politically controlled Corps of Engineers programs principally paid by the federal government. As a result, additional beachfront developments and higher storm damages are observed during hurricane impacts [189]. According to Leatherman [187], the final solution is to eliminate huge federal programs so that individual states can provide flood insurance and be in charge of beach nourishment programs. Zoning decisions would have to be approved by the state and, therefore, protection works of beachfront structures and activities would be largely paid by local governments.

5. Discussion

The analysis of the different forcing and morphological variables in both coastal sensitivity and vulnerability studies, together with the main coastal adaptation strategies, raises the following issues. The forcing components deal with both sea actions affecting the coastal region (i.e., tides and sea storms) and evolution of the hydrodynamics in time (i.e., sea-level rise) and space (i.e., bathymetry). Their analysis raises scaling issues and combination and interaction between different space and time scales. McLaughlin and Cooper [20] assessed the potential for a multiscaled coastal vulnerability index based on a common methodological and theoretical framework that was applied at national (the whole Northern Ireland using 500 × 500 m2 grid cells), regional (Coleraine Borough Council using 25 × 25 m2 grid cells) and local (Portrush East Strand using 1 × 1 m2 grid cells) scales. Evidently, although exact boundaries can be placed on administrative areas on maps, natural divisions in the coastal environment do not necessarily coincide with administrative boundaries. The level of detail required at the different scales range a lot being greater at the local scale. Thus, McLaughlin and Cooper [20] included or omitted some variables as the index scale varied. For example, at the Northern Ireland scale, geology was an essential variable to distinguish areas of potential vulnerability to wave-induced erosion, but such data had not a sufficient accuracy to be used at local spatial scale. The opposite was observed for coastal morphology: detailed data were available for local scale studies. Furthermore, other variables, respect to national and regional scales, record almost no changes at local scale, such as coastal orientation and tidal regime, so there is no point in using them at such scale. The same approach was followed by Di Paola et al. [190] for a multi-scale coastal risk analysis in Gran Canaria.
Another important aspect to be considered is the time scale involved in coastal zone processes and dynamics [46], which can range from hours to days for storm surge, from days to years for tidal ranges and from decades to millennia in the case of regional vertical land movements. This aspect is accounted for changing the time horizon of the scenario for vulnerability/risk, as in Ramieri et al. [191].
The time scale is also involved in adaptation strategies, because adaptation planners need to know at what timeframe a particular adaptation option becomes cost-effective. An example is the adaptation strategies for inundations in Jakarta, which are due to land vertical sinking due to subsidence induced by water extraction. The immediate measures are dredging of the canals and barriers, the longer time solutions are the regulation of water extraction and the land-use modification pushing residents out of the flooding risk areas [192].
Time interaction must consider both the seasonal forcing features (increased frequency of summer storms [47,48]) and the long-term ones, which are typical of sea-level, compared to other coastal processes [57,58]. Spatial interaction must consider both the local processes driving coastal erosion and flooding (e.g., nearshore waves, surge, tides, decrease of sediment sources), and ocean–atmosphere dynamics, which needs a global approach. Thus, the combination of and interaction between sea-level rise, waves and storm surges must be considered to be a crucial challenge to be solved for the coastal evolution comprehension [193]. The coastal morphology is directly linked with the sensitivity of the system. Beach width determines the distance of structures from the shoreline [38], which influences the degree of flooding associated with storm surges [43]. Dissipative beaches, with gentle slopes and fine sediments, present low permeability and usually small morphological seasonal changes, while reflective beaches, with coarser sediments and greater permeability, are considered to be highly susceptible beaches [94]. Dune system protects backing natural ecosystems and human activities/settlements against flooding and erosion processes [109]. The degree of beach armoring influences the level of coastal protection and so the sensitivity of the system, which is often associated with lower vulnerability [115,116]. A combination of adaptation and mitigation strategies aim at decreasing biophysical vulnerability and risk. The level of urbanization influences the choice of the different coastal adaptation strategies: defensive measures against inundation are preferred for the “urbanized coasts”, which are intensely developed and have a high economic value, while a nature-based reduction strategy is preferred for the “non-urbanized coasts”, to preserve their environmental value [176]. The accommodation strategies include land-use regulations in areas of severe flood hazard, relocation programs which decrease property damage due to coastal flooding and erosion by removing structures from the hazard zone [143]. The latter strategies, including also flood warning and emergency preparedness programs, require time to reduce the vulnerability to hazards occurring in the future. This means allowing the system time to adapt in an anticipatory manner or to adapt reactively to hazards that involve slow change over relatively long periods. This again raises scaling issues and interaction between the different adaptation strategies. Modelling can be a possible solution to choose a set of adaptation measures: whatever the potential impact of human intervention, and the temporal evolution of the erosion rate, numerical models provide information on the sensitivity of the beach to potential changes in marine parameters (related for instance to climate variability or climate change) [194]. Numerical simulations of the effects of the proposed strategies on the system vulnerability can give the necessary information to help managers and planners to choose the proper adaptation measures.

6. Conclusions and Future Directions

In this paper, we examined different vulnerability indexes, built up with forcing and morphological variables in both coastal sensitivity and vulnerability studies, together with the main coastal adaptation strategies used to reduce biophysical vulnerability. The analysis demonstrated that the more sophisticated the index or the model, the more data are required, so this point highlights the need for observations, continuous measurements and open-access databases. An integrated perspective in several dimensions must be performed, including integration across change drivers (climate and non-climate), across sectors, impacts and responses, across space and time dimensions, and across institutions (including levels of government). In particular, the adaptation strategies can be successfully implemented by an informed, engaged and prepared community with active participation of different stakeholders, even the more disadvantaged and marginalized groups. On the other hand, the planning, decision-making and response implementation to current and emerging climate impacts and risks require effective governance that operates integration between different institutional arrangements at both local and regional scales. In fact, local responses are required, although included in a wider context to ensure that overlap and duplication are avoided and that maximum benefits are derived from collaborative and joined-up adaptation initiatives.

Author Contributions

Conceptualization, G.A. and G.B.; data curation, D.D.L. and M.P.; writing–original draft preparation, G.A. and M.P. and D.D.L. and G.B.; writing–review and editing, G.A. and G.B.; visualization, D.D.L. and M.P.; supervision, G.A. and G.B. All authors have read and agreed to the published version of the manuscript.

Funding

This research was partially funded by the Office of Naval Research Global UK (MORSE project—Research Grant N62909-17-1-2148) and the Italian MIUR (PRIN 2017—Grant Number 20172B7MY9).

Acknowledgments

This is a contribution to the PAI Research Group RNM-328 (Andalucia, Spain).

Conflicts of Interest

The authors declare no conflict of interest.

Appendix A

Table A1. Summary table of the variables used in some susceptibility (S) and vulnerability (V) indices with their scale of applicability classified as national (N), regional (R) and local (L).
AuthorsTypologyScaleVariables
[81,195]VRRelief, lithology, landforms, vertical/horizontal land movements, tidal range, wave height,
tropical storm/hurricane probability.
[196]SRShoreline index. Exposed tidal flats, sheltered rocky shores and seawalls, exposed mangroves
and marsh, exposed vertical rocky shores and seawalls.
[22]S/VNCoastal Vulnerability Index. Relief, lithology, landforms, horizontal/vertical land
movements, tidal range, wave height.
[197]VRCoastal Vulnerability Index. Relief, rock type, landform,
vertical sea-level change, shoreline displacement, tidal range, wave height.
[198]S/VRCoastal Vulnerability Index. Elevation, geology, geomorphology, SLR, shoreline displacement, wave height,
annual probability of tropical storm and hurricane, Hurricane strike frequency-intensity, mean forward velocity,
number of extratropical cyclones, hurricane surge height, tidal range
[199]VLWind and wave climate, berm height, maximum depth for
shore-normal sediment transport and distance, sea level
[91]VLHydrodynamic and energy-related: mean energy flux per unit of coastline, net/gross
longshore transport rate. Evolutionary: mean shoreline retreat/accretion. Morphology and sedimentology of the beach:
width of the backshore, elevation of the backshore, mean size of the beach sediments. Seafloor: slope of the sea floor,
mean size of the sea floor sediment, number of bars. Human intervention: defensive structures and ports.
[200]VNClimate-induced: Environmental changes (sea-level rice, rainfall, sea surface temperature, wind,
wave, El-Nino changes, sediment budget), Socio-economic developments (Autonomous/planned adaptation).
Non-climate-induced: Environmental changes (vertical land movements, sediment budget), Socio-economic developments
(population, land-use, changes in gross domestic product).
[26]VRCoastal Vulnerability Index. Geomorphology, coastal slope, relative sea-level change,
shoreline erosion/accretion, mean tide range, mean wave height.
[95]VLCostral Vulnerability Impact. Physical parameters: rate of SLR, geomorphology, coastal slope,
H 1/3, Sediment budget, tidal range, proximity to coast, type of aquifer, hydraulic conductivity,
water depth at downstream, discharge. Human influence parameters: reduction
of sediment supply, river flow regulation, engineered frontage, natural protection degradation,
coastal protection structures, growndwater consumption, land-use pattern.
[26]VRCoastal Vulnerability Index. Geomorphology, coastal slope, relative sea-level change,
shoreline erosion/accretion, mean tide range, mean wave height.
[95]VLCostral Vulnerability Impact. Physical parameters: rate of SLR, geomorphology, coastal slope,
H 1/3, Sediment budget, tidal range, proximity to
coast, type of aquifer, hydraulic conductivity, water depth at downstream, discharge. Human influence parameters:
reduction of sediment supply, river flow regulation, engineered frontage, natural
protection degradation, coastal protection structures, growndwater consumption, land-use pattern.
[201]VRCoastal Vulnerability Index. Geological/geomorphological: resistance of the
geological/geomorphological substrate to erosion, erosion rates,
coastal slope. Physics/hydrodynamic: significant average swell,
rate of change in relative sea level, mid tidal range.
[116]VLCoastal Vuulnerability Index. Mean Elevation, geology,
coastal landform, shoreline, wave height, tide range.
Impact Index. Wave run-up, short/long-term erosion,
stability coastal protections, tide range.
[202]VRSocial economic index. Population, roads, industrial
and agricultural output value, residential land.
Land-use index. Farming land, Aquaculture, Arable land.
Eco-environmental index. Beaches and wetlands, mangroves, rivers.
Coastal construction index. Coastal engineering, coastal highways, coastal buildings.
Disaster-bearing capability index. Seawalls, labor population, financial revenue.
[106]VLPhysical Vulnerability Index. Barrier island width, lithology,
width of back-beach vegetation, percentage of low areas, shoreline change rate.
Socio-economic Vulnerability Index. Land use
[203]VRShoreline retreat, coastal defense works, events due to sea wave
action, emergency interventions, coastal defense costs.
[82]VRElevation referred to Chart Datum, distance to shore, tidal range,
maximum wave height, erosion/Accretion rate, geology, geomorphology,
ground cover, anthropogenic actions.
[204]S/VLBeach Vulnerability Index. Longshore/cross-shore sediment
transport, riverine inputs, relative sea-level change,
wave run-up, aeolian sediment transport.
Beach Value. Accommodation facilities, coastal business,
tourism area, beach width, distance from the city,
beach attendance, sector length.
[18]S/VLVulnerability sub-index. Coastal forcing: significant wave height, storm surge, degree of littoral
exposure to wave fronts, tidal range. Coastal Susceptibility: SANDY (dune height, percentage of washovers,
dry beach width as a multiple of the ICZ, beach slope/morphodynamic state, foreshore slope,
K Index); ROCKY (type, lithology, structures, slope, cliff edge
width as a multiple of the ICZ, weathering, K Index. Socio-economic:
land uses, percentage of urbanized areas, population density.
Ecological: protected area, ecosystem and habitat cover, level of human intervention.
[181]SLCliff, beach face, rocky shore, dunes, valley, skyline landform,
tides, coastal landscape features, vistas, water color and clarity,
natural vegetation cover, vegetation debris;
Human parameters: noise disturbance, litter, sewage discharge
evidence, non-built environment, built
environment, access type, skyline, utilities.
[16]SLMorphological Beach Sub-Index. Foreshore slope, grain size, backshore width, number of bars.
Morphological Dune Sub-Index. Mean dune height and width, vegetation succession continuity,
dune discontinuity. Shoreline Evolution Sub-Index. Short/medium/long-term evolution trend.
Coastal Run-Up Sub-Index. Mean and maximum run-up height. Fluvial System Sub-Index.
Basin area, mean river discharge, distance from the river mouth. Storm-Surge Sub-Index.
Storm-surge effect on beach and dune systems. Topographic Sub-Index. Presence of low-lying areas.
[205]VLCoastal Vulnerability Assessment. Run-up distance,
beach slope, beach retreat, presence of coastal structures,
medium-term coastline erosion.
[44]VRCoastal Vulnerability Index. Storm-surge height, SLR, tidal range,
elevation, coastal slope, geomorphology, shoreline change, bathymetry
[36]VRCoastal Vulnerability Index. Sea-level change, significant wave height,
tidal range, geomorphology/geology, coastal slope, shoreline change.
[45]VRCoastal Vulnerability Index. Significant wave height and direction,
SLR, tidal range, geomorphology, coastal slope, shoreline change.
[43]S/VRSusceptibility Index. Geomorphology, coastal defenses.
Value module. Population density, infrastructures, ecology.
Exposure module. Distance to shoreline, topography, sea-level trend,
Coastal-erosion hazard module. Wave climate, shoreline change.
[38]SRSensitivity indicator. Erosion rate, backshore width,
accommodation space width and typology
[17]VRCoastal Vulnerability Index. Elevation, presence/absence of artificial protection
structures, dunes coverage, shoreline change, land cover.
[42]S/VRHazard sub-index. Coastal Forcing: significant wave height, storm surge, degree of littoral
exposure to wave fronts, tidal range. Coastal Susceptibility: SANDY
(dune height, percentage of washovers, dry beach width as a multiple of the ICZ, beach slope/morphodynamic
state, foreshore slope; ROCKY: type, lithology, structures, slope, cliff edge
width as a multiple of the ICZ, weathering, K Index. Vulnerability sub-index.
Socio-Economic: land uses, percentage of urbanized area, population density, roads, conservation
designation, number of infrastructure services, tourism, economic activities. Ecological:
protected area, ecosystem and habitat cover, level of human intervention, protected species, ecosystem services,
litter presence, non-built environment. Cultural: cultural heritage, ethnographic interest,
state of conservation, national protection, ethnic communities, cultural built environment.
[177]SLCoastal Sensitivity. Coastal forcing: wave energy flux.
Buffer zone assessment: dry beach width.

References

  1. Zielinski, G.A. A classification scheme for winter storms in the eastern and central United States with an emphasis on nor’easters. Bull. Am. Meteorol. Soc. 2002, 83, 37–52. [Google Scholar] [CrossRef] [Green Version]
  2. Bacon, S.; Carter, D.T. Wave climate changes in the North Atlantic and North Sea. Int. J. Climatol. 1991, 11, 545–558. [Google Scholar] [CrossRef]
  3. Sallenger, A. Island in a Storm: A Rising Sea, a Vanishing Coast, and a Nineteenth-Century Disaster That Warns of a Warmer World; PublicAffairs: New York, NY, USA, 2009. [Google Scholar]
  4. Lozano, I.; Devoy, R.; May, W.; Andersen, U. Storminess and vulnerability along the Atlantic coastlines of Europe: Analysis of storm records and of a greenhouse gases induced climate scenario. Mar. Geol. 2004, 210, 205–225. [Google Scholar] [CrossRef]
  5. Beudin, A.; Ganju, N.K.; Defne, Z.; Aretxabaleta, A. Physical response of a back-barrier estuary to a post-tropical cyclone. J. Geophys. Res. Ocean. 2017, 122, 5888–5904. [Google Scholar] [CrossRef] [Green Version]
  6. Anfuso, G.; Loureiro, C.; Taaouati, M.; Smyth, T.; Jackson, D. Spatial Variability of Beach Impact from Post-Tropical Cyclone Katia (2011) on Northern Ireland’s North Coast. Water 2020, 12, 1380. [Google Scholar] [CrossRef]
  7. Komar, P.D.; Allan, J.C. Increasing hurricane-generated wave heights along the US East Coast and their climate controls. J. Coast. Res. 2008, 24, 479–488. [Google Scholar] [CrossRef]
  8. Meyer-Arendt, K. Grand Isle, Louisiana: A historic US Gulf Coast resort adapts to hurricanes, subsidence and sea level rise. In Disappearing Destinations; CAB International: Wallingford, UK, 2011; pp. 203–217. [Google Scholar]
  9. Goldenberg, S.B.; Landsea, C.W.; Mestas-Nuñez, A.M.; Gray, W.M. The recent increase in Atlantic hurricane activity: Causes and implications. Science 2001, 293, 474–479. [Google Scholar] [CrossRef] [Green Version]
  10. Hickey, K.R.; Connolly-Johnston, C. The impact of hurricane debbie (1961) and Hurricane Charley (1986) on Ireland. In Advances in Hurricane Research—Modelling, Meteorology, Preparedness and Impacts; Hickey, K., Ed.; IntechOpen: Rijeka, Croatia, 2012; pp. 183–198. [Google Scholar]
  11. Gracia, F.; Alonso, C.; Benavente, J.; Anfuso, G.; Del Río, L. The Different Coastal Records of the 1755 Tsunami Waves along the south Atlantic Spanish Coast. Z. Fur Geomorphol. Suppl. 2006, 146, 195–220. [Google Scholar]
  12. Martínez, C.; Cienfuegos, R.; Inzunza, S.; Urrutia, A.; Guerrero, N. Worst-case tsunami scenario in Cartagena Bay, central Chile: Challenges for coastal risk management. Ocean Coast. Manag. 2020, 185, 105060. [Google Scholar]
  13. Papadopoulos, G.A.; Dermentzopoulos, T. A tsunami risk management pilot study in Heraklion, Crete. Nat. Hazards 1998, 18, 91–118. [Google Scholar] [CrossRef]
  14. Papathoma, M.; Dominey-Howes, D. Tsunami Vulnerability Assessment and Its Implications for Coastal Hazard Analysis and Disaster Management Planning, Gulf of Corinth, Greece. Nat. Hazards Earth Syst. Sci. 2003, 3, 733–747. [Google Scholar] [CrossRef] [Green Version]
  15. Di Paola, G.; Aucelli, P.P.C.; Benassai, G.; Rodríguez, G. Coastal vulnerability to wave storms of Sele littoral plain (southern Italy). Nat. Hazards 2014, 71, 1795–1819. [Google Scholar] [CrossRef]
  16. Rizzo, A.; Aucelli, P.; Gracia, F.; Anfuso, G. A novelty coastal susceptibility assessment method: Application to Valdelagrana area (SW Spain). J. Coast. Conserv. 2018, 22, 973–987. [Google Scholar] [CrossRef]
  17. Sekovski, I.; Del Río, L.; Armaroli, C. Development of a coastal vulnerability index using analytical hierarchy process and application to Ravenna province (Italy). Ocean Coast. Manag. 2020, 183, 104982. [Google Scholar] [CrossRef]
  18. Rangel-Buitrago, N.; Anfuso, G. Risk Assessment of Storms in Coastal Zones: Case Studies from Cartagena (Colombia) and Cadiz (Spain); Springer: New York, NY, USA, 2015. [Google Scholar]
  19. McLaughlin, S.; McKenna, J.; Cooper, J. Socio-economic data in coastal vulnerability indices: Constraints and opportunities. J. Coast. Res. 2002, 36, 487–497. [Google Scholar] [CrossRef]
  20. McLaughlin, S.; Cooper, J.A.G. A multi-scale coastal vulnerability index: A tool for coastal managers? Environ. Hazards 2010, 9, 233–248. [Google Scholar] [CrossRef]
  21. Gilbert, J.; Vellinga, P. IPCC Response Strategies Working Group Reports. In Coastal Zone Management; Technical Report; IPCC: Geneva, Switzerland, 1990; Chapter 5. [Google Scholar]
  22. Gornitz, V. Global coastal hazards from future sea level rise. Glob. Planet. Chang. 1991, 3, 379–398. [Google Scholar] [CrossRef]
  23. Gornitz, V.M.; Daniels, R.C.; White, T.W.; Birdwell, K.R. The Development of a Coastal Risk Assessment Database: Vulnerability to Sea-Level Rise in the U.S. Southeast. J. Coast. Res. 1994, 12, 327–338. [Google Scholar]
  24. Shaw, J.; Taylor, R.B.; Forbes, D.L.; Ruz, M.; Solomon, S. Sensitivity of the Coasts of Canada to Sea-Level Rise; Geological Survey of Canada Ottawa: Ottawa, ON, Canada, 1998. [Google Scholar]
  25. Thieler, E.R.; Hammar-Klose, E.S. National Assessment of Coastal Vulnerability to Sea-Level Rise; Technical Report; U.S. Geological Survey: Woods Hole, MA, USA, 1999.
  26. Thieler, E.R.; Hammar-Klose, E.S. National Assessment of Coastal Vulnerability to Sea-Level Rise; Preliminary Results for the US Pacific Coast; Technical Report; U.S. Geological Survey: Woods Hole, MA, USA, 2000.
  27. Pendleton, E.A.; Thieler, E.R.; Williams, S.J.; Beavers, R.S. Coastal Vulnerability Assessment of Padre Island National Seashore (PAIS) to Sea-Level Rise; US Geological Survey Open-File Report; U.S. Geological Survey: Woods Hole, MA, USA, 2004.
  28. Boruff, B.J.; Emrich, C.; Cutter, S.L. Erosion hazard vulnerability of US coastal counties. J. Coast. Res. 2005, 21, 932–942. [Google Scholar] [CrossRef] [Green Version]
  29. Doukakis, E. Coastal vulnerability and risk parameters. Eur. Water 2005, 11, 3–7. [Google Scholar]
  30. Diez, P.G.; Perillo, G.M.; Piccolo, M. Vulnerability to sea-level rise on the coast of the Buenos Aires Province. J. Coast. Res. 2007, 23, 119–126. [Google Scholar] [CrossRef]
  31. Rao, K.N.; Subraelu, P.; Rao, T.V.; Malini, B.H.; Ratheesh, R.; Bhattacharya, S.; Rajawat, A. Sea-level rise and coastal vulnerability: An assessment of Andhra Pradesh coast, India through remote sensing and GIS. J. Coast. Conserv. 2008, 12, 195–207. [Google Scholar]
  32. Ozyurt, G.; Ergin, A.; Baykal, C. Coastal vulnerability assessment to sea level rise integrated with analytical hierarchy process. Coast. Eng. Proc. 2010, 32, 6. [Google Scholar] [CrossRef] [Green Version]
  33. Abuodha, P.A.; Woodroffe, C.D. Assessing vulnerability to sea-level rise using a coastal sensitivity index: A case study from southeast Australia. J. Coast. Conserv. 2010, 14, 189–205. [Google Scholar] [CrossRef]
  34. López Royo, M.; Ranasinghe, R.; Jiménez, J.A. A rapid, low-cost approach to coastal vulnerability assessment at a national level. J. Coast. Res. 2016, 32, 932–945. [Google Scholar] [CrossRef]
  35. Villa, F.; McLeod, H. Environmental vulnerability indicators for environmental planning and decision-making: Guidelines and applications. Environ. Manag. 2002, 29, 335–348. [Google Scholar] [CrossRef]
  36. Koroglu, A.; Ranasinghe, R.; Jiménez, J.A.; Dastgheib, A. Comparison of coastal vulnerability index applications for Barcelona Province. Ocean Coast. Manag. 2019, 178, 104799. [Google Scholar] [CrossRef]
  37. Saaty, T.L. A scaling method for priorities in hierarchical structures. J. Math. Psychol. 1977, 15, 234–281. [Google Scholar] [CrossRef]
  38. Díaz-Cuevas, P.; Prieto-Campos, A.; Ojeda-Zújar, J. Developing a beach erosion sensitivity indicator using relational spatial databases and Analytic Hierarchy Process. Ocean Coast. Manag. 2020, 189, 105146. [Google Scholar]
  39. Balica, S.F.; Wright, N.G.; Van der Meulen, F. A flood vulnerability index for coastal cities and its use in assessing climate change impacts. Nat. Hazards 2012, 64, 73–105. [Google Scholar] [CrossRef] [Green Version]
  40. Del Río, L.; Gracia, F.J. Erosion risk assessment of active coastal cliffs in temperate environments. Geomorphology 2009, 112, 82–95. [Google Scholar] [CrossRef] [Green Version]
  41. Benassai, G.; Di Paola, G.; Aucelli, P.P.C. Coastal risk assessment of a micro-tidal littoral plain in response to sea level rise. Ocean Coast. Manag. 2015, 104, 22–35. [Google Scholar] [CrossRef]
  42. Rangel-Buitrago, N.; Neal, W.J.; de Jonge, V.N. Risk assessment as tool for coastal erosion management. Ocean Coast. Manag. 2020, 186, 105099. [Google Scholar] [CrossRef]
  43. Narra, P.; Coelho, C.; Sancho, F. Multicriteria GIS-based estimation of coastal erosion risk: Implementation to Aveiro sandy coast, Portugal. Ocean Coast. Manag. 2019, 178, 104845. [Google Scholar] [CrossRef]
  44. Hoque, M.A.A.; Ahmed, N.; Pradhan, B.; Roy, S. Assessment of coastal vulnerability to multi-hazardous events using geospatial techniques along the eastern coast of Bangladesh. Ocean Coast. Manag. 2019, 181, 104898. [Google Scholar] [CrossRef]
  45. Mohd, F.A.; Maulud, K.N.A.; Karim, O.A.; Begum, R.A.; Awang, N.A.; Ahmad, A.; Azhary, W.A.H.W.M.; Kamarudin, M.K.A.; Jaafar, M.; Mohtar, W.H.M.W. Comprehensive coastal vulnerability assessment and adaptation for Cherating-Pekan coast, Pahang, Malaysia. Ocean Coast. Manag. 2019, 182, 104948. [Google Scholar] [CrossRef]
  46. Postacchini, M.; Romano, A. Dynamics of the Coastal Zone. J. Mar. Sci. Eng. 2019, 7, 451. [Google Scholar] [CrossRef]
  47. Amores, A.; Marcos, M.; Carrió, D.S.; Gómez-Pujol, L. Coastal impacts of Storm Gloria (January 2020) over the north-western Mediterranean. Nat. Hazards Earth Syst. Sci. 2020, 20, 1955–1968. [Google Scholar] [CrossRef]
  48. Lin-Ye, J.; García-León, M.; Gràcia, V.; Ortego, M.I.; Lionello, P.; Conte, D.; Pérez-Gómez, B.; Sánchez-Arcilla, A. Modellingof Future Extreme Storm Surges at the NW Mediterranean Coast (Spain). Water 2020, 12, 472. [Google Scholar] [CrossRef] [Green Version]
  49. Guo, Y.; Zhang, J.; Zhang, L.; Shen, Y. Computational investigation of typhoon-induced storm surge in Hangzhou Bay, China. Estuarine Coast. Shelf Sci. 2009, 85, 530–536. [Google Scholar] [CrossRef]
  50. Weisberg, R.H.; Zheng, L. Hurricane storm surge simulations for Tampa Bay. Estuaries Coasts 2006, 29, 899–913. [Google Scholar] [CrossRef]
  51. Helderop, E.; Grubesic, T.H. Hurricane storm surge in Volusia County, Florida: Evidence of a tipping point for infrastructure damage. Disasters 2019, 43, 157–180. [Google Scholar] [CrossRef]
  52. Wijnberg, K.M.; Kroon, A. Barred beaches. Geomorphology 2002, 48, 103–120. [Google Scholar] [CrossRef]
  53. Postacchini, M.; Ludeno, G. Combining numerical simulations and normalized scalar product strategy: A new tool for predicting beach inundation. J. Mar. Sci. Eng. 2019, 7, 325. [Google Scholar] [CrossRef] [Green Version]
  54. Rutten, J.; de Jong, S.M.; Ruessink, G. Accuracy of nearshore bathymetry inverted from X-band radar and optical video data. IEEE Trans. Geosci. Remote Sens. 2016, 55, 1106–1116. [Google Scholar] [CrossRef]
  55. Brodie, K.L.; Palmsten, M.L.; Hesser, T.J.; Dickhudt, P.J.; Raubenheimer, B.; Ladner, H.; Elgar, S. Evaluation of video-based linear depth inversion performance and applications using altimeters and hydrographic surveys in a wide range of environmental conditions. Coast. Eng. 2018, 136, 147–160. [Google Scholar] [CrossRef] [Green Version]
  56. Ranasinghe, R. Assessing climate change impacts on open sandy coasts: A review. Earth-Sci. Rev. 2016, 160, 320–332. [Google Scholar] [CrossRef] [Green Version]
  57. Vousdoukas, M.I.; Mentaschi, L.; Voukouvalas, E.; Verlaan, M.; Jevrejeva, S.; Jackson, L.P.; Feyen, L. Global probabilistic projections of extreme sea levels show intensification of coastal flood hazard. Nat. Commun. 2018, 9, 1–12. [Google Scholar]
  58. Vousdoukas, M.I.; Ranasinghe, R.; Mentaschi, L.; Plomaritis, T.A.; Athanasiou, P.; Luijendijk, A.; Feyen, L. Sandy coastlines under threat of erosion. Nat. Clim. Chang. 2020, 10, 260–263. [Google Scholar] [CrossRef]
  59. Taherkhani, M.; Vitousek, S.; Barnard, P.L.; Frazer, N.; Anderson, T.R.; Fletcher, C.H. Sea-level rise exponentially increases coastal flood frequency. Sci. Rep. 2020, 10, 6466. [Google Scholar] [CrossRef]
  60. Le Cozannet, G.; Thieblemont, R.; Rohmer, J.; Idier, D.; Manceau, J.C.; Quique, R. Low-end probabilistic sea-level projections. Water 2019, 11, 1507. [Google Scholar] [CrossRef] [Green Version]
  61. Short, A.D. Handbook of Beach and Shoreface Morphodynamics; Number 551.468; John Wiley & Sons: New York, NY, USA, 1999. [Google Scholar]
  62. Masselink, G.; Short, A.D. The effect of tide range on beach morphodynamics and morphology: A conceptual beach model. J. Coast. Res. 1993, 9, 785–800. [Google Scholar]
  63. Boccotti, P. Wave Mechanics for Ocean Engineering; Elsevier: Amsterdam, The Netherlands, 2000. [Google Scholar]
  64. Bonazzi, A.; Cusack, S.; Mitas, C.; Jewson, S. The spatial structure of European wind storms as characterized by bivariate extreme-value Copulas. Nat. Hazards Earth Syst. Sci. 2012, 12, 1769–1782. [Google Scholar] [CrossRef] [Green Version]
  65. MacClenahan, P.; McKenna, J.; Cooper, J.; O’Kane, B. Identification of highest magnitude coastal storm events over western Ireland on the basis of wind speed and duration thresholds. Int. J. Climatol. A J. R. Meteorol. Soc. 2001, 21, 829–842. [Google Scholar] [CrossRef]
  66. Sotillo, M.; Aznar, R.; Valero, F. The 44-year Mediterranean HIPOCAS wind database: A useful tool to analyse offshore extreme wind events from a long-term regional perspective. Coast. Eng. 2008, 55, 930–943. [Google Scholar] [CrossRef]
  67. Matias, A.; Carrasco, A.R.; Loureiro, C.; Masselink, G.; Andriolo, U.; McCall, R.; Ferreira, Ó.; Plomaritis, T.A.; Pacheco, A.; Guerreiro, M. Field measurements and hydrodynamic modelling to evaluate the importance of factors controlling overwash. Coast. Eng. 2019, 152, 103523. [Google Scholar] [CrossRef] [Green Version]
  68. Hamed, K.; Rao, A.R. Flood Frequency Analysis; CRC Press: Boca Raton, FL, USA, 2019. [Google Scholar]
  69. Kriebel, D.; Dalrymple, R. A Northeaster Risk Index; R and D Coastal Engineering: Newak, DE, USA, 1995. [Google Scholar]
  70. Dorsch, W.; Newland, T.; Tassone, D.; Tymons, S.; Walker, D. A statistical approach to modelling the temporal patterns of ocean storms. J. Coast. Res. 2008, 24, 1430–1438. [Google Scholar] [CrossRef]
  71. Ferreira, Ó. Storm groups versus extreme single storms: Predicted erosion and management consequences. J. Coast. Res. 2005, 42, 221–227. [Google Scholar]
  72. Coco, G.; Senechal, N.; Rejas, A.; Bryan, K.R.; Capo, S.; Parisot, J.; Brown, J.A.; MacMahan, J.H. Beach response to a sequence of extreme storms. Geomorphology 2014, 204, 493–501. [Google Scholar] [CrossRef] [Green Version]
  73. Dissanayake, P.; Brown, J.; Wisse, P.; Karunarathna, H. Effects of storm clustering on beach/dune evolution. Mar. Geol. 2015, 370, 63–75. [Google Scholar] [CrossRef]
  74. Ruessink, B.; Kroon, A. The behaviour of a multiple bar system in the nearshore zone of Terschelling, the Netherlands: 1965–1993. Mar. Geol. 1994, 121, 187–197. [Google Scholar] [CrossRef]
  75. Postacchini, M.; Soldini, L.; Lorenzoni, C.; Mancinelli, A. Medium-term dynamics of a middle Adriatic barred beach. Ocean Sci. 2017, 13, 719. [Google Scholar] [CrossRef]
  76. Melito, L.; Parlagreco, L.; Perugini, E.; Postacchini, M.; Devoti, S.; Soldini, L.; Zitti, G.; Liberti, L.; Brocchini, M. Sandbar dynamics in microtidal environments: Migration patterns in unprotected and bounded beaches. Coast. Eng. 2020, 161, 103768. [Google Scholar] [CrossRef]
  77. Bertin, X.; Prouteau, E.; Letetrel, C. A significant increase in wave height in the North Atlantic Ocean over the 20th century. Glob. Planet. Chang. 2013, 106, 77–83. [Google Scholar] [CrossRef]
  78. Ferrarin, C.; Roland, A.; Bajo, M.; Umgiesser, G.; Cucco, A.; Davolio, S.; Buzzi, A.; Malguzzi, P.; Drofa, O. Tide-surge-wave modelling and forecasting in the Mediterranean Sea with focus on the Italian coast. Ocean Model. 2013, 61, 38–48. [Google Scholar] [CrossRef] [Green Version]
  79. Parlagreco, L.; Melito, L.; Devoti, S.; Perugini, E.; Soldini, L.; Zitti, G.; Brocchini, M. Monitoring for coastal resilience: Preliminary data from five Italian sandy beaches. Sensors 2019, 19, 1854. [Google Scholar] [CrossRef] [Green Version]
  80. Postacchini, M.; Lalli, F.; Memmola, F.; Bruschi, A.; Bellafiore, D.; Lisi, I.; Zitti, G.; Brocchini, M. A model chain approach for coastal inundation: Application to the bay of Alghero. Estuarine, Coast. Shelf Sci. 2019, 219, 56–70. [Google Scholar] [CrossRef]
  81. Gornitz, V. Vulnerability of the East Coast, USA to future sea level rise. J. Coast. Res. 1990, 9, 201–237. [Google Scholar]
  82. Coelho, C.; Silva, R.; Veloso-Gomes, F.; Taveira Pinto, F. A vulnerability analysis approach for the Portuguese west coast. Risk Anal. V Simul. Hazard Mitigation 2006, 1, 251–262. [Google Scholar]
  83. Mattei, G.; Rizzo, A.; Anfuso, G.; Aucelli, P.; Gracia, F. A tool for evaluating the archaeological heritage vulnerability to coastal processes: The case study of Naples Gulf (southern Italy). Ocean Coast. Manag. 2019, 179, 104876. [Google Scholar] [CrossRef]
  84. Crowell, M.; Leikin, H.; Buckley, M.K. Evaluation of coastal erosion hazards study: An overview. J. Coast. Res. 1999, 28, 2–9. [Google Scholar]
  85. Crowell, M.; Buckley, M.K. Calculating erosion rates: Using long-term data to increase data confidence. In Coastal Engineering Considerations in Coastal Zone Management; ASCE: Sheffield, UK, 1993; pp. 117–129. [Google Scholar]
  86. Smith, G.L.; Zarillo, G.A. Calculating long-term shoreline recession rates using aerial photographic and beach profiling techniques. J. Coast. Res. 1990, 6, 111–120. [Google Scholar]
  87. Anfuso, G.; Dominguez, L.; Gracia, F. Short and medium-term evolution of a coastal sector in Cadiz, SW Spain. Catena 2007, 70, 229–242. [Google Scholar] [CrossRef]
  88. Williams, A.; Alveirinho-Dias, J.; Novo, F.G.; Garcıa-Mora, M.; Curr, R.; Pereira, A. Integrated coastal dune management: Checklists. Cont. Shelf Res. 2001, 21, 1937–1960. [Google Scholar] [CrossRef]
  89. Mullick, M.R.A.; Tanim, A.; Islam, S.M.S. Coastal vulnerability analysis of Bangladesh coast using fuzzy logic based geospatial techniques. Ocean Coast. Manag. 2019, 174, 154–169. [Google Scholar] [CrossRef]
  90. Bertoni, D.; Sarti, G.; Alquini, F.; Ciccarelli, D. Implementing a coastal dune vulnerability index (CDVI) to support coastal management in different settings (Brazil and Italy). Ocean Coast. Manag. 2019, 180, 104916. [Google Scholar] [CrossRef]
  91. Dal Cin, R.; Simeoni, U. A model for determining the classification, vulnerability and risk in the southern coastal zone of the Marche (Italy). J. Coast. Res. 1994, 10, 18–29. [Google Scholar]
  92. Simeoni, U.; Tessari, U.; Zamariolo, A.; Gabbianelli, G.; Del Grande, C.; Gonella, M.; Polo, P.; Atzeni, P.; Anconetani, P.; Pellizzari, M. Studio dell’Ancona e delle Vene di Bellocchio e del litorale tra Porto Garibaldi e Porto Corsini: Proposta di sistemazione ambientale; Rapporto Conclusivo; Parco del Delta del Po Emilia-Romagna: Ferrara, Italy, 2000. [Google Scholar]
  93. Anfuso, G.; Martínez Del Pozo, J.Á. Assessment of coastal vulnerability through the use of GIS tools in South Sicily (Italy). Environ. Manag. 2009, 43, 533–545. [Google Scholar] [CrossRef] [Green Version]
  94. Abuodha, P.A.; Woodroffe, C.D. Assessing Vulnerability of Coasts to Climate Change: A Review of Approaches and Their Application to the Australian Coast; UOW Library: Wollongong, Australia, 2006. [Google Scholar]
  95. Özyurt, G.; Ergin, A. Application of sea level rise vulnerability assessment model to selected coastal areas of Turkey. J. Coast. Res. 2009, 56, 248–251. [Google Scholar]
  96. Özyurt, G.; Ergin, A. Improving coastal vulnerability assessments to sea-level rise: A new indicator-based methodology for decision makers. J. Coast. Res. 2010, 26, 265–273. [Google Scholar] [CrossRef]
  97. Cooper, J.; McLaughlin, S. Contemporary multidisciplinary approaches to coastal classification and environmental risk analysis. J. Coast. Res. 1998, 4, 512–524. [Google Scholar]
  98. García-Mora, M.; Gallego-Fernández, J.; Williams, A.; García-Novo, F. A coastal dune vulnerability classification. A case study of the SW Iberian Peninsula. J. Coast. Res. 2001, 17, 802–811. [Google Scholar]
  99. Gracia, F.; Rodríguez Vidal, J.; Benavente, J.; Cáceres, L.; López Aguayo, F. Tectónica cuaternaria en la Bahía de Cádiz. Avances en el estudio del Cuaternario español; Carles Roqué i Pau y Lluís Pallí Buxó: Girona, Spain, 1999; pp. 67–74. [Google Scholar]
  100. Sunamura, T. Geomorphology of Rocky Coasts; John Wiley & Son Ltd.: Hoboken, NJ, USA, 1992; Volume 3. [Google Scholar]
  101. Trenhaile, A.S. Rock coasts, with particular emphasis on shore platforms. Geomorphology 2002, 48, 7–22. [Google Scholar] [CrossRef]
  102. Gomitz, V.M.; Beaty, T.W.; Daniels, R.C. A Coastal Hazards Data Base for the US West Coast; Technical Report; Oak Ridge National Lab. (ORNL): Oak Ridge, TN, USA, 1997.
  103. Hammar-Klose, E.S.; Thieler, E.R. Coastal vulnerability to Sea-Level Rise: A Preliminary Database for the US Atlantic, Pacific, and Gulf of Mexico Coasts; Number 68; US Geological Survey: Woods Hole, MA, USA, 2001.
  104. Thieler, E.; Himmelstoss, E.; Zichichi, J.; Miller, T. Digital shoreline analysis system (DSAS) version 3.0. In ArcGIS© Extension for Calculating Shoreline Change; US Geological Survey Open-File Report; US Geological Survey: Woods Hole, MA, USA, 2005; Volume 1304. [Google Scholar]
  105. Gracia, F.; Sanjaume, E.; Hernández, L.; Hernández, A.; Flor, G.; Gómez-Serrano, M. Dunas marítimas y Continentals, Bases ecológicas Preliminares para la Conservación de los tipos de hábitat de interés Comunitario en España; Ministerio de Medio Ambiente y Medio Rural y Marino: Madrid, Spain, 2009.
  106. Raji, O.; Niazi, S.; Snoussi, M.; Dezileau, L.; Khouakhi, A. Vulnerability assessment of a lagoon to sea level rise and storm events: Nador lagoon (NE Morocco). J. Coast. Res. 2013, 65, 802–807. [Google Scholar] [CrossRef]
  107. Anfuso, G.; Gracia, F.J.; Battocletti, G. Determination of cliffed coastline sensitivity and associated risk for human structures: A methodological approach. J. Coast. Res. 2013, 29, 1292–1296. [Google Scholar]
  108. Wright, L.D.; Short, A.D. Morphodynamic variability of surf zones and beaches: A synthesis. Mar. Geol. 1984, 56, 93–118. [Google Scholar] [CrossRef]
  109. Pendleton, E.A.; Thieler, E.R.; Williams, S.J. Coastal Vulnerability Assessment of Golden Gate National Recreation Area to Sea-Level Rise; US Geological Survey Open-File Report; US Geological Survey: Woods Hole, MA, USA, 2005.
  110. Santos, M.; Río, L.D.; Benavente, J. GIS-based approach to the assessment of coastal vulnerability to storms. Case study in the Bay of Cádiz (Andalusia, Spain). J. Coast. Res. 2013, 65, 826–831. [Google Scholar] [CrossRef]
  111. Kraus, N.; Militello, A.; Todoroff, G. Barrier Breaching Processes and Barrier Spit Breach, Stone Lagoon; Engineer Research and Development Centre, MS Coastal and Hydraulics Lab.: Vicksburg, MS, USA, 2002. [Google Scholar]
  112. Goldsmith, V. Coastal dunes. In Coastal Sedimentary Environments; Springer: Berlin/Heidelberg, Germany, 1985; pp. 303–378. [Google Scholar]
  113. Ceia, F.R.; Patrício, J.; Marques, J.C.; Dias, J.A. Coastal vulnerability in barrier islands: The high risk areas of the Ria Formosa (Portugal) system. Ocean Coast. Manag. 2010, 53, 478–486. [Google Scholar] [CrossRef]
  114. Molina, R.; Manno, G.; Lo Re, C.; Anfuso, G. Dune Systems’ Characterization and Evolution in the Andalusia Mediterranean Coast (Spain). Water 2020, 12, 2094. [Google Scholar] [CrossRef]
  115. Ozyurt, G.; Ergin, A.; Esen, M. Indicator based coastal vulnerability assessment model to sea level rise. In Proceedings of the 7th International Conference on Coastal and Port Engineering in Developing Countries (COPEDEC), Dubai, UAE, 24–28 February 2008. Paper E-06. [Google Scholar]
  116. Di Paola, G.; Iglesias, J.; Rodríguez, G.; Benassai, G.; Aucelli, P.; Pappone, G. Estimating coastal vulnerability in a meso-tidal beach by means of quantitative and semi-quantitative methodologies. J. Coast. Res. 2011, 61, 303–308. [Google Scholar] [CrossRef]
  117. Aybulatov, N.; Artyukhin, Y. Geo-Ecology of the World Ocean’s Shelf and Coasts; World Ocean’s Shelf and Coasts: Sheffield, UK, 1993. [Google Scholar]
  118. Szlafsztein, C.; Sterr, H. A GIS-based vulnerability assessment of coastal natural hazards, state of Pará, Brazil. J. Coast. Conserv. 2007, 11, 53–66. [Google Scholar] [CrossRef]
  119. De Serio, F.; Armenio, E.; Mossa, M.; Petrillo, A.F. How to define priorities in coastal vulnerability assessment. Geosciences 2018, 8, 415. [Google Scholar] [CrossRef] [Green Version]
  120. De Lange, H.; Sala, S.; Vighi, M.; Faber, J. Ecological vulnerability in risk assessment—A review and perspectives. Sci. Total Environ. 2010, 408, 3871–3879. [Google Scholar] [CrossRef]
  121. Bevacqua, A.; Yu, D.; Zhang, Y. Coastal vulnerability: Evolving concepts in understanding vulnerable people and places. Environ. Sci. Policy 2018, 82, 19–29. [Google Scholar] [CrossRef]
  122. Benassai, G.; Migliaccio, M.; Nunziata, F. The use of COSMO-SkyMed© SAR data for coastal management. J. Mar. Sci. Technol. 2015, 20, 542–550. [Google Scholar] [CrossRef]
  123. Nunziata, F.; Buono, A.; Migliaccio, M.; Benassai, G. Dual-polarimetric C-and X-band SAR data for coastline extraction. IEEE J. Sel. Top. Appl. Earth Obs. Remote Sens. 2016, 9, 4921–4928. [Google Scholar] [CrossRef]
  124. Di Luccio, D.; Benassai, G.; Di Paola, G.; Mucerino, L.; Buono, A.; Rosskopf, C.M.; Nunziata, F.; Migliaccio, M.; Urciuoli, A.; Montella, R. Shoreline rotation analysis of embayed beaches by means of in situ and remote surveys. Sustainability 2019, 11, 725. [Google Scholar] [CrossRef] [Green Version]
  125. Benassai, G.; Aucelli, P.; Budillon, G.; De Stefano, M.; Di Luccio, D.; Di Paola, G.; Montella, R.; Mucerino, L.; Sica, M.; Pennetta, M. Rip current evidence by hydrodynamic simulations, bathymetric surveys and UAV observation. Nat. Hazards Earth Syst. Sci. 2017, 17, 1493. [Google Scholar] [CrossRef] [Green Version]
  126. Pugliano, G.; Robustelli, U.; Di Luccio, D.; Mucerino, L.; Benassai, G.; Montella, R. Statistical Deviations in Shoreline Detection Obtained with Direct and Remote Observations. J. Mar. Sci. Eng. 2019, 7, 137. [Google Scholar] [CrossRef] [Green Version]
  127. Jankowski, P. Towards participatory geographic information systems for community-based environmental decision making. J. Environ. Manag. 2009, 90, 1966–1971. [Google Scholar] [CrossRef]
  128. Montella, R.; Kosta, S.; Foster, I. DYNAMO: Distributed leisure yacht-carried sensor-network for atmosphere and marine data crowdsourcing applications. In Proceedings of the 2018 IEEE International Conference on Cloud Engineering (IC2E), Orlando, FL, USA, 17–20 April 2018; pp. 333–339. [Google Scholar]
  129. Di Luccio, D.; Riccio, A.; Galletti, A.; Laccetti, G.; Lapegna, M.; Marcellino, L.; Kosta, S.; Montella, R. Coastal marine data crowdsourcing using the Internet of Floating Things: Improving the results of a water quality model. IEEE Access 2020, 8, 101209–101223. [Google Scholar] [CrossRef]
  130. Keating, M.; Rhodes, B.; Richards, A. Crowdsourcing: A flexible method for innovation, data collection, and analysis in social science research. Soc. Media Soc. Surv. Res. 2013, 1, 179–201. [Google Scholar]
  131. Taeihagh, A. Crowdsourcing, sharing economies and development. J. Dev. Soc. 2017, 33, 191–222. [Google Scholar] [CrossRef]
  132. Cilliers, L.; Flowerday, S. Information security in a public safety, participatory crowdsourcing smart city project. In Proceedings of the World Congress on Internet Security (WorldCIS-2014), London, UK, 20 September 2014; pp. 36–41. [Google Scholar]
  133. Kong, X.; Liu, X.; Jedari, B.; Li, M.; Wan, L.; Xia, F. Mobile crowdsourcing in smart cities: Technologies, applications, and future challenges. IEEE Internet Things J. 2019, 6, 8095–8113. [Google Scholar] [CrossRef]
  134. Mukhopadhyay, A.; Dasgupta, R.; Hazra, S.; Mitra, D. Coastal hazards and vulnerability: A review. Int. J. Geol. Earth Environ. Sci. 2012, 2, 57–69. [Google Scholar]
  135. May, V. Integrating the geomorphological environment, cultural heritage, tourism and coastal hazards in practice. Geografia Fisica e Dinamica Quaternaria 2008, 31, 187–194. [Google Scholar]
  136. Donovan, K.H.M. Cultural Responses to Volcanic Hazards on Mt Merapi, Indonesia. Ph.D. Thesis, University of Plymouth, Plymouth, UK, 2010. [Google Scholar]
  137. Grattan, J.; Torrence, R. Natural Disasters and Cultural Change; Routledge: London, UK, 2003. [Google Scholar]
  138. Gregory, G.; Loveridge, A.; Gough, J. Social and cultural aspects of natural hazards perception and response. N. Z. Geogr. 1997, 53, 47–54. [Google Scholar] [CrossRef]
  139. Klein, R.J.; Nicholls, R.J.; Mimura, N. Coastal adaptation to climate change: Can the IPCC Technical Guidelines be applied? Mitig. Adapt. Strateg. Glob. Chang. 1999, 4, 239–252. [Google Scholar] [CrossRef]
  140. Klein, R.J.; Nicholls, R.J.; Ragoonaden, S.; Capobianco, M.; Aston, J.; Buckley, E.N. Technological options for adaptation to climate change in coastal zones. J. Coast. Res. 2001, 17, 531–543. [Google Scholar]
  141. VanKoningsveld, M.; Mulder, J.P.; Stive, M.J.; VanDerValk, L.; VanDerWeck, A. Living with sea-level rise and climate change: A case study of the Netherlands. J. Coast. Res. 2008, 24, 367–379. [Google Scholar] [CrossRef] [Green Version]
  142. Niemeyer, H.D.; Berkenbrink, C.; Ritzmann, A.; Knaack, H.; Wurpts, A.; Kaiser, R. Evaluation of coastal protection strategies in respect of climate change impacts. Die Küste 81 Model. 2014, 81, 565–577. [Google Scholar]
  143. Williams, A.; Rangel-Buitrago, N.; Pranzini, E.; Anfuso, G. The management of coastal erosion. Ocean Coast. Manag. 2018, 156, 4–20. [Google Scholar] [CrossRef]
  144. Foti, E.; Musumeci, R.E.; Stagnitti, M. Coastal defence techniques and climate change: A review. Rend. Lincei. Sci. Fis. E Nat. 2020, 31, 123–138. [Google Scholar] [CrossRef]
  145. Airoldi, L.; Abbiati, M.; Beck, M.W.; Hawkins, S.J.; Jonsson, P.R.; Martin, D.; Moschella, P.S.; Sundelöf, A.; Thompson, R.C.; Åberg, P. An ecological perspective on the deployment and design of low-crested and other hard coastal defence structures. Coast. Eng. 2005, 52, 1073–1087. [Google Scholar] [CrossRef] [Green Version]
  146. Bertasi, F.; Colangelo, M.A.; Abbiati, M.; Ceccherelli, V.U. Effects of an artificial protection structure on the sandy shore macrofaunal community: The special case of Lido di Dante (Northern Adriatic Sea). Hydrobiologia 2007, 586, 277–290. [Google Scholar] [CrossRef]
  147. Walker, S.J.; Schlacher, T.A.; Thompson, L.M. Habitat modification in a dynamic environment: The influence of a small artificial groyne on macrofaunal assemblages of a sandy beach. Estuarine Coast. Shelf Sci. 2008, 79, 24–34. [Google Scholar] [CrossRef]
  148. Bastos, L.; Bio, A.; Pinho, J.; Granja, H.; da Silva, A.J. Dynamics of the Douro estuary sand spit before and after breakwater construction. Estuarine Coast. Shelf Sci. 2012, 109, 53–69. [Google Scholar] [CrossRef]
  149. Veloso-Gomes, F.; Taveira-Pinto, F.; das Neves, L.; Barbosa, J.P.; Coelho, C. Erosion risk levels at the NW Portuguese coast: The Douro mouth—Cape Mondego stretch. J. Coast. Conserv. 2004, 10, 43–52. [Google Scholar] [CrossRef]
  150. Finkl, C.; Walker, H.J. Beach nourishment. In Engineered Coasts; Springer: Berlin/Heidelberg, Germany, 2002; pp. 1–22. [Google Scholar]
  151. Cooper, J.; Anfuso, G.; Del Río, L. Bad beach management: European perspectives. Geol. Soc. Am. Ser. 2009, 460, 167–179. [Google Scholar]
  152. Reeve, D.; Spivack, M. Evolution of shoreline position moments. Coast. Eng. 2004, 51, 661–673. [Google Scholar] [CrossRef]
  153. French, P.W. Coastal Defences: Processes, Problems and Solutions; Psychology Press: East Sussex, UK, 2001. [Google Scholar]
  154. Huisman, B.; De Schipper, M.; Ruessink, B. Sediment sorting at the Sand Motor at storm and annual time scales. Mar. Geol. 2016, 381, 209–226. [Google Scholar] [CrossRef]
  155. Barnard, P.; Erikson, L.H.; Hansen, J. Monitoring and modeling shoreline response due to shoreface nourishment on a high-energy coast. J. Coast. Res. 2009, 56, 29–33. [Google Scholar]
  156. Krumbein, W.C.; James, W.R. A Lognormal Size Distribution Model for Estimating Stability of Beach Fill Material; Number 16; US Army Coastal Engineering Research Center Reston: Evanston, IL, USA, 1965. [Google Scholar]
  157. James, W.R. Techniques in Evaluating Suitability of Borrow Material for Beach Nourishment; Number 60; US Coastal Engineering Research Center: Fort Belvoir, VA, USA, 1975. [Google Scholar]
  158. Pranzini, E.; Anfuso, G.; Muñoz-Perez, J.J. A probabilistic approach to borrow sediment selection in beach nourishment projects. Coast. Eng. 2018, 139, 32–35. [Google Scholar] [CrossRef]
  159. Short, A.; Jackson, D. Beach morphodynamics. In Treatise on Geomorphology; Elsevier: Amsterdam, The Netherlands, 2013; pp. 106–129. [Google Scholar]
  160. Narayan, S.; Beck, M.W.; Reguero, B.G.; Losada, I.J.; Van Wesenbeeck, B.; Pontee, N.; Sanchirico, J.N.; Ingram, J.C.; Lange, G.M.; Burks-Copes, K.A. The effectiveness, costs and coastal protection benefits of natural and nature-based defences. PLoS ONE 2016, 11, e0154735. [Google Scholar] [CrossRef] [Green Version]
  161. Jackson, N.L.; Nordstrom, K.F. Aeolian sediment transport and landforms in managed coastal systems: A review. Aeolian Res. 2011, 3, 181–196. [Google Scholar] [CrossRef]
  162. Van der Nat, A.; Vellinga, P.; Leemans, R.; Van Slobbe, E. Ranking coastal flood protection designs from engineered to nature-based. Ecol. Eng. 2016, 87, 80–90. [Google Scholar] [CrossRef]
  163. McIvor, A.; Möller, I.; Spencer, T.; Spalding, M. Mangroves as a sustainable coastal defence. In Proceedings of the 7th International Conference on Asian and Pacific Coasts (APAC) The Nature Conservancy, Bali, Indonesia, 24–26 September 2013; pp. 24–26. [Google Scholar]
  164. Krauss, K.W.; Doyle, T.W.; Doyle, T.J.; Swarzenski, C.M.; From, A.S.; Day, R.H.; Conner, W.H. Water level observations in mangrove swamps during two hurricanes in Florida. Wetlands 2009, 29, 142–149. [Google Scholar] [CrossRef]
  165. Bao, T.Q. Effect of mangrove forest structures on wave attenuation in coastal Vietnam. Oceanologia 2011, 53, 807–818. [Google Scholar]
  166. IFRC. Breaking the Waves. Impact Analysis of Coastal Afforestation for Disaster Risk Reduction in Viet Nam; International Federation of Red Cross and Red Crescent Societies: Geneva, Switzerland, 2011. [Google Scholar]
  167. Rey, J.R.; Carlson, D.B.; Brockmeyer, R.E. Coastal wetland management in Florida: Environmental concerns and human health. Wetl. Ecol. Manag. 2012, 20, 197–211. [Google Scholar] [CrossRef]
  168. Brown, B.; Fadillah, R.; Nurdin, Y.; Soulsby, I.; Ahmad, R. CASE STUDY: Community Based Ecological Mangrove Rehabilitation (CBEMR) in Indonesia. From small (12–33 ha) to medium scales (400 ha) with pathways for adoption at larger scales (>5000 ha). Surv. Perspect. Integr. Environ. Soc. 2014, 7, 1–13. [Google Scholar]
  169. Giri, C.; Zhu, Z.; Tieszen, L.; Singh, A.; Gillette, S.; Kelmelis, J. Mangrove forest distributions and dynamics (1975–2005) of the tsunami-affected region of Asia. J. Biogeogr. 2008, 35, 519–528. [Google Scholar] [CrossRef]
  170. Villate Daza, D.A.; Sánchez Moreno, H.; Portz, L.; Portantiolo Manzolli, R.; Bolívar-Anillo, H.J.; Anfuso, G. Mangrove forests evolution and threats in the caribbean sea of Colombia. Water 2020, 12, 1113. [Google Scholar] [CrossRef] [Green Version]
  171. Vanderlinden, J.P.; Baztan, J.; Coates, T.; Dávila, O.G.; Hissel, F.; Kane, I.O.; Koundouri, P.; Mcfadden, L.; Parker, D.; Penning-Rowsell, E.; et al. Nonstructural approaches to coastal risk mitigations. In Coastal Risk Management in a Changing Climate; Elsevier: Amsterdam, The Netherlands, 2015; pp. 237–274. [Google Scholar]
  172. Bapalu, G.V.; Sinha, R. GIS in flood hazard mapping: A case study of Kosi River Basin, India. GIS Dev. Wkly. 2005, 1, 1–3. [Google Scholar]
  173. Di Luccio, D.; Benassai, G.; Budillon, G.; Mucerino, L.; Montella, R.; Pugliese Carratelli, E. Wave run-up prediction and observation in a micro-tidal beach. Nat. Hazards Earth Syst. Sci. 2018, 18, 2841–2857. [Google Scholar] [CrossRef] [Green Version]
  174. Bernardini, G.; Postacchini, M.; Quagliarini, E.; Brocchini, M.; Cianca, C.; D’Orazio, M. A preliminary combined simulation tool for the risk assessment of pedestrians’ flood-induced evacuation. Environ. Model. Softw. 2017, 96, 14–29. [Google Scholar] [CrossRef]
  175. Esteves, L.S. What is Managed Realignment? In Managed Realignment: A Viable Long-Term Coastal Management Strategy? Springer: Berlin/Heidelberg, Germany, 2014; pp. 19–31. [Google Scholar]
  176. Ruol, P.; Martinelli, L.; Favaretto, C. Vulnerability analysis of the Venetian littoral and adopted mitigation strategy. Water 2018, 10, 984. [Google Scholar] [CrossRef] [Green Version]
  177. Molina, R.; Manno, G.; Re, C.L.; Anfuso, G.; Ciraolo, G. A Methodological Approach to Determine Sound Response Modalities to Coastal Erosion Processes in Mediterranean Andalusia (Spain). J. Mar. Sci. Eng. 2020, 8, 154. [Google Scholar] [CrossRef] [Green Version]
  178. Cooper, J.; McKenna, J. Social justice in coastal erosion management: The temporal and spatial dimensions. Geoforum 2008, 39, 294–306. [Google Scholar] [CrossRef]
  179. Carvalho, T.; Coelho, C. Coastal risk perception: A case study in Aveiro District, Portugal. J. Hazard. Mater. 1998, 61, 263–270. [Google Scholar] [CrossRef]
  180. Economos, C.D. Beach user values and perceptions of coastal erosion. In Environment Waikato Technical Report; Environment Waikato: Hamilton, New Zealand, 2002. [Google Scholar]
  181. Anfuso, G.; Williams, A.T.; Martínez, G.C.; Botero, C.; Hernández, J.C.; Pranzini, E. Evaluation of the scenic value of 100 beaches in Cuba: Implications for coastal tourism management. Ocean Coast. Manag. 2017, 142, 173–185. [Google Scholar] [CrossRef]
  182. Clayton, K.M. Sediment Input from the Norfolk Cliffs, Eastern England A Century of Coast Protection and Its Effect. J. Coast. Res. 1989, 5, 433–442. [Google Scholar]
  183. Pontee, N.; Drummond, J.; Morrisey, D. Coastline change and implications for habitat loss. In Proceedings of the Institution of Civil Engineers-Maritime Engineering; Thomas Telford Ltd.: London, UK, 2004; Volume 157, pp. 133–142. [Google Scholar]
  184. Nason, S. Maintenance of Uneconomic Sea Flood Defences: A Way Forward; Department for Environment (DEFRA): London, UK, 2004.
  185. Nason, S. Adaptation to Climate Change; Department for Environment (DEFRA): London, UK, 2016. [Google Scholar]
  186. Chatterton, J.; Clarke, C.; Daly, E.; Dawks, S.; Elding, C.; Fenn, T.; Hick, E.; Miller, J.; Morris, J.; Ogunyoye, F.; et al. The Costs and Impacts of the Winter 2013 to 2014 Floods; Report SC140025; Environment Agency: Bristol, UK, 2016. [Google Scholar]
  187. Leatherman, S.P. Coastal erosion and the United States national flood insurance program. Ocean Coast. Manag. 2018, 156, 35–42. [Google Scholar] [CrossRef]
  188. Leatherman, S.P.; White, G. Living on the edge: The coastal collision course. Nat. Hazards Obs. 2005, 30, 5–6. [Google Scholar]
  189. Mileti, D.S.; Design, D. A Reassessment of Natural Hazards in the United State; Joseph Henry Press: Washington, DC, USA, 1999. [Google Scholar]
  190. Di Paola, G.; Aucelli, P.P.C.; Benassai, G.; Iglesias, J.; Rodríguez, G.; Rosskopf, C.M. The assessment of the coastal vulnerability and exposure degree of Gran Canaria Island (Spain) with a focus on the coastal risk of Las Canteras Beach in Las Palmas de Gran Canaria. J. Coast. Conserv. 2018, 22, 1001–1015. [Google Scholar] [CrossRef]
  191. Ramieri, E.; Hartley, A.; Barbanti, A.; Santos, F.D.; Gomes, A.; Hilden, M.; Laihonen, P.; Marinova, N.; Santini, M. Methods for assessing coastal vulnerability to climate change. ETC CCA Tech. Pap. 2011, 1, 1–93. [Google Scholar]
  192. Marfai, M.A.; Sekaranom, A.B.; Ward, P. Community responses and adaptation strategies toward flood hazard in Jakarta, Indonesia. Nat. Hazards 2015, 75, 1127–1144. [Google Scholar] [CrossRef]
  193. Zhang, K.; Douglas, B.C.; Leatherman, S.P. Global warming and coastal erosion. Clim. Chang. 2004, 64, 41. [Google Scholar] [CrossRef]
  194. Idier, D.; Castelle, B.; Poumadère, M.; Balouin, Y.; Bertoldo, R.B.; Bouchette, F.; Boulahya, F.; Brivois, O.; Calvete, D.; Capo, S.; et al. Vulnerability of sandy coasts to climate variability. Clim. Res. 2013, 57, 19–44. [Google Scholar] [CrossRef] [Green Version]
  195. Gornitz, V. Mean sea level changes in the recent past. In Climate and Sea Level Change, Observations, Projections and Implications; Cambridge University Press: Cambridge, MA, USA, 1993; pp. 25–44. [Google Scholar]
  196. Jensen, J.R.; Ramsey, E.W., III; Holmes, J.M.; Michel, J.E.; Savitsky, B.; Davis, B.A. Environmental sensitivity index (ESI) mapping for oil spills using remote sensing and geographic information system technology. Int. J. Geogr. Inf. Syst. 1990, 4, 181–201. [Google Scholar] [CrossRef]
  197. Hughes, G. An index to assess South Africa’s vulnerability to sea-level rise: News and views. S. Afr. J. Sci. 1992, 88, 308–311. [Google Scholar]
  198. Daniels, R.; Gornitz, V.; Mehta, A.; Lee, S.; Cushman, R. Adapting to Sea-Level Rise in the US Southeast: The Influence of Built Infrastructure and Biophysical Factors on the Inundation of Coastal Areas; Technical Report; Oak Ridge National Lab.: Oak Ridge, TN, USA, 1992.
  199. Hughes, P.; Brundrit, G.; Searson, S. The vulnerability of Walvis Bay to rising sea levels. J. Coast. Res. 1992, 8, 868–881. [Google Scholar]
  200. Klein, R.J.; Nicholls, R.J. Assessment of coastal vulnerability to climate change. Ambio 1999, 28, 182–187. [Google Scholar]
  201. Ojeda Zújar, J.; Álvarez Francoso, J.; Martín Cajaraville, D.; Fraile Jurado, P. El uso de las tecnologías de la información geográfica para el cálculo del índice de vulnerabilidad costera (CVI) ante una potencial subida del nivel del mar en la costa andaluza (España). GeoFocus 2009, 9, 83–100. [Google Scholar]
  202. Li, K.; Li, G.S.; Loukas, A.; Topouzelis, K. Vulnerability assessment of storm surges in the coastal area of Guangdong Province. Nat. Hazards Earth Syst. Sci. 2011, 11, 2003–2010. [Google Scholar] [CrossRef] [Green Version]
  203. Costa, S.; Coelho, C. Northwest coast of Portugal–Past behavior and future coastal defense options. J. Coast. Res. 2013, 65, 921–926. [Google Scholar] [CrossRef]
  204. Alexandrakis, G.; Manasakis, C.; Kampanis, N.A. Valuating the effects of beach erosion to tourism revenue. A management perspective. Ocean Coast. Manag. 2015, 111, 1–11. [Google Scholar] [CrossRef]
  205. Di Luccio, D.; Benassai, G.; Di Paola, G.; Rosskopf, C.M.; Mucerino, L.; Montella, R.; Contestabile, P. Monitoring and modelling coastal vulnerability and mitigation proposal for an archaeological site (Kaulonia, Southern Italy). Sustainability 2018, 10, 2017. [Google Scholar] [CrossRef] [Green Version]
1.
Figure 1. Block diagram of the principal susceptibility/vulnerability indexes components related to its assessment strategies to enhance coastal resilience/ human activities protection.
Jmse 09 00072 g001
Figure 2. Cross-shore view of the main characteristics of a typical beach-dune system.
Jmse 09 00072 g002
Figure 3. Spatial and temporal evolution scale characteristics of the main phenomena determining the coastal sentitivity/vulnerabilty.
Jmse 09 00072 g003
Table 1. Summary table of the coastal adaptation strategies approaches.
“Protect” Option
Hard engineering defensesbreakwaters, groins, seawalls dikes
Soft engineering interventionsbeach nourishment
Ecosystem-based solutionswetland/mangrove maintenance
dune replenishment
barrier island and coastal wetland maintenance
mangrove conservation/restoration
“Accomodate” Options
Non-structural mitigation options land-use regulations/restrictions
relocation programs
Information systemsflood hazard mapping
emergency preparedness programs
good warning
“Retreat” Option
Marraged realignmentsetback zones (vertical/horizontal)
soft tolerant crops
change of land use
Publisher’s Note: MDPI stays neutral with regard to jurisdictional claims in published maps and institutional affiliations.

