Study on the Rheological Behavior of a Model Clay Sediment


1
Institute of Ocean Engineering and Technology, Ocean College, Zhejiang University, Zhoushan 310027, China
2
The Engineering Research Center of Oceanic Sensing Technology and Equipment, Ministry of Education, Zhoushan 310027, China
*
Author to whom correspondence should be addressed.
J. Mar. Sci. Eng. 2021, 9(1), 81; https://0-doi-org.brum.beds.ac.uk/10.3390/jmse9010081
Submission received: 9 December 2020
/
Revised: 3 January 2021
/
Accepted: 5 January 2021
/
Published: 14 January 2021
(This article belongs to the Special Issue Selected Papers from the 8th International Conference on the Application of Physical Modelling in Coastal and Port Engineering and Science (CoastLab2020))
Abstract
:Clay sediments are the main component of seabed sediment. Interactions between the nano-sized, disk-shaped and charged clay particles are complicated, as they control the sediment’s rheology. In this study, we studied the rheological behavior of the clay sediment modeled by laponite and bentonite suspensions experimentally using a rotational rheometer. The yield stress decreased when water content increased. Meanwhile, the yield stress of the laponite suspension first increased and then decreased with increasing salinity. It is considered that the face-to-face repulsive electrostatic interaction between clay platelets dominated the yield behavior. A yield stress model was developed to describe the change of the yield stress with both the water content and the salinity. When the system started to flow, the viscosity decreased with increasing shear. A master curve of viscosity is was from the viscosity-stress curves at different water contents if the applied shear stress was normalized by the yield stress and the viscosity normalized by a characteristic viscosity. This study provides a preliminary understanding of the clay sediment rheology and its mechanism for the investigation on the flowing of the sediment systems with strong interparticle interaction.
1. Introduction
The deep-sea sediment is composed of sand, silt and clay, and the content of clay is commonly found to be more than 50% in, for example, South China Sea [1]. Due to the strong interaction between clay particles, the rheological property of the sediment is determined by the clay sediment, which is a multiphase flow system composed of cohesive clay minerals (e.g., kaolinite, montmorillonite and illite) and water. Therefore, understanding the flowing behavior of the clay-water system (or clay suspension) is important in the study of sediment transportation, where the viscosity and the yield stress are important factors. Clay particles are disk-shaped particles. Their faces carry permanently negative charges, and their edges are positively charged in acidic condition, while negatively charged in alkaline condition. As a result, when suspended in water, clay platelets interact strongly with each other by a face-to-edge attractive electrostatic interaction or a face-to-face repulsive electrostatic interaction. Consequently, the clay sediment forms a gel with a card-house (face-to-edge) or a face-to-face microstructure, complicating the rheology behavior [2,3,4,5,6,7,8,9]. The system is solid at the static state (gel state) while becomes liquid (flowing state) that approaching a low viscosity when a shear stress larger than a yield stress is applied. At the gel state, Laxton et al. [10] and Teh et al. [11] studied the change of yield stress with pH for the clay system. Both groups observed a decreasing yield stress with increasing pH. The change of the yield stress was proportionate to the square of the zeta potential of the system. Leong et al. [12] found that the yield stress of the kaolinite suspension changed by adding of citric acid and monophosphate. Sakairi et al. [13] discovered that the yield stress of the montmorillonite suspension decreased with increasing concentration of sodium chloride. Lin et al. [2] found that yield stress of the kaolinite suspensions was strongly affected by the clay concentration and the microstructure changes with the concentration due to the packing effect. Moreover, the yield stress increased with increasing temperature [14]. At the flowing state, Michot et al. [15] found that the orientation of particles was affected by the electrostatic interactions between platelets, which was better for smaller particles and for lower ionic strength. For smectite and montmorillonite suspensions, Paineau et al. [3] found particle alignment at high shear rates, which reduced the hydrodynamic drag, making the plateau viscosity at high shear rates insensitive to the clay concentration. Philippe et al. [16] studied the shear-thinning behavior of montmorillonite and beidellite suspensions. Based on the knowledge of the average orientation of the particles from the small angle x-ray scattering (SAXS) measurement, they were able to calculate the evolution of viscosity as a function of shear rate. Based on a master viscosity curve from the normalization of the applied shear stress by the yield stress of the system, Lin et al. [17] developed a model for clay suspensions, indicating that electrostatic interaction, measured by the yield stress, also dominated at high shear rates.
In the current stage, the study on rheological behavior of clay suspensions is still insufficient. A rheological model for practical application, such as in the simulation of the sediment flow, still needs to be developed. In this paper, we focused on the rheological behavior of an artificial laponite-water system, as well as a bentonite-water system to model sea sediment. We studied the yield stress of the system as a function of the clay concentration, as well as the ionic strength (IS, or salinity), and the mechanism was proposed.
2. Experiment
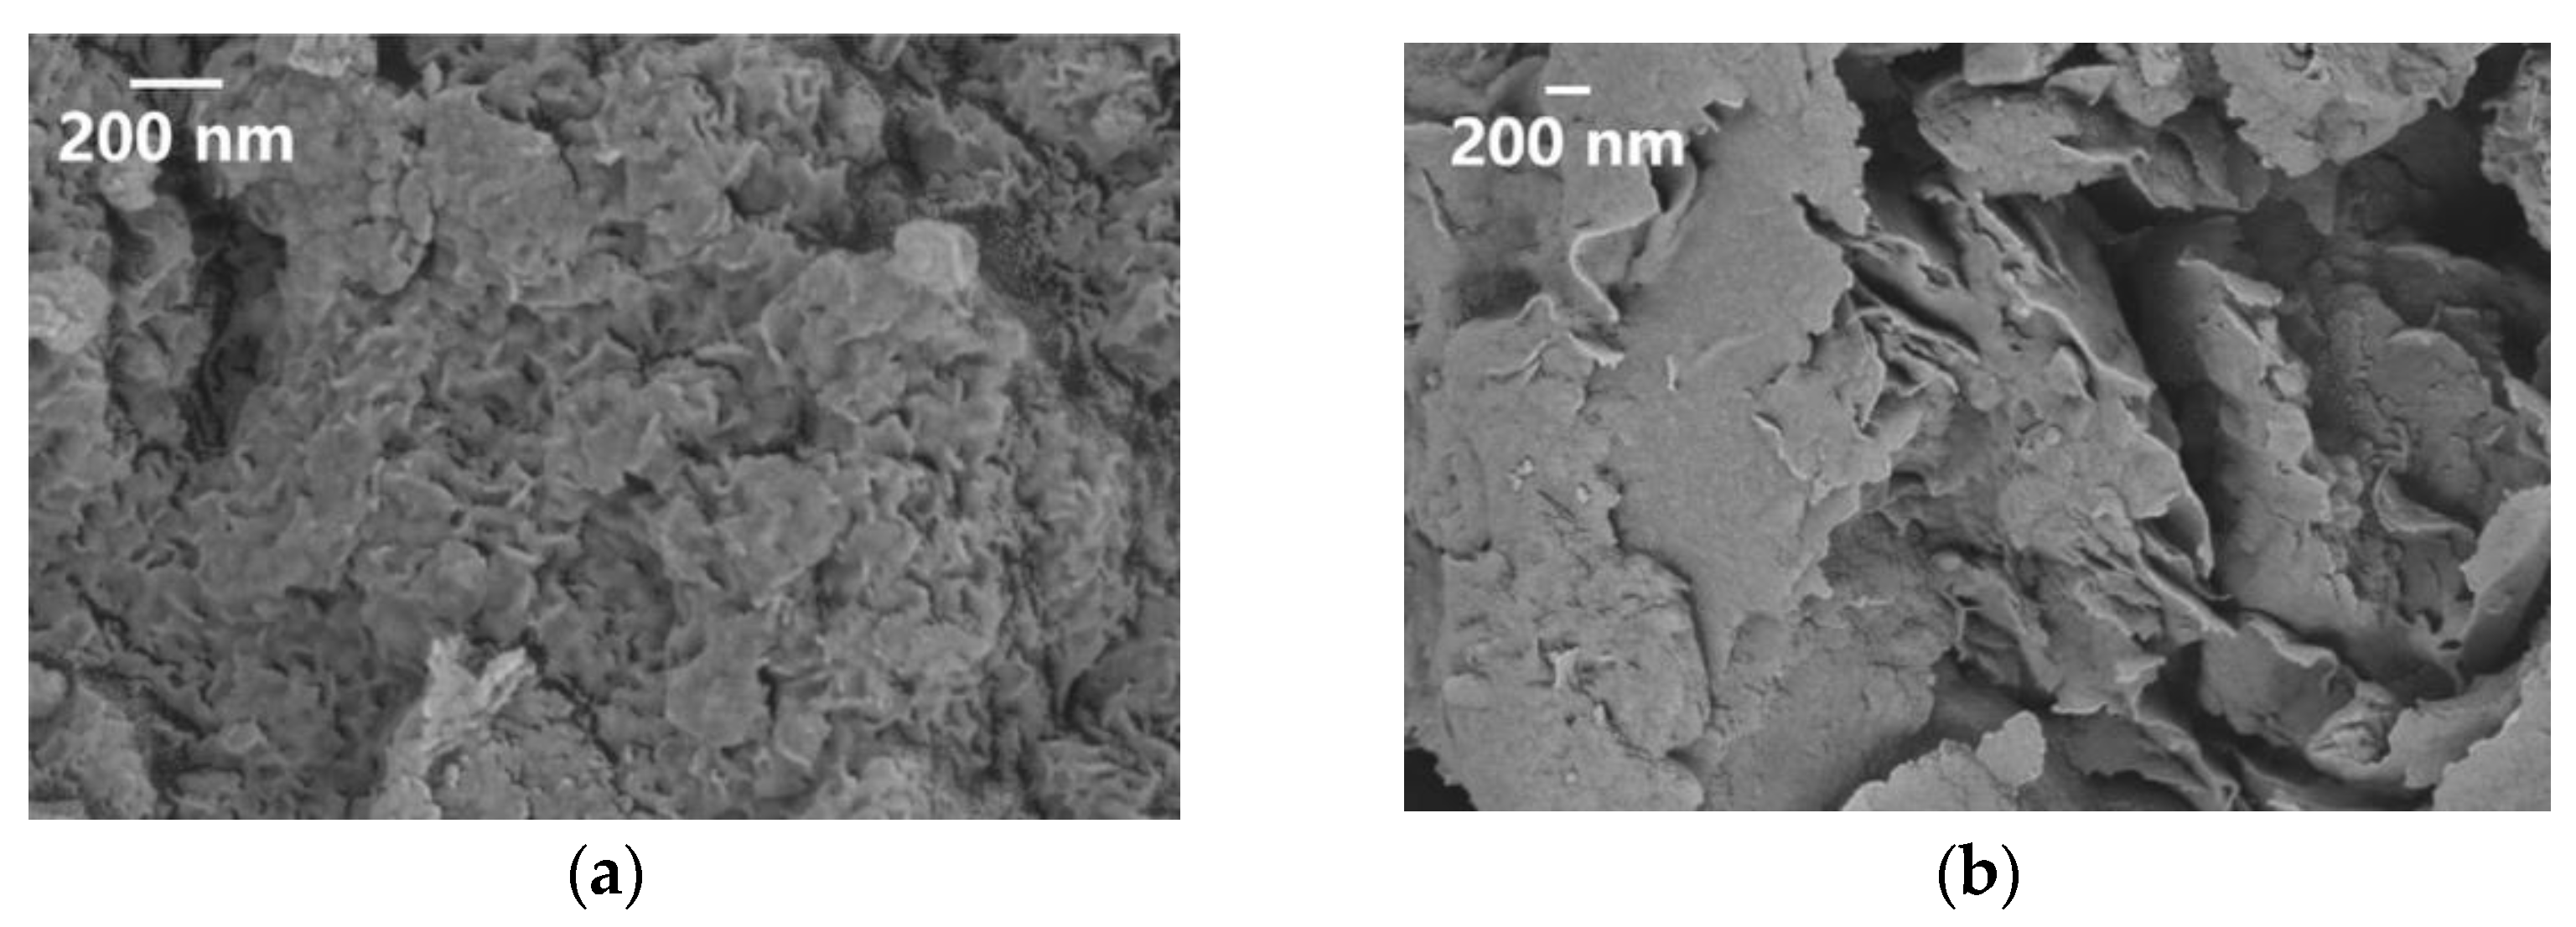
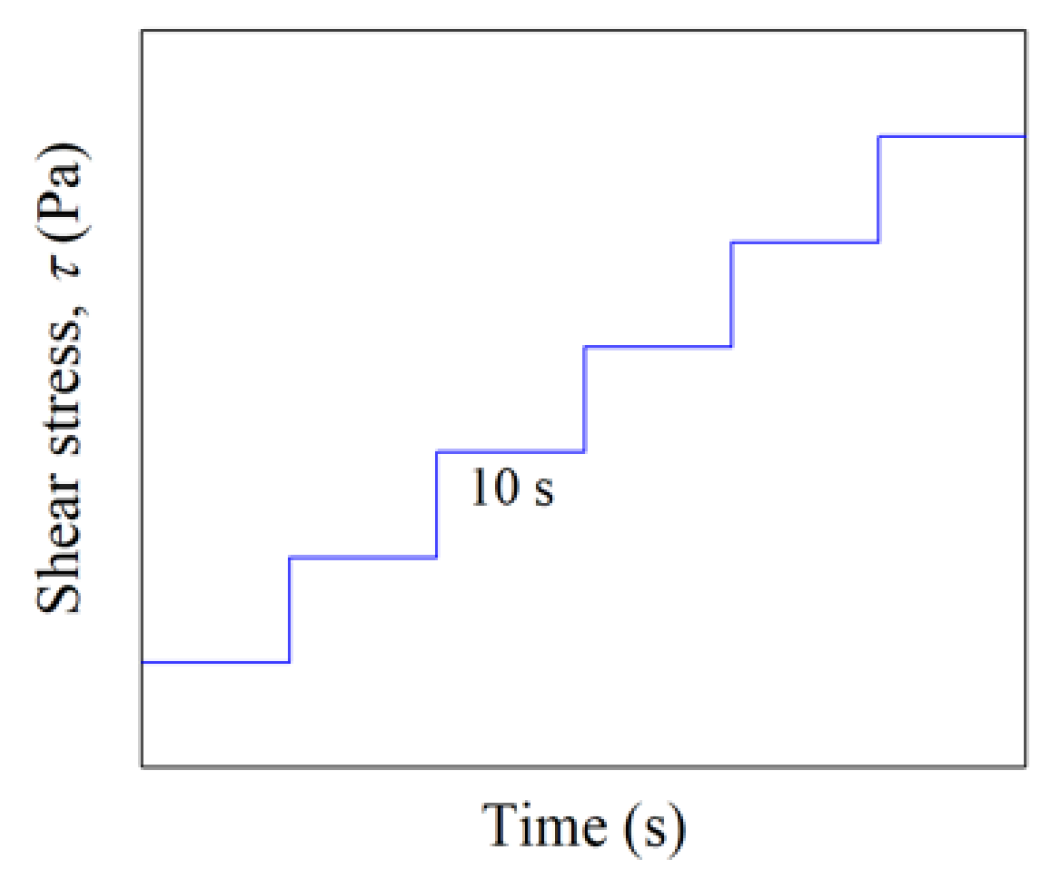
A commercial laponite clay (BYK Additives and Instruments, UK) and bentonite clay (Hongruitai Bentonite Technology Co., Ltd., China) were used in the experiments. The composition of laponite clay is shown in Table 1, and the composition of bentonite clay is listed in Table 2 [18]. The SEM (scanning electron microscope) image of the two clay particles are shown in Figure 1. The clay suspensions were made by mixing the clay powder with deionized water. Samples were homogenized by an overhead stirrer for 60 min at the rotation rate of 600 rpm. After mixing, samples were sealed and set for 24 h. The ionic strength (IS), or salinity, changed by the adding of NaCl powder. A DHR-1 rotational rheometer (TA Instrument, US) was used in the rheological measurement, with a 40 mm diameter cone-plate geometry. Both control-stress and control-shear-rate modes were adopted in the test. The temperature was kept at 25 ℃. A pre-shearing period of 30 s with the shear rate of 1000 s−1 was applied, after which the sample rested for another 30 s before the former test was carried out. During the test of the clay system, an obvious transition behavior was observed [17], the duration of which was about 10 s. Therefore, in the ramp up (or step-up) test, as shown in Figure 2, the shearing time in each step was set to 10 s in order to obtain the data at the equilibrium state. The total time spent for one test to complete was about 12 min, during which the influence caused by water evaporation was negligible. Suspensions prepared at each ionic strength and clay concentration were tested five times (each time loading with new samples), and the mean yield stress was calculated over the yield stress determined.
3. Result and Discussion
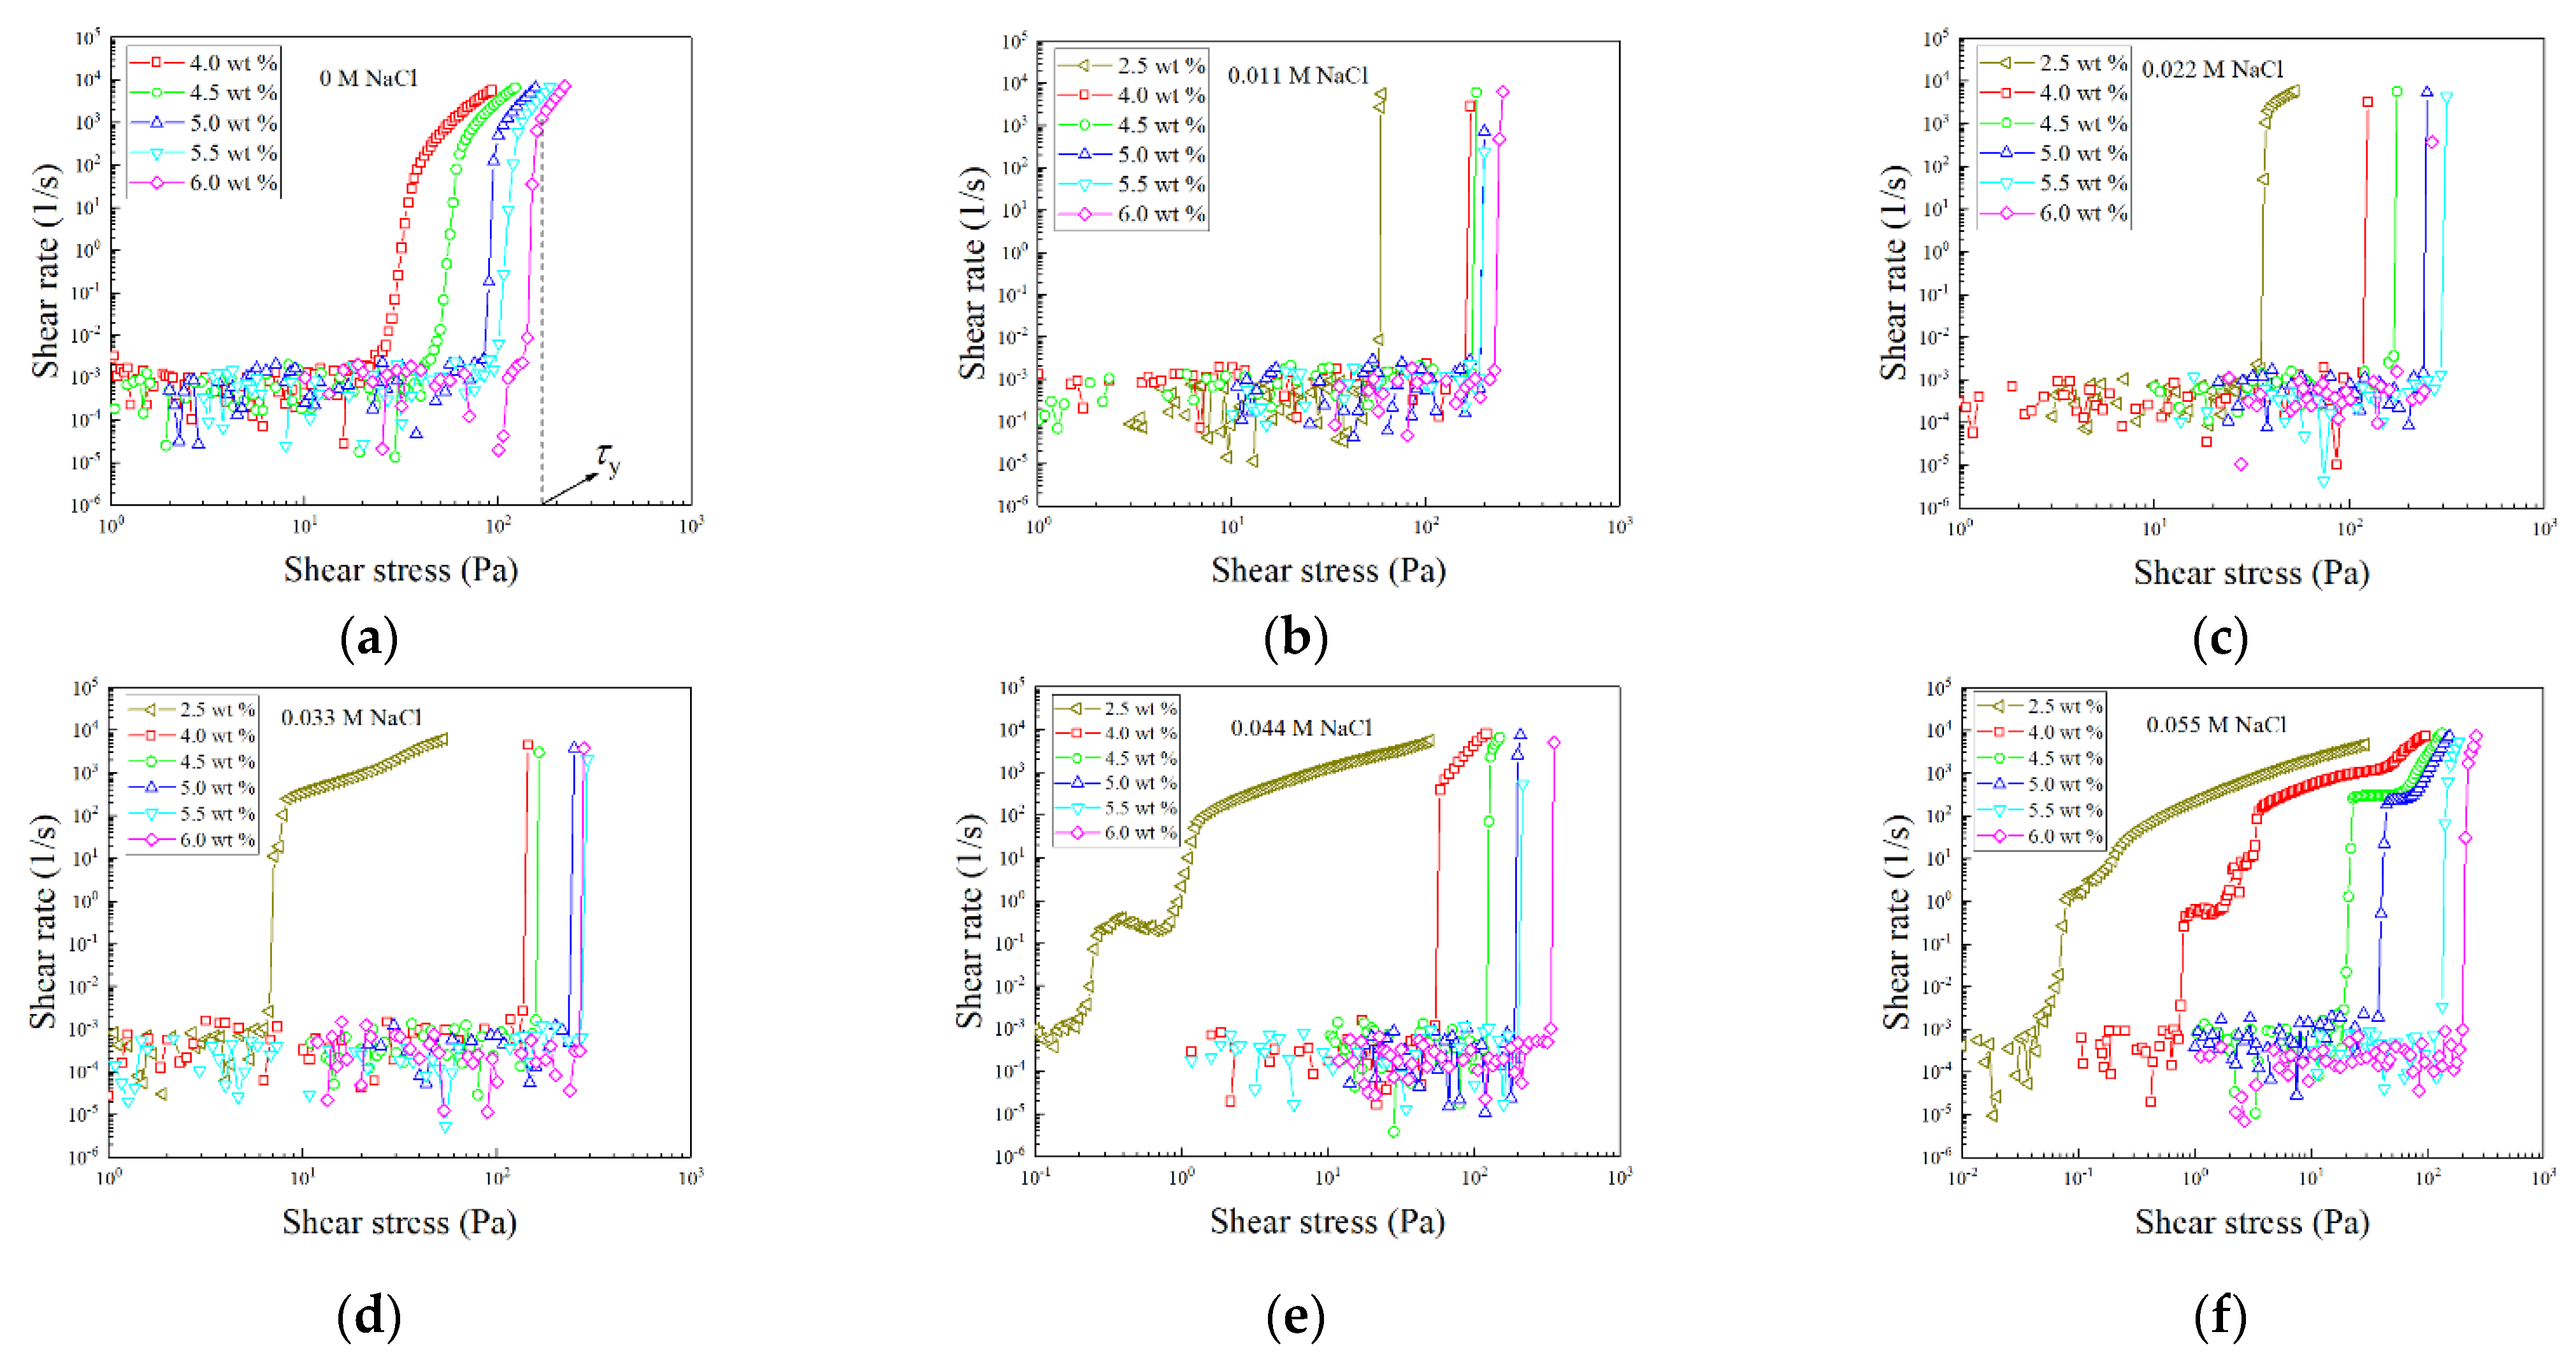
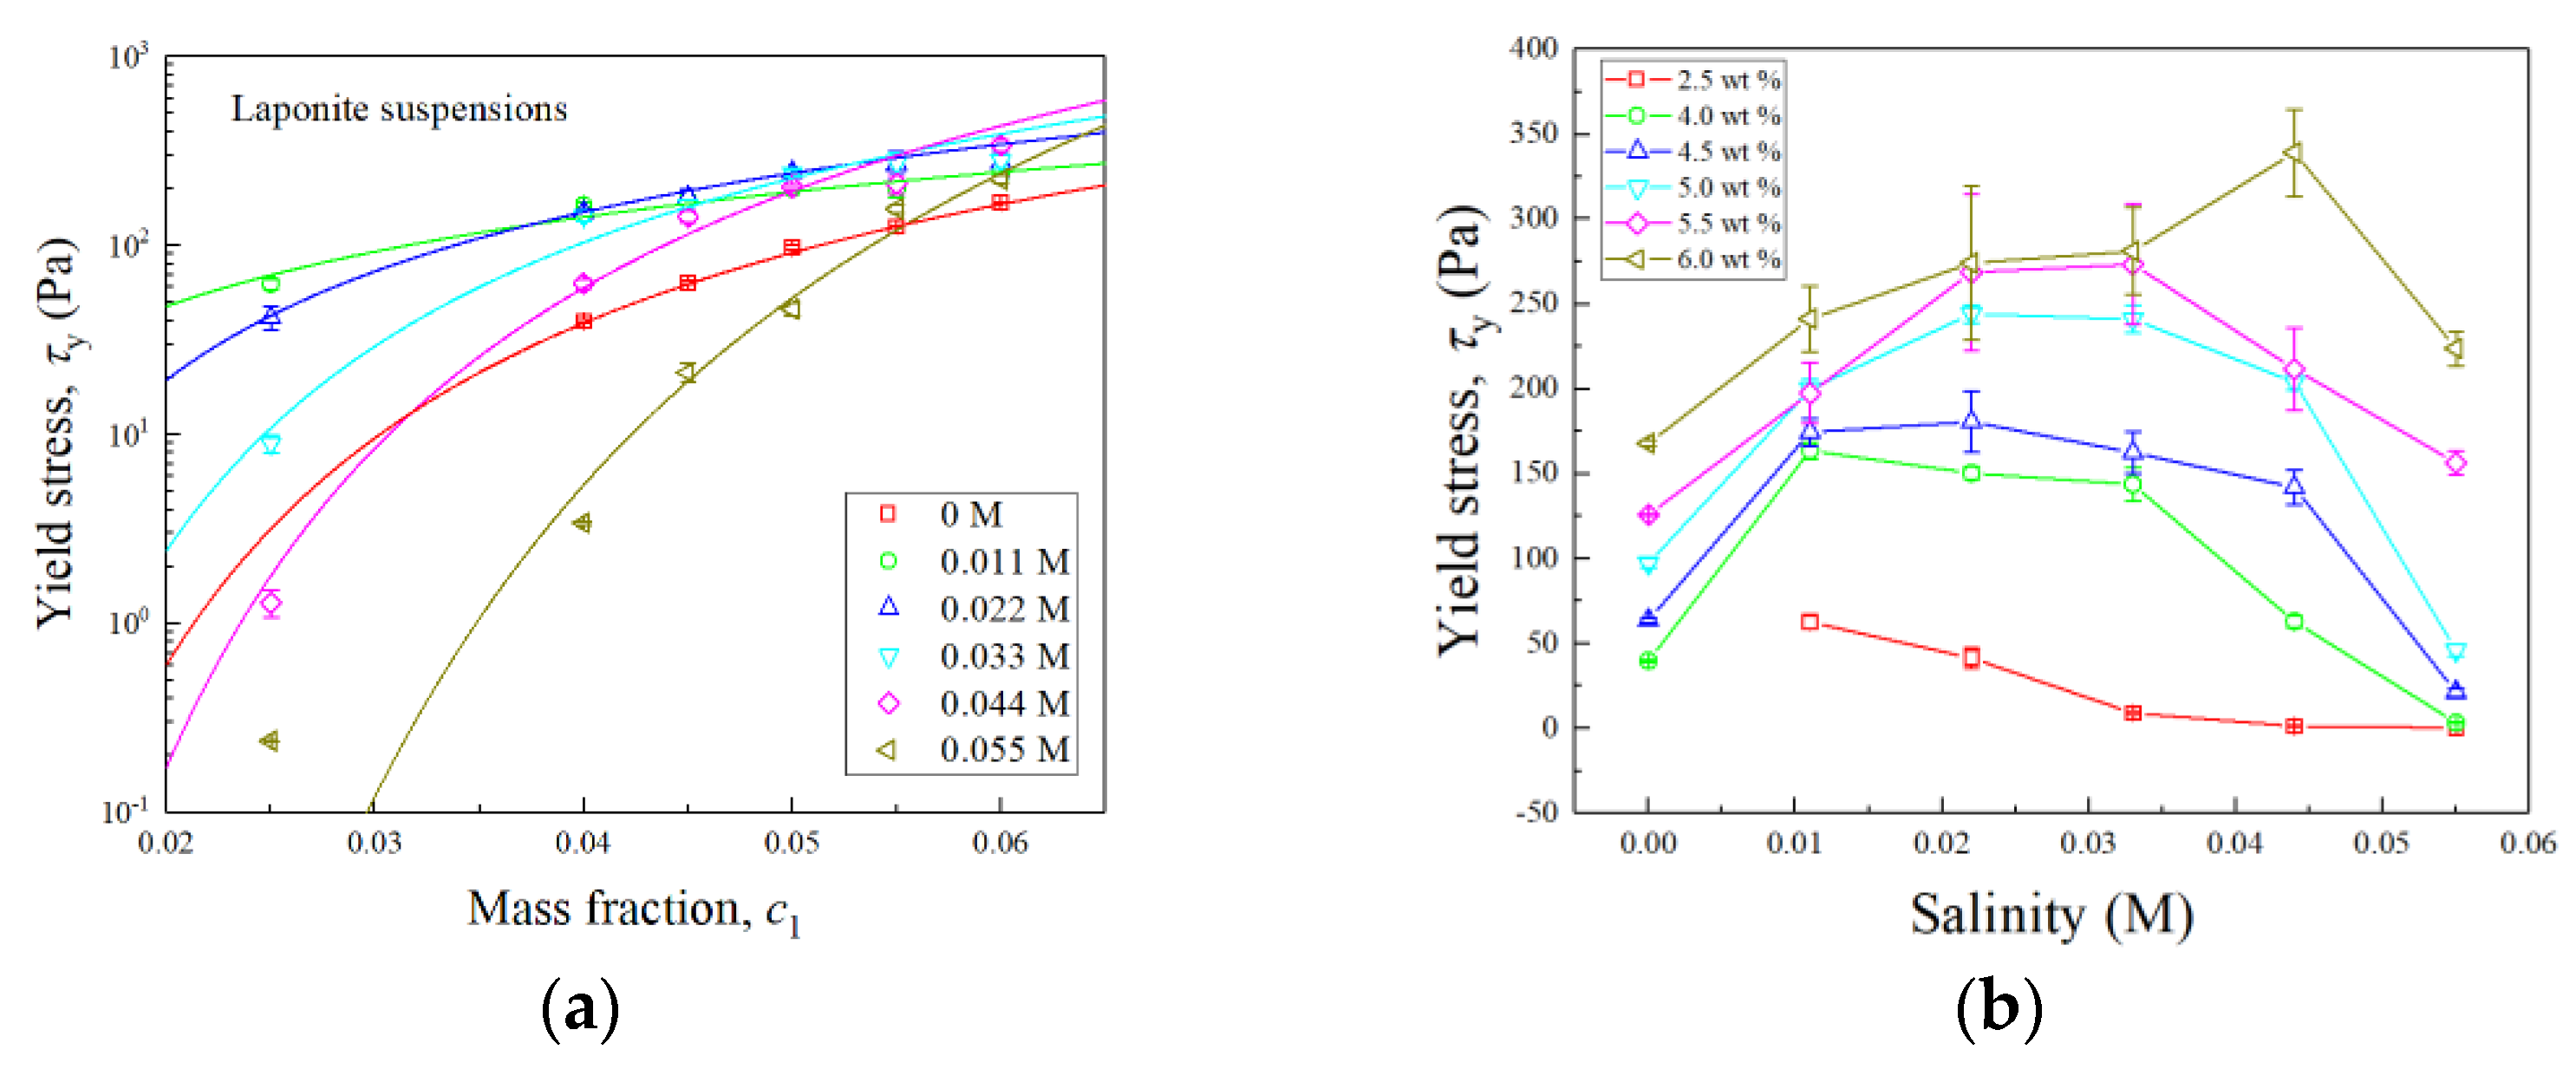
The shear rate curves as a function of the shear stress using the stress-control mode are shown in Figure 3 for laponite suspensions, from which the yield stress, τy, were determined at the first point in the steady shear-rate curve after the shear rate increased significantly (e.g., several orders of magnitude), and the system started to flow, as shown in Figure 3a. The yield stress at different IS and clay concentrations are listed in Table 3 and shown in Figure 4. Obviously, at all salinities (IS), τy increased with clay concentration, which was due to the decreasing of separation between clay platelets, resulting in a higher electrostatic inter-particle force. As shown in Figure 4, the influence of the IS was also investigated. It is well accepted that τy should decreases when IS increased due to the weakening of the electrostatic interaction due to the screening effect by the electrolyte in the system [10,13,19]. However, we observed in Figure 4b that, at a determined clay concentration, when IS increased, τy first increased and then decreased above a critical IS, which was found to increase with increasing clay concentration. We considered the increment of τy with IS at the early stage should be due to the local structure refinement of the gel formed by clay platelets. Since both face-to-face repulsive and face-to-edge attractive inter-particle interactions played roles in the gelation of the system [2], the increment of IS at the early stage may induce a local rearrangement of the structure for the ease of a single form of interaction. With further increases of IS, τy decreased due to the overall descending of the electrostatic potential.
The yield stress of the gel system may be estimated as [20]
and according to the DLVO theory,
where, a is the particle effective radius, D is the particle distance and is the volume fraction of clay; is the van de Waals potential with AH the Hamaker constant; is the electrostatic potential. ε0 = 8.85 × 10⁻¹² C2/(J·m) and εr = 78.54 are the permittivity of space and the dielectric constant of the medium, respectively. ψs is the surface electrostatic potential of clay particles and κ−1 is the Debye screen length, which decreases with increasing ionic strength. Consequently, the yield stress may be estimated as
The above equation estimates the yield stress of the system considering the influence of both clay concentration and ionic strength.
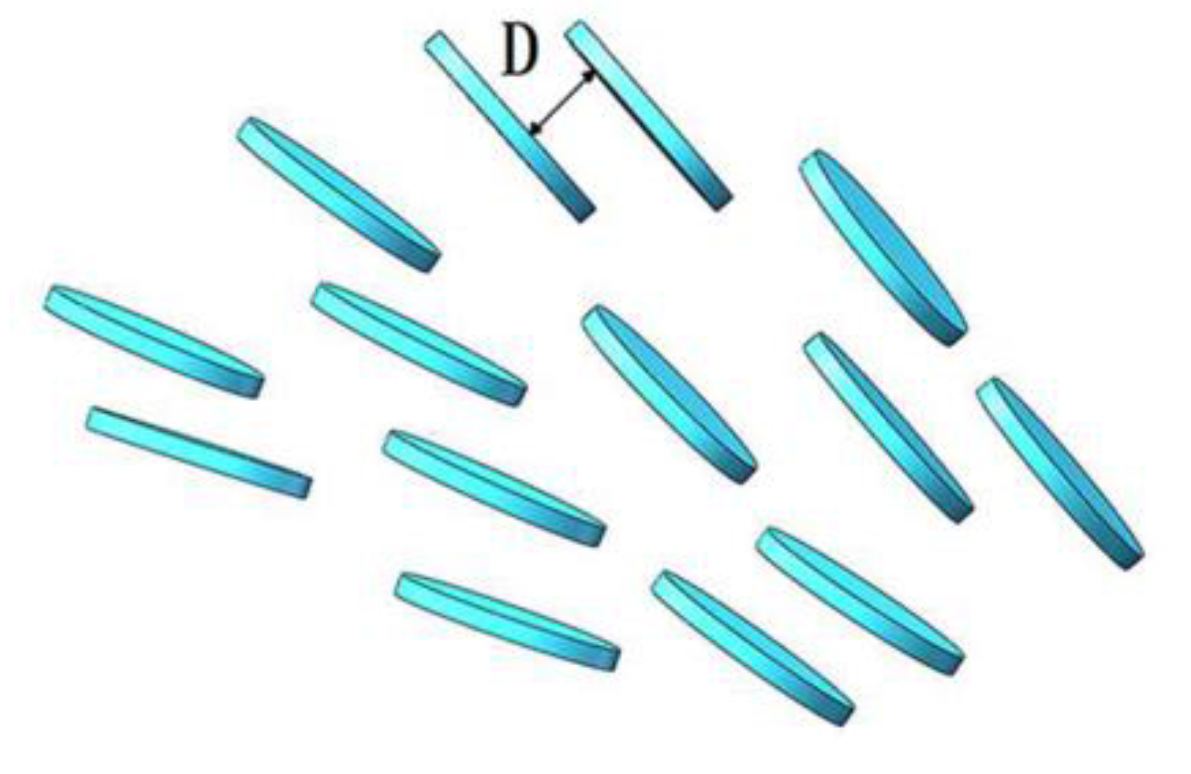
It is assumed that the face-to-face repulsive inter-particle interaction dominates, which results in a face-to-face structure, as shown in Figure 5. Therefore, the volume fraction can be related to the distance between clay platelets, , where δ is the thickness of clay platelets, and α is a correction factor. The term from van de Waals interaction can be neglected [2]. Moreover, . Therefore, Equation (3) can be rewritten as
where and is a stress constant; A is a constant; c is the concentration of clay in the system, and ρ ≈ 2.6 g/cm3 is the density of clay particles. Since a, ψs, κ−1, α and δ are unknown, and B are parameters to be determined through the fitting of the experimental data. As shown by the curve fitting using Equation (4) in Figure 4a, this theory well describes the change of yield stress as functions of clay concentration at different ionic strength for laponite suspensions. The value of and B are listed in Table 4, both of which increased when IS increased. This is reasonable, since the two parameters were both linear with κ, increasing when IS increased (κ−1 decreased when IS increased, as mentioned previously).
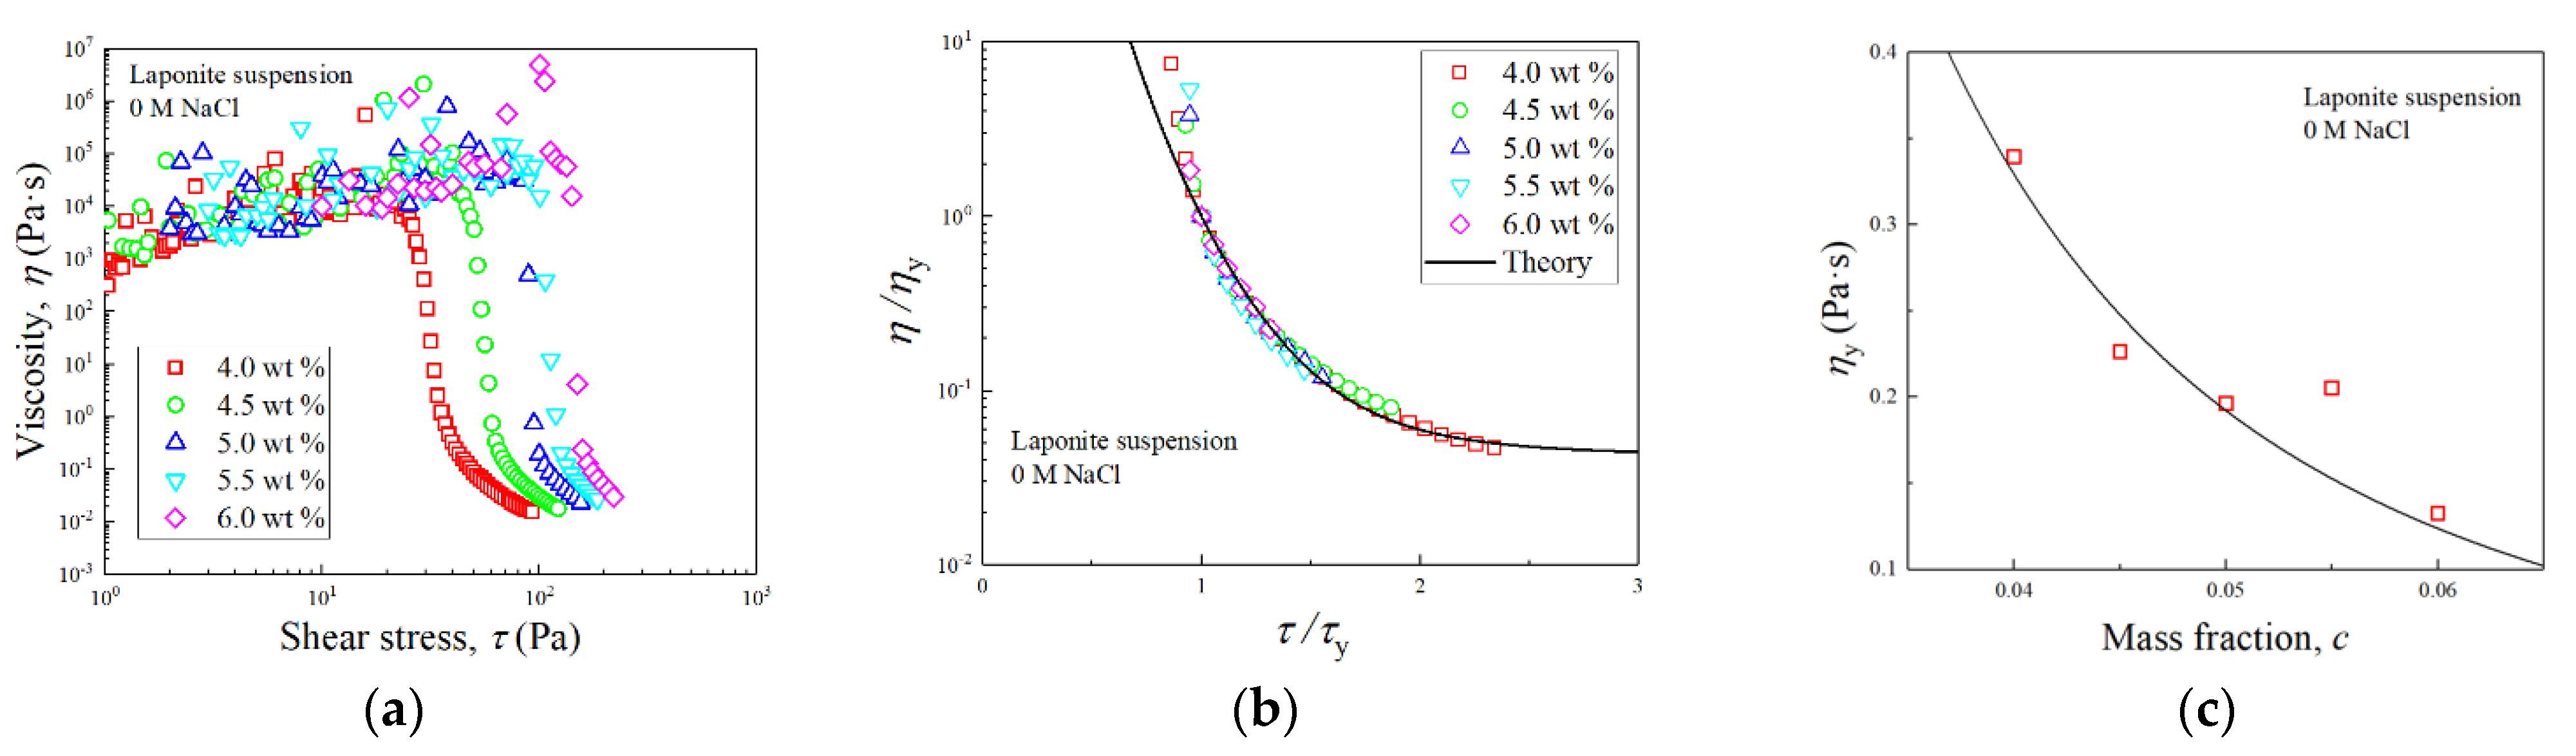
As shown in Figure 6a, a significant shear thinning of viscosity was observed after the yielding of the system, which was due to the deformation and disaggregation of the gel structure formed by clay platelets. The resistant force against the flow was induced by the interparticle interaction between clay platelets, e.g., face-to-face repulsive forces, which previously caused the gelation of the system at the static state. Therefore, it was proposed that . We took the viscosity-stress curves at the natural salinity in Figure 6a for an example, where the stress was normalized by τy,, and the viscosity was also normalized by a characteristic viscosity, ηy, which approached the corresponding viscosity at , determined from the viscosity curves. As shown in Figure 6b, a master curve of the normalized viscosity was achieved. Therefore, the viscosity of the system was . τy and ηy were adopted for the rescaling and are listed in Table 5. In a previous study, Lin et al. [17] successfully re-scaled the viscosity curve of bentonite clay suspensions and laponite suspensions at different clay concentrations into a master curve by solely the τy. Small divergence of the viscosity data from the master curve were observed, which showed that a normalization of the viscosity with ηy was necessary. ηy generally decreased when clay concentration increased for laponite suspensions, as shown in Figure 6c. It can be deduced that the plateau viscosity, η∞ at a high shear stress rate (not shown in Figure 6a due to the up limitation of the shear rate of the rheometer) was proportionate to ηy. Therefore, η∞ also decreased when clay concentration decreased. Lin et al. [2] observed the transition of the structure formed by clay platelets with increasing clay concentration, from partially face-to-edge structure to a face-to-face dominated structure; therefore, we considered that increasing clay concentration resulted in a more oriented structure at a high shear rates due to the face-to-face repulsive interaction, thereby reducing the plateau viscosity.
Obviously, the master curve in Figure 6b was independent of the clay concentration, and was easily fitted by an empirical constitutive model, proposed as
where η0, K and m are constants determined experimentally, as listed in Table 6. It should be noted in Figure 6b that at , the system is at the yielding point, and shear inhomogeneity, as well as slippage at the boundary, are likely to occur [7,17,18]. Therefore, theoretical curves diverge from the experimental data. The master curve of viscosity allowed us to capture the non-Newtonian behavior of laponite suspensions at different concentrations, once the yield stress and characteristic viscosity was known. As mentioned previously, τy can be estimated by Equation (4). And as shown in Figure 6c, the evolution of ηy with the clay concentration for laponite clay studied here may be approached by .
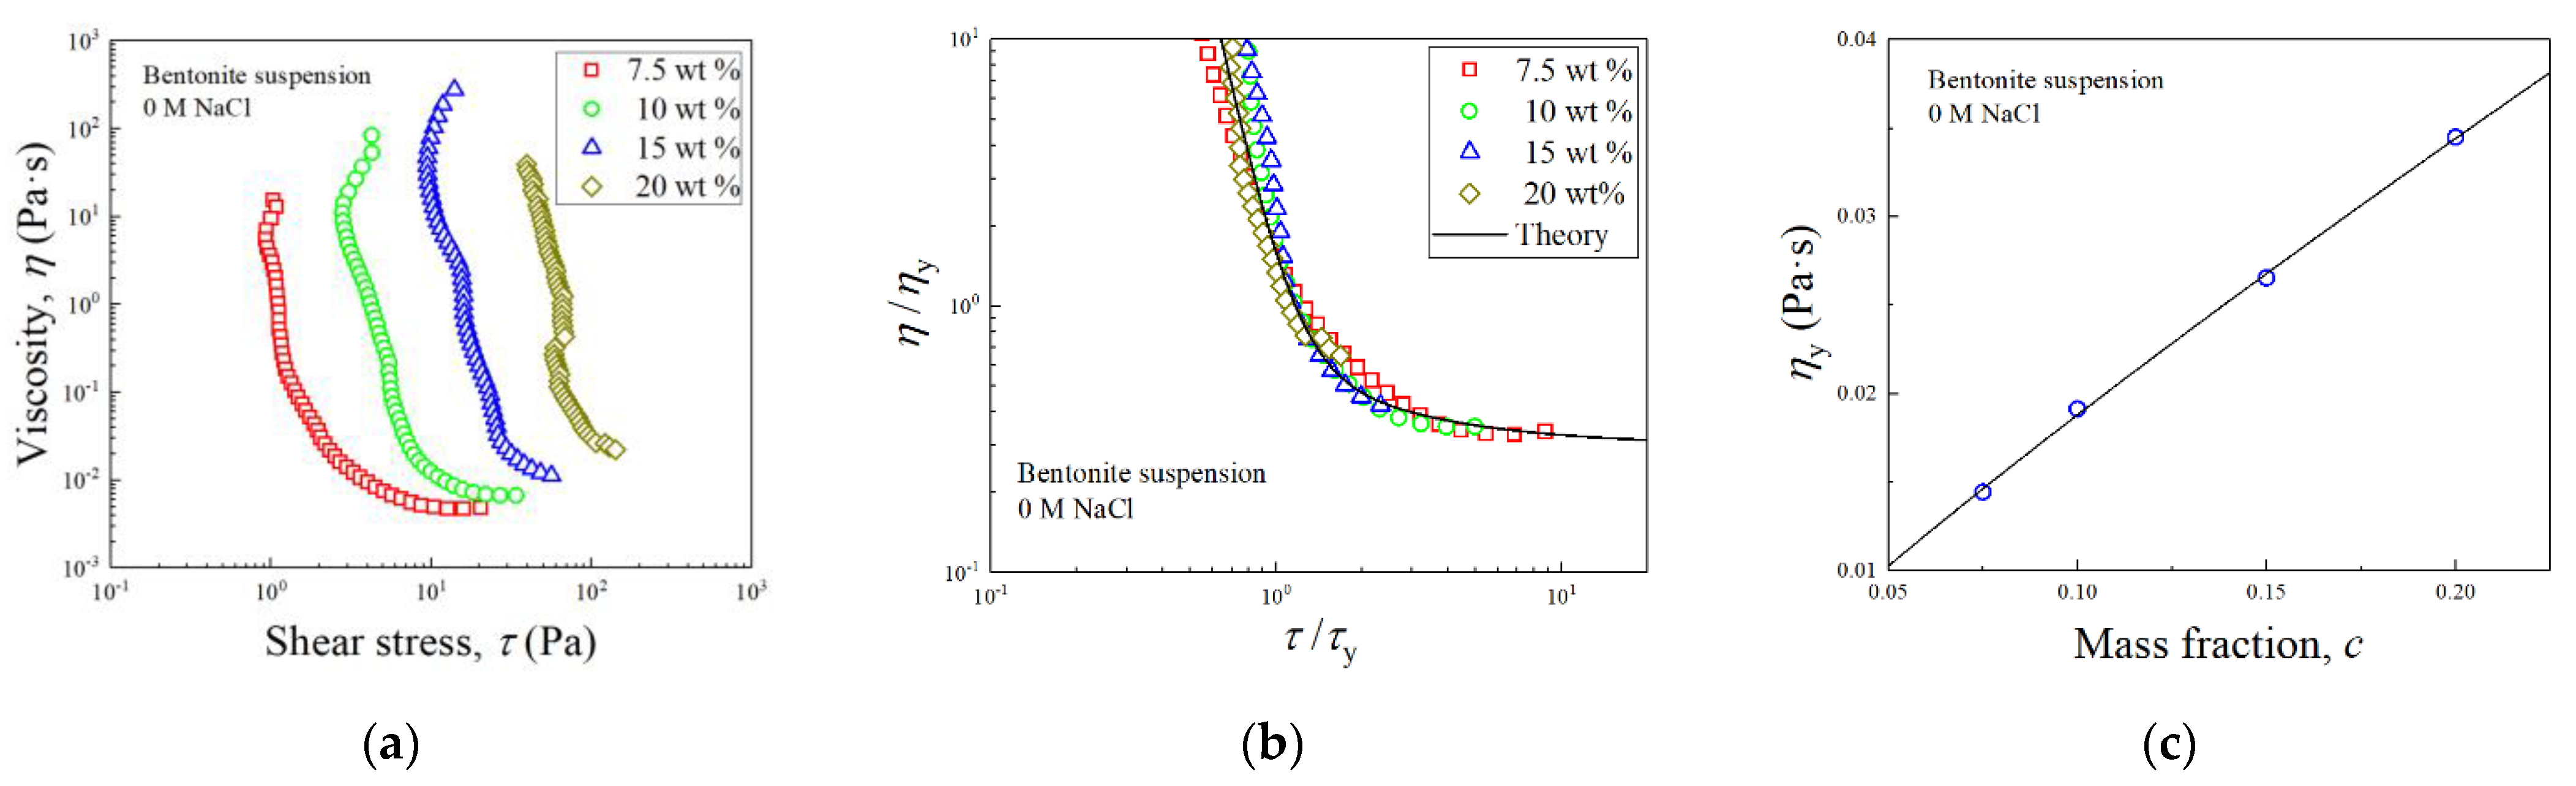
The theory was also applied to bentonite clay suspensions with different clay concentration, as shown in Figure 7. As indicated in Figure 7b, viscosity curves were successfully rescaled into a master curve using τy and ηy, listed in Table 7, and the master curve was also described by Equation (5) using parameters listed in Table 6. It is noted that ηy increased with increasing clay concentration, as shown in Figure 7c, which is different from laponite suspensions. Since the clay concentration for bentonite suspensions investigated was higher, the face-to-face structure dominated due to the packing effect [2], and the transition of the face-to-face structure to the face-to-edge structure, which caused decreasing of ηy with increasing concentration for laponite suspensions, was not obvious, resulting the different trend of ηy. The evolution of ηy with clay concentration for bentonite suspensions was approached by , as shown in Figure 7c.
The model proposed in this study is useful to predict the viscosity of the sediment-water flow. For example, this occurred in a simulation of particle-driven gravity flow considering the particle-concentration gradient [21,22]. It should be noted that the change of τy and ηy with the clay concentration varies, depending on the clay samples used, as well as the level of ionic strength. Equation (4) for τy has been successfully applied to kaolinite and bentonite clays using different sets of and B [2,14,17]. While changing ηy is more complicated and the mechanism is yet to be understood, more clay-water systems and natural sea-sediment should be tested in future to understand the behavior of ηy for complement of the model proposed.
4. Conclusions
The rheological behavior of laponite and bentonite suspensions was investigated at different clay concentrations and salinity levels. We found that the yield stress increased when clay concentration increased due to the decrease of the distance between clay platelets, which induced a larger electrostatic inter-particle force. Meanwhile, the yield stress first increased and then decreased when salinity for laponite suspensions increased, which was proposed to be due to the local refinement of the structure followed by the overall decrement of the electrostatic potential. A master curve of viscosity was obtained by normalizing the stress and viscosity by the yield stress, as well as the corresponding viscosity at the yielding point. Based on the master viscosity curve, the viscosity curves at different clay concentrations and salinity levels was estimated once the yield stress and the characteristic viscosity was known.
Author Contributions
Con-ceptualization, Y.L., H.Q., J.G. and J.C.; methodology, Y.L.; software, H.Q.; validation, J.G. and H.Q.; formal analysis, Y.L.; investigation, H.Q.; resources, Y.L. and J.C.; data curation, H.Q.; writing—original draft preparation, Y.L.; writing—review and editing, Y.L. and H.Q.; visualization, H.Q.; supervision, Y.L. and J.C.; project administration, Y.L., J.C.; funding acquisition, Y.L. and J.C. All authors have read and agreed to the published version of the manuscript.
Funding
This study is supported by the National Natural Science Foundation of China (NNSFC, No. 11702246), the National Natural Science Foundation of China (NNSFC, No. 41976055), and the Fundamental Research Funds for ZheJiang Provincial Colleges & Universities (No.2019XZZX003-07).
Institutional Review Board Statement
Not applicable.
Informed Consent Statement
Not applicable.
Conflicts of Interest
The authors declare no conflict of interest.
References
- Zhang, F.Y.; Zhang, W.Y.; Zhang, X.Y.; Feng, X.L.; Lin, L.; Zhu, K.C.; Chen, K.Y.; Meng, Y.; Feng, X.W. Key Technique and Scheme of Classification and Nomenclature for Deep Sea Sediments. Earth Sci. J. China Univ. Geosci. 2012, 37, 93–104. [Google Scholar]
- Lin, Y.; Phan-Thien, N.; Lee, J.B.P.; Khoo, B.C. Concentration Dependence of Yield Stress and Dynamic Moduli of Kaolinite Suspensions. Langmuir 2015, 31, 4791–4797. [Google Scholar] [CrossRef] [PubMed]
- Paineau, E.; Michot, L.J.; Bihannic, I.; Baravian, C. Aqueous suspensions of natural swelling clay minerals. 2. Rheological characterization. Langmuir 2011, 27, 7806–7819. [Google Scholar] [CrossRef]
- Baird, J.C.; Walz, J.Y. The effects of added nanoparticles on aqueous kaolinite suspensions: II. Rheological effects. J. Colloid Interface Sci. 2007, 306, 411–420. [Google Scholar] [CrossRef] [PubMed]
- Abou, B.; Bonn, D.; Meunier, J. Nonlinear rheology of Laponite suspensions under an external drive. J. Rheol. 2003, 47, 979–988. [Google Scholar] [CrossRef] [Green Version]
- Cocard, S.; Tassin, J.F.; Nicolai, T. Dynamical mechanical properties of gelling colloidal disks. J. Rheol. 2000, 44, 585–594. [Google Scholar] [CrossRef]
- Pignon, F.; Magnin, A.; Piau, J.M. Thixotropic behavior of clay dispersions: Combinations of scattering and rheometric techniques. J. Rheol. 1998, 42, 1349–1373. [Google Scholar] [CrossRef]
- Au, P.I.; Leong, Y.K. Surface chemistry and rheology of laponite dispersions zeta potential, yield stress, ageing, fractal dimension and pyrophosphate. Appl. Clay Sci. 2015, 107, 36–45. [Google Scholar]
- Leong, Y.K.; Du, M.Y.; Au, P.I.; Clode, P.; Liu, J. Microstructure of sodium montmorillonite gels with long aging time scale. Langmuir 2018, 34, 9673–9682. [Google Scholar] [CrossRef]
- Laxton, P.B.; Berg, J.C. Relating clay yield stress to colloidal parameters. J. Colloid Interface Sci. 2006, 296, 749–755. [Google Scholar]
- Teh, E.; Leong, Y.K.; Liu, Y.; Fourie, A.B.; Fahey, M. Differences in the rheology and surface chemistry of kaolin clay slurries: The source of the variations. Chem. Eng. Sci. 2009, 64, 3817–3825. [Google Scholar] [CrossRef]
- Leong, Y.K.; Teo, J.; Teh, E.; Smith, J.; Widjaja, J.; Lee, J.X.; Fourie, A.; Fahey, M.; Chen, R. Controlling attractive interparticle forces via small anionic and cationic additives in kaolin clay slurries. Chem. Eng. Res. Des. 2012, 90, 658–666. [Google Scholar] [CrossRef]
- Sakairi, N.; Kobayashi, M.; Adachi, Y. Effects of salt concentration on the yield stress of sodium montmorillonite suspension. J. Colloid Interface Sci. 2005, 283, 245–250. [Google Scholar] [CrossRef] [PubMed]
- Lin, Y.; Cheah, L.K.J.; Phan-Thien, N.; Khoo, B.C. Effect of temperature on rheological behavior of kaolinite and bentonite suspensions. Colloids Surf. A Physicochem. Eng. Asp. 2016, 506, 1–5. [Google Scholar] [CrossRef]
- Michot, L.J.; Baravian, C.; Bihannic, I.; Maddi, S.; Moyne, C.; Duval, J.F.; Levitz, P.; Davidson, P. Sol-Gel and Isotropic/Nematic Transitions in Aqueous Suspensions of Natural Nontronite Clay. Influence of Particle Anisotropy. 2. Gel Structure and Mechanical Properties. Langmuir 2009, 25, 127–139. [Google Scholar] [CrossRef]
- Philippe, A.M.; Baravian, C.; Imperor-Clerc, M.; De, S.J.; Paineau, E.; Bihannic, I.; Davidson, P.; Meneau, F.; Levitz, P.; Michot, L.J. Rheo-SAXS investigation of shear-thinning behaviour of very anisometric repulsive disc-like clay suspensions. J. Phys. Condens. Matter 2011, 23, 194112. [Google Scholar] [CrossRef] [PubMed]
- Lin, Y.; Zhu, H.; Wang, W.; Chen, J.W.; Phan-Thien, N.; Pan, D.Y. Rheological behavior for laponite and bentonite suspensions in shear flow. AIP Adv. 2019, 9, 125–233. [Google Scholar] [CrossRef] [Green Version]
- Lin, Y.; Wang, W.; Zhu, H.; Chen, J.W.; Phan-Thien, N.; Pan, D.Y. Size effect of the parallel-plate geometry on the rheological behavior of bentonite suspensions. J. Rheol. 2020, 64, 111–117. [Google Scholar] [CrossRef]
- Montoro, M.A.; Francisca, F.M. Effect of ion type and concentration on rheological properties of natural sodium bentonite dispersions at low shear rates. Appl. Clay Sci. 2019, 178, 105132. [Google Scholar] [CrossRef]
- Larson, R.G. The Structure and Rheology of Complex Fluids; Oxford University Press: New York, NY, USA, 1999. [Google Scholar]
- He, Z.G.; Zhao, L.; Hu, P.; Yu, C.H.; Lin, Y.T. Investigations of dynamic behaviors of lock-exchange turbidity currents down a slope based on direct numerical simulation. Adv. Water Resour. 2018, 119, 164–177. [Google Scholar] [CrossRef]
- Bertevas, E.; Tran-Duc, T.; Le-Cao, K.; Khoo, B.C.; Phan-Thien, N. A smoothed particle hydrodynamics (SPH) formulation of a two-phase mixture model and its application to turbulent sediment transport. Phys. Fluids 2019, 31, 103303. [Google Scholar] [CrossRef]
Figure 1.
The SEM (scanning electron microscope) image of (a) laponite and (b) bentonite clay used in the experiment.
Figure 1.
The SEM (scanning electron microscope) image of (a) laponite and (b) bentonite clay used in the experiment.

Figure 2.
The ramp-up (step-up) shear test applied in the rheological experiment.

Figure 3.
Shear rate versus shear stress curves at different clay concentrations at the ionic strength of (a) 0 M, (b) 0.011 M, (c) 0.022M, (d) 0.033M, (e) 0.044M and (f) 0.055M, respectively, for laponite suspensions.
Figure 3.
Shear rate versus shear stress curves at different clay concentrations at the ionic strength of (a) 0 M, (b) 0.011 M, (c) 0.022M, (d) 0.033M, (e) 0.044M and (f) 0.055M, respectively, for laponite suspensions.

Figure 4.
(a) Change of the yield stress as a function of clay concentration at different ionic strength for laponite suspensions, with solid curves representing the fitting of the data using Equation (4); (b) change of the yield stress as a function of ionic strength at different clay concentrations.

Figure 5.
Diagram of the face-to-face structure by the face-to-face repulsive electrostatic interaction.
Figure 5.
Diagram of the face-to-face structure by the face-to-face repulsive electrostatic interaction.

Figure 6.
(a) Viscosity as a function of shear stress for laponite suspensions, (b) normalized viscosity as a function of normalized stress and (c) change of the characteristic viscosity with mass frication of clay at the natural salinity with the solid line showing an empirical power-law curve fitting.

Figure 7.
(a) Viscosity as a function of shear stress using a control-shear-rate mode for bentonite suspensions, (b) normalized viscosity as a function of normalized stress and (c) change of the characteristic viscosity with mass frication of clay at the natural salinity with the solid line showing an empirical power-law curve fitting.


Table 1.
Composition of the laponite clay used in the experiment.
| Component | SiO2 (%) | MgO (%) | Li2 O(%) | Na2O (%) | Loss on Ignition (%) | Free Moisture | Sieve Analysis |
|---|---|---|---|---|---|---|---|
| Value | 59.5 | 27.5 | 0.8 | 2.8 | 8.2 | 10% Max | 2% Max > 250 μm |
Table 2.
Composition of the bentonite clay used in the experiment.
| Component | SiO2 (%) | Al2O3 (%) | Fe2O3 (%) | CaO (%) | MgO (%) | K2O (%) | Na2O (%) | Loss on Ignition (%) |
|---|---|---|---|---|---|---|---|---|
| Value | 60.77 | 17.11 | 2.26 | 0.15 | 0.78 | 3.85 | 0.33 | 5.85 |
Table 3.
The average yield stress (Pa) determined at different ionic strength and clay concentration for laponite suspensions.
Table 3.
The average yield stress (Pa) determined at different ionic strength and clay concentration for laponite suspensions.
| Clay Concentration | 2.5 wt% | 4.0 wt% | 4.5 wt% | 5.0 wt% | 5.5 wt% | 6.0 wt% | |
|---|---|---|---|---|---|---|---|
| Ionic Strength | |||||||
| 0 M | - | 39.74 | 63.72 | 97.16 | 125.87 | 168.04 | |
| 0.011 M | 62.55 | 163.63 | 174.53 | 199.92 | 197.52 | 241.31 | |
| 0.022 M | 41.40 | 150.26 | 180.56 | 244.24 | 268.70 | 274.21 | |
| 0.033 M | 8.95 | 143.84 | 162.52 | 241.15 | 273.44 | 281.24 | |
| 0.044 M | 1.29 | 62.90 | 142.05 | 204.00 | 211.78 | 339.22 | |
| 0.055 M | 0.24 | 3.40 | 21.29 | 46.03 | 156.35 | 223.84 | |
Table 4.
Parameters adopt for the fitting of experimental data in Figure 4a using Equation (4) for laponite suspensions.
Table 4.
Parameters adopt for the fitting of experimental data in Figure 4a using Equation (4) for laponite suspensions.
| NaCl Concentration | 0.011 M | 0.022 M | 0.033 M | 0.044 M | 0.055 M |
|---|---|---|---|---|---|
| B | 7.03 | 26.96 | 55.46 | 88.04 | 173.25 |
| Aτ0 | 87.83 | 741.71 | 3617.37 | 16,338.03 | 302,752.7 |
Table 5.
The yield stress and characteristic viscosity adopt for re-scaling of the viscosity curves for laponite suspensions.
Table 5.
The yield stress and characteristic viscosity adopt for re-scaling of the viscosity curves for laponite suspensions.
| Clay Concentration | 4.0 wt% | 4.5 wt% | 5.0 wt% | 5.5 wt% | 6.0 wt% |
|---|---|---|---|---|---|
| τy (Pa) | 39.74 | 63.72 | 97.16 | 125.87 | 168.04 |
| ηy (Pa·s) | 0.3395 | 0.2265 | 0.1965 | 0.2054 | 0.1324 |
Table 6.
Parameters adopt for the fitting of master curves using Equation (5) for laponite and bentonite suspensions.
Table 6.
Parameters adopt for the fitting of master curves using Equation (5) for laponite and bentonite suspensions.
| Parameter | η0 | K | m | η∞ |
|---|---|---|---|---|
| Laponite | 0.01 | 0.95 | −6 | 0.04 |
| Bentonite | 0.284 | 1 | −5 | 0.3 |
Table 7.
The yield stress and characteristic viscosity adopt for re-scaling of the viscosity curves for bentonite suspensions.
Table 7.
The yield stress and characteristic viscosity adopt for re-scaling of the viscosity curves for bentonite suspensions.
| Clay Concentration | 7.5 wt% | 10 wt% | 15 wt% | 20 wt% |
|---|---|---|---|---|
| τy (Pa) | 2.198 | 5.81 | 25.72 | 84.38 |
| ηy (Pa·s) | 0.0145 | 0.0192 | 0.0266 | 0.0345 |
Publisher’s Note: MDPI stays neutral with regard to jurisdictional claims in published maps and institutional affiliations. |
© 2021 by the authors. Licensee MDPI, Basel, Switzerland. This article is an open access article distributed under the terms and conditions of the Creative Commons Attribution (CC BY) license (http://creativecommons.org/licenses/by/4.0/).
Share and Cite
MDPI and ACS Style
Lin, Y.; Qin, H.; Guo, J.; Chen, J. Study on the Rheological Behavior of a Model Clay Sediment. J. Mar. Sci. Eng. 2021, 9, 81. https://0-doi-org.brum.beds.ac.uk/10.3390/jmse9010081
AMA Style
Lin Y, Qin H, Guo J, Chen J. Study on the Rheological Behavior of a Model Clay Sediment. Journal of Marine Science and Engineering. 2021; 9(1):81. https://0-doi-org.brum.beds.ac.uk/10.3390/jmse9010081
Chicago/Turabian StyleLin, Yuan, Huaitao Qin, Jin Guo, and Jiawang Chen. 2021. "Study on the Rheological Behavior of a Model Clay Sediment" Journal of Marine Science and Engineering 9, no. 1: 81. https://0-doi-org.brum.beds.ac.uk/10.3390/jmse9010081
Note that from the first issue of 2016, this journal uses article numbers instead of page numbers. See further details here.