Visual Appearance of Oil on the Sea


Spill Science, Edmonton, AB T6W 1J6, Canada
J. Mar. Sci. Eng. 2021, 9(1), 97; https://0-doi-org.brum.beds.ac.uk/10.3390/jmse9010097
Submission received: 3 December 2020
/
Revised: 29 December 2020
/
Accepted: 14 January 2021
/
Published: 18 January 2021
(This article belongs to the Special Issue Marine Oil Spills 2020)
Abstract
:The visual appearance of oil spills at sea is often used as an indicator of spilled oil properties, state and slick thickness. These appearances and the oil properties that are associated with them are reviewed in this paper. The appearance of oil spills is an estimator of thickness of thin oil slicks, thinner than a rainbow sheen (<3 µm). Rainbow sheens have a strong physical explanation. Thicker oil slicks (e.g., >3 µm) are not correlated with a given oil appearance. At one time, the appearance of surface discharges from ships was thought to be correlated with discharge rate and vessel speed; however, this approach is now known to be incorrect. Oil on the sea can sometimes form water-in-oil emulsions, dependent on the properties of the oil, and these are often reddish in color. These can be detected visually, providing useful information on the state of the oil. Oil-in-water emulsions can be seen as a coffee-colored cloud below the water surface. Other information gleaned from the oil appearance includes coverage and distribution on the surface.
1. Introduction
When an oil spill occurs, there is a need for extensive information including the location of the oil, its distribution, its trajectory and its thickness [1,2,3]. Thickness is of particular interest because many countermeasures are dependent on oil being a minimum thickness in order to be effective. This is true for in-situ burning and chemical oil spill dispersion, and, to a certain degree, for oil removal by skimmers.
Observations in the visible spectrum, be they by human eyesight or through the use of cameras or spectrometers, have been used over the past decades to gain information about spilled oil [1,3]. The suggested uses of such observations have been used to estimate the state of the oil, the position and distribution, its condition and thickness. The primary tool for visual observation of oil is to use its color or appearance. Most crude and fuel oils are black; however, when very thin (<3 µm), oil has other appearances based on its interaction with light. These light interactions can change the color or appearance of the oil. Efforts have been made to correlate these colors and appearance with the thickness of oil. This correlation of color and thickness will be reviewed in detail below. Further, it is noted that there are variances to the appearance of oil caused by factors such as viewing angle, wind effects, solar illumination and water conditions.
Other uses of visual observations are suggested. These include observation of the formation of water-in-oil emulsions [4], indication of oil-in-water emulsions [5], measurement of subsea discharge rates [2] and the simple measurement of the oil geometry on the sea [6]. These observation uses will be reviewed in this paper.
In the past, visual observations were standardized in various codes to provide users with a standard way of interpreting appearances of oil on the sea [1]. These did not enter the broad scientific literature; rather, they became industry and government practices. This paper will examine the appearance of the oil on the sea and provide insight into those appearances that provide correct information about the state of the oil.
The appearance of oil on the sea is subject to several variances [1]. The most important variable is that of oil type. Crude oils are typically brown to black when on the sea in thicker slicks (>3 µm) [1]. Fuel oils are black. The native oil color can have an influence on the final appearance. Secondly, the viewing angle has an influence on appearance when viewing thin slicks [1]. In daylight, with the broad illumination that occurs, the viewing angle is not as important [1]. Atmospheric conditions have an effect on appearance [1]. For example, slick observations can be clearer when there is cloud cover. Atmospheric haze can affect the clarity of observations. Finally, sea conditions can have an influence [1]. Because oil slicks often cover vast areas, the effect of sea conditions on observations is minimized.
2. Thickness
2.1. Basic Considerations
The knowledge of slick thickness has many uses in the oil spill trade, which include determining the size of a leak and optimizing the effectiveness of oil spill countermeasures [1]. Countermeasures such as chemical dispersion and in-situ burning are highly dependent on slick thickness.
In the past, it was thought that there was thickness data in the color of oil slicks [1]. Over the years, experiments were conducted to show that there was only a relationship between appearance and thin slicks, that is, slicks less than 3 µm in thickness [1]. The start of this work was in 1930 [7]. Some recent work has been carried out; however, all of it has been carried out in close proximity to the slicks and not from airborne platforms.
The appearance and color of slicks as related to slick thickness, are affected by several factors in addition to thickness [1]. Some of these are noted in Section 1 above. In addition, there is the question of slick heterogeneity [1,8]. Oils may not form a consistent flat slick over large extents on the water. Some experimental work has shown that some slicks form a “fried egg” type of profile. Sometimes slicks do not cover the entire area of consideration. On other occasions, interfacial tension may herd spilled oil into multiple small slicks, instead of forming one consistently thick slick. In the absence of accurate slick thickness methods, visual judgement on slicks may be incorrect [9,10,11].
In summary, the relationship of oil thickness to appearance is subject to a number of variations [1,2]. The major question still needs to be answered, that is, is there a fundamental relationship between oil thickness and appearance? Furthermore, if there is, what ranges of oil thickness does it apply to and under what conditions?
2.2. Fundamental Slick Thickness–Color Relationships
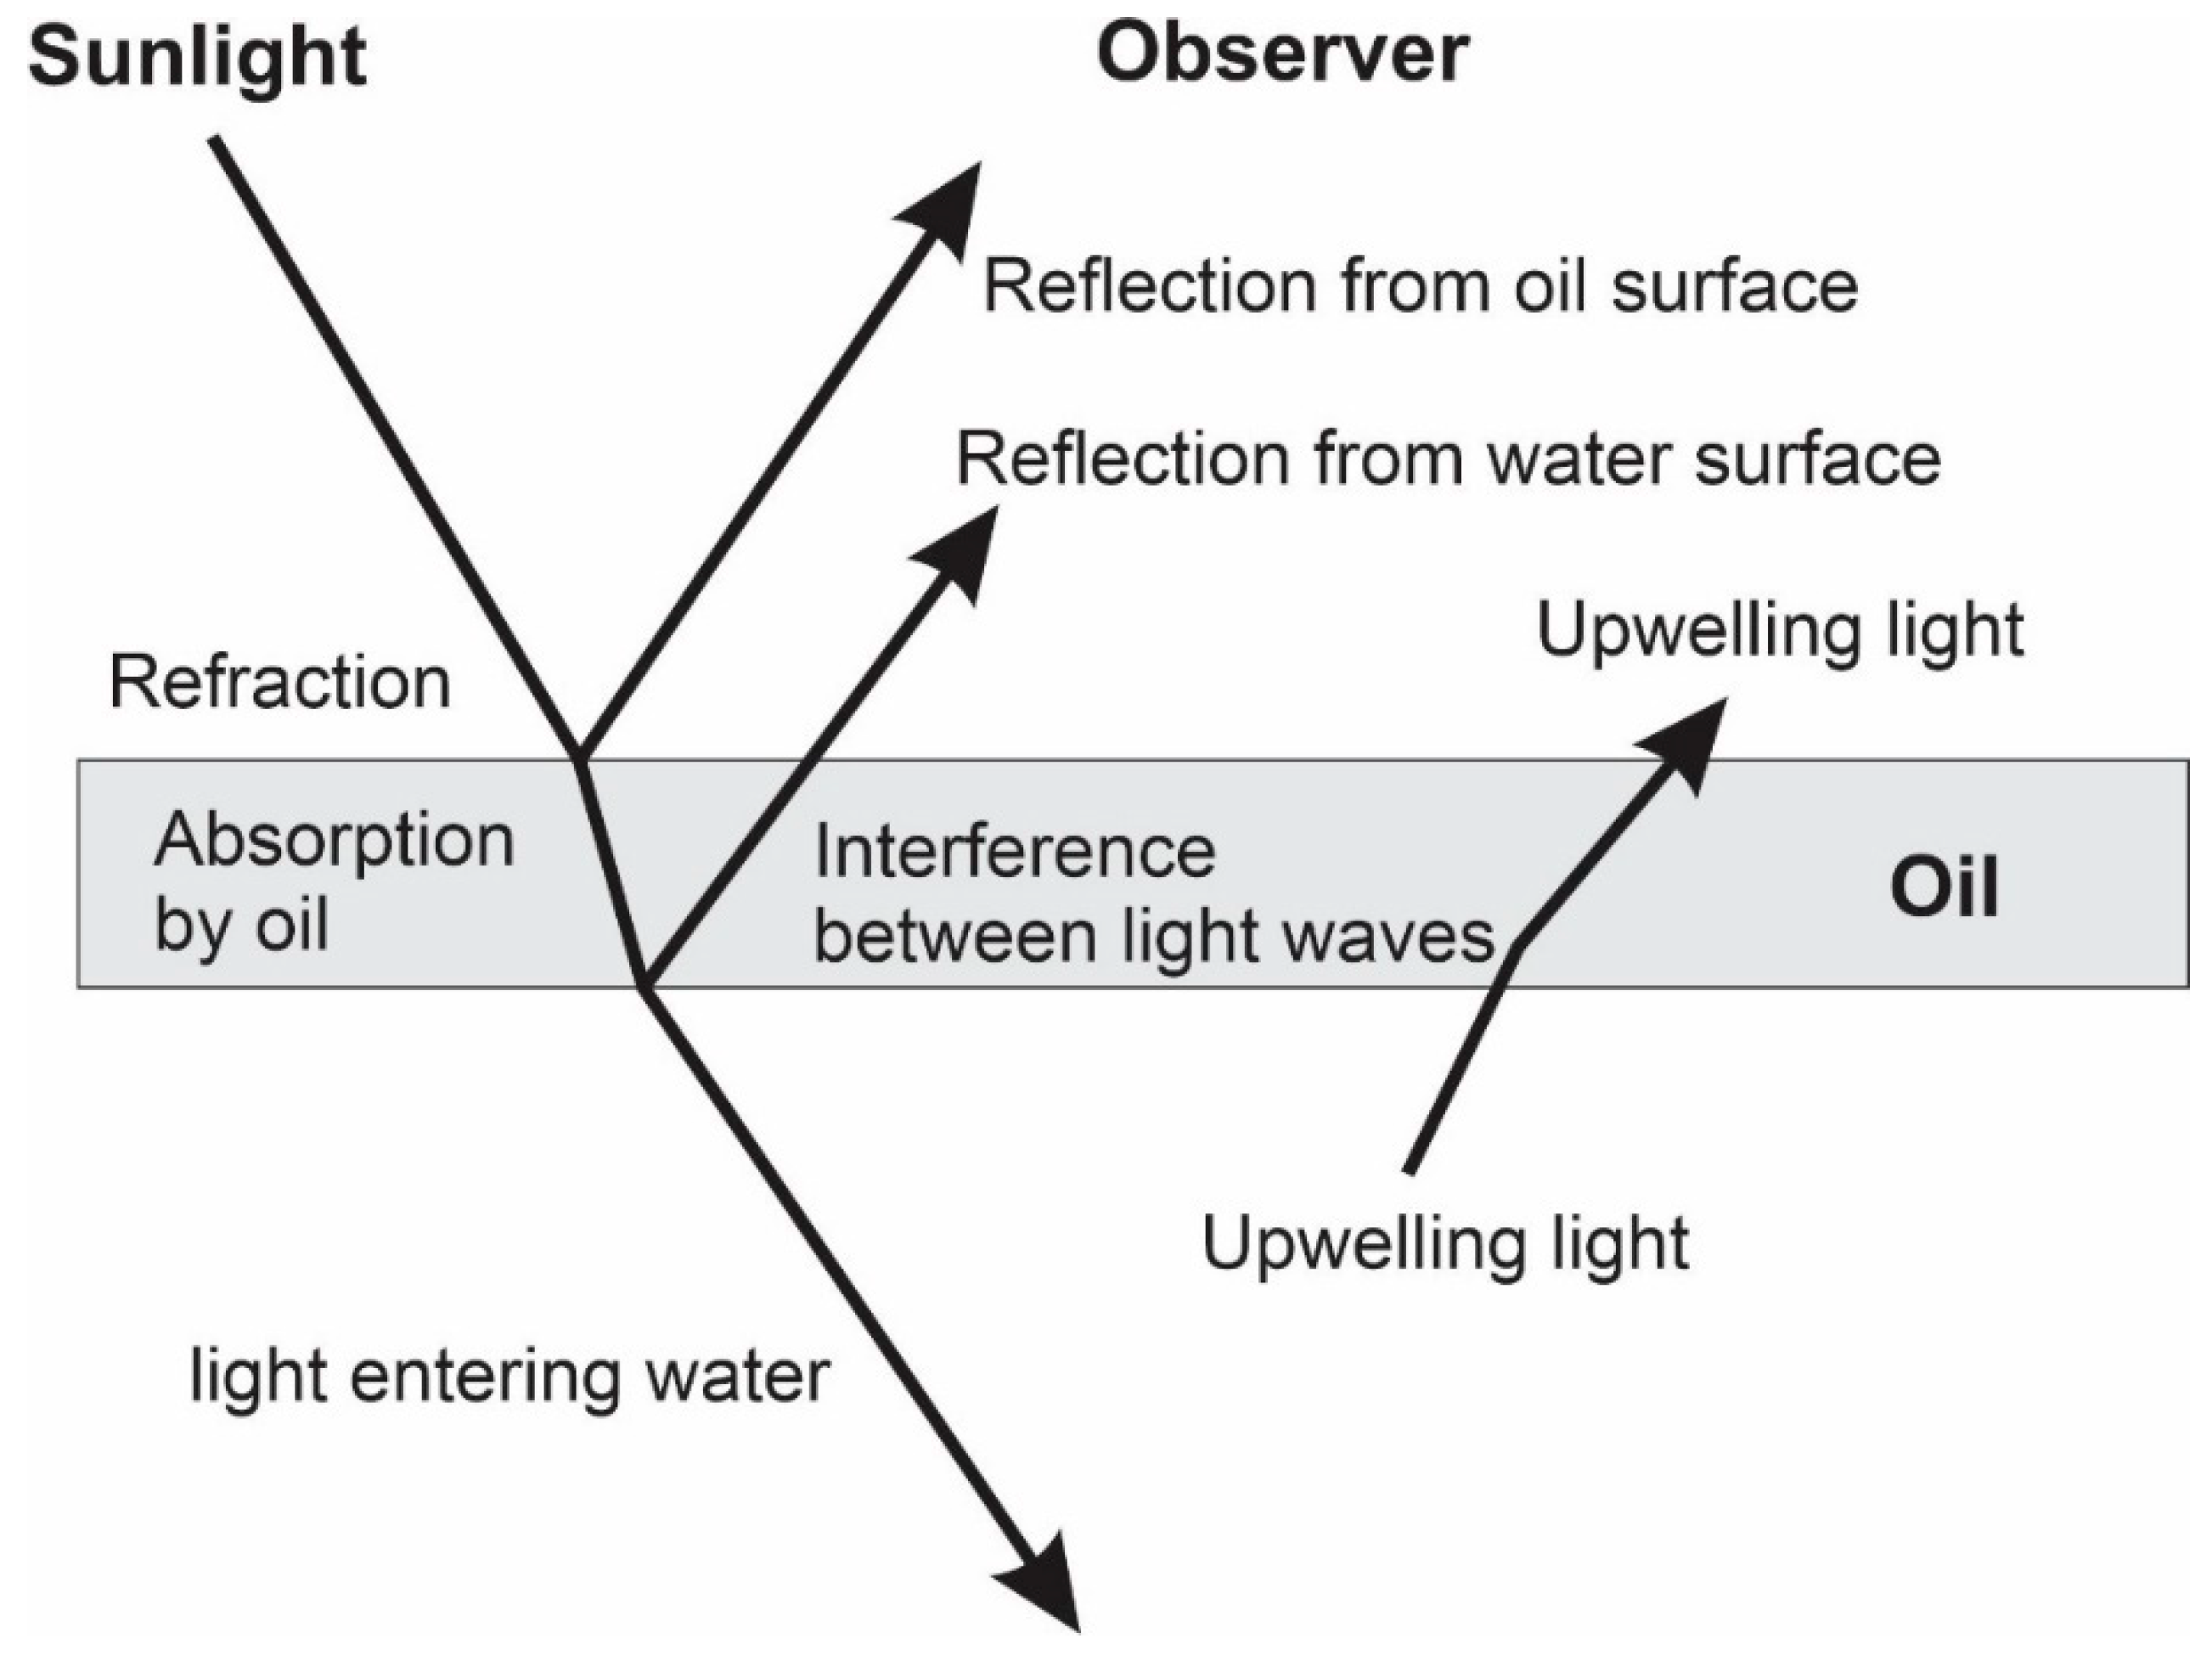
The appearance of an oil slick on water is dependent on several processes including reflection from the oil–air interface, the oil–water interface and various processes in the oil layer itself [10,11]. Some of these processes are illustrated in Figure 1. Ambient sunlight can enter the oil and will be refracted by the oil as a result of the diffraction index of oil (typically about 1.5). Light then can be reflected back through the oil from the oil–water interface and back to the surface of the oil. For thin slicks, the reflectivity is high because oil absorption is low as a result of the low attenuation of the light by the thin slick. The light absorption by the oil becomes more significant as the oil becomes thicker, that is, above 3 µm [11]. Oils have varying absorbances of light, as will be shown later. An important process is the interference of light waves between that entering the oil and that being reflected from the oil/water interface. For the purposes of this paper, thin slicks are defined as those below 3 µm and thick slicks as those above 3 µm.
The processes which influence the amount and nature of the light viewed by the observer are described below. The major influence on light returned to the observer is that of reflection. The layer of oil acts as a mirror and reflects light at the same angle as it was transmitted [12]. As some thin slicks are somewhat transparent to light, part of the light will be refracted into the oil and then again into the water column [13]. While light passes through the oil, some of the light is absorbed.
The observer views the oil somewhat differently if the oil is very thin (<1 µm) or if very thick (>10 µm). At various thicknesses, different physical phenomena predominate. At less than 1 µm oil thickness, the light returned to the observer from sunlight is composed of reflection from the oil surface, reflection from the water surface and some upwelling light. This multiple reflection makes oil appears silvery.
As the oil thickens past about 1 µm, the absorption of the oil begins to play a significant role in the appearance of the oil [9,11]. The absorption by light is given as [12]:
where: Io is the incident radiation, I is the radiation at a specified depth, a is the absorption coefficient, and x is the depth of the absorber. Otremba [14] measured the attenuation of two oils, Petrobaltic, a medium oil, and Romashkino, a darker oil. These absorption coefficients vary with wavelength, and the average for Petrobaltic was 5005 m−1, and for Romashkino was 150,685 m−1. Extending these averages over thicknesses of interest, we arrive at Table 1 using Equation (1). Absorption is shown as the absolute value of attenuation, e.g., a value of 2 reduces the light by a factor of 2.
I = Ioe−ax
As can be seen from Table 1, absorption does not significantly affect the attenuation of the Petrobaltic oil below 4.5 µm, but the Romashkino has an attention of 2; that is, about ½ the light is absorbed at 4.5 µm.
Another phenomenon that takes place is the interference between light waves [13]. This interference results in the rainbow colors of thin slicks. The refractive index of a given wavelength results in a difference in the optical path length. This difference can be given as [13]:
where: ΔL is the difference in optical path length; t is the film thickness; μ is the refractive index of the film; I is the angle of light incidence.
ΔL = 2t (μ2 − sin2(I))½
Hornstein [13] points out that if ΔL contains a whole number of wavelengths, then the maximum destructive interference will occur. If ΔL contains an odd number of half wavelengths, then the maximum constructive interference will occur.
The maximum destructive interferences occur at:
where λ is the wavelength under consideration, and x is a whole number as 1, 2, 3, 4 etc.
λ = ΔL/x
The maximum constructive interferences occur at:
where x is a whole odd number as 1, 3, 5, 7 etc. This results in the interferences shown in Table 2 [13].
λ = 2ΔL/x
Table 2 shows the colors that are the result of the light interference in the oil layer [13]. Furthermore, the dulling of the colors shows that with increasing numbers of constructive and destructive interferences, colors become increasing dull. The decrease in light, as judged by the color dullness, approximates double the number of interferences. This effect is additive to absorption. Calculating this effect for Petrobaltic, a medium oil, and Romashkino, a dark oil, shows that the oil colors appear earlier for the dark oil. This calculation is shown in Table 3. The calculations begin at the bottom of Table 3. The attenuation equivalent of the effect of number of constructive and destructive interferences is taken as a doubling of the attenuation with each doubling of the number of interferences, beginning with the bright colors at 0.9 µm and thereafter with 3 constructive interferences. The calculated absorptions for the two oils (similar to Table 1) are added to the relative attenuations resulting from constructive and destructive interference. This gives rise to a relative attenuation number called the total attenuation in Table 3. The end result is that the true oil color of the darker oil, Romashkino, appears at about 1.8 µm, whereas this true oil color appears at about 2.7 µm for the medium oil, Petrobaltic. Thus, at thicknesses greater than the rainbow colors, >1.5 µm, the true oil colors will appear sooner for a darker oil. Further, this calculation, as shown in Table 3, shows that there are no possible colorations beyond about 3 µm for any oil. This is true even if the effect of constructive and destructive interferences for the oil is not considered.
2.3. Rainbow Slicks
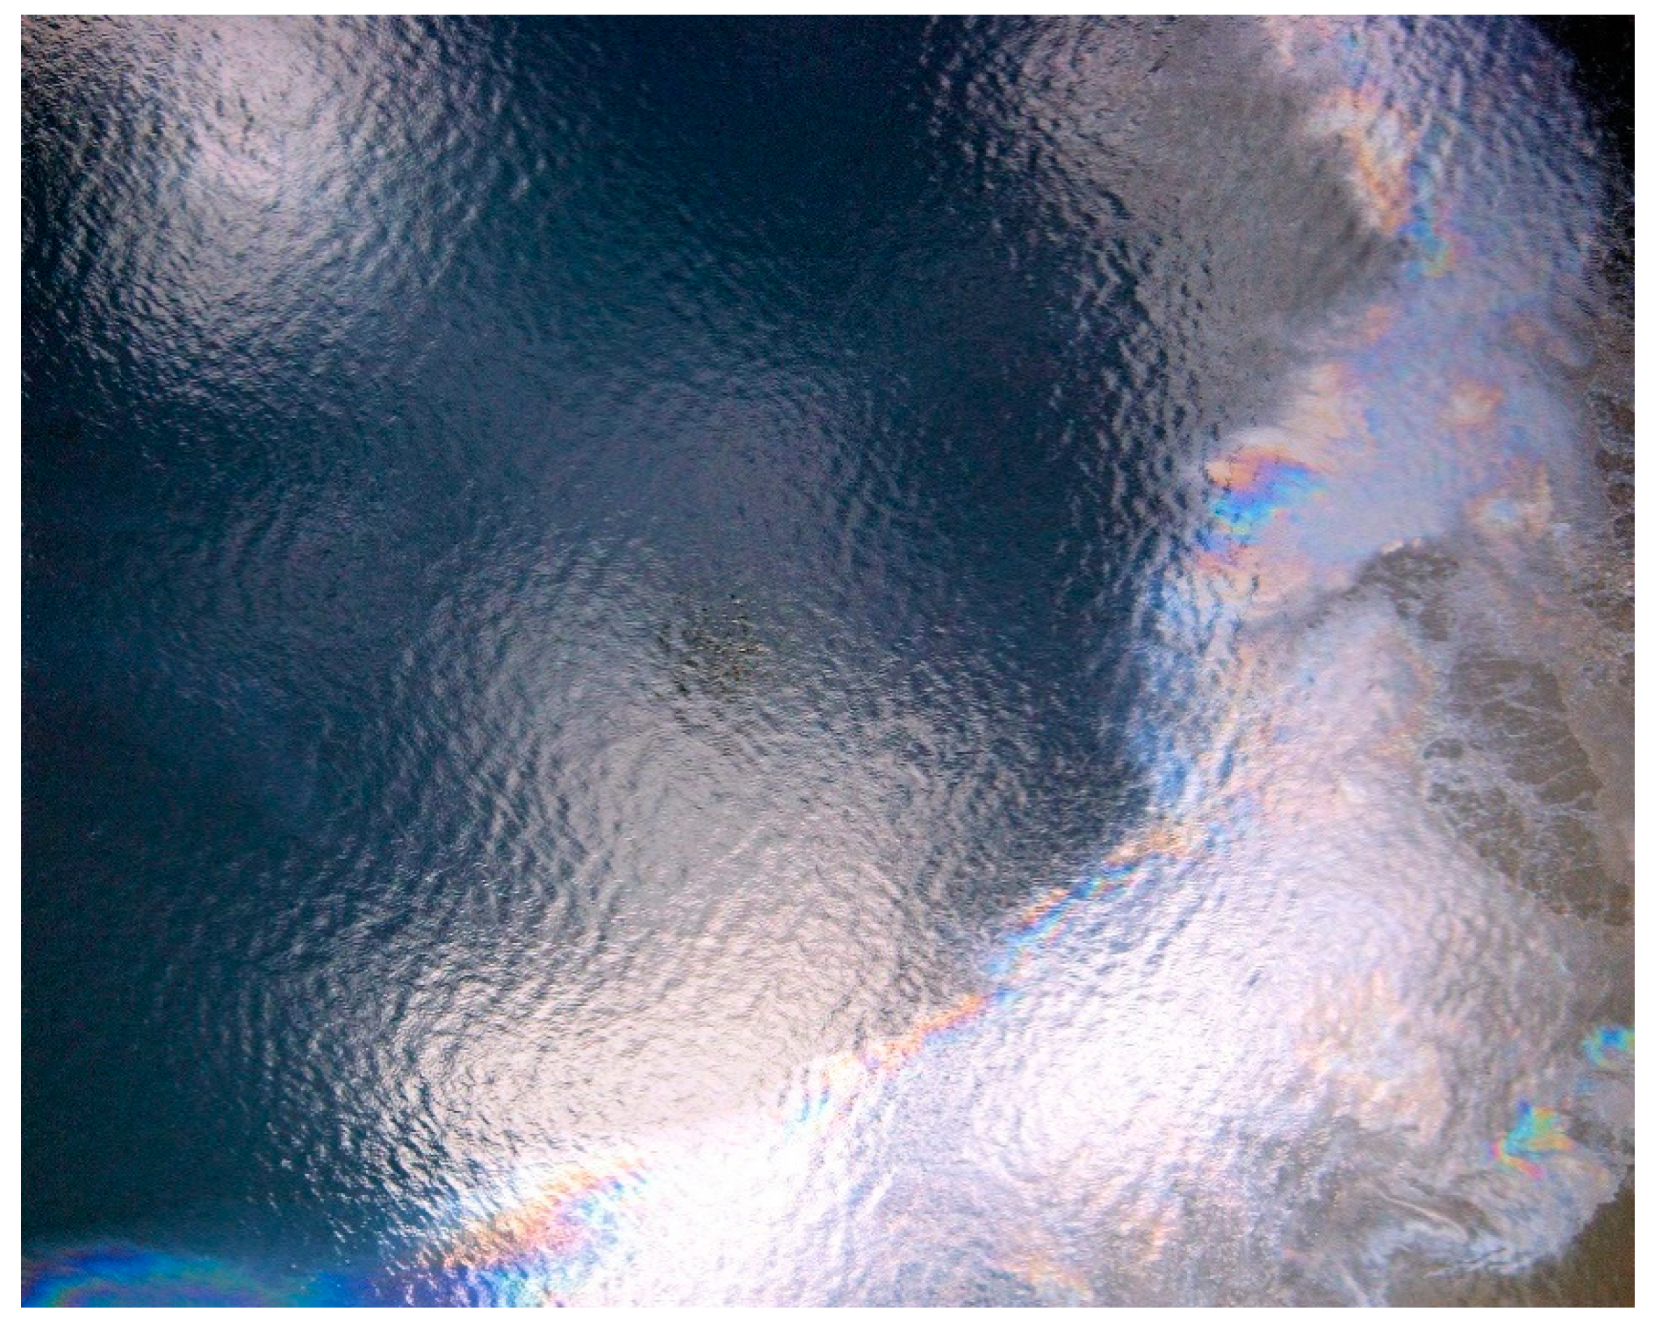
Studies have shown that rainbow sheens, a particular form of slick appearance illustrated in Figure 2, actually has different physical origins from other thickness–appearance relationships [1,13,15]. Hornstein [13,15] studied the various slick phenomena and concluded that rainbow sheen was the result of constructive and destructive interference between light reflected from the oil surface and that from the water surface. This is a unique indicator of oil thickness.
Tables of constructive and destructive wavelengths can be written as shown in Table 2 [13,15]. This task results in a color chart for visible oil as: thickness less than 0.15 μm—no color apparent; thickness of 0.15 μm—warm tone apparent; thickness of 0.2 to 0.9 μm—variety of colors (e.g., rainbow); and for thickness greater than 0.9 μm—colors of less purity. This corresponds to the observed onset noted in experiments [2].
2.4. Color Codes
Color codes are charts relating oil thickness to color. Many different codes were developed—largely based on older work, some of which are listed in Table 4 [16]. The findings of the research to date include the following points [1,2]. First, the appearance of thin slicks is relatively consistent across the many experiments carried out over many years. Second, the most reliable thickness appearances are for the thin sheen and the rainbow sheen. Third, the utility of thicknesses derived from oil color codes is very limited [16]. The only reliable color codes are the thin ones (<3 µm). Most of the oil is located in the thick portions of the slick (thickness > 3 µm). For larger spills, the appearance codes are not useful. Finally, there is no supporting evidence for any colorations for the thicker portions of the slick.
One of the new color codes that has emerged has been that of the Bonn Agreement [24]. This is shown in Table 4. The part that is different from any other code is the thicker indications. The basis for these thicker appearances is some experimental work; however, this work was never reviewed or published [25]. A second issue is the calling of the thicker portion “metallic”, again a departure from convention. Most observers agree that there may not be a commonly-accepted color described as “metallic”. Further, this color may be confused with silver sheen. Several parties have questioned this code [26,27]. The current ASTM standard has the conventional thin appearance codes. There have been no scientific papers supporting the thicker portions of the Bonn code. There is strong evidence that the clearest signal for thickness is the rainbow sheen, as shown in Figure 2.
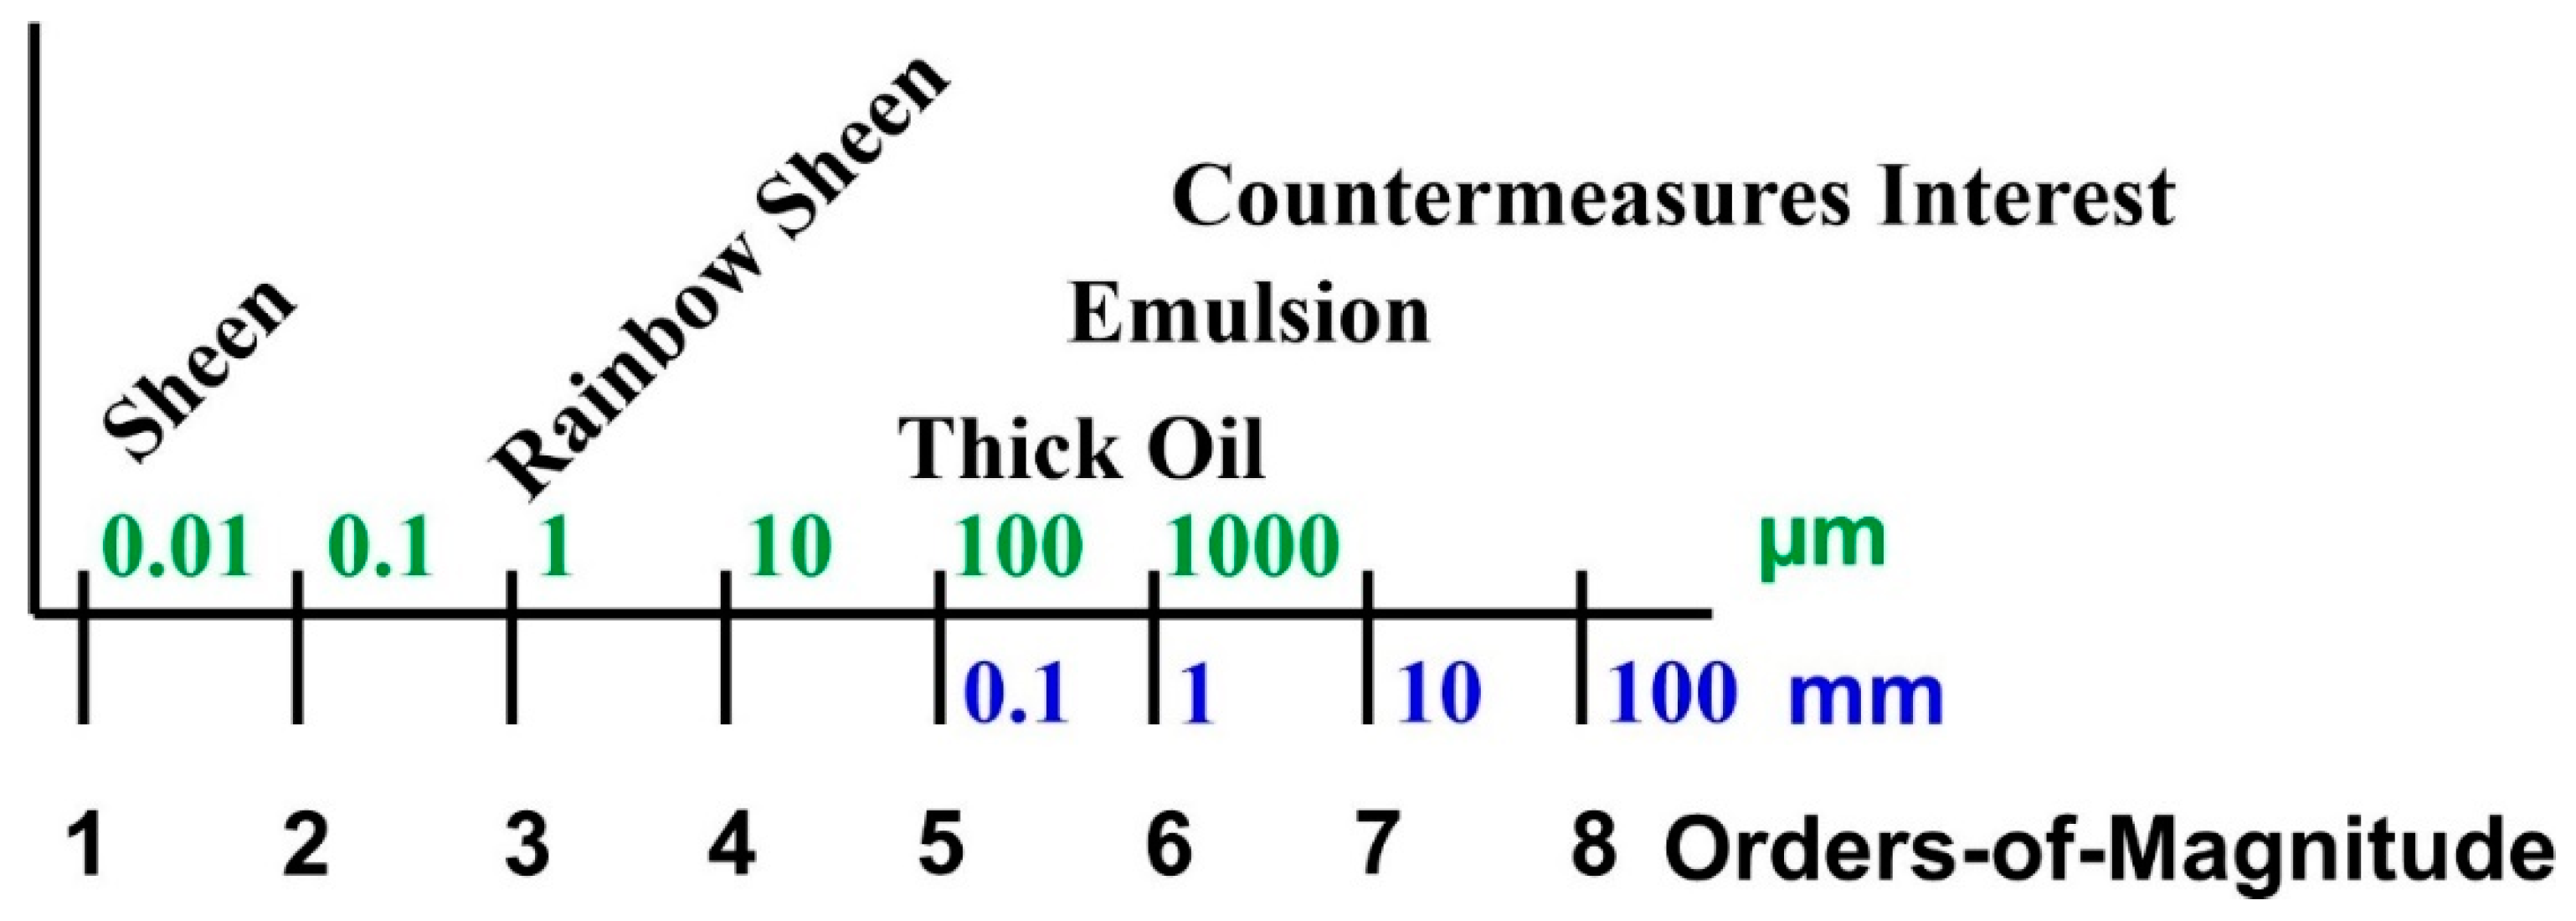
An important question is the determination of the relevant thickness ranges. Figure 3 illustrates the orders of magnitude relevant to an oil spill situation. An important point is that the easily determined visual ranges are orders of magnitude below the relevant thickness ranges needed for oil spill countermeasure considerations. This figure also illustrates the errors that would occur if one used incorrect data on thickness to determine the volume. The errors could be as large as orders of magnitude.
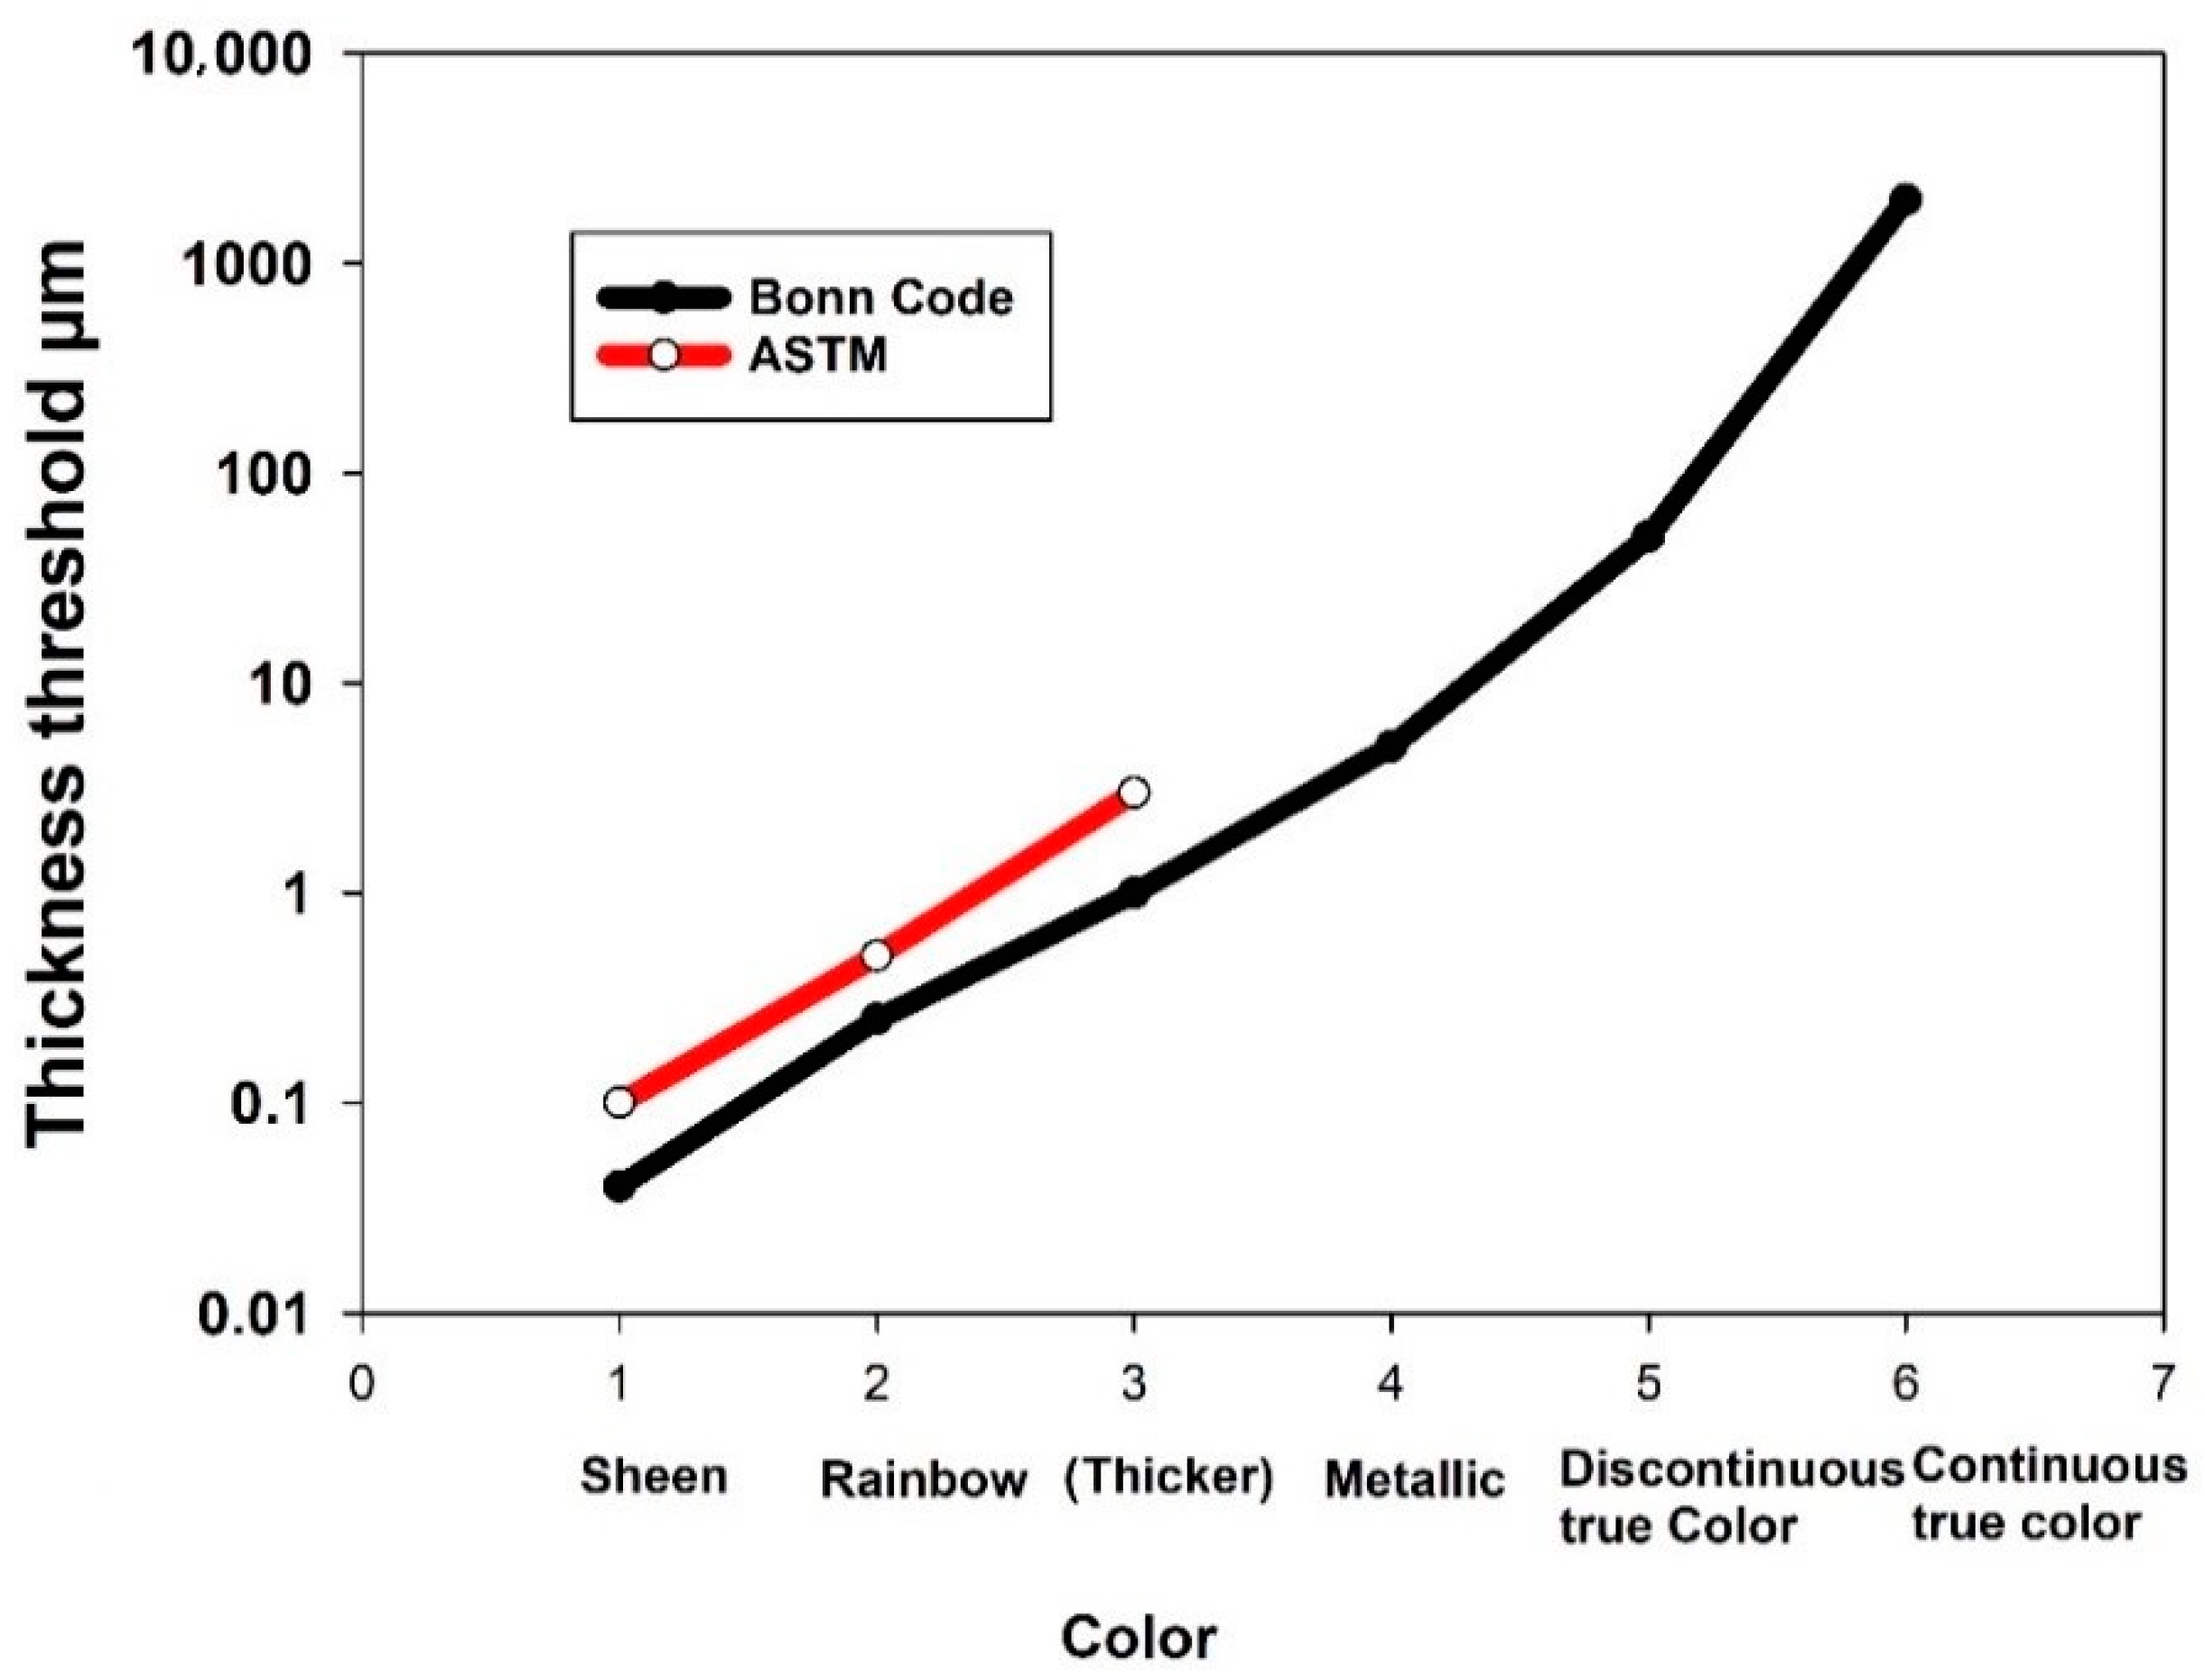
Two codes are currently used, that of the ASTM code and the Bonn Agreement Codes. These two codes cover widely different thickness regimes, as shown in Figure 4.
3. Visibility of Discharges
Just as thin slicks on water appear to show consistency in appearance, discharges from vessels were thought to show consistency in appearance [2]. The proposition was that appearance of oil on the surface related to the oil content of discharge at a given speed. For example, it was proposed that discharges below 50 or 100 ppm could not be observed if the vessel was moving at 8 knots or more. It was thought that the greater the vessel speed, the greater the discharge could be before the slick was visible. These speed–discharge relationships actually depended both on the appearance of the resulting slick as well as the rise time and spreading of the oil. Because the speed of deposition was similar for most vessels, consistency in the observation of oil slicks was thought to be relevant. The purpose of this speculation and subsequent tests was to establish a maximum oil discharge value at sea, which did not result in a visible slick. These types of test are subject to high variability, much more than that for slick appearance, as listed in Section 2.1 above. Several tests were conducted and these tests ceased when discharge limits were established by a United Nations organization independently of these tests [28]. Early visibility test results are summarized in Table 5.
4. Determination of Water-in-Oil Emulsification
Water-in-oil emulsions sometimes form in rough waters after oil products are spilled. These emulsions, often called “chocolate mousse” or “mousse” by oil spill workers, can make the cleanup of oil spills very difficult [29]. When water-in-oil emulsions form, the physical properties of oil change dramatically. As an example, stable emulsions contain from 60 to 80% water, thus expanding the spilled material from 2 to 5 times the original volume. Most importantly, the viscosity of the oil typically changes from a few hundred mPa·s to about 100,000 mPa·s, an increase by a factor of 500 to 1000. A liquid product is changed into a heavy, semi-solid material.
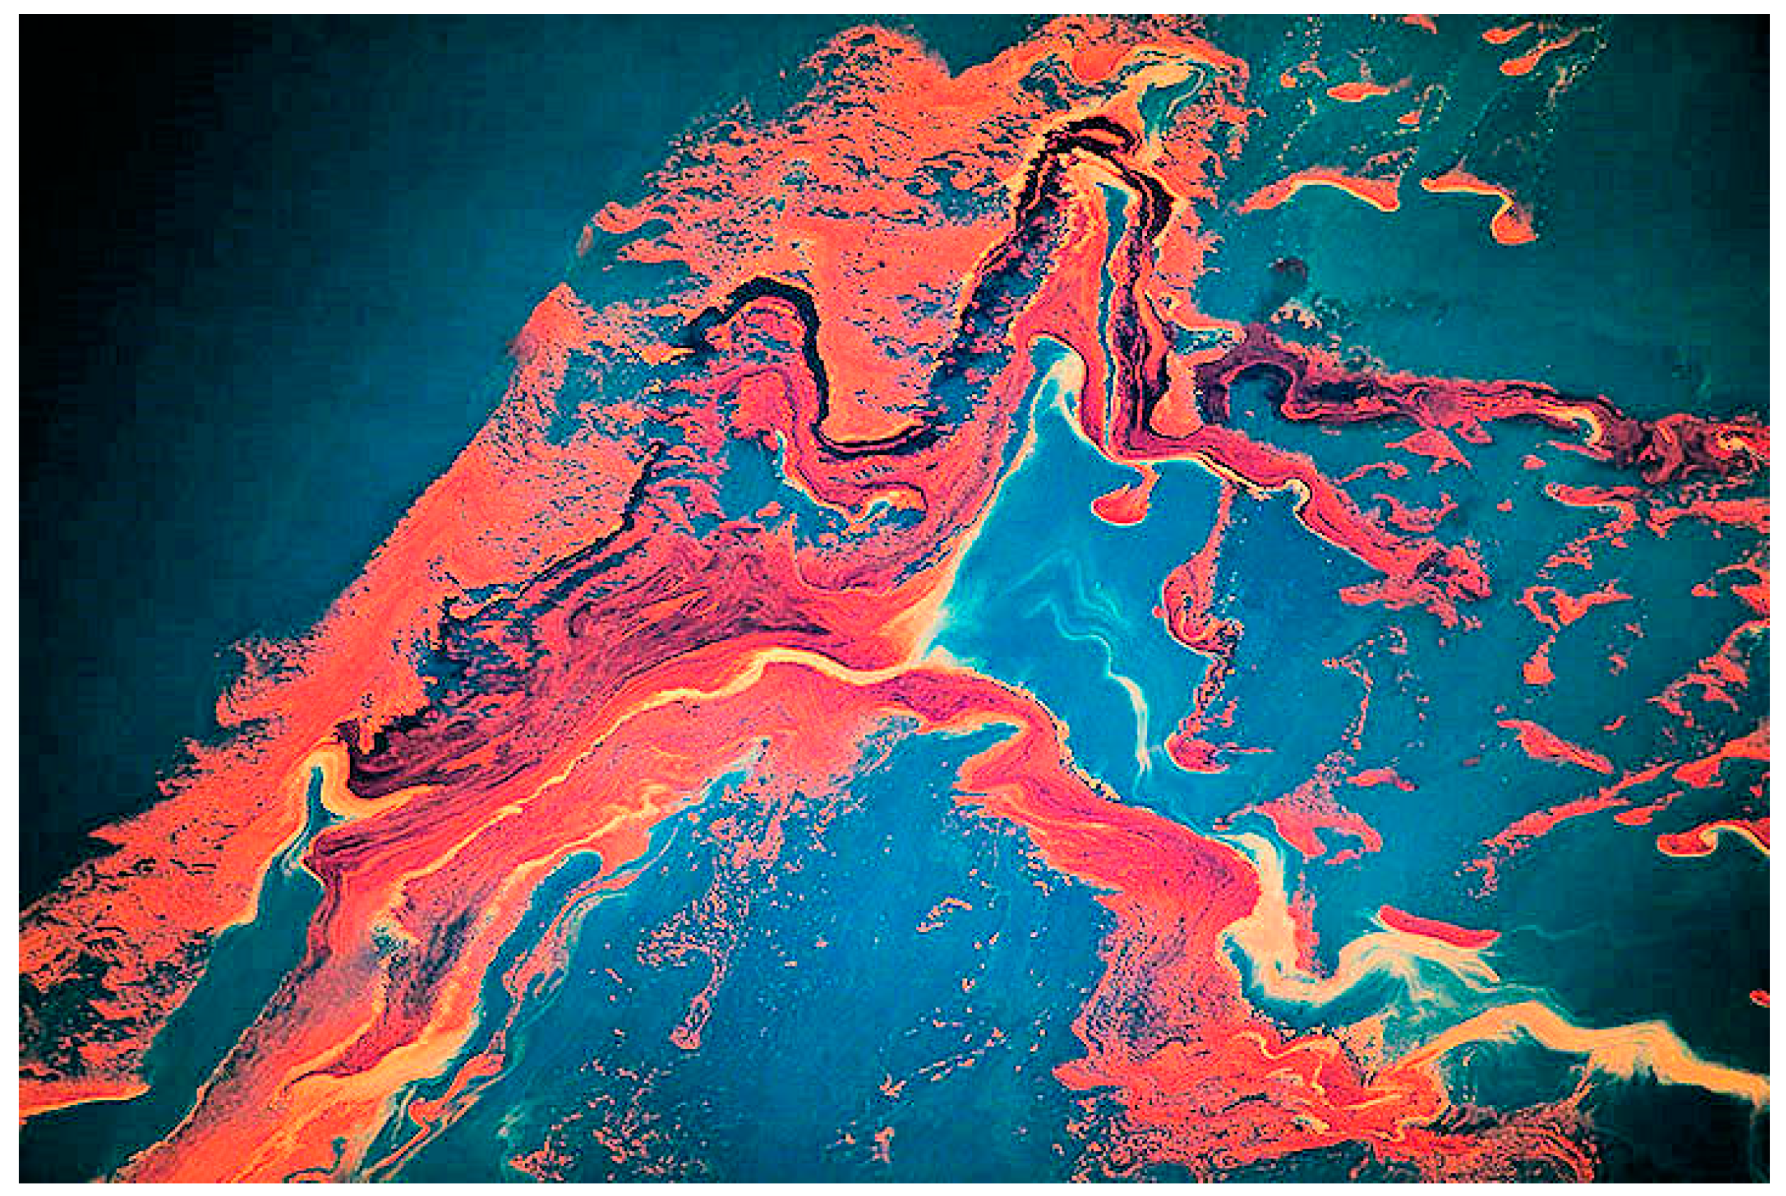
There are several types of emulsions, two of which are colored reddish because of the specular reflection of light from the water droplets in the oil. These colors can be seen from the air and are distinctive when most of the oil in the scene is emulsified in this manner [4]. This is shown in Figure 5. It should be noted that water-in-oil emulsions sometimes form, dependent on various conditions [30].
It is important to note that the red color of water-in-oil emulsions is caused by the specular reflection of the emulsion. Water-in-oil emulsions are opaque to light. The thickness of water-in-oil emulsions is unknown but is thought to be much greater than sheen [30].
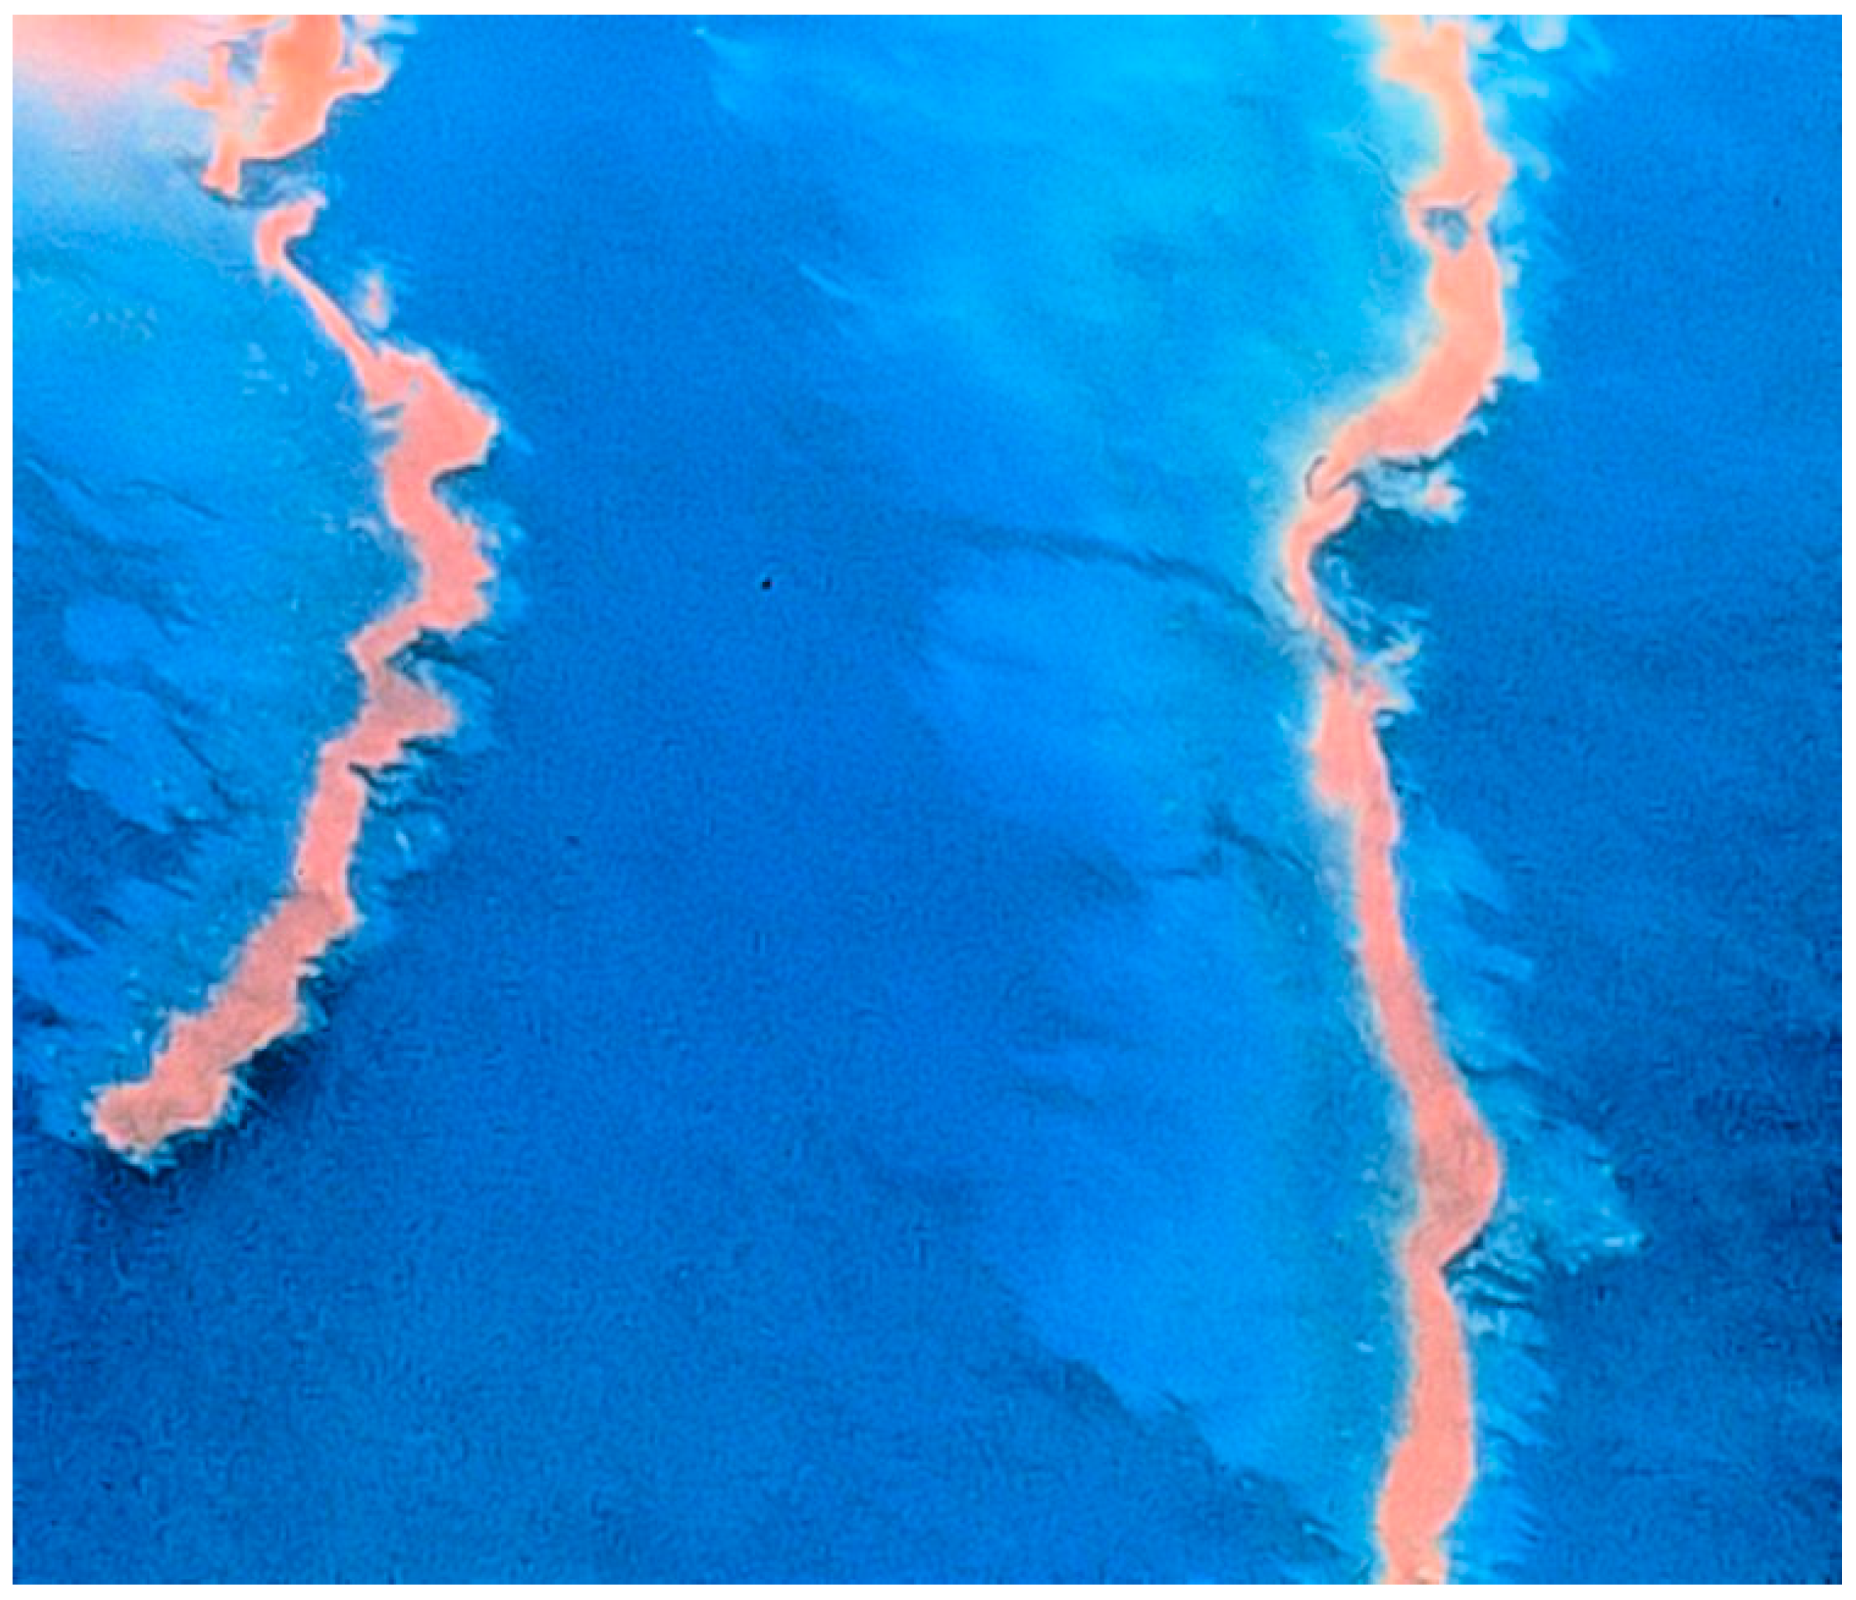
Fingas and Fieldhouse [30] found that four clearly-defined water-in-oil types are formed by crude oil when mixed with water. The types are named stable water-in-oil emulsions, meso-stable water-in-oil emulsions, entrained water, and unstable water-in-oil types. The differences among the four types are quite large [31]. The overall properties of the water-in-oil types are shown in Table 6. Table 6 shows that the biggest difference between types are shown in the typical lifetime of the water-in-oil types. Meso-stable emulsions appear very much like stable emulsions but break down within a few days. Figure 6 shows a typical scenario where emulsions appear in streaks among sheen.
This shows that the reddish-brown characteristic of water-in-oil emulsions, meso-stable and stable, can be visually identified. It should be noted that the presence of emulsions negates other appearance information; however, sheen or thin slicks can exist alongside emulsion, as shown in Figure 6. Emulsion does not form in thin slicks or sheen.
5. Observation of Oil-in-Water Emulsification
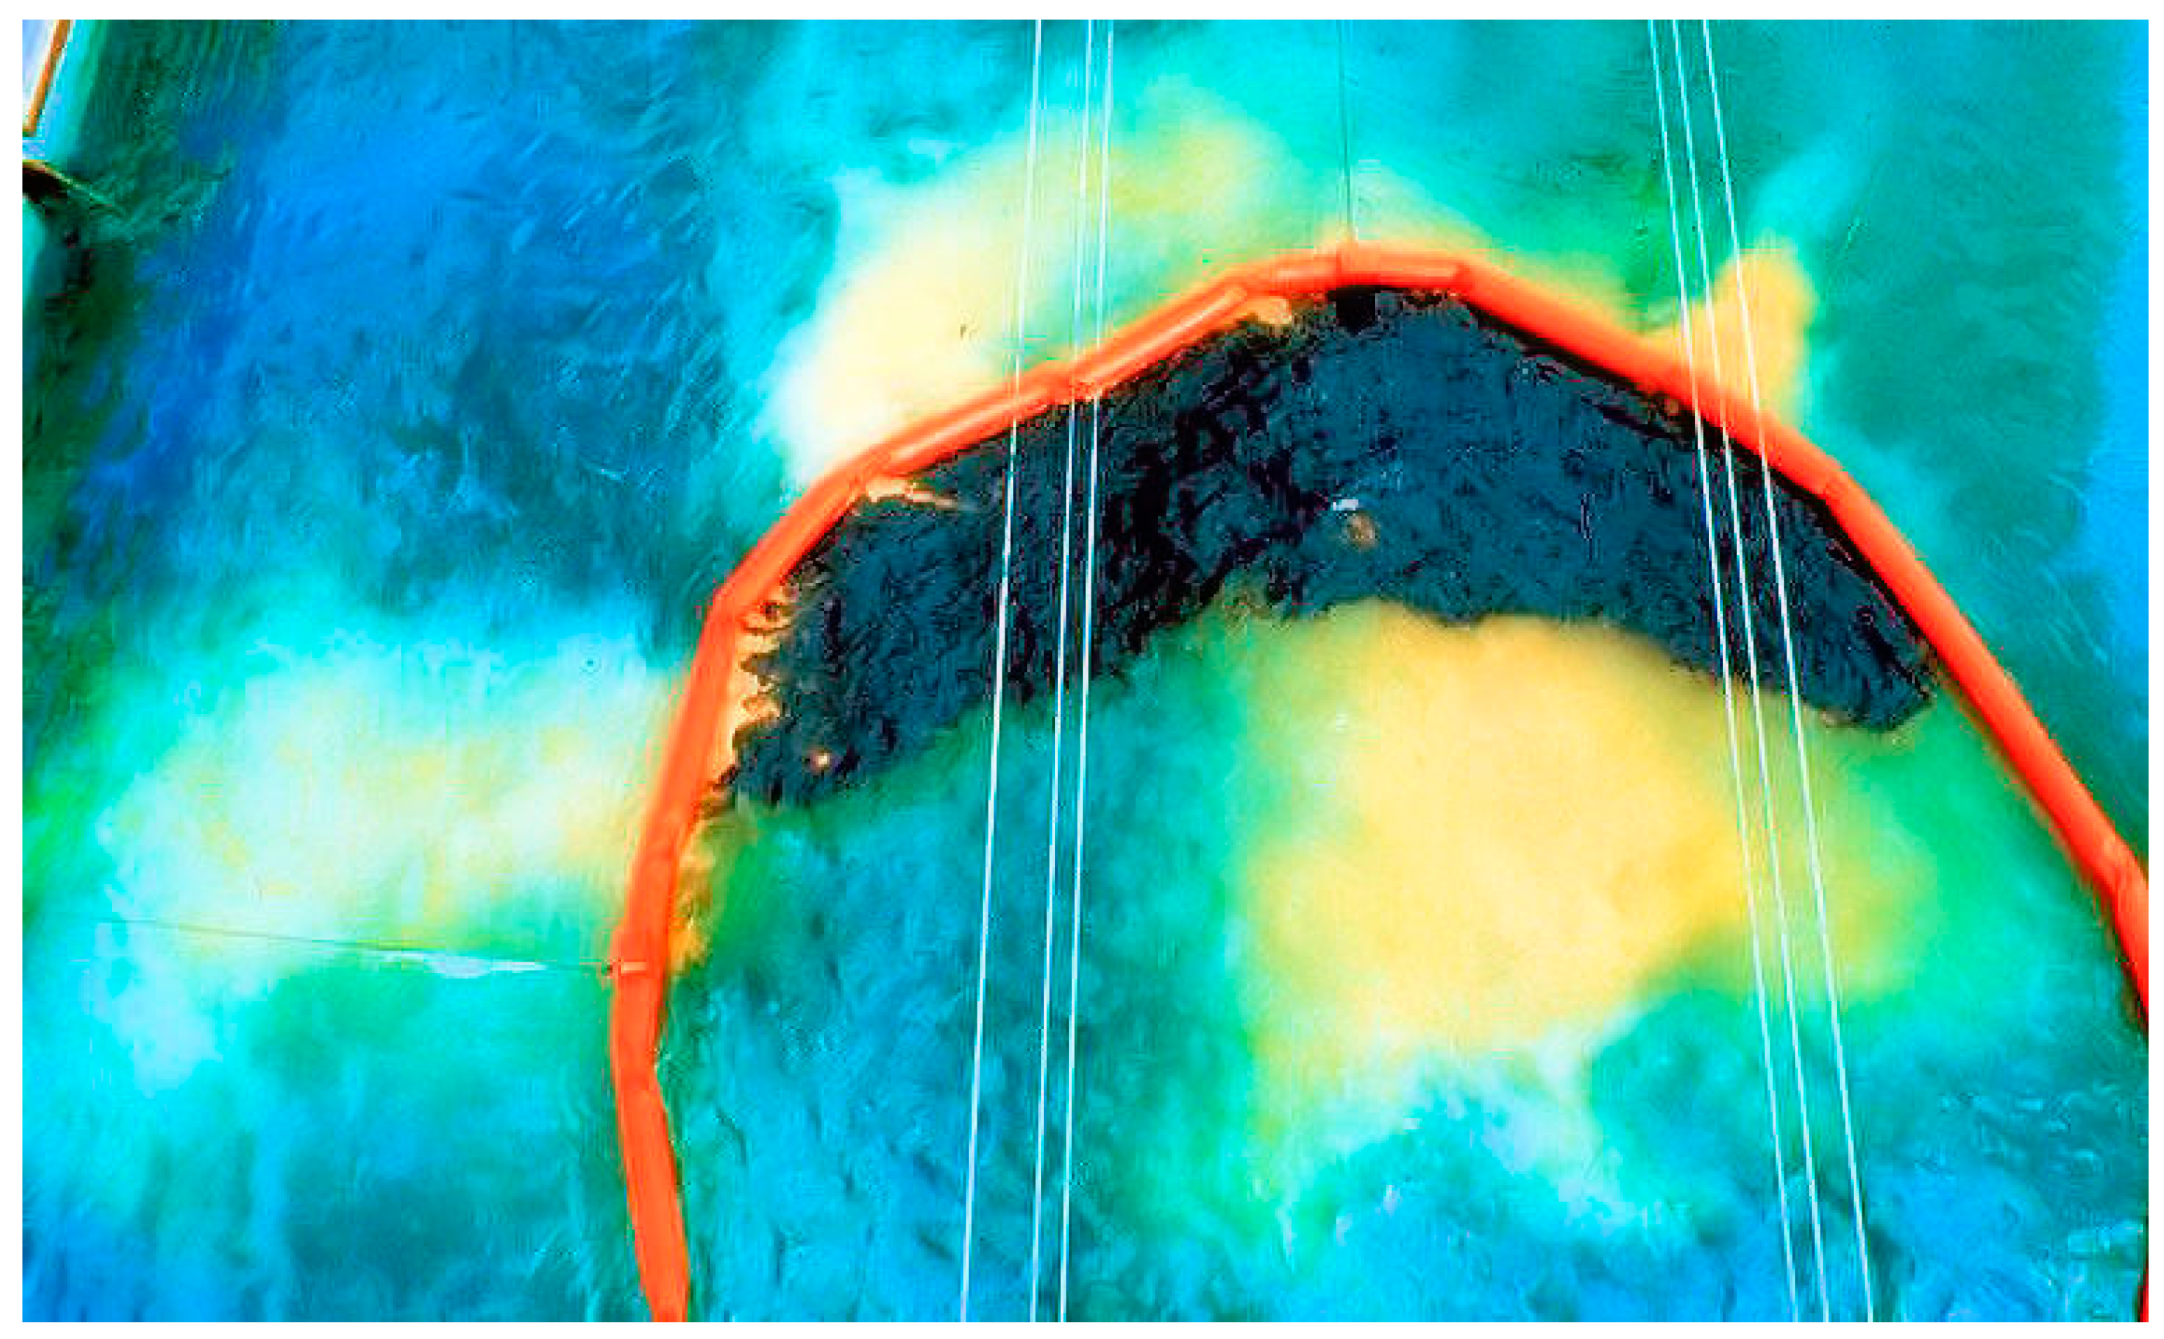
Spill countermeasures sometimes involve the application of chemical dispersants to the oil. The results of such activity may result in a dispersion of droplets under the oil slick. This oil-in-water emulsion is called a dispersion in the oil spill trade. If dispersion is successful, a coffee-colored plume in the water is formed, such as that shown in Figure 7 [5,32]. This is a result of the light reflection from the many 5 to 50 µm droplets in the water column [33]. The coffee-colored plume is used as a sign of dispersant effectiveness by oil spill cleanup personnel. This coffee-colored plume develops after about 20 min after the application of dispersants, slowly dissipates and is generally visible up to about 3 h after a spill dispersion. The appearance of oil-in-water emulsions is dependent on their being no oil on the water’s surface to block the transmission of light into and out of the water column.
6. Other Observations
Several other observations of oil slicks may have utility to the spill countermeasures effort [6]. This includes obvious physical parameters such as slick position, movement, aerial coverage and distribution or patchiness [34]. Additional information that may be sought is the viscosity of the oil, although there is no clear evidence of viscosity indications in any documented observations.
7. Conclusions
The use of color and other visual observations has been used for many years to characterize oil on the sea. Visual methods to estimate oil thickness are restricted by physics to thicknesses smaller than those of rainbow sheens (<3 µm). One can observe that some slicks are not sheen and are probably thicker. The use of color codes to estimate thickness should be restricted to that of rainbow sheens and lesser thicknesses (<3 µm). Other slick thicknesses do not have a basis in physics, nor in practical observations.
Many different codes were developed, largely based on older work, and some with newer experimental work. Although there is good consistency for thin slicks, that is, for sheen and rainbow sheen, there are no consistencies for the appearance of thicker slicks (>3 µm).
The reddish color of some water-in-oil emulsion types enables the detection of this oil condition. This is limited to stable or nearly-stable water-in-oil emulsions. The coffee-colored reflection of light from 5 to 50 µm oil droplets in water from a chemically-dispersed oil slick can give an indication of this dispersion. The discharge of oil from ships cannot be quantitatively monitored using the appearance of oil on the surface.
Funding
This research received no external funding.
Institutional Review Board Statement
Not applicable.
Informed Consent Statement
Not applicable.
Conflicts of Interest
The author declares no conflict of interest.
References
- Fingas, M.F. The Challenges of Remotely Measuring Oil Slick Thickness. Remote Sens. 2018, 10, 319. [Google Scholar] [CrossRef] [Green Version]
- Fingas, M.F.; Brown, C.E.; Gamble, L. The Visibility and Detectability of Oil Slicks and Oil Discharges on Water. In Proceedings of the Twenty-Second Arctic and Marine Oil Spill Program Technical Seminar, Calgary, AB, Canada, 2–4 June 1999; pp. 865–886. [Google Scholar]
- Sicot, G.; Lennon, M.; Miegebielle, V.; Dubucq, D. Estimation of the thickness and emulsion rate of oil spilled at sea using hyperspectral remote sensing imagery in the SWIR domain. Int. Arch. Photogram. Remote Sens. Spat. Inf. Sci. ISPRS Arch. 2015, 40, 445–450. [Google Scholar] [CrossRef] [Green Version]
- Lu, Y.; Shi, J.; Hu, C.; Zhang, M.; Sun, S.; Liu, Y. Optical interpretation of oil emulsions in the ocean—Part II: Applications to multi-band coarse-resolution imagery. Remote Sens. Environ. 2020, 242, 111778. [Google Scholar] [CrossRef]
- IPECA. Dispersants: Surface Application; International Association of Oil & Gas Producers: London, UK, 2015. [Google Scholar]
- De Padova, D.; Mossa, M.; Adamo, M.; De Carolis, G.; Pasquariello, G. Synergistic use of an oil drift model and remote sensing observations for oil spill monitoring. Environ. Sci. Pollut. Res. 2017, 24, 5530–5543. [Google Scholar] [CrossRef] [PubMed]
- US Congress. Report on Oil-Pollution Experiments—Behaviour of Fuel Oil on the Surface of the Sea; US Congress: Washington, DC, USA, 1930. [Google Scholar]
- Cheemalapati, S.; Orth, H.P.F.; Wang, H.; Konnaiyan, K.R.; Morris, J.M.; Pyayt, A.L. Measurement of thickness of highly inhomogeneous crude oil slicks. Appl. Opt. 2017, 56, E72–E76. [Google Scholar] [CrossRef] [PubMed]
- Otremba, Z. Modeling of visibility of oil in the sea. Proc. SPIE 2002, 4881, 484–492. [Google Scholar] [CrossRef]
- Otremba, Z.; Piskozub, J. The modification of light flux leaving a wind-roughened, oil covered sea surface example of computations for shallow seas. Ocean. Stud. 2000, 29, 117–133. [Google Scholar]
- Otremba, Z. A thin oil film covering the sea surface as a modifier of the downward transmission of light. Oceanologia 1997, 39, 397–411. [Google Scholar]
- Pedrotti, F.L.; Pedrotti, L.S.; Pedrotti, L.M. Introduction to Optics, 3rd ed.; Prentice Hall: Upper Saddle River, NJ, USA, 2007. [Google Scholar]
- Hornstein, B. The Appearance and Visibility of Thin Oil Films on Water; Environmental Agency Protection Report, EPA-R2-72-039; EPA: Cincinnati, OH, USA, 1972. [Google Scholar]
- Otremba, Z. Oil droplets as light absorbents in seawater. Opt. Express 2007, 15, 8592–8597. [Google Scholar] [CrossRef] [PubMed]
- Horstein, B. The Visibility of Oil-Water Discharges. In Proceedings of the 1973 International Oil Spill Conference; American Petroleum Institute: Washington, DC, USA, 1973; pp. 91–99. [Google Scholar]
- ASTM. Visually Estimating Oil Spill Thickness on Water; American Society for Testing and Materials: Conshohoken, PA, USA, 2016. [Google Scholar]
- Allen, A.A.; Schlueter, R.S. Natural Oil Seepage at Coal Oil Point, Santa Barbara, California. Science 1970, 170, 974–977. [Google Scholar] [CrossRef]
- API. Manual on Disposal of Refinery Wastes, Volume on Liquid Wastes; American Petroleum Institute: Washington, DC, USA, 1969. [Google Scholar]
- Parker, H.D.; Cormack, D. Evaluation of Infrared Line Scan (IRLS) and Side-Looking Airborne Radar (SLAR) over Controlled Oil Spills in the North Sea; Warren Spring Laboratory Report; Plenum Press: New York, NY, USA, 1979. [Google Scholar]
- ITOPF (International Tanker Owners Pollution Federation). Aerial Observation of Oil at Sea; International Tanker Owners Pollution Federation: London, UK, 2005. [Google Scholar]
- MacDonald, I.; Guinasso, N.L., Jr.; Ackleson, S.G.; Amos, J.F.; Duckworth, R.; Sassen, R.; Brooks, J.M. Natural Oil Slicks in the Gulf of Mexico Visible from Space. J. Geophys. Res. 1993, 98, 16351–16364. [Google Scholar] [CrossRef]
- Brown, H.M.; Baschuk, J.J.; Goodman, R.H. The Limits of Visibility of Spilled Oil Sheens. In Proceedings of the Twenty-First Arctic and Marine Oil Spill Program (AMOP) Technical Seminar, Edmonton, AB, Canada, 10–12 June 1998; Environment Canada: Calgary, AB, Canada, 1998; Volume 2, pp. 805–810. [Google Scholar]
- Canadian Coast Guard. Appearance and Thickness of an Oil Slick; Section 3, Annex C, Operations Manual; Canadian Coast Guard: Ottawa, ON, Canada, 1996. [Google Scholar]
- Bonn Agreement. Guidelines for Oil Pollution Detection: Investigation and Post Flight Analysis/Evaluation for Volume Estimation. 2017. Available online: https://www.bonnagreement.org/ (accessed on 16 November 2019).
- Lewis, A. The Use of Colour as a Guide to Oil Film Thickness: Phase I—A Literature Review; SINTEF Report No. STF66-F97075; SINTEF: Trondheim, Norway, 2000. [Google Scholar]
- Lehr, W.J. Visual Observations and the Bonn Agreement. In Proceedings of the Thirty-Third Environment Canada Arctic and Marine Oil Spill Program Technical Seminar (AMOP), Halifax, NS, Canada, 7–9 June 2010; pp. 669–678. [Google Scholar]
- Lehr, W.J.; Simecek-Beatty, D.; Leifer, I. Calculating Surface Oil Volume during the Deepwater Horizon Spill. In Proceedings of the Thirty-Fourth Environment Canada Arctic and Marine Oil Spill Program, Banff, AB, Canada, 4–6 October 2011; pp. 259–269. [Google Scholar]
- Interpol. Marpol 73/78 Illegal Oil Discharges from Vessels; Interpol: London, UK, 2020. [Google Scholar]
- NAS. Oil in the Sea III, Inputs, Fates and Effects, National Research Council; National Academies Press: Washington, DC, USA, 2002. [Google Scholar]
- Fingas, M.; Fieldhouse, B. Studies on Crude Oil and Petroleum Product Emulsions: Water Resolution and Rheology. Colloids Surfac. A 2009, 333, 67–81. [Google Scholar] [CrossRef]
- Fingas, M. Models for Water-in-Oil Emulsion Formation. In Oil Spill Science and Technology; Elsevier: Amsterdam, The Netherlands, 2011; Chapter 10; pp. 243–273. [Google Scholar]
- Cedre, F. (Ed.) Using Dispersants to Treat Oil Slicks at Sea: Airborne and Shipborne Treatment Response Manual; Centre for Documentation, Research and Experimentation on Accidental Water Pollution (CEDRE): Brest, France, 2005. [Google Scholar]
- Fingas, M. Oil Spill Dispersants: A Technical Summary. In Oil Spill Science and Technology; Gulf Publishing Company: Houston, TX, USA, 2011; Chapter 15; pp. 435–582. [Google Scholar]
- Lee, M.-S.; Park, K.-A.; Lee, H.-R.; Park, J.-J.; Kang, C.-K.; Lee, M. Detection and dispersion of oil spills from satellite optical images in a coastal bay. Int. Geosci. Remote Sens. Symp. 2016, 7729643, 2491–2494. [Google Scholar] [CrossRef]
Figure 1.
Fundamental optical phenomena involved in the oil coloration of thin slicks. This diagram is applicable only to the consideration of the appearance of thin slicks.
Figure 1.
Fundamental optical phenomena involved in the oil coloration of thin slicks. This diagram is applicable only to the consideration of the appearance of thin slicks.

Figure 2.
A photograph of a rainbow sheen taken from an aircraft at an altitude of about 300 m. This color of sheen has a strong physical relation to 1 to 1.5 µm.
Figure 2.
A photograph of a rainbow sheen taken from an aircraft at an altitude of about 300 m. This color of sheen has a strong physical relation to 1 to 1.5 µm.

Figure 3.
Thicknesses of interest to the spill responder.

Figure 4.
The comparison of the ASTM and Bonn Color Codes.

Figure 5.
Emulsion shown from an aircraft from an altitude of approximately 100 m.

Figure 6.
Photograph showing emulsion streaks surround by sheen (thin oil). This photograph was taken from an aircraft flying at about 1000 m.
Figure 6.
Photograph showing emulsion streaks surround by sheen (thin oil). This photograph was taken from an aircraft flying at about 1000 m.

Figure 7.
The appearance of a coffee-colored plume after the application of a chemical dispersant to crude oil in a test tank. This photo was taken about 20 min after the application of a dispersant. This coffee-colored plume is the result of light reflection from droplets of oil in the water in the size range of 5 to 50 µm.


Table 1.
Light attenuation by absorption.
| Scheme 0 | 0.3 | 0.6 | 1.2 | 1.8 | 2.4 | 3 | 3.6 | 4.2 | 4.5 |
|---|---|---|---|---|---|---|---|---|---|
| Average Absorption over Visible Spectrum | |||||||||
| Absorption Petrobaltic | 1 | 1 | 1 | 1 | 1 | 1 | 1 | 1 | 1 |
| Absorption Romashkino | 1 | 1.1 | 1.2 | 1.3 | 1.4 | 1.6 | 1.7 | 1.9 | 2 |
Table 2.
Typical wave lengths resulting from interference [13].
Table 2.
Typical wave lengths resulting from interference [13].
| Oil Thickness | Constructive Wavelengths | Destructive Wavelengths | Resulting Color(s) |
|---|---|---|---|
| µm | nm | nm | |
| 0.3 | 544 | 816, 408 | First colors appear |
| 0.6 | 652, 465 | 816, 544, 408 | Bright Rainbow Colors |
| 0.9 | 699, 544, 445 | 816, 612, 490, 408 | |
| 1.2 | 725, 593, 502, 435 | 816, 652, 544, 466, 408 | Dull Rainbow Colors |
| 1.5 | 743, 528, 544, 480, 429 | 816, 680, 583, 510, 453, 408 | More Dull Colors |
| 1.8 | 753, 653, 616, 516, 466, 426 | 816, 699, 612, 544, 490, 445, 408 |
Table 3.
Effect of absorption and interference.
| Slick Thickness µm | 0.3 | 0.6 | 0.9 | 1.2 | 1.5 | 1.8 | 2.1 | 2.4 | 2.7 | 3 | 3.3 | 3.6 | 3.9 | 4.2 | 4.5 | 10 | 20 |
|---|---|---|---|---|---|---|---|---|---|---|---|---|---|---|---|---|---|
| Total Attenuation | |||||||||||||||||
| Petrobaltic | 1 | 2 | 2 | 2.3 | 2.6 | 3 | 3.3 | 3.6 | 4 | 4.3 | 4.6 | 5 | 5.3 | 5.6 | 6 | 9.1 | 17.1 |
| First colors appear Bright Rainbow Colors | Dull Rainbow Colors | More Dull Colors | Oil Color | Oil Color | Oil Color | Oil Color | Oil Color | Oil Color | Oil Color | Oil Color | Oil Color | ||||||
| Romashkino | 2 | 3.1 | 4.1 | 5.2 | 6.3 | 7.3 | 8.4 | 9.4 | 10.5 | 11.6 | 12.6 | 13.7 | 14.8 | 15.9 | 17 | 27.5 | 66.4 |
| First colors appear Bright Rainbow Colors | Dull Rainbow Colors More Dull Colors | Oil Color | Oil Color | Oil Color | Oil Color | Oil Color | Oil Color | Oil Color | Oil Color | Oil Color | Oil Color | Oil Color | Oil Color | ||||
| Absorption Petrobaltic | 1 | 1 | 1 | 1 | 1 | 1 | 1 | 1 | 1 | 1 | 1 | 1 | 1 | 1 | 1 | 1.1 | 1.1 |
| Absorption Romashkino | 1 | 1.1 | 1.1 | 1.2 | 1.3 | 1.3 | 1.4 | 1.4 | 1.5 | 1.6 | 1.6 | 1.7 | 1.8 | 1.9 | 2 | 4.5 | 20.4 |
| Effect of Interference | 0 | 1 | 1 | 1.3 | 1.6 | 2 | 2.3 | 2.6 | 3 | 3.3 | 3.6 | 4 | 4.3 | 4.6 | 5 | 8 | 16 |
| # constructive | 1 | 2 | 3 | 4 | 5 | 6 | 7 | 8 | 9 | 10 | 11 | 12 | 13 | 14 | 15 | 23 | 46 |
| # destructive | 2 | 3 | 4 | 5 | 6 | 7 | 8 | 9 | 10 | 11 | 12 | 13 | 14 | 15 | 16 | 24 | 47 |
Table 4.
Summary of Appearance Color Codes.
| Reference | Year | Oil | Type | Number | Height(m) | ViewingAngle | Visibility Thresholds (μm) | ||||||
|---|---|---|---|---|---|---|---|---|---|---|---|---|---|
| Minimum | Silvery | Rainbow | Darkening | Dull | Dark Colors | ||||||||
| Colors | Colors | ||||||||||||
| Congress [7] | 1930 | various incl. Bunker, fuel oil | e | >15 | ship board | oblique | 0.1 | ||||||
| Allen et al. [17] | 1969 | crude—Santa Barbara | e | multiple | ns | ns | 0.05 to 0.18 | 0.23 to 0.75 | 1 to 2.5 | 2.5 to 5.5 | |||
| API [18] | 1969 | general | l | ns | ns | 0.04 | 0.08 | 0.15 to 0.3 | 1 | 2 | |||
| Hornstein [13] | 1972 | Arabian and Louisiana crudes | e | >20 | 1 to 2 | various | <0.15 | up to 0.15 | 0.15 to 0.9 | 0.9 to 1.5 | 1.5 to 3 | ||
| Hornstein [15] | 1973 | various | e & l | ship & aerial | various | 0.038 | 0.076 | 0.15 to 0.31 | 1 | 2 | |||
| Parker et al. [19] | 1979 | North Sea and Arabian crudes | e | 2 | ship & aerial | various | 0.1 | ||||||
| ITOPF [20] | 2005 | general | l | aerial | ns | 0.1 | 0.1 | 0.3 | 0.1 | ||||
| Schriel [2] | 1987 | general | e & l | aerial | various | 0.05 | 0.1 | 0.15 | 0.3 | 1 | 2 | ||
| Schriel [2] | 1987 | general | e & l | aerial | various | 0.1 | 0.3 | 1 | 5 | 15 | |||
| Duckworth [21] | 1993 | various crudes | e | several | ns | ns | 0.1 | 0.1 | 0.1 to 1 | ||||
| Brown et al. [22] | 1995 | crude—Norman Wells | e | 32 | 30 m | nadir | 0.094 | ||||||
| diesel | e | 25 | 30 m | nadir | 0.165 | ||||||||
| lubricating oil | e | 16 | 30 m | nadir | 0.077 | ||||||||
| hydraulic oil | e | 13 | 30 m | nadir | 0.159 | ||||||||
| Coast Guard [23] | 1996 | general—tar codes | l | 0.04 | 0.075 | 0.15 | 0.3 | 1 | 3 |  | |||
| Bonn Agreement [24] | 2017 | l | 0.04 | 0.04 to 0.3 | 0.3 | 5 | >5 to 50 b | 50 to 200, 200 to 2000 b  | |||||
| ASTM Standard [16] | 2016 | 0.08 | 0.1 | 0.5 | 0.9 | 3 | >3 | ||||||
| Average | 0.09 | 0.1 | 0.6 | 0.9 | 2.7 | 8.5 | |||||||
e = experiment; l = literature; ns = not specified; a dark is sometimes stated as “true oil color”, “black”, “brown” or “darker colors” or “metallic.”; b the Bonn agreement document has two additional thicknesses, based on oil distribution: 50 to 200 for patchy, discontinuous distribution and >200 µm for continuous slicks.
Table 5.
Minimum discharge visible with win and speed of discharge (Data from Fingas et al., 1999 [2]).
Table 5.
Minimum discharge visible with win and speed of discharge (Data from Fingas et al., 1999 [2]).
| Wind | Speed of the Discharge Vessel in Knots (and Visibility Minimum in ppm) | |||||
|---|---|---|---|---|---|---|
| Beaufort | 2 | 4 | 6 | 8 | 12 | 16 |
| 0 | 50 | - | - | 100 | - | 100 |
| 0 | 100 | - | 250 | 250 | 250 | - |
| 1 | 50 | 50 | 50 | 75 | 150 | 200 |
| 1 | - | - | - | 100 | - | - |
| 2 | 67 | 87 | 100 | 200 | - | - |
| 3 | - | 200 | - | 100 | - | 8500 |
| 4 | - | - | 300 | 300 | - | 8500 |
| 5 | 4500 | 4500 | 4500 | 2300 | - | - |
| 6 | - | 8000 | - | 4500 | - | - |
Table 6.
Four ways by which oil uptakes water.
| Type | Color | Typical Lifetime |
|---|---|---|
| Entrained | as oil, typically black, shiny | 2 to 7 days |
| Meso-stable | reddish until broken | 2 to 7 days |
| Stable | reddish | months |
| Unstable or does not uptake water | as oil, typically black | - |
Publisher’s Note: MDPI stays neutral with regard to jurisdictional claims in published maps and institutional affiliations. |
© 2021 by the author. Licensee MDPI, Basel, Switzerland. This article is an open access article distributed under the terms and conditions of the Creative Commons Attribution (CC BY) license (http://creativecommons.org/licenses/by/4.0/).
Share and Cite
MDPI and ACS Style
Fingas, M. Visual Appearance of Oil on the Sea. J. Mar. Sci. Eng. 2021, 9, 97. https://0-doi-org.brum.beds.ac.uk/10.3390/jmse9010097
AMA Style
Fingas M. Visual Appearance of Oil on the Sea. Journal of Marine Science and Engineering. 2021; 9(1):97. https://0-doi-org.brum.beds.ac.uk/10.3390/jmse9010097
Chicago/Turabian StyleFingas, Merv. 2021. "Visual Appearance of Oil on the Sea" Journal of Marine Science and Engineering 9, no. 1: 97. https://0-doi-org.brum.beds.ac.uk/10.3390/jmse9010097
Note that from the first issue of 2016, this journal uses article numbers instead of page numbers. See further details here.