
Genome-Wide Marker Analysis for Traits of Economic Importance in Asian Seabass Lates calcarifer


1
GenCology Research Centre, University of the Sunshine Coast, Locked Bag 4, Maroochydore, QLD 4558, Australia
2
School of Science, Technology and Engineering, University of the Sunshine Coast, Maroochydore, QLD 4558, Australia
*
Author to whom correspondence should be addressed.
J. Mar. Sci. Eng. 2021, 9(3), 282; https://0-doi-org.brum.beds.ac.uk/10.3390/jmse9030282
Submission received: 17 January 2021
/
Revised: 18 February 2021
/
Accepted: 26 February 2021
/
Published: 5 March 2021
(This article belongs to the Special Issue Genomic Prediction and Functional Genomics in Aquaculture)
Abstract
:To date, it is not known whether animal breeding values in Asian seabass (Lates calcarifer) can be estimated using single nucleotide polymorphisms (SNPs) generated from new high-throughput genotyping by sequencing platforms. The principal aim of the present study was to assess the genomic prediction accuracy for growth traits, survival, cannibalism, and disease resistance against Streptococcus iniae in this species L. calcarifer. Additionally, this study attempted to identify markers associated with the five traits studied as well as to understand if the genotype data can be used to estimate genetic parameters for these complex traits. The genomic best linear unbiased prediction (gBLUP) method was used to analyze 11,084 SNPs and showed that the prediction accuracies for growth traits (weight and length) were high (0.67–0.75). By contrast, these estimates for survival were low (0.25). Multi-locus mixed model analyses identified four SNPs significantly associated with body weight (p < 5 × 10⁻⁸ or −log10 p ≥ 5). There were, however, no significant associations detected for other traits. Similarly, the SNP heritability was moderate, while the estimates for other traits were approximated to zero and not significant. Genetic correlations between body weight and standard length were close to unity. Collectively, the results obtained from this study suggest that genotyping by sequencing platforms can provide informative DNA markers to conduct genome-wide association analysis, estimation of genetic parameters, and evaluation of genomic prediction accuracy for complex traits in Asian seabass.
1. Introduction
A genetic improvement program for Asian seabass (Lates calcarifer) was established in 2007 to improve traits of economic importance for this species [1]. As the first step of any selective breeding program, we conduct a quantitative genetic analysis of a range of traits. Our restricted maximum likelihood (REML) analysis using a mixed model methodology framework showed that there are heritable genetic variations for growth traits (weight and length), survival during the grow-out phase, cannibalism, and disease resistance to Streptococcus iniae [2]. These results suggest that there are prospects to improve these traits through conventional quantitative genetic selection, especially for growth traits, as evidenced in several studies ranging from fish [3] to crustaceans [4] and mollusk [5,6]. Despite these significant improvements in growth traits, the conventional selective breeding approach is less effective for traits with low heritability (e.g., cannibalism) or traits that are difficult and expensive to measure, e.g., disease resistance. While the former traits require substantial phenotype and pedigree data to obtain a reasonable level of accuracy for selection, genetic improvement for disease traits involves challenge tests that are costly, time-consuming, and concerning biosecurity issues. In this regard, gene- or marker-assisted selection can be considered to improve genetic progress made in these traits.
Over the past decades, several attempts have been made to search for genes or DNA markers involved with complex traits (e.g., growth, survival, or disease resistance) in Asian seabass. For instance, Xia et al. [6] studied Asian seabass populations to map quantitative trait loci (QTL) for omega-fatty acids. Some other studies mapped QTLs for resistance to iridovirus in this species using genotyping-by-sequencing [7] and resistance against viral nervous necrosis (VNN) disease [8]. Recent genome-wide association studies have identified loci associated with growth [9] or VNN resistance [10]. There were also attempts to characterize polymorphisms in candidate genes associated with growth (e.g., prolactin gene) [11] or the LECT2 gene associated with resistance to the big belly disease in Asian seabass [12], as well expression profiling of mitochondrial antiviral signaling adapter in this species [13].
However, to date, no studies have been conducted to understand SNP association with disease resistance against Streptococcus iniae and cannibalism in Asian seabass. It is also necessary to understand whether single nucleotide polymorphisms can be used to predict breeding values for quantitative traits of commercial importance in this species. There has been a lack of published information regarding the utilization of genotype data (i.e., SNPs markers) to estimate genetic parameters for these complex traits in seabass.
The present study had three main aims: (i) estimating heritability and genetic correlations for five traits of economic importance in Asian seabass, including body weight, standard length, survival, cannibalism, and resistance to Streptococcus iniae, (ii) identifying markers associated with these complex traits; and (iii) assessing genomic prediction accuracy for the five traits studied. The overall aim of the study was to explore molecular genetic options to increase genetic progress made for these traits in the breeding program for Asia seabass.
2. Materials and Methods
2.1. Fish Samples
Fin tissue samples of 188 individual fish were from 28 families (16 full- and 12 half-sibs) produced in the second generation of an Asian seabass population, which has been undergoing 8-year selection (or two generations) for increased body weight [1]. The experimental fish were produced in 2017 by single-pair mating (one male to one or two females) using the induced breeding method. After hatching, larvae of each family were reared in a separate tank (1 m3) and fed rotifer for the first 15 days and subsequently on a commercial pellet feed (55% crude protein). The water parameters during this rearing period were averaged at 27 °C, salinity of 33.4g L−1, pH of 8.2, and dissolved oxygen level of 5.2 mg L−1. When they reached about 20–25 g, about 60 fingerlings were randomly sampled from each family for physical tagging using a passive integrated transponder (PIT). After tagging, the fish from all families were pooled and conditioned without food for 2–3 days and then transferred to sea cages (4 × 4 × 2.5 m) and tanks (200 m3 with a water depth of 1.5 m) for communal grow-out. Fish of all families were represented in both culture environments. During grow-out in sea cage, the fish were fed pellets (3–5% of total body mass) for two weeks and then trash fish, whereas only commercial feeds (45% protein) were used in tanks. The grow-out period was about 17–18 months. At harvest, pedigree and phenotypic information were recorded on individual fish. In this study, five important economic traits were considered as detailed below.
2.2. Traits Studied
Growth-related traits: Two main growth traits were considered here, namely, body weight and standard length. Both weight and length were measured at five different time points as described by Khang et al. [1]. In this study, only body weight and length at 180 dph were analyzed as they had the most complete data records.
Survival: Survival was recorded during the grow-out from stocking to harvest (580 dph) and was expressed as a binary trait (0 = missing or dead fish at harvest and 1 = alive or present at harvest). Due to a subset of fish samples used in this study, family data were used for this trait.
Cannibalism: Cannibalism data were recorded during the fingerling rearing phase at three different experimental times (0–10 d, 11–20 d, and 21–30 d). This trait was calculated as a percentage of the number of fish eaten to the total animals at stocking [14]. In this study, the cannibalistic rate throughout the entire experimental period from 0–30 d was analyzed. As individual data were not available for this trait, the family mean was used in our analysis.
Disease resistance: A total of 6835 fish from 64 full- and half-sib families produced in 2014/2015 and 2017 were challenge tested with Streptococcus iniae using the injection method. The resistance data were measured as survival rate over a 15-d period [2]. In a similar manner to cannibalism, disease resistance data were not available for individual fish, and, hence, there were only family data for this trait.
As family information was used for survival, cannibalism, and disease resistance, the data showed continuous variation, and they were analyzed using a linear mixed model.
2.3. DNA Extraction, Preparation of Libraries, and Sequencing
DNA samples were extracted, quantified, and purified using a commercial kit, following a standard procedure in our laboratory at the University of the Sunshine Coast (USC). The samples were sent to Diversity Array Technology Pty Ltd. (DArT), Canberra, Australia for SNP genotyping based on the genome complexity reduction method (DArTseq). The DArTseq protocol used for this study was previously described in Nguyen et al. [15]. SNP data obtained in this study were developed de novo for Asian seabass. The data were then mapped to the genome assembly of the Asian seabass population [16] to chromosome level. All SNP analyses were conducted in DArTSoft. SNP genotypes used in the present study were scored as 0 = homozygous for major allele; 1 = heterozygous; and 2 = homozygous for the minor allele. Sample and markers statistics are given in Supplementary Table S1.
2.4. Genome-Wide Association Study (GWAS)
Multi-locus mixed models were used to scan genome-wide markers for association analysis. Our earlier study [17] showed that the mixed model is more powerful than principal component analysis (PCA)-based correction since it can account for pairwise allele sharing among all study samples (Supplementary Figure S1A–D). The multi-locus mixed model included the systematic fixed effects of family origin (wild native fish or F1 animals produced in the first generation of the breeding program) and culture environment (sea cage and tank), and the random effect of an individual animal. The kinship matrix calculated from the genotype data (i.e., 11,084 SNPs) was used to model covariances between the individual animals. In all GWAS analyses, multiple testing corrections considering false discovery rate (FDR) methods were used to minimize type I errors (i.e., SNPs declared were significant, but they were not present) and type II errors (or proportions of false positives), respectively. In this study, the corrected significant level was set at 0.5 × 10⁻⁸, a very high level of stringency like GWAS studies in humans. In addition, the genome-wide significance thresholds (1%) based on 1000 permuted datasets were used to screen significantly associated SNPs. All GWAS analyses used the SNP & SVS Suite.
2.5. Genomic Prediction
The genomic best linear unbiased prediction (gBLUP) method was used as described in our earlier studies [15]. In brief, BLUP family methods assume normally distributed SNPs with equal variance. The same model as that used in GWAS analysis was used to analyze the traits studied. In addition, the normalized genomic relationship matrix (G) was calculated using the Genome-wide Complex Trait Analysis (GTCA) method [18]. The genomic prediction accuracy of the gBLUP model was defined as the correlations between the predicted breeding values and actual phenotypes () divided by the square root of the trait heritability. The trait heritabilities were calculated from the gBLUP model; they were the observed heritability for the traits studied. The correlations () were determined as the average value after five-fold cross-validation and 20 iterations. All analyses were conducted using the SNP & SVS Suite [19].
Additionally, a total of 11,084 SNPs were analyzed using Blast and Blast2go to understand the gene ontology (GO) of the markers.
3. Results
3.1. Phenotypic Data
The average body weight of the fish used for genotyping by sequencing was 281 g (Table 1). The survival rate of the population was about 57.5%. Cannibalism during juvenile rearing was remarkable in Asian seabass (~31%). The challenge test used to assess resistance to Streptococcus iniae resulted in 43.5% mortality over the 15-day experimental period. Consistent with our previous results, barramundi grew faster in sea cage than in the tank (371.5 vs. 200.5 g, respectively); the difference in body weight between the two culture systems was statistically significant (p < 0.01).
3.2. Heritability and Correlation
Genetic parameters (heritability and correlations) for body weight, standard length, survival, cannibalism, and disease resistance to Streptococcus iniae were estimated from the genotype data (Table 1). The SNP heritability for body weight was moderate (0.26 ± 0.05). By contrast, the SNP heritability for other traits was close to zero and not significant, given the high standard errors of the estimates.
In agreement with our estimate obtained from the pedigree and phenotype REML analysis, the genetic correlation between body weight and the standard length was close to one (0.97 ± 0.12) (Results not tabulated), suggesting that the genetic covariances between growth traits are not independent. The genetic correlations between body weight with other traits (survival, cannibalism, and disease resistance) were not estimable, likely due to the limited trait data information used in the analysis.
3.3. SNPs Associated With Traits of Economic Importance
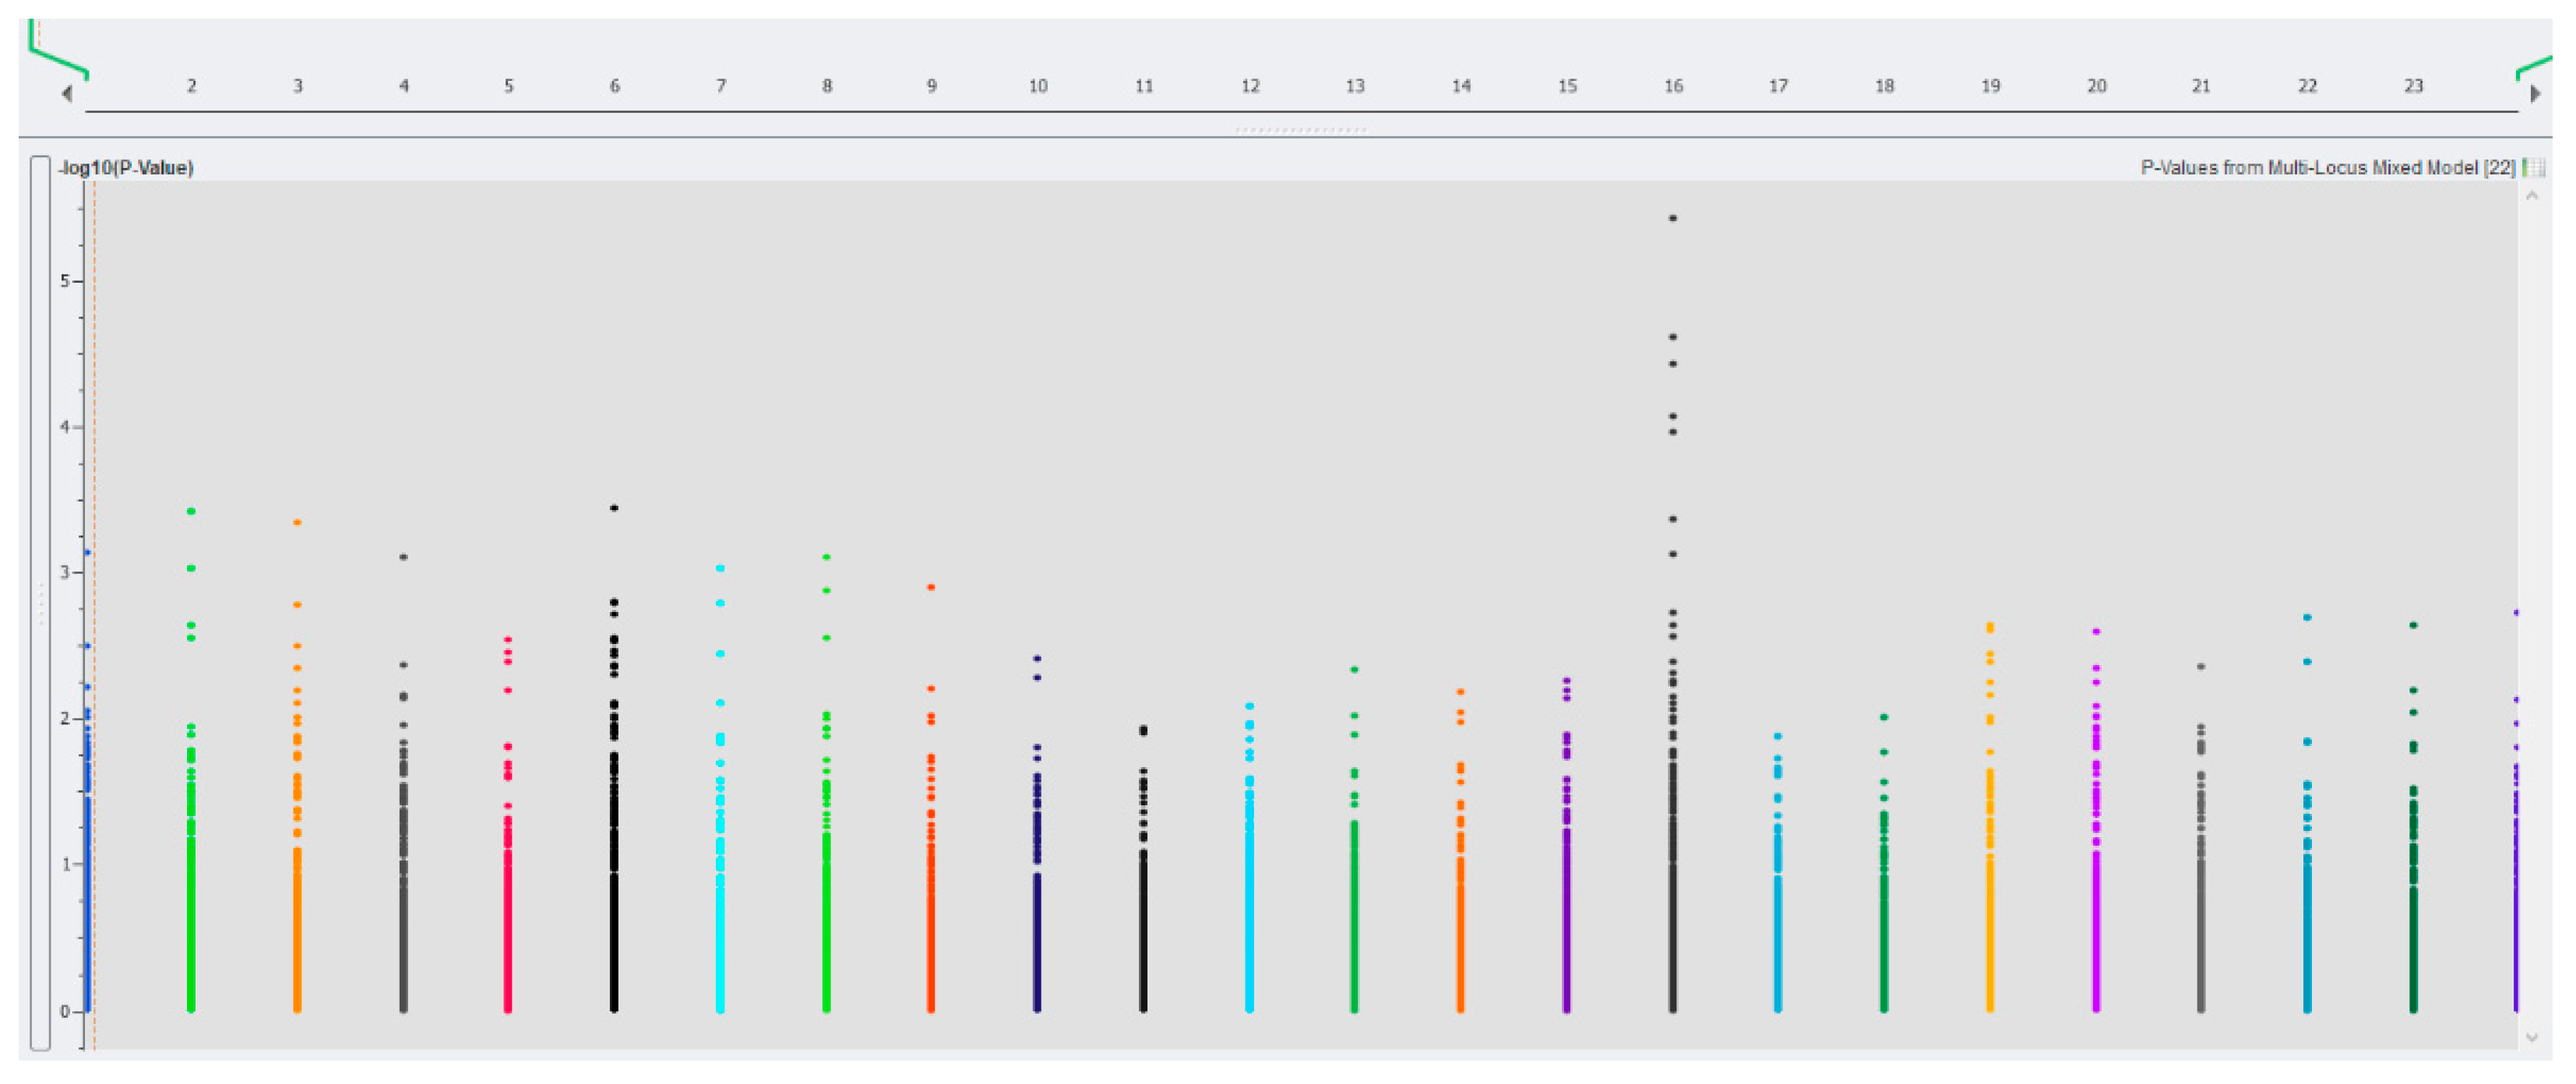
The genome-wide associations of SNPs with a body weight of 180 dph are graphically presented in Figure 1. At a very high stringent threshold (p < 5 × 10⁻⁸ or −log10 p-value > 5), the multi-locus mixed model analysis showed that one SNP located on chromosome 16 (at position 11: C > T) was significantly associated with body weight (Manhattan plot, Figure 1). The other two SNPs (also on chromosome 16 at positions 60: A > G and 25: G > A, respectively) were marginally significant. In addition, three different markers (chromosomes 11, 15, and 17) were also detected at −log10 p-value > 5 when PCA-based correction methods were analyzed (Supplementary Table S2). The minor allelic frequency for these SNPs was from 0.22 to 0.48, indicating that they are common variants. However, when the significant level was set at −log10 (p-value) > 5, there was, however, no significant association between SNPs and survival, cannibalism, and disease resistance to Streptococcus iniae (Supplementary Figure S2A–C). The number of common variants identified by different statistical methods is given in Supplementary Figure S3.
3.4. Accuracy of Genomic Prediction
Table 1 presents the five-fold cross-validation accuracies of the genomic predictions for all of the traits studied. The prediction accuracy was assessed by correlating genomic breeding values and the phenotypes after adjustments for the fixed effects. When expressing genomic predictions relative to the trait heritability, the prediction accuracies varied within a range of from 0.25 (survival) to 0.78 (body weight). Across traits, the prediction accuracy estimated from the gBLUP model was somewhat higher than those obtained from pedigree BLUP (e.g., 0.76 for body weight).
4. Discussion
Three main findings obtained from this study include (i) a reasonable high level of genomic prediction accuracy for growth traits (weight and length), (ii) significant SNPs associated with growth traits, and (iii) genetic parameters estimated using genotype information. A detailed discussion of these results is presented below.
4.1. Genomic Prediction
Our results obtained from the gBLUP model indicate that the accuracy of the genomic prediction depends on the genetic architecture of the traits studied. The accuracy was high for body weight; however, the estimates for traits with low heritability (survival) were low. These results should be validated in future studies using non-parametric methods (e.g., Bayesian approaches) when more data are collected. The increased sample size will enable the analysis of the data at the individual level for survival, cannibalism, and disease resistance, using advanced statistical (e.g., threshold) models. Due to the limited sample size of the present study, the prediction accuracy, especially for survival in our study, was somewhat lower than those reported in other aquaculture species, such as Atlantic salmon [20] or yellowtail kingfish [15]. This can be attributed to the limited sample size of the reference (discovery) population used in our study. It has been well documented that the accuracy of genomic prediction increased with the size of the reference population. Thus, when resources are permitted, a greater number of barramundi fish should be sequenced to improve the accuracy of genomic prediction, especially for the resistance to Streptococcus iniae. Published information reporting the genomic prediction accuracy is low to moderate (0.36 to 0.71) for a range of infectious diseases in fish species, namely resistance to amoebic gill disease in Atlantic salmon [21], resistance to infectious pancreatic necrosis virus in rainbow trout [22,23], resistance to viral nervous necrosis in European sea bass [24] or resistance to photobacteriosis in gilthead sea bream [25] or Hepatopancreatic parvovirus (HPV) disease in white shrimp [26]. When taken together, these results suggest the potential application of genomic selection to improve quantitative traits in Asian seabass. However, further data testing and cost-benefit analysis should be conducted prior to the implementation of genomic selection in practical breeding programs.
4.2. Significant Markers
Our multi-locus mixed model identified three SNPs significantly associated with body weight. However, the three SNPs explained only a small proportion of variation in body weight, summing up only 3.51%. Our additional analysis using the gBLUP method as described above found that the allele substitution effects of these SNPs were also small (0.392–0.533). These SNPs are likely new markers involved with growth; hence, gene names for these markers are not available. However, our functional analysis of whole SNPs showed that 12 markers (p < 0.05 to 0.001) are linked to genes with known functions (e.g., growth hormone) (Supplementary Table S3). Other studies in Asian seabass reported loci or polymorphisms in candidate genes responsible for growth; examples of the candidate’s genes related to growth in Asian seabass are FTO, IFABP, or ACOX1 [9,27]
On the other hand, the important candidate genes linked with growth in Asian seabass or other fish species were not detected via our genome scan, largely due to the limited sample size used here in our analysis. The gene ontology (GO) distribution of our markers is given in Supplementary Figure S4. Recent genome-wide association studies also detected variants or markers for body weight in rainbow trout [28] or for bacterial kidney disease [29], resistance to amoebic gill disease [21], and resistance to sea lice [30] in Atlantic salmon. These results give possibilities to continue searching for genes with moderate or large effects to assist selection for improved health and production performance of Asian seabass.
4.3. Genetic Parameters
The genotype data also enabled the estimation of genetic parameters for the five traits studied. However, the SNP heritability was smaller than those obtained from our pedigree and phenotype analysis using the REML linear mixed model [1,2,14]. Thus, the genotype data (low density and only genotyped individuals) used here did not fully explain all the genetic variation in complex traits in Asian seabass. The “missing” heritability involves a range of intrinsic factors from genetics to environment, gene by environment interaction, and epigenetics [31]. However, our results show a consistent trend, that is, the heritability for body weight was moderate, while the estimates for survival, cannibalism, and disease resistance were low [14].
Interestingly, the gBLUP mixed model analysis obtained a close-to-one genetic correlation between body weight and length, which is consistent with the REML analysis [1]. This is also observed in a different study in banana shrimp in which the genetic correlations estimated from SNPs data had similar signs and direction to those obtained from pedigree and phenotype analysis [26]. These results suggest that genotyping by sequencing can provide informative markers to understand genetic relationships among complex traits in fish and aquaculture species.
4.4. Practical Implications
Genomic selection is of practical significance in a barramundi or Asian seabass due to the long generation interval (3–4 years) of this species. Reducing half of the generation time will double genetic gain for a trait of interest, as predicted from the breeder equation. Furthermore, our study also shows there are possibilities for applying a multi-trait selection program for this species. Almost all breeding programs in aquaculture species have focused on growth, and many research studies have examined a single individual trait only. Based on the genetic parameter estimates obtained here and from previous studies, a multi-trait genomic selection program can maximize the productivity of this Asian seabass population. This is evidenced through a simulation study in which the breeding objectives included two main traits, namely, body weight and survival, and genetic response to genomic selection can be achieved in 7 to 12% per generation, respectively.
5. Conclusions
Results from this study showed that the DArT sequencing platform provided informative genotypes (i.e., SNPs markers) to conduct genomic prediction, association analysis, and estimation of genetic parameters. First, the accuracies of genomic prediction for growth traits (weight and length) were moderate to high, whereas these values for survival traits were low. Second, our genome-wide association analysis identified four markers significantly associated with body weight (p < 5 × 10⁻⁸) across the methods used. However, there were no significant SNPs associations with other traits (survival, cannibalism, and disease resistance). Third, the genotype data enabled the estimation of genetic parameters for the five traits studied. The SNP heritability for body weight was moderate, whereas the estimates for other traits were not significant. Our results also suggest that sequencing a greater number of individuals and families to increase the sample size and additional analyses using Bayesian approaches or machine learning should be conducted to validate the prediction accuracy, especially for traits with low heritability. The analyses of the survival, cannibalistic, and disease-resistant data should be carried out at the individual level, considering advanced statistical methods (e.g., threshold model) when more data are accumulated. Furthermore, a larger sample size is also needed to increase statistical power to detect significant associations between markers and traits. Our present results provide initial information towards understanding the genomic basis of quantitative traits in Asian seabass.
Supplementary Materials
The following are available online at https://0-www-mdpi-com.brum.beds.ac.uk/2077-1312/9/3/282/s1, Table S1: Basic statistics of single nucleotide polymorphisms (SNPs), Table S2: Number of SNPs (N) and false discovery rates (FDR) for traits studied (p < 5 × 10⁻⁸ or −log10 p ≥ 5), Table S3: A list of significant SNPs (p < 0.01) linked to candidate genes with known functions for body weight, Figure S1: A–D: Q–Q plots for body weight (A), survival (B), cannibalism (C), and disease resistance (D). Lambda values close to one for all traits, Figure S2: A–C: The Manhattan plot showing the −log10 (p-values) of SNPs on cannibalism (top), survival (middle), and disease resistance (bottom) using a multi-locus mixed model, Figure S3: Venn diagram to show common SNPs involved with body weight, using four different statistical methods: (1) Correlation/trend test, (2) correlation with PCA corrections, (3) regression with PCA corrections, and (4) multi-locus mixed model at a significant level of p < 0.001 or −log10 (p) > 3, Figure S4: Gene ontology distribution of 11,084 SNPs used in the study.
Author Contributions
Conceptualization, N.H.N. and P.V.K.; methodology, N.H.N. and P.V.K.; software, N.H.N. and P.V.K.; validation, N.H.N. and P.V.K.; formal analysis, N.H.N.; investigation, P.V.K.; resources, P.V.K.; data curation, P.V.K.; writing—original draft preparation, P.V.K.; writing—review and editing, N.H.N.; visualization, P.V.K.; supervision, N.H.N.; project administration, N.H.N.; funding acquisition, P.V.K. All authors have read and agreed to the published version of the manuscript.
Funding
This research was funded by the Ministry of Agriculture and Rural Development, Vietnam grant number KHCN2013, and the APC was funded by MDPI.
Informed Consent Statement
Not applicable.
Acknowledgments
This study was supported by the School of Science and Engineering and GeneCology Research Center of the University of the Sunshine Coast. The breeding program for Asian seabass was funded by the Ministry of Agriculture and Rural Development, Vietnam. The authors would like to thank the Marine Culture Center of RIA3 for providing facility, staff, and technical assistance in managing the animal and sample collection. We also extend our sincere thanks to Truong Ha Phuong, Vice director of RIA3, for his support.
Conflicts of Interest
The authors declare no conflict of interest.
References
- Khang, P.V.; Phuong, T.H.; Dat, N.K.; Knibb, W.; Nguyen, N.H. An 8-Year Breeding Program for Asian Seabass Lates calcarifer: Genetic Evaluation, Experiences, and Challenges. Front. Genet. 2018, 9, 191. [Google Scholar] [CrossRef] [PubMed]
- Khang, P.V.; Nha, V.V.; Nguyen, N.H. Resistance to Streptococcus iniae and its genetic associations with traits of economic importance in Asian seabass (Lates calcarifer). J. Fish Dis. 2019, 42, 1657–1666. [Google Scholar] [CrossRef] [PubMed]
- Nguyen, N.H.; Hamzah, A.; Thoa, N.P. Effects of genotype by environment interaction on genetic gain and genetic parameter estimates in Red Tilapia (Oreochromis spp.). Front. Genet. 2017, 8, 82. [Google Scholar] [CrossRef] [Green Version]
- Hung, D.; Vu, N.T.; Nguyen, N.H.; Ponzoni, R.W.; Hurwood, D.A.; Mather, P.B. Genetic response to combined family selection for improved mean harvest weight in giant freshwater prawn (Macrobrachium rosenbergii) in Vietnam. Aquaculture 2013, 412, 70–73. [Google Scholar] [CrossRef]
- In, V.V.; Sang, V.V.; O’Connor, W.; Van, P.T.; Dove, M.; Knibb, W.; Nguyen, N.H. Are strain genetic effect and heterosis expression altered with culture system and rearing environment in the Portuguese oyster (Crassostrea angulata)? Aquac. Res. 2017, 48, 4058–4069. [Google Scholar] [CrossRef]
- Xia, J.H.; Lin, G.; He, X.; Yunping, B.; Liu, P.; Liu, F.; Sun, F.; Tu, R.; Yue, G.H. Mapping quantitative trait loci for omega-3 fatty acids in Asian seabass. Mar. Biotechnol. 2014, 16, 1–9. [Google Scholar] [CrossRef]
- Wang, L.; Bai, B.; Huang, S.; Liu, P.; Wan, Z.Y.; Ye, B.; Wu, J.; Yue, G.H. QTL mapping for resistance to iridovirus in Asian seabass using genotyping-by-sequencing. Mar. Biotechnol. 2017, 19, 517–527. [Google Scholar] [CrossRef] [PubMed]
- Liu, P.; Wang, L.; Wong, S.-M.; Yue, G.H. Fine mapping QTL for resistance to VNN disease using a high-density linkage map in Asian seabass. Sci. Rep. 2016, 6, 32122. [Google Scholar] [CrossRef] [PubMed] [Green Version]
- Xia, J.H.; Lin, G.; He, X.; Liu, P.; Liu, F.; Sun, F.; Tu, R.; Yue, G.H. Whole genome scanning and association mapping identified a significant association between growth and a SNP in the IFABP-a gene of the Asian seabass. BMC Genom. 2013, 14, 295. [Google Scholar] [CrossRef] [Green Version]
- Wang, L.; Liu, P.; Huang, S.; Ye, B.; Chua, E.; Wan, Z.Y.; Yue, G.H. Genome-wide association study identifies loci associated with resistance to viral nervous necrosis disease in Asian seabass. Mar. Biotechnol. 2017, 19, 255–265. [Google Scholar] [CrossRef] [PubMed]
- He, X.; Xia, J.; Wang, C.; Pang, H.; Yue, G. Significant associations of polymorphisms in the prolactin gene with growth traits in Asian seabass (Lates calcarifer). Anim. Genet. 2012, 43, 233–236. [Google Scholar] [CrossRef]
- Fu, G.H.; Bai, Z.Y.; Xia, J.H.; Liu, X.J.; Liu, F.; Wan, Z.Y.; Yue, G.H. Characterization of the LECT2 gene and its associations with resistance to the big belly disease in Asian seabass. Fish Shellfish Immunol. 2014, 37, 131–138. [Google Scholar] [CrossRef] [PubMed]
- Krishnan, R.; Babu, P.G.; Jeena, K.; Tripathi, G.; Prasad, K.P. Molecular characterization, ontogeny and expression profiling of mitochondrial antiviral signaling adapter, MAVS from Asian seabass Lates calcarifer, Bloch (1790). Dev. Comp. Immunol. 2018, 79, 175–185. [Google Scholar] [CrossRef] [PubMed]
- Pham, V.K.; Truong, H.P.; Nguyen, D.K.; Nguyen, N.H. Genetic component of cannibalism in Asian seabass Lates Calcarifer. Appl. Anim. Behav. Sci. 2020, 231. [Google Scholar] [CrossRef]
- Nguyen, N.H.; Premachandra, H.; Kilian, A.; Knibb, W. Genomic prediction using DArT-Seq technology for yellowtail kingfish Seriola lalandi. BMC Genom. 2018, 19, 107. [Google Scholar] [CrossRef]
- Vij, S.; Kuhl, H.; Kuznetsova, I.S.; Komissarov, A.; Yurchenko, A.A.; Van Heusden, P.; Singh, S.; Thevasagayam, N.M.; Prakki, S.R.S.; Purushothaman, K.J.P.g. Chromosomal-level assembly of the Asian seabass genome using long sequence reads and multi-layered scaffolding. PLoS Genet. 2016, 12, e1005954. [Google Scholar] [CrossRef] [Green Version]
- Nguyen, N.H.; Rastas, P.M.; Premachandra, H.; Knibb, W. First high-density linkage map and single nucleotide polymorphisms significantly associated with traits of economic importance in Yellowtail Kingfish Seriola lalandi. Front. Genet. 2018, 9, 127. [Google Scholar] [CrossRef]
- Yang, J.; Lee, S.H.; Goddard, M.E.; Visscher, P.M. GCTA: A tool for genome-wide complex trait analysis. Am. J. Hum. Genet. 2011, 88, 76–82. [Google Scholar] [CrossRef] [Green Version]
- SNP & Variation Suite™ (Version 8.9.0) [Software]. Golden Helix, Inc.: Bozeman, MT, USA. Available online: http://www.goldenhelix.com (accessed on 5 March 2021).
- Tsai, H.-Y.; Hamilton, A.; Tinch, A.E.; Guy, D.R.; Gharbi, K.; Stear, M.J.; Matika, O.; Bishop, S.C.; Houston, R.D. Genome wide association and genomic prediction for growth traits in juvenile farmed Atlantic salmon using a high density SNP array. BMC Genom. 2015, 16, 969. [Google Scholar] [CrossRef] [Green Version]
- Robledo, D.; Matika, O.; Hamilton, A.; Houston, R.D. Genome-wide association and genomic selection for resistance to amoebic gill disease in Atlantic salmon. G3 Genes Genomes Genet. 2018, 8, 1195–1203. [Google Scholar] [CrossRef] [Green Version]
- Barria, A.; Christensen, K.A.; Yoshida, G.M.; Correa, K.; Jedlicki, A.; Lhorente, J.P.; Davidson, W.S.; Yáñez, J.M. Genomic predictions and genome-wide association study of resistance against Piscirickettsia salmonis in coho salmon (Oncorhynchus kisutch) using ddRAD sequencing. G3 Genes Genomes Genet. 2018, 8, 1183–1194. [Google Scholar] [CrossRef] [Green Version]
- Yoshida, G.M.; Carvalheiro, R.; Rodríguez, F.H.; Lhorente, J.P.; Yáñez, J.M. Single-step genomic evaluation improves accuracy of breeding value predictions for resistance to infectious pancreatic necrosis virus in rainbow trout. Genomics 2019, 111, 127–132. [Google Scholar] [CrossRef] [Green Version]
- Palaiokostas, C.; Cariou, S.; Bestin, A.; Bruant, J.-S.; Haffray, P.; Morin, T.; Cabon, J.; Allal, F.; Vandeputte, M.; Houston, R.D. Genome-wide association and genomic prediction of resistance to viral nervous necrosis in European sea bass (Dicentrarchus labrax) using RAD sequencing. Genet. Sel. Evol. 2018, 50, 30. [Google Scholar] [CrossRef] [Green Version]
- Aslam, M.L.; Carraro, R.; Bestin, A.; Cariou, S.; Sonesson, A.K.; Bruant, J.-S.; Haffray, P.; Bargelloni, L.; Meuwissen, T.H.E. Genetics of resistance to photobacteriosis in gilthead sea bream (Sparus aurata) using 2b-RAD sequencing. BMC Genet. 2018, 19, 43. [Google Scholar] [CrossRef] [PubMed]
- Nguyen, N.H.; Phuthaworn, C.; Knibb, W. Genomic prediction for disease resistance to Hepatopancreatic parvovirus and growth, carcass and quality traits in Banana shrimp Fenneropenaeus merguiensis. Genomics 2020, 112, 2021–2027. [Google Scholar] [CrossRef] [PubMed]
- Wang, L.; Wan, Z.Y.; Bai, B.; Huang, S.Q.; Chua, E.; Lee, M.; Pang, H.Y.; Wen, Y.F.; Liu, P.; Liu, F. Construction of a high-density linkage map and fine mapping of QTL for growth in Asian seabass. Sci. Rep. 2015, 5, 16358. [Google Scholar] [CrossRef] [PubMed] [Green Version]
- Neto, R.V.R.; Yoshida, G.M.; Lhorente, J.P.; Yáñez, J.M. Genome-wide association analysis for body weight identifies candidate genes related to development and metabolism in rainbow trout (Oncorhynchus mykiss). Mol. Genet. Genom. 2019, 294, 1–9. [Google Scholar]
- Holborn, M.K.; Ang, K.P.; Elliott, J.; Powell, F.; Boulding, E.G. Genome wide association analysis for bacterial kidney disease resistance in a commercial North American Atlantic salmon (Salmo salar) population using a 50 K SNP panel. Aquaculture 2018, 495, 465–471. [Google Scholar] [CrossRef]
- Robledo, D.; Gutierrez, A.P.; Barria, A.; Lhorente, J.P.; Houston, R.D.; Yáñez, J.M. Discovery and functional annotation of quantitative trait loci affecting resistance to sea lice in Atlantic salmon. Front. Genet. 2019, 10, 56. [Google Scholar] [CrossRef] [Green Version]
- Manolio, T.A.; Collins, F.S.; Cox, N.J.; Goldstein, D.B.; Hindorff, L.A.; Hunter, D.J.; McCarthy, M.I.; Ramos, E.M.; Cardon, L.R.; Chakravarti, A. Finding the missing heritability of complex diseases. Nature 2009, 461, 747. [Google Scholar] [CrossRef] [Green Version]
Figure 1.
Genome-wide association of SNPs and body weight at 180 dph using a multi-locus mixed model (Y-axis represents the −log10 (p-values) and X-axis represents chromosome of Asian seabass). The proportions of variation explained by the three most significant SNPs were 1.9, 1.6, and 0.01%, with a total of 3.51%.


Table 1.
Number of observations (n), mean, standard deviation (SD), coefficient of variation (CV, %), single nucleotide polymorphism (SNP) heritability, and accuracy of genomic prediction for traits studied.
Table 1.
Number of observations (n), mean, standard deviation (SD), coefficient of variation (CV, %), single nucleotide polymorphism (SNP) heritability, and accuracy of genomic prediction for traits studied.
| Trait | Unit | n | Mean | SD | CV | SNP Heritability | Accuracy |
|---|---|---|---|---|---|---|---|
| Weight | g | 187 | 281.0 | 131.2 | 46.7 | 0.26 ± 0.15 | 0.78 |
| Length | cm | 187 | 27.5 | 4.3 | 15.8 | 0.07 ± 0.11 | 0.67 |
| Survival | % | 184 | 57.5 | 13.9 | 32.8 | 0.01 ± 0.07 | 0.25 |
| Cannibalism | % | 184 | 30.6 | 10.1 | 33.0 | 0.05 × 10⁻³ ± 0.09 | n.e. |
| Disease resistance | % | 184 | 57.5 | 13.9 | 24.2 | 0.01 ± 0.08 | n.e. |
Weight and length at 180 d ph, family mean data for survival during the grow-out phase, cannibalism during fingerling rearing, and disease resistance to Streptococcus iniae. There were missing values for all traits; n.e. = not estimable due to non-convergence.
Publisher’s Note: MDPI stays neutral with regard to jurisdictional claims in published maps and institutional affiliations. |
© 2021 by the authors. Licensee MDPI, Basel, Switzerland. This article is an open access article distributed under the terms and conditions of the Creative Commons Attribution (CC BY) license (http://creativecommons.org/licenses/by/4.0/).
Share and Cite
MDPI and ACS Style
Nguyen, N.H.; Van Khang, P. Genome-Wide Marker Analysis for Traits of Economic Importance in Asian Seabass Lates calcarifer. J. Mar. Sci. Eng. 2021, 9, 282. https://0-doi-org.brum.beds.ac.uk/10.3390/jmse9030282
AMA Style
Nguyen NH, Van Khang P. Genome-Wide Marker Analysis for Traits of Economic Importance in Asian Seabass Lates calcarifer. Journal of Marine Science and Engineering. 2021; 9(3):282. https://0-doi-org.brum.beds.ac.uk/10.3390/jmse9030282
Chicago/Turabian StyleNguyen, Nguyen Hong, and Pham Van Khang. 2021. "Genome-Wide Marker Analysis for Traits of Economic Importance in Asian Seabass Lates calcarifer" Journal of Marine Science and Engineering 9, no. 3: 282. https://0-doi-org.brum.beds.ac.uk/10.3390/jmse9030282
Note that from the first issue of 2016, this journal uses article numbers instead of page numbers. See further details here.