1. Introduction
Rubble mound breakwaters are coastal structures that play a fundamental role in creating safety conditions in ports by reducing sea agitation in their sheltered areas. They enable favorable conditions for the permanence and berthing of ships and small boats and can also contribute to the non-accumulation of sediment, responsible for the conditioning of navigation. A rubble mound breakwater consists mainly of the core and the main and secondary armor, interior (leeward side) and exterior (seaward side), the armors being constituted by the material of significant weight to maintain the stability of the breakwater. The core consists of material of extensive granulometry, with the objective of controlling the transmission of energy resulting from the breaking of the waves and guaranteeing the stability of the armors. In case of need, filters are installed between the core and the armor to prevent core material to escape through the gaps in the armor pieces. Another important part in rubble mound breakwater is the crown wall, installed in its upper part. This superstructure (crown wall) can enable an important reduction in overtopping [
1] and resistance to wave action, allowing an increase in the top level of the complete structure without compromising the financial viability of the construction process.
The superstructures of rubble mound breakwaters are usually made of concrete or masonry and are based directly on top of them. From a constructive point of view, in the case of superstructures with curtain walls, the great advantage is that the presence of a superstructure allows the height of the edge of the outer armor of the slope to be reduced, which results in less financial expense in armor rock or concrete pieces for the constitution of the armors, filters and core and consequently, less environmental impact due to the use of materials existing in the breakwater construction area [
2].
From a structural point of view, due to their own weight and the friction generated between the base and the foundation material, the superstructures also guarantee the greater stability of the armor’s constituent materials [
3]. In matters of functionality, and in view of rubble mound breakwater solutions without a superstructure, the presence of a superstructure allows accessibility for maintenance purposes and the installation of elements for monitoring the behavior and conservation status of the constituent elements of breakwater [
4].
In recent decades, the effects of climate change have become evident in the coastal environment throughout the world [
5], a key condition being that of the sea level rise [
6,
7,
8]. This sea level rise is not uniform in all regions of the planet so each particular case must be studied to determine the value of this rise and its possible impact on coastal structures. In view of the worsening conditions of maritime unrest in the context of climate change, it is becoming increasingly important to study the forces to which the superstructures of the slope breakwaters are and will be subjected, both to ensure their correct dimensioning and guarantee efficient rehabilitation processes, since it is intended to guarantee the conditions of stability of these structural elements throughout their useful life.
This paper summarizes the results of forces and moments in crown wall superstructures due to wave conditions considering some of the equations sanctioned by practice: (1) Jensen (1984) and Bradbury et al. (1998); (2) Günback and Gökce (1984); (3) Martin et al. (1999); (4) Berenguer and Baonza (2006); and (5) Pedersen (1996) and Nørgaard et al. (2013). The formulation proposed by Molines et al. [
9] was not considered because in this case study, the percentage of breakwater overtopping is 12.3%, so the results are not comparable with those of the rest of the formulas used in the research. Anyway, the Molines et al. equation should be used in the case where the overtopping rates match their research test conditions.
For that, the state of the art of those equations are explained in the second section of the paper (Methods).
Section 3 includes the description of the case study, the Ericeira rubble mound breakwater in Portugal, the meteocean data and the different scenarios considered in this study, including not only the current case, but also some of them associated with the sea level rise due to the climate change, and the possible damage of the armor layer losing the upper concrete piece.
The consideration of all these scenarios allows to obtain some important conclusions comparing the forces, moments, and security factors of the current scenario, similarly to the original design of the crown wall, the ones due to the sea level rise caused by climate change, and the ones due to the damage of the upper part of the armor layer.
Section 4 exposes the results of the application of the five equations to the case study and for the different scenarios.
Section 5 includes some comparisons between all the results exposed in
Section 4, and conclusions are summarized in
Section 6.
2. Methods
This manuscript aimed to compare the results of the application of the different existing equations for the design of crown walls in a specific location. In addition, to determine which of the expressions best fits the original state of the design, it will also determine if the design is adequate for the change in metocean conditions in different damage scenarios.
The actions on the superstructures of the rubble mound breakwaters are essentially due to the interaction between the sea waves and the breakwater, that is, the interaction of waves with the outer armor and the superstructure resulting in pressures and consequently, forces and moments. As the wave approaches a breakwater, the depth decreases and its steepness increases [
10].
If the Iribarren number in deep waters and considering peak period (ξ
0p) value is greater than 3, the breaking due to the depth effect occurs, which means that the wave has already broken at the foot of the breakwater. This scenario is favorable from the functional point of view as it allows to a priori disregard a situation of wave breaking directly on the breakwater superstructure. If there is no depth breaking, it is still possible to determine empirically whether the breaking occurs directly on the superstructure or on the outer armor through the relation between the relative width of the berm of the outer main armor layer, B
e/H, and its relative height, A
c/H as it is indicated in [
11].
On the other hand, it is important to verify if waves break before reaching the slope of the breakwater. One of the most used equations for that verification is:
This parameter represents the maximum wave height compatible with the depth without any breaking due to the seabed. Considering Hs as the significant wave height measured at the foot of the breakwater, if Hs > Hr it is assumed that the break occurs before the wave reaches the breakwater, thus allowing the possibility of a break to be excluded on the superstructure.
Run-up, R
u, is the phenomenon that occurs after the wave breaks and translates, in the case of slope breakwater, as the rise of the water mass associated with the wave over the main outer armor. R
u is thus defined as the distance measured vertically, between the maximum level reached by the wave on the armor layer and the sea level [
12]. This is one of the most important parameters in the design of a rubble mound breakwater, since it is based on its value that the crowning height, W
c, is defined, depending on whether the occurrence of overtopping (the occurrence of overtopping is verified if R
u > F
c), where Fc is the distance from the superstructure foundation in relation to the sea level [
13,
14]. Ru depends on the height and slope of the wave, the slope of the armor, and the permeability, roughness and porosity of the materials that make up the breakwater.
This research considers different equations for the design of the crown wall: (1) Jensen (1984) and Bradbury et al. (1998); (2) Günback and Gökce (1984); (3) Martin et al. (1999); (4) Berenguer and Baonza (2006); and (5) Pedersen (1996) and Nørgaard et al. (2013).
2.1. Jensen (1984) and Bradbury et al. (1988)
The formulation proposed by Bradbury, Allsop and Stephens (1988) was based on the results of the experimental work carried out by Jensen (1984) [
15]. It is thus an empirical formulation, resulting from the performance and analysis of test results on different types of sections and geometries of slope breakwater superstructures. By performing the tests on the different cross sections, Jensen verified the existence of a linearity relationship between the horizontal force induced by the wave in the superstructure crown wall, F
h, the significant wave height value, H
s, and the distance measured vertically between the sea level and the top of the outer main layer (A
c) [
4].
Bradbury, Allsop and Stephens (1988) [
16] proposed an equation that makes it possible to determine the horizontal force induced by the wave in the crown wall which is exceeded by only 0.1% of the waves of the sea states considered, F
h,0.1% [
4], considering the relationship of a line with two calibration parameters, a and b:
For the different standard section geometries considered, called A to E, the values of the empirical coefficients a and b were defined in
Table 1.
The vertical force induced by the wave at the base of the superstructure that is exceeded by only 0.1% of the waves of the sea states considered, Fb,0.1%, is obtained by assuming a linear and constant pressure distribution in the superstructure’s crown wall, and linear and triangular at the base of crown wall, with the continuity of pressures at the seaward side and zero pressure at the lee-ward side.
Given the pressure distributions assumed by the authors, the horizontal pressure acting on the crown wall, Ph, is given by the quotient between Fh,0.1% and hw. The vertical pressure acting on the base of the seaward side, Pv, is equal to Ph.
The validity limits to be considered in the application of the formulation were suggested by the authors according to the type of cross section tested. The limits of validity, as well as the type of geometry, parameter, and author to which they are associated, are presented in
Table 2.
2.2. Günbak and Gökce (1984)
Günbak and Gökce’s (1984) semi-empirical formulation [
3] was proposed considering the incidence of regular waves and the effect of run-up on the superstructure, thus allowing the vertical and horizontal pressures acting on the superstructure to be obtained.
In terms of pressure distribution in the superstructure, these authors assumed that the pressure acting on the crown wall corresponds to the sum of the dynamic pressure, P
d, with the hydrostatic pressure, P
hd, both in the area protected by the curtain edge and in the unprotected area. It was also assumed by the authors the linear variation of P
hd, occurring the maximum value at the level of the base of the superstructure. In turn, the dynamic pressure in the protected zone of the superstructure, P
d (p), corresponds to half of the dynamic pressure in the unprotected zone, P
d (np). The pressure at the base of the superstructure, P
b, has a triangular distribution and is zero at the lee-ward side (P
b (s)) [
3].
In this case, the different pressures on the superstructures are related to the run-up [
17,
18], R
u, and to the height of the armor berm, A
c. The authors also take into account the angle of the armor slope by subtracting the angle formed between the wave screen and the slope of the armor layer, whose value is 15°, assumed by the authors.
For the present formulation, R
u is obtained through:
The authors assumed the height of run-up exceeded by only 0.1% of the waves of the sea states considered, Ru,0.1%.
2.3. Martín et al. (1999)
The formulation proposed by Martín et al. (1999) [
14] is based on the concept of run-up suggested earlier by Günbak and Gökce (1984) and is only valid in situations where the wave breaks before the superstructure.
Based on tests performed on small-scale models, the present authors concluded that, for each breaker wave, the two pressure peaks in the superstructure, which occurred at different times, should be analyzed separately:
- –
First pressure peak: dynamic pressure (Pd);
- –
Second pressure peak: pseudo-hydrostatic or reflection pressure (Pph).
Based on the experimentally verified pressure distributions, the authors assumed the pressure diagrams presented as an assumption for the application of their suggested formulation, considering a triangular pressure distribution at the base of the superstructure of maximum value at seaward side at the first pressure peak and trapezoidal at the second.
As the separate analysis of the two pressure peaks is suggested, when applying the present formulation for sizing purposes, the authors suggest that the largest of the pressure valleys obtained between the first and second pressure peaks should be considered.
Pd values in the protected zone are lower in comparison to the values in the non-protected zone of the superstructure. The dynamic pressure in the protected zone of the superstructure, Pd (p) as a function of the z coordinate, being the vertical distance measured from the sea level, and λ, that is the adimensional parameter representative of the decrease in the dynamic pressure in the protected zone of the superstructure due to the constituent materials of the main outer armor. The range of values obtained experimentally for this coefficient varied between 0.25 and 0.65, being in competition with the decrease in dynamic pressure of 50% in the protected zone compared to the non-protected zone assumed by Jensen (1984) and Günback and Gökce (1984).
2.4. Berenguer and Baonza (2006)
The semi-empirical formulation of Berenguer and Baonza (2006) [
2] was developed based on the results of tests on small scale models with irregular wave action, obtained in 2001. Through the relationships established by the authors for the different geometric characteristics of the models tested and their agitation parameters, it was possible to obtain a time-dependent graphical representation of the horizontal pressures acting on the crown wall and vertical pressures acting on the base of the superstructure. By integrating the maximum pressure value into each diagram, it was possible to obtain the values of the horizontal force, F
x, and the vertical force, F
y.
The authors concluded, through the analysis of the pressure diagrams obtained, that the maximum horizontal force acting on the crown wall of the superstructure, Fx, max, occurred in a phased shift and later in time in relation to the maximum vertical force acting on the base of the superstructure, Fy, max. Even if this has been verified, the authors in the elaboration of the present formulation have assumed, in a conservative way, the action of both forces simultaneously.
Although the results of the tests have allowed the variation of the pressure in the superstructure as a function of time, the method developed only provides an approximation for the acting forces and moments.
2.5. Pedersen (1996) and Nørgaard et al. (2013)
Of a semi-empirical nature, the formulation proposed by Perdersen (1996) [
19,
20] was developed on the basis of the theory of Günbak and Gökce (1988) [
3] and the results of tests on small-scale models for different agitation conditions and mantle and superstructure geometries.
By carrying out different parametric analyses based on the results obtained in the tests, Pedersen concluded that the maximum forces generated in the crown wall of the superstructure were mainly due to the impact forces of the incident waves. Therefore, he proposed that the dynamic pressure, Pd, should be calculated as a kinetic pressure, resulting from the ascending velocity of the water mass at the time of run-up, v0, and disregarding the loss of energy by friction between the run-up height and the crest of the armor.
Based on the above conclusions, the author suggested a superstructure pressure distribution resulting only from dynamic pressure, assuming that the contribution of pseudo-hydrostatic pressure, Pph, was small and could be disregarded.
According to Pedersen (1996), R
u,0.1%, is calculated using the method suggested by Van der Meer and Stam (1992) [
21] for breakwater armors composed of permeable or non-permeable core rockfill and regular or irregular wave action. The linear pressure distribution at the base of the superstructure, exceeded only by 0.1% of the waves of the sea states, has a linear relationship with the dynamic pressure of the unprotected zone with the parameter V being the wave impact reduction parameter:
The parameter V results from the ratio between the volume of the crest of the outer main armor, V
1, and the volume of the hypothetical run-up, V
2. In cases of reduced run-up, the parameter V assumes a value lower than unit, reflecting the effect of the size of the top of the armor on the reduction in the impact imposed by the waves. In the opposite situation, the volume of water associated with run-up is large enough to make the consideration of the effect of reducing the impact of the waves negligible, in which case V is considered equal to the unit. In 2013, Nørgaard, Lykke-Andersen and Burcharth [
22] proposed a modification to the formulation of Pedersen (1996) with the aim of validating it for small depths, since it was originally limited to large and intermediate depths. The proposed modifications were based on the results of 162 tests on small scale models and irregular wave action, considering agitation conditions at large and small depths and using the same experimental equipment used by Pedersen (1996).
The first modification to the original formulation of Pedersen (1996) was made with respect to the Ru,0.1% level. For the Pd (np),0.1% and Pb (b),0.1% calculation expressions, no changes were suggested. For the calculation of Fh,0.1% the expression suggested by Pedersen (1996) was considered, but changing the empirical coefficient b, to b = 1. This modification was intended to bridge the differences of the new results obtained compared to those obtained by Pedersen (1996), which occurred in the readings carried out in the unprotected area of the superstructure curtain wall. These differences were due to the fact that the transducer used was different from that previously used by Pedersen (1996).
3. Case Study Description
In the following paragraphs, the section of the Ericeira rubble mound breakwater will be described, in which the design formulas stated in the previous section will be applied. The metocean data to be used have also been defined, as have the scenarios considered in the study.
3.1. Ericeira Rubble Mound Breakwater Description
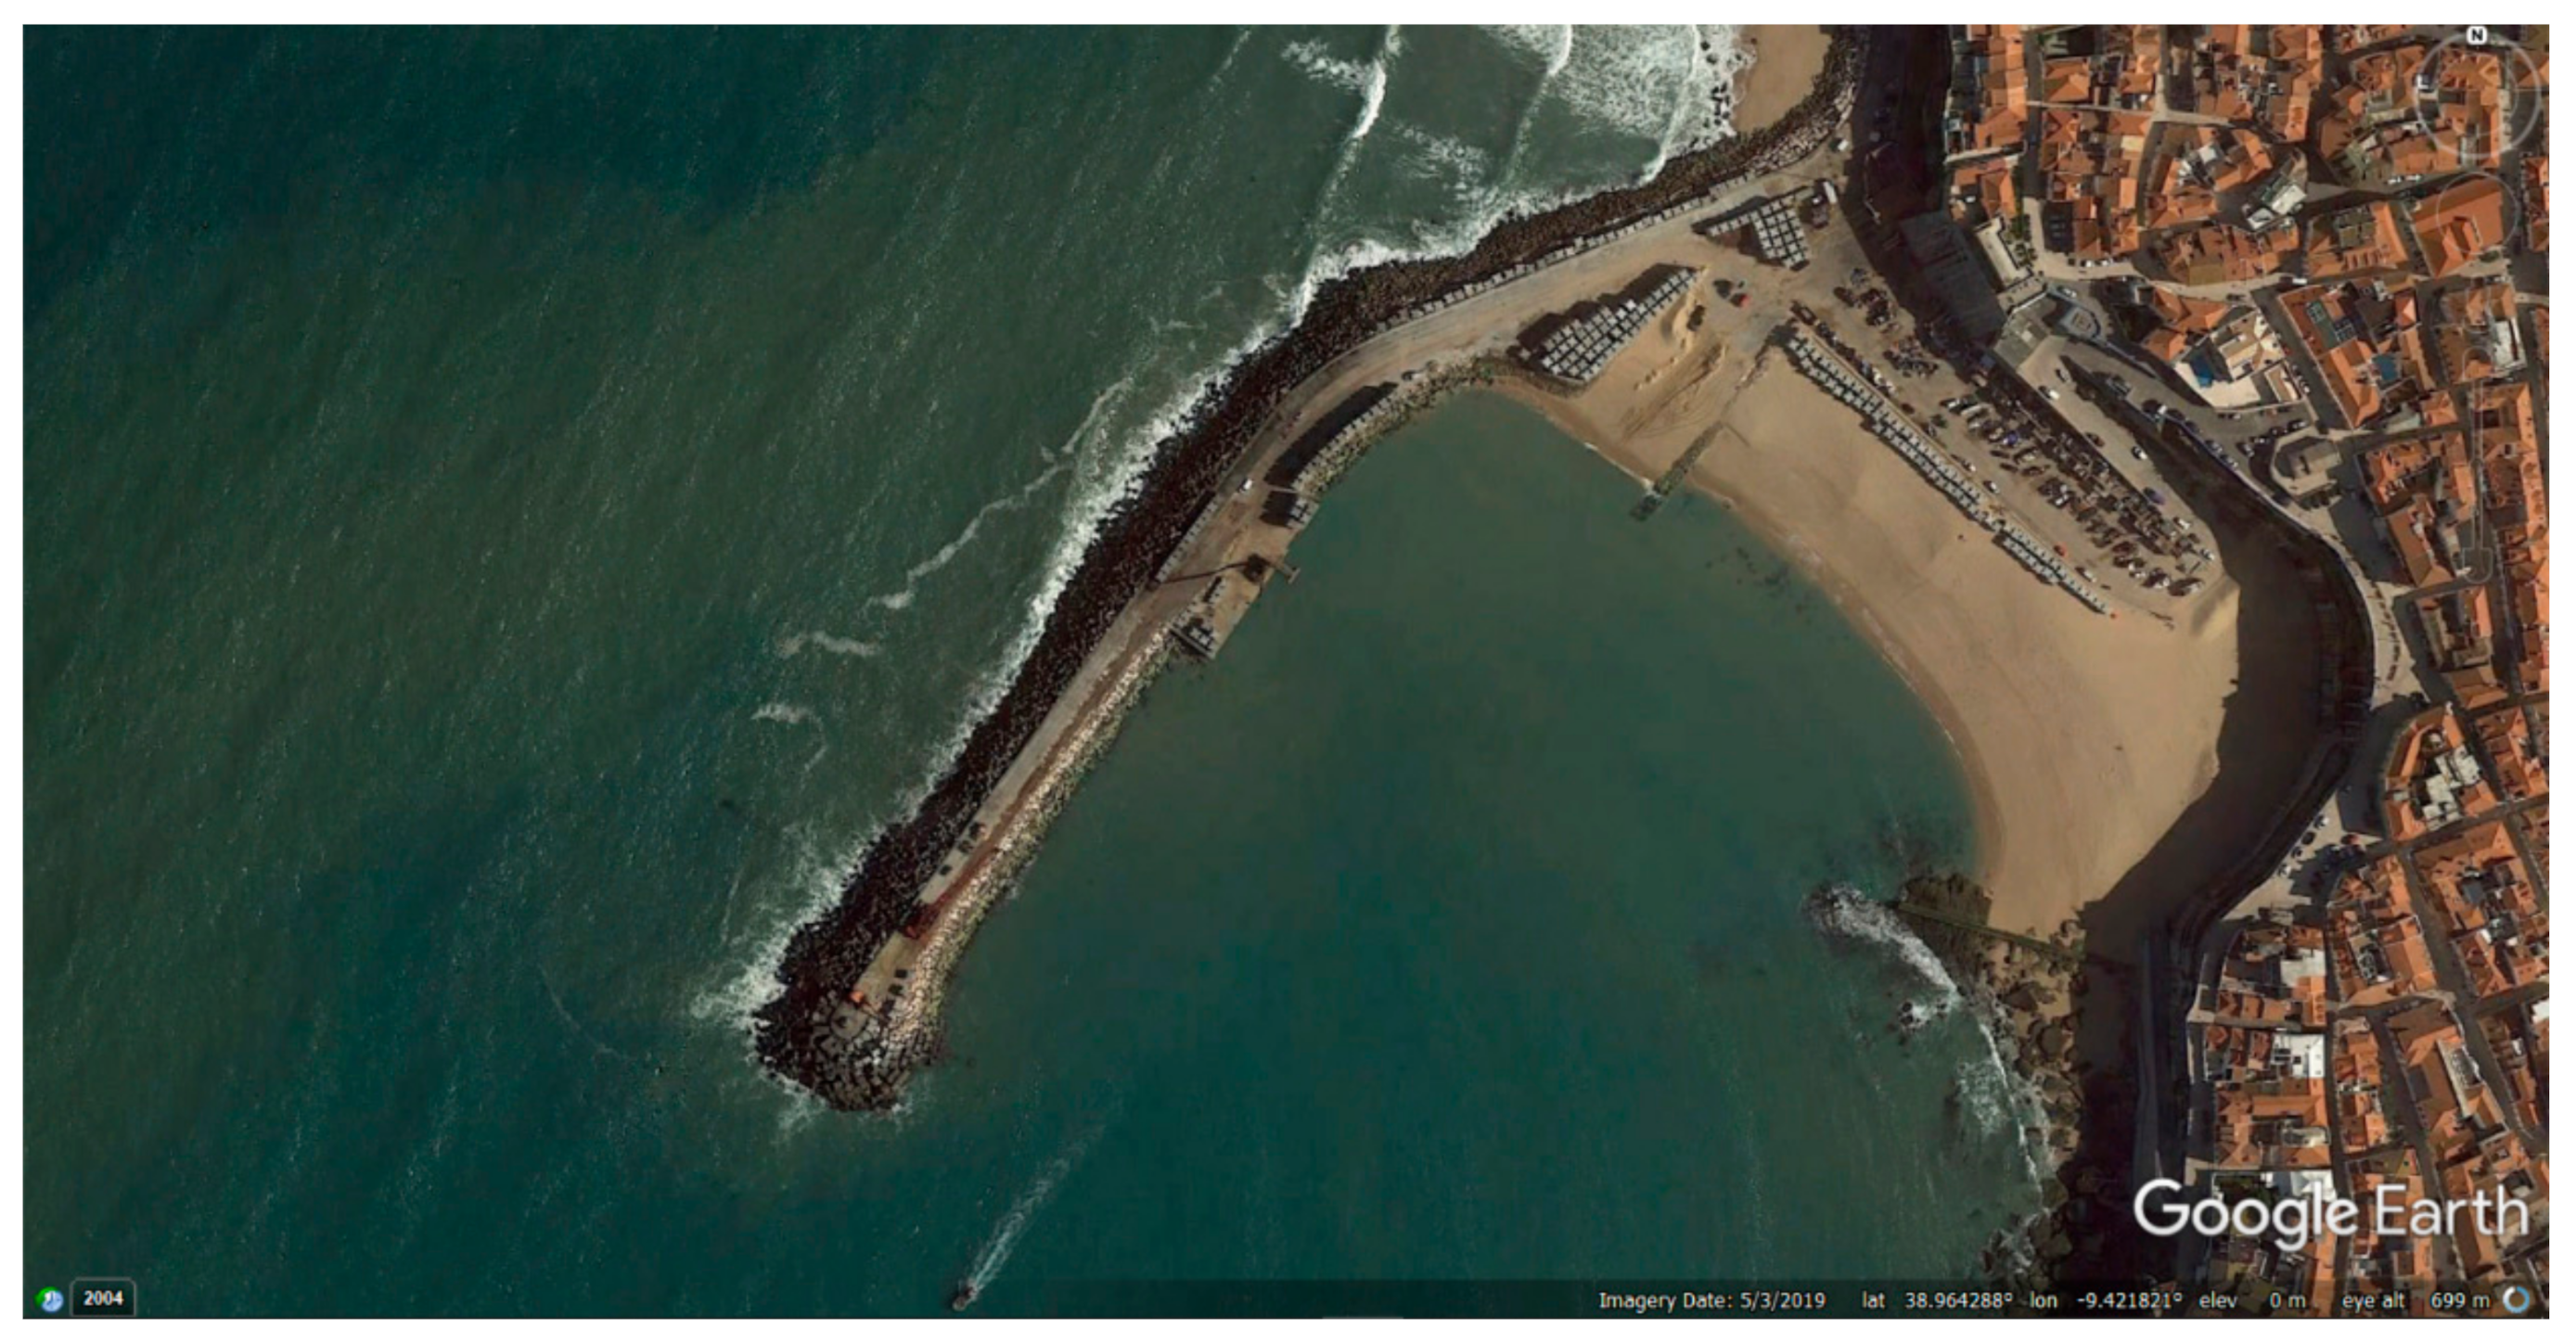
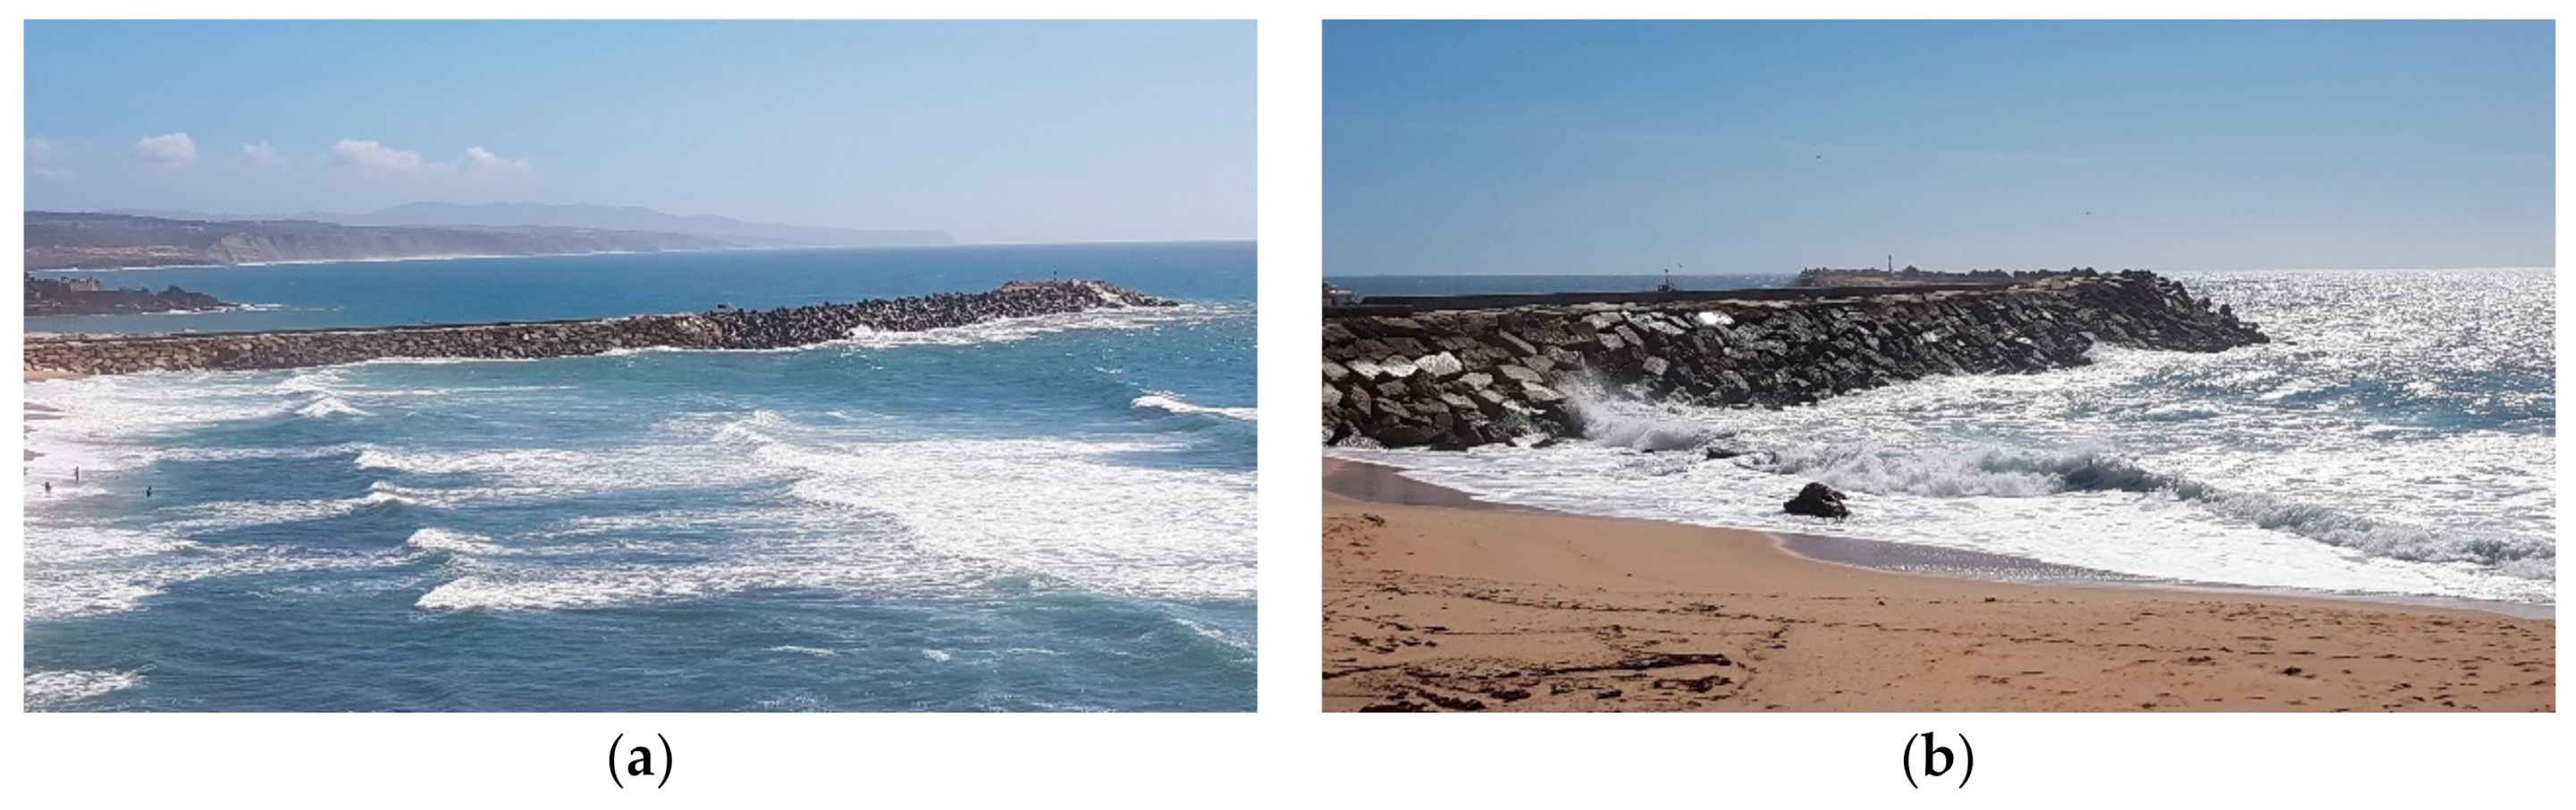
Ericeira rubble mound breakwater was built in the 1970s, on the west coast of mainland Portugal. Ericeira port has as main objective to provide shelter for a small artisanal fishing fleet. The breakwater of the port is 440 m long and has a slipway (
Figure 1 and
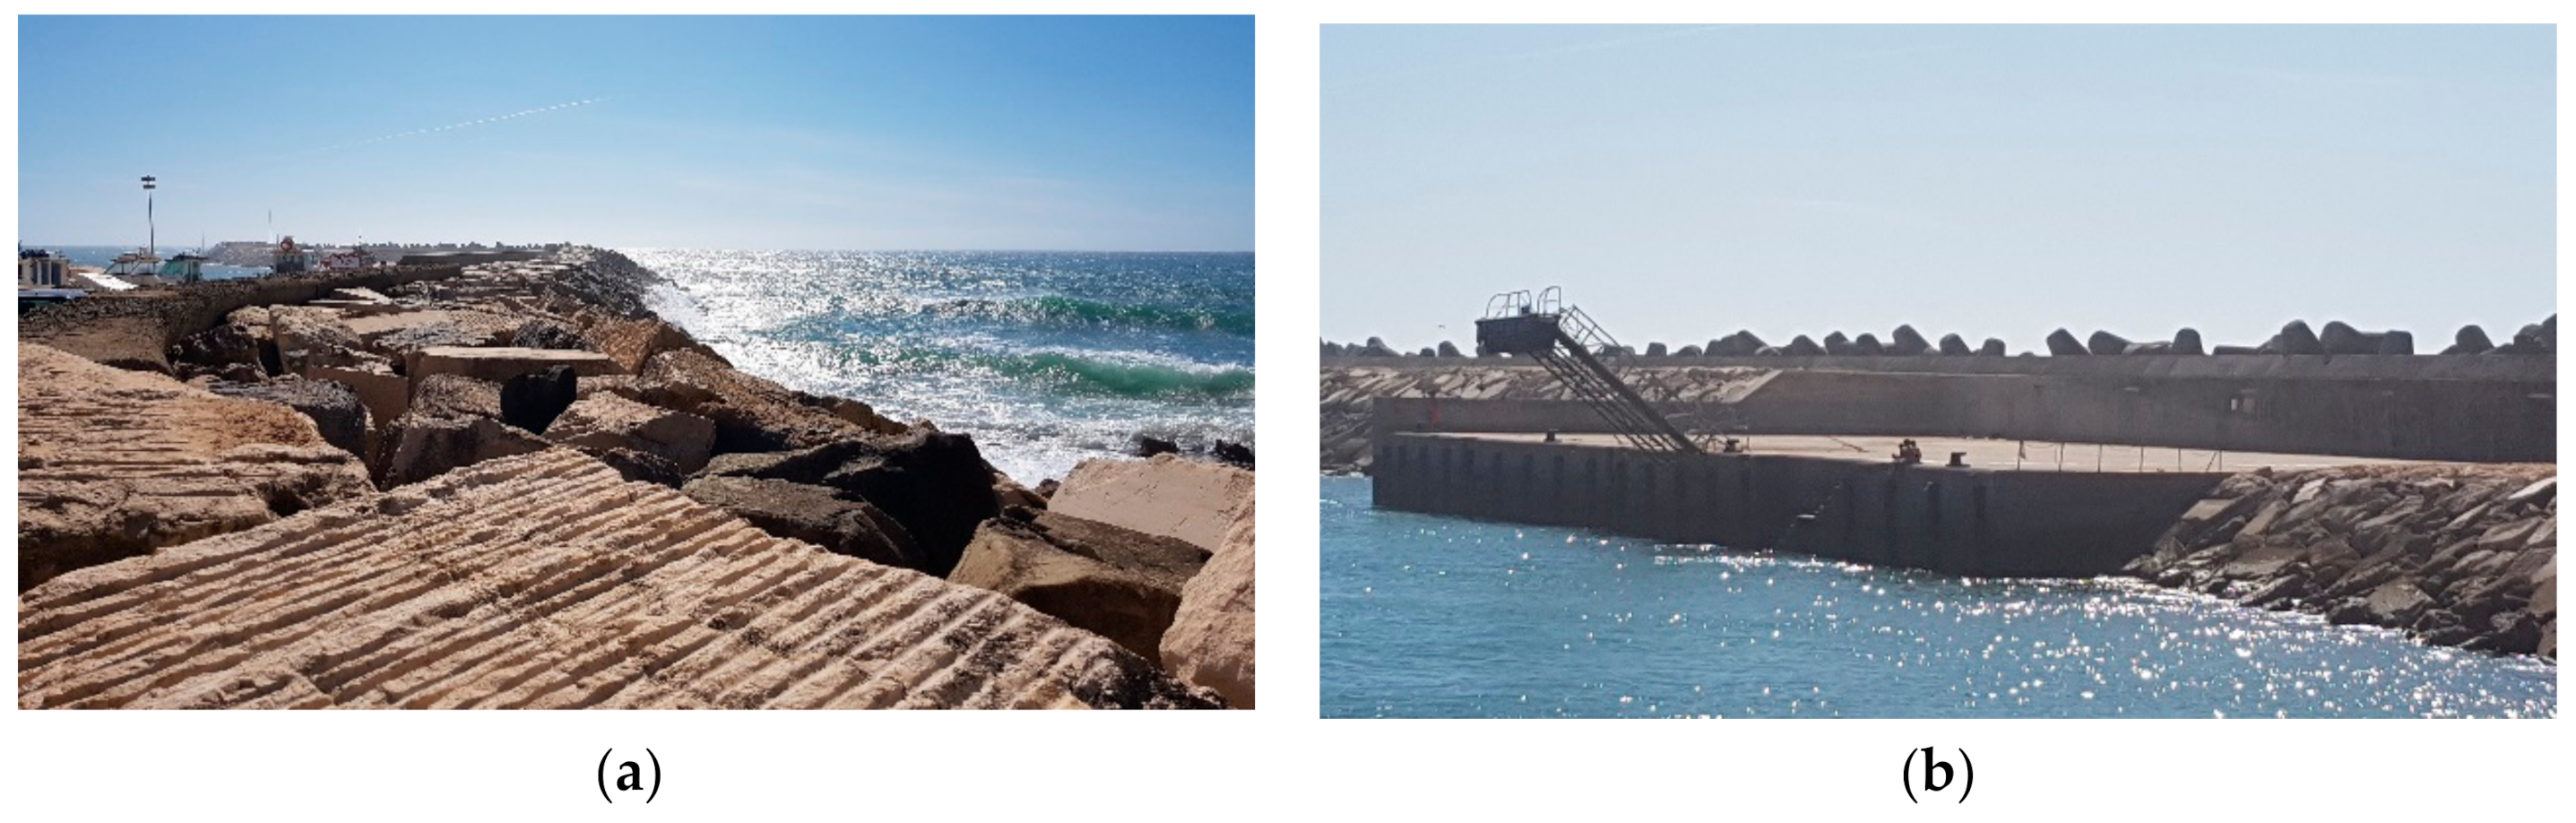
Figure 2). The breakwater suffered several damages during its useful life, the last intervention being in 2008, going through its total rehabilitation and requalification, since some 200 m of its length were in complete ruin and the remaining 240 m were in high condition of degradation. During the reparation phase, the breakwater was damaged again, being repaired again in March 2016.
For the current research, the P–P cross section was selected (
Figure 3). The selection of this profile was because it is one of the most critical parts for the operation of the port since it has an attached quay right on the side of that P–P profile protected against storms, and any failure would affect the use of the quay infrastructure.
The cross section is composed of three layers: outer armor of 300 kN tetrapods, filter of 20–40 kN riprap and a core of sand and gravel. On top of the breakwater, there is a crown wall which is made up by mass concrete.
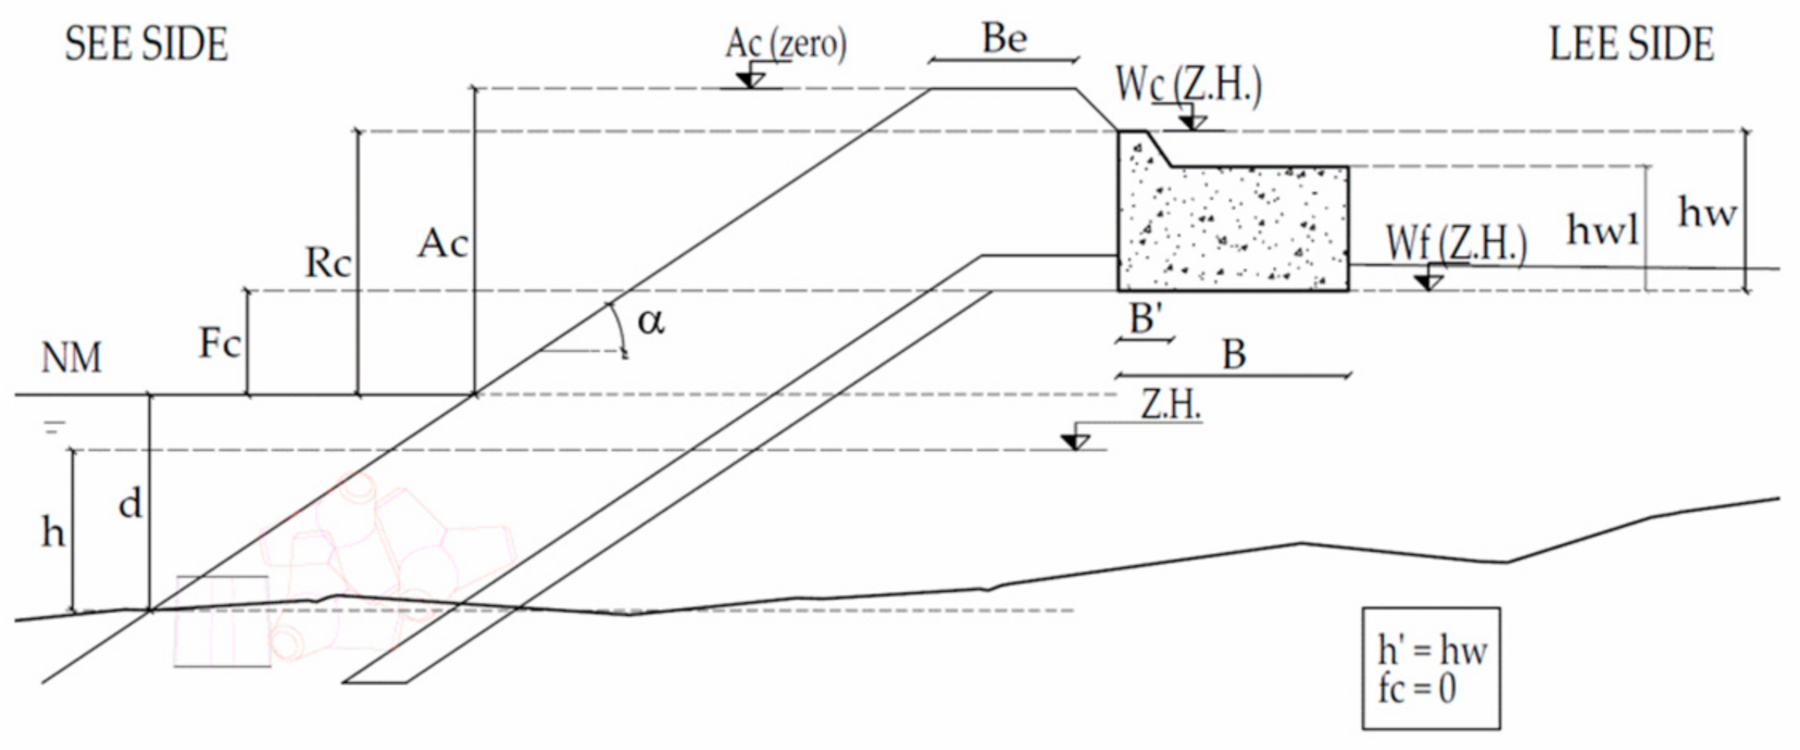
The main parameters and symbols of the geometry of the main outer armor of the rubble mound breakwater are included in
Figure 4:
Vertically measured distance between the sea level and the top of the crest of the outer main armor (Ac);
Crest width of the outer main armor layer (Be);
Slope of the outer main armor (α);
Depth at the toe of the breakwater (h).
The parameter Ac depends on the reference considered, that is, it corresponds to the distance, measured vertically, between the crowning edge and the hydrographic zero (ZH), or between this and the resting sea level/sea level (NR or NM). In terms of notation, the designation of Ac (zero) will be used for the first case since the level considered is the hydrographic zero (ZH). For the second case, the designation Ac will be used. The depth at the foot of the breakwater (h) is a measured distance from the ZH. The depth at the bottom of the breakwater measured in relation to sea level (NM) is called d.
In the case of superstructures where it is possible to make a clear distinction between the base and the curtain wall, the height of the superstructure base can also be defined. The geometric parameters of the superstructure must, therefore, be defined according to the geometry of the main outer armor, the set of which consists of (
Figure 4):
Height of the superstructure (hw);
Height of the base of the superstructure (hwl);
Crown wall width (B’);
Width of the base of the superstructure (B);
Freeboard of the superstructure (Wc);
Superstructure foundation level (Wf);
The top and foundation levels identified above are measured in relation to the hydrographic zero (ZH). Bearing in mind that the sea level (NM) is also measured in relation to ZH, subtracting the value of NM from the levels mentioned, it is possible to obtain the following distances using the NM as a reference level:
The height of the superstructure can be totally or partially protected by the edge of the outer main armor. In cases where it is partially protected, it is possible to define the measures fc and h’, which are, respectively, the height of the superstructure not protected by the shoulder of the outer main armor and the height of the superstructure protected by the shoulder of the outer main armor.
The main values of different parameters in the Ericeira P–P cross section are shown in
Table 3 and
Table 4.
3.2. Metocean Data
For calculation purposes, a data series on agitation and sea level [
23] at the toe of the breakwater corresponding to the period between 1 January 2009 and 31 December 2019 was considered. The approach selected for this research is to consider the real values of the waves over the breakwater and their effects over it during this period of time. The length of the data series has been chosen due to the fact that a breakwater repair was carried out in 2008, so the focus of the research is from the beginning of 2009.
Wave data were obtained using the results of a hindcast model, achieving spectral values of significant wave height (Hs), peak period (Tp), and wave directions (dirw). The data series corresponds to the sum of four daily measurements, every 6 h, during the period indicated above, making a total of 16,068 values for each of the parameters before mentioned (Hs, Tp, dirw).
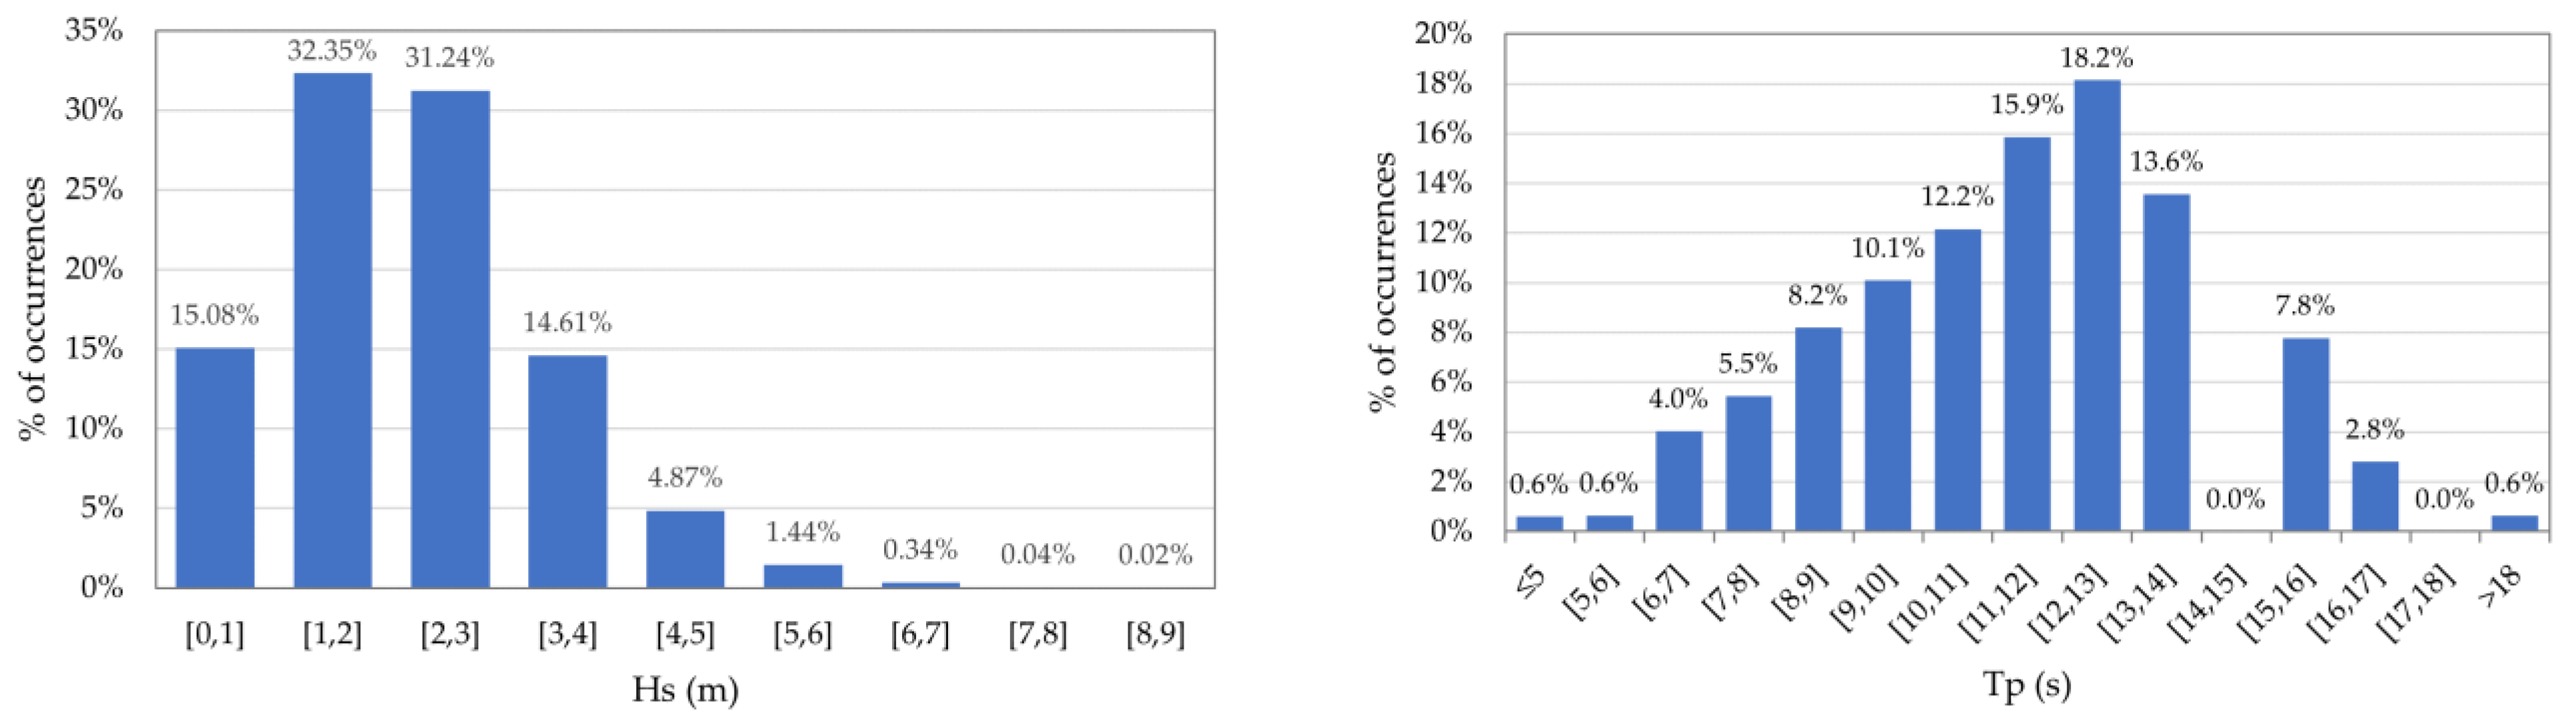
Given the 11 years of wave series hindcast data, it was found that the maximum value of H
s is 5.98 m, being the highest percentage of occurrences in the interval between 1 and 2 m with a total number of occurrences of 5198, which corresponds to approximately 33% of the total series (
Figure 5); here were 426 occurrences with H
s values greater than 4.5 m, a value normally used as a minimum for storm conditions, which correspond to 2.7%. Considering temporal cases in which H
s > 4.5 m during at least 1 day and considering those that occur with less than 0.75 as the same storm days apart, in these 11 years there have been 18 storms, with durations between 1 and 2.50 days. The maximum value of T
p is 20.4 s with the highest number of occurrences being between 12 and 13 s, with a total of 2919 occurrences, that is, approximately 18% (
Figure 5).
Relating the data of H
s and T
p, it was verified that as the values of H
s increase, there is also an increase in T
p (
Figure 6), which means that for the highest values of H
s, longer wavelengths are associated and consequently so are greater efforts on the superstructure [
19], since the wavelength depends on T
p by airy or linear wave theory.
On the other hand, to obtain the sea level corresponding to each wave data, the astronomical tide levels obtained by the XTide program [
24] were added to the respective values of the storm surge [
23], thus obtaining the sea levels considered for the purpose calculation. Storm surge values correspond to a drop or rise in astronomical tide levels according to the increase or decrease in atmospheric pressure, respectively.
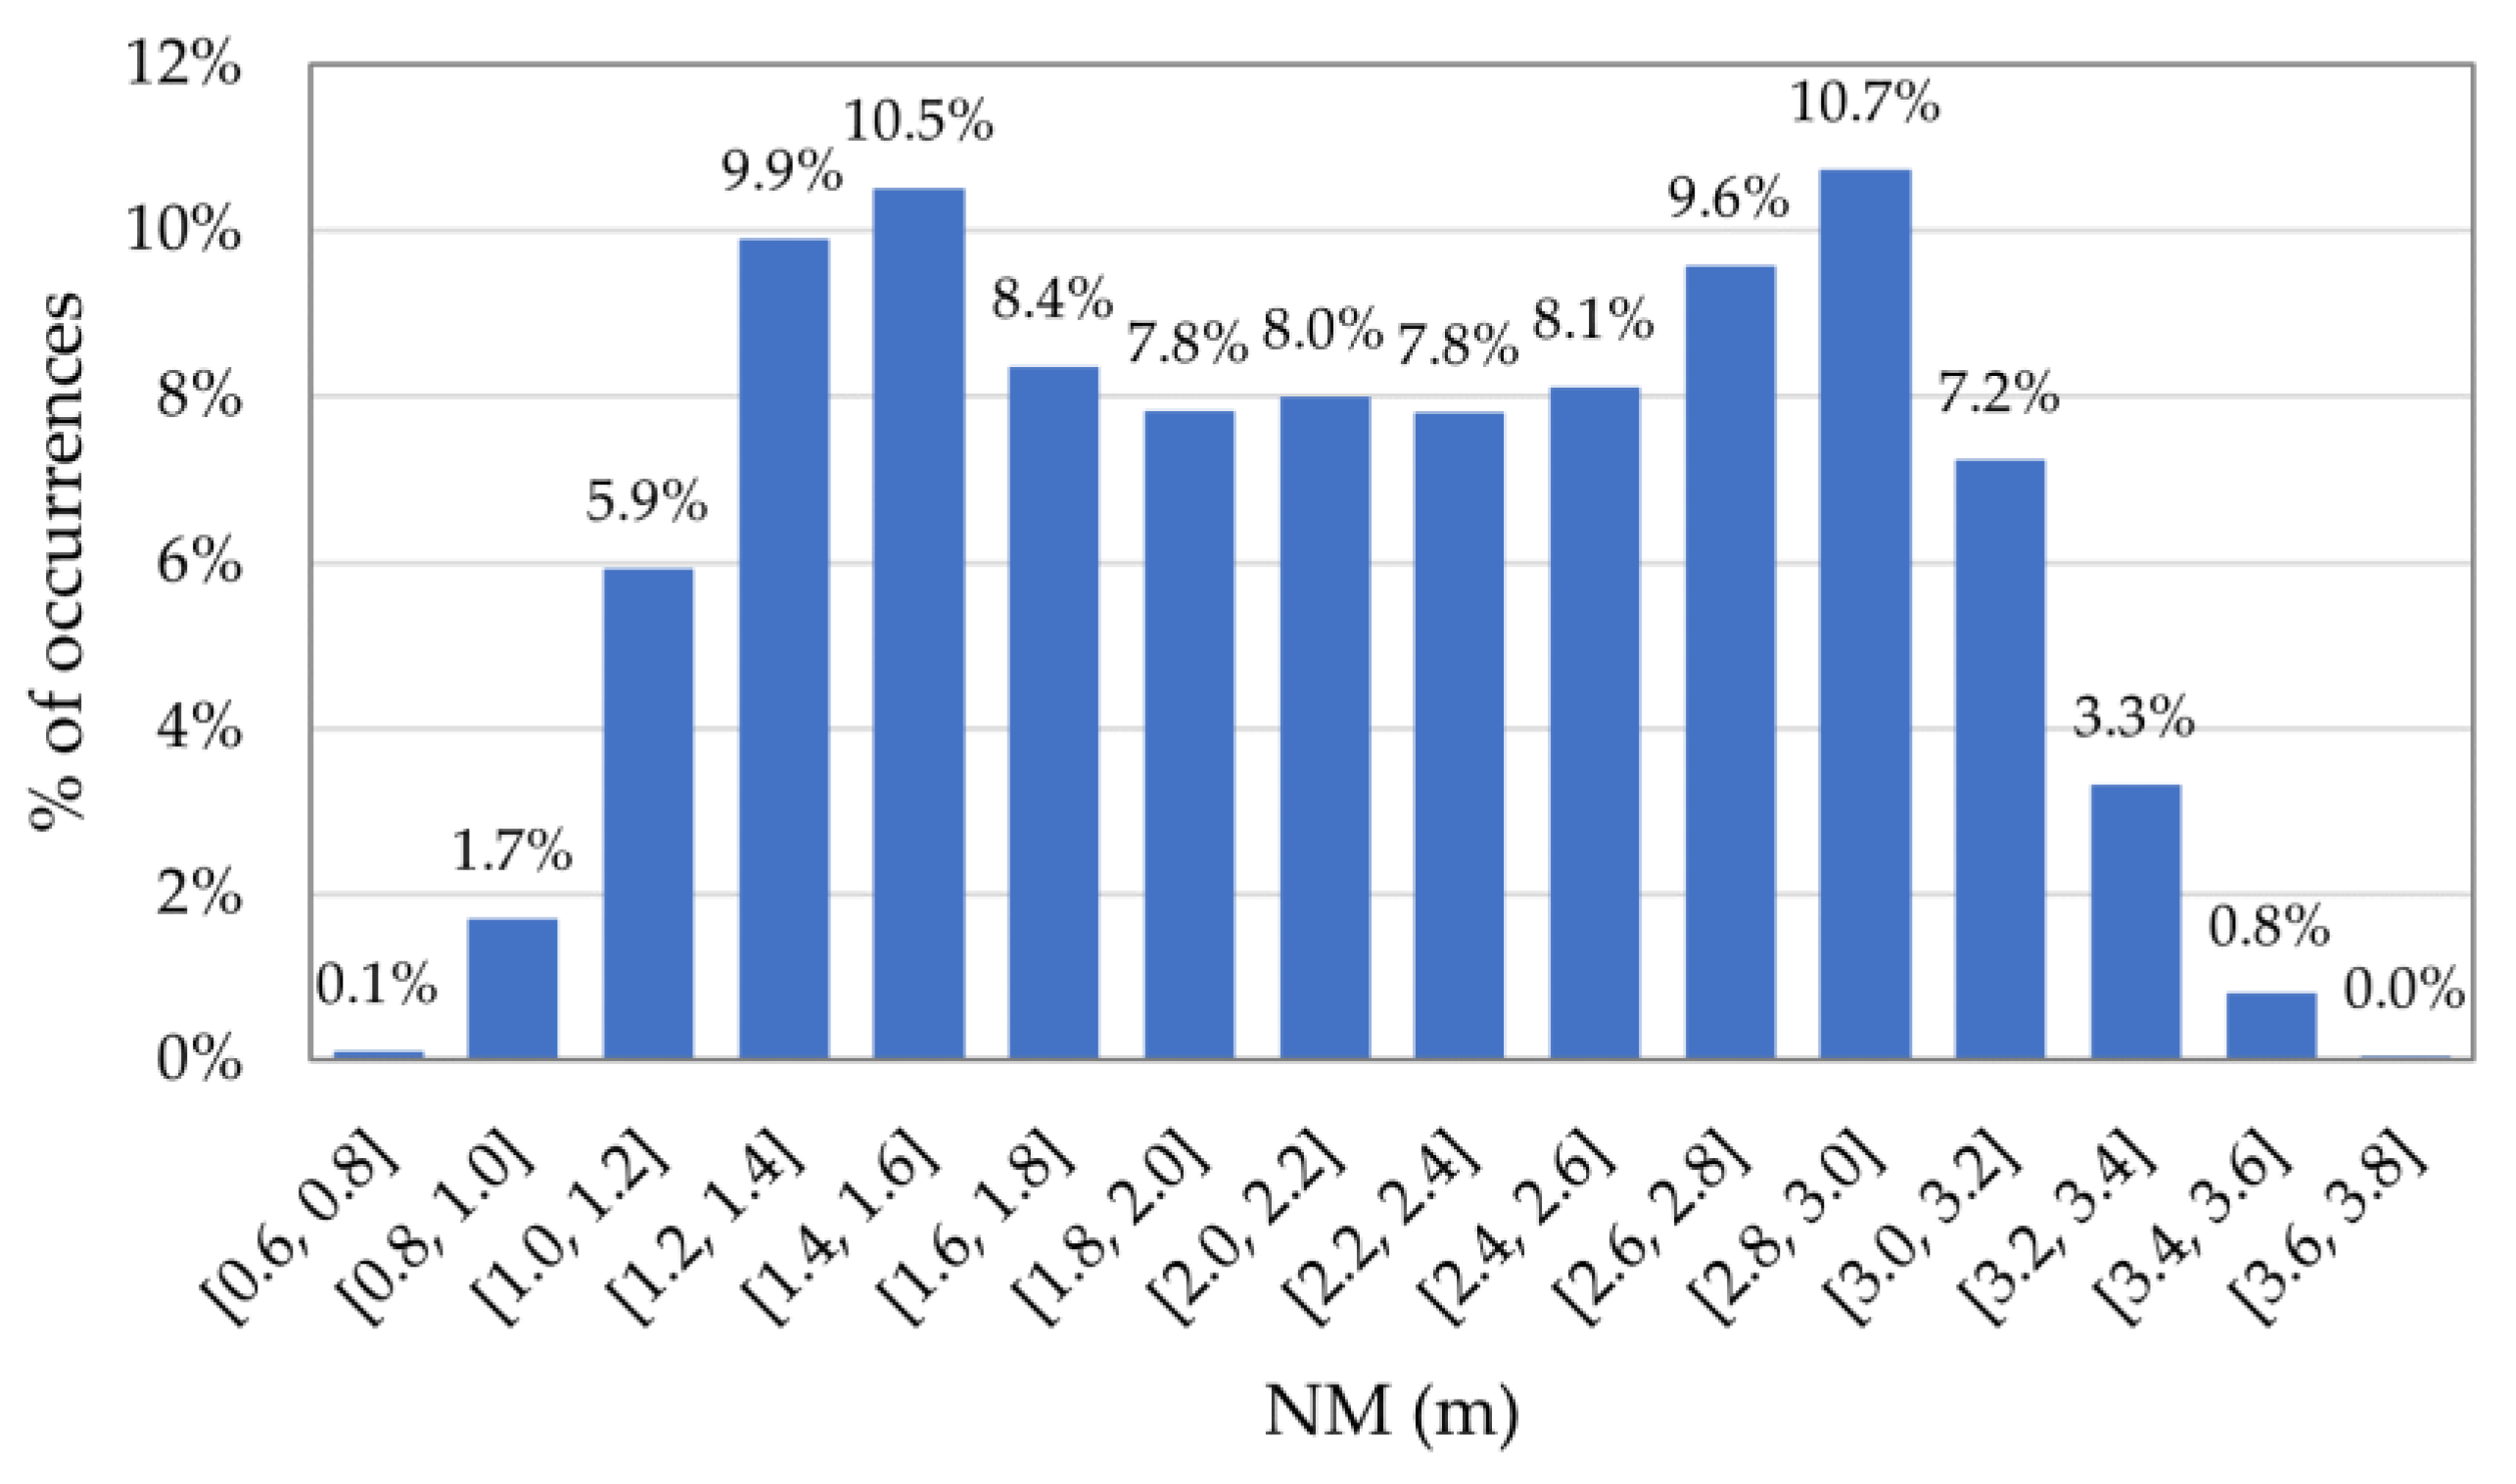
Meteorological tide levels for the period relating to the wave data series ranged between 0.66 and 3.71 m, with the highest number of occurrences associated with the interval between 2.8 and 3.0 m with a total of 1725 occurrences (approximately 11% of the total data in the series) (
Figure 7).
3.3. Scenarios Considered for the Case Study
Different scenarios were going to be analyzed for Ericeira breakwater P–P section, using for all of them the different existing equations fr. The scenarios are:
First scenario, considering wave series and sea level data previously described, representing the current situation;
Second scenario, considering a sea level rise of 5 mm/year (expected value in the area close to Ericeira port due to the Climate Change) [
25];
Third scenario, considering a lowering of the armor berm. A tetrapod is removed at the armor berm leaving the crown wall partially unprotected;
Fourth scenario, considering the second and third scenarios simultaneously.
The sea level rise included in the second and fourth scenarios enables analyzing the impact of climate change in the short term (10 years are considered in this research, the total sea level rise in the research being 50 mm) in rubble mound breakwater structures. The lowering of the armor berms represented in the third and fourth scenario simulates the partial failure of the rubble mound breakwater, losing some concrete pieces. All these scenarios allow the comparison of the loads in different cases: the real and current ones, the ones due to the sea level rise, the ones due to the failure on the top of the armor, and a combination of the sea level rise and the failure on the top of the armor. So, some conclusions can be obtained for being prepared for different possible scenarios.
4. Results
Formula application and validity are here presented together with the results obtained for the different formulas and for the different scenarios, which are shown below according to the different equations previously exposed: (1) Jensen (1984) and Bradbury et al. (1988); (2) Günbak and Gökce (1984); (3) Martín et al. (1999); (4) Berenguer and Baonza (2006); and (5) Pedersen (1996) and Nørgaard et al. (2013). The results are presented in terms of forces due to the wave action (Fh: horizontal; and Fb: uplift pressures), and corresponding destabilizing moments (Mh: horizontal forces moment; and Mb: uplift pressure moment) and safety coefficients (Cdes: sliding; and Cder: overturning).
4.1. Jensen (1984) and Bradbury et al. (1988)
For the application of Jensen and Bradbury equations to the case study, it was necessary to associate the geometry of the P-P profile to the geometry of one of the type sections tested by the authors. As mentioned in previous sections, each theoretical section is characterized by a validity interval associated with the parameters A
c, S
0p, H
s/A
c and ξ
op (or I
r0p). To determine the most suitable section, the intervals of the validity parameters of each type of section (
Table 2) were compared with the intervals obtained for the same parameters for the series of agitation data and sea levels, and for each study scenario (
Table 5). Looking to the validity range of A
c and S
op, cross section A is the only one where the values are within the range of the validity of the formulation. Looking to H
s/A
c and ξ
op, cross section A is again the most appropriate for the parameter range of this case study. Consequently, the empirical coefficients of cross section A were adapted hereafter.
Table 6 presents the valid number of cases for formula validity parameters. It should be pointed out that this formula does not include any reduction in horizontal pressures because of the existence of an armor layer facing the wave wall and the crown wall analyzed here is totally protected by the armor layer in scenarios 1 and 2.
As it can be seen, in none of the four scenarios are the formulas within the limits of parameters for all cases. Hs/Ac and ξop are the most restricted parameters for all scenarios, even for Hs > 4.5 m, i.e., temporal conditions.
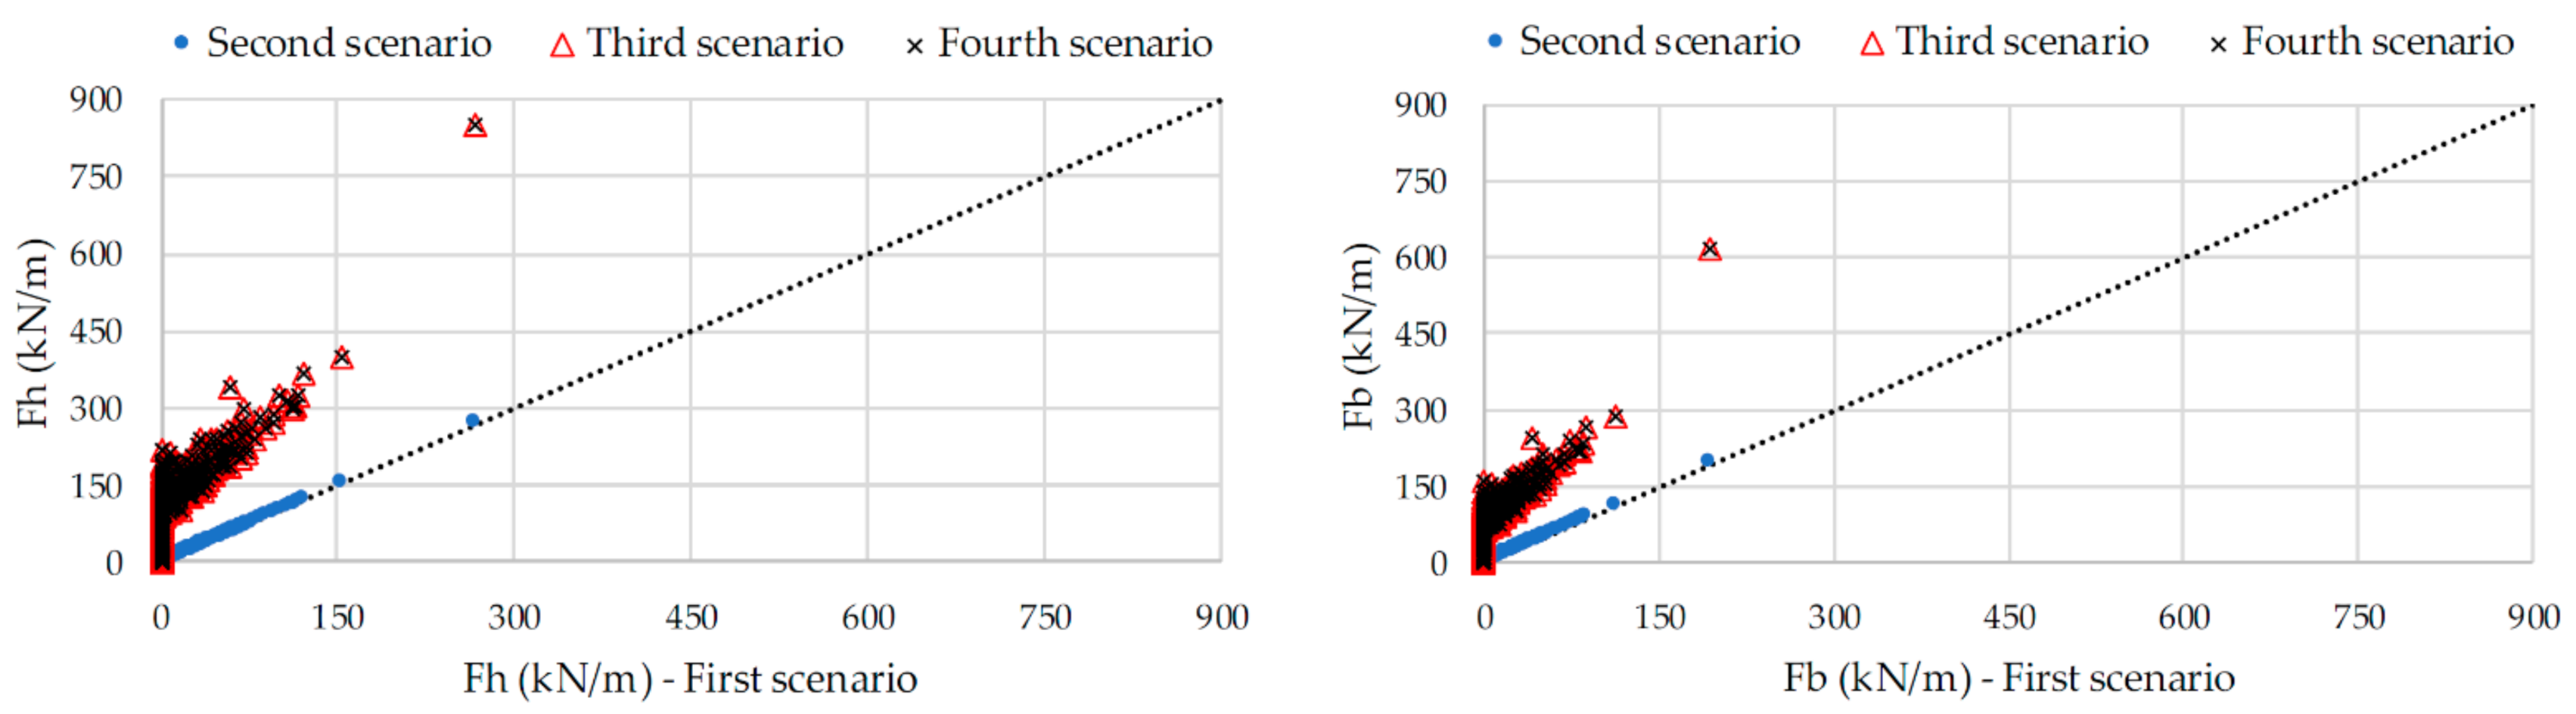
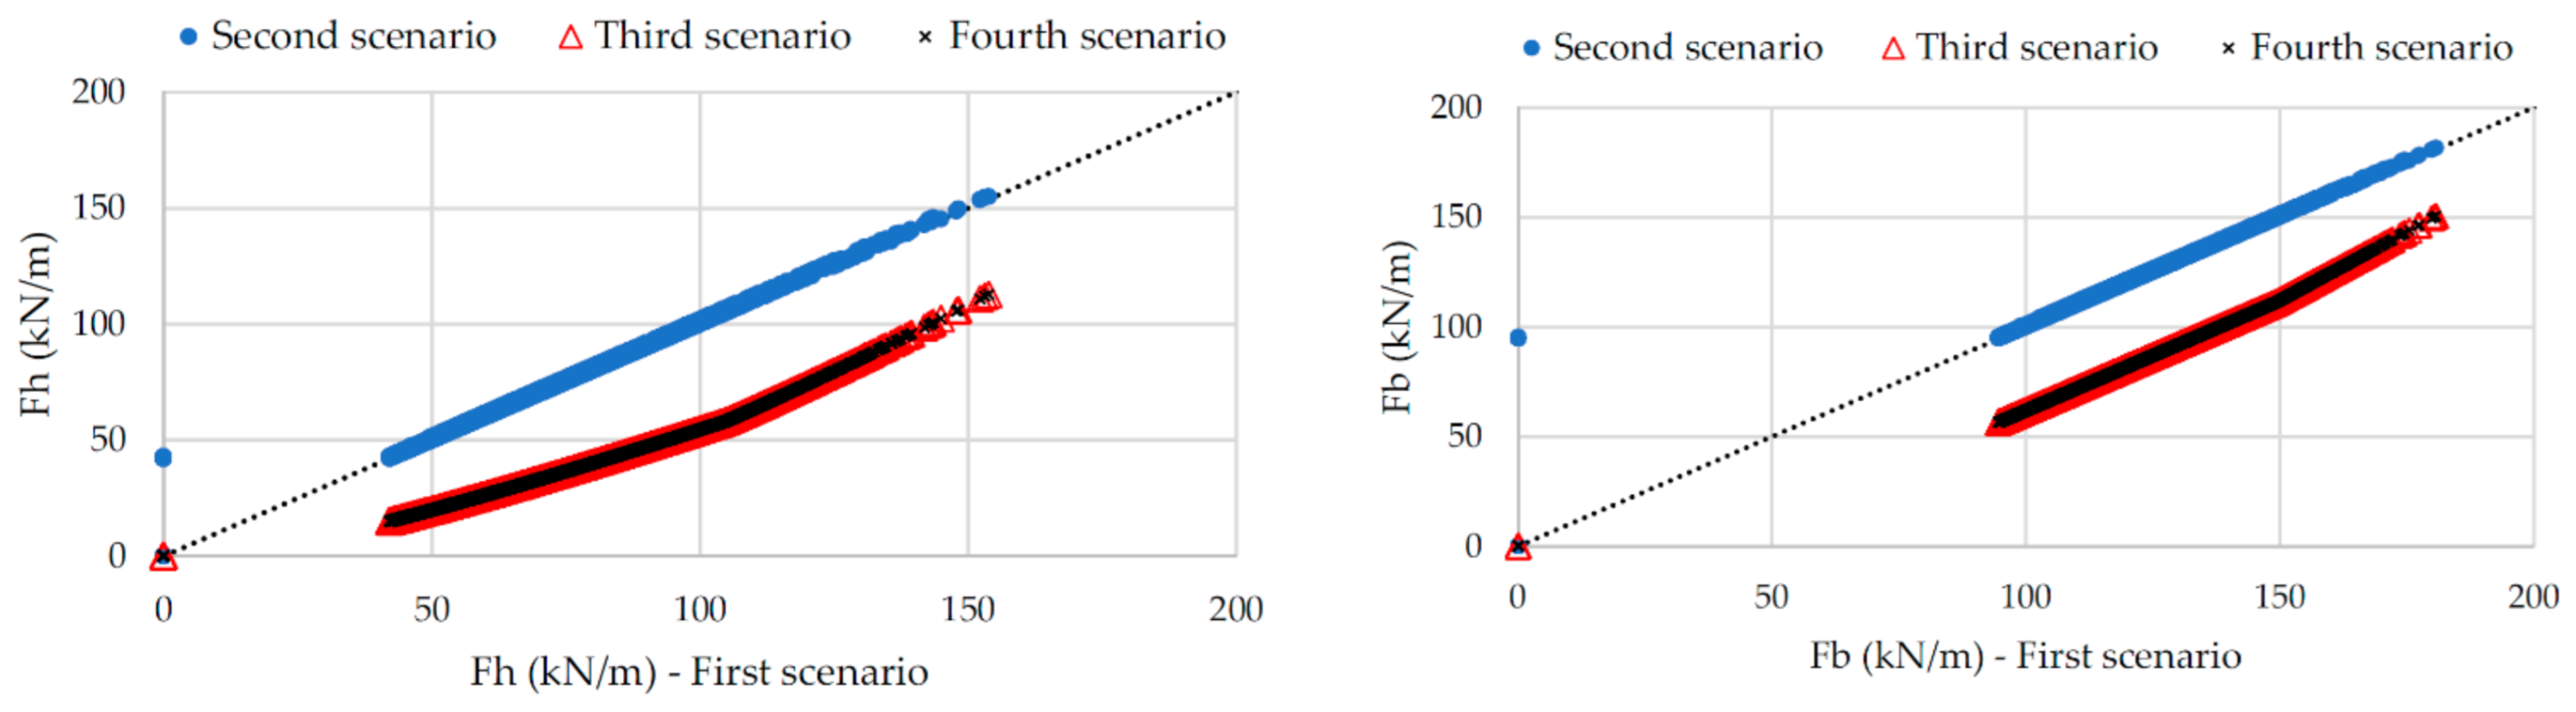
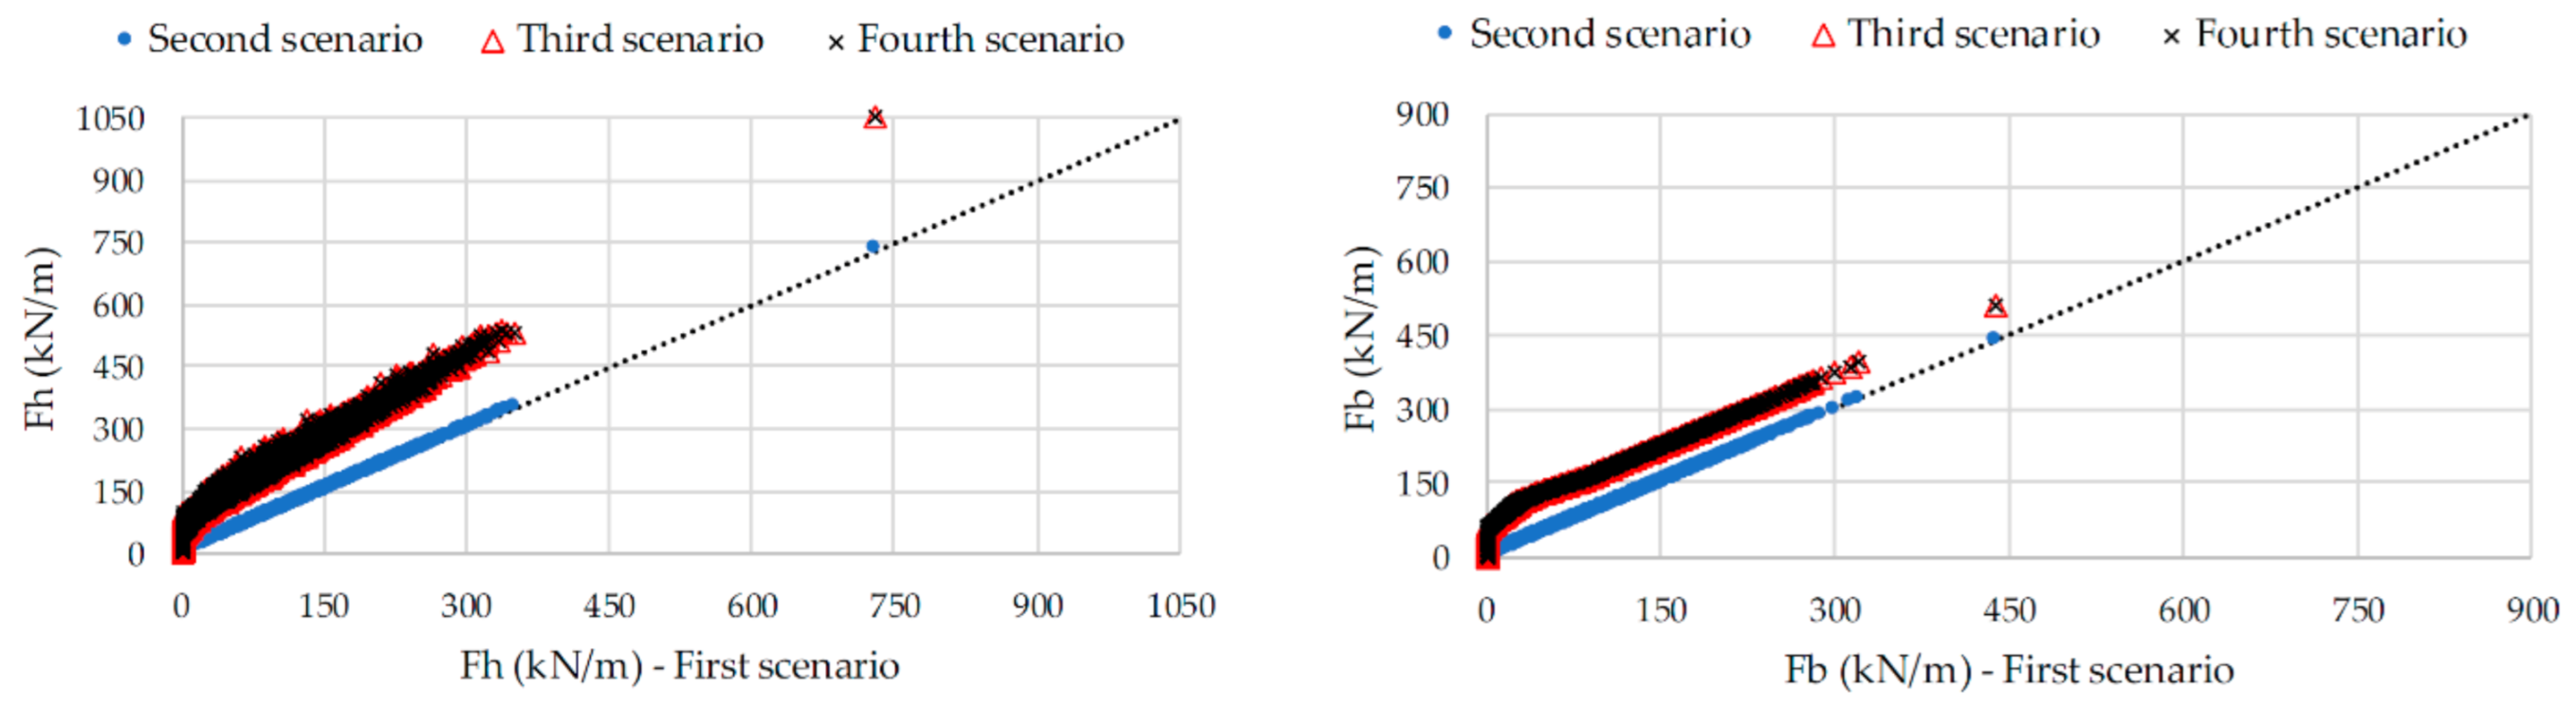
The next figures include relevant information about horizontal and vertical forces for the first scenario compared with the second to fourth scenarios (
Figure 8), as well as sliding safety coefficients for the first scenario compared with the second to fourth scenarios (
Figure 9).
A small response is observed in the horizontal and vertical forces to the sea level variation, i.e., between scenarios 1 to 2 and 3 to 4, since the maximum sea level variation expected in 10 years was also small—50 mm. Differences in the maximum values are less than 2% with the increase in sea level considered. The maximum Fh varies from 267.6 (scenario 1) to 272.7 kN/m (scenario 2) and from 852.8 (scenario 3) to 864.2 kN/m (scenario 4). The same happens for Fb, with the maximum values being lower than Fh and varying from 193.2 kNm/m for scenario 1 to 197.0 kNm/m for scenario 2 but being 615.9 and 624.1 kNm/m for scenarios 3 and 4, respectively. However, if there is a change in the protection of the crown wall, with an area being unprotected, the differences deeply increase, especially for the higher values of forces that become more than two times the value for a design protected crown wall. The same trend was found for momentum.
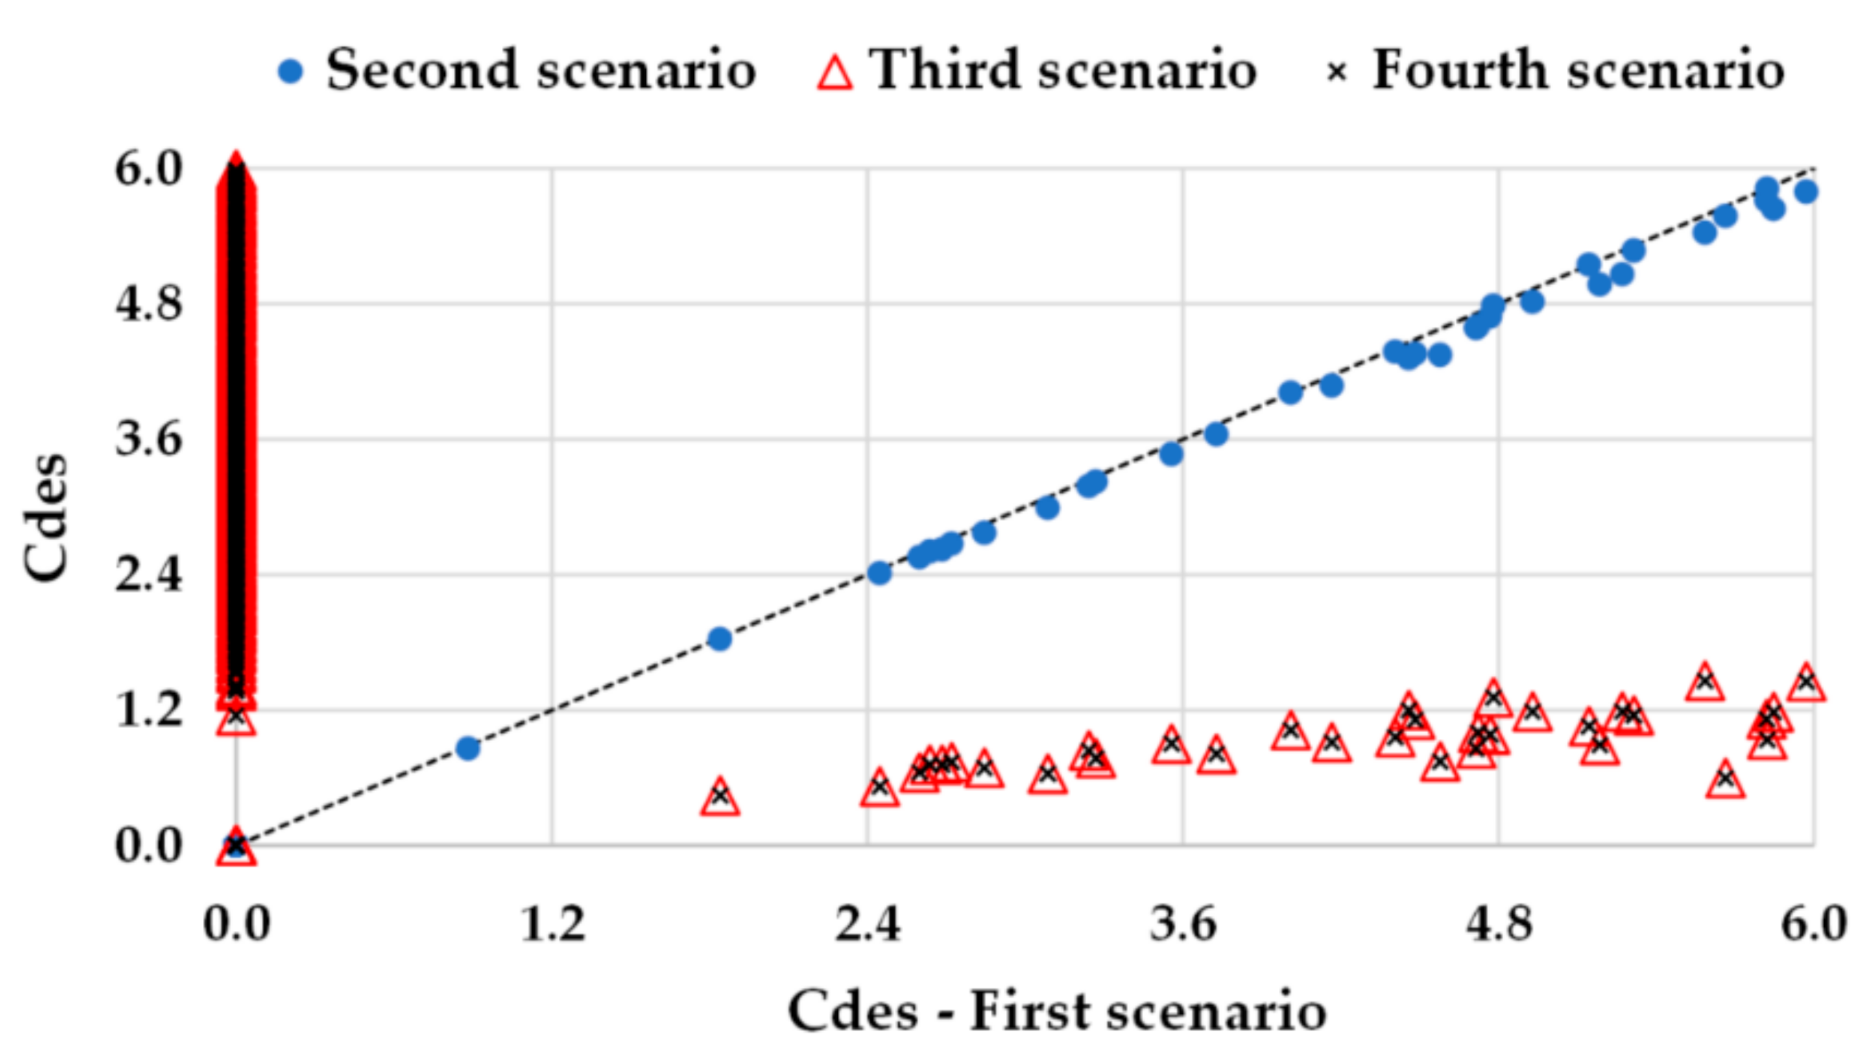
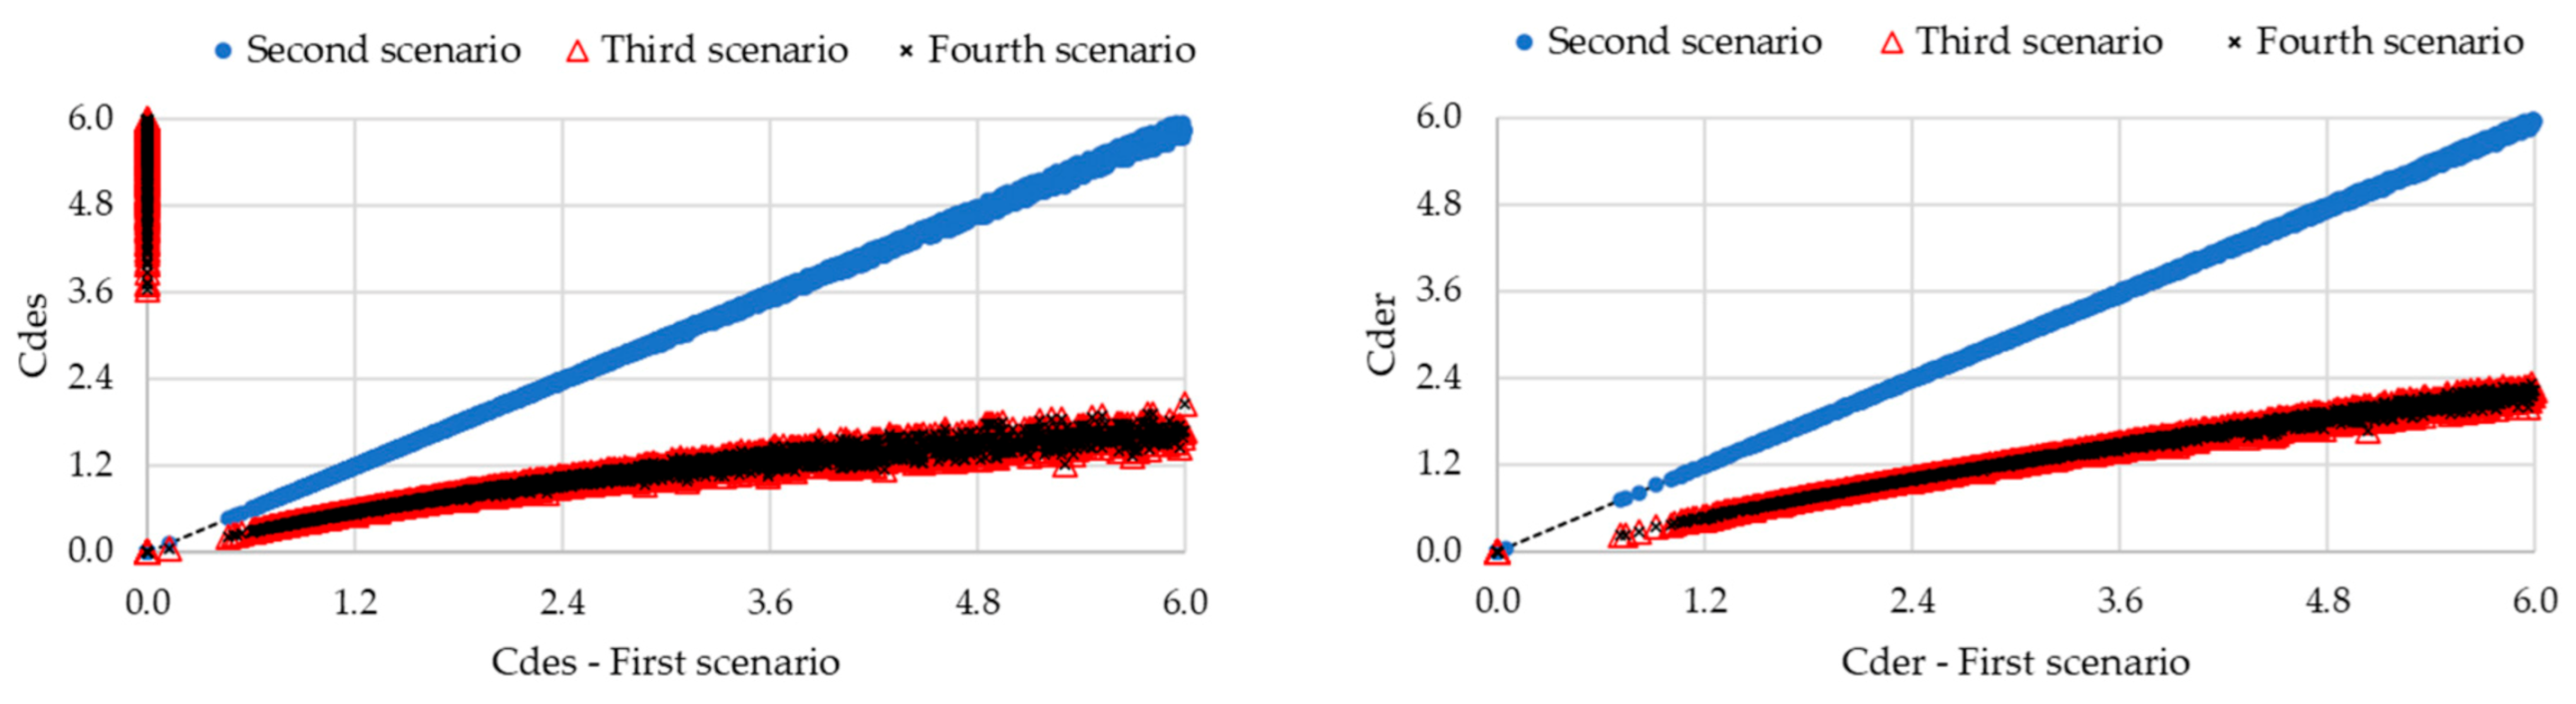
These results lead to differences in safety coefficients. For both scenarios 1 and 2, both safety coefficients are always higher than 1.2. When the protection of the crown wall is reduced, part of the structure suffers from the direct wave impact; for 43 wave conditions Cder becomes less than 1.2, corresponding to Hs higher than 4.3 m and with sea levels higher than 2.15. Cdes remains higher than 1.2. In other words, the crown wall becomes unstable for sliding for some of the storm conditions.
4.2. Günbak and Gökce (1984)
Although it does not impose validity limits of the equation, it is important to emphasize the run-up values, since the equation depends on this parameter, with the highest percentage between 2 and 3 m, followed by the intervals of 3 and 4 m, 4 and 5 m, and 1 and 2 m for the four scenarios (
Figure 10).
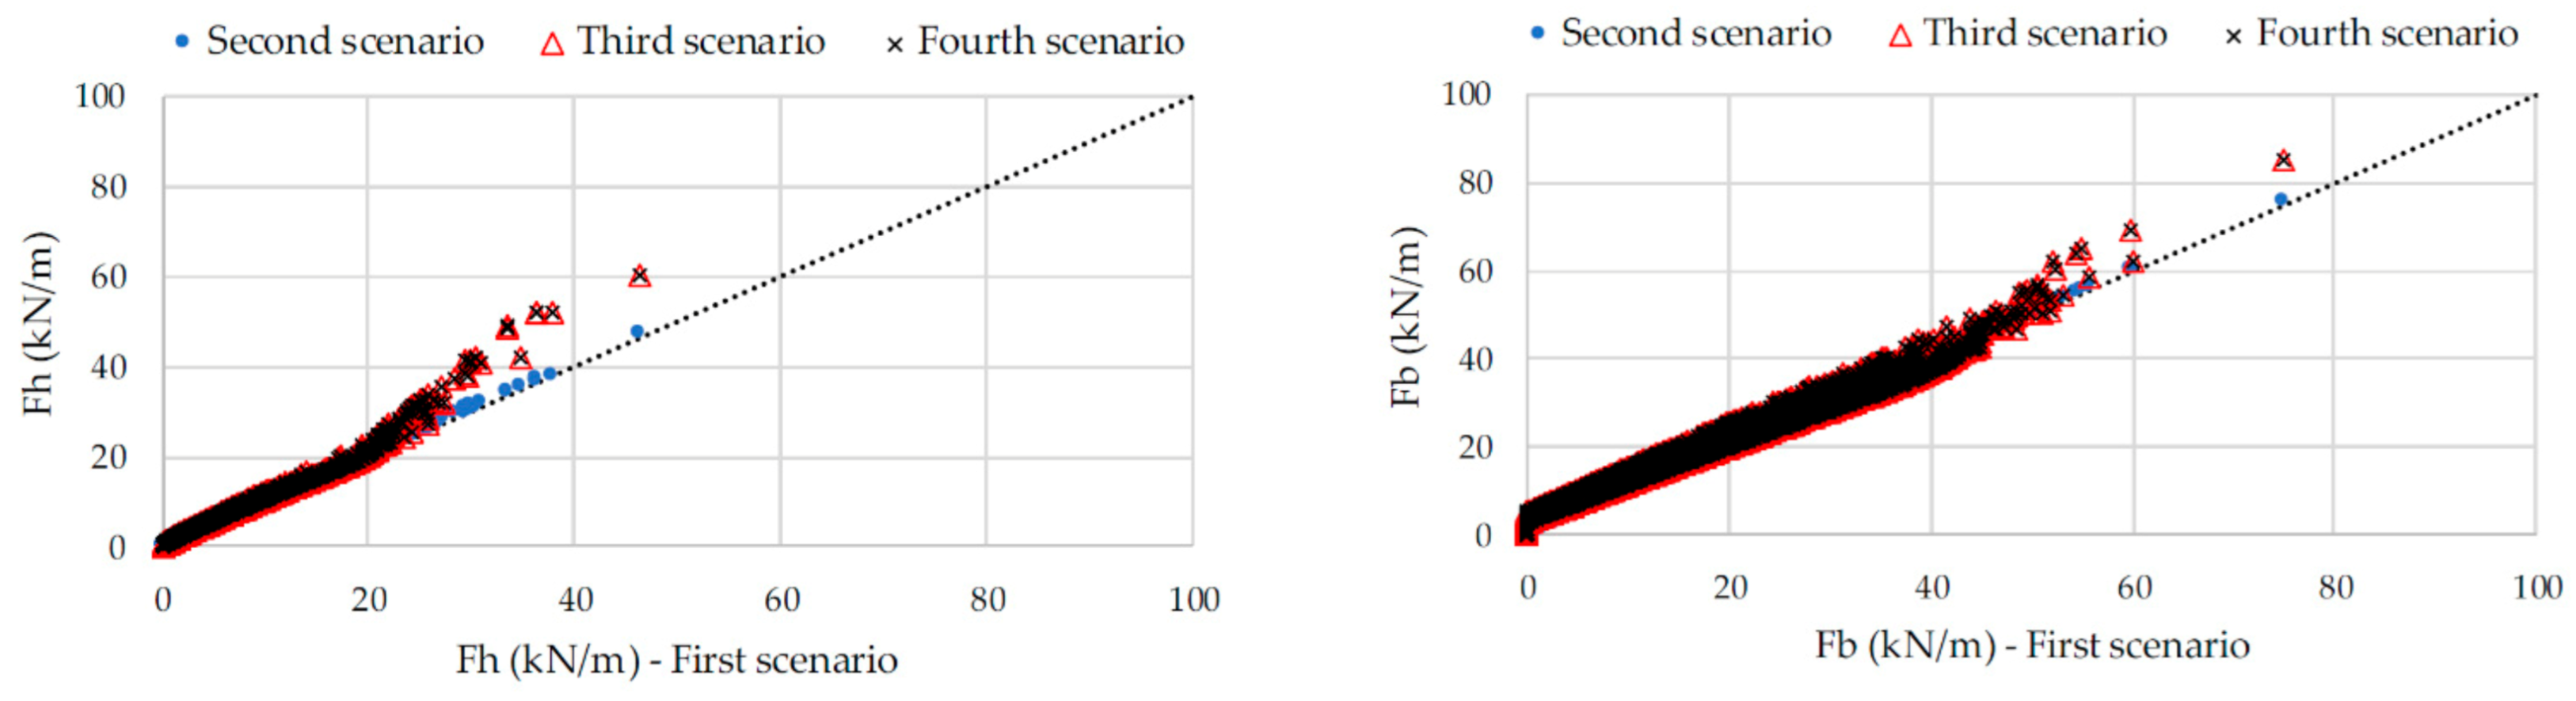
The next figures include relevant information about these values: horizontal and vertical forces for the first scenario compared with the second to fourth scenarios (
Figure 11); and sliding and overturning safety coefficients for the first scenario compared with the second to fourth scenarios (
Figure 12).
As expected, minor changes are observed in horizontal and vertical forces to the sea level variation, while the maximum forces increase by less than 2% from scenarios 1 to 2 and from scenarios 3 to 4. The same happens with the momentum. With a change in the protection of the crown wall, and an area being unprotected, the differences are not as expected. In fact, the value of forces reduces as well as the correspondent momentum and the maximum of forces reduces by more than 25%. Fh goes from a maximum of 153.8 kN/m (scenario 1) and 154.9 kN/m (scenario 2) to 112.8 kN/m (scenario 3) and 114.1 kN/m (scenario 4). This happens because the reduction in Ac in scenarios 3 and 4 does not correspond a reduction in the value used for the authors to calculate dynamic pressure. This value depends on the difference between Ru and Ac. Ru is only a function of the wave height and ξ, not depending on Ac, making a reduction in Ac lead to an increase in dynamic pressures and consequently, on forces and momentum.
These results lead to a surprising increase in the safety coefficient values. For all the scenarios, both safety coefficients are always higher than 1.2, even when the protection of the crown wall is reduced, and part of the structure suffers from the direct wave impact. It should be pointed out that Günbak and Gökce (1984) claimed that their method was designed to be applied to Mediterranean ports, where the wave characteristics are clearly different to the one from Ericeira, on the Portuguese west Atlantic coast.
4.3. Martín et al. (1999)
The validity for the application of the Martín et al. equation depends on the validity limits of expressions for calculating μ and λ parameters, and the surf, only being valid in cases where the surf occurs before the wave reaches the superstructure. Furthermore, it is considered that the wave breaks before the superstructure if the bottom breaks (ξ
0p, max > 3) or if the relationship between B
e/H
max and A
c/H
max will respect the non-impact zone. The number of cases in the data series in which the formulation was valid according to the surf is shown in
Table 7 for each study scenario.
The number of cases valid for the formulas is rather small, since for most of the cases, ξ0p, max is less than 3. Hs is less than 3.2 m for the valid cases, showing that the formulas is applied out of its validity range for storm conditions.
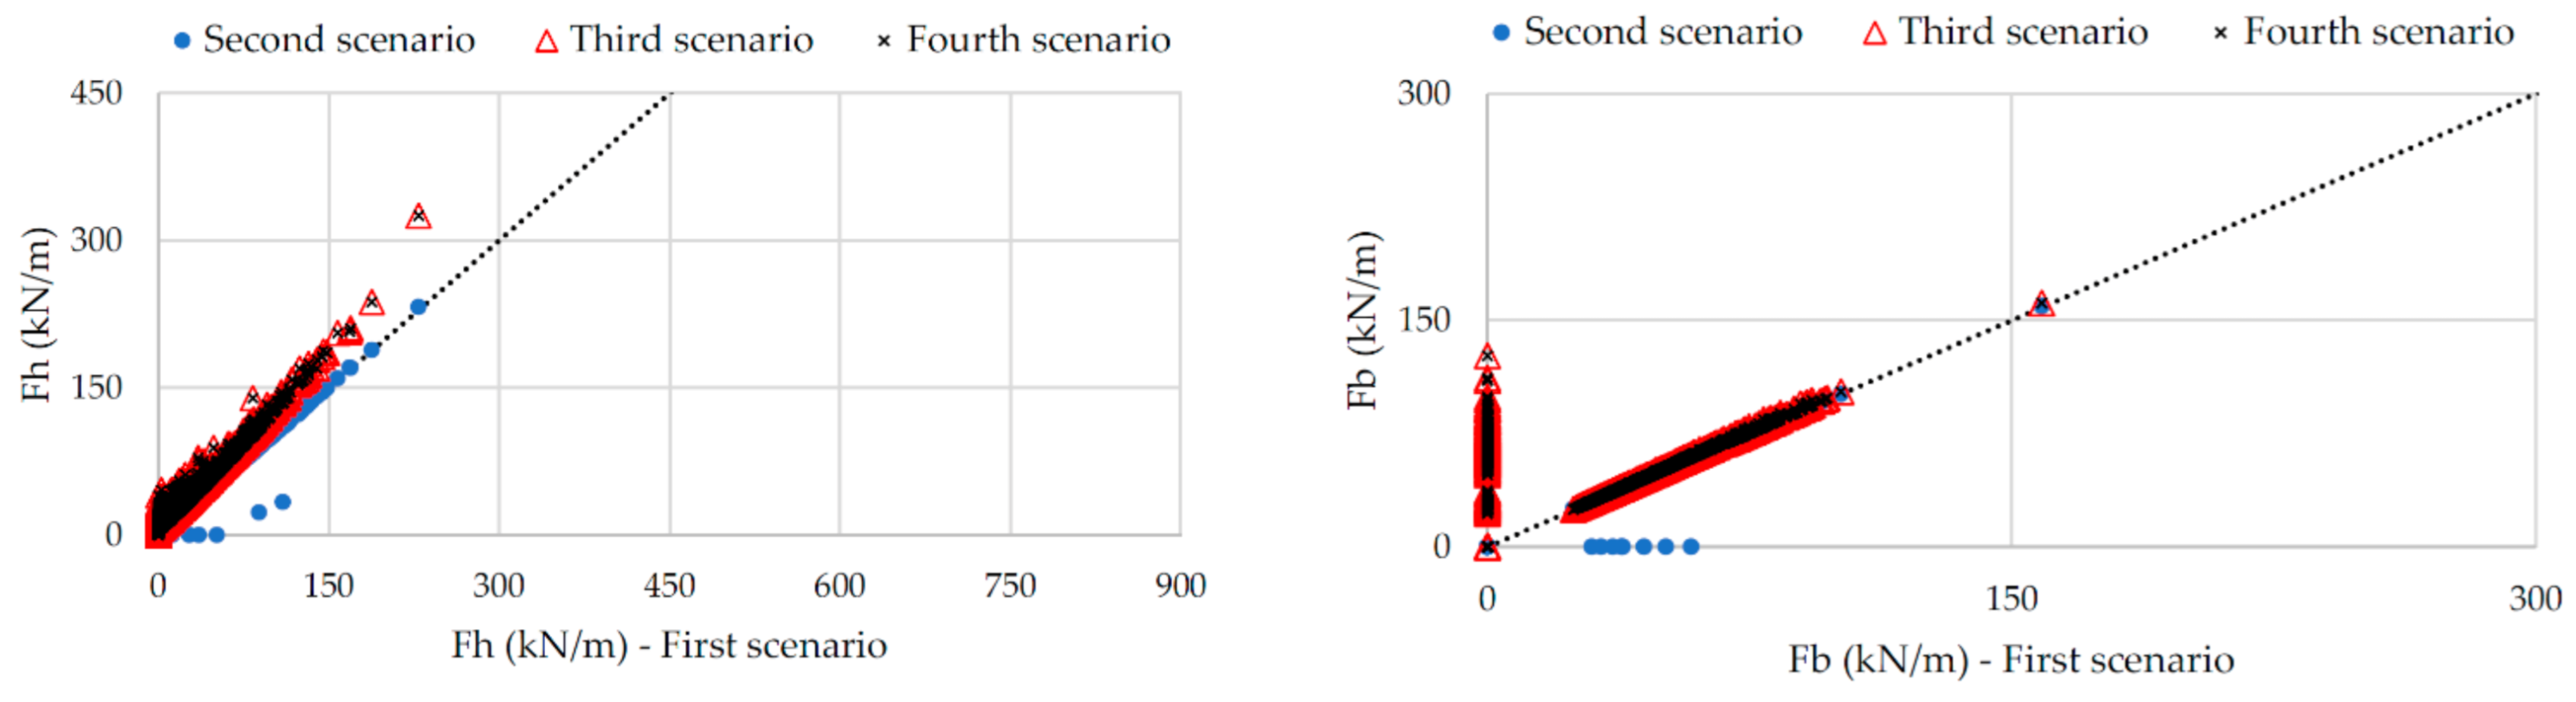
The next figure presents information about horizontal and vertical forces for the first scenario compared with the second to fourth scenarios (
Figure 13). The forces of the first and second peaks was calculated separately, as indicated by the authors, and the addition the first and second peaks were made in order to obtain the total force.
Horizontal and vertical forces reduce very little to the sea level variation, i.e., between scenarios 1 to 2 and 3 to 4, with the maximum forces reducing by less than 4%. With a change in the protection of the crown wall, between scenarios 1 to 3 and 2 to 4, with an area being unprotected, the differences in forces are small, increasing for the higher values of forces: difference in the maximum reaches 30% for Fh and 14% for Fb. Fh present a maximum value of 46.5 kN/m for scenario 1, and a value of 47.7 Kn/m, 60.3 kN/m and 62.4 Kn/m for scenarios 2, 3 and 4. Vertical forces are a little higher than Fh, with a maximum of 75.0 kN/m (scenario 1) to 75.9 (scenario 2) and from 84.9 kN/M (scenario 3) to 86.5 kN/m (scenario 4).
Both safety coefficients remain higher than 1.2 for all scenarios and wave conditions tested. In other words, the stability of the crown wall is considered not affected by the increase in sea level or by the crown wall being partially unprotected to the directly wave action.
4.4. Berenguer and Baonza (2006)
The application of this equation was carried out assuming the presence of concrete blocks in the outer main armor and Ericeira is composed of tetrapods.
Table 8 shows the values of R
u for which there is no limit on validity. In view of this, the only validity condition for applying the formulation lies in calculating the moment due to the vertical forces, M
b, including the minimum and maximum figures obtained in
Table 8, and the number of valid cases in
Table 9.
As can be seen, all Ru values are within the validity limits of the formulation. However, less than 20% of the data have Mb values within their range of validity.
Differences in forces due to increasing sea level are not relevant, with the maximum values increasing by less than 2% for F
h and less than 0.5% for F
b between scenarios 1 (maximum F
h and F
b of 229.0 and 158.7 kN/m, respectively) and 3 (maximum F
h and F
b of 232.4 and 159.3 kN/m, respectively), and between scenarios 2 (maximum F
h and F
b of 232.4 and 161.4 kN/m, respectively) and 4 (maximum F
h and F
b of 330.6 and 162.1 kN/m, respectively). The change in the protection of the crown wall, scenarios 1 to 3 and 2 to 4, with an area being unprotected, leads to larger differences on F
h than on F
b, with a difference in the maximum value reaching 42% and less than 2%, respectively (
Figure 14). Differences in momentum follow the same trend as on forces.
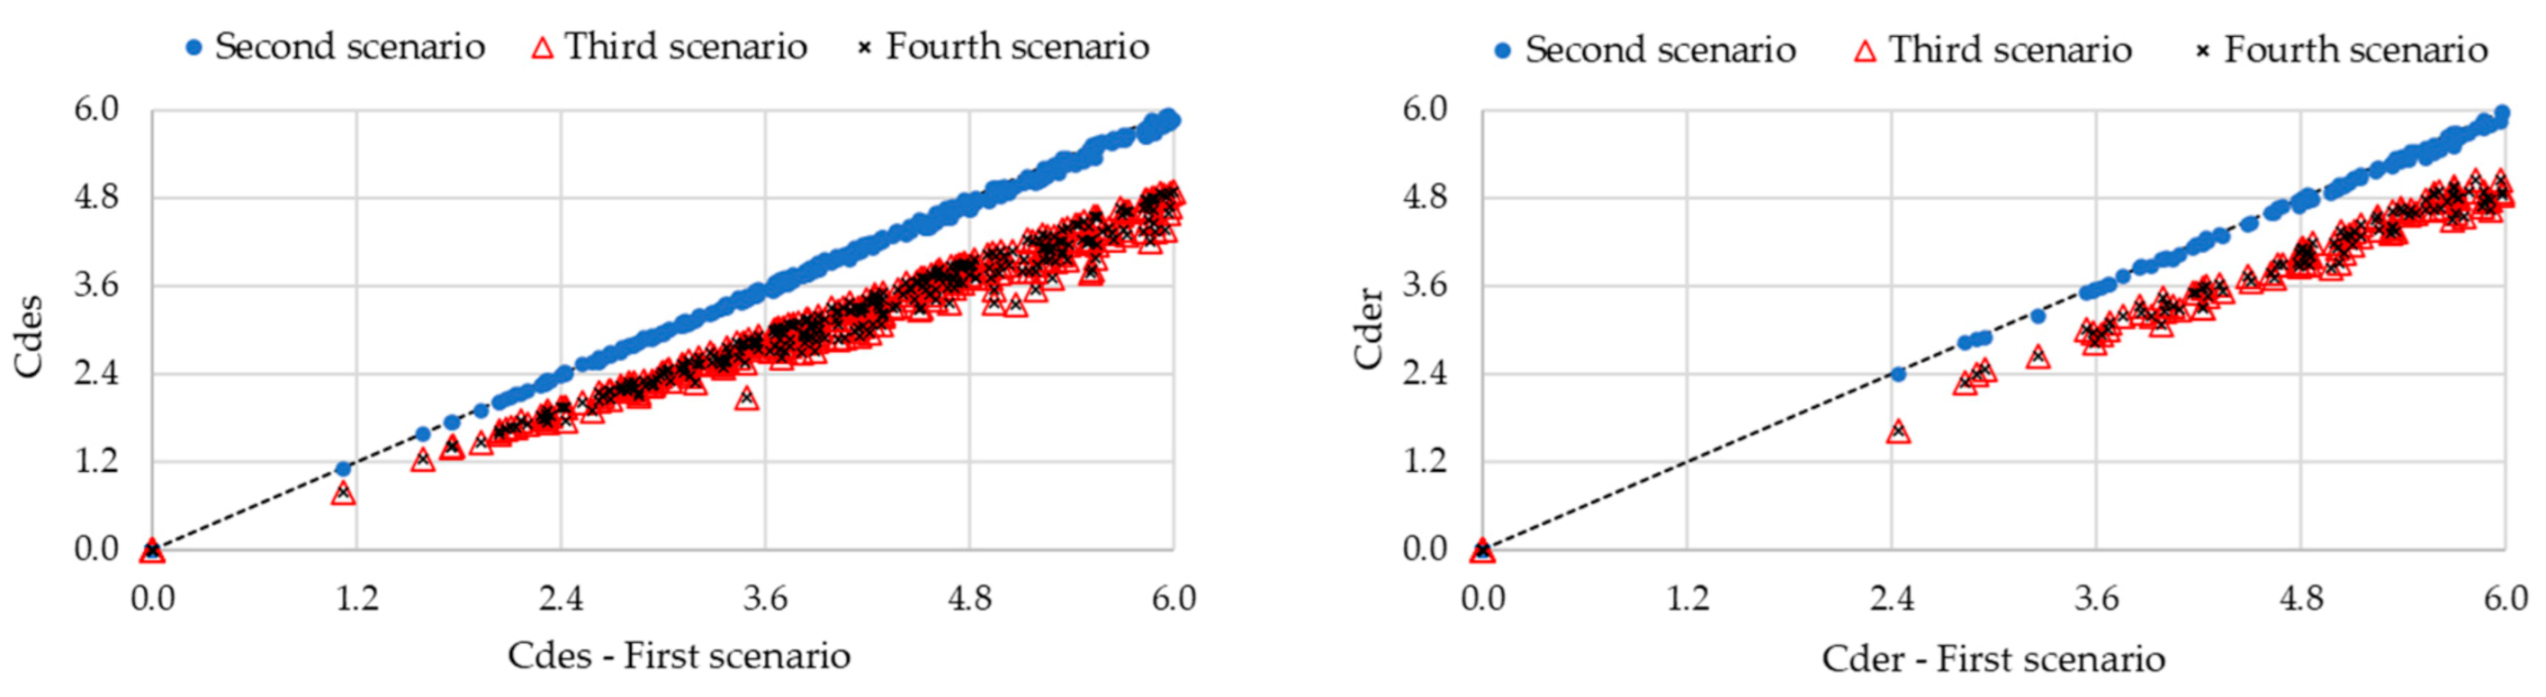
For both scenarios 1 and 2, both safety coefficients are always higher than 1.2. When the protection of the crown wall is reduced and part of the structure suffers from the direct wave impact, only for the highest H
s does the C
des become less than 1.2. C
des remains higher than 1.2. In other words, the crown wall becomes unstable for sliding for the worst storm condition tested (
Figure 15).
4.5. Pedersen (1996) and Nørgaard et al. (2013)
Table 10 shows the values of different parameters essential to detect the validity for the application of the formula, and
Table 11 and
Table 12 include the number of valid cases.
As can be seen, some parameters are within the formulation validity range, but not all of them and for some parameters—Rc/Ac and Ac/Be for Pedersen et al. (1996) and Ac/Be for Nørgaard et al. (2013)—all data are out of limits for formula applications.
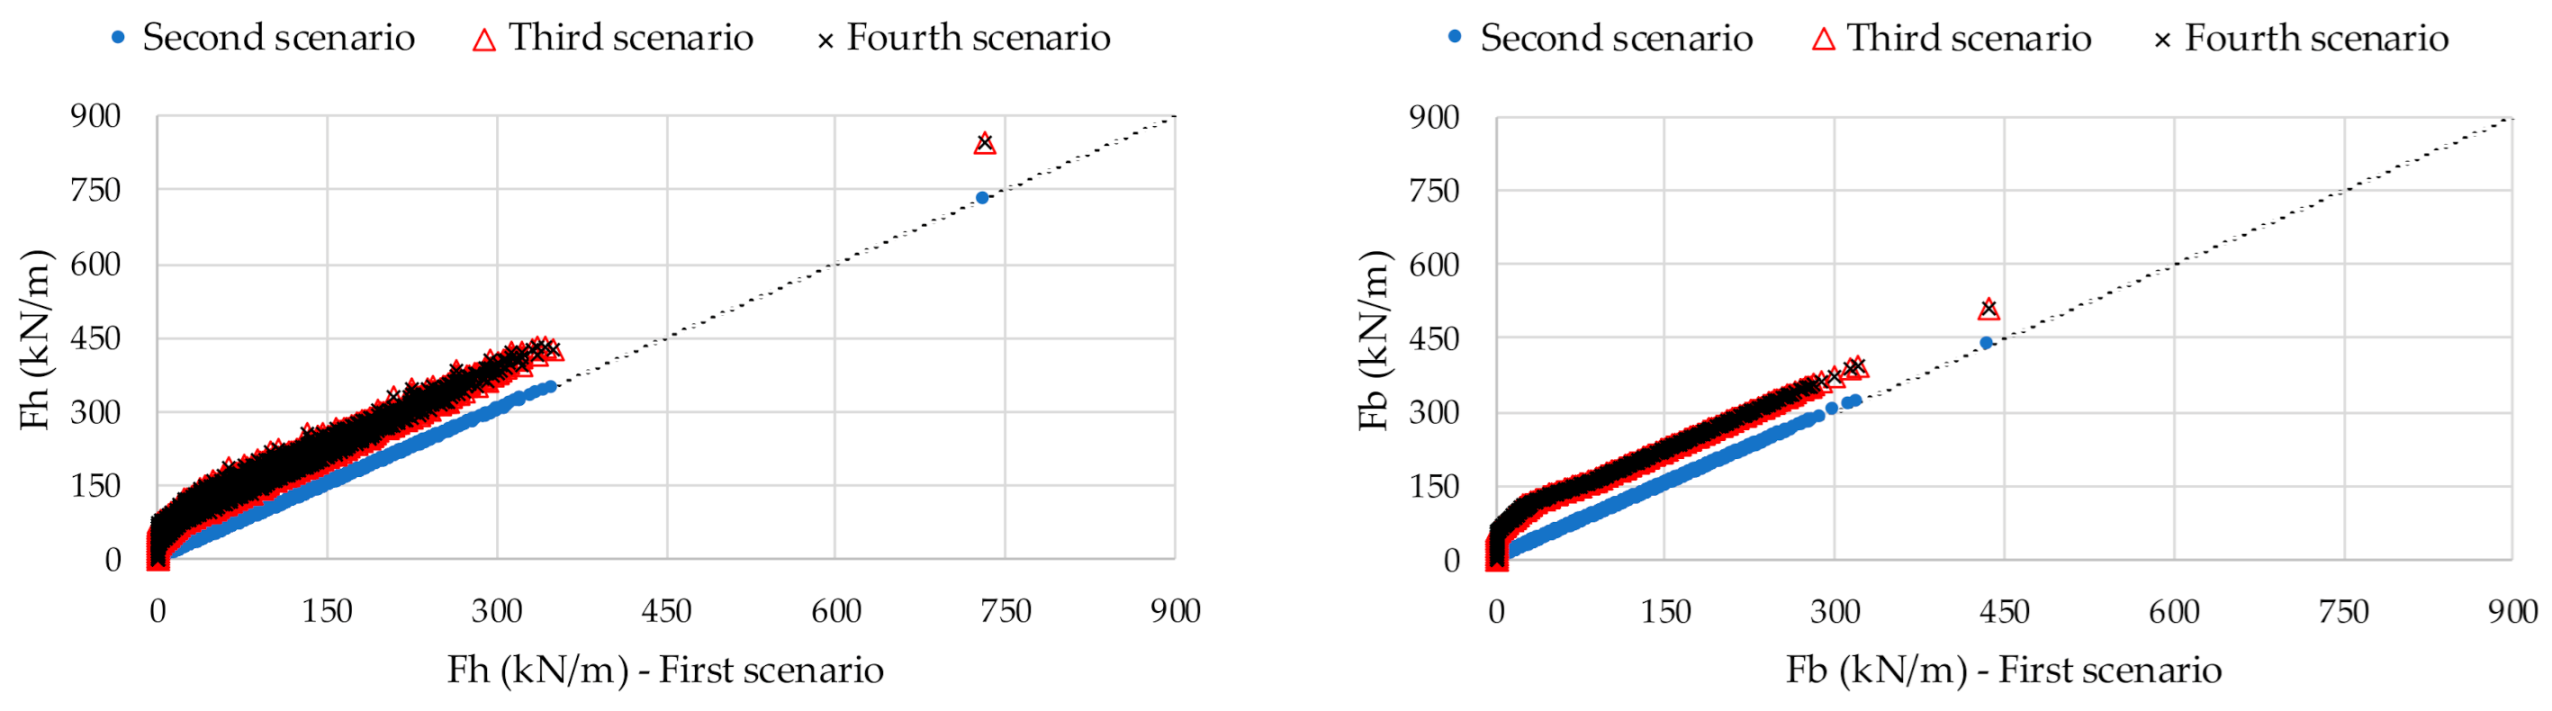
The next figures include relevant information about horizontal and vertical forces for the first scenario compared with the second to fourth scenarios (
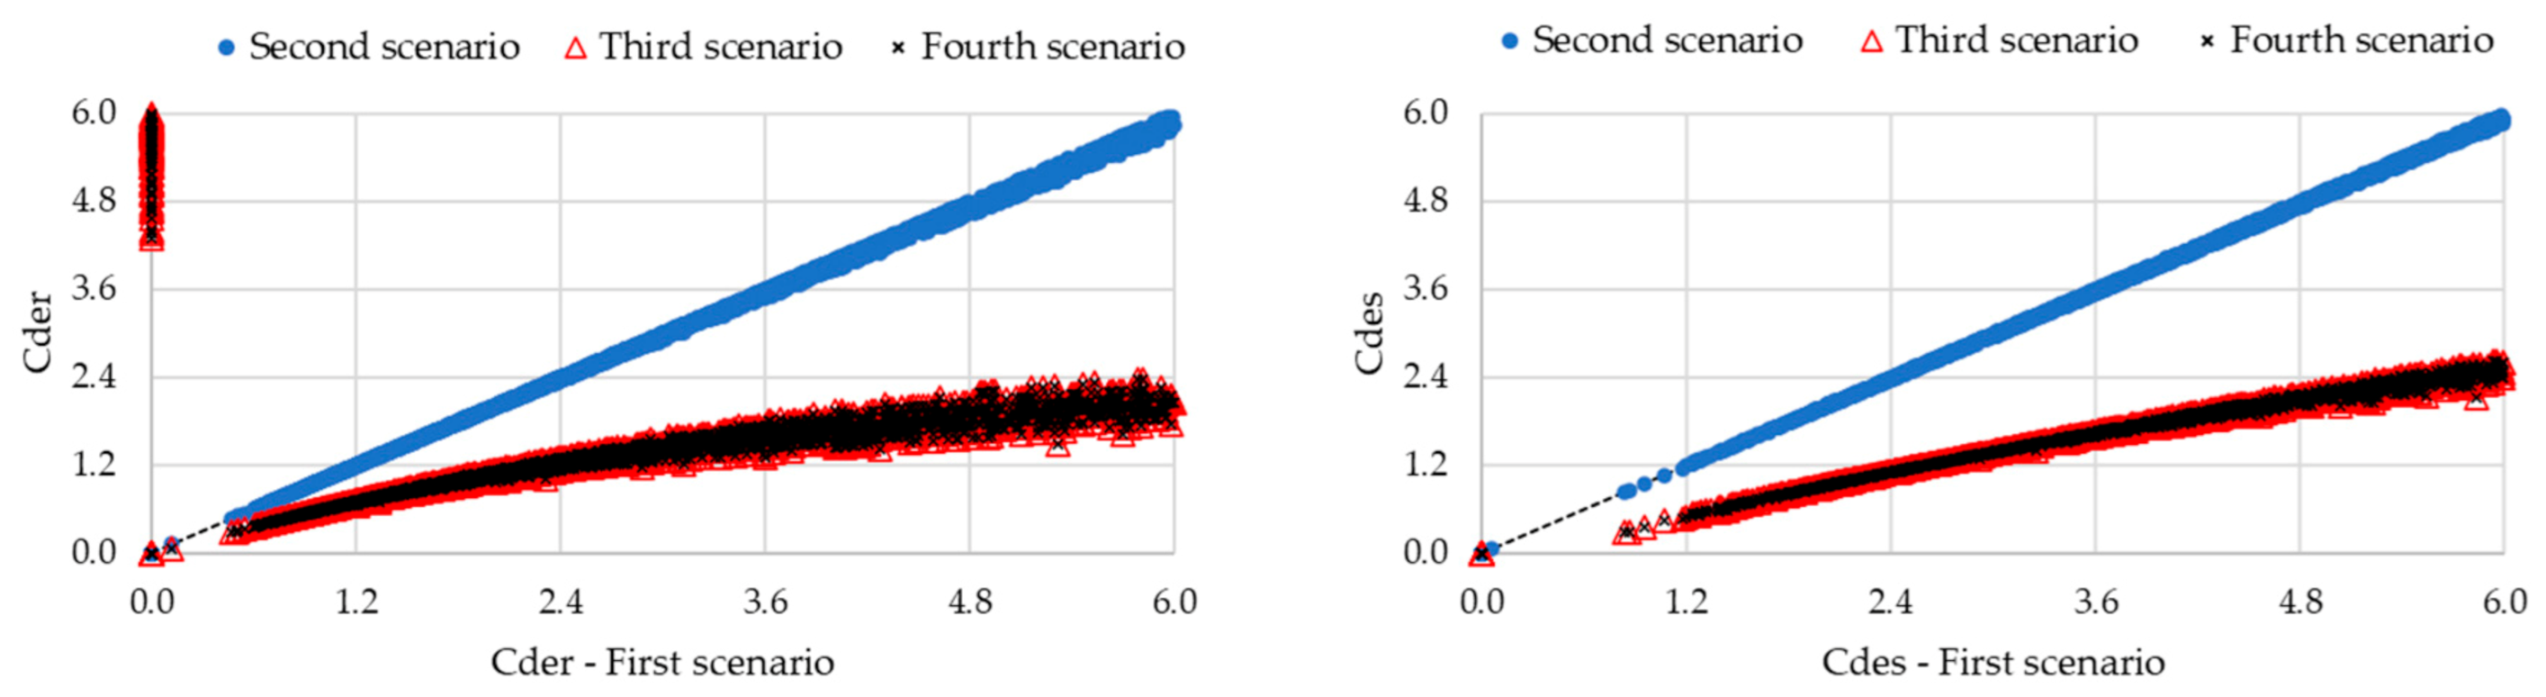
Figure 16); and sliding and overturning safety coefficients for the first scenario compared with the second to fourth scenarios (
Figure 17) for Pedersen et al. (1996).
Figure 18 and
Figure 19 show the same aspects for Nørgaard et al. (2013).
The response of the horizontal and vertical forces to the sea level variation, i.e., between scenarios 1 to 2 and 3 to 4, is not relevant for both formula, as expected, with differences in the maximum values of Fh and Fb less than 0.5%. The maximum Fh for Pedersen (1996) varies from 730.6 kN/m (scenario 1) to 732.3 (scenario 2) and from 1049.6 (scenario 3) to 1051.6 kN/m (scenario 4). Vertical force is smaller than Fh, with the maximum varying from 437.4 kNm/m for scenario 1 to 512.6 kNm/m for scenario 2 but being 512.6 and 513.5 kNm/m for scenarios 3 and 4, respectively. With Fh for scenarios 1 and 2 and Fb for all scenarios calculated with Nørgaard et al. (2013), the formula gives similar results as Pederson (1996). Larger differences are found in Fh and scenarios 3 and 4, with maximum values of Fh being, for Nørgaard et al. (2013), almost 24% higher than for Pederson (1996): 1049.6 and 1051.6 kN/m, respectively.
The impact of the crown wall will become partially unprotected by the armor layer due to the wave action, which is especially important for the higher values of forces. Differences in maximum values of Fh reach 44% for Pederson (1996) and 16% for Nørgaard et al. (2013) and on the maximum values of Fb, are 17% for both formulas.
In what concerns safety coefficients, values lower than 1.2 for scenarios 1 and 2 are presented in less than 3% of cases (with Hs higher than 2.6 m) and in 0.1% of cases (with Hs higher than 4.5 m) for Cdes and Cder, respectively. However, the crown wall did not suffer any damage during these 11 years (scenario 1), these results being considered conservative for these types of structures/wave conditions.
When the protection of the crown wall is reduced and part of the structure suffers from the direct wave impact, the number of cases with Cdes and Cder less than 1.2 increases to 16% (with Hs higher than 1.9 m) and 4% (Hs higher than 2.5 m), respectively, for Pederson (1996). For Nørgaard et al. (2013), these values are lower: 11 and 2% for Cdes and Cder, respectively. In other words, the crown wall is unstable for sliding and overturning in a small number of wave conditions tested for scenarios 1 and 2, but these values increase for scenarios 3 and 4, with wave conditions becoming less energetic.
5. Discussion
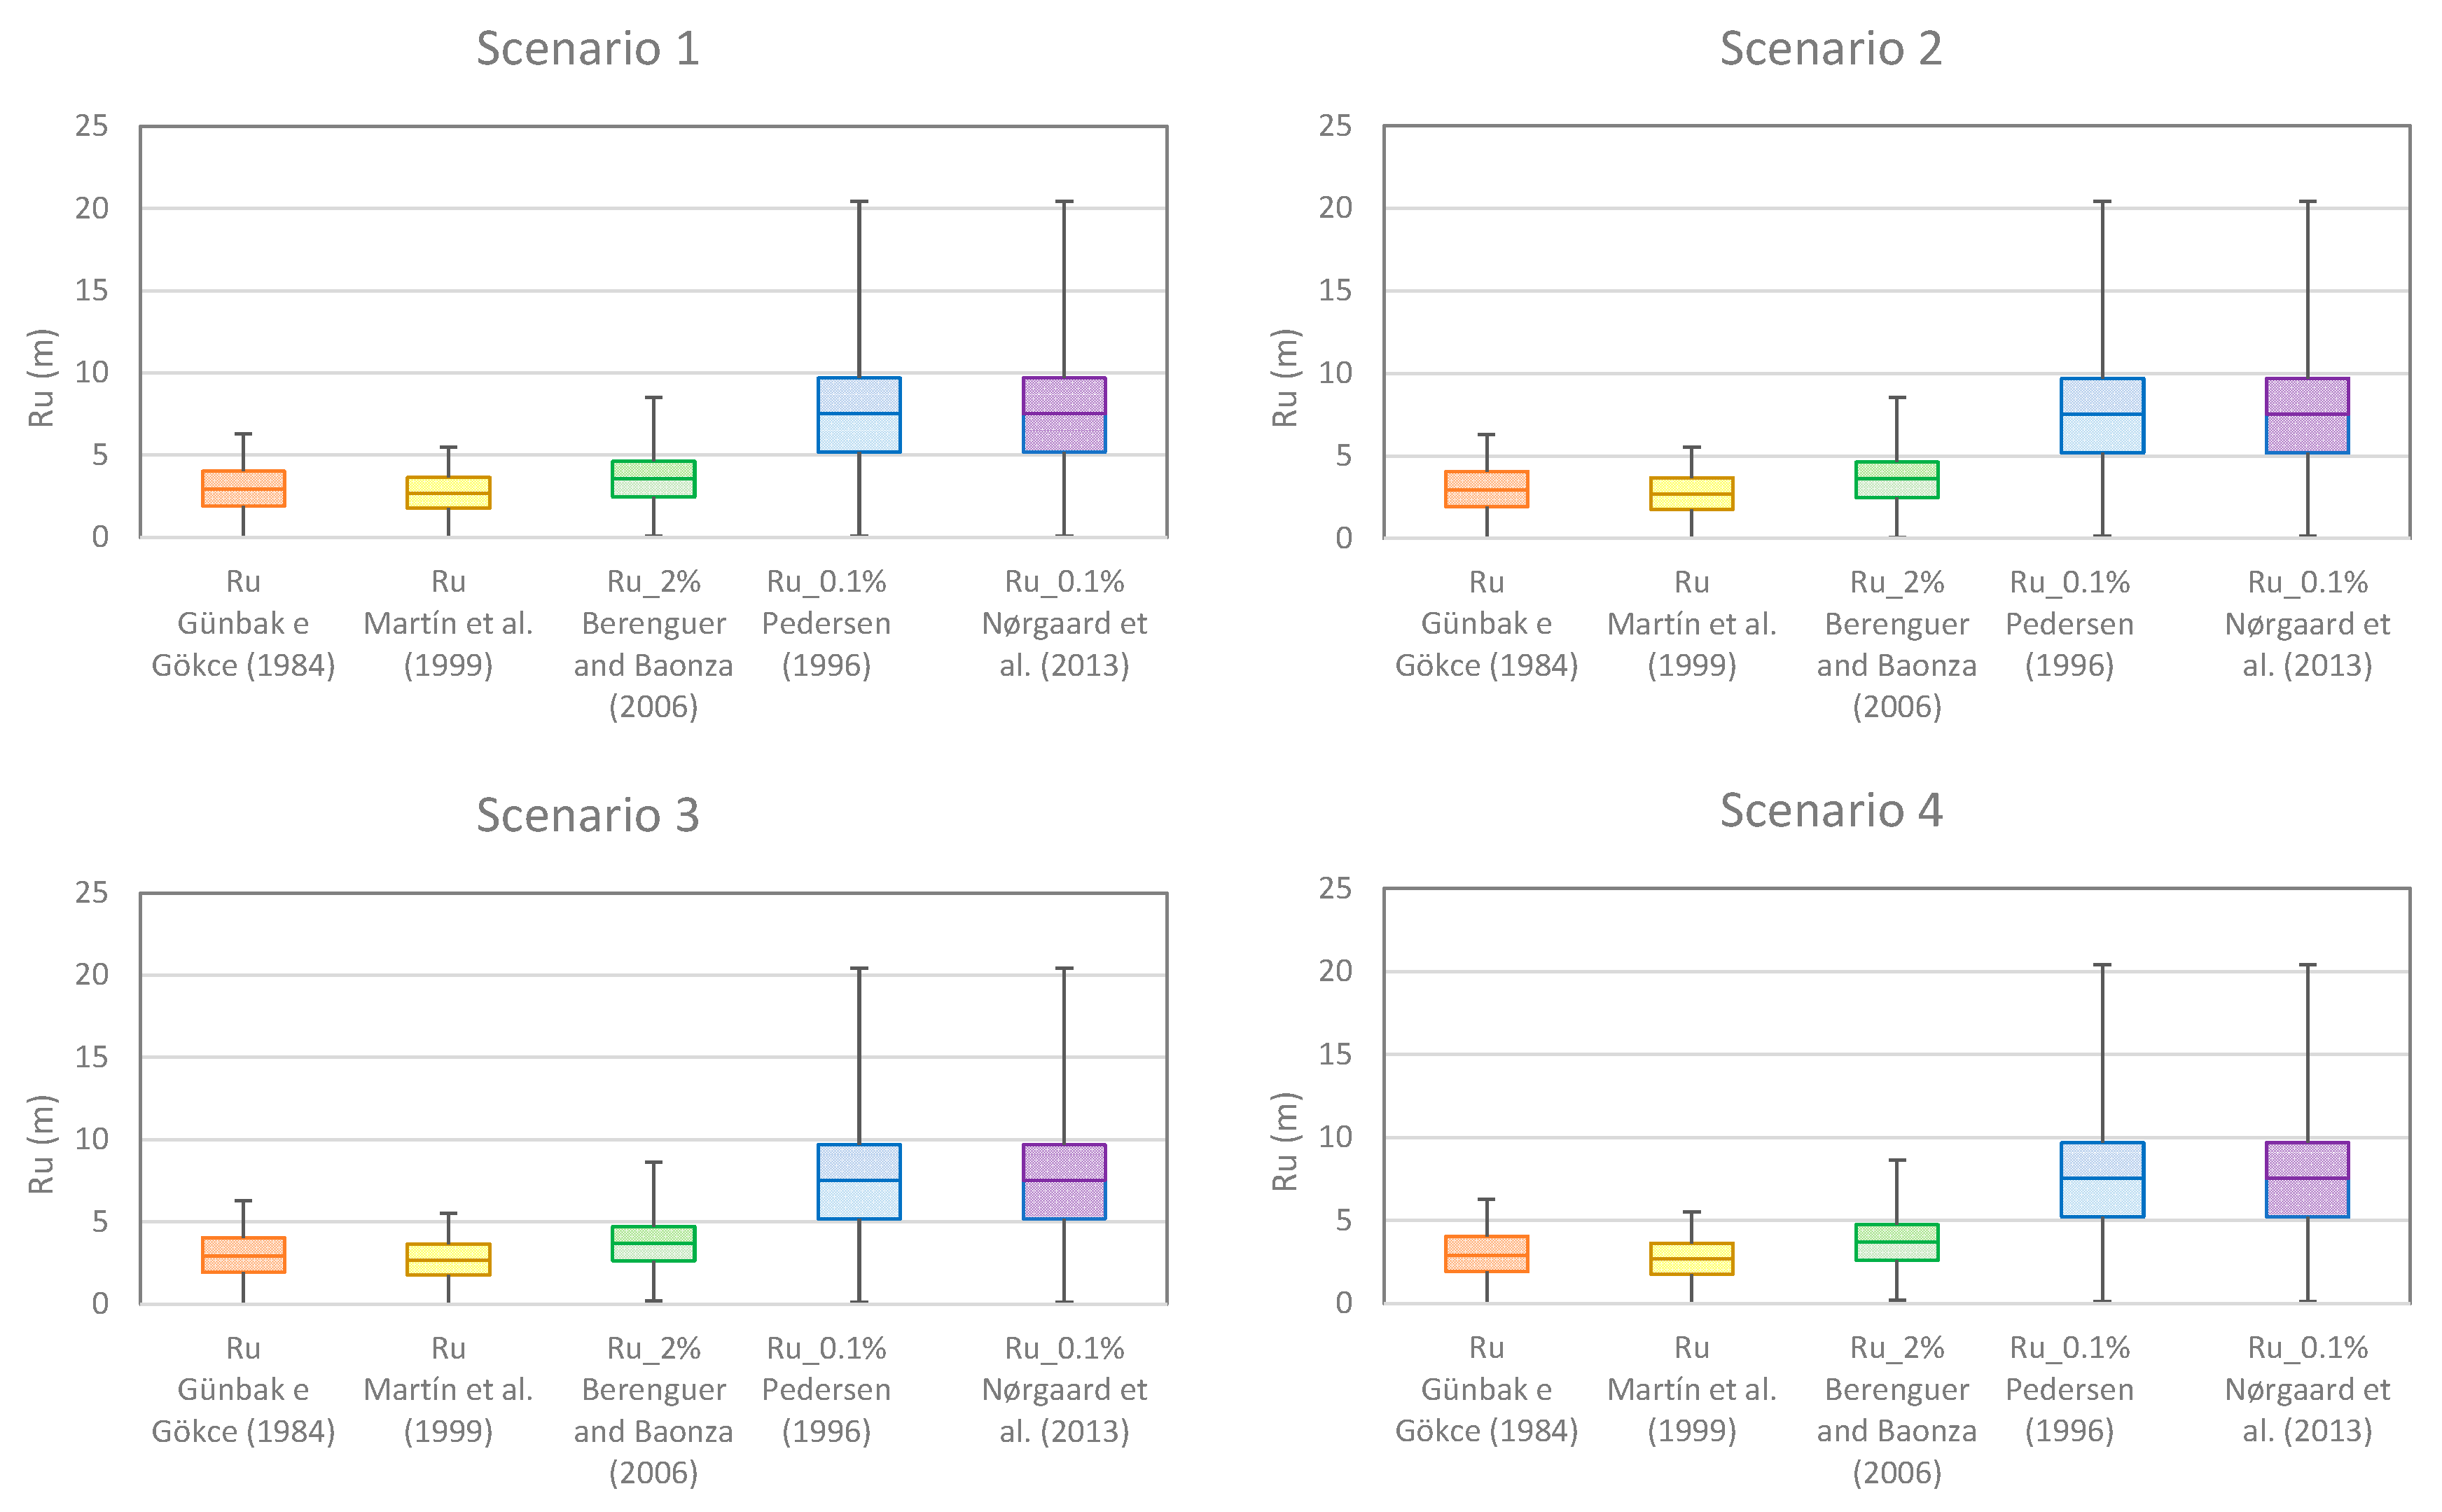
To compare the results presented previously, firstly values of run-up, a very important parameter, are compared for each equation and scenario for the case study,
Figure 20. As it can be observed in the figure, run-up values are highest in the case of Pedersen and Nørgaard et al., followed by Berenguer and Baonza, Günbak and Gökce, and Martín et al. Pederson and Nørgaard et al., calculate R
u0.1% as well as Günbak and Gökce and Martín et al. However, Pederson and Nørgaard et al. consider the Irribaren number in deep water, leading to higher run-up values and a wider range of values. Berenguer and Baonza calculate R
u2% but take the wave direction into account in the run-up whereas the other formulations have not. Jensen and Bradbury forces does not depend on R
u. This happens in the four scenarios, reaching similar values in all of them. The run-up value does not considerably change with the water level because the difference is only in the ξ
0 value, and ξ
0 does not change significantly. Run-up formulas depend on the average porosity, H or H
max, and ξ
m0. Since changes in A
c have no influence on R
u, the value of R
u in the four scenarios is the same.
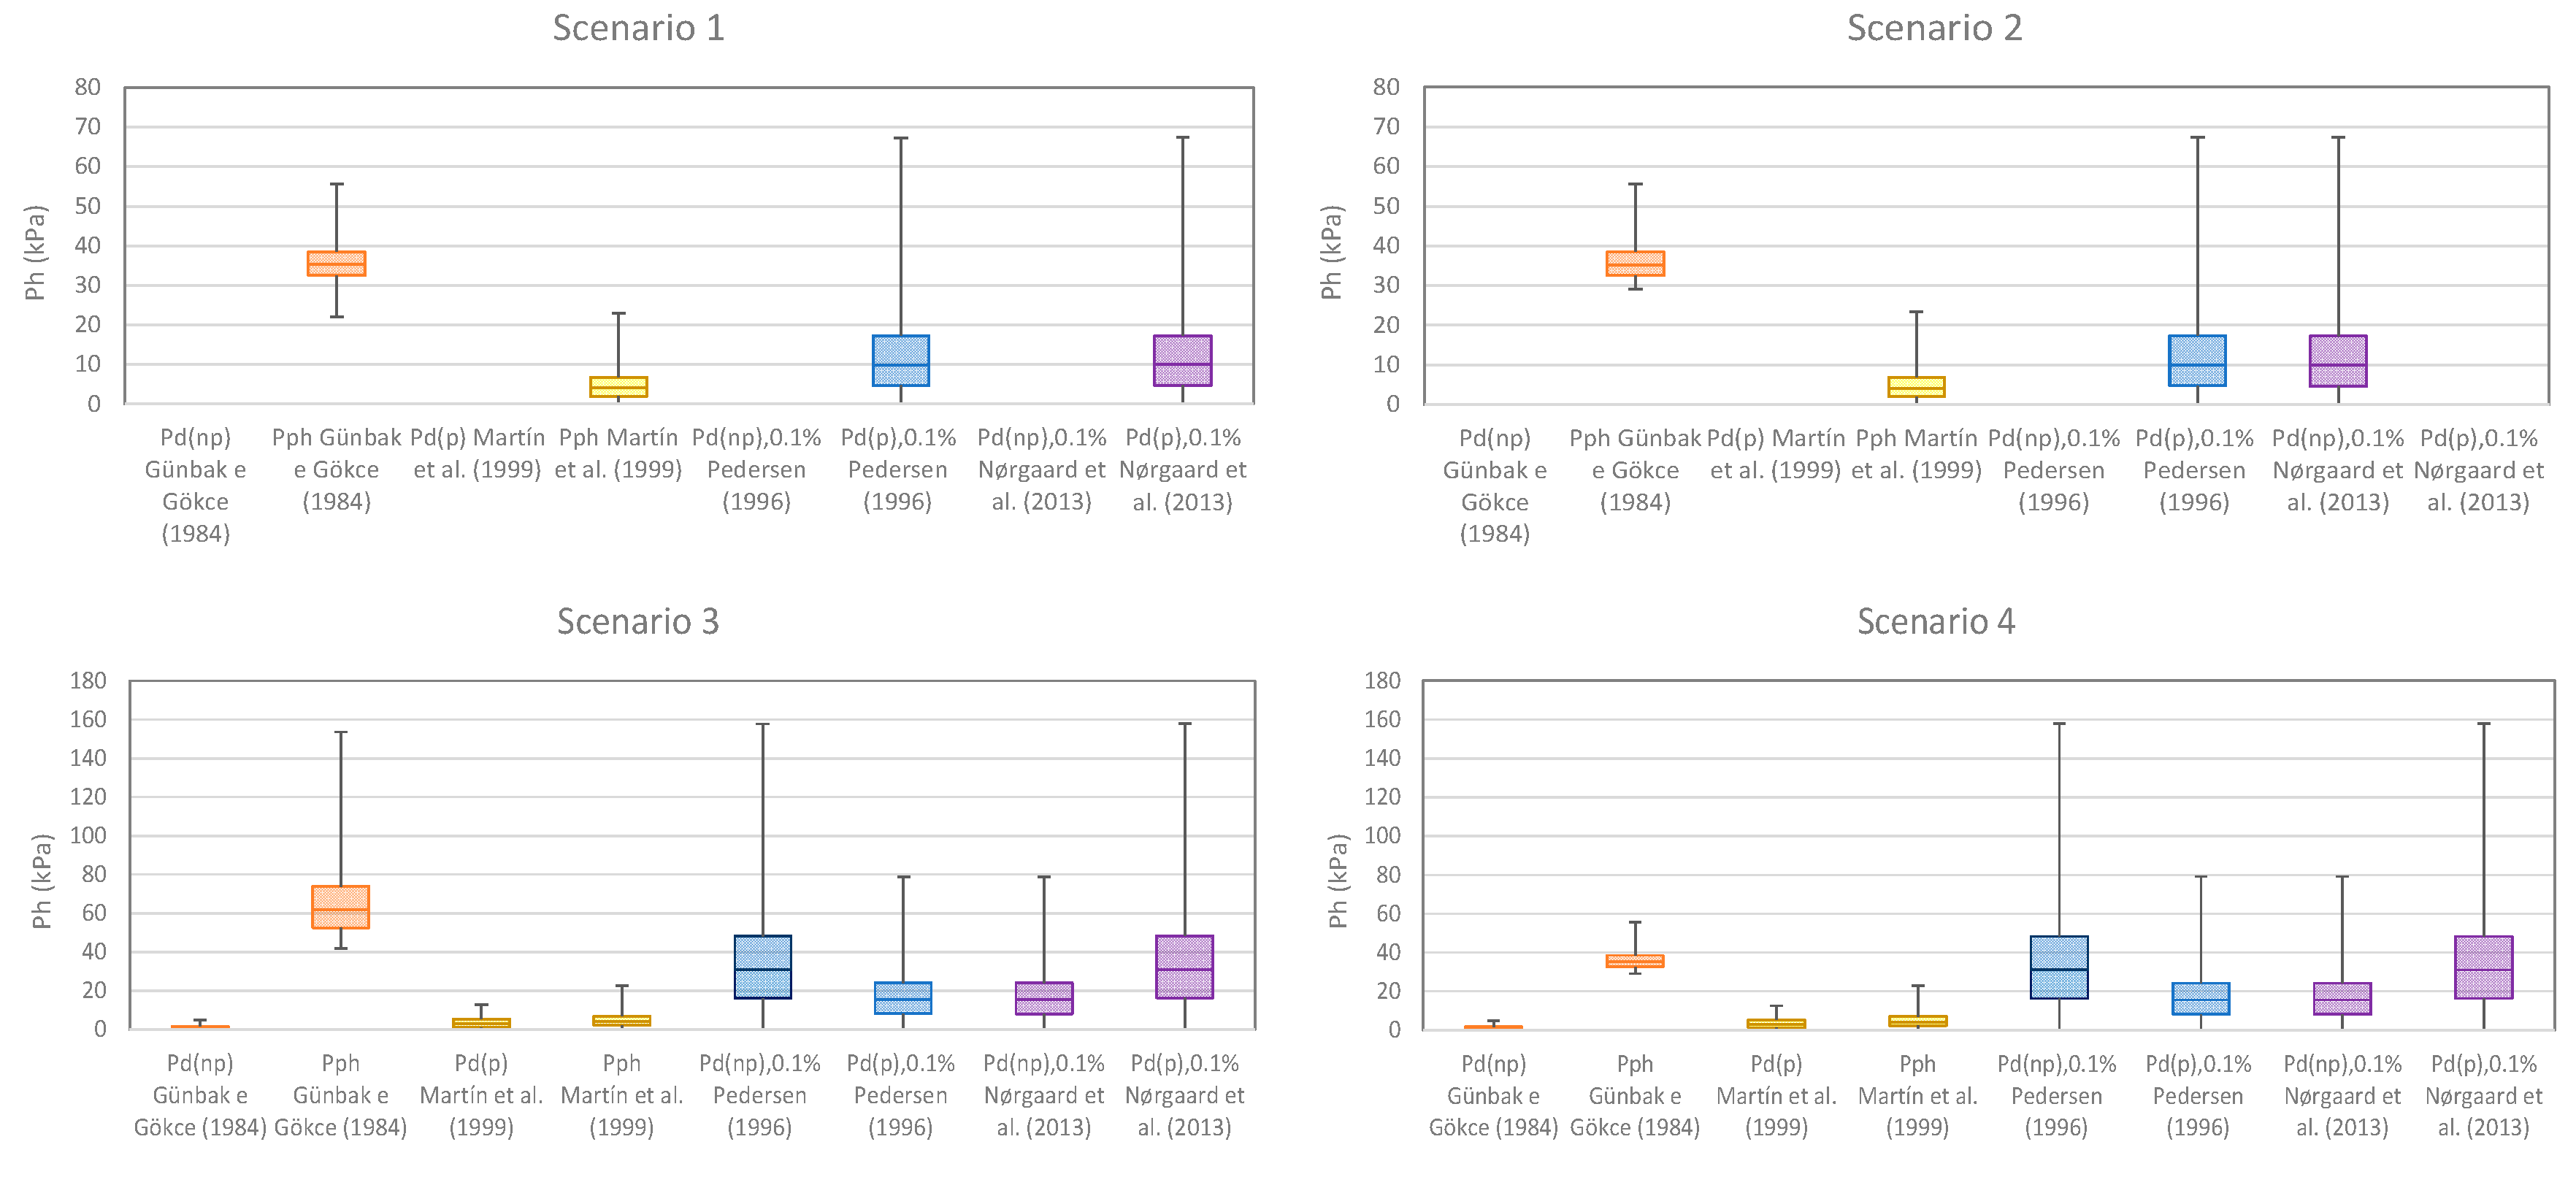
Figure 21 allows to compare the values of horizontal pressures for the four equations analyzed in this paper where pressure is calculated (Jensen and Bradbury and Berenguer and Baonza calculate forces directly) and for the four scenarios. As it can be observed, the values for the first and second scenarios are very similar. This is because the only difference between both scenarios is the sea level, and the difference is very small to imply high variation in the forces. Differences among the third and fourth scenarios with the first scenario values are expected because of the damage in the armor. In fact, the comparison between the third and fourth scenario gives similar values except in the case of Günback and Gökce. On the other hand, horizontal pressure values are the highest in the case of Günbak and Gökce, followed by Pedersen and Nørgaard, and later by Martín et al. The higher maximum value and the wider range of values obtained by Pederson and Nørgaard et al. follow the trend presented in R
u, presented before. The lower values of Martin’s formulation could be because in this formulation, unlike the others analyzed here, the effect of B
e and the material of the armor in the energy dissipate into the structure.
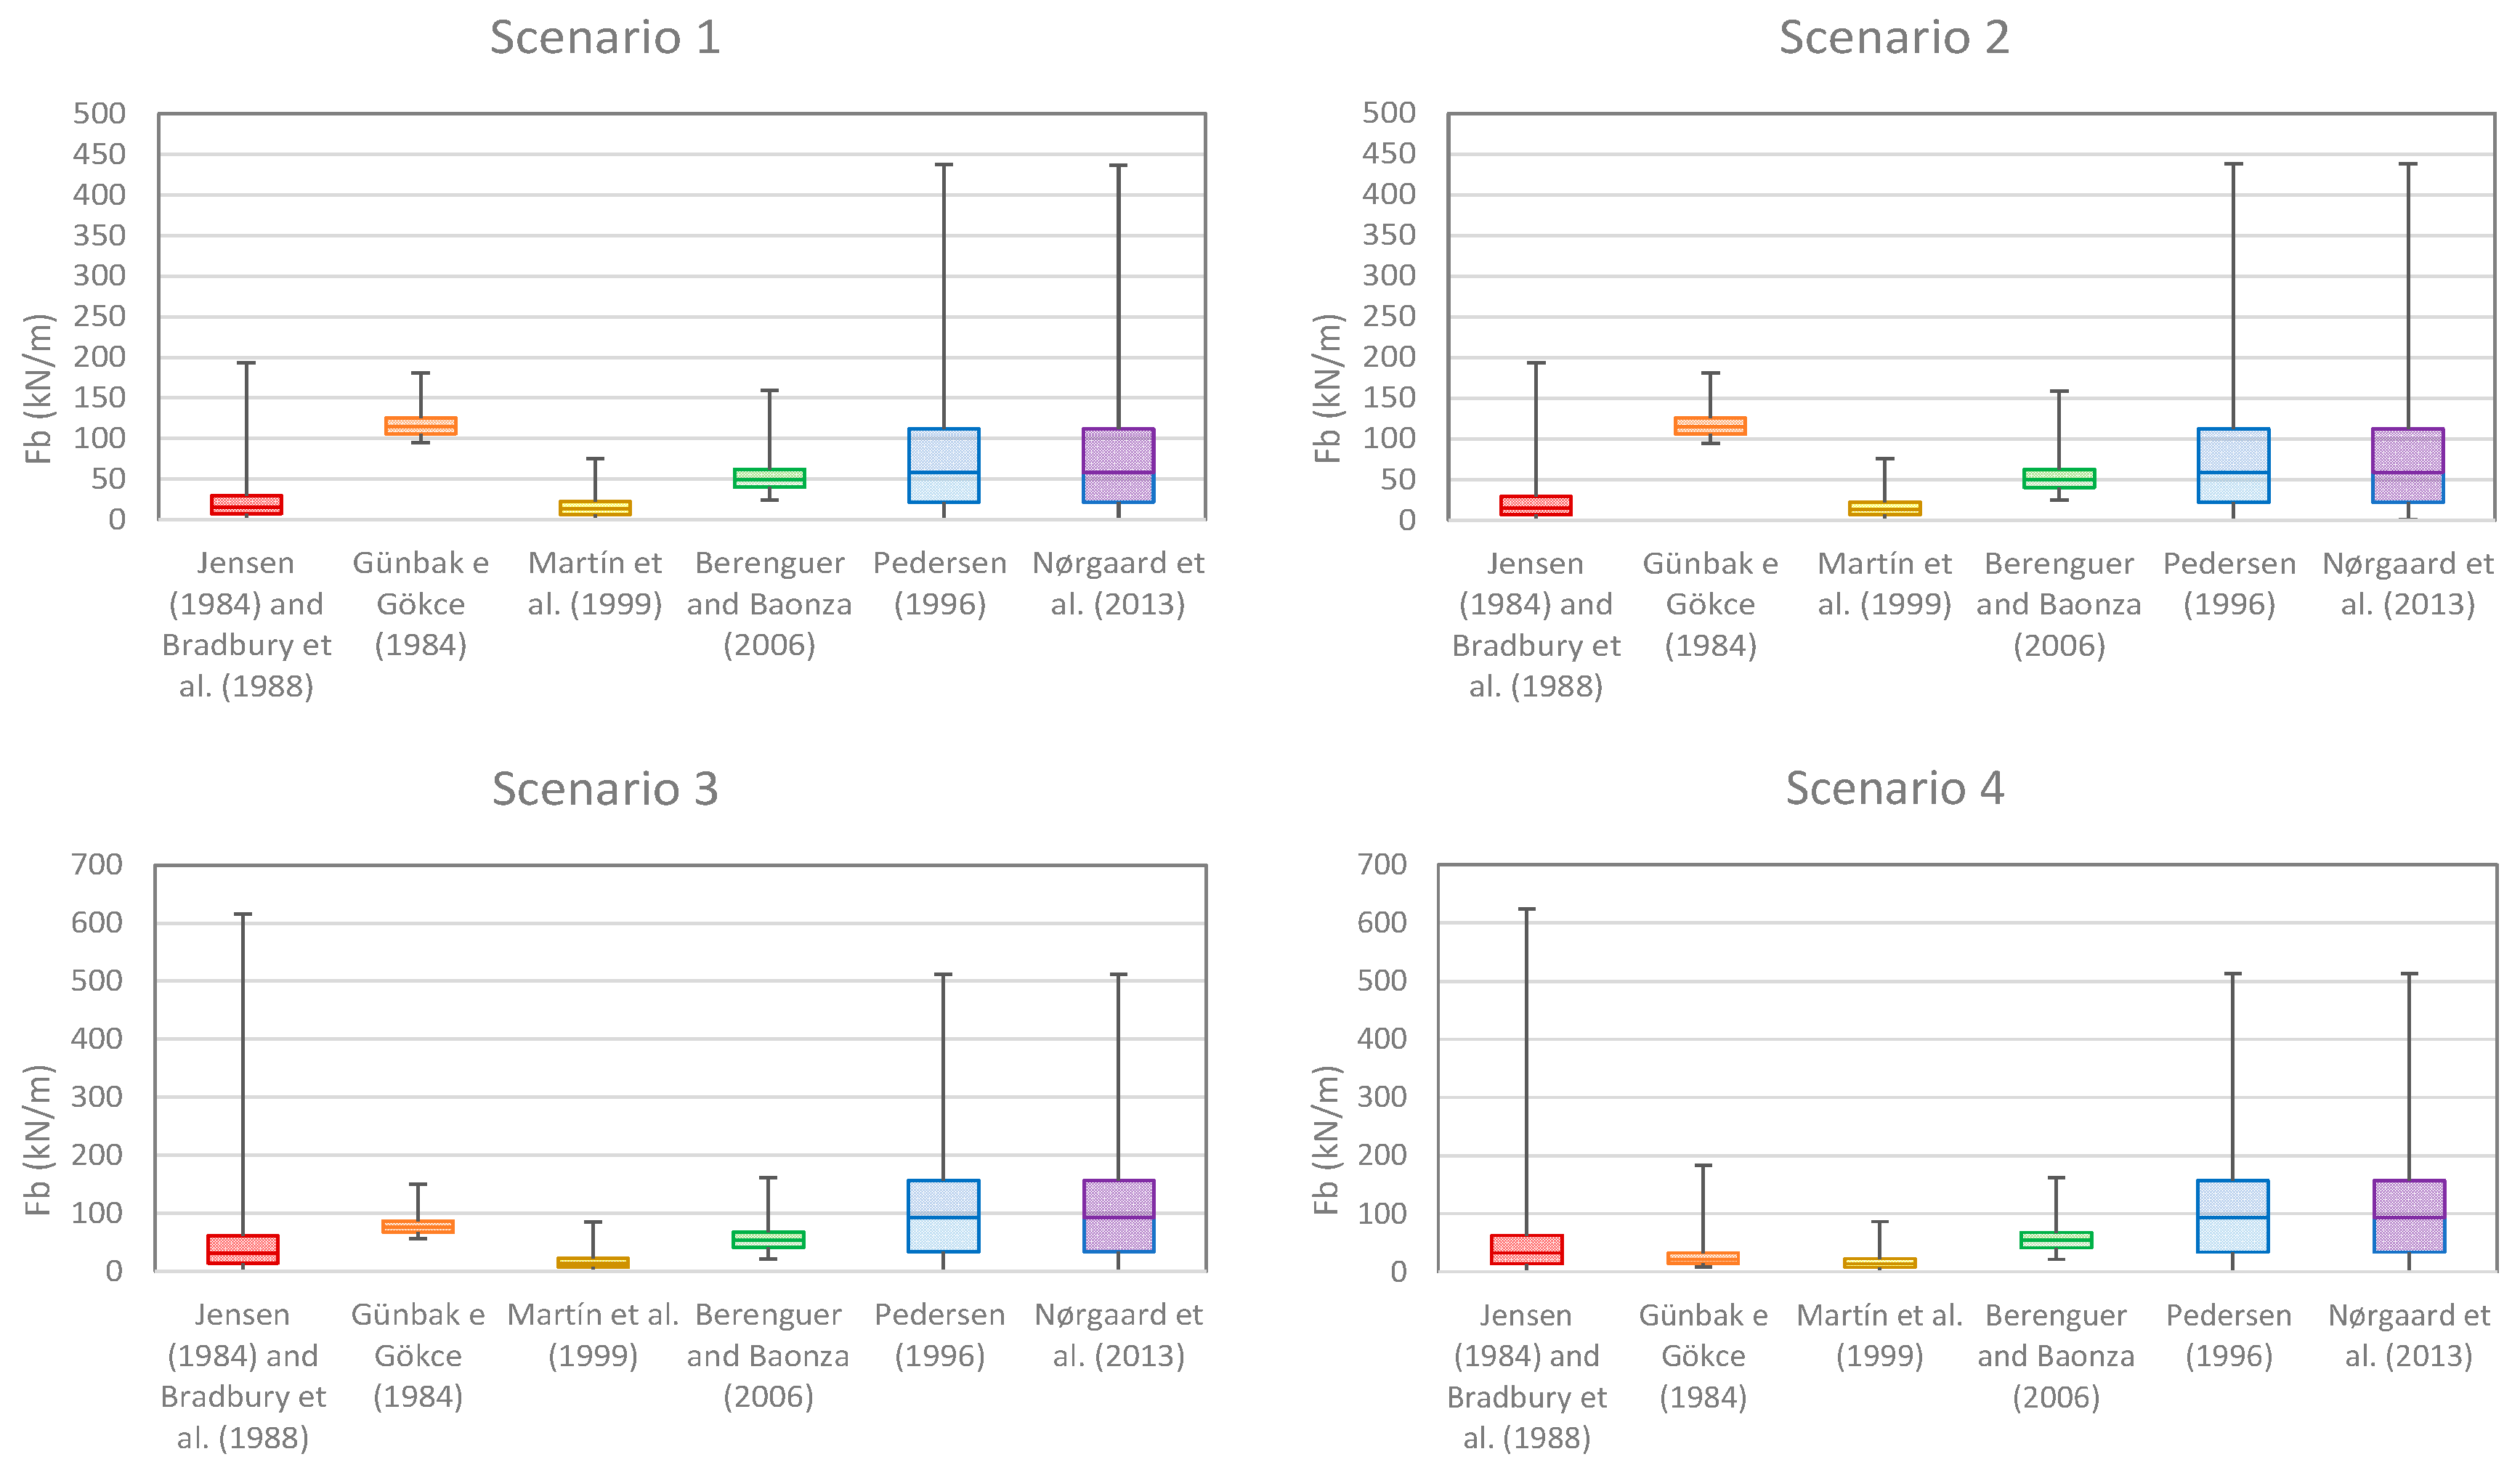
The same aspects observed in the previous figure can be concluded for horizontal forces analyzing
Figure 22: scarce differences between scenarios 1 and 2, and the same happens when comparing scenarios 3 and 4. The justification is the same as previously exposed: the low sea level variation in the area due to the climate change in the lifetime studied. Horizontal forces differences between scenario 1 and scenario 3 are clear, based on the damage of the armor. Günbak and Gökce is the only formulation were the reduction in A
c leads to a reduction in horizontal forces. In fact, the A
c reduction leads to a reduction in the pseudo-hydrostatic pressure and consequently in horizontal forces. On the other hand, medium horizontal forces from highest to lowest values are according to the following equations: Pedersen and Nørgaard, followed by Günbak and Gökce, Berenguer and Baonza, Jensen and Bradbury, and Martín. As referred to previously, Pedersen and Nørgaard consider H
0.1% as the wave height parameter, leading to the higher maximum values of R
u and P
d, as referred to before and consequently, higher maximum values of horizontal forces. Martin and Berenguer and Baonza formulation have the lower values and this could be due to the fact that these formulations, unlike the others analyzed here, have taken into account Be and the material of the armor on the energy dissipation. Moreover, Berenguer and Baonza only allow considering blocks or rip-rap, while Martín et al. allow considering tetrapods that have a higher porosity value leading to lower R
u values.
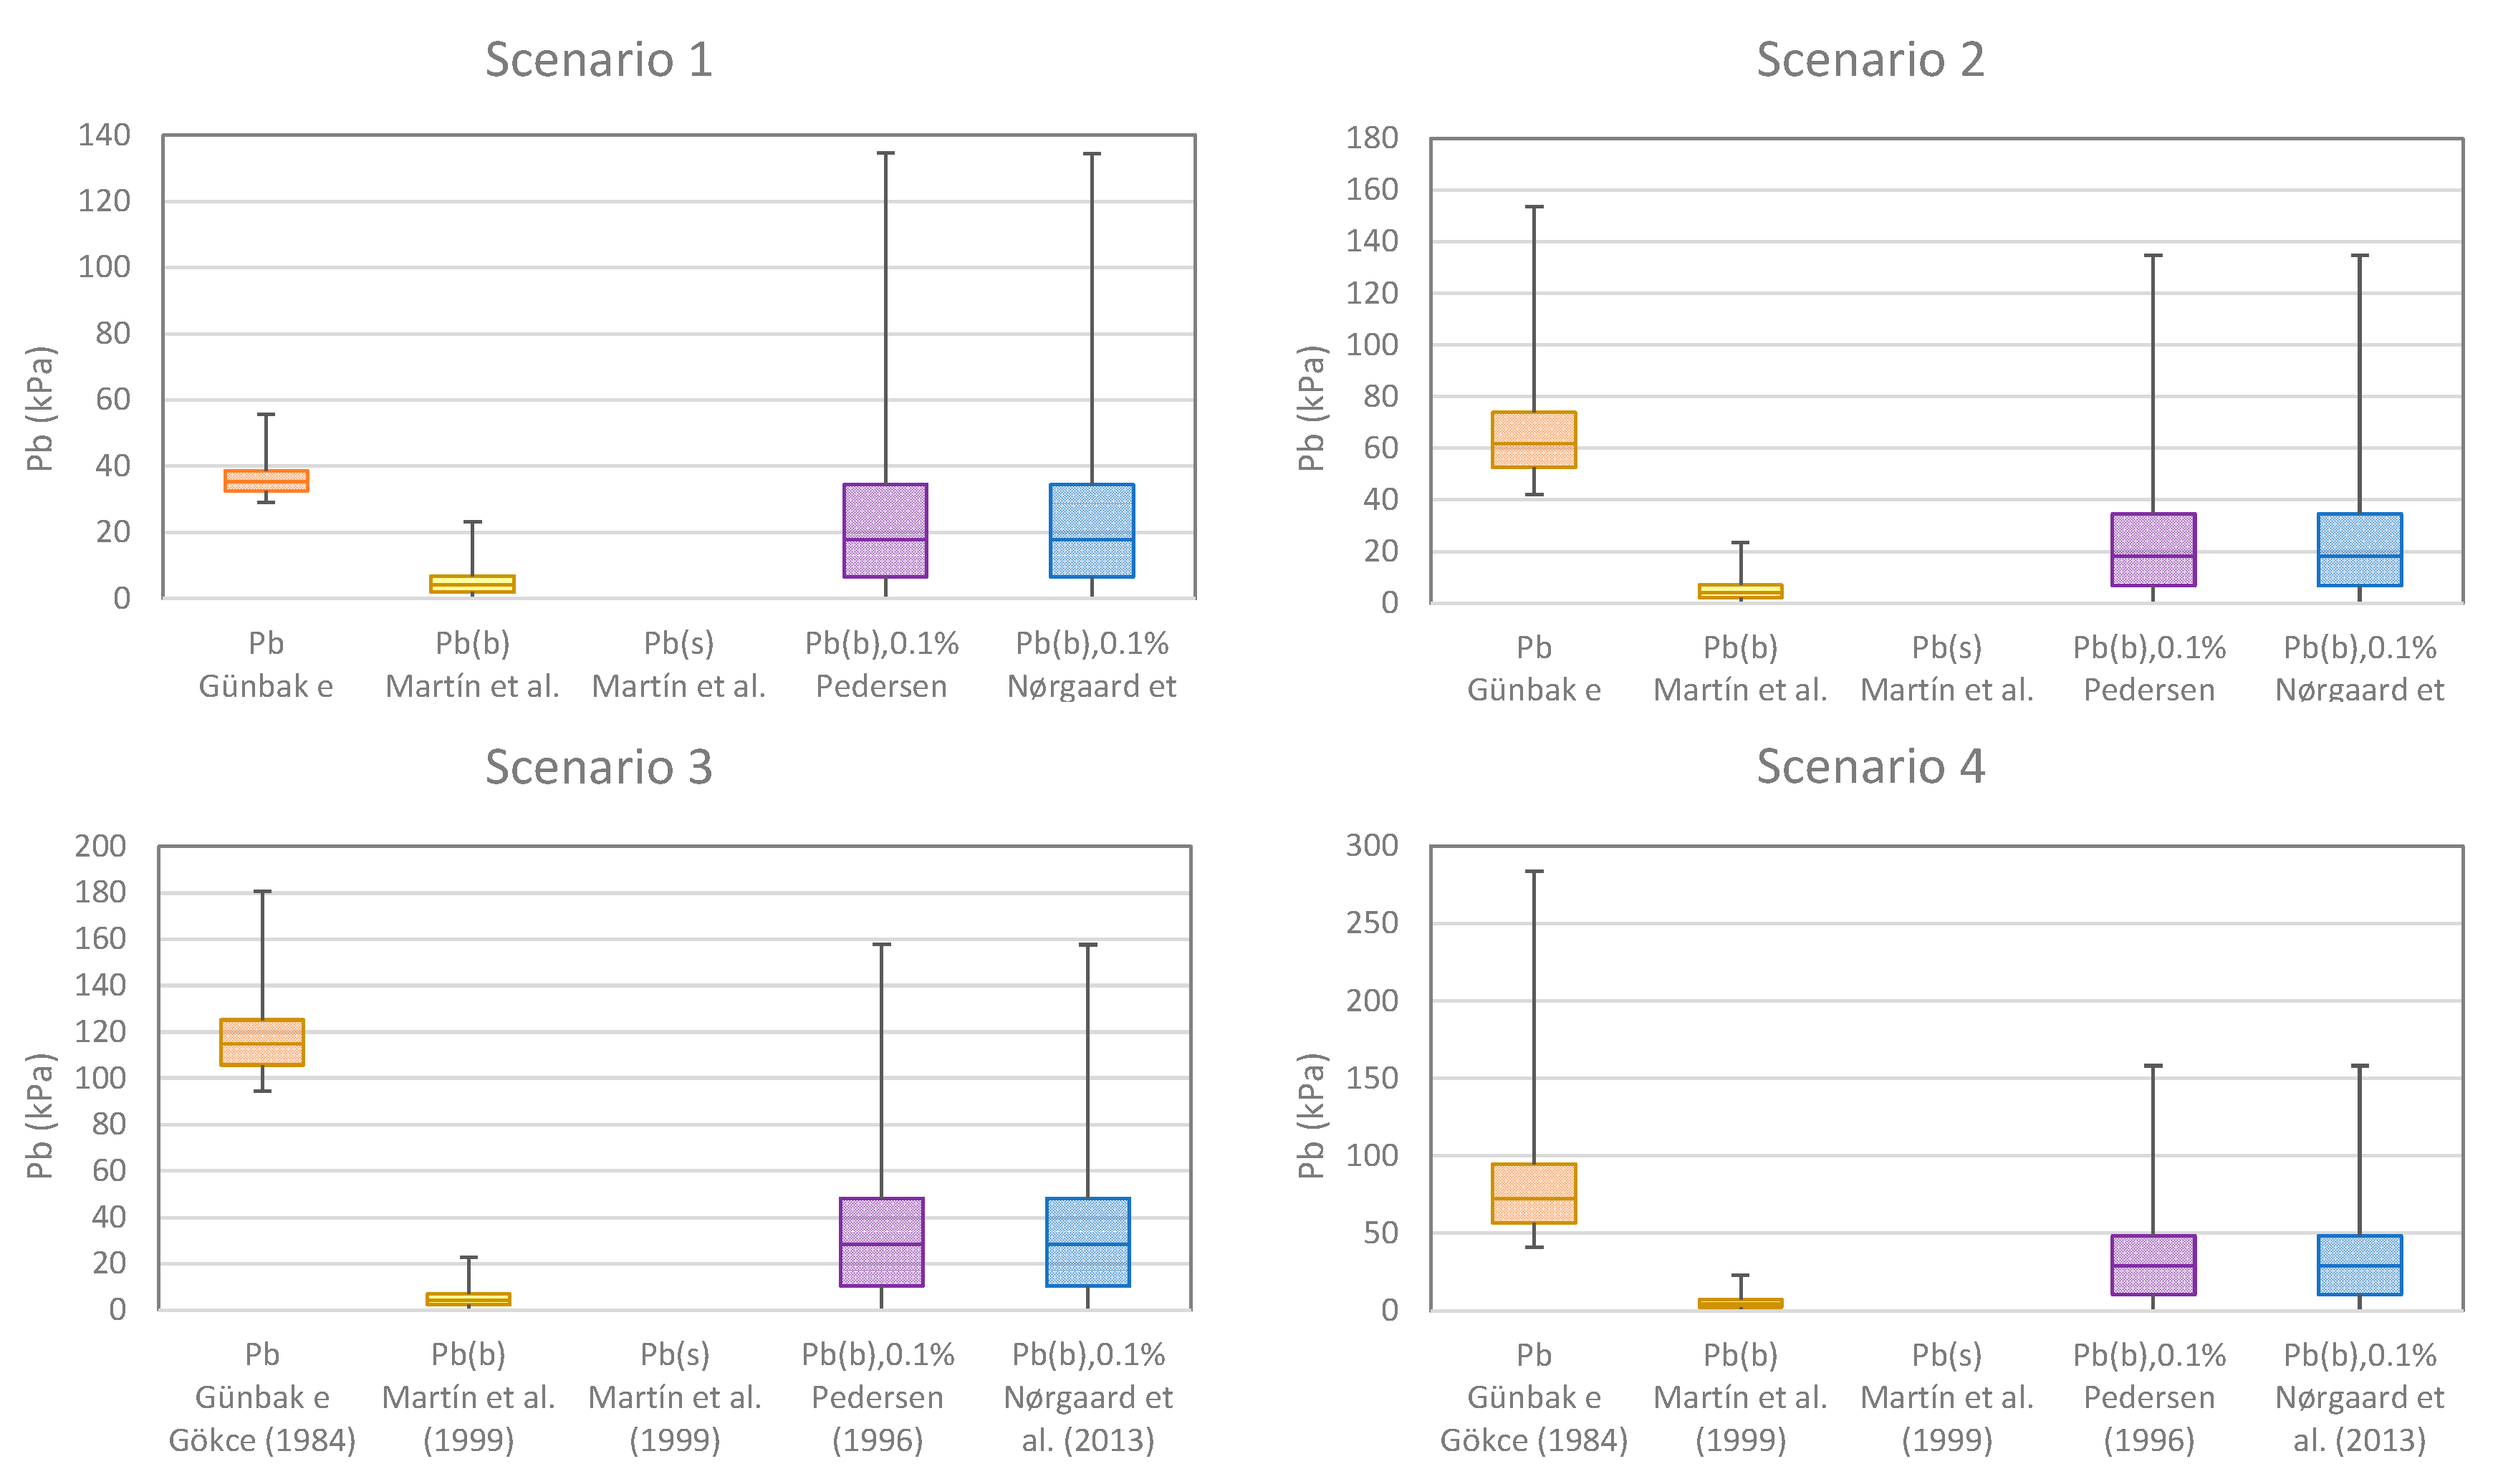
Uplift pressure action values considerably change depending on the scenario in the case of Günbak and Gökce, but it is similar in the rest of the equations (
Figure 23). On the other hand, uplift pressure action values from highest to lowest values are according to the next equations: Günbak and Gökce, followed by Pedersen and Nørgaard, and Martín. The trend is the same as in the horizontal pressure, for the same reasons already explained since the uplift pressure depends on the horizontal pressure in the base of the superstructure.
Uplift forces follow the pressure trend, with the change depending on the scenario in the case of using the Günbak and Gökce equation and the Pedersen and Nørgaard (
Figure 24). On the other hand, sub-pressure action values from highest to lowest values are according to the next equations: Günbak and Gökce, followed by Pedersen and Nørgaard, Berenguer and Baonza, Jensen and Bradbury, and Martín.
Moments present the same trend as forces, for the reasons presented before. Safety coefficients Cdes (sliding) and Cder (overtuning) present a small reduction between scenarios 1 and 2. This was expected, since the sea level rise considered is small and leads to small differences in forces and momenta. However, this decrease was more accentuated in scenarios 3 and 4 for all formulations since the reduction in Ac leads to a considerable increase in the forces and momenta calculated by the formulations. The only exception is that of the results of the Günbak and Gökce equation, where the opposite occurred, for the reasons explained before. Nørgaard and Pedersen is the only formulation with values of Cder less than 1.2, as the forces and momenta calculated by this formulation lead to higher values of forces and momenta, as referred to previously.
6. Conclusions
Calculating the forces on the crown walls is not a simple task. There are several equations that have been sanctioned by practice, so it is necessary to know the calculation hypotheses of each of them and check that the section under study fits those hypotheses. The methods of calculation of the crown walls respond to very different criteria in terms of schemes (forces or pressures), slopes and shape of the crests. To cite some examples, in the case of schemes, Martin et al. (1999) provides pressures or Pedersen and Burcharth (1992) and Berenguer and Baonza (2006) provide forces. In the case of slopes, Bradbury et al. (1988) for slopes 2/1, Martín et al. (1999) with slope 3/2 and Günbak and Gökce (1984) with slope 2/5. In addition, the geometry considered in all of them is with the mantle berm below the crest of the crown wall. Therefore, great caution should be exercised in using any crown wall calculation expression because of its dispersion in results and scenarios or because of the uniqueness in the geometry that does not exactly fit the application ranges of the known formulas.
Ericeira breakwater has a different geometry. It is a crown wall completely protected by the outer armor and the artificial blocks that form the armor are interlocking pieces (tetrapods). With all this, it can be observed that energy transmission takes place before reaching the parapet. It should also be noted that wave periods of high value can be recorded which, together with a macro-tidal tidal range, can lead to the presence of combinations of broken and unbroken waves on the armor. For the Ericeira crown wall, in the 11 years of data analyzed, only few or no wave conditions follow within the range of all parameters where the analyzed formulas are valid. Thus, for this structure, the formula should be used out of the limits of application proposed by the authors.
For this case, the values of the horizontal forces are more conservative in the case of the Pedersen and Nørgaard equations, the lowest value being that of Martin. With respect to the uplift pressures, Martin’s is still the least value, while for scenarios 1 and 2 the most conservative is Günbak and Gökce’s, and for scenarios 3 and 4, Pedersen and Nørgaard’s as in the case of the horizontal forces. Günbak and Gökce’s is the only formulation where damage to the main armor by losing pieces at the berm led to a reduction in forces, which was not expected. Furthermore, it can be observed that notable difference between the values of the forces when each of the formulas was used, which forces further research in this field since these variations imply important differences in the design of the crown walls.
For all scenarios, a sliding safety coefficient was more a conditioning than overturning safety coefficient. The increase in the sea level for the case study was not significant to the stability of the crown wall and therefore its incidence is very small. This does not mean that, in other regions of the world, where the rate of sea level rise per year is more important, the influence of sea level rise is not a determining factor in the design. On the other hand, damage to the main armor by losing pieces at the berm is much more important in this case study, so it is essential to carry out the proper maintenance of the design section.


 ,
, 


