Article

On the Slope Stability of the Submerged Trench of the Immersed Tunnel Subjected to Solitary Wave

1
Institute of Geotechnical Engineering, Nanjing Tech University, Nanjing 210009, China
2
School of Civil Engineering, Sun Yat-Sen University, Guangzhou 510275, China
*
Author to whom correspondence should be addressed.
J. Mar. Sci. Eng. 2021, 9(5), 526; https://0-doi-org.brum.beds.ac.uk/10.3390/jmse9050526
Submission received: 19 March 2021 / Revised: 5 May 2021 / Accepted: 7 May 2021 / Published: 13 May 2021
(This article belongs to the Special Issue Structure-Seabed Interactions in Marine Environments)

Abstract

:
Wave is a common environmental load that often causes serious damages to offshore structures. In addition, the stability for the submarine artificial slope is also affected by the wave loading. Although the landslide of submarine slopes induced by the waves received wide attention, the research on the influence of solitary wave is rare. In this study, a 2-D integrated numerical model was developed to investigate the stability of the foundation trench under the solitary wave loading. The Reynolds-averaged Stokes (RANS) equations were used to simulate the propagation of a solitary wave, while the current was realized by setting boundary inlet/outlet velocity. The pore pressure induced by the solitary wave was calculated by Darcy’s law, and the seabed was characterized by Mohr–Coulomb constitutive model. Firstly, the wave model was validated through the comparison between analytical solution and experimental data. The initial consolidation state of slope under hydrostatic pressure was achieved as the initial state. Then, the factor of stability (FOS) for the slope corresponding to different distances between wave crest and slope top was calculated with the strength reduction method. The minimum of FOS was defined as the stability index for the slope with specific slope ratio during the process of dynamic wave loading. The parametric study was conducted to examine the effects of soil strength parameters, slope ratio, and current direction. At last, the influence of upper slope ratio in a two-stage slope was also discussed.

1. Introduction

With the continuous breakthrough of key technologies in the tunnel construction [1], underwater tunnels gradually became important means to cross rivers, lakes, and seas. The immersed tube tunnel is widely used in the submarine constructions for its advantages of being suitable for soft ground, having short construction periods, and saving engineering costs. In general, the excavation of an underwater foundation trench forms the temporary underwater slope, the stability of which has a significant impact on the safety of the whole construction.
The stability of foundation under different environment conditions is always a crucial issue in the design of offshore structures. Seismic load and wave load are two common types of marine environment loading. The effects of seismic load acting on a seabed or an offshore structure attracted a great deal of attention in the past decades [2,3,4,5]. Although the wave load is more common compared with the seismic action, the attention paid to the submarine slope under wave loading is not enough. A significant change in the pore pressure is induced in the seabed as the propagation of wave. The pressure exerted on the slope increases under the wave crest, and it may result in significant displacements of slope [6]. Even if the artificial slope is temporary, its stability under wave loading needs to be guaranteed until the end of the construction. In order to reduce the impact on both coastal environment and financial resources, the volume of earth excavation should be as small as possible on the premise of stability [7].
Wave-induced responses in the seabed and offshore structures are widely studied. Some analytical studies were performed to investigate the changes of the wave-induced pore pressure and stresses in a seabed [8,9,10,11]. Liu et al. [12] carried out an experimental study of wave-induced pore pressures in marine sediments and discussed the influences of parameters of wave and soil on the wave-induced liquefaction. Zhang et al. [13] developed a 3-D finite element method (FEM) model to simulate wave-induced response and considered the non-homogeneous soil properties. Considering the engineering applications, many investigations on the interaction between waves, seabed, and structures were conducted [14,15,16,17,18,19]. However, few studies addressed the issue related to the slope stability of temporary foundation trench for the immersed tunnel under wave loading. Most of the existing works concentrated on the regular linear waves such as progressive waves, neglecting the nonlinear waves [20].
Solitary wave is a kind of nonlinear wave often used to model the leading waves of storm surges, such as tsunami, in many studies [21,22,23]. Concerning the interaction between solitary waves and coastal structures, some research focused on the processes of a solitary wave running up and running down on a uniform slope. Synolakis [24] measured the free wave surface of a solitary wave on slope through the experiment. Summer et al. [25] conducted two parallel experiments of the solitary wave running up, breaking, and falling on the sloping seabed and measured shear stresses and pore water pressure. Young et al. [26] used the numerical method to predict liquefaction failure probability of slope on a sandy coast caused by solitary waves and obtained the distribution of transient pressure, displacement, and subsurface pore water pressure near the slope. Based on this, Xiao et al. [27] further investigated the parameters that affect the maximum liquefaction depth, such as soil permeability, cross-shore location, and offshore wave heights. Although the aforementioned studies concentrated mainly on the offshore slopes, the research on the stability of the artificial slope subjected to the solitary wave is still rare.
The objective of this study was to investigate the foundation trench for the immersed tunnel under the solitary wave loading based on a two-dimensional (2D) integrated model. The Reynolds-averaged Navier–Stokes (RANS) equations combined with k-ε turbulence were adopted to simulate the solitary wave. The current was realized by setting boundary inlet and outlet velocity. In order to assess the stability index of the elastic–plastic slope, Darcy’s law and Mohr–Coulomb yield criteria were used for the calculation of pore pressure. With the wave model verified, the dynamic response and the specific failure mode of trench slope were then analyzed. Discussion on the effects of soil strength parameters, slope ratio, and current direction on the slope was carried out through parametric studies. Considering that the trench slopes in practical engineering are often the slope with two stages or more, the influence of the upper slope ratio on the whole two-stage slope was investigated at last.

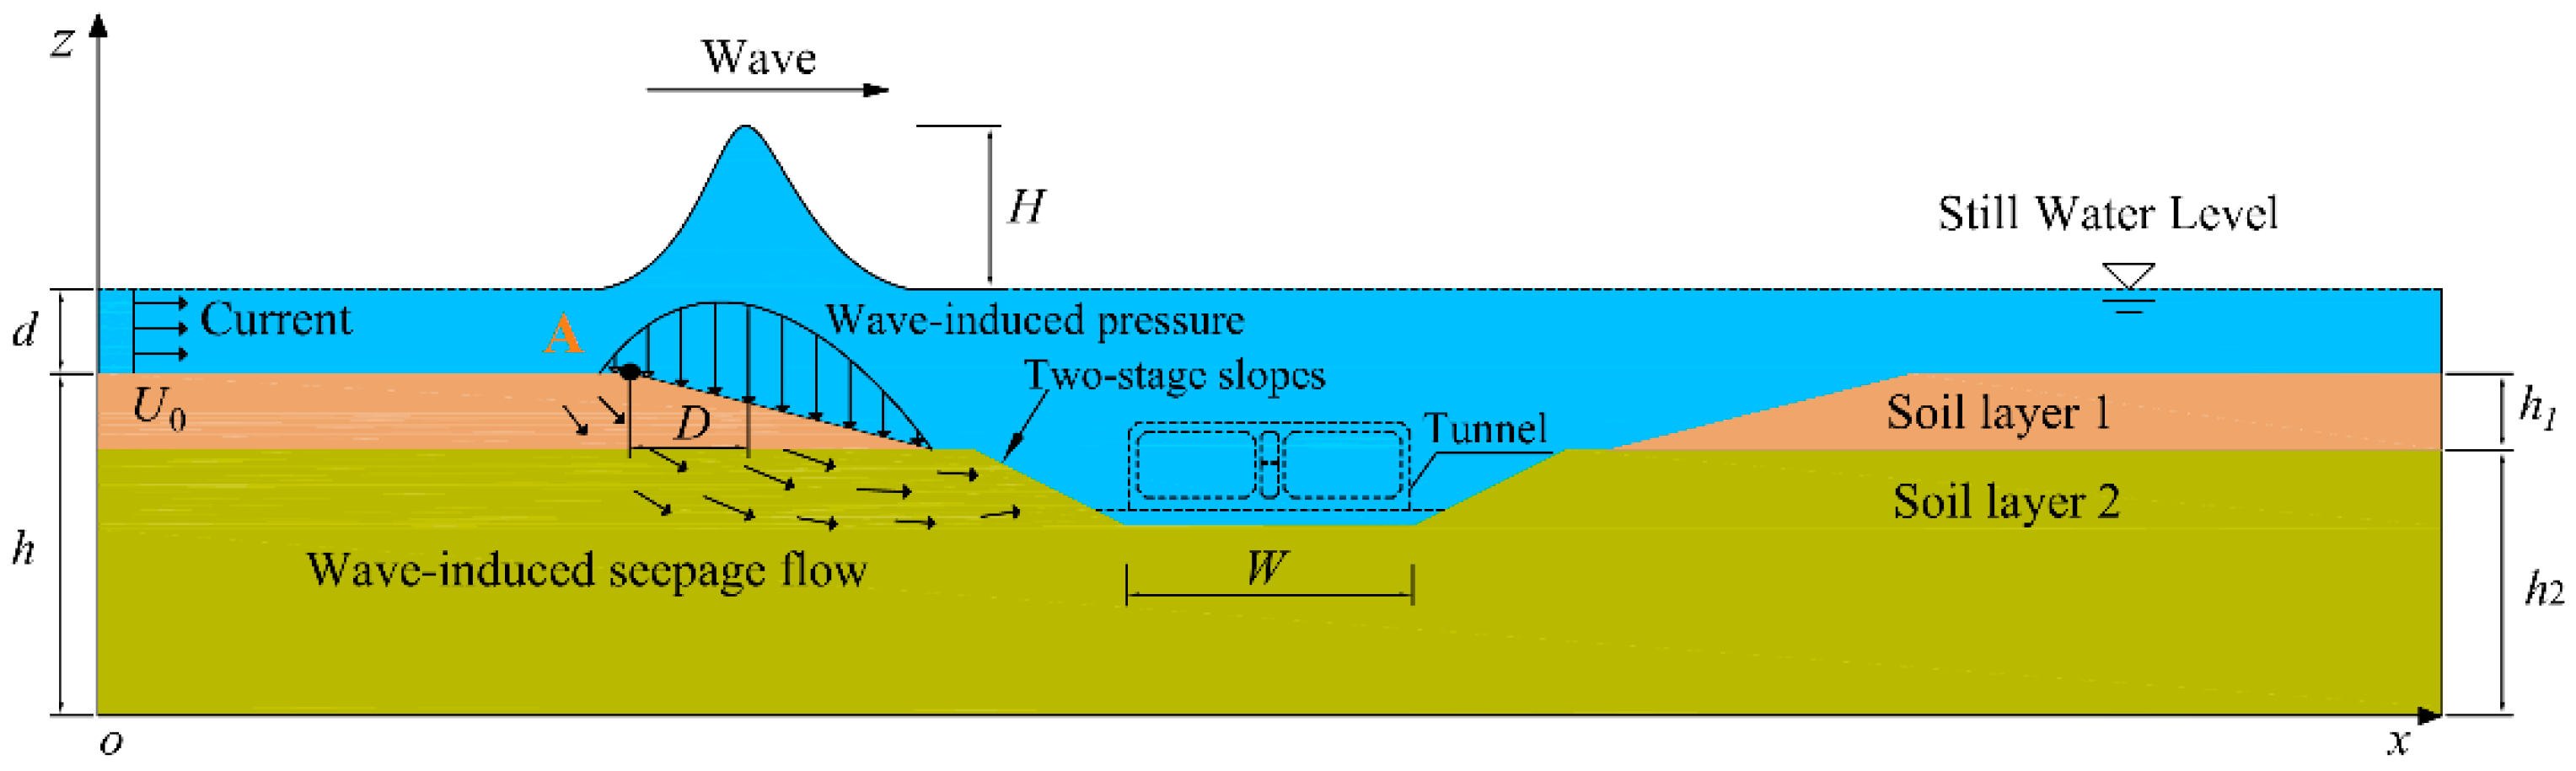
2. Theoretical Formulations

The 2-D model consisted of two sub-models: A wave–current model and a seabed model. The sketch of the numerical model for an artificial submarine slope under the combined action of current and solitary wave is shown in Figure 1. x and z are the Cartesian coordinates, h is the thickness of seabed, h1 is the thickness of soil layer 1, h2 is the thickness of soil layer 2, D is the relative distance between the wave crest and the slope top of the left slope, H is the height of the solitary wave, W is the width of the trench, B is the height of the trench, d is the water depth, and U0 is the initial current velocity.

2.1. Wave–Current Sub-Model

In this study, FLOW-3D, which uses the finite difference method to solve the Navier–Stokes equation, was adopted to simulate the propagation of solitary wave. The free surface motion was computed with a true volume of fluid (VOF) method [28,29], and the complex geometric regions were modeled by the fractional area/volume obstacle representation (FAVOR) technique [30].

2.1.1. Continuity Equations and Momentum Equations

The flow was assumed to be incompressible and viscous fluid; the continuity equation in Cartesian coordinates can be expressed as:
x ( u A x ) + y ( v A y ) + z ( w A z ) = 0
where (u, v, w) are the velocity components in the coordinate direction (x, y, z); A x , A y and A z are the fractional areas open to flow in x, y, and z directions.
The momentum equations of motion for the fluid velocity components (u, v, w) in the three coordinate directions were the Navier–Stokes (N–S) equations with some additional terms. The general N–S equations are described as:
u t + 1 V F { u A x u x + v A y u y + w A z u z } = 1 ρ p x + G x + f x v t + 1 V F { u A x v x + v A y v y + w A z v z } = 1 ρ p y + G y + f y w t + 1 V F { u A x w x + v A y w y + w A z w z } = 1 ρ p z + G z + f z
where V F is the fractional volume open to flow; p is the water pressure; ρ is the fluid density; ( G x , G y , G z ) are the body accelerations; ( f x , f y , f z ) are the viscous accelerations.

2.1.2. Turbulence Models

The k ε model was demonstrated to provide reasonable approximations for various types of flows [31]. It consisted of two transport equations for the turbulent kinetic energy k T and its dissipation ε T [32].
The two transport equations are as follows:
k t + ( u k ) x + ( v k ) y = x [ ( μ + μ t σ k ) k x ] + y [ ( μ + μ t σ k ) k y ] + G ε
ε t + ( u ε ) x + ( v ε ) y = x [ ( μ + μ t σ ε ) ε x ] + y [ ( μ + μ t σ ε ) ε y ] C ε 1 ε 2 k G C ε 2 ε 2 k
in which
μ t = C μ k 2 ε
G = μ t [ ( u y + v x ) 2 + 2 ( u x ) 2 + 2 ( v y ) 2 ]
where μ is the kinematic molecular viscosity; μ t is kinematic eddy viscosity; k is the turbulent kinetic energy; ε is the turbulent kinetic energy dissipation rate; C μ , C ε 1 , C ε 2 , σ k and σ ε are the empirical constants recommended in the literature [33]. The values in this study were as follows: C μ = 0.09 , C ε 1 = 1.44 , C ε 2 = 1.92 , σ k = 1.0 , and σ ε = 1.3 .

2.1.3. Boundary Conditions for Solitary Wave Generation

In this model, the incident wave boundary was set at the left boundary to generate the solitary wave, as shown in Figure 1. The solitary wave solution was based on McCowan’s theory [34], which has the higher order accuracy than Boussinesq’s theory [35] and is recommended by Munk [36] after detailed examinations. The wave height was assumed to be H. The reference system (x, z) was established with its origin fixed at the bottom. A current existed, and its x-component of undisturbed velocity was u ¯ . The equations for water elevation η, x-velocity u, z-velocity w, and wave speed c are [37]:
η d = N M sin [ M ( 1 + η d ) ] cos [ M ( 1 + η d ) ] + cosh ( M X d )
u ( x , z , t ) u ¯ c 0 = N 1 + cos ( M z d ) cosh ( M X d ) [ cos ( M z d ) + cosh ( M X d ) ] 2
w ( x , z , t ) c 0 = N sin ( M z d ) sinh ( M X d ) [ cos ( M z d ) + cosh ( M X d ) ] 2
c = u ¯ + c 0
where c 0 = g ( d + H ) is the wave speed in still water; g is the absolute value of gravitational acceleration; X = x c t ; M and N satisfy:
ε = N M tan [ 1 2 M ( 1 + ε ) ]
N = 2 3 sin 2 [ M ( 1 + 2 3 ε ) ]
where ε = H / d .
The initial estimates of M and N are M = 3 ε and N = 2 ε . The initial estimate of η is from Boussinesq’s solution for solitary wave [35]:
η d = ε sech 2 ( 3 ε 4 X d )

2.2. Seabed Sub-Model

2.2.1. Seepage Pressure

After the wave pressure was obtained from the wave model in FLOW-3D, the seepage induced by the wave loading needed to be calculated. In this study, the seepage pressure was calculated with Darcy’s law. The seepage velocity can be affected by factors such as pressure gradient, fluid viscosity, and structure of porous media, thus the Darcy’s law can be expressed as:
u s = k f μ p s
where k f is the permeability coefficient of porous seabed, μ is the dynamic viscosity of fluid, p s is the seepage force, u s is the seepage velocity in the seabed.
Combining the continuity equation with Darcy’s law, the seepage pressure could be easily calculated under the solitary wave loading. The equation is as follows:
t ( ρ w n ) + ( ρ w u s ) = 0
where ρ w is the density of pore fluid, n is soil porosity.

2.2.2. Strength Reduction Method for the Seabed

The seabed behavior was described by the Mohr–Coulomb constitutive model. Before determining the factor of safety (FOS) for the temporary slope formed by foundation trench excavation, the seepage pressure calculated by Darcy’s law needed to be added to the total tensor of seabed. The shear stress in the Mohr–Coulomb mechanical model can be expressed as:
τ f = c + σ n tan φ
where c and φ are the effective cohesion and the effective friction angle of the soil, respectively; σ n is the normal stress.
It was assumed that the seabed material was isotropic and elastoplastic. The stability of the slope could be calculated by 2-D plane strain approximation. With the Mohr–Coulomb yield criterion, the associated potential can be expressed as:
F = m J 2 + α 0 I 1 k 0
where F is the yield function, I1 is the first invariant stress tensor, J2 is the second invariant deviatoric stress tensor. m, α 0 and k 0 are the parameters related to soil material parameters:
m ( θ ) = cos ( θ π / 6 ) 1 / 3 sin φ r e sin ( θ π / 6 ) , k 0 = c r e cos ϕ r e
where c r e and φ r e are the factored shear strength parameters which are defined as a function of FOS of slope [37].
c r e = 1 F O S c
φ r e = arctan ( 1 F O S tan φ )
The criterion to define the failure of slope was the non-convergence happening when the horizontal displacement increased dramatically in the process of calculation.

2.3. Boundary Conditions

In order to get the accurate wave pressure, appropriate boundary conditions needed to be defined in the wave model at first. As shown in Figure 1, the left side of the solitary wave model was the wave incident boundary, which was generated based on the solitary wave theory, and the inflow boundary was added at the same time to form the wave current inlet boundary; the right side of the solitary wave model was the wave outflow boundary with a wave-absorbing layer of 50 m width; the upper boundary of the solitary wave model was the interface of water and air, and the air pressure was equal to a standard atmospheric pressure (101.3 kPa); the bottom was the interface between water and soil, and thus the wall boundary was adopted. The normal velocity of fluid on the boundary was zero.
In the seabed model, the pore pressure induced by the solitary wave was equal to the pressure obtained from the wave–current model at the surface of the seabed. At seabed surface, the boundary is described as:
p s = p b
where p b is the pressure at seabed surface in the wave–current model.
The bottom and both sides of the seabed were set to be impermeable, furthermore, there was no horizontal displacement, which can be expressed as:
n u = 0
u s = 0

2.4. Integration of Sub-Models

In this study, the so-called one-way coupling method was adopted to realize the integration of the wave–current sub-model and the seabed sub-model. FDM (finite differential method) was used to solve the RANS equations in the wave–current sub-model, while FEM (finite element method) was used to calculate the seepage pressure and the seabed response. The size of the wave–current model was 200 m × 50 m, and the whole wave domain was divided into 5,024,294 cells with the cell size of 0.1 m × 0.1 m. The aim of this model was to capture the wave–current pressure acting on the seabed and then apply it to the surface in the seabed sub-model. The seabed sub-model was divided into triangular meshes with the maximum size of 2.8 m and the minimum size of 0.025 m.

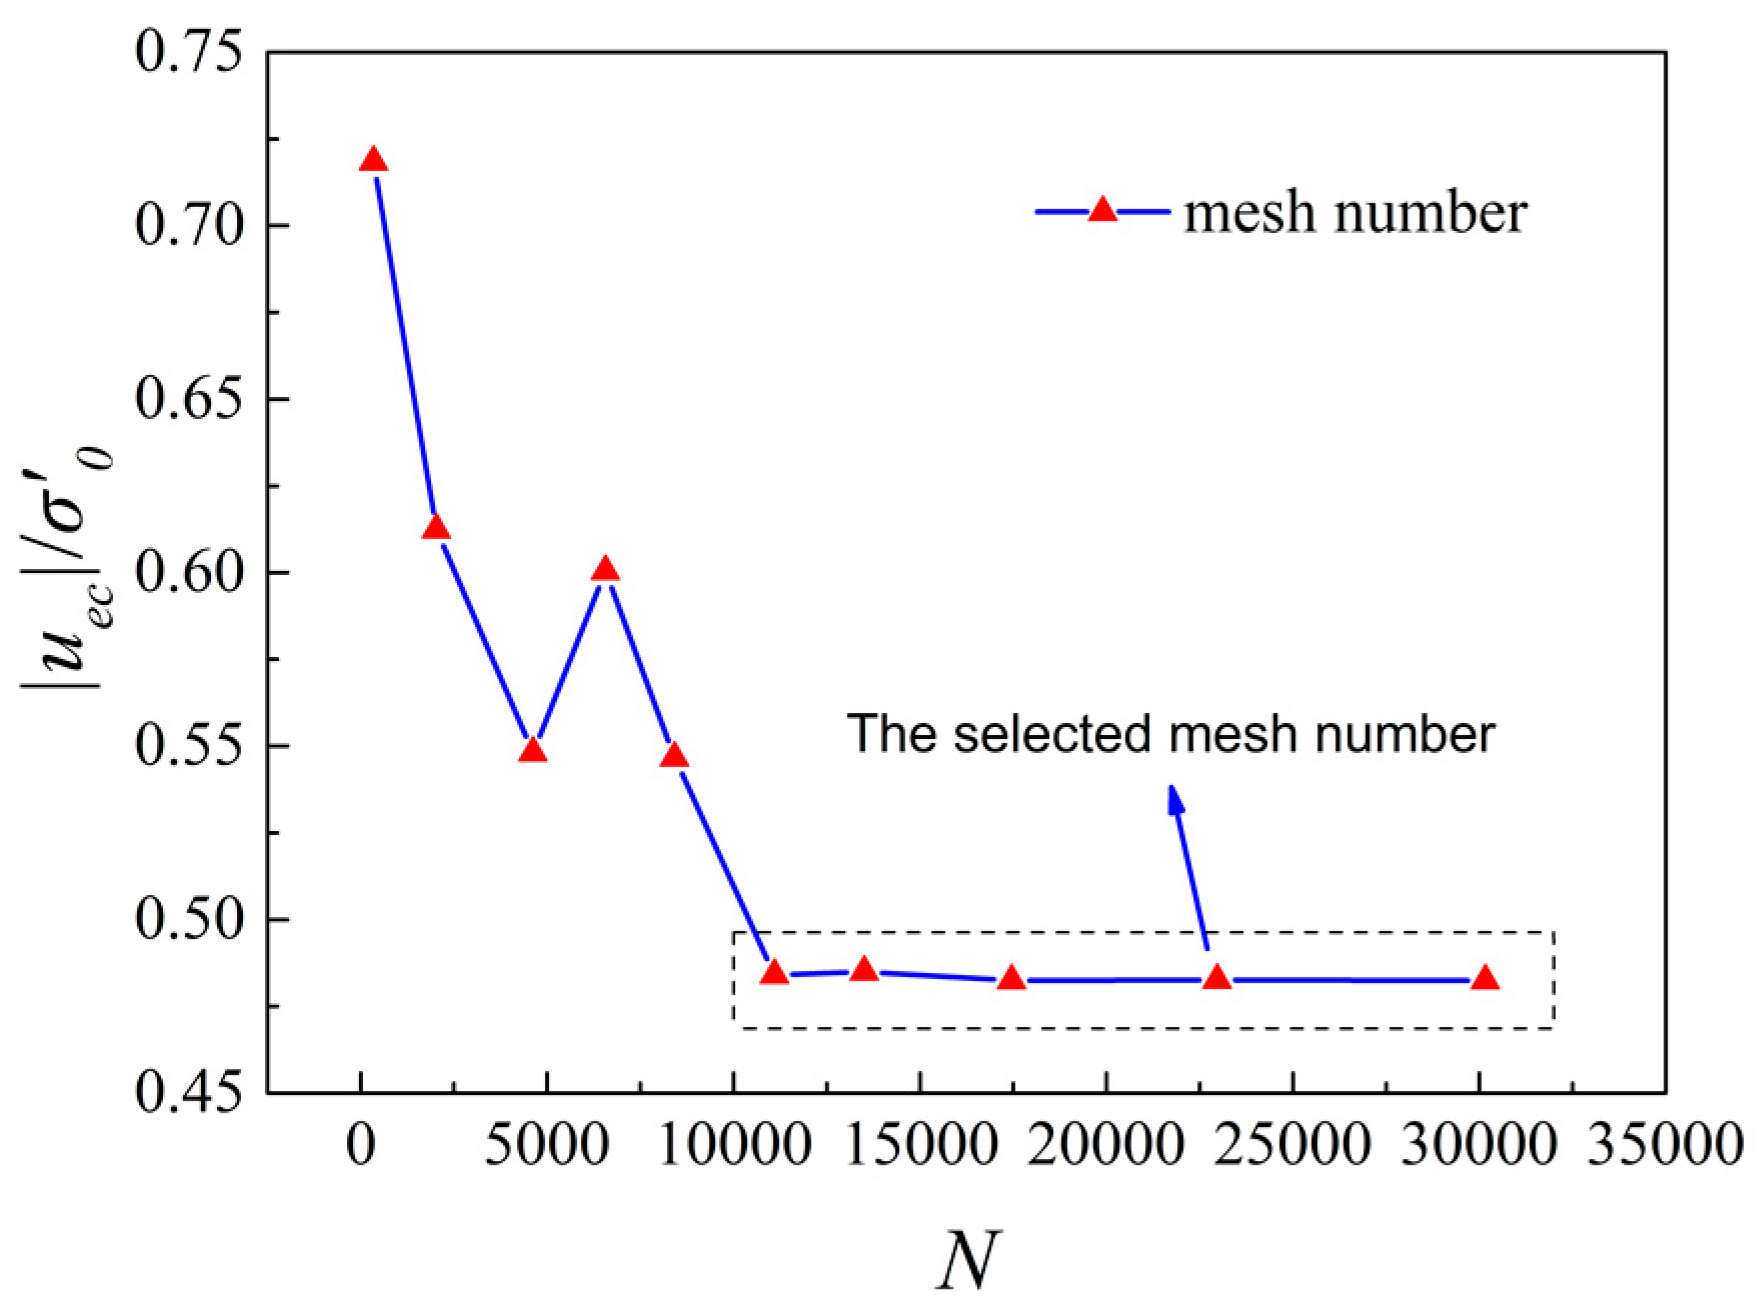
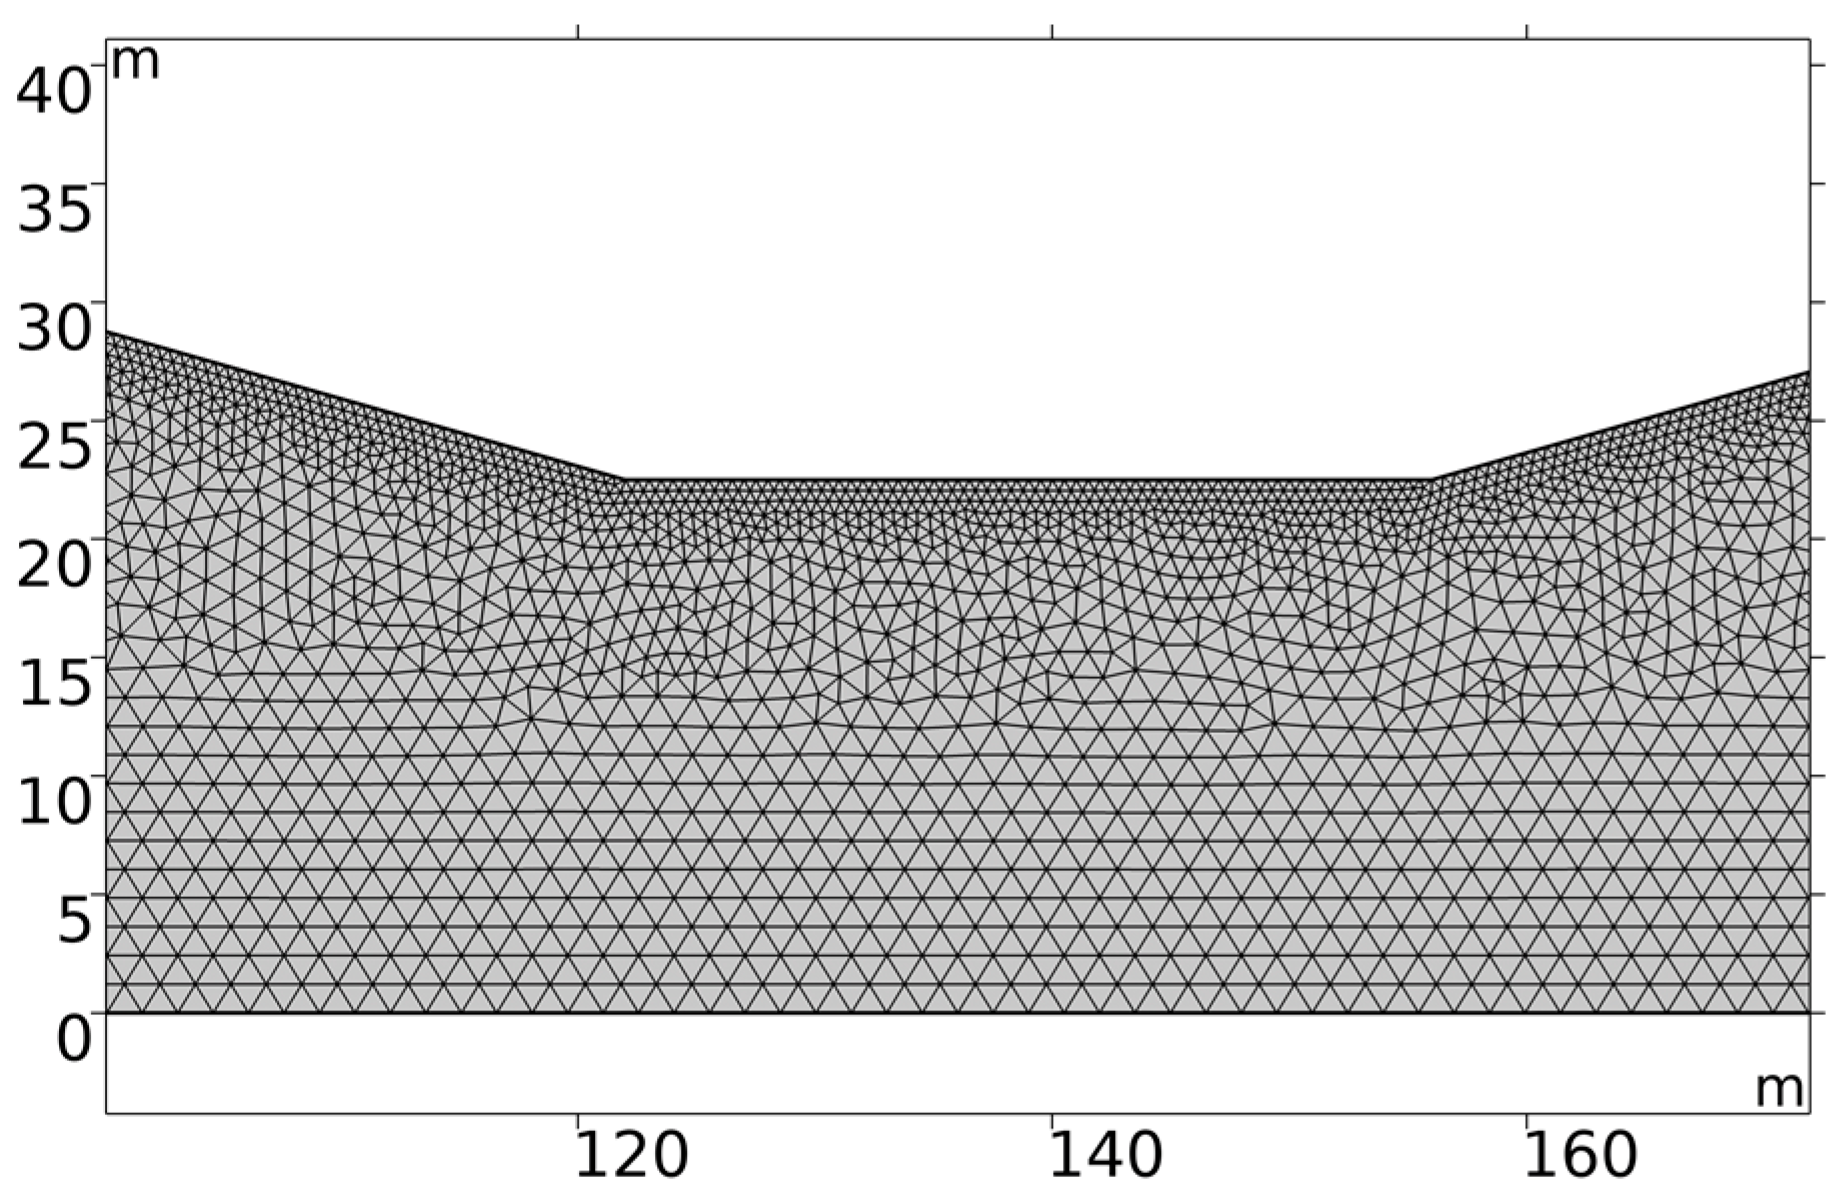
2.5. Convergence of the FEM Meshes
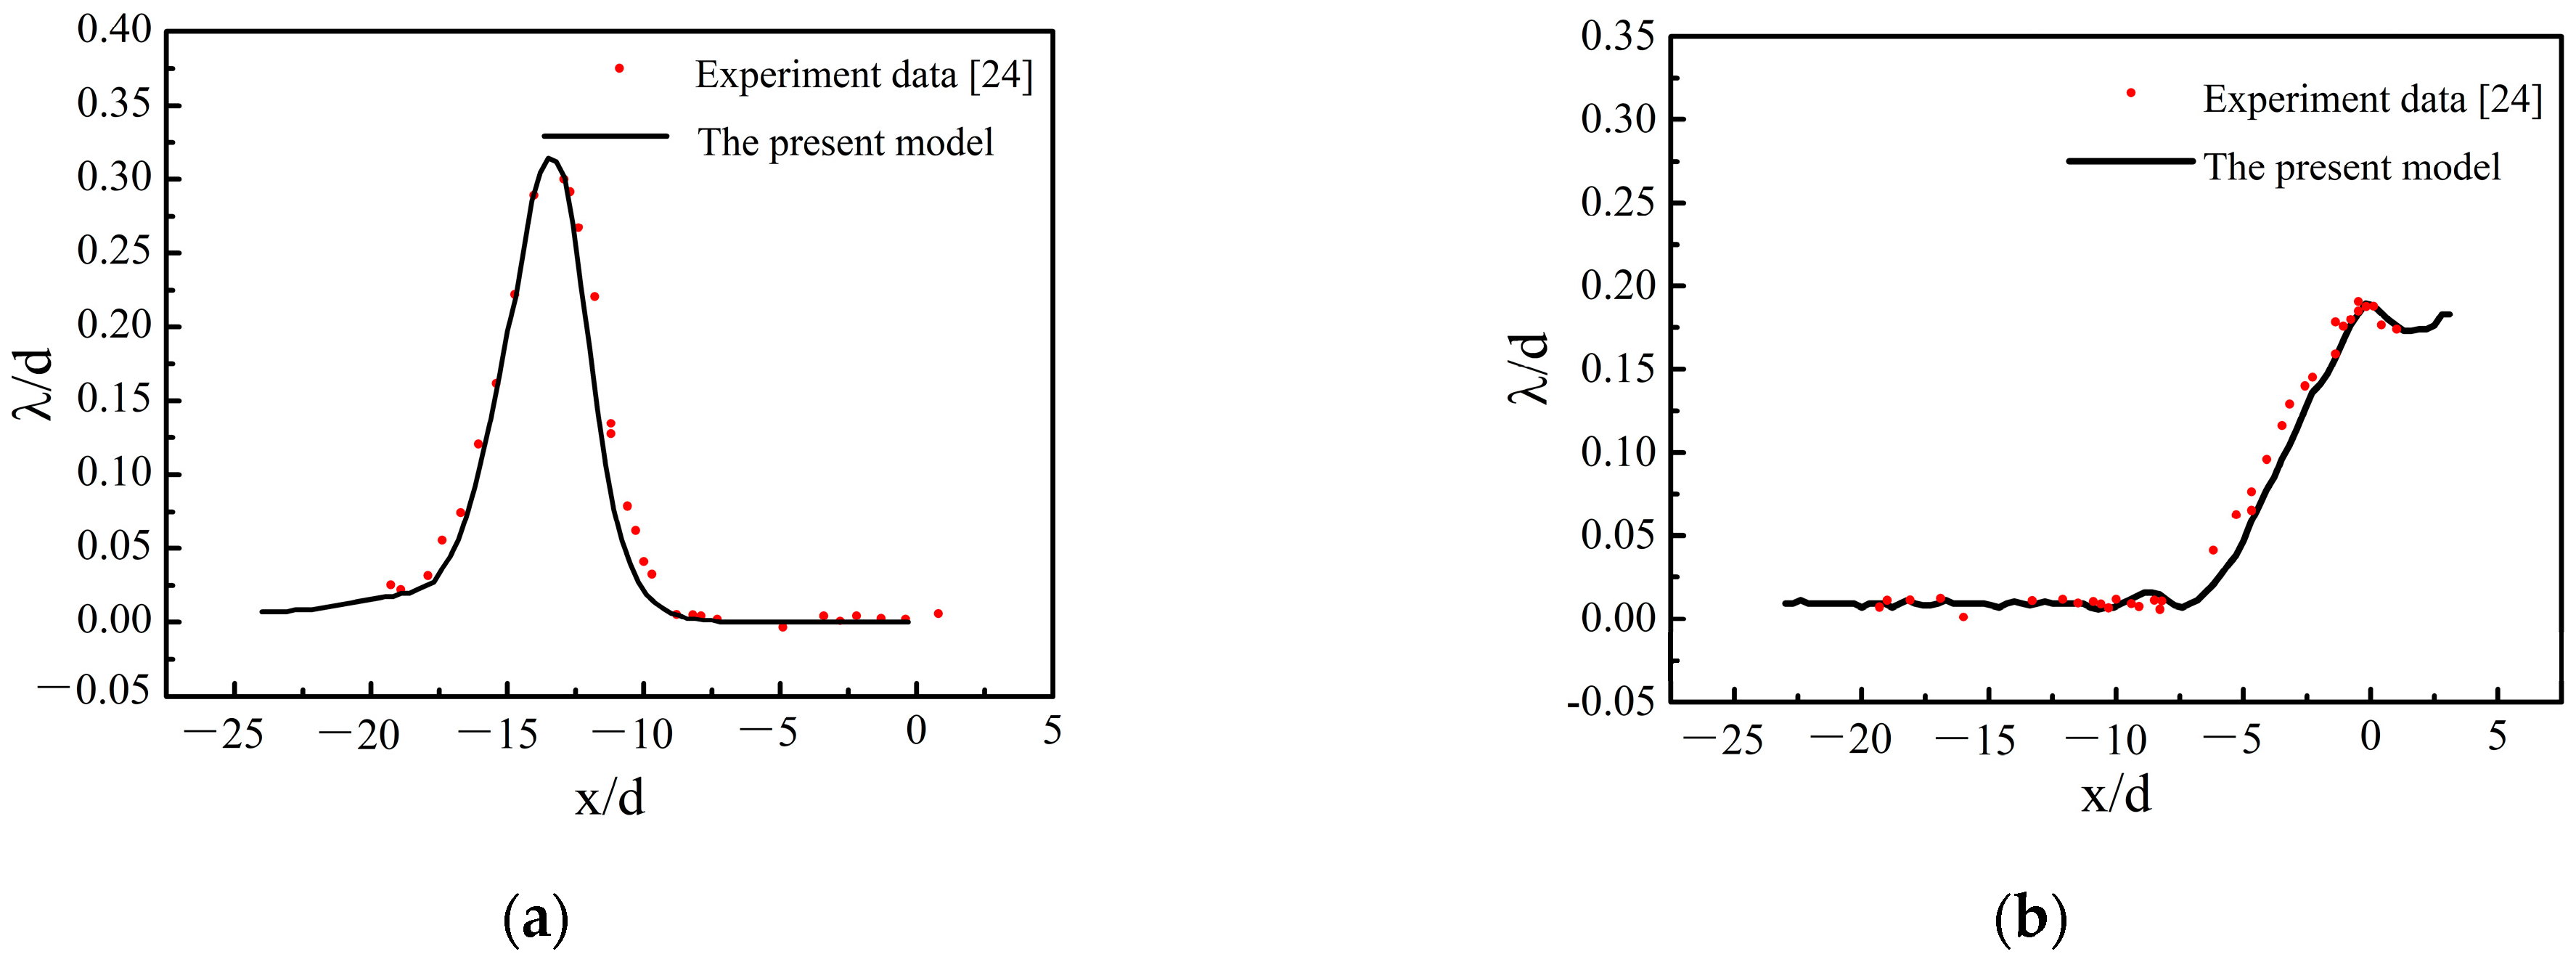
A case of slope ratio 1:3.5 was adopted to examine the rationality of meshes in the numerical model. Figure 2 shows the variation of induced maximum excess pore pressure (at point A in Figure 1) with the mesh number N, in which |uec| is the maximum pore pressure, and σ′0 is the initial effective stress at point A. To achieve the computational accuracy, a mesh number with the smallest standard deviation was selected. The FEM mesh adopted in the computation for the seabed in the vicinity of the foundation trench is shown in Figure 3. The mesh refinement near the foundation trench was adopted to achieve satisfactory calculation.

3. Model Validation

To validate the calculation accuracy of the solitary wave pressure, the results of the wave model were compared with the laboratory experiments of Synolakis [24], in which a series of experiments about the process of solitary wave running up on the slope with the gradient of 1:19.85 were performed. One of the experiments was conducted with the wave height up to H/d = 0.3 and the maximum water depth d of 1 m. The corresponding wave parameters were set the same as Synolakis [24], and the wave elevation was obtained at a different time. Figure 4 shows the comparison between the measured free water surface and the present model results. It was apparent that the process of the wave running up, down, and breaking in the experiment was in good agreement with the current model, and thus the wave model is reliable.

4. Results and Discussion

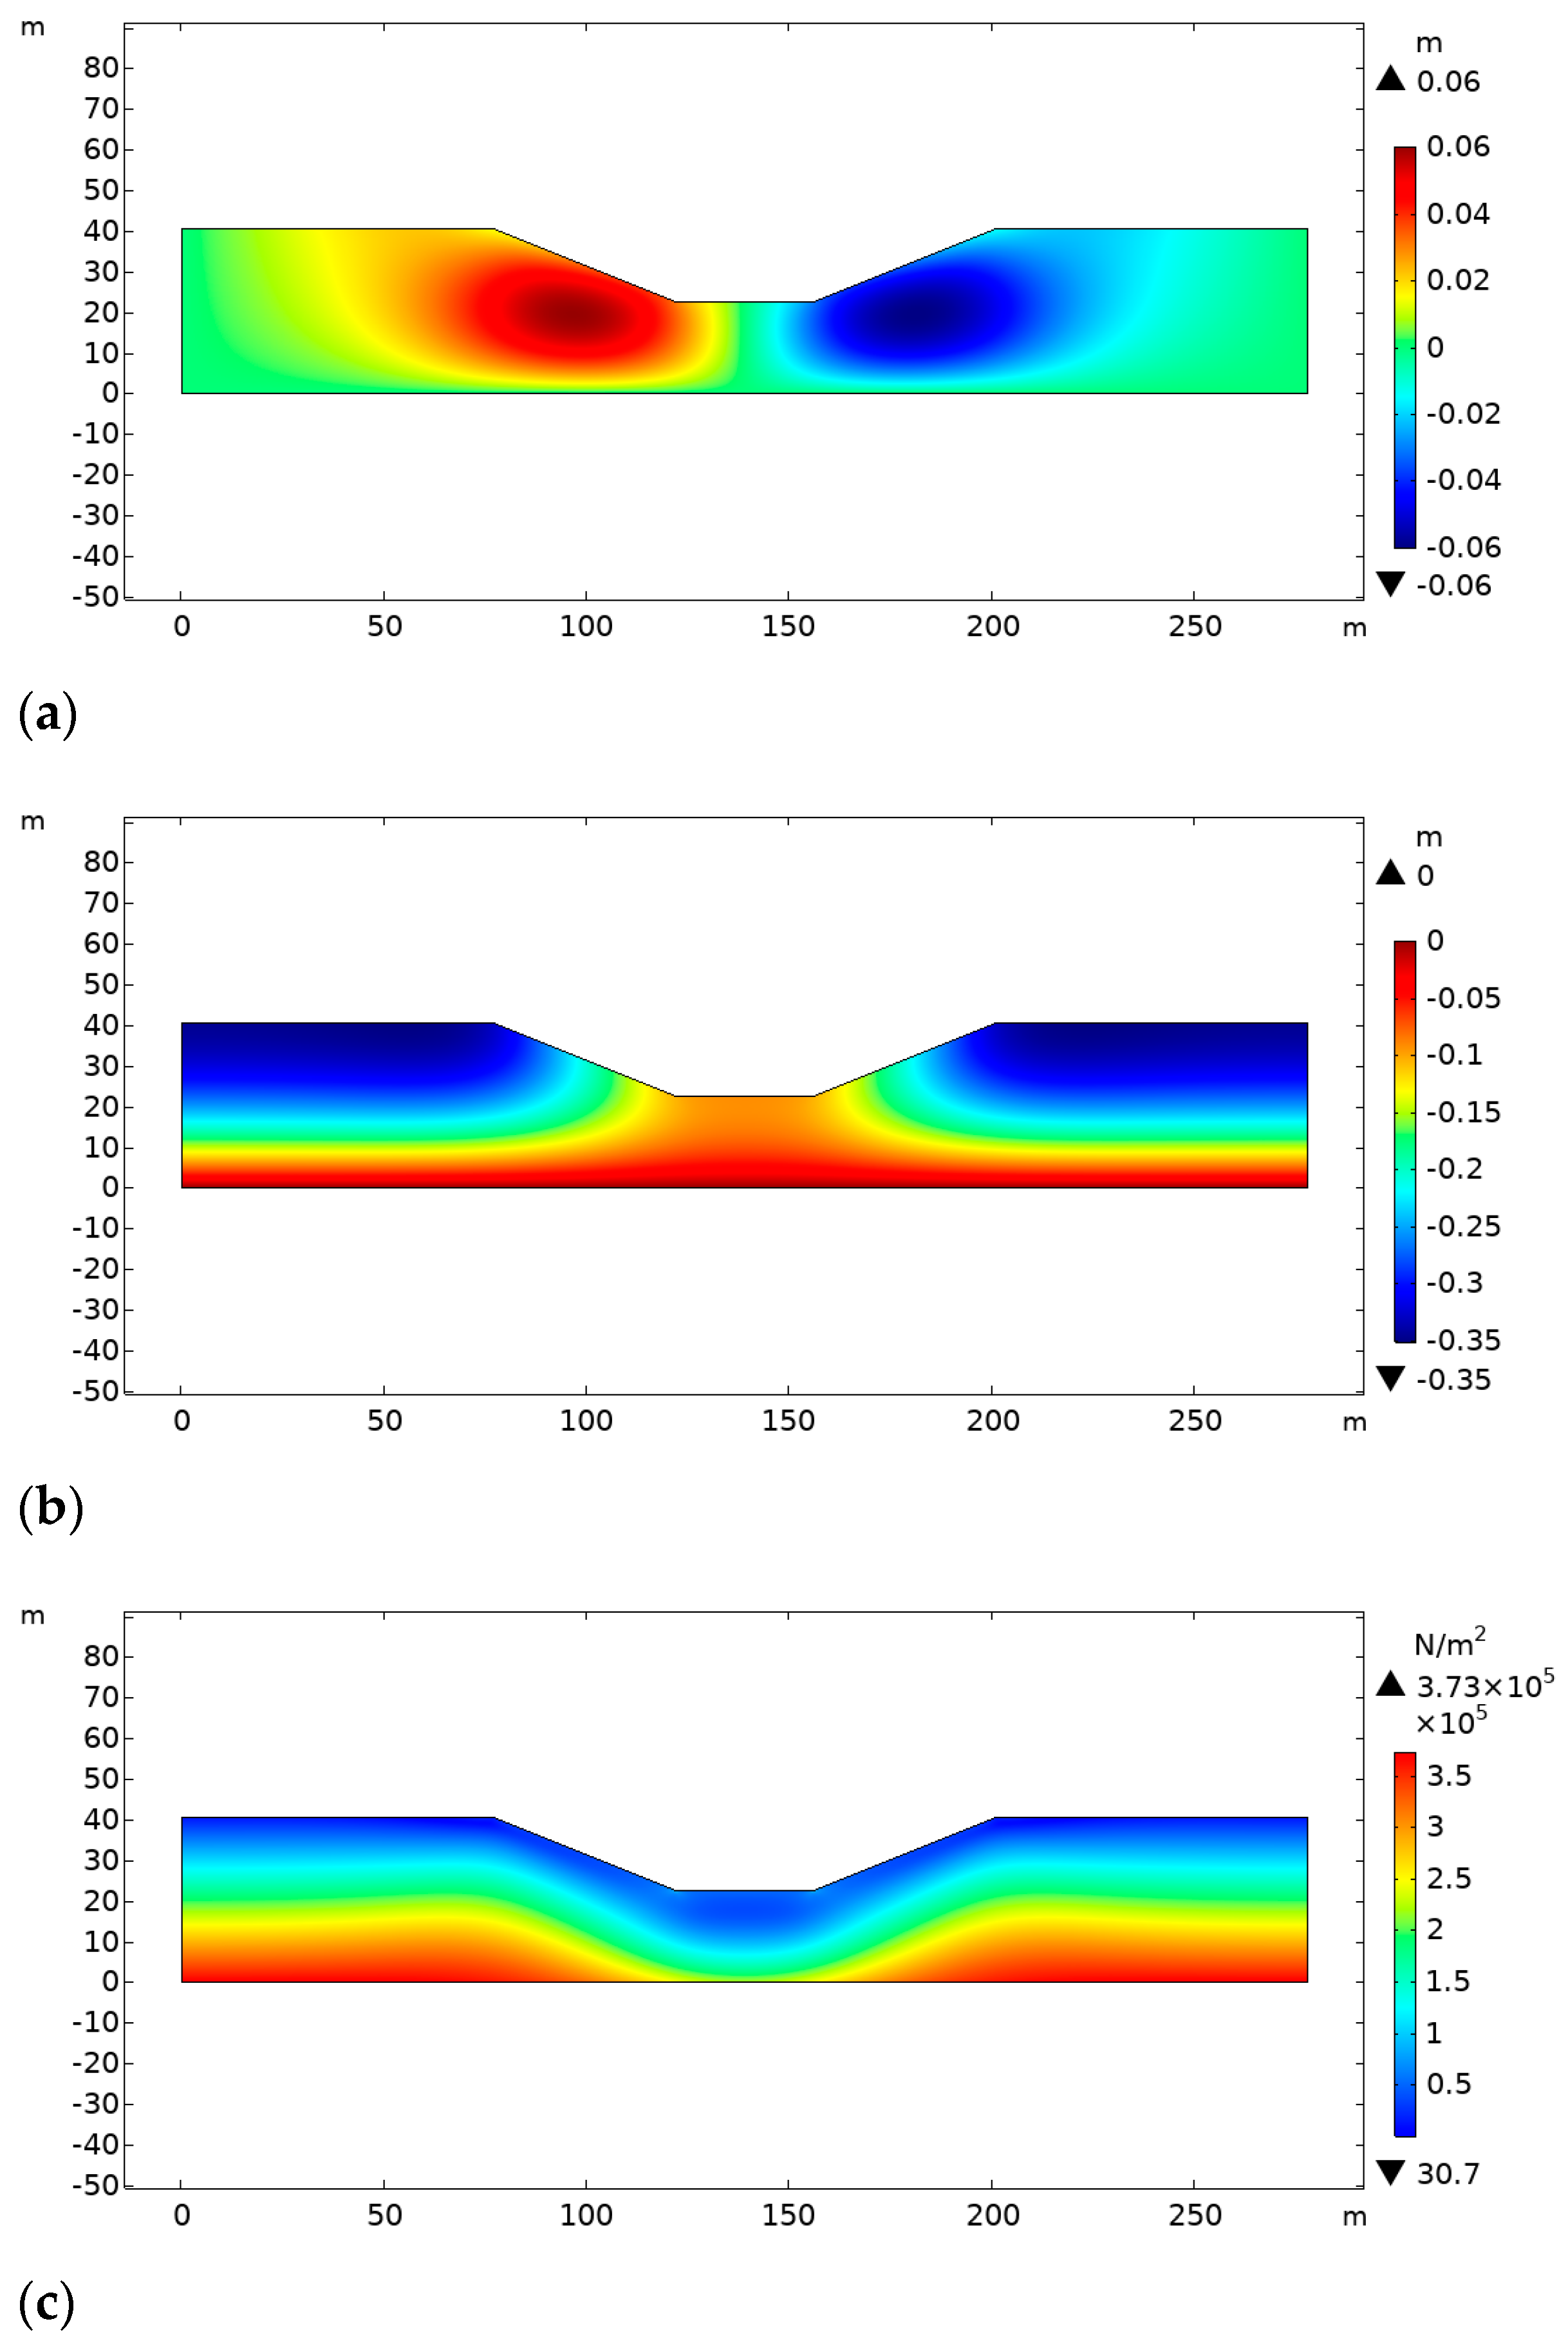
4.1. Consolidation of the Seabed

In general, the natural seabed has a consolidation process due to the existence of self-weight. The seabed reaches a new stable state of consolidation after being disturbed by the excavation of the foundation trench. Before adding the wave-induced pressure to the seabed, the state of stress and strain after the adequate reconsolidation under hydrostatic pressure and self-gravity was determined. The calculation parameters are listed in Table 1, and the soil parameters refer to the silt. The width of the trench bottom (W) and the vertical height of slope (B) were 34 m and 18 m, respectively. Figure 5 shows the distribution of stress and displacement in the foundation trench after reconsolidation, which was set as the initial condition for the model.

4.2. Stability Index for the One-Stage Slope under Solitary Wave Loading

To find the most dangerous moment in the whole process of solitary wave passing over the foundation trench, the stability indexes of the slope at different moments could be continuously calculated [38]. At different positions of the wave crest relative to the slope top from far to near, the factors of safety (FOS) for the slope were obtained correspondingly. The smallest FOS corresponded to the most dangerous moment, and the cases of different slope were investigated in this section.
Figure 6 illustrates the variation of FOS with D for the foundation trench slope with different slope ratios. Here, D is denoted as the relative distance between the wave crest and the slope top. Positive value of D means the crest passed the top of the slope and vice versa. As shown in Figure 6, the dotted line presents the variation of FOS only under the hydrostatic pressure, and the solid line represents that under solitary wave pressure. It was obvious that the wave loading significantly reduced the stability of the underwater slope. As the solitary wave crest propagated over the slope, the FOS decreased at first and then increased. As a result, the minimum of FOS could be determined for the slope with different slope ratios. Thus, the minimum of the FOS (defined as FOSmin) was regarded as the stability index for the slope with the corresponding slope ratio. With the decrease of slope ratio, the FOSmin increased as expected. It was observed that FOSmin was bigger than 1 when the slope ratio was 1:2.5 in this case. Therefore, when the slope ratio was smaller than 1:2.5, the slope was stable under the combined actions of self-weight, wave pressure, and induced seepage force in the seabed in this study. With the decrease of slope ratio, the FOSmin increased as expected.

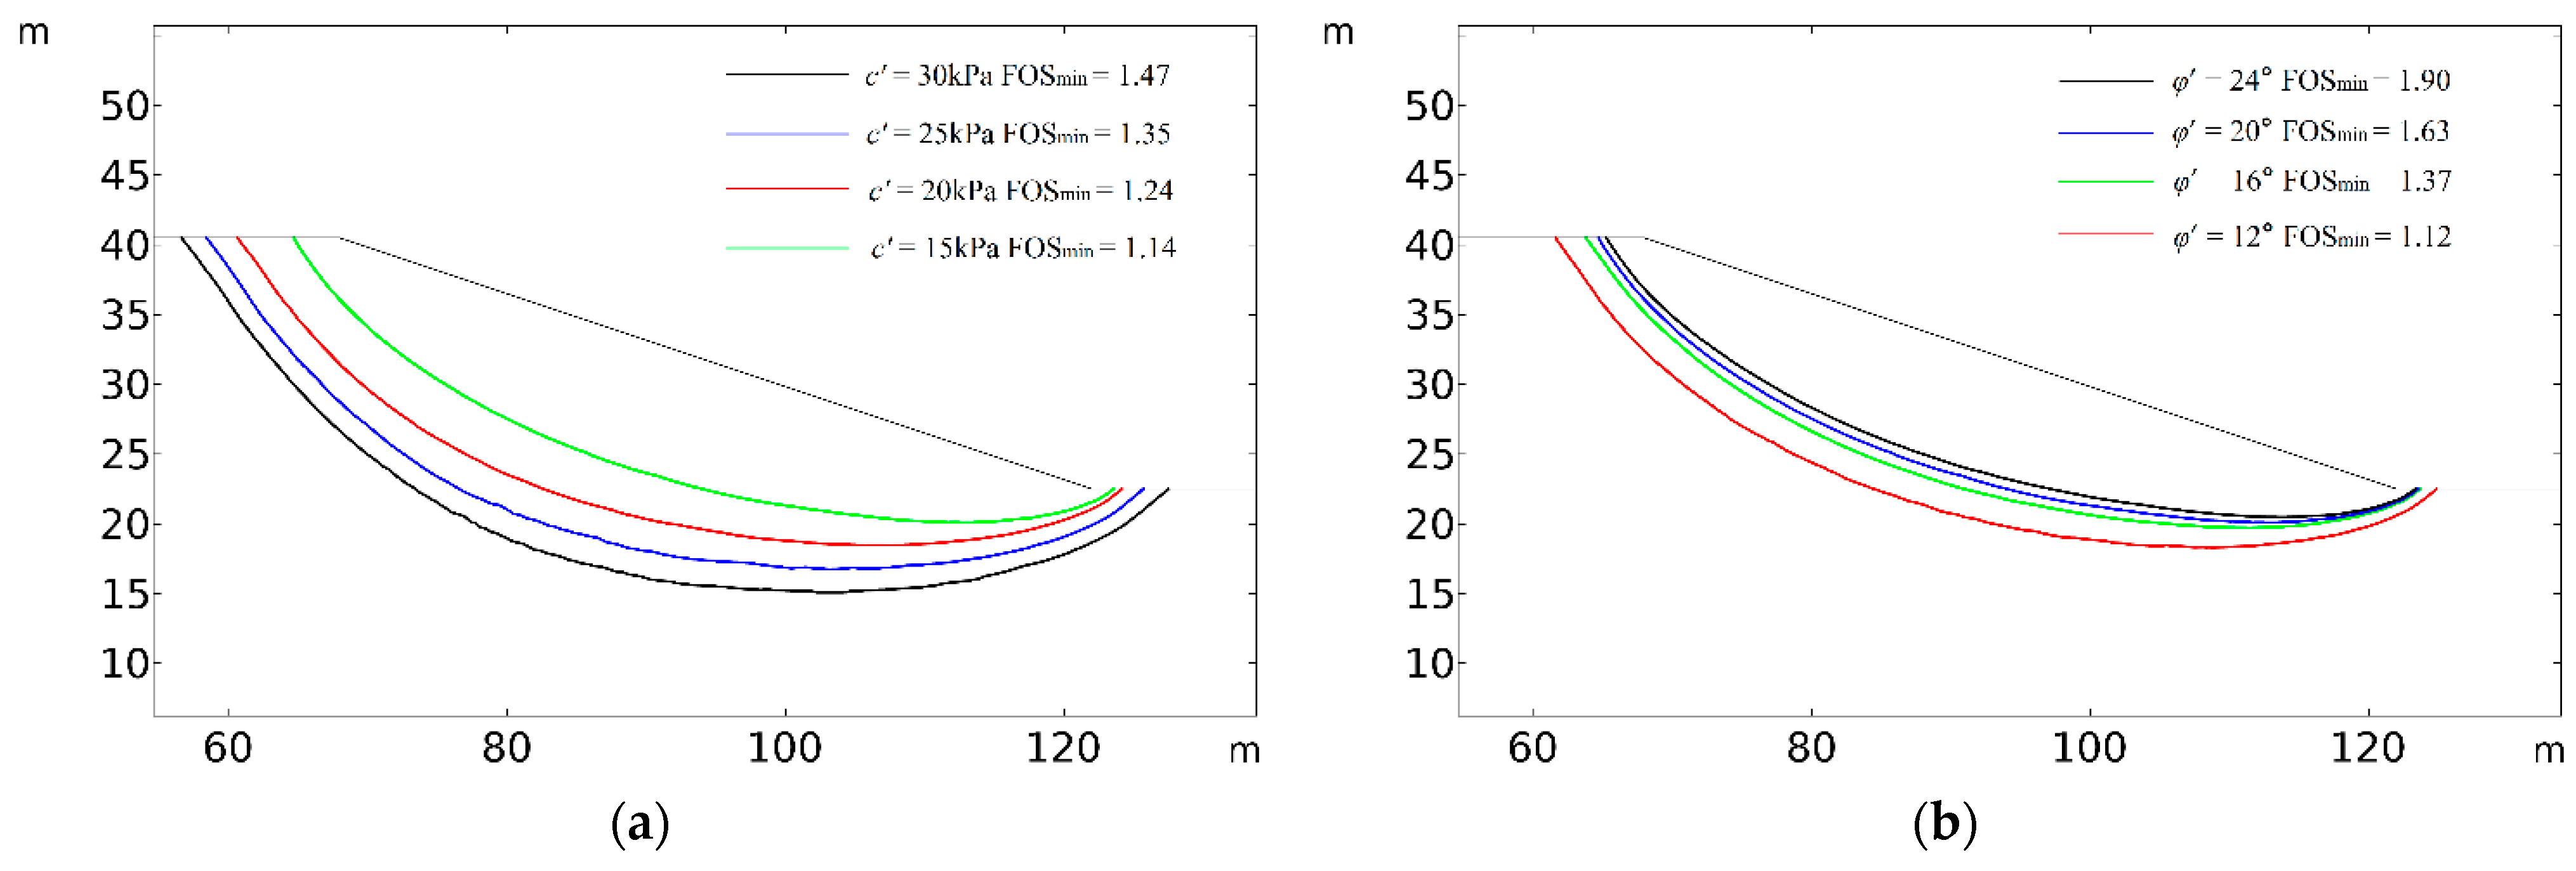
4.3. Influence of Soil Strength Parameters on the Slope Stability

Generally speaking, soil properties have a great influence on the wave-induced pore pressure and displacement in the slope. In this section, two important soil parameters, cohesion and internal friction angle, are discussed. The soil cohesion c′ is taken to be 15 kPa, 20 kPa, 25 kPa and 30 kPa, respectively. While the internal friction angle φ′ is taken to be 12°, 16°, 20°, and 24°, respectively. Figure 7 illustrates the influences of cohesion and internal friction on the displacement contour of 0.2 m in the slope. It is noted that the increase of cohesion increases the failure depth and enlarges the area of landslide. With the increase of friction angle, the sliding damage area and failure depth decrease gradually. The results in this section agree well with that of the slopes on land in Cheng et al. [39]. The influences of soil strength parameters on the slope stability, i.e., FOSmin, are also shown in Figure 7. As expected, the stability of slope increases with the increase of soil strength.

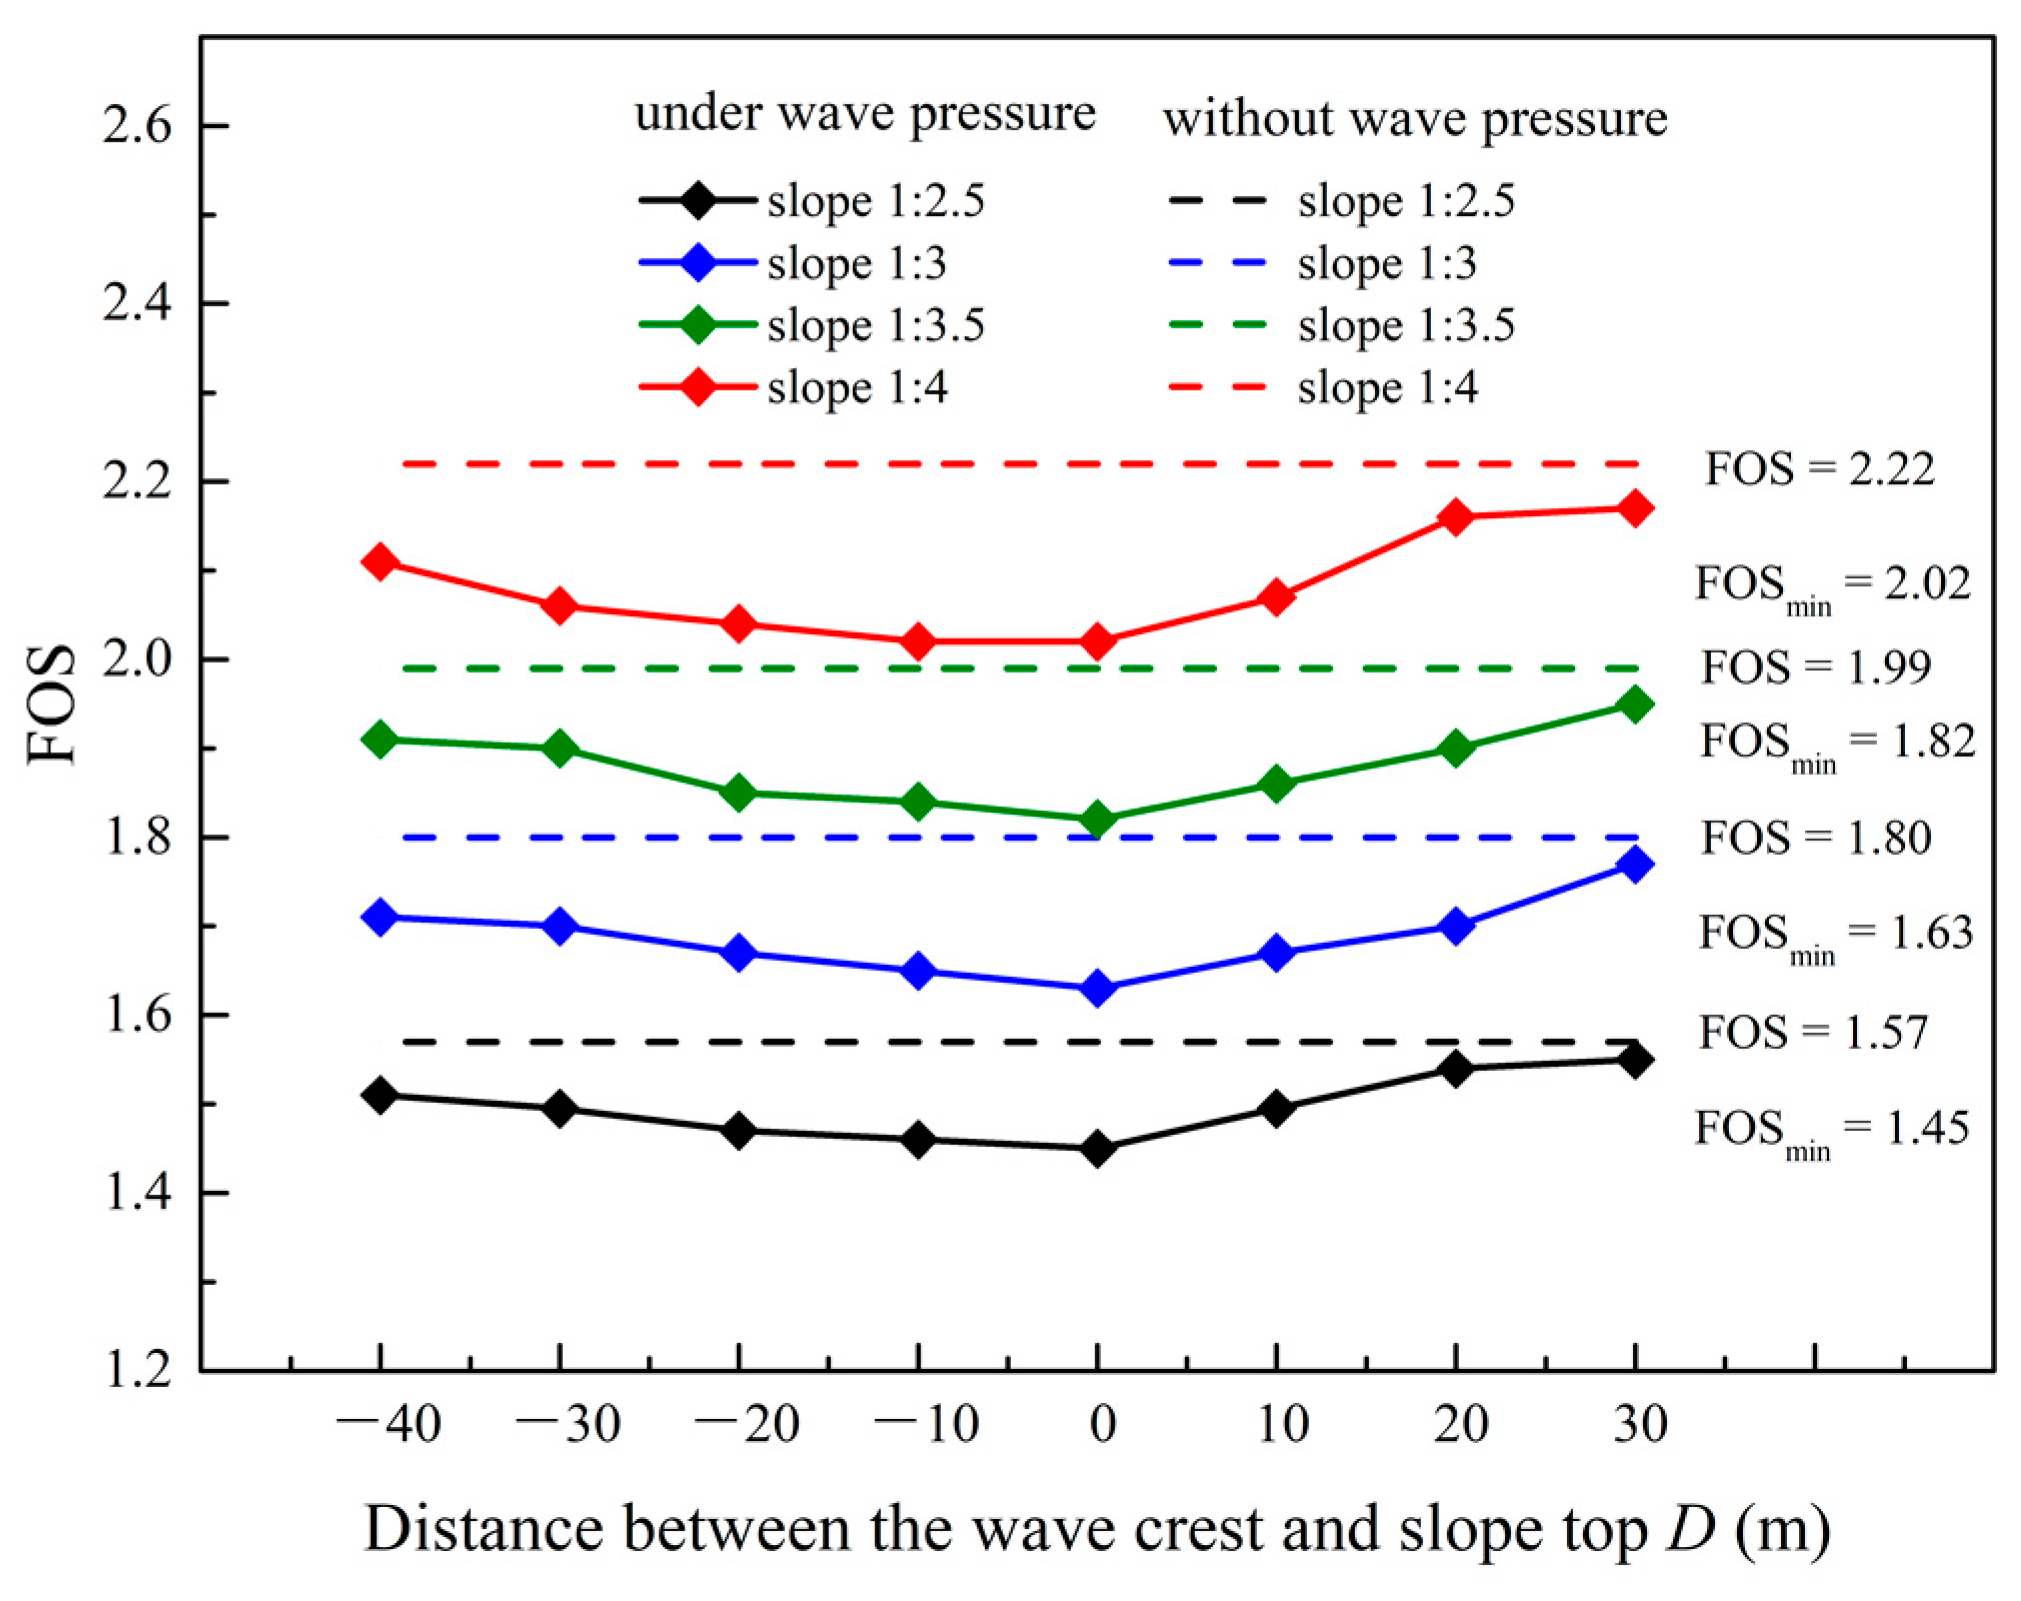
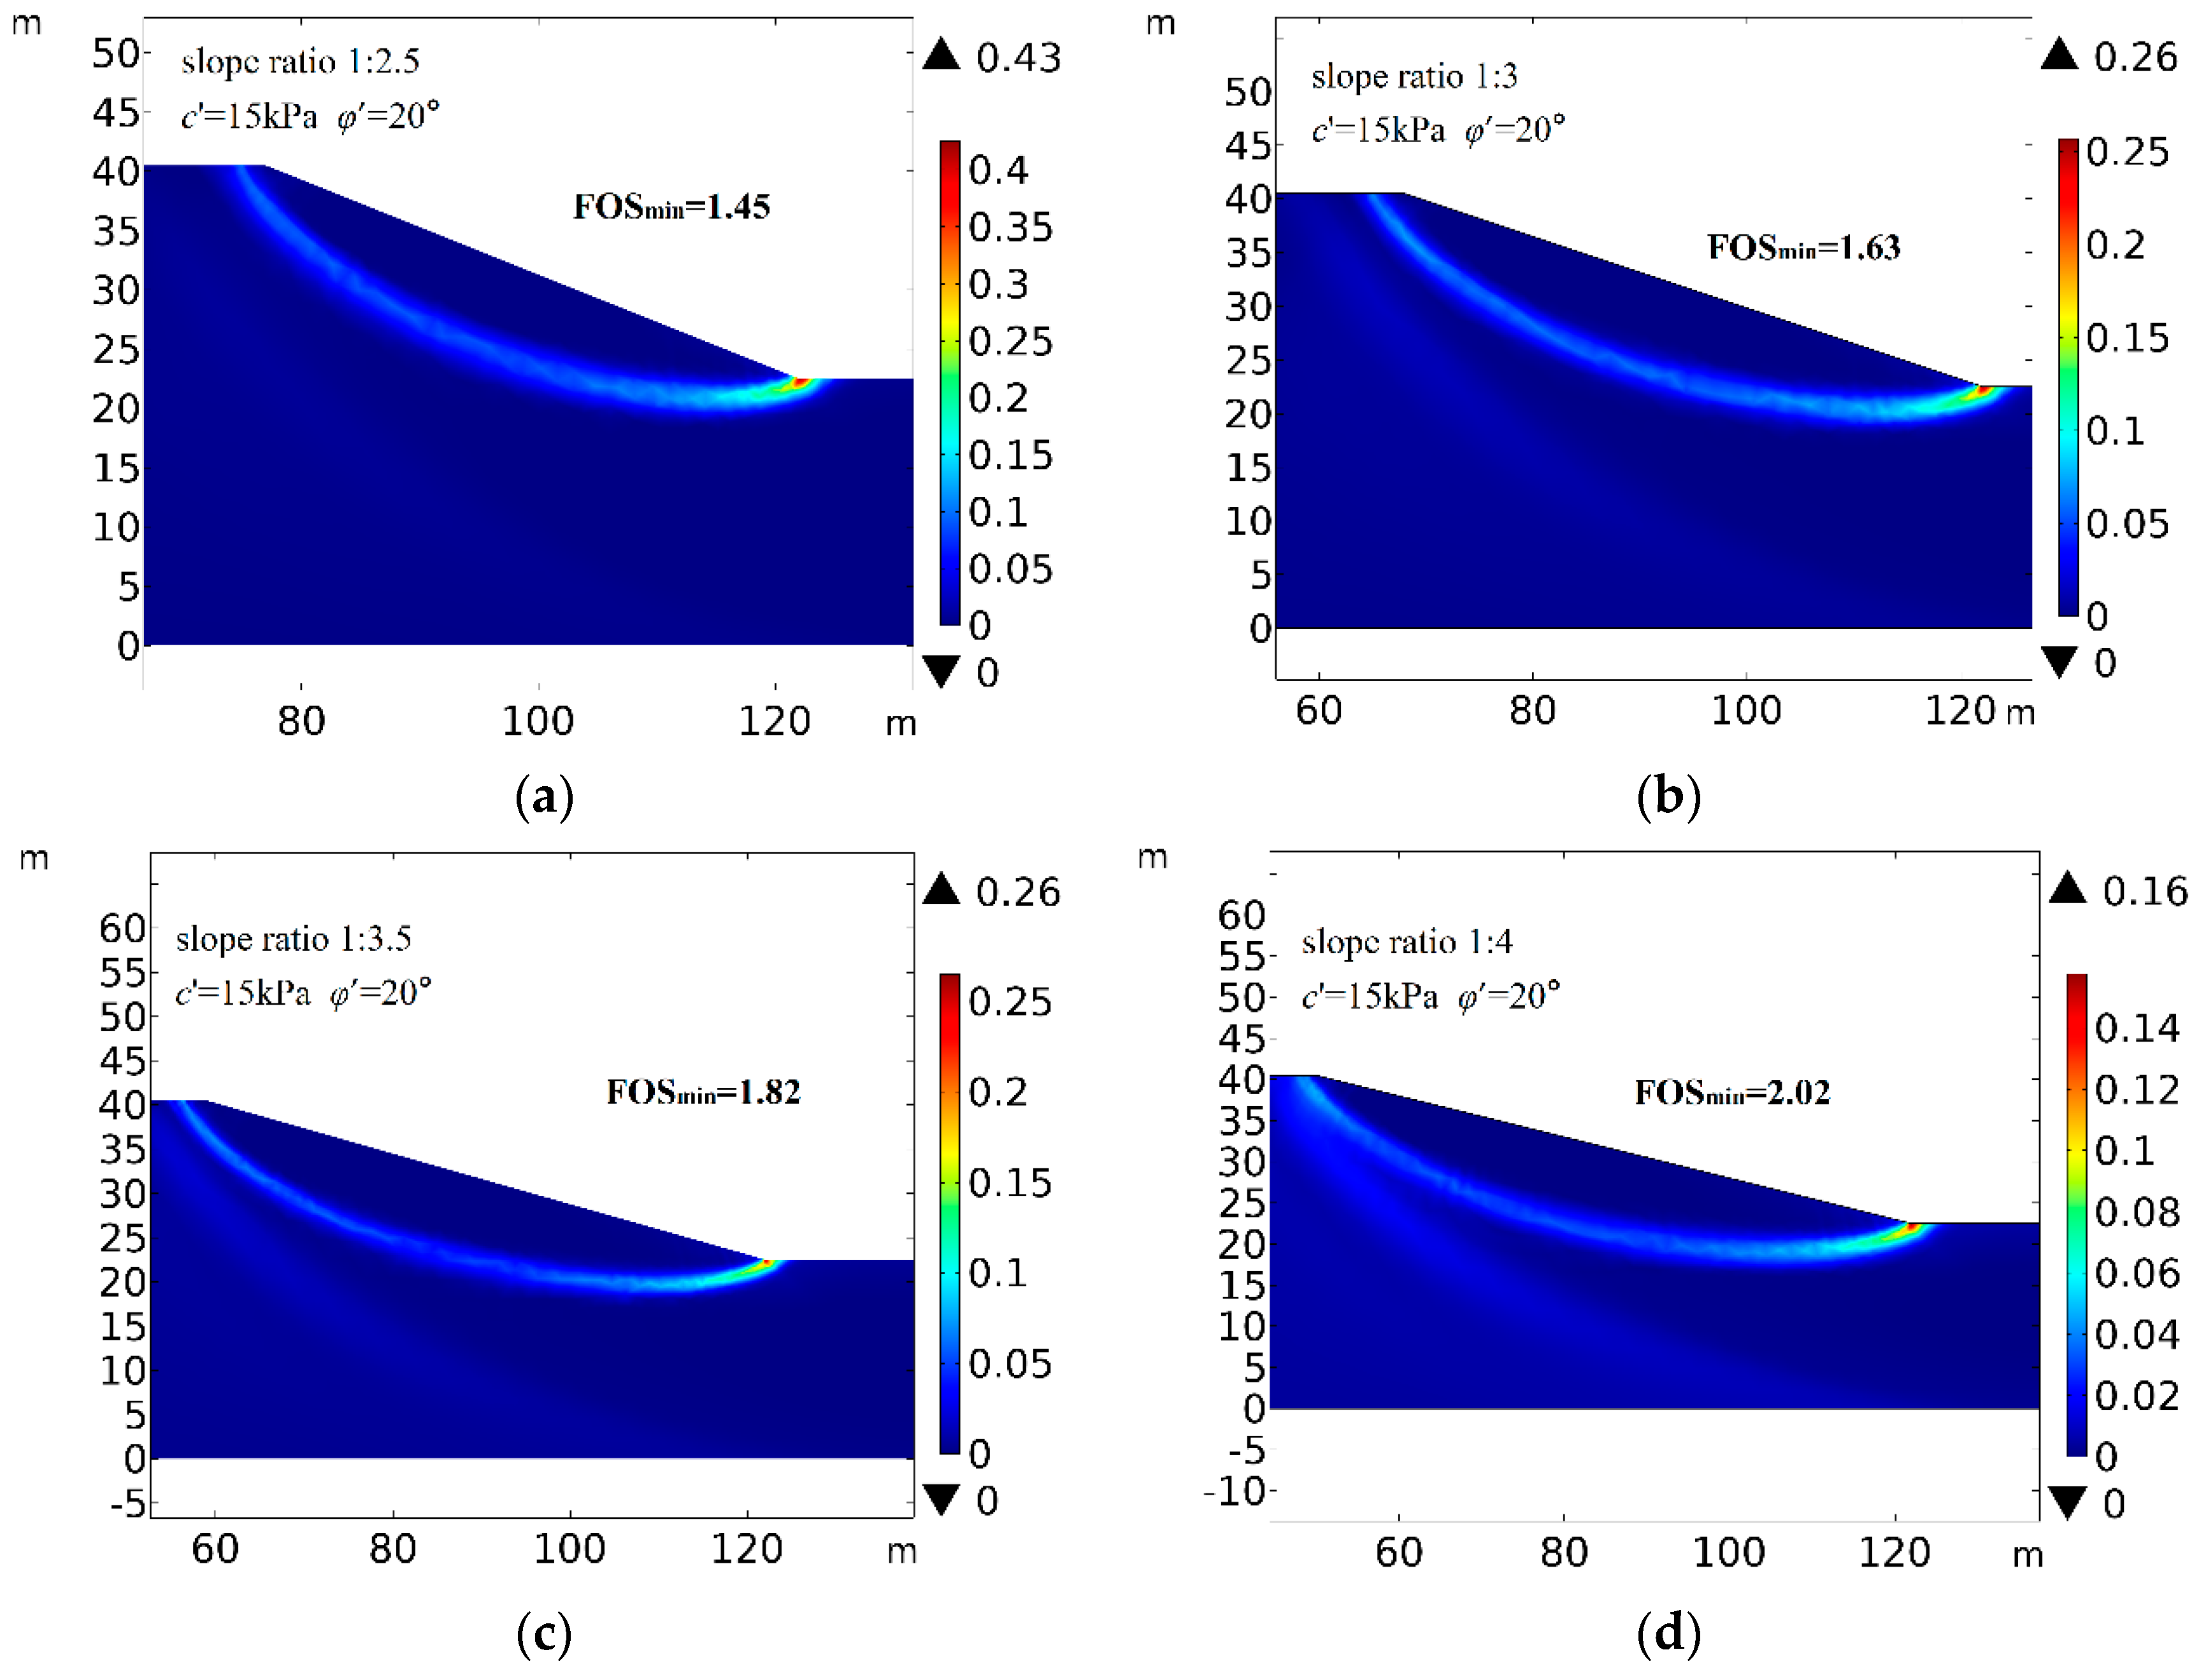
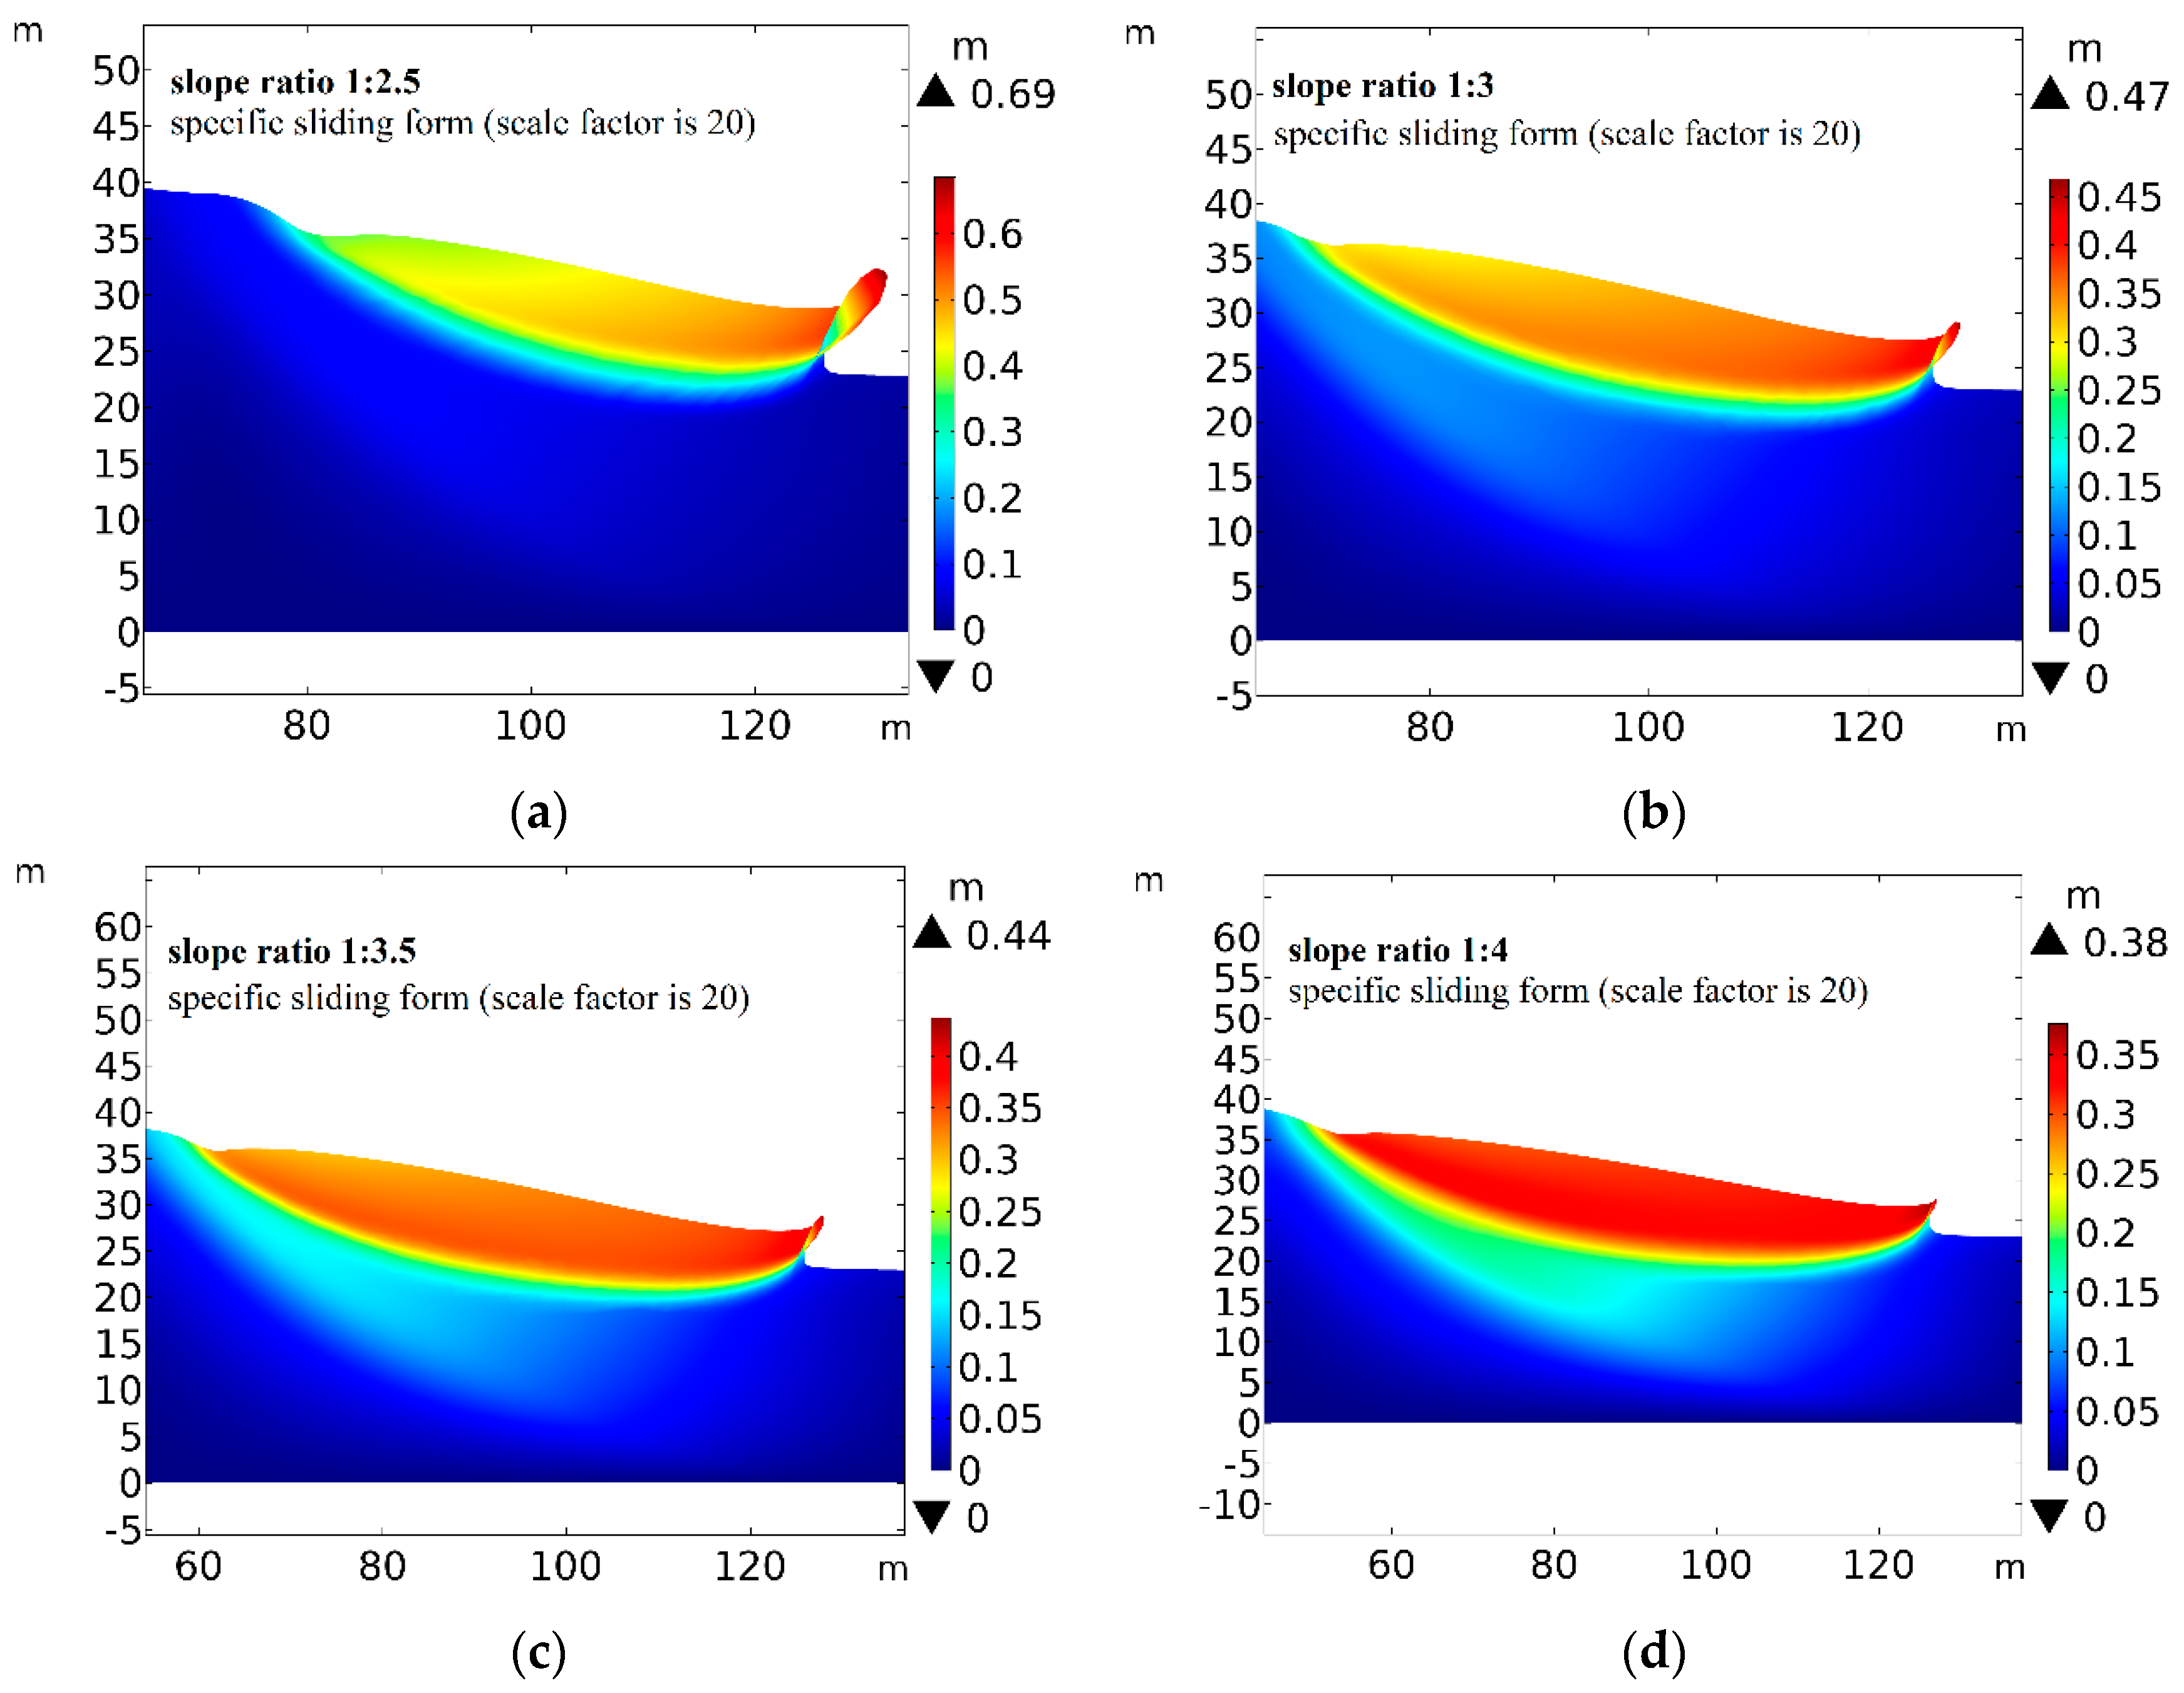
4.4. Influence of the Slope Ratio on Slope Stability

The slope ratio of the trench directly affects the amount of excavation and backfilling materials and thus has an important influence on the cost of trench excavation of immersed tunnels. Obviously, the larger the slope ratio is, the more stable the slope is. Since the stability is not the only factor to be considered, reasonable slope ratio should be achieved to ensure the balance between economy and safety in practical projects. The wave and the soil parameters were chosen from Table 1. The slope ratios were set to be 1:2.5, 1:3, 1:3.5, and 1.4, respectively. Figure 8 demonstrates the distribution of equivalent plastic strain in four different cases in the seabed. When the plastic zone developed continuously through the toe to the top, the landslide was likely to happen. It was shown that the maximum plastic strain in the seabed increased with the increasing slope ratio, as expected.
Figure 9 demonstrates the actual failure deformation for the slope with four slope ratios, and the scale factor adopted was 1:20. The sliding area had an arc-shaped layered division. The maximum deformation of the slope occurred at the toe of the slope and had the tendency to concentrate at the bottom with the increasing of slope ratio.

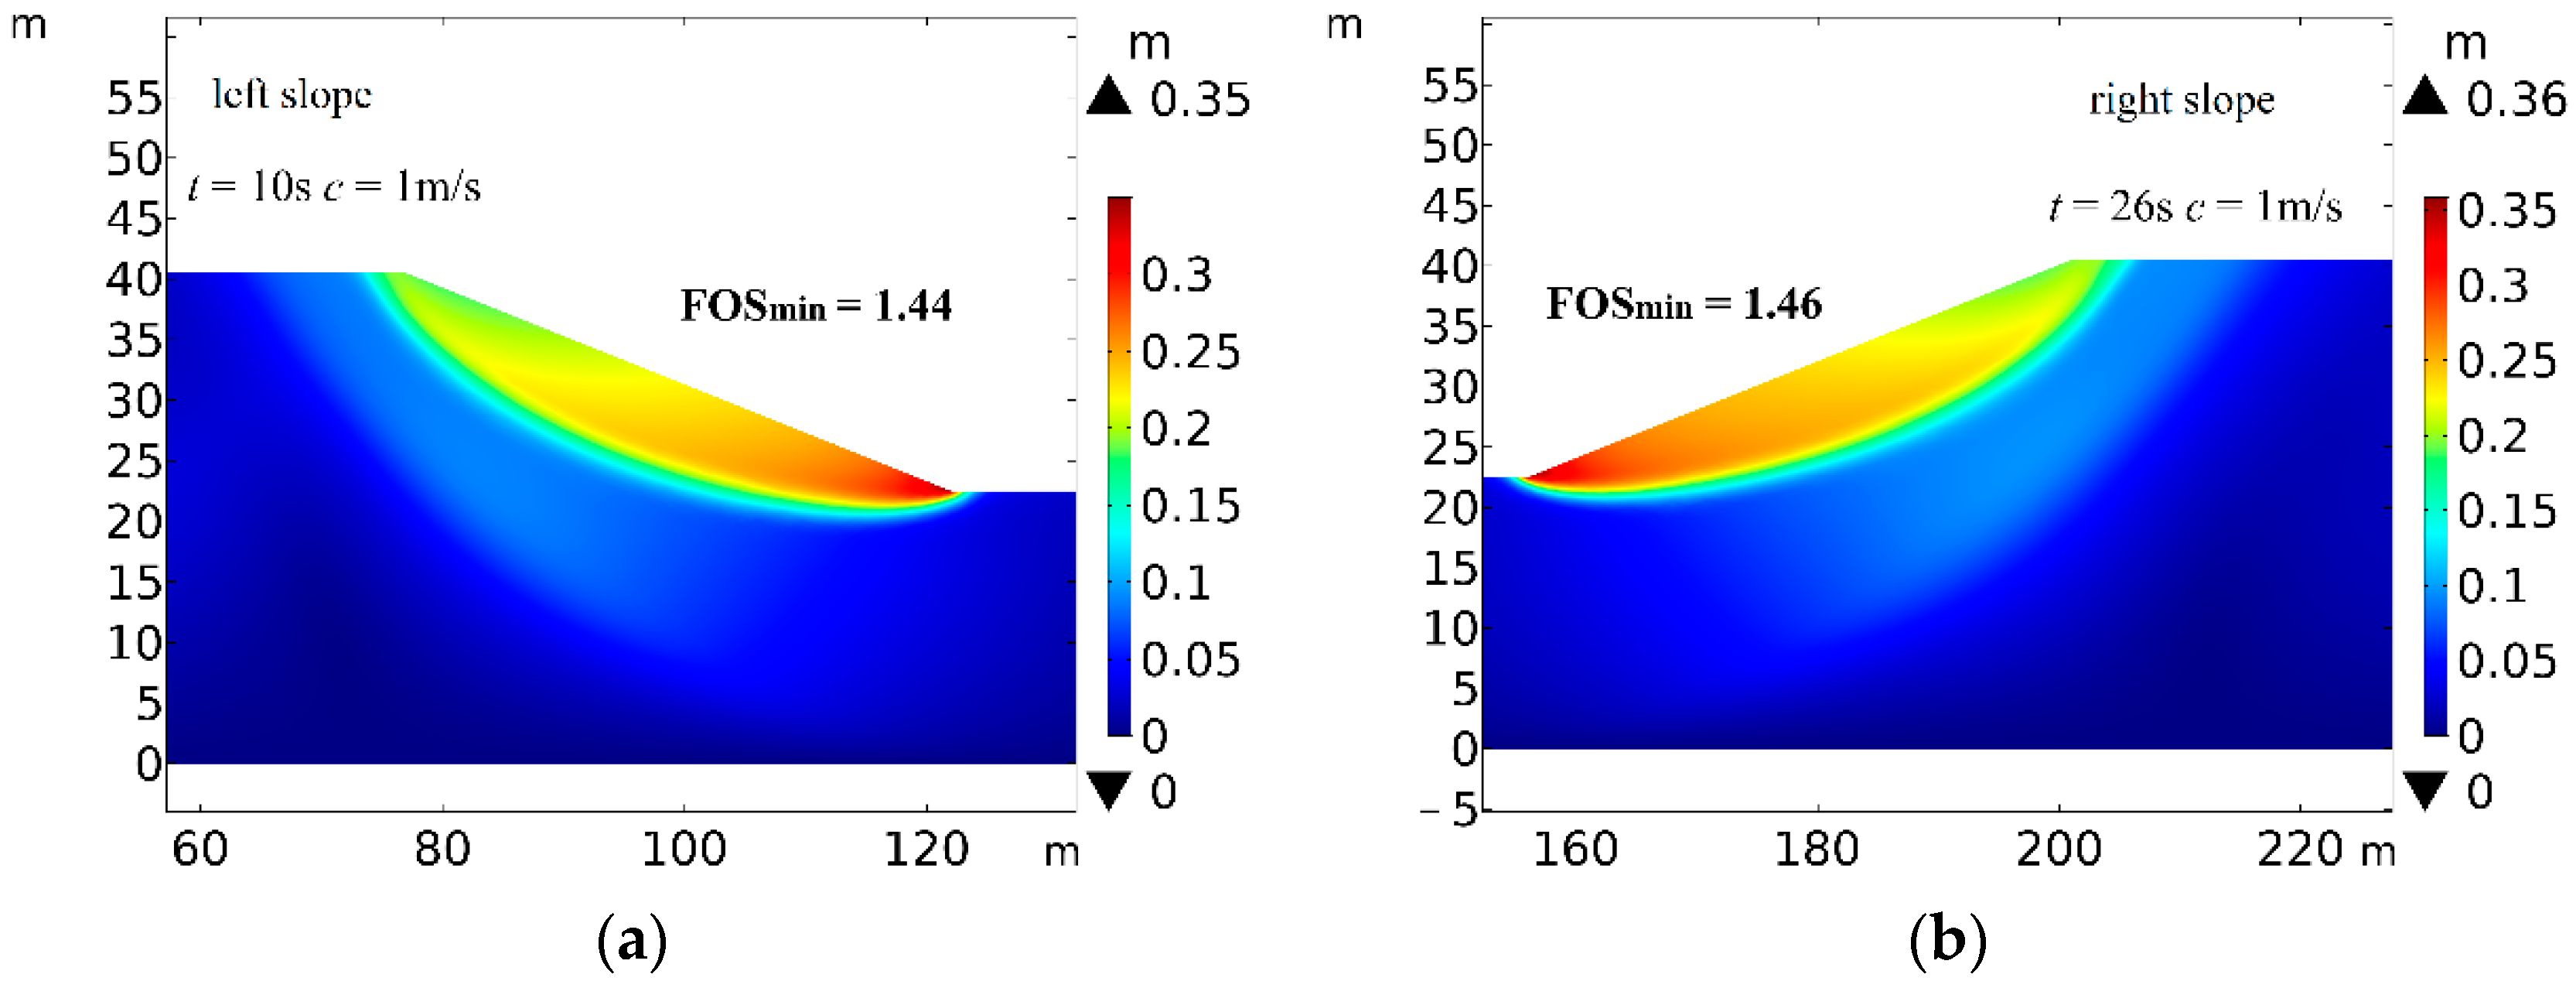
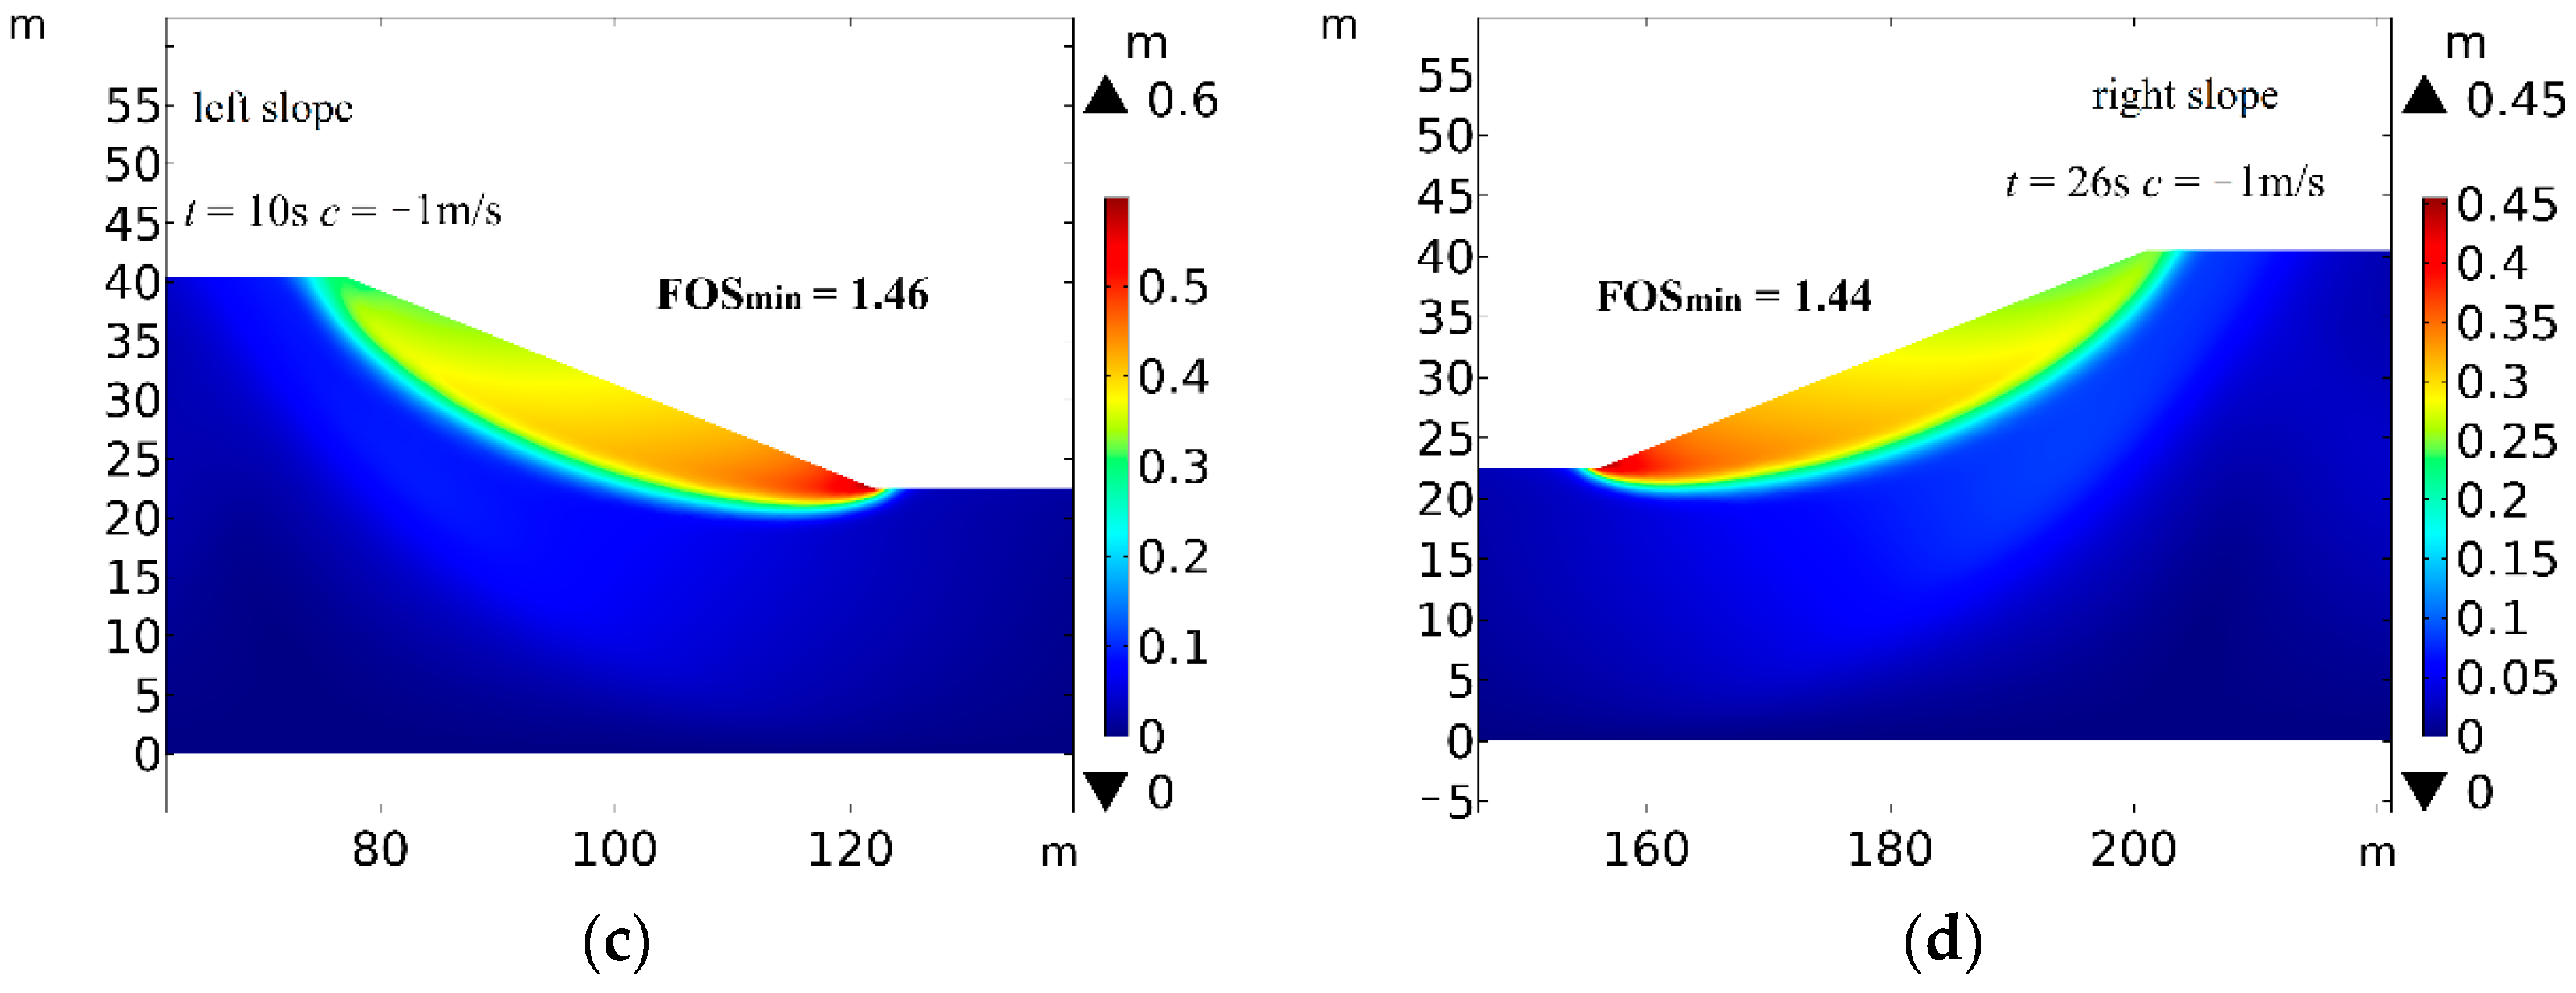
4.5. Influence of Current Direction on Slope Stability

The current flow can affect the propagation of a solitary wave and thus has further impact on the failure of the slope. In this section, two different current directions are discussed: one is the flow and the current in the same direction (+1 m/s, wave co-current), and the other is in the opposite direction (−1 m/s, wave counter-current). The deformation of both sides of the slope is illustrated in Figure 10, in which Figure 10a,b are the left and the right slope deformations in the case of wave co-current (+1 m/s), while Figure 10c,d are the left and the right slope deformations in the cases of wave counter-current (−1 m/s). It was observed that the FOSmin in Figure 10a,d were smaller than those in Figure 10b,c. This phenomenon may be attributed to the fact that, when the currents propagated away from the slope surface, the current-induced pressure acting on the slope surface may have reduced the stability of slope.

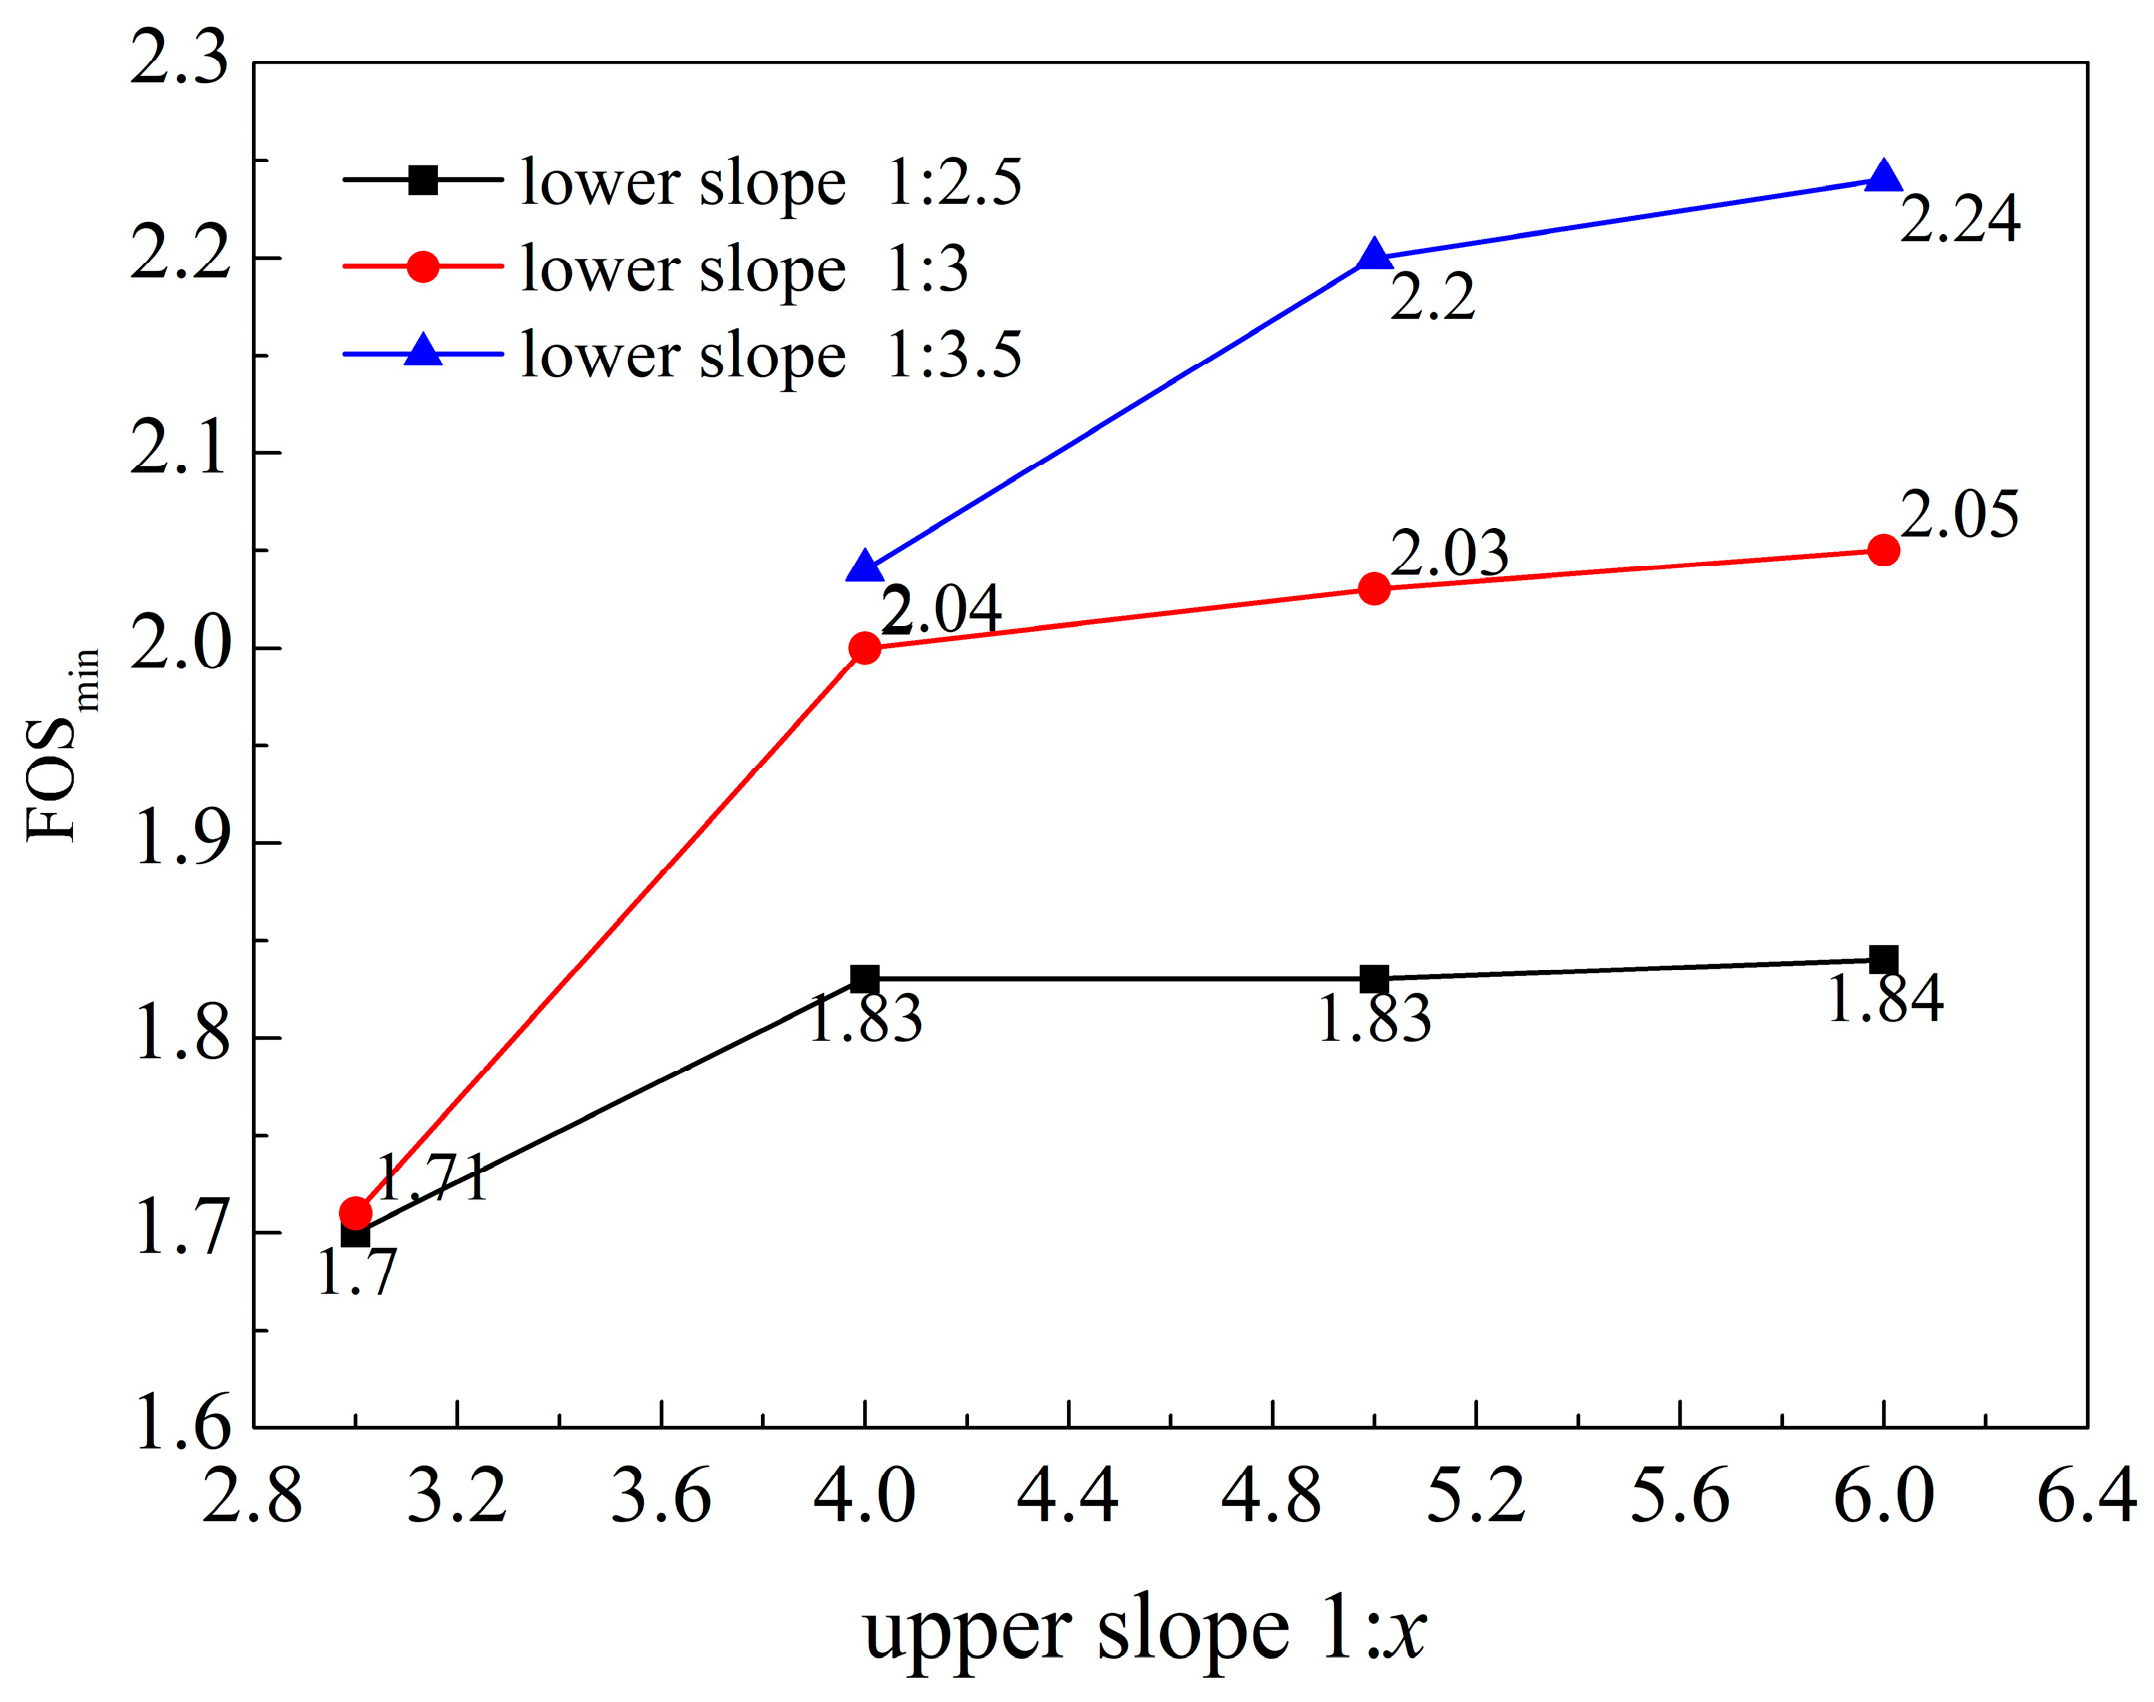
4.6. Influence of Slope Ratio on Two-Stage Slope

Due to the uneven distribution of horizontal layers, two-stage slope is mostly used in the trench excavation in practical engineering [20]. In this section, the effects of the slope ratio of upper slope and lower slope on the stability of the two-stage trench slope are investigated. The heights of the upper and the lower slopes were set be the same, and the soil parameters for the lower and the upper slopes were selected from Table 2. The lower soil was silt, and the upper soil was clay. The slope ratios of the lower slope were set to be 1:2.5, 1:3, and 1:3.5, respectively. Figure 11 shows the variation of FOSmin with the slope ratio of upper slope. It could be noted that FOSmin increased slightly as the upper slope ratio increased. Thus, it was concluded that the slope ratio of the lower slope had more significant influence on the stability of the whole slope compared with the upper slope ratio.

5. Conclusions

In this study, an integrated numerical model was developed to investigate the potential for the failure of the foundation trench of the immersed tunnel under solitary wave loading. Darcy’s law was adopted to calculate the pore water pressure, and the soil behavior was described by the Mohr–Coulomb constitutive model. The strength reduction method was applied in investigating the stability index for the foundation trench under the dynamic wave loading. Based on the calculation, the following conclusions can be drawn:
(1) The factor of stability (FOS) for the slope varied as the relative distance between wave crest and slope top changed. The wave motion significantly affected the stability of the slope seabed foundation. The minimum of FOS corresponded to the most dangerous situation of the slope with specific slope ratio under the solitary wave loading.
(2) The soil strength parameters had great impact on the area and the depth of the slope failure. The slope failure area and the depth increased with the increase of soil cohesion but decreased with the increase of internal friction angle.
(3) As the slope ratio increased, the FOS decreased, and the maximum deformation was more likely to concentrate at the toe of the slope with the increasing slope ratio.
(4) The FOS of the slope in the case where currents propagated towards the slope surface was greater than that in the case where the currents propagated away from the slope surface. It was noted that the current propagating away from the slope could increase the possibility of slope instability.
(5) When the foundation trench took the form of two-stage slope, the slope ratio of the lower slope had more significant influence on the stability of the whole slope compared with that of the upper slope.

Author Contributions

Conceptualization, W.C. and L.X.; methodology, D.W.; software, D.W.; validation, D.W. and Z.L.; formal analysis, D.W.; investigation, W.C. and D.W.; resources, Z.W.; data curation, D.W.; writing—original draft preparation, W.C. and D.W.; writing—review and editing, W.C. and Z.W.; visualization, D.W.; supervision, W.C.; project administration, H.G.; funding acquisition, W.C. and H.G. All authors have read and agreed to the published version of the manuscript.

Funding

This research was funded by the National Natural Science Foundation of China, grant number No. 41877243.

Institutional Review Board Statement

Not applicable.

Informed Consent Statement

Not applicable.

Data Availability Statement

Not applicable.

Conflicts of Interest

The authors declare no conflict of interest.

References

  1. Liu, C.; Cui, J.; Zhang, Z.; Liu, H.; Huang, X.; Zhang, C. The role of TBM asymmetric tail-grouting on surface settlement in coarse-grained soils of urban area: Field tests and FEA modelling. Tunn. Undergr. Space Technol. 2021, 111, 103857. [Google Scholar] [CrossRef]
  2. Chen, W.Y.; Wang, Z.H.; Chen, G.X.; Jeng, D.S.; Wu, M.; Zhao, H.Y. Effect of vertical seismic motion on the dynamic response and instantaneous liquefaction in a two-layer porous seabed. Comput. Geotech. 2018, 99, 165–176. [Google Scholar] [CrossRef] [Green Version]
  3. Chen, W.Y.; Huang, Y.; Wang, Z.H.; He, R.; Chen, G.X.; Li, X.J. Horizontal and vertical motion at surface of a gassy ocean sediment layer induced by obliquely incident SV waves. Eng. Geol. 2017, 227, 43–53. [Google Scholar] [CrossRef]
  4. Chen, G.X.; Ruan, B.; Zhao, K.; Chen, W.Y.; Zhuang, H.Y.; Du, X.L.; Khoshnevisan, S.; Juang, C.H. Nonlinear Response Characteristics of Undersea Shield Tunnel Subjected to Strong Earthquake Motions. J. Earthq. Eng. 2020, 24, 351–380. [Google Scholar] [CrossRef]
  5. Xu, L.Y.; Song, C.X.; Chen, W.Y.; Cai, F.; Li, Y.Y.; Chen, G.X. Liquefaction-induced settlement of the pile group under vertical and horizontal ground motions. Soil Dyn. Earthq. Eng. 2021, 144, 106709. [Google Scholar] [CrossRef]
  6. Henkel, D. The Role of Waves in Causing Submarine Landslides. Geotechnique 1970, 20, 75–80. [Google Scholar] [CrossRef]
  7. Bubel, J.; Grabe, J. Stability of Submarine Foundation Pits Under Wave Loads. In Proceedings of the Asme International Conference on Ocean, Rio de Janeiro, Brazil, 1–6 July 2012; p. 11. [Google Scholar]
  8. Jeng, D.S. Wave-induced liquefaction potential at the tip of a breakwater: An analytical solution. Appl. Ocean Res. 1996, 18, 229–241. [Google Scholar] [CrossRef]
  9. Madsen, O.S. Wave-induced pore pressures and effective stresses in a porous bed. Géotechnique 1978, 28, 377–393. [Google Scholar] [CrossRef]
  10. Yamamoto, T. Wave-induced pore pressures and effective stresses in inhomogeneous seabed foundations. Ocean Eng. 1981, 8, 1–16. [Google Scholar] [CrossRef]
  11. Mei, C.C.; Foda, M.A. Wave-induced responses in a fluid-filled poro-elastic solid with a free surface—a boundary layer theory. Geophys. J. Int. 1981, 66, 597–631. [Google Scholar] [CrossRef]
  12. Liu, B.; Jeng, D.S.; Ye, G.L.; Yang, B. Laboratory study for pore pressures in sandy deposit under wave loading. Ocean Eng. 2015, 106, 207–219. [Google Scholar] [CrossRef]
  13. Zhang, C.; Titi, S.; Zheng, J.H.; Xie, M.X.; Nguyen, V.T. Modelling wave-induced 3D non-homogeneous seabed response. Appl. Ocean Res. 2016, 61, 101–114. [Google Scholar] [CrossRef]
  14. Lin, Z.B.; Guo, Y.K.; Jeng, D.S.; Liao, C.C.; Rey, N. An integrated numerical model for wave–soil–pipeline interactions. Coast. Eng. 2016, 108, 25–35. [Google Scholar] [CrossRef] [Green Version]
  15. Lin, Z.B.; Pokrajac, D.; Guo, Y.K.; Jeng, D.S.; Tang, T.; Rey, N.; Zheng, J.H.; Zhang, J.S. Investigation of nonlinear wave-induced seabed response around mono-pile foundation. Coast. Eng. 2017, 121, 197–211. [Google Scholar] [CrossRef] [Green Version]
  16. Duan, L.L.; Liao, C.C.; Jeng, D.S.; Chen, L.Y. 2D numerical study of wave and current-induced oscillatory non-cohesive soil liquefaction around a partially buried pipeline in a trench. Ocean Eng. 2017, 135, 39–51. [Google Scholar] [CrossRef] [Green Version]
  17. Zhai, Y.Y.; He, R.; Zhao, J.L.; Zhang, J.S.; Jeng, D.S.; Li, L. Physical Model of wave-induced seabed response around trenched pipeline in sandy seabed. Appl. Ocean Res. 2018, 75, 37–52. [Google Scholar] [CrossRef] [Green Version]
  18. Zhang, Q.; Zhou, X.L.; Wang, J.H.; Guo, J.J. Wave-induced seabed response around an offshore pile foundation platform. Ocean Eng. 2017, 130, 567–582. [Google Scholar] [CrossRef]
  19. Zhao, H.Y.; Zhu, J.F.; Zheng, J.H.; Zhang, J.S. Numerical modelling of the fluid–seabed-structure interactions considering the impact of principal stress axes rotations. Soil Dyn. Earthq. Eng. 2020, 136, 106242. [Google Scholar] [CrossRef]
  20. Hu, Z.N.; Xie, Y.L.; Wang, J. Challenges and strategies involved in designing and constructing a 6 km immersed tunnel: A case study of the Hong Kong–Zhuhai–Macao Bridge. Tunn. Undergr. Space Technol. 2015, 50, 171–177. [Google Scholar] [CrossRef]
  21. Lara, J.L.; Losada, I.J.; Maza, M.; Guanche, R. Breaking solitary wave evolution over a porous underwater step. Coast. Eng. 2011, 58, 837–850. [Google Scholar] [CrossRef]
  22. Synolakis, C.E.; Bernard, E.N. Tsunami science before and beyond Boxing Day 2004. Philos. Trans. R. Soc. A Math. Phys. Eng. Sci. 2006, 364, 2231–2265. [Google Scholar] [CrossRef] [PubMed]
  23. Hsiao, S.C.; Lin, T.C. Tsunami-like solitary waves impinging and overtopping an impermeable seawall: Experiment and RANS modeling. Coast. Eng. 2010, 57, 1–18. [Google Scholar] [CrossRef]
  24. Synolakis, C.E. The Runup of Long Waves. Ph.D. Thesis, California Institute of Technology, Pasadena, CA, USA, 1986. [Google Scholar]
  25. Sumer, B.M.; Sen, M.B.; Karagali, I.; Ceren, B.; Fredsøe, J.; Sottile, M.; Zilioli, L.; Fuhrman, D.R. Flow and sediment transport induced by a plunging solitary wave. J. Geophys. Res. 2011, 116, C1008. [Google Scholar] [CrossRef] [Green Version]
  26. Young, Y.L.; White, J.A.; Xiao, H.; Borja, R.I. Liquefaction potential of coastal slopes induced by solitary waves. Acta Geotech. 2009, 4, 17–34. [Google Scholar] [CrossRef] [Green Version]
  27. Xiao, H.; Young, Y.L.; Prévost, J.H. Parametric study of breaking solitary wave induced liquefaction of coastal sandyslopes. Ocean Eng. 2010, 37, 1546–1553. [Google Scholar] [CrossRef]
  28. Nichols, B.D.; Hirt, C.W.; Hotchkiss, R.S. SOLA-VOF: A Solution Algorithm for Transient Fluid Flow with Multiple Free Boundaries; Technology Report LA-8355; Los Alamos Scientific Lab.: Los Alamos, NM, USA, 1980; Volume 12, p. 39.
  29. Hirt, C.W.; Nichols, B.D. Volume of fluid (VOF) method for the dynamics of free boundaries. J. Comput. Phys. 1981, 39, 201–225. [Google Scholar] [CrossRef]
  30. Hirt, C.; Sicilian, J. A Porosity Technique for the Definition of Obstacles in Rectangular Cell Meshes. In Proceedings of the 4th International Conference on Numerical Ship Hydrodynamics, Washington, DC, USA, 1 January 1985; p. 19. [Google Scholar]
  31. Launder, B.E.; Spalding, D.B. The numerical computation of turbulent flows. Comput. Method Appl. Mech. Eng. 1974, 3, 269–289. [Google Scholar] [CrossRef]
  32. Harlow, F.H.; Nakayama, P.I. Turbulence Transport Equations. Phys. Fluids 1967, 10, 2323–2332. [Google Scholar] [CrossRef]
  33. Franke, R.; Rodi, W. Calculation of Vortex Shedding Past a Square Cylinder with Various Turbulence Models, Berlin, Heidelberg, 1 January 1993; Durst, F., Friedrich, R., Launder, B.E., Schmidt, F.W., Schumann, U., Whitelaw, J.H., Eds.; Springer: Berlin/Heidelberg, Germany, 1993; pp. 189–204. [Google Scholar]
  34. McCowan, J. VII. On the solitary wave. Lond. Edinb. Dublin Philos. Mag. J. Sci. 1891, 32, 45–58. [Google Scholar] [CrossRef] [Green Version]
  35. Boussinesq, J.V. Théorie de l’intumescence liquide appelée onde solitaire ou de translation se propageant dans un canal rectangulaire. C. R. Hebd. Séances Acad. Sci. 1871, 72, 755–759. [Google Scholar]
  36. Munk, W.H. The solitary wave theory and its application to surf problems. Ann. N. Y. Acad. Sci. 1949, 51, 376–424. [Google Scholar] [CrossRef]
  37. Matsui, T.; San, K. Finite Element Slope Stability Analysis by Shear Strength Reduction Technique. Soils Found. 1992, 32, 59–70. [Google Scholar] [CrossRef] [Green Version]
  38. Chen, W.Y.; Liu, C.L.; Li, Y.; Chen, G.X.; Yu, J. An integrated numerical model for the stability of artificial submarine slope under wave load. Coast. Eng. 2020, 158, 103698. [Google Scholar] [CrossRef]
  39. Cheng, Y.M.; Länsivaara, T.; Wei, W.B. Two-dimensional slope stability analysis by limit equilibrium and strength reduction methods. Comput. Geotech. 2007, 34, 137–150. [Google Scholar] [CrossRef]
Figure 1. The solitary wave–artificial submarine slope coupling model.
Jmse 09 00526 g001
Figure 2. Variation of the wave induced maximum excess pore pressure (|uec|/σ′0) (at point A in Figure 1) with the mesh number N.
Jmse 09 00526 g002
Figure 3. FEM mesh used in the computation for seabed in the vicinity of the foundation trench.
Jmse 09 00526 g003
Figure 4. Comparison of wave surface profile between the proposed model and the experimental data [23]: (a) t = 10 s, (b) t = 20 s, (c) t = 25 s, (d) t = 30 s.
Jmse 09 00526 g004aJmse 09 00526 g004b
Figure 5. Initial state of the trench after excavation: (a) horizontal displacement, (b) vertical displacement, (c) stress state.
Jmse 09 00526 g005
Figure 6. Variations of FOS with D in the cases of various slope ratios.
Jmse 09 00526 g006
Figure 7. Destruction areas of the slope with different soil parameters: (a) c′ = 15 kPa, 20 kPa, 25 kPa, 30 kPa; (b) φ′ = 12°, 16°, 20°, 24°.
Jmse 09 00526 g007
Figure 8. Plastic penetration zones in the slope with different slope ratios: (a) slope ratio 1:2.5, (b) slope ratio 1:3, (c) slope ratio 1:3.5, (d) slope ratio 1:4.
Jmse 09 00526 g008
Figure 9. Sliding displacements in the slope with different slope ratios (scale factor is 20): (a) slope ratio 1:2.5, (b) slope ratio 1:3, (c) slope ratio 1:3.5, (d) slope ratio 1:4.
Jmse 09 00526 g009
Figure 10. Deformation of the trench slopes under the currents in different directions: (a) left slope, 1 m/s; (b) right slope, 1 m/s; (c) left slope, −1 m/s; (d) right slope, −1 m/s.
Jmse 09 00526 g010aJmse 09 00526 g010b
Figure 11. Variation of FOSmin with the slope ratio of upper slope for various lower slope ratios.
Jmse 09 00526 g011
Table 1. Input parameters for parametric study.
ParametersCharacteristicsValueUnit
Wave ParametersWave height (H)3m
Water depth (d)10m
Soil ParametersSeabed thickness (h)40.5m
Shear modulus (G)6.56 × 10⁶Pa
Soil porosity (n)0.41-
Poison’s Ratio (μ)0.35-
Elastic modulus (E)1.77 × 10⁷Pa
Soil permeability (k)8 × 10⁻⁶m/s
Density of soil grain (ρs)2.71 × 10³kg/m3
Effective cohesion (c′)15kPa
Effective internal friction angle (φ′)20°
Trench width (W)34m
Trench height (B)18m
Water parametersBulk modulus (Kw)2 × 10⁹Pa
Density of water (ρw)1000kg/m3
Table 2. Input soil parameters of the two-stage slope.
ParametersCharacteristicsValueUnit
Soil Parameters in Upper SlopeSeabed thickness (h1)8m
Shear modulus (G1)4.33 × 10⁶Pa
Soil porosity (n1)0.56-
Poison’s ratio (μ1)0.35-
Elastic modulus (E1)1.17 × 10⁷Pa
Soil permeability (k1)1 × 10⁻⁹m/s
Density of soil grain (ρs1)2.75 × 10³kg/m3
Effective cohesion (c1′)12kPa
Effective internal friction angle (φ1′)13
Soil Parameters in Lower SlopeSeabed thickness (h2)32.5m
Shear modulus (G2)6.56 × 10⁶Pa
Soil porosity (n2)0.41-
Poison’s ratio (μ2)0.35-
Elastic modulus (E2)1.77 × 10⁷Pa
Soil permeability (k2)8 × 10⁻⁶m/s
Density of soil grain (ρs2)2.71 × 10³kg/m3
Effective cohesion(c2′)15kPa
Effective internal friction angle (φ2′)20
Publisher’s Note: MDPI stays neutral with regard to jurisdictional claims in published maps and institutional affiliations.

