
Quantitative Ship Collision Frequency Estimation Models: A Review


1
Faculty of Maritime Studies, University of Split, 21000 Split, Croatia
2
Faculty of Transport and Traffic Sciences, University of Zagreb, 10000 Zagreb, Croatia
*
Author to whom correspondence should be addressed.
J. Mar. Sci. Eng. 2021, 9(5), 533; https://0-doi-org.brum.beds.ac.uk/10.3390/jmse9050533
Submission received: 14 April 2021
/
Revised: 13 May 2021
/
Accepted: 13 May 2021
/
Published: 16 May 2021
(This article belongs to the Section Ocean Engineering)
Abstract
:Ship collisions are one of the most common types of maritime accidents. Assessing the frequency and probability of ship collisions is of great importance as it provides a cost-effective and practical way to mitigate risk. In this paper, we present a review of quantitative ship collision frequency estimation models for waterway risk assessment, accompanied by a classification of the models and a description of their main modelling characteristics. Models addressing the macroscopic perspective in the estimation of ship collision frequency on waterways are reviewed in this paper with a total of 29 models. We extend the existing classification methodology and group the collected models accordingly. Special attention is given to the criteria used to detect potential ship collision candidates, as well as to causation probability and the correlation of models with real ship collision statistics. Limitations of the existing models and future improvement possibilities are discussed. The paper can be used as a guide to understanding current achievements in this field.
1. Introduction
Despite technological advances, maritime accidents continue to occur, causing economic and environmental damage as well as loss of human lives. Statistical data show that the number of maritime accidents has increased in the last decade [1,2]. Collisions account for an estimated 16% of all accidents, and with groundings and fires they are among the most common types of accidents [3,4]. For maritime accidents, the risk is usually defined as the product of the probability of occurrence of an adverse event and the consequences of this event , i.e., [5,6,7]:
In maritime accident risk assessment, instead of the conventional expression of probabilities, the concept of the number of adverse events in a given period of time (frequency) is often used in practice, e.g., the number of ship collisions in a year [6]. This is supported by the fact that in the International Maritime Organization (IMO) methodology called Formal Safety Assessment (FSA), risk is defined as the frequency of occurrence of adverse events and the severity of the consequences [8]. The FSA is the leading methodology for maritime risk analysis and maritime regulatory policy formulation [9]. For example, the consequences of an accident can be the number of lives lost in a year or the cost of removing oil pollution in a year. It is well known that a practical and cost-effective way to reduce risk is to reduce the probability of an adverse event, and this can be achieved through prior knowledge of that very probability [10]. This is supported by the fact that research and quantitative models for estimating ship collision frequency and probability are more prevalent than research and models for estimating the consequences of ship collisions, although both components of risk definition are equally important for a complete risk analysis [11,12]. Ship collision frequency can be estimated using statistical data, expert opinion and models [12,13]. An approach based on maritime accident statistics (e.g., ship collisions) is often not an appropriate solution and has several drawbacks. For example, past maritime traffic conditions in a given navigation area may not correspond to current or future traffic conditions in the same area, as the structure and traffic volume on a waterway may change or new safety rules and regulations may be applied. In this case, ship collision statistics from the past are not reliable for ship collision frequency estimations in the future. Similarly, the application of new maritime technologies implies that the use of historical collision statistics to estimate collision frequency in the future may also be inappropriate. Additionally, many navigation areas have an insufficient amount of historical data for a valid risk assessment, while potential new waterways have no data at all. Furthermore, an important issue regarding maritime accident statistics is the lack of appropriate standards for storing detailed accident information. Consequently, the use of quantitative models is a dominant and generally most accepted way for estimating the frequency of ship collisions, which eliminates the above disadvantages [14]. Quantitative-based ship collision risk analysis is gaining attention from researchers and academics as it provides measurable quantitative results for risk assessment and mitigation in conjunction with consequence assessment. Terminologies, quantitative risk analysis and probabilistic risk analysis both refer to the same approach to risk analysis, so the choice of terminology is a matter of author preference [5]. The basic concept, adopted to some extent in most of today’s collision frequency estimation models, implies that collision candidates [14,15] are first identified, i.e., ships on an encounter course where a collision is imminent if no evasive action is taken [14,16,17,18,19]. The concept is expressed as:
where is the expected number of actual collisions, represents the number of collision candidates and represents the causation probability, i.e., the probability of unsuccessful collision avoidance in a situation where a collision candidate occurs. This approach is also known as the synthetic estimation approach [14]. In addition to the term known as collision candidate, several other terminologies can be found in the literature, some of which differ in definition but follow the same general concept [20]. Some of the related terminologies are near miss [21,22], traffic conflict [23], dangerous encounters [24], etc. In research [20], all of the above terminologies are placed under the common framework known as non-accident critical events. Non-accident critical events should be considered as hazardous events that are close to an accident according to certain criteria and therefore require attention [20]. Further in the text, we accept the terminology “collision candidates” because it fits the general concept very well. In order to reduce the unrealistically large number of collision candidates to a realistic expected number of collisions, the causation probability is used. It refers to the probability of a collision occurring due to various reasons, such as human and organizational factors, meteorological conditions, mechanical failures, etc. Human and organizational factors are the major contributors to the occurrence of maritime accidents [25,26,27]. Such factors include errors in decision making, rule violations, fatigue, etc. The values of the causation probability vary and, according to the literature, are usually most dependent on the navigation area and the collision scenario (overtaking, crossing, etc.) for which the ship collision probability is estimated [12,17,19,28].
An overview of the models used for the estimation of ship collision frequency and probability on waterways is presented in this paper (a total of 29 models). Models used for improving situational awareness of Officers on Watch (OOW), real-time collision avoidance systems and ship collision consequence estimation are beyond the scope of this review. Although there are several relevant review papers from this field [14,20,29], we found that quantitative ship collision frequency estimation models are only partially addressed in the studies. The lack of clarity regarding the definition of different categories of models, as well as the affiliation of individual models to different categories, was one of the main motivations for this research. This research sought to cover questions such as: In which category/subcategory does this model fit in terms of the overall model characteristics? In which category/subcategory does the method of detecting a collision candidate fit in relation to other known methods? Furthermore, the ability of the model to represent reality as accurately as possible should be of the utmost importance. Therefore, it is necessary to answer the questions: Have the results of the model been compared to the actual statistical number of collisions? If so, was an internal or extraneous causation probability used? We also consider it valuable to present the sum of most of the known shortcomings of existing models and possible improvements, as well as our own considerations.
The relevant bibliographic databases were searched using the standard search approach. Selected keywords and their different combinations were used as search input, and identified papers were manually screened based on the titles, abstracts and introductions. Keywords were chosen based on the most commonly accepted concepts and phrases from the literature. Therefore, the following keywords and sets of keywords, as well as their combinations were used in the database search: (a) ship collision, (b) frequency estimation, (c) risk assessment, (d) probabilistic modelling, (e) quantitative, (f) probability, (g) collision candidates, (h) dangerous encounters, (i) near miss, (j) computer simulation, (k) AIS data. Following databases were searched: (i) ScienceDirect, (ii) Springer Journals, (iii) Wiley Online Library, (iv) Cambridge Journals, (v) IEEE/IET Electronic Library (IEL), (vi) Science Journals, (vii) Taylor & Francis Subject Collections, (viii) Wiley Online Library, (ix) Bentham Open, (x) IEEE Xplore Digital Library, (xi) Google Scholar search engine. A publication date limit was not applied, although more attention was given to the papers published in the last decade. Manual filtering of the papers was performed since some of them were not mainly focused on the overall risk assessment and risk profile obtainment of waterways. Afterwards, papers were analyzed and classified after in-depth examination as presented further in this review. The existing classification methodology [14] has been adopted and updated so to facilitate classification and category affiliation.
The paper is structured as follows: Section 2 provides a classification and overview of quantitative models for estimating the frequency of ship collisions, with a brief description of the main modelling features. Within Section 2, Section 2.1 discusses basic and commonly used scientific approach to risk analysis in maritime transport, Section 2.2 discusses analytical models, Section 2.3 discusses models that use and iteratively process Automatic Identification System (AIS) data, Section 2.4 discusses simulation models, Section 2.5 presents the classification framework with models classified accordingly, and Section 2.6 discusses methods used for estimating causation probabilities. The drawbacks of the existing models and areas for improvement for future research are discussed in Section 3. A discussion and concluding remarks are given in Section 4.
2. Quantitative Ship Collision Frequency Estimation Models
2.1. Basic Scientific Approach to Risk Analysis in Maritime Transport
Three basic scientific approaches should be distinguished in risk analysis: realist, constructivist and proceduralist approaches [29,30,31,32]. A realist approach considers risk as a physical attribute of a system or technology that can be characterized by objective facts, and risk is characterized by quantitative information related to incidental events or consequences [29]. The constructivist approach considers risk as a social creation attributed to a system or technology while not being a part of it [31]. In this case, the risk analysis is based on expert opinion. In a proceduralist approach, different stakeholders, such as scientists, experts, risk-takers and politicians participate in the risk assessment process through a common understanding, facts and values.
In the last decade, the interest in maritime risk analysis methods has increased to such an extent that international organizations (e.g., IMO) issue relevant recommendations on the use of specific mathematical tools for risk analysis and management [29,33]. In practice, there is often a different understanding of the concept of risk itself and its scientific-theoretical background. A similar problem has been identified in maritime transport, where extensive research has been conducted on the fundamental issues of risk analysis in maritime transport [29]. Different definitions, classifications and scientific approaches to risk assessment in maritime transport were analyzed and it was found that most risk assessment models lack clarity regarding the scientific definition used in risk analysis. According to the same study, the aspect of uncertainty is neglected in most models and the concept of frequency and probability is used as the basis of most models. It was also found that most of the models use a realist scientific approach in risk assessment which involves quantitative modeling.
The generally accepted definition of risk in maritime transport defines risk as the product of the probability of an adverse event and its consequences. Therefore, quantitative models for ship collision risk assessment can be divided into [19] models for ship collision frequency estimation, which are considered in this review study, and models for consequence estimation. The relationship between ship collision frequency and consequences in the context of risk assessment is presented in [11]. As explained earlier, most ship collision frequency estimation models follow a framework according to which two components need to be considered (see Equation (2) in the introductory section), which means that it is necessary to calculate the total number of collision candidates and the probabilities that two ships forming a collision candidate will lead to a collision. This approach is known as the synthetic estimation approach, which is dominant among researchers, and it combines maritime traffic information (e.g., dynamic information on ship movements) and causation probability (e.g., considering various human, organizational and external factors) [14]. A classification and overview of quantitative ship collision frequency estimation models is provided in the following subsections.
2.2. Analytical Models
Models that estimate the frequency of ship collisions in waterways and different scenarios from a macroscopic perspective are the subject of this paper. Individual analytically expressed different criteria for detection of collision candidates that can be found in the literature of related fields that may overlap with each other (e.g., literature dealing with real-time collision avoidance) were omitted from this review.
2.2.1. IWRAP Analytical Models
IWRAP (IALA Waterway Risk Assessment Program) is undoubtedly one of the most commonly used software programs for calculating the ship collision and grounding frequencies in maritime traffic supported by the International Association of Maritime Signaling Authorities (IALA) and IMO [33,34]. Its popularity is not declining, and it has been used in numerous studies for waterway risk assessment recently [35,36,37]. The IWRAP program itself is based on the synthetic estimation approach, i.e., the concept presented in Equation (2) from the introductory section, and does not consider the consequences of incident events. IWRAP calculates the number of collision candidates from the Equation (2) which is then multiplied by some of the existing causation probabilities from the literature, depending on the type of collision [28,33]. Analytical models integrated into IWRAP are presented further in this section. IWRAP distinguishes the following ship collision scenarios [28,38]: (a) overtaking collisions, (b) head-on collisions, (c) crossing collisions, (d) merging collisions, (e) bend collisions, (f) collisions in the random sailing directions scenario. In IWRAP, ship collision scenarios (d–f) are approximated with scenarios (a–c), which are described below.
Maritime traffic on a part of the waterway and the scenario resulting in head-on and overtaking collisions can be illustrated as in Figure 1.
The probability of the trajectories (course lines) of two oncoming ships overlapping depends on the distribution of ships along the width of the fairway from each direction of the fairway (a lower value of the variable implies a higher probability of collision). The number of collision candidates for the head-on collision in the observed time is obtained using the following analytical equation [28,40]:
where the parameters are described as follows: is the length of the route, is the number of passes of class ships in a unit of time on route 1, is the number of passes of class ships in a unit of time on route 2, is the average speed of class ships on route 1, is the average speed of class ships on route 2, denotes the width of class ships, denotes the width of class ships, is the distance between the center lines of navigation routes and denotes the average deviation of ships during navigation from the center lines of navigation routes. Figure 1 also describes the scenario of overtaking collisions which implies that ships move in only one direction, and the number of collision candidates is calculated so that in Equation (3) the sum of average velocities is replaced with the absolute value of the difference between these velocities .
For the crossing collision scenario, IWRAP uses Pedersen’s model [28,40], which is among the most used models for estimating ship collision frequency in numerous studies [35,36,37,41,42,43,44]. The scenario can be illustrated as in Figure 2.
The deviation of ships on waterways from the center lines of waterways also follows the normal distribution as in the previous scenario. The number of collision candidates in the crossing collision scenario , in the observed time , is obtained using the following analytical equation [28,40]:
where the parameters are described as follows: is the number of passes of class ships in a unit of time on route 1, is the number of passes of class ships in a unit of time on route 2, is the relative speed of approach of a class ship from fairway 1 to a class ship from fairway 2. It should be noted that contrary to head-on and overtaking collisions, traffic distribution along the width of the route is not relevant for crossing collisions. is the collision diameter of two ships approaching each other on different courses, is the angle of intersection of waterways (due to practical reasons the angle is limited to a range between 10 and 170 degrees). The collision diameter represents the minimum passing distance below which a collision is inevitable. For details on calculating the collision diameter and the relative speed , see the sources [28,40].
2.2.2. Other Analytical Models
The model based on the collision theory of molecules [17] refers to a crossing collision scenario. Ships on a waterway are homogeneous groups where each ship is the same size and each ship has the same speed. A ship approaching a waterway that is being intersected with the ship’s course line at the angle is considered, and the average free distance that the ship can cover on average before colliding with one of the ships on the waterway is defined. According to this model, the geometric probability of a collision is defined as
where is the average distance between ships, is the actual length of the path observed for an individual ship, is the average length of ships, the value of 925 is a constant that represents approximately half a nautical mile. The model assumes that all ships move at the same speed (including the observed individual ship).
In [45], the so-called parallel collisions (overtaking and head-on collisions) and crossing collisions are considered. The frequency of contacts between two ships (ship 1 and ship 2) on one segment of the waterway is defined as
where is the length of the considered waterway segment, and are the annual number of passes of ship 1 and ship 2 on the considered waterway segment, and and denote the speeds of ships 1 and 2. The geometric probability of collision of these two ships is calculated as
where is the width of the considered segment of the waterway, and and are the widths of the considered ships 1 and 2 (the model is valid if the width of the considered waterway segment is significantly greater than the width of the ships). In the case of two ships on one waterway segment, the estimated annual collision frequency is
where and are the previously described parameters, is the causation probability, and is the risk reduction factor. According to this model, a collision of two ships that are not positioned on the same waterway is defined as a crossing collision. The frequency of such collisions is calculated based on the type of waterway crossing, traffic intensity, length, width and speed of ships, crossing angle, causation probability and the probability that the course lines of the two ships intersect. The annual frequency of such collisions is calculated as follows:
where is the probability that the course line of ship 1 intersects with the course line of ship 2, is the annual geometric ship collision frequency (i.e., annual number of collision candidates), is the causation probability, is the risk reduction factor.
The model [46] calculates the ship collision frequency at a given geographical location at a given time (usually 1 year). The frequency of encounter situations is calculated. Within the model, the encounter is defined as a situation where two ships have met at a distance of half a nautical mile. The frequency of encounters is the sum of pairs of ships (located at a distance of half a nautical mile from each other) on all waterways in the considered geographical location. The encounter frequency is multiplied by the collision probability per encounter in order to calculate the collision frequency . The model enables the calculation of the total collision frequency of all ships, as well as the calculation of the collision frequency of a certain type of ship. The collision frequency at a certain location is calculated as
where is the probability of normal visibility, is the probability of reduced visibility, the probability of a collision in a normal visibility encounter (causation probability in normal visibility), the probability of a collision in a low visibility encounter (causation probability in reduced visibility). The stated causation probabilities in this model are calculated using the Fault Tree Analysis (FTA).
In [47], ship collision frequency models for two different scenarios are proposed. One of the scenarios considers the sea surface in the form of a circle in which ships move randomly, while the other scenario considers the sea surface in the form of a square in which ships move in predetermined fixed directions. Let be the radius of a very small circle (the area within which it is possible to place a ship of average dimensions) that is of negligible size in relation to the considered sea surface represented by a circle or a square. Both models calculate the number of “dangerous encounters”. If the distance between two ships is less than the radius , it is considered that a “dangerous encounter” has occurred. For the circular sea surface scenario where ships move in random directions, the number of “dangerous encounters” of one selected ship (one’s own ship) with other ships sailing on the considered sea surface during time is calculated as
and
where is the average number of ships sailing on the considered sea surface, is the speed of one’s own ship, is the speed of other ships, , is the angle between the sailing directions of one’s own ship and the sailing directions of other ships. For the square-shaped sea surface scenario where ships move in predetermined fixed directions, the number of “dangerous encounters” of one’s own ship with other ships sailing on the considered sea surface during time is calculated as
These models assume that the density of ships sailing on the considered sea surfaces is uniform, i.e., the models assume that each part of the sea surface has an equal probability that there is a ship on it. Therefore, they are more suitable for use on the open sea than on limited narrow waterways.
In [7], models for calculating the number of collision candidates are presented, namely for the head-on and overtaking collision scenario, crossing collision scenario and random sailing direction collision scenario. The model assumes a uniform distribution of ship traffic along the width of waterways. The number of collision candidates for the head-on scenario during the time is obtained using the following analytical equation:
where is the length of the observed waterway for which the number of collisions is calculated, is the width of the observed waterway, while the meaning of all other parameters is equal to the meaning of the eponymous parameters appearing in Equation (3) from Section 2.2.1. The following equation is used for the overtaking scenario:
and for the crossing scenario the formulation of the model is as follows:
where is the angle of intersection between waterway 1 and waterway 2, , is the collision diameter (which can be approximated with the diameter of the circle describing the ship, i.e., the length of the ship), while the meaning of the other parameters is equal to the meaning of the parameters from the Equation (14). The model is limited to an angle of . The same source presents a model for calculating the number of ship collisions for the random sailing direction scenario on the waterway that implies only one ship class (all ships have the same characteristics):
where is the density of ships on the considered waterway, and is the average width of the waterway.
2.3. AIS Data-Processing-Based Models
A number of models based on the iterative processing of historical AIS data and the application of different criteria during the process of collision candidate detection can be found in the literature, especially in recent years. It should be emphasized that these models generally depend directly on real data, which can be considered input parameters for the model.
The paper in [44] presents a model for calculating the expected number of ship collisions off the coast of Portugal using AIS data. AIS data processing (decoding, visualization and analysis of the same) was performed using a custom-developed computer program. Based on AIS data, maritime traffic on the coast of Portugal was characterized and statistical analysis of maritime traffic was made. The visualization was achieved by representing the considered geographical area bounded by two parallels and two meridians with a matrix whose elements represent pixels in the image of the considered geographical area (pixel color intensity varies depending on traffic intensity at that geographical location). This approach calculates the number of collision candidates directly from the decoded AIS messages and the collision diameter concept (see Section 2.2.1) [40]. The number of collision candidates is obtained by calculating the future positions of the ships and their mutual distances based on the positions, courses and speeds contained in the AIS messages, and the distances between ships are compared with the collision diameter. If the distance between any two ships is less than the collision diameter of those two ships, the pair is considered a collision candidate (the calculations are performed at intervals of 30 s). The collision diameter concept is used for the overtaking, head-on and crossing collision scenarios (overtaking and head-on scenarios can be viewed as a special case of the analytical model of the author P.T. Pedersen for the crossing collision scenario [40]). The model graphically shows the distribution of identified collision candidates in the considered geographical navigation area. Causation probability values from other studies are used to obtain the real expected number of collisions.
In the model in [48], instead of the collision diameter, the concept of “Minimum distance to collision” (MDTC) is used and calculated under the assumption that both ships take a collision avoidance maneuver in a situation where they may be considered as collision candidates. A collision candidate arises if the distance between the ships is not sufficient to take a collision avoidance maneuver. The distance and time required to undertake avoidance maneuvers depend primarily on the hydrodynamic and maneuvering characteristics of the ship type. The implementation of collision avoidance maneuvers in the collision probability assessment model first appears in the research of [49], but this model was limited to only one ship type, and the head-on and overtaking collision scenario. This model includes four types of ships of different sizes with the assumption that they move at their maximum speeds, sail on the high seas and start a collision avoidance maneuver at the same time. This model is based on the molecular collision model used in air traffic to estimate the number of aircraft collisions [50]. The ship is represented by a point in the middle of the circle which is considered to be an area where the appearance of other objects (ships) is not allowed, the so-called “no-go area” (Figure 3).
A collision candidate is declared in a situation where the circles of two ships overlap in such a way that the point of one circle enters the area of the circle whose radius is equal to the sum of the radii of the two original ship circles. The value of the circle diameter from Figure 3 is an MDTC value that is not constant but is calculated individually for each ship type and encounter. If the distance between two points (two ships) is smaller than the MDTC value, a collision is inevitable, regardless of the anti-collision maneuvers taken, and the model declares a collision candidate. The model is directly dependent on AIS data and has been tested in the “Gulf of Finland”. Existing causation probabilities from the literature were used.
Later, research [24] used the MDTC concept [48] to calculate the frequency of ship collisions in several major port approaches in the Singapore city area. In this work, the ship circle (as described in [48]) is expressed as a mathematical function of the angle between the course lines of two ships, the types of ships and the average length of two ships. In this way, the relationship between the ship’s circle and some characteristics of the ship (length, ship type, angle of intersection with the course line of another ship) is quantitatively expressed. A satisfactory match was found between the results of this research (collision frequency) and historical statistics on ship collisions in the Singapore port area. It should be noted that the MDTC concept is widely adopted and even used as one of the foundations for the development of novel critical situation detection models in real-time collision avoidance systems [51].
Extensive AIS data collected from the US Coast Guard’s national network of AIS receivers were used in the model [52] to identify collision candidates. The collision candidates were obtained through iterative processing of AIS data using a slightly modified quaternion ship domain [53]. The correlation between the obtained collision candidates and the actual real collisions from the database was calculated, and the results show that the statistical correlation between the number of actual collisions and the collision candidates is not sufficiently strong. The authors attribute that issue to various other factors not included in the model (waterway geometry, weather conditions, regulations, human factor, etc.). Based on framework (2), this model introduced an additional causation probability parameter called the probability of collision avoidance, which should be estimated using expert judgment based on the perceived probability of avoiding another approaching vessel when addressing hypothetical scenarios. Risk estimates of hypothetical traffic scenarios are possible using this model. A hypothetical scenario was simulated by introducing imaginary obstacles (wind farms in this example) that required traffic rerouting, which was performed using a simple diversion method. Existing causation probabilities from the literature were used in the model.
Another model [54] that applies its own dynamic ship domain was developed and tested by processing AIS data of Yangtze River estuary areas. The proposed ship domain takes some external environmental factors (in this case visibility and meteorological conditions) into account that affect ship collision probability. It is one of the few models that includes external factors affecting collision when detecting collision candidates. From a macroscopic perspective, based on traffic flow, traffic density and traffic speed, as well as visibility, route width and weather conditions, it attempts to find a relationship between these variables and collision frequency in the Yangtze River estuary areas using AIS data. Authors modeled ship collision frequency as a probabilistic function of influencing factors, including traffic characteristics and the above-mentioned environmental conditions. To quantify and calibrate the effects of these factors affecting the radius of the ship’s domain, more than 200 people, including ship captains and chief officers, participated in the survey. Causation probabilities from other studies were used. Results were compared with real collision statistics from that navigational area.
A developed quantitative risk assessment model [11] was used to assess ship collision risk in the Singapore Strait, including the frequency and consequences of ship collisions. AIS data from Lloyd’s MIU database was used in this case study. AIS data were processed, and ship collision candidates were detected using the ship domain based on [48]. The results were compared with real collisions in the Singapore Strait and borrowed causation probabilities from the literature were applied. The authors point out that the calculation of collision frequencies with this model provides insight into the current risk situation of the waterway and does not provide insight into the level of risk that would result if new rules and regulations were applied to the waterway to increase safety. To overcome this problem, authors propose a strategy where this model would be further embedded with a ship traffic simulation model to artificially generate ship trajectories and apply the model to determine the collision frequency for the hypothetical scenario.
AIS data from the Dutch part of North Sea and slightly modified elliptical ship domains (centered around the bow and only depending on ship size) based on [55] were used to calculate collision candidates in the research in [56]. The model detected conflict situations every 60 s, i.e., situations where ship maneuvers are required to avoid collision. Conflicts were additionally classified according to their complexity. The International Regulations for Preventing Collisions at Sea 1972 (CORLEGs) were also incorporated as an influencing factor when detecting collision candidates. More precisely, during the AIS data processing, calculations were made for a ship that must give way or for a larger ship if, according to rules, they both need to make a maneuver. After detecting the encounter requiring a maneuver, the model applied projected intrusion of the domain within the next 450 s. In other words, the ship movements along with their ship domains were artificially simulated within the next 450 s based on their current status, during which the model searched for domain intrusion. Any intrusion detected was considered a collision candidate. No correlation was sought between collision candidates and actual collisions.
Ship encounters were classified in the North Sea using another AIS-based developed model [57]. The model used the Time to the Closest Point of Approach (TCPA) and Distance of the Closest Point of Approach (DCPA) indicators to detect ship encounters that followed abnormal patterns, and it distinguished between crossing, head-on and overtaking encounters from AIS data collected over a two-year period. This study was initiated to evaluate the risk on the new route structures. A comparison was made between the old and new route structures, as the AIS data covered both time periods, and the heat maps, i.e., dangerous locations, were identified.
In the research of [58], instead of the ship domain concept, a “Vessel Conflict Ranking Operator” (VRCO) has been developed and used to detect and rank collision candidates from AIS data in Northern Baltic Sea. The highest ranked vessel encounters were judged by expert knowledge whether they can be classified as collision candidates or not. A mathematical formulation of the VCRO was constructed based on the expert interviews, where the following influencing factors were included: distance between two ships, rate of change of the distance determined by the relative speed of the two ships and the relative orientation of the two ships determined by the difference between their headings. Areas of collision candidate appearance were compared with known critical riskier areas from real-world determined based on the expert opinion and history of accidents. The results matched with the critical areas detected with analytical models in the Northern Baltic Sea within one of the previously performed studies [59].
In [60], a model for estimating ship collision frequency for the Sabine–Neches Waterway (SNWW) located in the southeast Texas was described. The model directly relies on the collected AIS data, and uses ship domain theory (domains represented by circles and ellipses) [61,62] to estimate the ship collision frequency. Locations with the highest risk of collision are also identified. The model is based on a collision candidate detection algorithm that compares the data (relevant for collision detection, e.g., the position of the ship at a particular point in time) of each AIS message (each individual ship) with the data of other AIS messages to seek if there is a spatio-temporal match of the data being compared within AIS messages. Due to the high processing requirements, AIS data collected within two months were used.
A model for calculating the collision frequency based on an innovative algorithm for detection of collision candidates, the so-called “Time Discrete Non-linear Velocity Obstacle (TD-NLVO)” is presented within the research [15]. AIS data from the port area of Aarhus in Denmark was used. Unlike most models in which the detection of collision candidates is performed using the spatio-temporal relationship between ships at certain time points where the pre-defined conditions for the occurrence of a collision are met (e.g., overlapping disks of two ships), in this model the collision candidate is defined as a pair of ships that is in a “meeting process” that lasts for a certain period of time and within which the speed of one of the ships has become equal to one of the previously calculated speeds from the predetermined set of speeds. The mentioned set of speeds is calculated using the TD-NLVO algorithm, which also considers the changing kinematics of ships that are in the “meeting process”. Afterwards, authors developed an improved version of the algorithm that can detect multiple ship encounter situations using AIS data [63].
A recently developed model [64] represents a new approach based on Convolutional Neural Networks (CNNs) and image recognition that can classify ship collision risk in encounter situations. The developed model is an expert system that mimics expert judgments of risk levels associated with ship encounter situations. AIS data from the Baltic Sea were utilized, and model has been validated by experts. Many other models require the inclusion of experts that evaluate the risk and make a final decision after the results are obtained, and, on the other hand, this model mimics the expert and does not require additional human experts and evaluation. AIS data are first used to generate images of encounters between ships and possible collision candidates based on the proximity of those ships. For each ship in which another ship is detected within the circular domain of 6 nm, an image is generated and the scenario is visualized. Additional traffic information from the encounters is also extracted, such as ship lengths, vessel types, speed over ground and course over ground (for the model accuracy improvement) This information then serves as an input for training the CNN model. A modified version of the VCRO model was used to help experts in the development and training of the model in order to determine the risk level for each encounter, i.e., potential collision candidate. Once sufficient traffic images augmented with additional information were interpreted by experts, the CNN model was developed to link traffic images directly with risk ratings, effectively mimicking expert judgments. The model was tested using a new AIS dataset from which it re-extracted images of encounter situations and additional traffic information that served as input parameters. The model then detected and classified all encounter situations based on these input parameters, simulating an expert. Images of encounter situations judged by expert knowledge imply that the impact of surrounding ships on the collision probability of two ships is taken into account to the certain degree, but this aspect requires further exploration. Figure 4 illustrates the basic modeling steps.
2.4. Simulation Models
Models based on computer simulations and other simulation modeling techniques are presented in this section.
This section provides an overview of simulation models for estimating the frequency of ship collisions developed over the past decade. Most models are based on the concept of calculating the number of collision candidates described in the introductory section.
A model [41,65] was developed to estimate the ship collision frequency while simultaneously predicting the location and time of the collision within the simulated time period. The model is based on the microsimulation of ship traffic within the geographical navigation area “Gulf of Finland” using the Monte Carlo simulation technique. The number of collision candidates and the locations of such collisions are calculated (causation probabilities from the literature are used to predict the actual number of collisions). The navigation of each individual ship is simulated in the time domain. Input data for the simulation, such as routes, structure and the number of ships on individual routes, sailing durations, ship sizes and speeds were collected from the AIS data of the Gulf of Finland navigation area. It should be emphasized that it is possible to enter input data and perform a simulation without AIS data. The model is based on the concept of the so-called “traffic event”. The voyage of each individual ship with the associated characteristics (length, width and type of ship, departure time, sailing route and speed of the ship) from the starting point to the destination is called a “traffic event”. The simulated time is one year, and “traffic events” are generated for each individual route, the number of which corresponds to the volume of annual traffic on that route. The corresponding characteristics of each individual “traffic event” are randomly selected based on the input distributions generated using AIS data. One set of generated “traffic events” represents one possible traffic situation during a year (one representation of a stochastic process). Collision candidates are predicted based on the generated set of “traffic events” assuming that the ships do not perform any maneuvers to avoid collision. The collision detection algorithm analyzes one representation of the stochastic process to find those combinations of “traffic events” in which the contours of the ships overlap at least at one point in time; the ships are in the same location simultaneously, and the model declares a collision. The collision detection algorithm is shown in Figure 5.
A dynamic computer simulation model [39] was developed for calculating the ship collision frequency in head-on, overtaking and crossing collision scenarios. Modeling steps are implemented within a developed computer application that contains a user interface for entering model input data and graphical visualization of the simulated scenario (graphical representation of the considered navigation area, ship navigation, ship collisions and their locations). Since the model is realized as an application developed in an object-oriented language, everything in the model is treated as an object (in the terminology of programming languages). Objects interact with each other during the simulation. Ships (and their physical characteristics) have been replaced by geometric circles. A geometric circle is an object that carries information about the ship and its current status (dimensions, position, course, speed, etc.) in the simulated time. For example, multiple geometric circles are used for simulating the width and length of ships in the model (Figure 6).
The model declares a collision candidate if two circles overlap in the simulated period. The model is not directly dependent on AIS data and the specific navigation area; it uses causation probabilities from the literature, and it has been validated using existing analytical models for ship collision frequency estimation [7,28,40].
The research in [66] presents a model for determining the frequency of maritime accidents in case of lack or limitation of data containing information relevant for risk assessment. This model is universal and suitable for all types of maritime accidents and does not require a large amount of data to be analyzed (e.g., AIS data). The approach is based on Markov’s modeling and “Markov Chain Monte Carlo” (MCMC) simulation. Markov’s three-state model is used to store and estimate the frequencies of maritime accidents and their probabilities. The authors defined and distinguished between three types of events (different degrees of event severity based on the literature and reports of different maritime organizations), namely, marine accidents, marine incidents and marine serious incidents (see source [66] for definitions of different events). Accordingly, they proposed a three-state graph that is applicable to any type of maritime accident (Figure 7).
As can be seen in Figure 7, the three states are S1—Normal, S2—Near Fail and S3—Fail. is occurrence rate from state 1 to state 2, is occurrence rate from state 1 to state 3, and is occurrence rate from state 2 to state 3. Using the slice sampling algorithm (one of the MCMC simulation methods that can generate random numbers from a distribution), the authors estimated the expected values of the occurrence rates (accident rate, incident rate, and serious incident rate). The estimated occurrence rates were put into the Kolmogorov equations, and the probabilities of occurrences were found by solving those equations. The MCMC simulation requires initial data (incomplete or limited) on the frequency of marine accidents of the Markov model to perform risk assessment. Data and reports (year 2011) from the Australian Transport Safety Bureau (ATSB) were used in the simulation. Based on the results, it can be seen that the simulated accident frequencies were not significantly affected by the actual accident frequencies from the initial data, and the simulated accident frequency over a period of 5 years recorded a slight decrease.
A group of researchers from three American universities (The George Washington University, Rensselaer Polytechnic Institute and Virginia Commonwealth University), the so-called GWU–RPU–VCU group, has developed a dynamic computer simulation model for counting collision candidates with the aim of assessing ship collision risk in the “Washington state ferry” (WSF) system [67]. For each pair of ships, the model calculates the Closest Point of Approach (CPA) [68], encounter angle and the time of occurrence of the CPA on the basis of which the collision candidates are classified and counted. The model uses its own causation probabilities that are determined based on statistical data. The scope of this model and research was not limited to ship collision risk assessment only, but also included risk assessment of other maritime accidents (groundings, explosions, fire, etc.) using expert knowledge.
Authors from the GWU–RPU–VCU group later developed a similar dynamic computer simulation model for counting collision candidates adapted for the San Francisco Bay [69]. The model was developed due to the introduction of new navigation routes in the bay and their risk profiles. The simulation model was developed based on the detailed knowledge of the structure of maritime traffic and all associated characteristics, navigation schedule and visibility. Information was collected from statistics and consultations with crew and captains (e.g., ship speeds in areas with a certain degree of visibility). The geographical navigation area and routes are visually represented by a computer, and the navigation area itself is divided into cells where each cell has a certain visibility degree. Ships are represented by triangles, and collision candidates are determined using CPA, i.e., analogously as in the research [67]. Each pair that is a collision candidate is stored in a database (ship type, encounter time, encounter angle, encounter location, visibility at the encounter location), and then the navigation area is graphically plotted with colored cells. Cell colors depend on the number of collision candidates detected on each individual cell. Thus, potentially dangerous locations on waterways that require special attention are identified.
A simulation model for risk assessment of different types of maritime accidents in the Strait of Istanbul is presented in [70]. The navigation area is divided into cells, and the risk of each cell is assessed (different types of maritime accidents are considered, e.g., collisions, groundings, fires, etc.) whenever a new ship enters the cell. As a first step, the model estimates the extent to which a new ship entering a cell contributes to a maritime accident, afterwards it estimates the contributions of all other ships in the cell, and finally calculates the cumulative contribution of all existing ships in the cell. The model takes into account a number of factors, such as detailed structure of ship traffic, departure schedule, visibility, sea currents and difficulty of navigation in certain areas of the waterway. Risk is assessed using its own numerical scale of the degree of risk, rather than using the concept of collision candidates.
A simulation model based on cellular automata (CA) for estimating the number of ship collisions in the “Singapore Strait” was presented in [71]. Discrete event models are used to generate ships of several categories and speeds from four major directions within the strait. Fifteen rules (based on the expert knowledge and interviewing of the captains) were also used to simulate the response of the seafarer to different navigation scenarios, which is manifested in the change of speed and movement of the ship. Collision candidates can be detected using a criterion according to which a distance of half a nautical mile and a five-minute encounter time between two ships is considered a critical situation, but the authors point out that some other criteria can also be implemented.
A simulation model that estimates the number of collision candidates in Portuguese waters, i.e., in the Tagus River Estuary area, is described within the research [72]. A simulation of ship navigation (ship movement) was achieved using the Artificial Potential Field (APF) method and the Monte Carlo simulation technique, and the detection of collision candidates was performed using the ship domain concept from [55]. The input data for the model were derived from the AIS data of the mentioned area. The simulation model was route based, where routes were characterized from AIS data, and a statistical study of relevant traffic parameters and ship particulars on each route was performed first. Ship trajectories were obtained based on 30 days of traffic simulation, and a comparison between trajectories obtained using simulation and AIS-derived trajectories was performed. For calculating collision candidates, ship domains were defined for all ships based on their positions at each time step. If the domains were overlapped or violated by another ship, the encounter was defined as a near collision and the location of the encounter was recorded. The simulation results were compared with the results obtained from processing raw AIS data. This model represents an improved version of the author’s previous version of the model [73] since this version considers the lateral distribution of the traffic along the waterway, speed distributions for different ship types and speed changes that occur along the main routes.
2.5. Model Classification
Since the classification of some models was not feasible with the methodology [14], the extended framework presented in Table 1 is proposed. Due to the existence of numerous models that use and iteratively process collected historical traffic data, i.e., AIS data to perform risk assessment, we grouped them within the same model class type and proposed a common terminology: “AIS data-processing-based models”. The AIS data-processing-based models and simulation models were classified after thorough review and presented in Table 1. The classification was performed considering the model type, the collision candidate detection criterion, the causation probability used and comparison with actual collisions.
The number of developed models by different classes during the period from 1995 to 2021 is shown in Figure 8.
It can be seen that most models using unconventional and new approaches do not directly link the results to the number of actual collisions. Furthermore, the popularity of AIS data-processing-based models using different ship domains and borrowed causation probabilities has increased significantly recently, while the implementation of the synthetic indicator approach for obtaining waterway risk profiles has lagged behind.
Additionally, it can be seen from Table 1 that almost all previously reviewed analytical models [7,17,28,40,45,47] fit into the category “Direct/nearly direct ship-ship contact and collision diameter”, and do not use borrowed causation probabilities. Only model [46] fits into the category “Synthetic indicator approach”. Even though models [35,36,37] (see Section 2.2.1) are only examples of the use of IWRAP analytical models in different navigation areas, such models can also be classified with the proposed framework as follows: all three models are “AIS data-processing-based models” that fit into category “Direct/nearly direct ship-ship contact and collision dimeter”. Additionally, models [35] and [36] both make a direct comparison with real collisions, and model [36] uses a borrowed causation probability. Furthermore, scientific evidence for the superiority of one model over others in terms of accuracy is lacking. Two studies conducted [15,74] could not determine if any model was superior to other models in terms of accuracy. The models marked with * in Table 1 all showed relatively good agreement of results with actual collisions. It should be emphasized that despite the shortcomings, the analytical models used in the IWRAP software have been validated multiple times through application over a number of geographical areas, and their ability to credibly reflect reality has been confirmed. Generally speaking, the ability of an AIS data-based model to evaluate collision risk for a current waterway traffic situation should be superior by default to other methods (provided that the chosen collision detection criterion is also accurate). The reason is the reliable representation of the actual spatio-temporal domain on the waterway since each AIS message contains the location and time of the ship at the time of transmission.
2.6. Methods for Estimating Causation Probabilities
Models used for estimating causation probabilities can be seen as a tier above the analytical models [75]. As complementary to analytical models, these models analyze collision accidents from a more holistic and systematic view, utilizing different methods (discussed further in the text) for estimating causation probabilities. The probability that an encounter, which is a collision candidate, results in an actual collision represents an indispensable element when estimating ship collision frequency. As mentioned in the introductory section, the probability of unsuccessful collision avoidance in a situation where collision candidates exist, i.e., the probability of an unsuccessful collision avoidance maneuver, is called causation probability, denoted as (2). The following is a brief description of the methods used to calculate the causation probabilities, namely, calculation of causation probability using statistics on the number of collisions in a geographical navigation area, calculation of causation probability using Fault Tree Analysis (FTA) and calculation of causation probability using the Bayesian network [14,42,76]. It should be emphasized that most of the existing models of different geographical navigation areas and different authors were realized using the above methods (modelling concepts are analogous, but the data used in the models differ).
Calculating the causation probability using historical statistics is the simplest approach where the correction factor for an area is calculated from the ratio of the number of actual collisions recorded and the estimated number of collision candidates in that area [77]. Examples of such models can be found in [16,17] and from recent research in [77]. This approach requires the availability and accuracy of historical collision statistics, which might represent a problem. Furthermore, insight into the detailed causes of collisions is not possible with this approach, which means that it is difficult to adopt measures to reduce the risk of collisions [76]. Models developed using FTA and the Bayesian network are a more commonly used approach in recent times, and in addition to causation probability value, they provide insight into a series (chain) of events that resulted in a collision.
FTA is performed using a logic diagram that can be used to determine the probability of an accident in maritime traffic using Boolean logic, which combines a series of lower-level “events” and their causal links that can lead to a collision (e.g., radar failure, seafarer fatigue, etc.) [14,42]. FTA is conducted on the basis of a cause-and-effect analysis of accident reports or the expertise of experts in the field. “Events” are placed in different groups based on recognized cause-and-effect relationships in the form of a Boolean gate (AND, OR, etc.). A “tree” shape is formed to graphically illustrate the impacts of lower level “events” on the main “event”, i.e., ship collision. The probability of each individual “event” of a lower level is determined by statistical analysis, expert interviews, questionnaires, etc., while the probability of the main “event” is calculated using Boolean logic. This method for calculating the causation probability of ship collisions along with an analysis of the causes that led to the accident was also recommended by the IMO within the Formal Safety Assessment (FSA) methodology [78]. FTA was also used in one of the well-known models [40] for calculating causation probability. In [25], an extensive model for calculating tanker collision causation probability was described using FTA, and emphasis was placed on a detailed analysis of human errors and its contribution to the occurrence of collisions. A similar study using FTA, which refers to tanker collisions, was described in [79], while a model for calculating the causation probability for RoPax ship collisions was presented in [80]. In [46], a general model for calculating the ship collision causation probability in good visibility was presented.
The disadvantages of using FTA in such models are manifested through the exponential growth of the tree structure when adding variables, i.e., “events” whose influence is taken into account when it comes to the occurrence of collisions [76]. Another disadvantage of FTA is Boolean logic, where states of components are described as binary, and the existence of more than two states is not allowed [14]. The Bayesian network eliminates these shortcomings, and its use for risk assessment in maritime transport has increased significantly over the last decade [21,76]. A Bayesian network is a structure composed of directed acyclic graphs consisting of nodes (representing variables), arcs (representing dependencies between variables) and a conditional probability table containing the conditional probabilities of occurrence of each state of the variable. It is said that for each variable that has parent nodes , there is a table of conditional probabilities , and if variable has no parent nodes, probability is assigned to it. Thus, nodes are variables that can have a finite number of different states, and each state can have some probability of occurrence assigned to it. For example, the “Weather” node can have “Good” and “Bad” states. The probability of a node state occurrence can be affected by other nodes (represented by arcs). Historical statistical data and expert knowledge (or a combination of both) can be used to identify relevant nodes and their dependencies, as well as to create a table of conditional probabilities. More details on Bayesian networks can be found in [81]. One simplified generic example of Bayesian network for modeling and calculating the ship collision causation probability is shown in the Figure 9 [82].
There are numerous examples of Bayesian network usage in ship collision risk assessment. The case study in [83] presented a model based on the Bayesian network for assessing the RoPax ship collision risk assessment on the high seas (validated in the Gulf of Finland) and a framework on which it is recommended to perform risk assessment in maritime transport in general. In [84], the Bayesian network and the Human Reliability Analysis (HRA) method were used to develop a model for oil tanker ship collision risk assessment. The possibility of combining the Bayesian network and the FTA is also demonstrated within the same research. Within the case study in [85], a general model for risk assessment in maritime transport is described, with an emphasis on human and organizational factors. In [40,43], models based on the Bayesian network were used to calculate causation probabilities for different ship collision scenarios (e.g., overtaking collisions, head-on collisions, crossing collisions). Additionally, for the purpose of developing the computer simulation program IWRAP (see Section 2.2.1), the Bayesian network for calculating causation probability was used in [28]. Furthermore, a model based on the Bayesian network for calculating the causation probability for the Chittagong port area (the largest port in Bangladesh) was presented in [86].
3. Disadvantages of Existing Models and Improvement Possibilities
3.1. Disadvantages of Existing Models
Based on the research conducted, the following shortcomings of the existing models were identified:
- (a)
- (b)
- The aspect of uncertainty, which is part of the risk analysis, is not taken into account in most of the models used for calculating the causation probability [29], and this is particularly emphasized in the analysis of the human and organizational factors [14]. The modeling of the human factor and the lack of analysis of the uncertainty aspect have also been identified as a shortcoming in existing models within the research [76].
- (c)
- The lack of a generally accepted standard for the storage of data on maritime accidents, i.e., ship collisions with the associated detailed information, represents an issue [77]. The first problem is manifested in the fact that different models for estimating the collision frequency use different methods for detecting collision candidates [14], and the accuracy of each of these methods cannot be assessed well enough due to the lack of a standard collision database (and all the relevant details) against which the results of the model and the corresponding methods of detection of collision candidates could be compared [15]. Another potential problem arises from a possible bias in the models for calculating causation probability because such models tend to rely heavily on expert knowledge in the absence of data.
- (d)
- Most of the existing AIS data-processing-based models for estimating collision frequencies are designed for a specific navigation area, which has its own specific characteristics, and their application to other geographical navigation areas can be difficult [5].
- (e)
- Furthermore, all models for calculating causation probabilities are closely related to individual geographical navigation areas, which have their own specific properties [77]. Causation probabilities borrowed from other geographical navigation areas are often used in ship collision frequency estimation models [19,28]. This can affect the accuracy of the results, as the causation probability of one navigation area may not accurately describe the traffic situation of another navigation area.
- (f)
- Many AIS data-processing-based models and simulation models for estimating ship collision frequency use their own original methods for detecting collision candidates, do not explicitly express an estimate of the number of actual collisions and do not propose their own causation probability. The validation of such models is hindered due to the fact that it is not possible to compare the results with the actual number of collisions based on statistical historical data [48,77]. Causation probability depends on the navigation area, but also on the model, i.e., the way collision candidates are detected, so it is often not possible to use already calculated existing causation probabilities from the literature [77].
- (g)
- With regard to the detection of collision candidates, most ship collision frequency estimation models analyze two ships (a pair of ships) in a dangerous situation without considering other ships that could potentially affect the encounter of these two ships [14].
- (h)
- According to the same source [14], most AIS data-processing-based models for estimating the ship collision frequency detect collision candidates by analyzing AIS data in time intervals, which may cause an error because the time between two iterations is “ignored”. The problem is particularly emphasized in the situation of a dangerous encounter between two ships, since the kinematic status of the ships changes significantly (due to the critical situation), i.e., the criteria parameters on the basis of which the collision candidate is detected change. It follows that there is a possibility that the model may fail to detect a collision candidate due to the “ignored” time. Additionally, the direct use of AIS data assesses the risk of the current traffic situation in a navigation area, but not of a possible future hypothetical situation (change in traffic volume and structure, change in rules and regulations, etc.).
- (i)
- Analytical models for estimating ship collision frequency treat ship passages on a route (i.e., departures of ships) as a stationary Poisson process, which is often not a realistic assumption [41]. Most of the time, the number of ships passing a route varies depending on the time of day, month, etc. For example, in the Strait of Istanbul, there is a significant difference in day and night traffic [70], but this is also true for many other navigation areas.
- (j)
- Bend collision scenarios have not been adequately addressed among existing analytical models [41], including the models used in IWRAP [19]. Random sailing direction collision scenarios are also inadequately analyzed (e.g., IWRAP makes approximations to address this scenario by using head-on and crossing collision scenario to simulate random sailing direction collision scenario).
3.2. Improvement Possibilities of Existing Models
Based on the shortcomings (items a–c) identified in Section 3.1, the following improvements and recommendations are suggested for each of the shortcomings in the development of future models:
- (a)
- When developing the model, it is necessary to define which scientific approach to risk analysis will be used; this can be carried out using the methodology presented in [29].
- (b)
- The uncertainty aspect needs to be included in the models used to calculate causation probability as it improves the accuracy of the causation probability itself. The research [88] suggests the use of the “Credal Network” concept for conducting probabilistic inference with an interval, thus including the aspect of uncertainty in the model for calculating the causation probability. The research concluded that the highest degree of uncertainty is the result of individual exact probability values in the Bayesian network determined based on the collected expert knowledge, and the paper proposes a solution by introducing probability intervals (instead of single probability values). Regarding the calculation of the causation probability, it is necessary to take into account the IMO guidelines for Human Reliability Analysis (HRA), which include the analysis using the generic tools “Technique for Human Error Rate Prediction (THERP)” and “Human Error Assessment and Reduction Technique (HEART)” [76].
- (c)
- The existence of standards for the storage of ship collision information, together with collision details relevant to the development and testing of models, may help to resolve this problem. The long-term existence of such a publicly available database for at least one significant geographical navigation area would allow testing and validation of all models using a common database. In this way, comparison of results from different models is valid, as differences in results could not be attributed to the data, and the accuracy of each model’s results is measured by comparison with recorded actual collisions and associated details.
- (d)
- It is desirable to develop simulation models for estimating ship collision frequency that can be readily adapted for use in different navigation areas. Examples of computer simulation models that can be used in different navigation areas without demanding modifications are presented in [39,41]. The popularity of analytical models for estimating ship collision frequency stems from their practicality and applicability in different geographical navigation areas.
- (e)
- Although practice has shown that the use of “borrowed” causation probabilities from other navigation areas produces results of satisfactory accuracy [17], it is recommended to use the causation probability of the navigation area for which the ship collision risk is assessed.
- (f)
- For the developed AIS data-processing-based models and simulation models that estimate collision frequency, it is necessary to calculate the corresponding causation probability if the method used by a model to detect collision candidates differs from existing collision detection methods for which a calculated causation probability exists. This is also highlighted in [77].
- (g)
- The focus should be on approaches that simultaneously consider situations in which multiple dangerous encounters occur without analyzing all pairs of ships separately [14]. In other words, it is necessary to include the influence of other surrounding ships on the possibility of a collision of a pair of ships in a hazardous situation. An example of such an approach can be found in [64].
- (h)
- Instead of analyzing the data in time intervals, it is desirable to develop an approach that considers the dangerous encounter of two ships as a “process” [15]. This approach can prevent an error that occurs due to a neglected time interval in a dangerous encounter between two ships. Hypothetical scenarios can be addressed using simulation models. Alternatively, an example of the methodology from the AIS data-processing-based model which can address hypothetical scenarios to some extent is described in [52].
- (i)
- Simulation models for ship collision frequency estimation can successfully overcome this shortcoming [76].
- (j)
- Models covering bend collisions should be developed [41], as well as models that address random sailing direction collisions. Simulation models represent a suitable solution to this issue.
4. Discussion
4.1. Discussion on Recent Related Literature Reviews
The models discussed in this review can be viewed as a subset of those discussed in [14,20,29]. A comparison is made in terms of content to the main concerns.
Compared to this review, the work in [14] covers a broader scope and different perspective of quantitative risk analysis for ship–ship collisions. Macroscopic models for obtaining waterway risk profiles, risk analysis models for improving situational awareness (OOW), models for real-time collision avoidance and operations and models and methods for causation probability are covered within the paper [14]. Review and analysis is conducted with a focus on the macroscopic perspective for maritime safety management and the various stakeholders and their preferences in risk analysis. Model features and properties are not considered within the classification presented in [14] (i.e., the classification is based solely on the methods and criteria used for the detection of collision candidates). Several models with unique properties can be found in the literature, and it is not always a straightforward task to categorize the model in terms of modeling properties and features (e.g., model [44]), as such information is often not provided in a straightforward and explicit manner. In contrast to the classification of models into three model class types presented in this review, the classification framework in [14] groups all models (relevant for this review) under a single terminology “Geometric collision probability analysis” and further classifies them as ship domain-based collision candidate identification, indicator-based collision candidate identification and mathematical models. Moreover, an additional category called “velocity-based approach” is proposed in [14] based on a single newly emerged method for detecting ship collision candidates. Several examples according to which the classification framework in [14] is inadequate for classifying the models discussed in this review are provided further in the text, e.g., the recent model [64] with its novel features does not fit into the class “velocity-based approach” or any other class, and according to [14], the model in [46] fits into two different categories: “mathematical models” and “indicator-based collision candidate identification”, which may lead to ambiguity. Note that in the “mathematical models” category, different collision candidate detection criteria may be implemented for different models (as shown in Table 1 in this review). In addition, models that use direct ship contour contact as a collision candidate detection criterion do not fit into the framework [14] (e.g., model [39,41,65]). Moreover, models such as those in [64,66,70] do not belong to any of the categories and classes in [14], since the classification framework from [14] strictly relies on the framework based on Equation (2).
A review of the models in the paper [20] is limited exclusively to models that introduce novel criteria for detecting collision candidates based on AIS data. Thus, the aforementioned criteria defined and expressed via models are the exclusive focus of this review, and it is necessary to emphasize that while they are a critical component of the models used to determine the ship collision frequency and probability on waterways (models covered in our review), they are not the only component because the models also consist of a number of other model steps and algorithms that affect model output and results. For example, the model described in [44] is an AIS data-processing-based model that is not included in [20] because it does not introduce novel collision candidate detection criteria, although the novelty of the other modelling steps is not questioned. Note that AIS-based collision candidate detection criteria, which are discussed in the review [20], have also emerged from other types of models related to ship collisions (e.g., real-time collision situations, see Table 1 in source [20]).
Paper [29] presents an overview and analysis of risk definitions, perspectives and scientific approaches to risk analysis found in the maritime transportation application domain, with a focus on applications that address the accident risk of shipping in a sea area. In other words, the paper examines how well-known and widely accepted scientific approaches to risk analysis are applied to maritime transportation, lists existing problems, and classifies the models accordingly. The review of the models within the paper is carried out solely in the context of the above, and the paper covers general accidental situations that may occur in a sea area (groundings, collisions, etc.).
4.2. General Remarks
This paper presents an overview of quantitative models for ship collision frequency estimation on waterways. Basic concepts used in ship collision frequency estimation models are explained, and the importance of their usage in maritime transport is highlighted. In this study, we reviewed and classified 29 different models using the extended classification framework based on the methodology [14]. A description of the main model characteristics of each model is presented. Disadvantages and improvement possibilities of existing models are highlighted as well.
In this study, it was found that most models for estimating the ship collision frequency are based on the concept of detecting collision candidates, the number of which should then be reduced to reflect the realistic expected number of collisions or correlated in some way with realistic accidents. The conventional approach performs the reduction using causation probability, i.e., the probability that the collision candidate will result in an actual collision. Other less conventional approaches often calculate collision candidates without providing a direct link to real collision statistics and use expert knowledge for validation purposes. Depending on the models, different ways of detecting collision candidates and calculating causation probabilities have been identified. AIS data-processing-based models combined with a safe boundary approach (in particular the ship domain concept) as a criterion for collision candidate detection have gained considerable popularity in the last decade. Additionally, the widespread use of analytical models is still present due to their robustness and ease of application to different waterways and navigation areas. For example, IWRAP analytical models have recently been used in several risk assessment studies [35,36,37], and COWI models [45] have been used for result validation within research [58]. Compared to the above-mentioned categories, simulation models are less used. Although AIS data-processing-based models might capture current spatio-temporal traffic patterns and situations more realistically and provide more accurate results for present situations compared to simulation and analytical models, they are not able to test hypothetical scenarios and provide answers to if-then analysis. Additional problems can arise when processing AIS data using excessively long intervals, as this can affect the detection of critical situations. Furthermore, AIS data-processing-based models are highly dependent on specific navigation areas, so their applicability in different navigation areas may be hindered. Simulation models can test hypothetical situations and are less dependent on navigation areas, but it is challenging to capture current spatio-temporal traffic patterns and situations realistically as with AIS data-processing-based models. The development of simulation models to test hypothetical scenarios is suggested in a recently published study [11]. Furthermore, analytical models cannot describe complex ship navigation scenarios and time-dependent navigation schedules accurately as other approaches, but due to the ease of application, multiple validation of their results and the associated causation probabilities, they represent a valuable contribution to the field and should continue to be developed in the future. Based on the research conducted, it can be stated, for example, that for bend collision scenario and random sailing direction collision scenario, there is no suitable analytical model that adequately addresses them, and thus a simulation model is imposed as a possible solution. The possibility of developing analytical models using appropriate simulation models and regression analysis should also be considered. Such simulation models require the flexibility of model input parameters and multiple simulations to develop an analytical model using regression analysis (AIS data-processing-based models lack the ability to simulate hypothetical scenarios and are therefore not suitable for this purpose).
One of the biggest challenges when calculating causation probability is the evaluation of human and organizational factors that make the largest contribution to the probability of a collision. According to one recent study, the total percentage of all maritime accidents attributable to human error is 75% [89], and it was found that human error contributes to 89–96% of collisions [90]. The omission of the aspect of uncertainty represents an issue as well. Furthermore, many models use different criteria and methods to determine collision candidates without proposing their own causation probability for calculating the actual expected number of collisions (causation probability depends on the navigation area and collision candidate method of detection [77]). For example, as shown in Table 1, most AIS data-processing-based models use existing borrowed causation probability values without any calibration, and these values may not match the probability of ship collision because a new criterion (e.g., different ship domains) is used to determine a collision candidate. Although some authors argue that model validation by comparing the results with real accident statistics can be neglected due to the extremely low frequency of real ship collisions, several studies show that this approach is feasible in many cases [11,52] (see other models marked with an asterisk in Table 1). Due to the high complexity of encounter situations and influencing factors leading to collisions, a large number of different criteria for collision candidate detection exist in the literature, and a general best criterion has not been found yet [15]. Possible solutions that would find consensus among scientists regarding the criteria for collision candidate detection could emerge from non-conventional approaches involving new technologies such as artificial intelligence, data analytics, big data, etc. (see Table 1). Confirmation of the potential of these technologies is also evident from recent studies [64,91,92]. For example, study [91] presented a big data analytics method for ship–ship collision risk using nowcast data and AIS data, which provided insight into ship collision avoidance behavior under real operational conditions and dangerous navigation locations. In [92], a similar analysis was performed with respect to grounding avoidance behavior in the Gulf of Finland.
5. Conclusions
In this paper, a subset of models from the field of ship collision risk assessment has been reviewed. In particular, the scope of this work is limited to models that refer to macroscopic perspective of ship collision frequency and probability estimations on waterways. The models are reviewed from the perspective of analyzing the affiliation of the models to different classes with respect to modelling features and properties, collision candidate detection method, model ability to reflect reality through comparison with actual collisions and causation probability used. The 29 models are analyzed in depth with respect to the above perspective, a description of the basic modeling steps of each model is given, and they are grouped within the proposed classification framework that can also be used for future models. Based on the analyzed literature and our own considerations, a detailed summary of the identified shortcomings is given, as well as possible improvements and recommendations for the development of future models. Based on the research conducted, we draw several conclusions. AIS data-processing-based models are gaining popularity, as well as risk assessment based on estimating the frequency of collision candidates that do not necessarily lead to a collision, but represent a dangerous situation and therefore require attention. There is no scientific consensus on the definition of the criteria for determining a collision candidate, nor is there any perceived advantage of one method over another in determining the collision candidate. The above statement also applies to other modeling features and properties that make up a model. This poses a problem for all models that calculate collision candidates without comparison to actual collisions, which affects their validation and increases uncertainty. Approximately half of all reviewed models do not make a direct comparison with actual collisions. The problem is particularly pronounced in the category “Non-conventional approaches and approaches emerged from robotics and artificial intelligence”, as most models in this class do not perform a direct comparison with actual collisions or use causation probabilities. As shown in the discussion, each type of model has advantages and disadvantages. AIS data-processing-based models are suitable for determining the current risk on the waterway, simulation models are suitable for considering hypothetical and future scenarios, while analytical models are robust and can be used in different navigation areas without major adjustments. These models complement each other and should be further developed on an equal footing.
Given the expected increase in maritime traffic in the future and the use of new technologies that will undoubtedly affect the current way of ship navigation, further research in the field of ship collision risk assessment can be considered imperative.
Author Contributions
Conceptualization, M.Č., S.M., A.G. and Z.L.; methodology, M.Č., S.M. and Z.L.; formal analysis, M.Č., S.M., A.G. and Z.L.; investigation, M.Č., S.M., A.G. and Z.L.; resources, M.Č., A.G. and Z.L.; writing—original draft preparation, M.Č. and Z.L; writing—review and editing, S.M. and A.G.; visualization, M.Č., S.M. and A.G. All authors have read and agreed to the published version of the manuscript.
Funding
This research received no external funding.
Institutional Review Board Statement
Not applicable.
Informed Consent Statement
Not applicable.
Conflicts of Interest
The authors declare no conflict of interest.
References
- Eleftheria, E.; Apostolos, P.; Markos, V. Statistical analysis of ship accidents and review of safety level. Saf. Sci. 2016, 85, 282–292. [Google Scholar] [CrossRef]
- 3174 Maritime Casualties and Incidents Reported in 2019. Available online: https://safety4sea.com/23073-maritime-casualties-and-incidents-reported-in-2019/ (accessed on 19 October 2020).
- Annual Overview of Marine Casualties and Incidents 2017. Available online: http://www.emsa.europa.eu/newsroom/latest-news/item/3156-annual-overview-of-marine-casualties-and-incidents-2017.html (accessed on 19 October 2020).
- Soares, C.G.; Teixeira, A.P. Risk assessment in maritime transportation. Reliab. Eng. Syst. Saf. 2001, 74, 299–309. [Google Scholar] [CrossRef]
- Ozbas, B. Safety Risk Analysis of Maritime Transportation Review of the Literature. Transp. Res. Rec. 2013, 2326, 32–38. [Google Scholar] [CrossRef]
- Vinnem, J.-E. Offshore Risk Assessment vol 2: Principles, Modelling and Applications of QRA Studies, 3rd ed.; Springer: London, UK, 2014; p. 513. ISBN 978-1-4471-5212-5. [Google Scholar] [CrossRef]
- Kristiansen, S. Maritime Transportation: Safety Management and Risk Analysis, 1st ed.; Elsevier Butterworth-Heinemann: Oxford, UK, 2005; pp. 133–171. [Google Scholar]
- IMO. Guidelines for Formal Safety Assessment (Fsa) for Use in the Imo Rule-Making Process. 2002. Available online: http://www.safedor.org/resources/1023-MEPC392.pdf (accessed on 27 October 2020).
- Kontovas, C.A.; Psaraftis, H.N. Formal safety assessment: A critical review. Mar. Technol. SNAME News 2009, 46, 45–59. [Google Scholar] [CrossRef]
- Wang, G.; Ji, C.; Kuhala, P.; Lee, S.-G.; Marino, A.; Sirkar, J.; Suzuki, K.; Pedersen, P.T.; Vredevelt, A.W.; Yuriy, V. Collison and Grounding. In Proceedings of the 16th International Ship and Offshore Structures Congress, Southampton, UK, 20–25 August 2006; p. 57. [Google Scholar]
- Chai, T.; Weng, J.; De-qi, X. Development of a quantitative risk assessment model for ship collisions in fairways. Saf. Sci. 2017, 91, 71–83. [Google Scholar] [CrossRef]
- Pedersen, P.T. Review and application of ship collision and grounding analysis procedures. Mar. Struct. 2010, 23, 241–262. [Google Scholar] [CrossRef]
- Lušić, Z. Assessment of number of ship collisions in waterways crossing situations. NAŠE MORE 2005, 52, 185–194. [Google Scholar]
- Chen, P.; Huang, Y.; Mou, J.; van Gelder, P.H.A.J.M. Probabilistic risk analysis for ship-ship collision: State-of-the-art. Saf. Sci. 2019, 117, 108–122. [Google Scholar] [CrossRef]
- Chen, P.; Huang, Y.; Mou, J.; van Gelder, P.H.A.J.M. Ship collision candidate detection method: A velocity obstacle approach. Ocean Eng. 2018, 170, 186–198. [Google Scholar] [CrossRef]
- Fujii, Y.; Shiobara, R. The Analysis of Traffic Accidents. J. Navig. 1971, 24, 534–543. [Google Scholar] [CrossRef]
- Macduff, T. Probability of Vessel Collisions. Ocean Ind. 1974, 9, 144–148. [Google Scholar]
- Chen, P.; Mou, J.; van Gelder, P.H. Risk assessment methods for ship collision in estuarine waters using ais and historical accident data. In Proceedings of the 17th International Congress of the International Maritime Association of the mediterranean, IMAM 2017, Lisbon, Portugal, 9–11 October 2017; pp. 213–221. [Google Scholar]
- Ylitalo, J. Modelling Marine Accident Frequency. Master’s Thesis, Aalto University, Espoo, Finland, 2 February 2010. [Google Scholar]
- Du, L.; Goerlandt, F.; Kujala, P. Review and analysis of methods for assessing maritime waterway risk based on non-accident critical events detected from AIS data. Reliab. Eng. Syst. Saf. 2020, 200. [Google Scholar] [CrossRef]
- Zhang, G.; Thai, V.V. Expert elicitation and Bayesian Network modeling for shipping accidents: A literature review. Saf. Sci. 2016, 87, 53–62. [Google Scholar] [CrossRef]
- Szłapczyński, R.; Niksa-Rynkiewicz, T. A Framework of A Ship Domain-Based Near-Miss Detection Method Using Mamdani Neuro-Fuzzy Classification. Polish Marit. Res. 2018, 25, 14–21. [Google Scholar] [CrossRef] [Green Version]
- Lei, P.R.; Tsai, T.H.; Wen, Y.T.; Peng, W.C. A framework for discovering maritime traffic conflict from AIS network. In Proceedings of the 19th Asia-Pacific Network Operations and Management Symposium: Managing a World of Things, APNOMS 2017, Seul, Korea, 27–29 September 2017; pp. 1–6. [Google Scholar]
- Weng, J.; Xue, S. Ship collision frequency estimation in port fairways: A case study. J. Navig. 2015, 68, 602–618. [Google Scholar] [CrossRef] [Green Version]
- Martins, M.R.; Maturana, M.C. Human error contribution in collision and grounding of oil tankers. Risk Anal. 2010, 30, 674–698. [Google Scholar] [CrossRef] [PubMed]
- Ren, J.; Jenkinson, I.; Wang, J.; Xu, D.L.; Yang, J.B. A methodology to model causal relationships on offshore safety assessment focusing on human and organizational factors. J. Safety Res. 2008, 39, 87–100. [Google Scholar] [CrossRef]
- Chauvin, C.; Lardjane, S.; Morel, G.; Clostermann, J.P.; Langard, B. Human and organisational factors in maritime accidents: Analysis of collisions at sea using the HFACS. Accid. Anal. Prev. 2013, 59, 26–37. [Google Scholar] [CrossRef] [PubMed]
- Friis-Hansen, P. Iwrap Mk Ii Working Document Basic Modelling Principles for Prediction of Collision and Grounding Frequencies. 2007. Available online: https://www.iala-aism.org/wiki/iwrap/images/2/2b/IWRAP_Theory.pdf (accessed on 15 November 2020).
- Goerlandt, F.; Montewka, J. Maritime transportation risk analysis: Review and analysis in light of some foundational issues. Reliab. Eng. Syst. Saf. 2015, 138, 115–134. [Google Scholar] [CrossRef]
- Shrader-Frechette, K. Risk and Rationality: Philosophical Foundations for Populist Reforms; University of California Press: Berkeley, CA, USA, 1992; Volume 29. [Google Scholar] [CrossRef]
- Bradbury, J.A. The Policy Implications of Differing Concepts of Risk. Sci. Technol. Human Values 1989, 14, 380–399. [Google Scholar] [CrossRef]
- Rosa, E.A. Metatheoretical foundations for post-normal risk. J. Risk Res. 1998, 1, 15–44. [Google Scholar] [CrossRef]
- IALA. Risk Management—Pawsa, Iwrap Mk2 & Simulation. 2010. Available online: https://www.iala-aism.org/product/risk-management-pawsa-iwrap-mk2-simulation/ (accessed on 22 November 2020).
- Kim, I.; Lee, H.; Lee, D. Development of a new tool for objective risk assessment and comparative analysis at coastal waters. J. Int. Marit. Safety Environ. Aff. Shipp. 2019, 2, 58–66. [Google Scholar] [CrossRef] [Green Version]
- Cucinotta, F.; Guglielmino, E.; Sfravara, F. Frequency of Ship Collisions in the Strait of Messina through Regulatory and Environmental Constraints Assessment. J. Navig. 2017, 70, 1002–1022. [Google Scholar] [CrossRef]
- Yoo, Y.; Kim, T.G. An improved ship collision risk evaluation method for Korea Maritime Safety Audit considering traffic flow characteristics. J. Mar. Sci. Eng. 2019, 7, 448. [Google Scholar] [CrossRef] [Green Version]
- Burmeister, H.-C.; Walther, L.; Jahn, C.; Toter, S.; Froese, J. Assessing the Frequency and Material Consequences of Collisions with Vessels Lying at an Anchorage in Line with IALA iWrap MkII. TransNav Int. J. Mar. Navig. Saf. Sea Transp. 2014, 8, 61–68. [Google Scholar] [CrossRef]
- Eriksson, O.F. Iwrap Mk2 Introduction Iala Waterway Risk Assessment Programme. 2018. Available online: https://portal.helcom.fi/meetings/OPENRISK%20WS%203-2018-527/MeetingDocuments/Presentaton%206.pdf (accessed on 23 November 2020).
- Lušić, Z.; Čorić, M. Models for estimating the potential number of ship collisions. J. Navig. 2015, 68, 735–749. [Google Scholar] [CrossRef] [Green Version]
- Pedersen, P. Collision and grounding mechanics. Danish Soc. Nav. Archit. Mar. Eng. 1995, 125–157. [Google Scholar]
- Goerlandt, F.; Kujala, P. Modeling of ship collision probability using dynamic traffic simulation. In Proceedings of the European Safety & Reliability Conference, ESREL 2010, Rhodes, Greece, 5–9 September 2010; pp. 440–447. [Google Scholar]
- Kujala, P.; Hänninen, M.; Arola, T.; Ylitalo, J. Analysis of the marine traffic safety in the Gulf of Finland. Reliab. Eng. Syst. Saf. 2009, 94, 1349–1357. [Google Scholar] [CrossRef]
- Otto, S.; Pedersen, P.T.; Samuelides, M.; Sames, P.C. Elements of risk analysis for collision and grounding of a RoRo passenger ferry. Mar. Struct. 2002, 15, 461–474. [Google Scholar] [CrossRef]
- Silveira, P.A.M.; Teixeira, A.P.; Soares, C.G. Use of AIS data to characterise marine traffic patterns and ship collision risk off the coast of Portugal. J. Navig. 2013, 66, 879–898. [Google Scholar] [CrossRef] [Green Version]
- COWI. Risk Analysis of Sea Traffic in the Area around Bornholm, 2008—VTT. 2008. Available online: https://www.yumpu.com/en/document/read/35601367/risk-analysis-of-sea-traffic-in-the-area-around-bornholm-2008-vtt (accessed on 28 November 2020).
- Fowler, T.G.; Sørgård, E. Modeling ship transportation risk. Risk Anal. 2000, 20. [Google Scholar] [CrossRef]
- Kaneko, F. Methods for probabilistic safety assessments of ships. J. Mar. Sci. Technol. 2002, 7, 1–16. [Google Scholar] [CrossRef]
- Montewka, J.; Hinz, T.; Kujala, P.; Matusiak, J. Probability modelling of vessel collisions. Reliab. Eng. Syst. Saf. 2010, 95, 573–589. [Google Scholar] [CrossRef]
- Curtis, R.G. A ship collision model for overtaking. J. Oper. Res. Soc. 1986, 37, 397–406. [Google Scholar] [CrossRef]
- Endoh, S. Aircraft Collision Models. Ph.D. Thesis, Massachusetts Institute of Technology, Cambridge, MA, USA, 1987. [Google Scholar]
- Gil, M.; Montewka, J.; Krata, P.; Hinz, T.; Hirdaris, S. Determination of the dynamic critical maneuvering area in an encounter between two vessels: Operation with negligible environmental disruption. Ocean Eng. 2020, 213, 107709. [Google Scholar] [CrossRef]
- Rawson, A.; Brito, M. A critique of the use of domain analysis for spatial collision risk assessment. Ocean Eng. 2021, 219. [Google Scholar] [CrossRef]
- Wang, N. An intelligent spatial collision risk based on the quaternion ship domain. J. Navig. 2010, 63, 733–749. [Google Scholar] [CrossRef]
- Weng, J.; Liao, S.; Wu, B.; Yang, D. Exploring effects of ship traffic characteristics and environmental conditions on ship collision frequency. Marit. Policy Manag. 2020, 47, 523–543. [Google Scholar] [CrossRef]
- Fujii, Y.; Tanaka, K. Traffic capacity. J. Navig. 1971, 24, 543–552. [Google Scholar] [CrossRef]
- Van Westrenen, F.; Ellerbroek, J. The Effect of Traffic Complexity on the Development of Near Misses on the North Sea. IEEE Trans. Syst. Man Cybern. Syst. 2017, 47, 432–440. [Google Scholar] [CrossRef] [Green Version]
- Van Iperen, E. Classifying Ship Encounters to Monitor Traffic Safety on the North Sea from AIS Data. TransNav Int. J. Mar. Navig. Saf. Sea Transp. 2015, 9, 51–58. [Google Scholar] [CrossRef] [Green Version]
- Zhang, W.; Goerlandt, F.; Montewka, J.; Kujala, P. A method for detecting possible near miss ship collisions from AIS data. Ocean Eng. 2015, 107, 60–69. [Google Scholar] [CrossRef]
- Cowi Risks of Oil and Chemical Pollution in the Baltic Sea Results and Recommendations from Helcom’s Brisk and Brisk-Ru Projects Nordic Council of Ministers. 2012. Available online: https://helcom.fi/media/publications/BRISK-BRISK-RU_SummaryPublication_spill_of_oil.pdf (accessed on 17 January 2021).
- Wu, X.; Mehta, A.L.; Zaloom, V.A.; Craig, B.N. Analysis of waterway transportation in Southeast Texas waterway based on AIS data. Ocean Eng. 2016, 121, 196–209. [Google Scholar] [CrossRef]
- Weng, J.; Meng, Q.; Qu, X. Vessel collision frequency estimation in the Singapore Strait. J. Navig. 2012, 65, 207–221. [Google Scholar] [CrossRef] [Green Version]
- Weng, J.; Meng, Q.; Li, S. Quantitative Risk Assessment Model for Ship Collisions in the Singapore Strait. In Proceedings of the 93rd Annual Meeting of Transportation Research Board, Washington, DC, USA, 12–16 January 2014; p. 16. [Google Scholar]
- Chen, P.; Huang, Y.; Papadimitriou, E.; Mou, J.; van Gelder, P.H.A.J.M. An improved time discretized non-linear velocity obstacle method for multi-ship encounter detection. Ocean Eng. 2020, 196. [Google Scholar] [CrossRef]
- Zhang, W.; Feng, X.; Goerlandt, F.; Liu, Q. Towards a Convolutional Neural Network model for classifying regional ship collision risk levels for waterway risk analysis. Reliab. Eng. Syst. Saf. 2020, 204. [Google Scholar] [CrossRef]
- Goerlandt, F.; Kujala, P. Traffic simulation based ship collision probability modeling. Reliab. Eng. Syst. Saf. 2011, 96. [Google Scholar] [CrossRef]
- Faghih-Roohi, S.; Xie, M.; Ng, K.M. Accident risk assessment in marine transportation via Markov modelling and Markov Chain Monte Carlo simulation. Ocean Eng. 2014, 91, 363–370. [Google Scholar] [CrossRef]
- Van Dorp, J.R.; Merrick, J.R.W.; Harrald, J.R.; Mazzuchi, T.A.; Grabowski, M. A risk management procedure for the Washington state ferries. Risk Anal. 2001, 21, 127–142. [Google Scholar] [CrossRef] [PubMed]
- Vujičić, S.; Mohović, Đ.; Mohović, R. A Model of Determining the Closest Point of Approach Between Ships on the Open Sea. Promet Traffic Transp. 2017, 29, 225–232. [Google Scholar] [CrossRef]
- Merrick, J.R.W.; Van Dorp, J.R.; Blackford, J.P.; Shaw, G.L.; Harrald, J.; Mazzuchi, T.A. A traffic density analysis of proposed ferry service expansion in San Francisco bay using a maritime simulation model. Reliab. Eng. Syst. Saf. 2003, 81, 119–132. [Google Scholar] [CrossRef]
- Ulusçu, Ö.S.; Özbaş, B.; Altiok, T.; Or, I. Risk analysis of the vessel traffic in the strait of Istanbul. Risk Anal. 2009, 29, 1454–1472. [Google Scholar] [CrossRef] [PubMed]
- Qu, X.; Meng, Q. Development and applications of a simulation model for vessels in the Singapore Straits. Expert Syst. Appl. 2012, 39, 8430–8438. [Google Scholar] [CrossRef] [Green Version]
- Rong, H.; Teixeira, A.; Soares, C. Evaluation of near-collisions in the Tagus River Estuary using a marine traffic simulation model. Zesz. Nauk. Akad. Mor. Szczec. 2015, 43, 68–78. [Google Scholar]
- Rong, H.; Teixeira, A.P.; Soares, C.G. Simulation and analysis of maritime traffic in the tagus river estuary using AIS data. In Proceedings of the Maritime Technology and Engineering—Proceedings of MARTECH 2014: 2nd International Conference on Maritime Technology and Engineering, Lisbon, Portugal, 15–17 October 2014; pp. 185–195. [Google Scholar]
- Goerlandt, F.; Kujala, P. On the reliability and validity of ship–ship collision risk analysis in light of different perspectives on risk. Saf. Sci. 2014, 62, 348–365. [Google Scholar] [CrossRef]
- Mazaheri, A.; Montewka, J.; Kujala, P. Modeling the risk of ship grounding—a literature review from a risk management perspective. WMU J. Marit. Affairs 2014, 13, 269–297. [Google Scholar] [CrossRef]
- Li, S.; Meng, Q.; Qu, X. An Overview of Maritime Waterway Quantitative Risk Assessment Models. Risk Anal. 2012, 32, 496–512. [Google Scholar] [CrossRef] [Green Version]
- Weintrit, A.; Neumann, T.; Montewka, J.; Goerlandt, F.; Lammi, H.; Kujala, P. A Method for Assessing a Causation Factor for a Geometrical MDTC Model for Ship-Ship Collision Probability Estimation. Methods Algorithms Navig. 2011, 5, 365–373. [Google Scholar] [CrossRef]
- IMO. Revised Guidelines for Formal Safety Assessment (Fsa) for Use in the Imo Rule-Making Process. 2018. Available online: https://wwwcdn.imo.org/localresources/en/OurWork/HumanElement/Documents/MSC-MEPC.2-Circ.12-Rev.2%20-%20Revised%20Guidelines%20For%20Formal%20Safety%20Assessment%20(Fsa)For%20Use%20In%20The%20Imo%20Rule-Making%20Proces...%20(Secretariat).pdf (accessed on 2 March 2021).
- Uğurlu, Ö.; Köse, E.; Yıldırım, U.; Yüksekyıldız, E. Marine accident analysis for collision and grounding in oil tanker using FTA method. Marit. Policy Manag. 2015, 42, 163–185. [Google Scholar] [CrossRef]
- Antão, P.; Guedes Soares, C. Fault-tree models of accident scenarios of RoPax vessels. Int. J. Autom. Comput. 2006, 3, 107–116. [Google Scholar] [CrossRef]
- Langseth, H.; Portinale, L. Bayesian networks in reliability. Reliab. Eng. Syst. Saf. 2007, 92, 92–108. [Google Scholar] [CrossRef] [Green Version]
- Hänninen, M.; Kujala, P. Influences of variables on ship collision probability in a Bayesian belief network model. Reliab. Eng. Syst. Saf. 2012, 102, 27–40. [Google Scholar] [CrossRef]
- Montewka, J.; Ehlers, S.; Goerlandt, F.; Hinz, T.; Tabri, K.; Kujala, P. A framework for risk assessment for maritime transportation systems—A case study for open sea collisions involving RoPax vessels. Reliab. Eng. Syst. Saf. 2014, 124, 142–157. [Google Scholar] [CrossRef]
- Martins, M.R.; Maturana, M.C. Application of Bayesian Belief networks to the human reliability analysis of an oil tanker operation focusing on collision accidents. Reliab. Eng. Syst. Saf. 2013, 110, 89–109. [Google Scholar] [CrossRef]
- Trucco, P.; Cagno, E.; Ruggeri, F.; Grande, O. A Bayesian Belief Network modelling of organisational factors in risk analysis: A case study in maritime transportation. Reliab. Eng. Syst. Saf. 2008, 93, 845–856. [Google Scholar] [CrossRef]
- Khaled, M.E.; Kawamura, Y. Application of Bayesian Belief Network to Estimate Causation Probability of Collision at Chittagong Port by Analyzing Accident Database of Bangladesh. In Proceedings of the Japan Society of Navala Architects and Ocean Engineers, Nagasaki, Japan, 20–21 November 2014; pp. 133–136. [Google Scholar]
- Kaplan, S. The words of risk analysis. Risk Anal. 1997, 17, 407–417. [Google Scholar] [CrossRef]
- Zhang, G.; Thai, V.V.; Yuen, K.F.; Loh, H.S.; Zhou, Q. Addressing the epistemic uncertainty in maritime accidents modelling using Bayesian network with interval probabilities. Saf. Sci. 2018, 102, 211–225. [Google Scholar] [CrossRef]
- Sánchez-Beaskoetxea, J.; Basterretxea-Iribar, I.; Sotés, I.; Machado, M.D.L.M.M. Human error in marine accidents: Is the crew normally to blame? Marit. Transp. Res. 2021, 2, 100016. [Google Scholar] [CrossRef]
- Hanzu-Pazara, R.; Barsan, E.; Arsenie, P.; Chiotoroiu, L.; Raicu, G. Reducing of maritime accidents caused by human factors using simulators in training process. J. Marit. Res. 2008, 5, 3–18. [Google Scholar]
- Zhang, M.; Montewka, J.; Manderbacka, T.; Kujala, P.; Hirdaris, S. A Big Data Analytics Method for Evaluation of Ship-Ship Collision Risk Reflecting Hydrometeorological Conditions. Reliab. Eng. Syst. Saf. 2021, 213, 107674. [Google Scholar] [CrossRef]
- Zhang, M.; Montewka, J.; Manderbacka, T.; Kujala, P.; Hirdaris, S. Analysis of the Grounding Avoidance Behavior of a Ro-Pax Ship in the Gulf of Finland using Big Data. In Proceedings of the 30th International Ocean and Polar Engineering Conference, Shanghai, China, 11–16 October 2020; pp. 3558–3559. [Google Scholar]
Figure 1.
Head-on and overtaking collision scenario (reproduced from [39], with permission from Cambridge University Press, 2015).
Figure 1.
Head-on and overtaking collision scenario (reproduced from [39], with permission from Cambridge University Press, 2015).

Figure 2.
Crossing collision scenario (reproduced from [39], with permission from Cambridge University Press, 2015).
Figure 2.
Crossing collision scenario (reproduced from [39], with permission from Cambridge University Press, 2015).

Figure 3.
Ship represented by a point in the middle of the circle and collision definition (reproduced from [48], with permission from Elsevier, 2010).
Figure 3.
Ship represented by a point in the middle of the circle and collision definition (reproduced from [48], with permission from Elsevier, 2010).

Figure 4.
Convolutional Neural Network-based ship collision risk analysis model (reproduced from [64], with permission from Elsevier, 2020).
Figure 4.
Convolutional Neural Network-based ship collision risk analysis model (reproduced from [64], with permission from Elsevier, 2020).

Figure 5.
Collision detection algorithm (reproduced from [41,65], with permission from Interaction Design Foundation, 2010, and Elsevier, 2011).

Figure 6.
Simulation of ship length and width (reproduced from [39], with permission from Cambridge University Press, 2015).
Figure 6.
Simulation of ship length and width (reproduced from [39], with permission from Cambridge University Press, 2015).

Figure 7.
Markov accident model (reproduced from [66], with permission from Elsevier, 2014).
Figure 7.
Markov accident model (reproduced from [66], with permission from Elsevier, 2014).

Figure 8.
Quantitative ship collision frequency estimation models developed from 1995 until 2021.

Figure 9.
Simplified example of the Bayesian network for ship collision risk assessment (reproduced from [82], with permission from Elsevier, 2012).
Figure 9.
Simplified example of the Bayesian network for ship collision risk assessment (reproduced from [82], with permission from Elsevier, 2012).


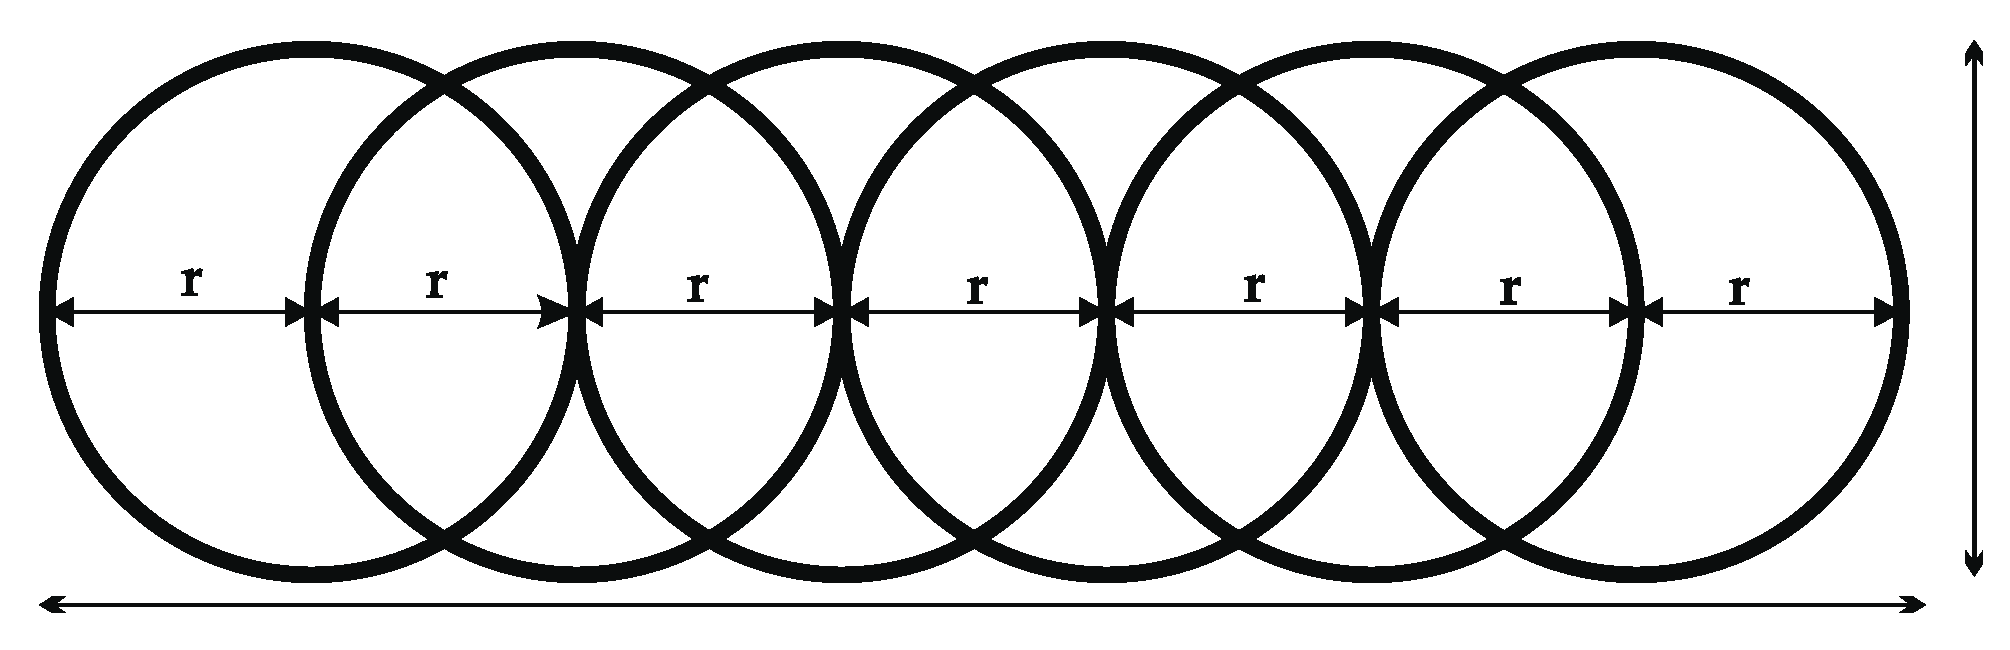
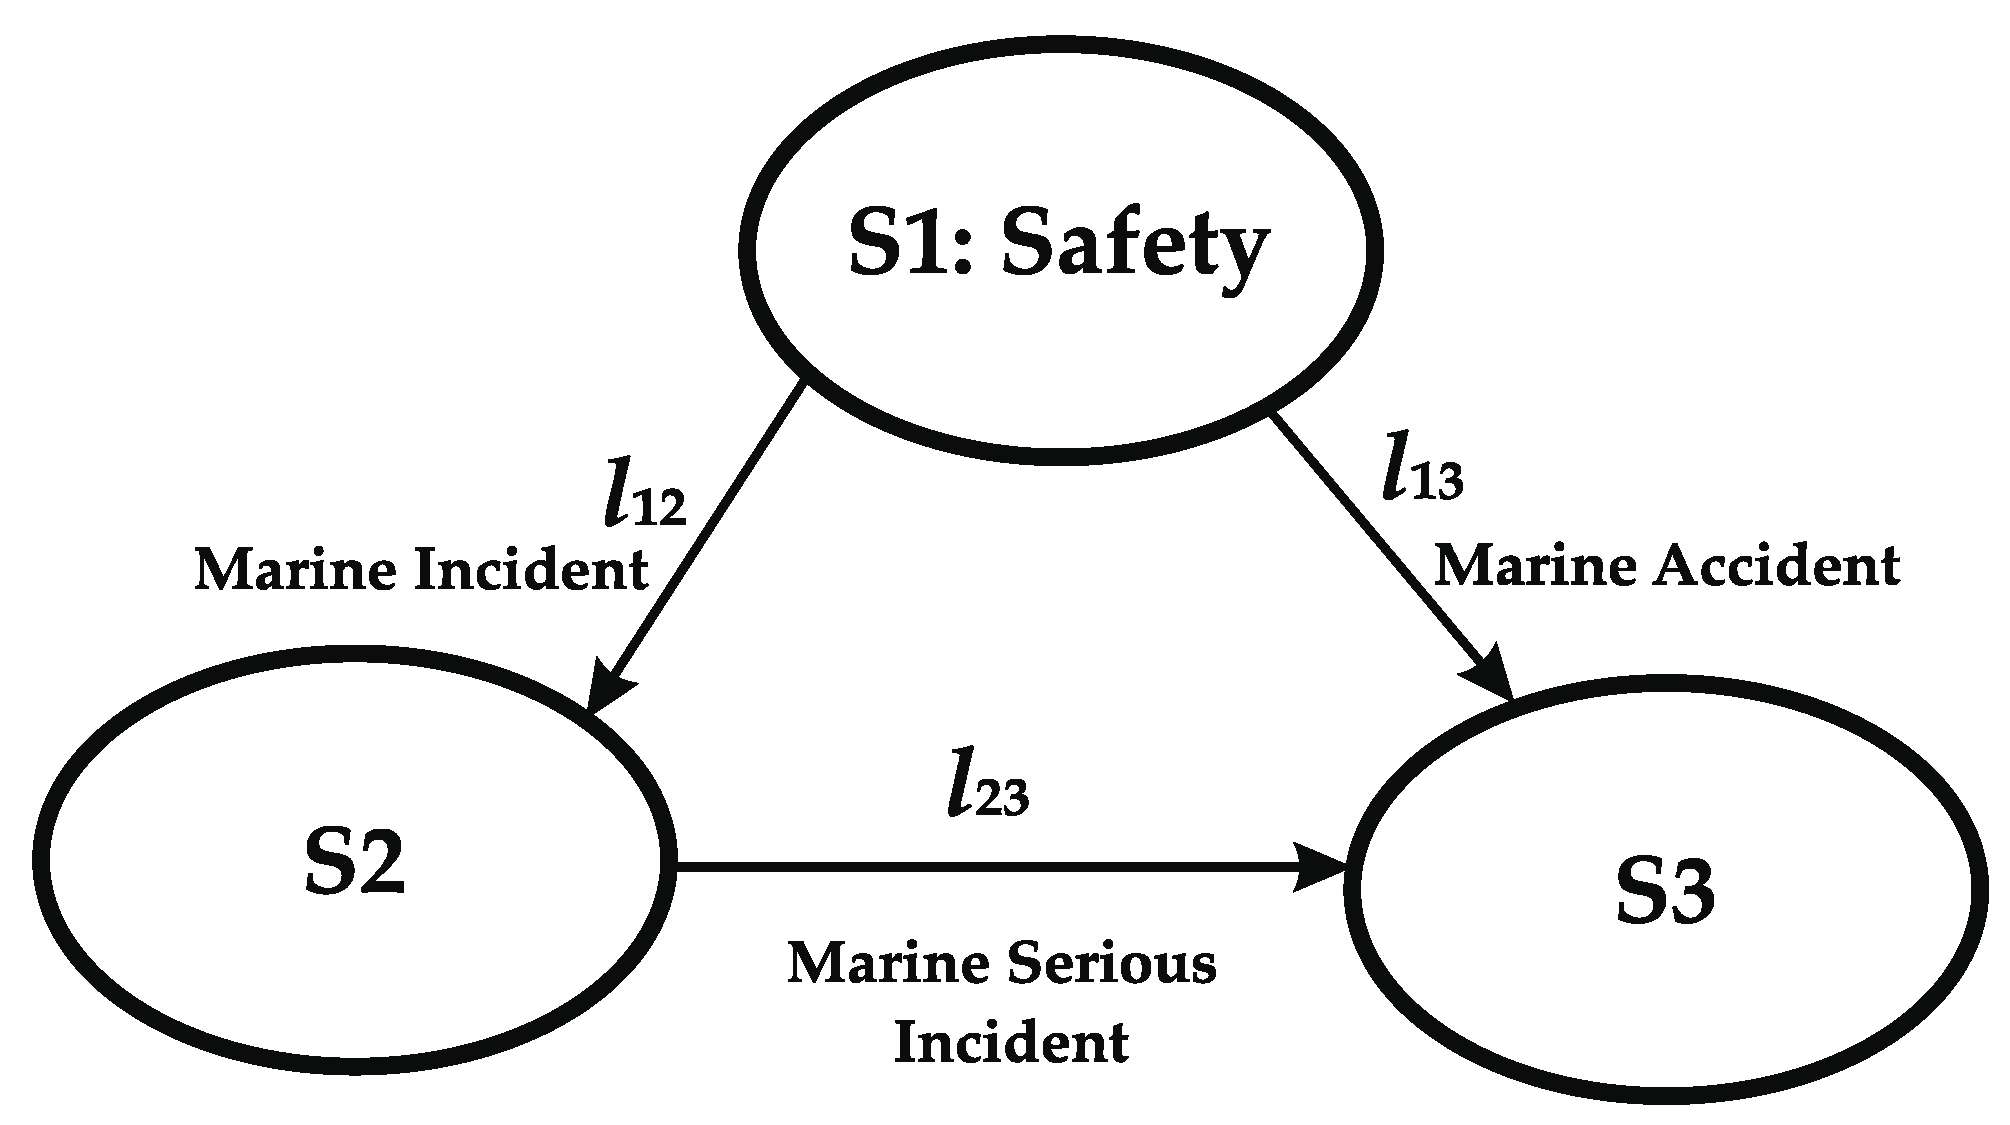
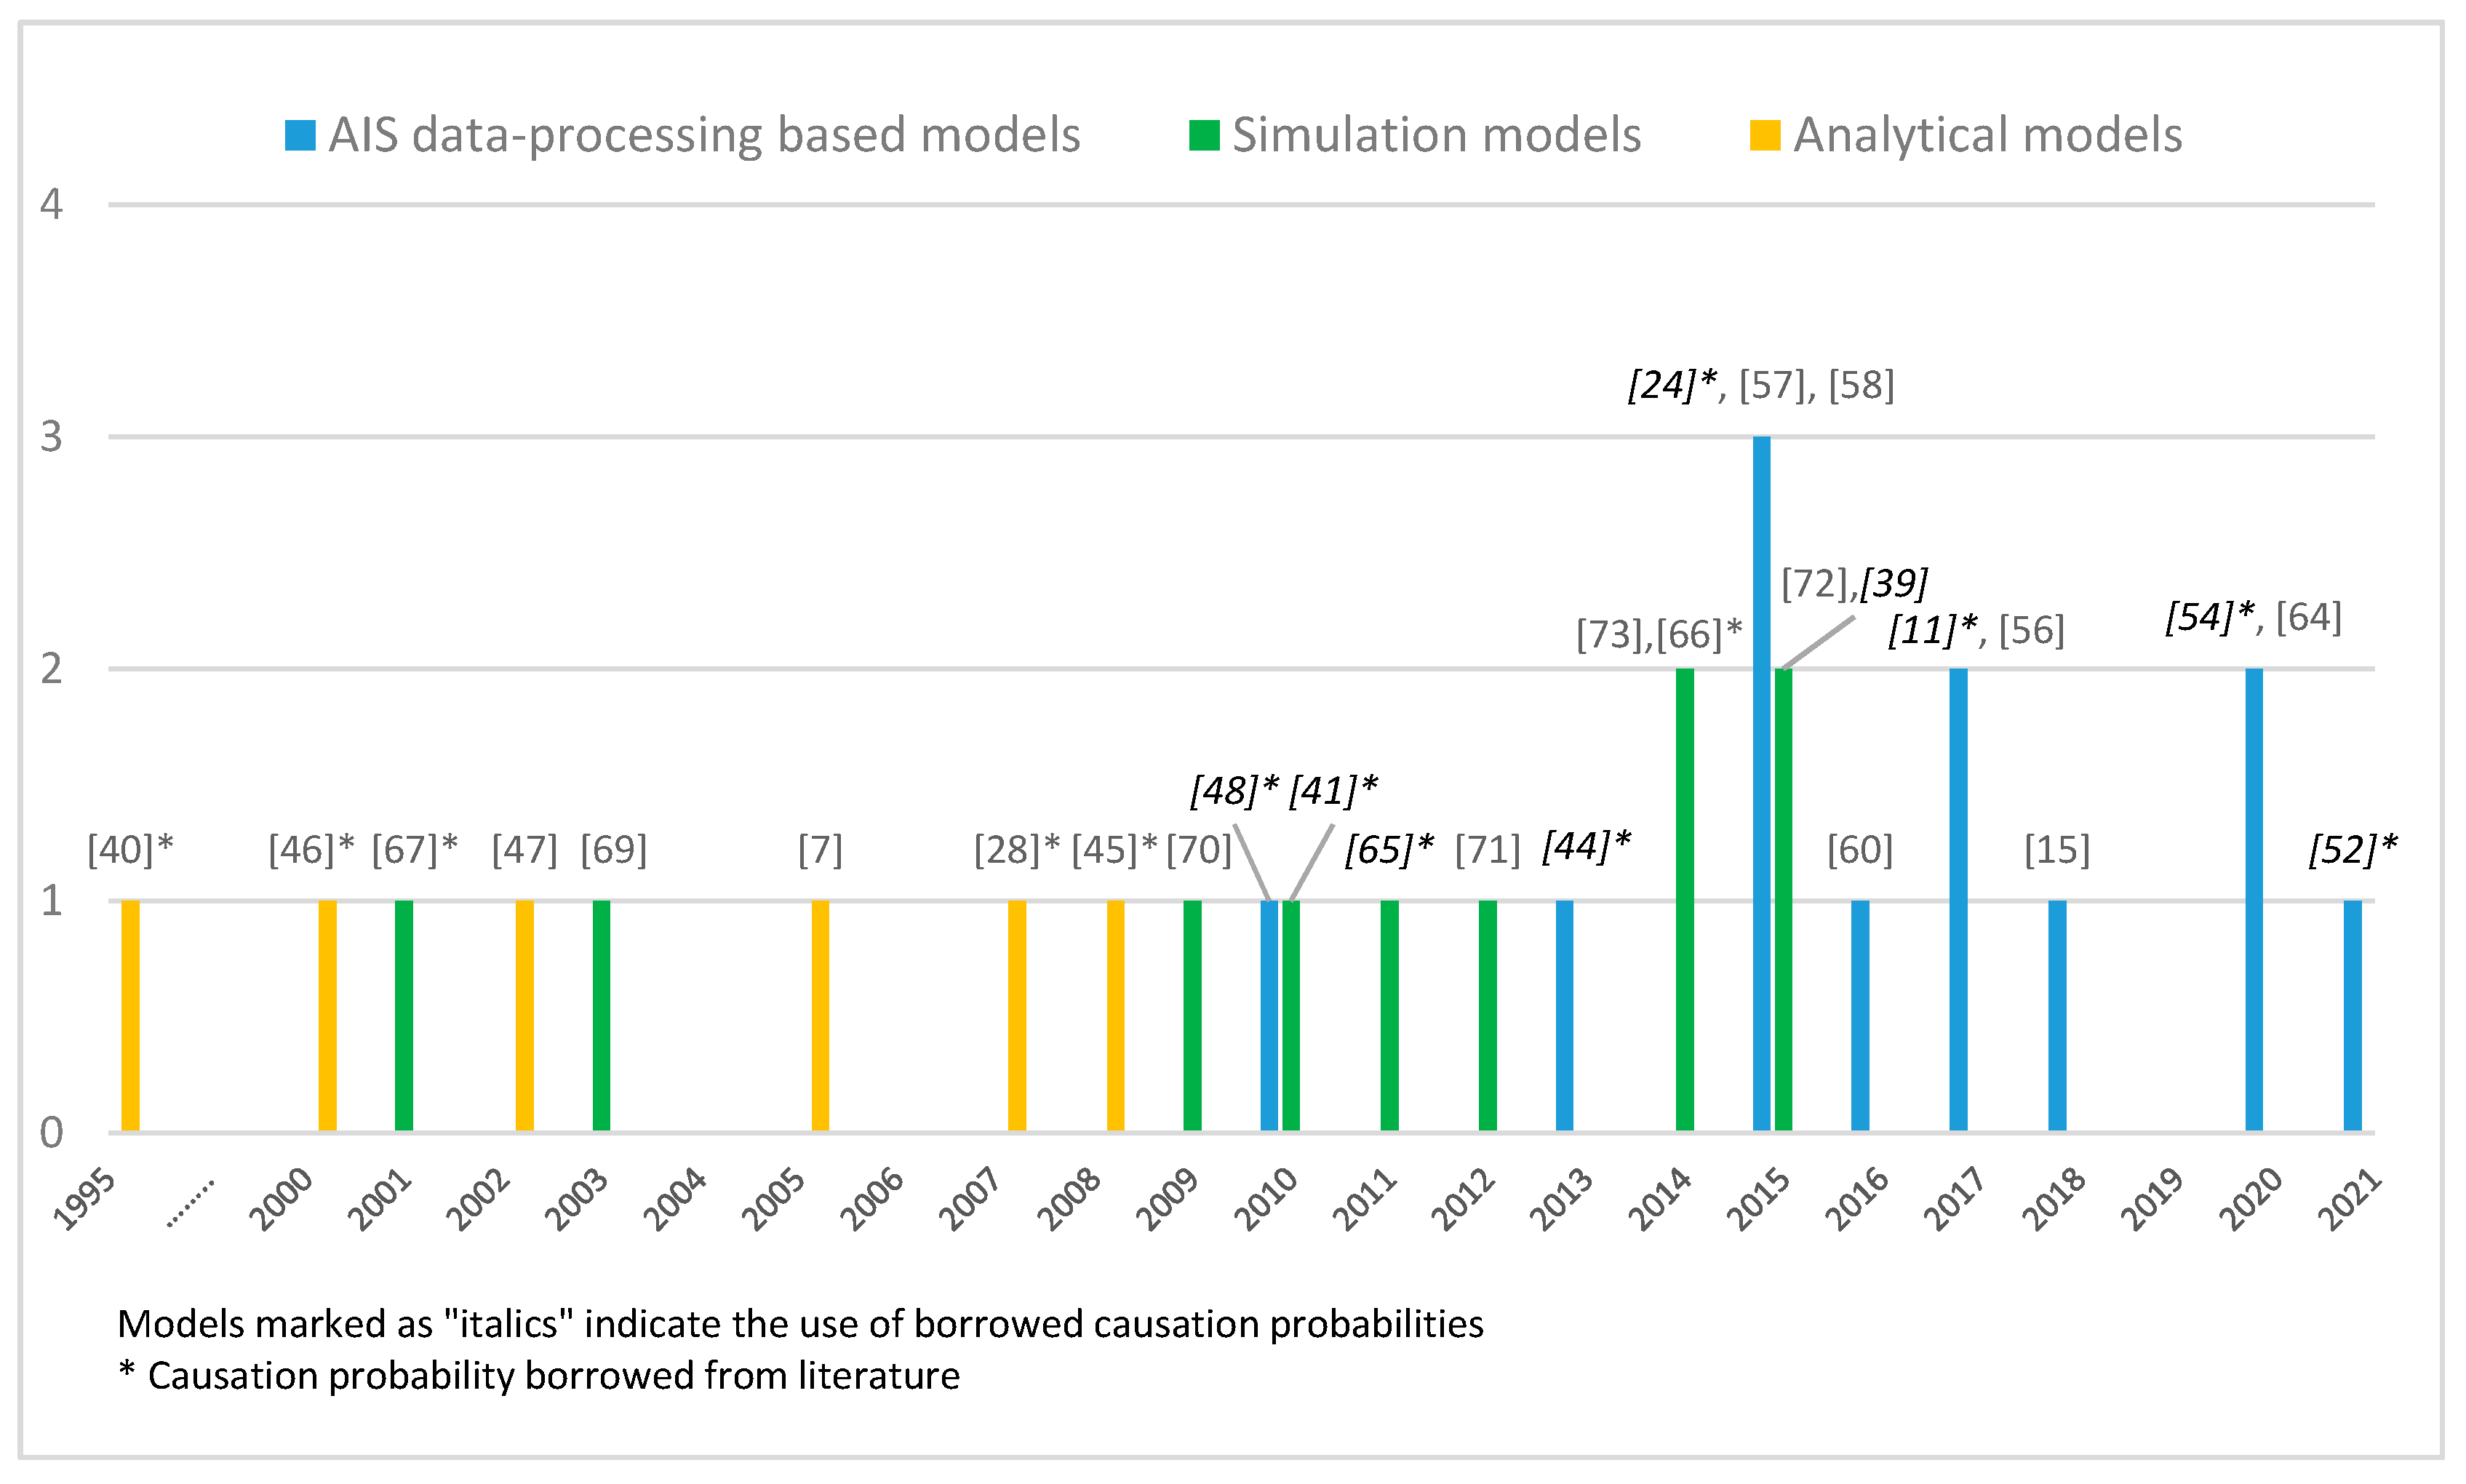
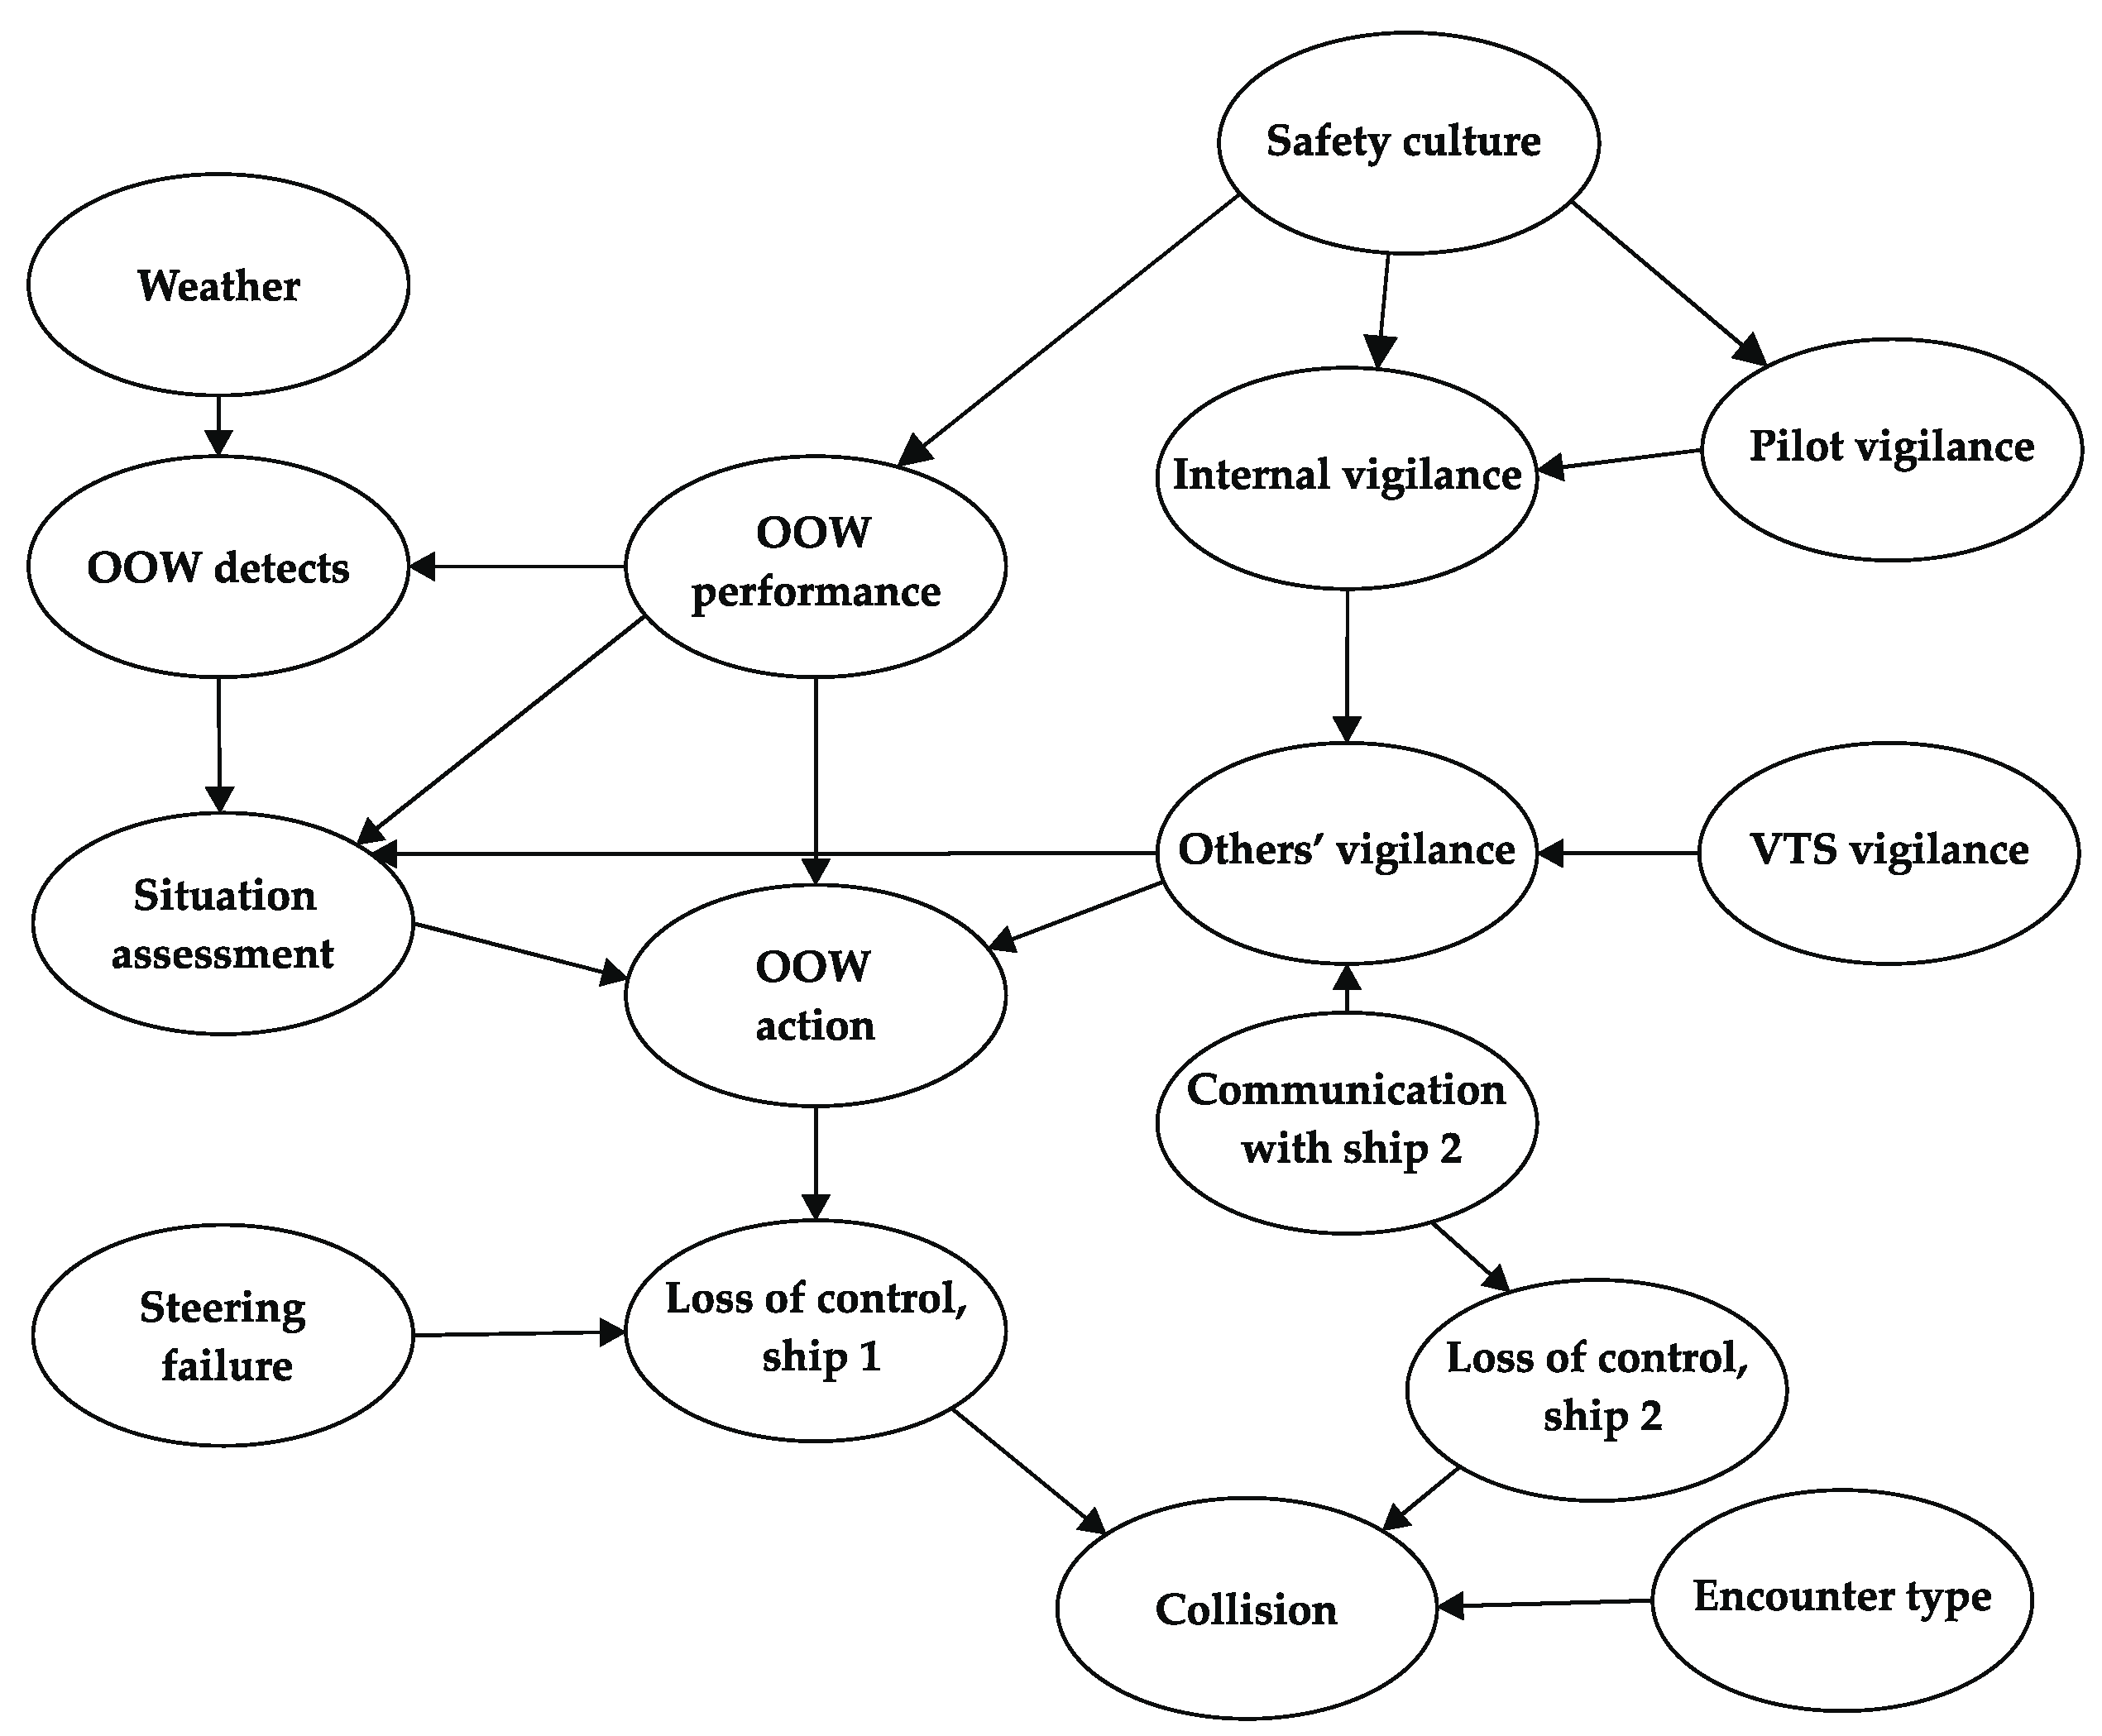
Table 1.
Classification framework.
| Model Class Type | Existing Collision Candidate Detection Approaches | |||
|---|---|---|---|---|
| Safe Boundary Approach | Synthetic Indicator Approach | Non-Conventional Approaches and Approaches Emerged from Robotics and Artificial Intelligence | ||
| Ship Domain | Direct/Nearly Direct Ship–Ship Contact and Collision Diameter | |||
| AIS data-processing-based models | [48] *, [24] *, [52] *, [54] *, [11] *, [56,60] | [44] * | [57,58] | [15,64] |
| Simulation models | [72,73] | [65] *, [41] *, [39] | [67] *, [69] | [66] *, [70,71] |
| Analytical models | [7], [17] *, [28] *, [40] *, [45] *, [47] | [46] * | ||
Models marked as “italics” indicate the use of borrowed causation probability. * Performed direct comparison with real collisions.
Publisher’s Note: MDPI stays neutral with regard to jurisdictional claims in published maps and institutional affiliations. |
© 2021 by the authors. Licensee MDPI, Basel, Switzerland. This article is an open access article distributed under the terms and conditions of the Creative Commons Attribution (CC BY) license (https://creativecommons.org/licenses/by/4.0/).
Share and Cite
MDPI and ACS Style
Čorić, M.; Mandžuka, S.; Gudelj, A.; Lušić, Z. Quantitative Ship Collision Frequency Estimation Models: A Review. J. Mar. Sci. Eng. 2021, 9, 533. https://0-doi-org.brum.beds.ac.uk/10.3390/jmse9050533
AMA Style
Čorić M, Mandžuka S, Gudelj A, Lušić Z. Quantitative Ship Collision Frequency Estimation Models: A Review. Journal of Marine Science and Engineering. 2021; 9(5):533. https://0-doi-org.brum.beds.ac.uk/10.3390/jmse9050533
Chicago/Turabian StyleČorić, Mirko, Sadko Mandžuka, Anita Gudelj, and Zvonimir Lušić. 2021. "Quantitative Ship Collision Frequency Estimation Models: A Review" Journal of Marine Science and Engineering 9, no. 5: 533. https://0-doi-org.brum.beds.ac.uk/10.3390/jmse9050533
Note that from the first issue of 2016, this journal uses article numbers instead of page numbers. See further details here.