
A Concept and Framework of the Extended Ecosystem-Based Fisheries Assessment Approach Incorporating Other Driving Forces


Abstract
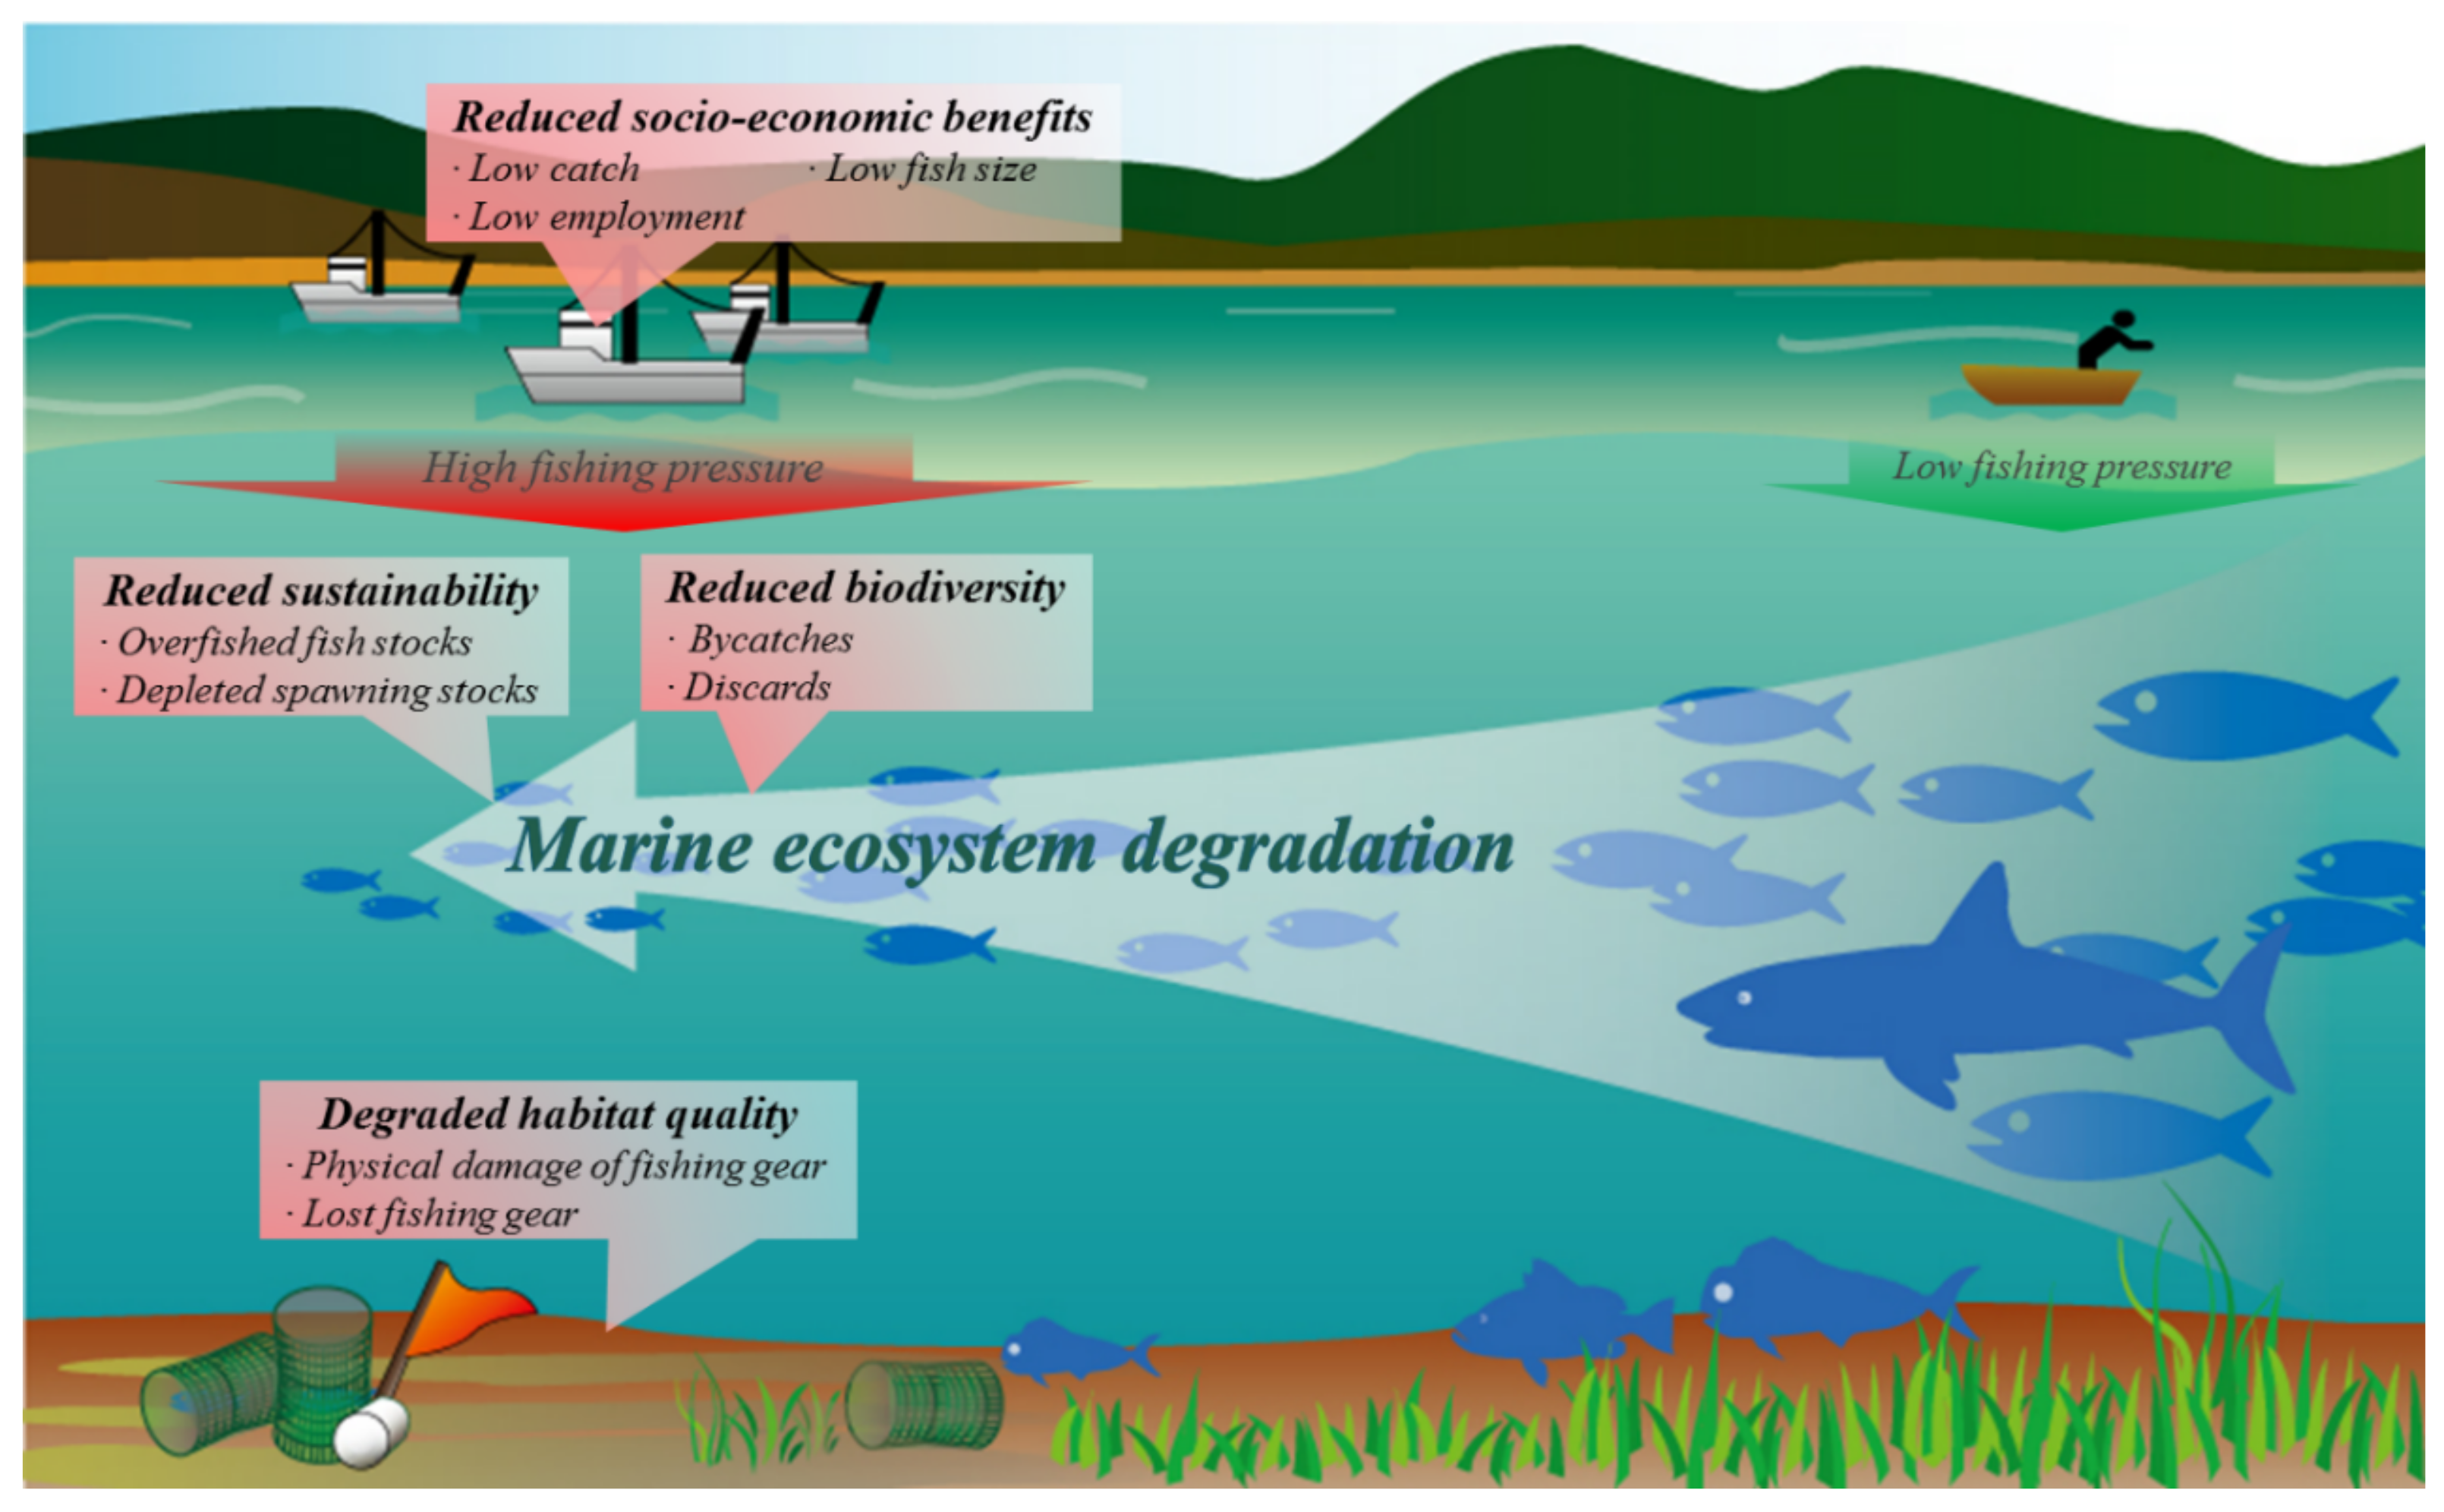
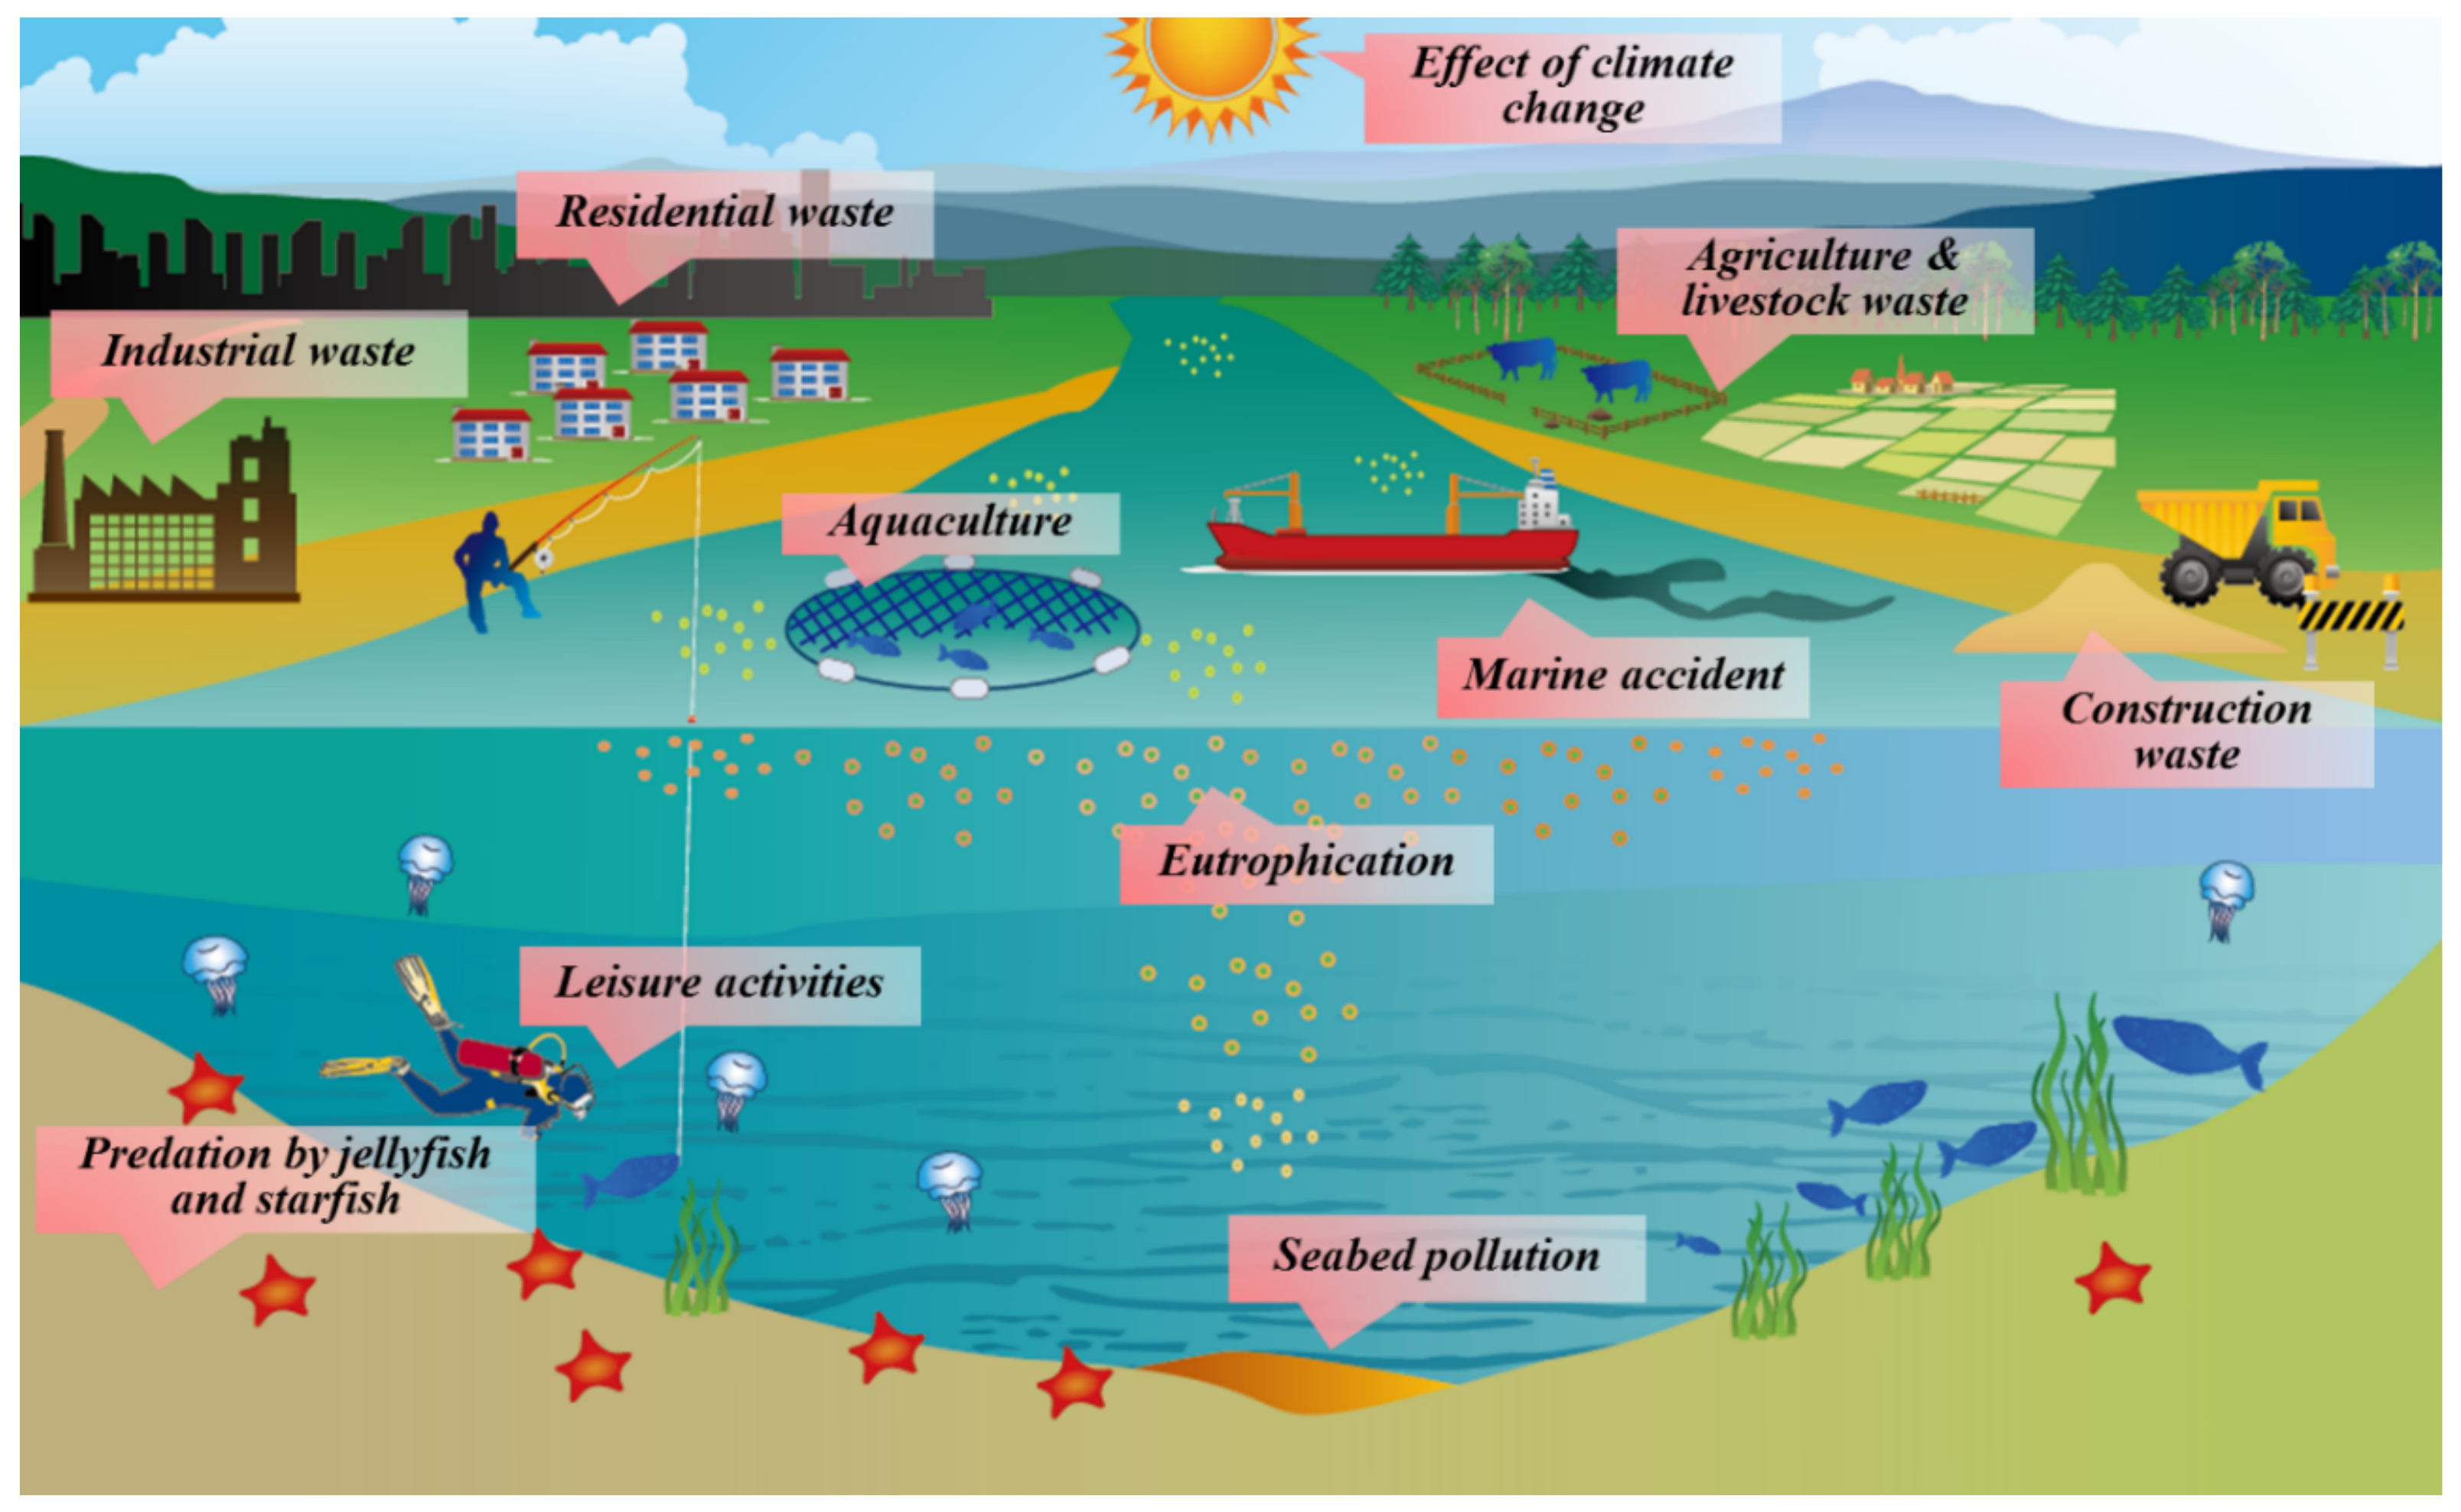
:1. Introduction
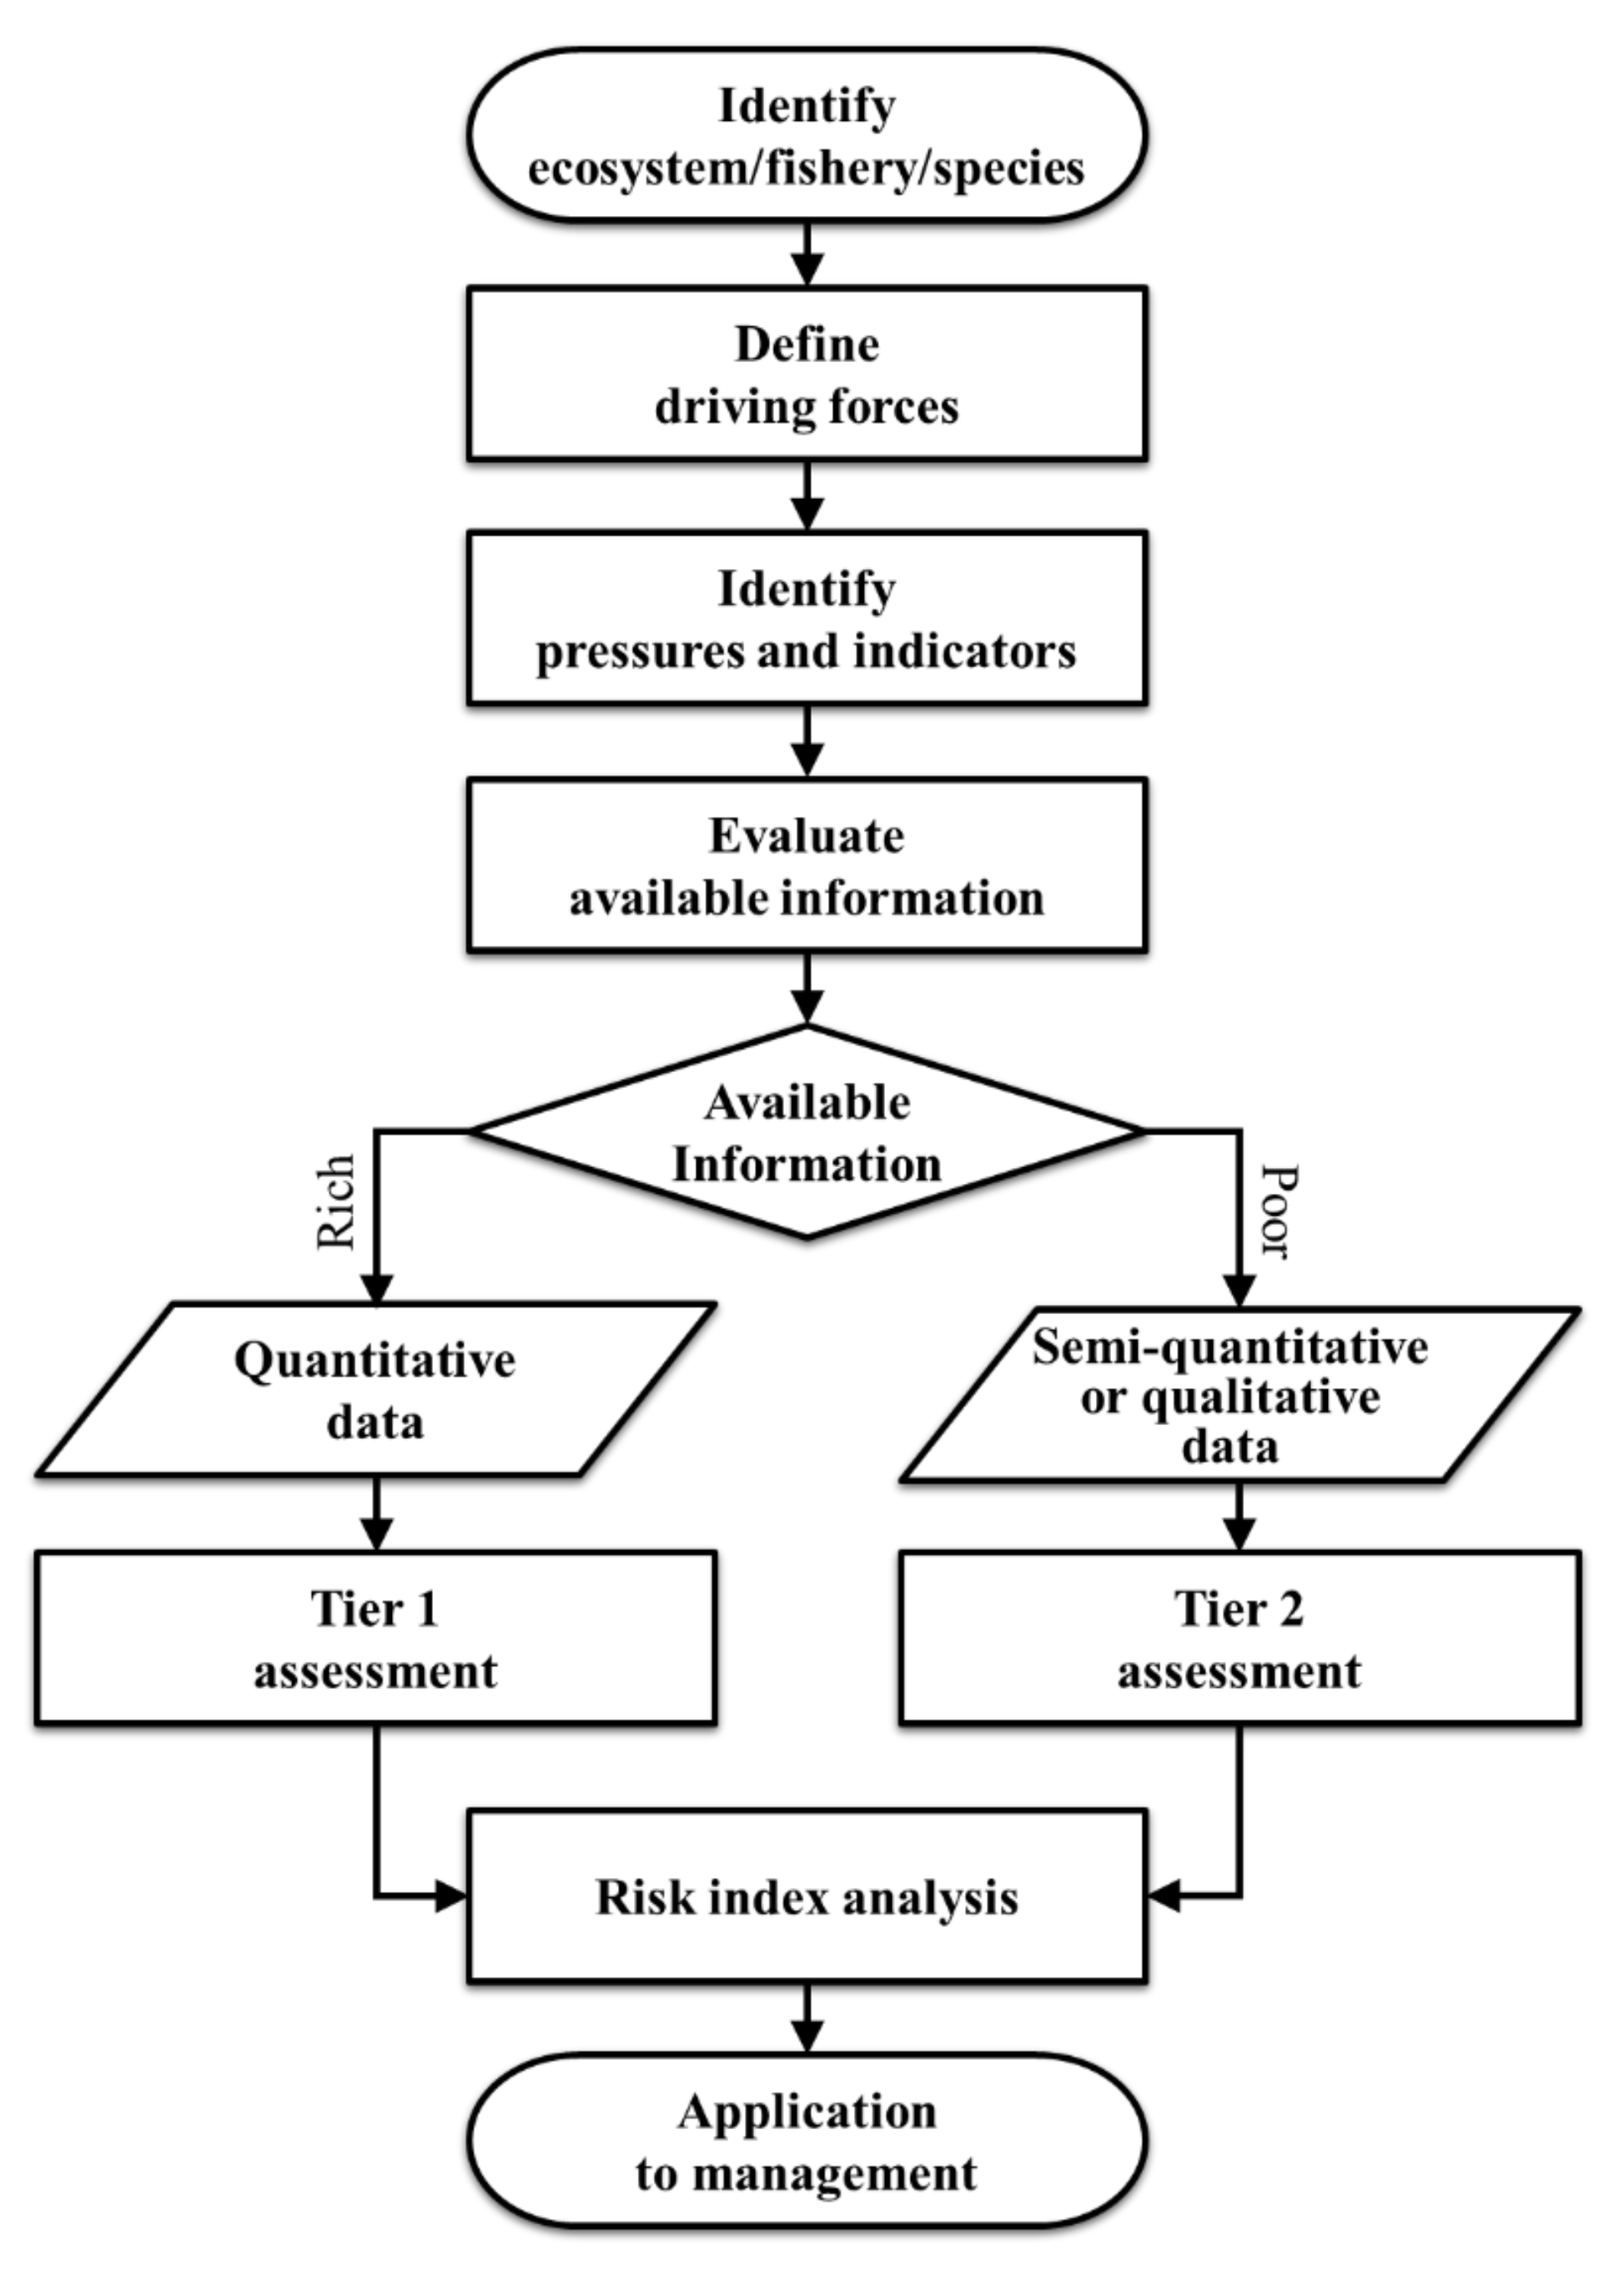
2. Materials and Methods
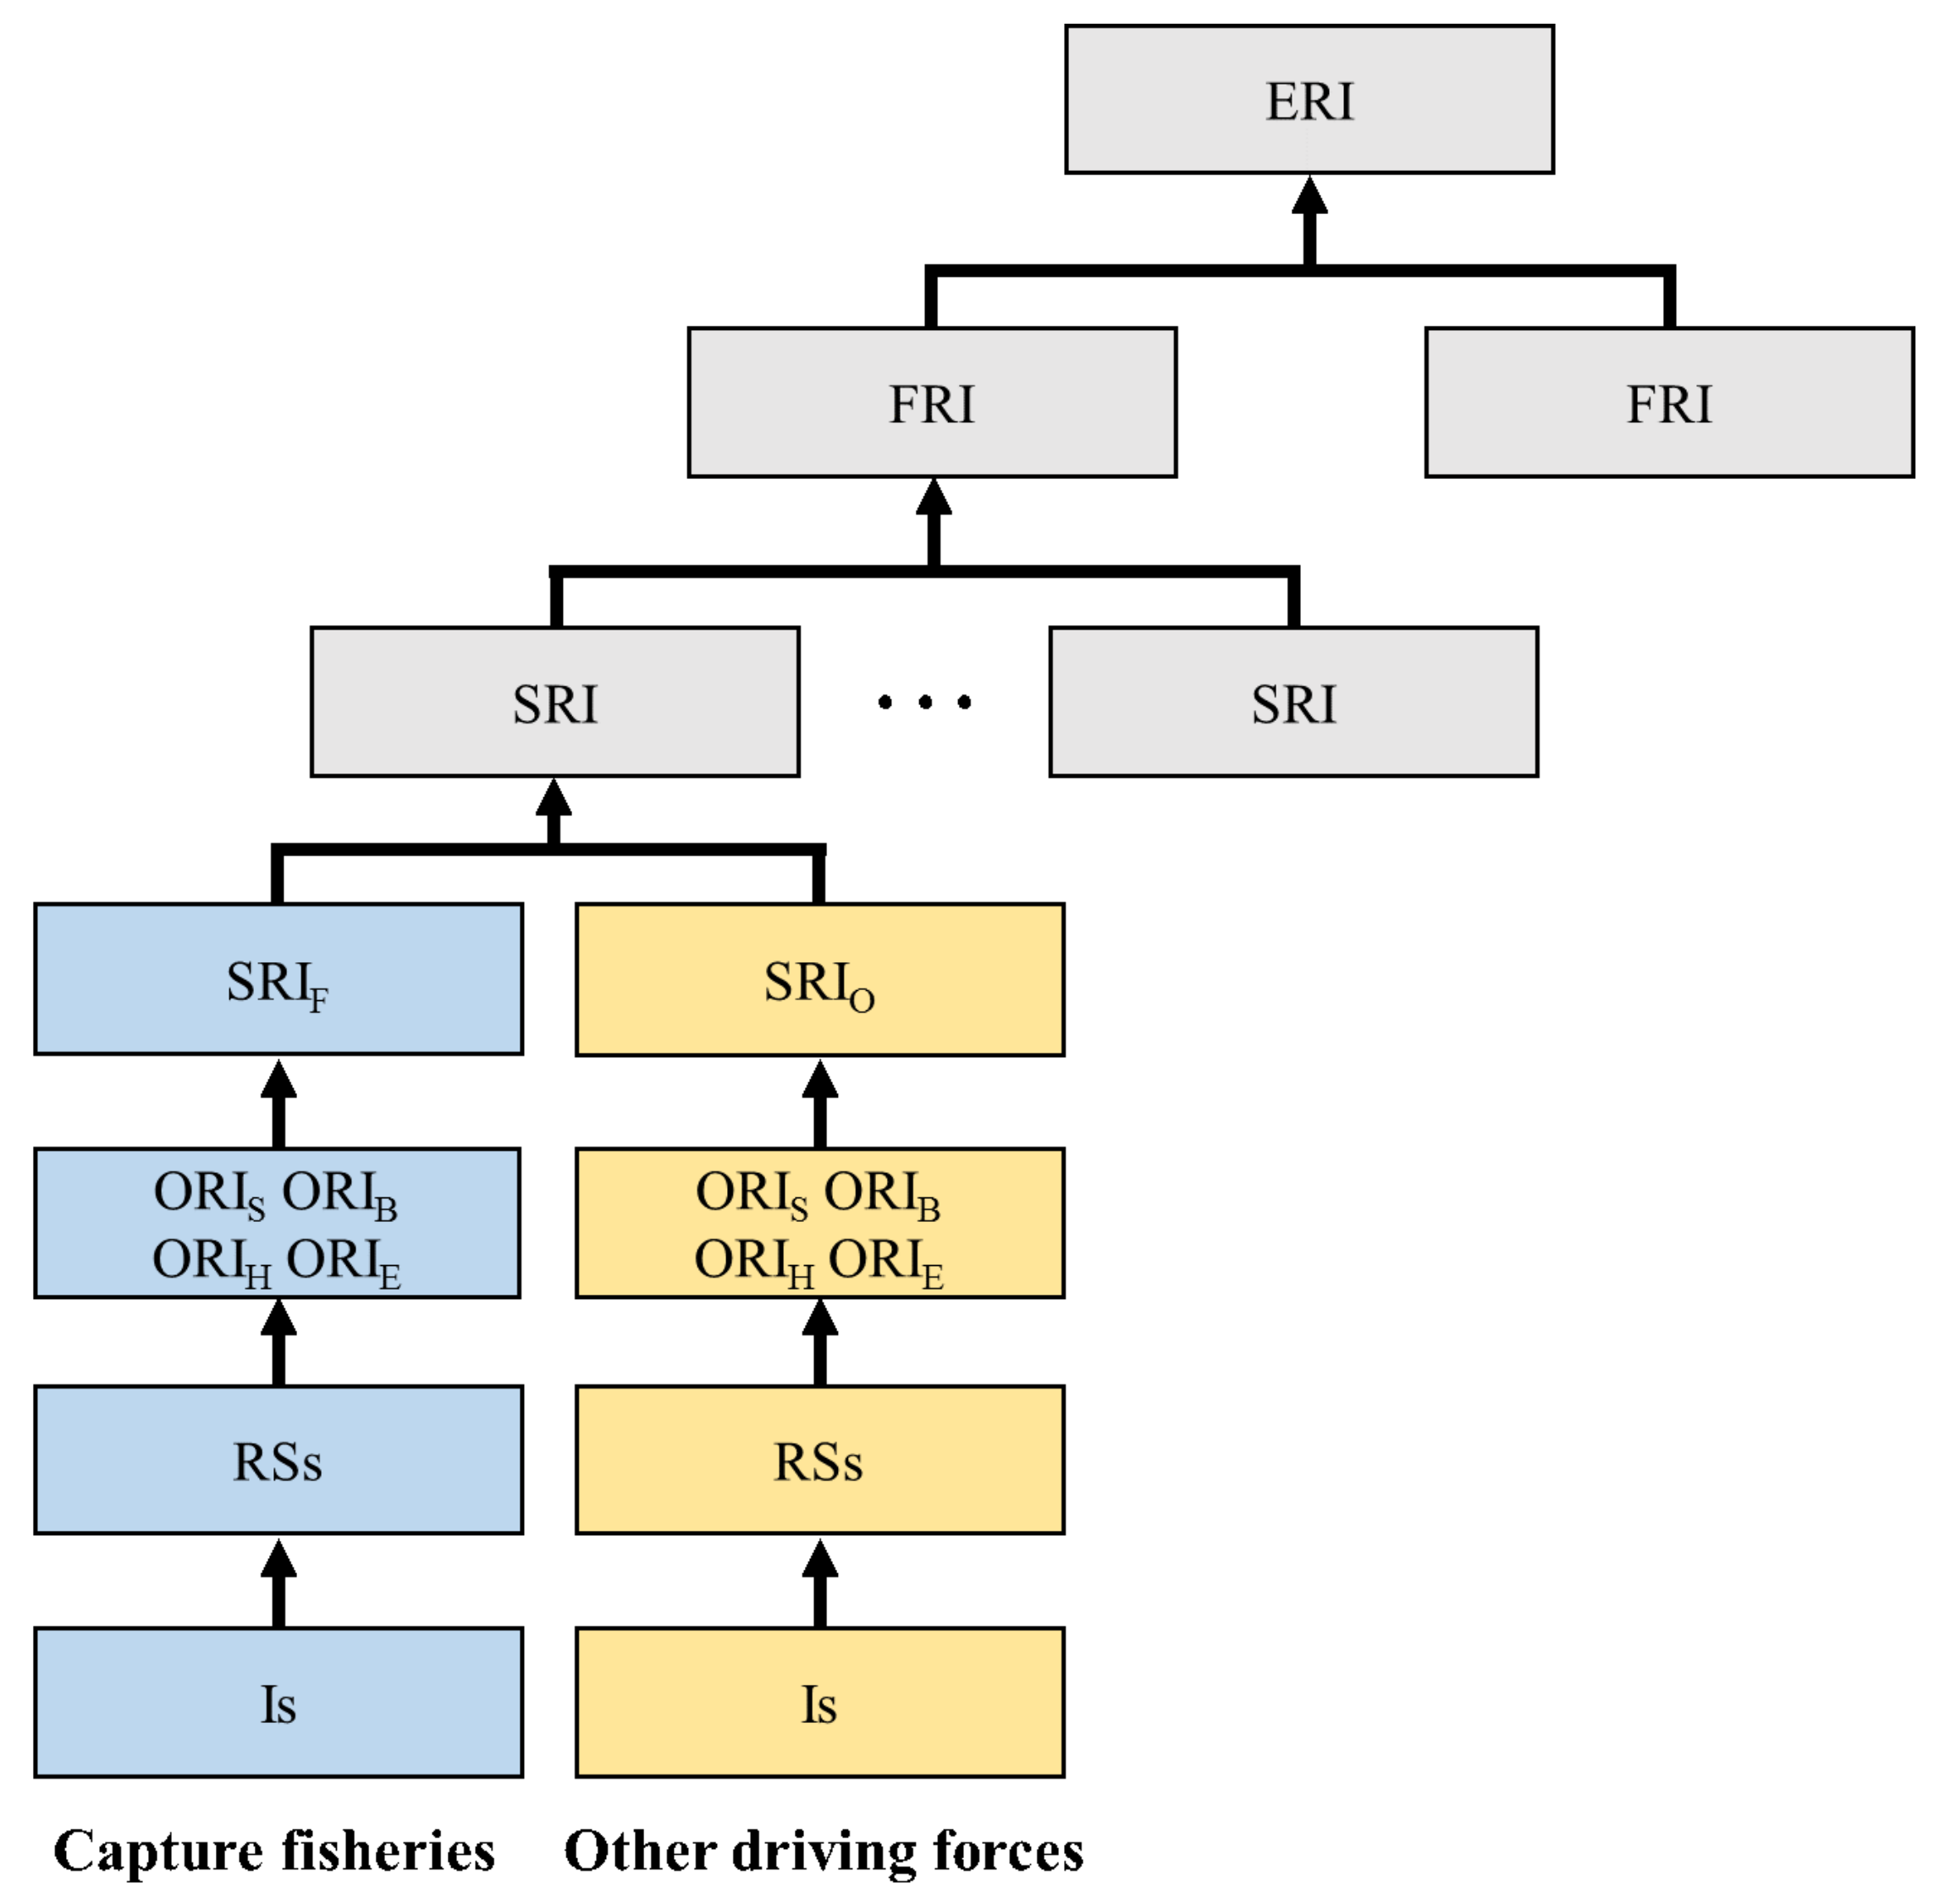
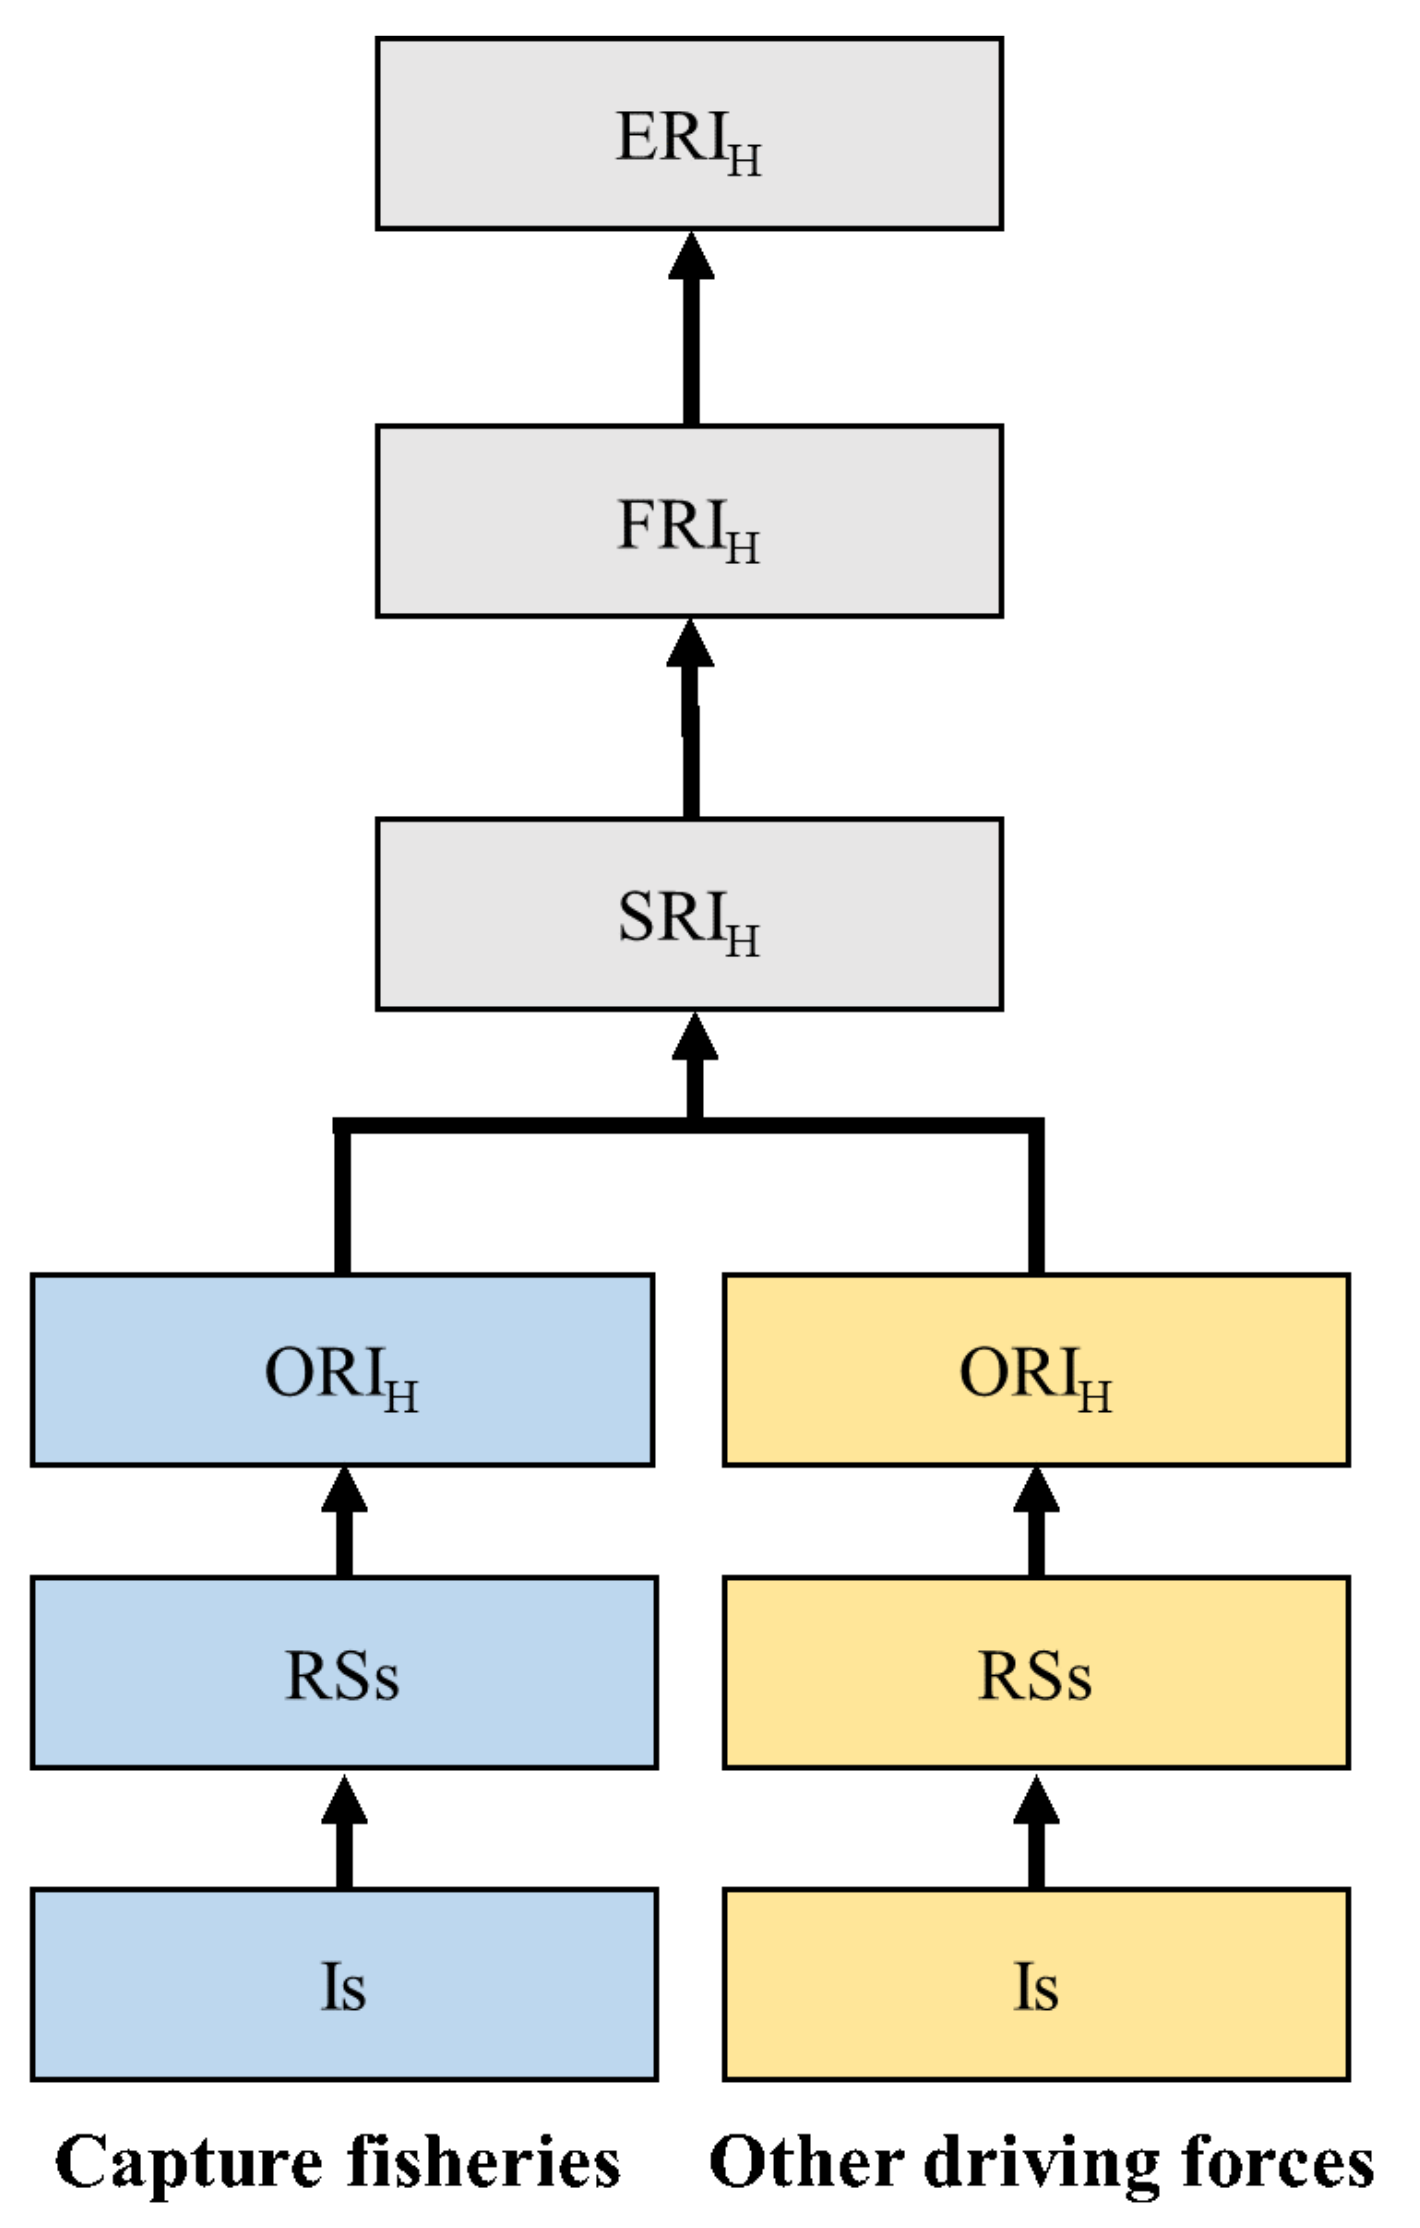
2.1. Assessment Framework
2.2. Application: Uljin Coastal Waters
2.2.1. Target Ecosystem, Fisheries, and Species
2.2.2. Driving Forces and Indicators
2.2.3. Risk Scoring and Derived Indices
3. Results
4. Discussion
5. Conclusions
Supplementary Materials
Author Contributions
Funding
Institutional Review Board Statement
Informed Consent Statement
Data Availability Statement
Conflicts of Interest
Abbreviations
| EAF | Ecosystem approach to fisheries |
| EBFM | Ecosystem-based fisheries management |
| EBFA | Ecosystem-based fisheries assessment |
| ERI | Ecosystem risk index |
| FRI | Fisheries risk index |
| RS | Risk score |
| ORI | Objective risk index |
| SRI | Species risk index |
| Species risk index by capture fishery | |
| Species risk index by other driving forces |
Appendix A. Potential Indicators and Reference Points
Appendix A.1. Capture Fishery


| Management Objective | Indicator |
|---|---|
| Sustainability | - Biomass (B) or CPUE |
| - Catch or fishing Mortality (F) | |
| - Age (or length) at first capture (t or L) | |
| - Rate of mature fish (MR) | |
| - Ratio of (released stock abundance)/(wild stock abundance) in catch (r/w) | |
| Habitat quality | - Critical habitat damage rate (DH/H) |
| - Lost fishing gear (frequency, FR) | |
| - Discard wastes rate (DW) | |
| - Pollution rate of spawning and nursery ground (PG/G) | |
| Biodiversity | - Bycatch rate (BC/C) |
| - Discard rate (D/C) | |
| - Diversity index (DI) | |
| Socio-economic benefits | - Income per person employed (IPPE) |
| - Ratio of profit to sales (RPS) | |
| - Employment rate (ER) |
Appendix A.2. Other Driving Forces

| Management Objective | Driving Force | Indicator |
|---|---|---|
| Sustainability | Aquaculture | - Cultured/wild biomass ratio () |
| Leisure activities | - Catch by leisure () | |
| - Catch by tideland education () | ||
| Accident and disaster | - Predation by jellyfish () | |
| - Predation by starfish () | ||
| - Deaths by eutrophication () | ||
| - Deaths by oil pollution () | ||
| Stock enhancement | - Biomass enhancement by fries or juveniles release () | |
| Habitat quality | Aquaculture | - Fish waste () |
| - Aquaculture debris () | ||
| - Fish food waste () | ||
| - Water circulation () | ||
| Land-based pollution | - Domestic sewage () | |
| - Domestic excreta () | ||
| - Industrial sewage () | ||
| - Industrial organic matter () | ||
| - Industrial heated effluent () | ||
| Construction activities | - Waste by construction () | |
| - Seabed-sand collection () | ||
| - Shoreline change by reclamation () | ||
| - Sediment inflow by reclamation () | ||
| Leisure activities | - Waste by leisure activities () | |
| - Heavy metal waste by leisure activities () | ||
| - Habitat physical damage by leisure activities () | ||
| - Tideland habitat physical damage by tideland education () | ||
| Accidents and disasters | - Global warming by climate change () | |
| - Ocean acidification by climate change () | ||
| - Eutrophication(red tide occurrence) () | ||
| - Whitening event () | ||
| - Water runoff by storm () | ||
| - Oil pollution by ship accident () | ||
| - Oxygen deficient event () | ||
| - Typhoon event () | ||
| Stock enhancement | - Artificial reefs deployment () | |
| Biodiversity | Aquaculture | - Attracted wild fish by uneaten food () |
| - Escaped cultured species () | ||
| - Disease spread to wild fish () | ||
| Land-based pollution | - Ballast water discharge () | |
| Accident and disaster | - Jellyfish bloom () | |
| - Starfish bloom () | ||
| Socio-economic benefits | Leisure activities | - Extra income from supporting leisure activities () |
| - Extra employment by leisure activities () | ||
| Accidents and disasters | - Fishing gear or ship damage by accident or disaster () |
References
- Christensen, N.; Bartuska, A.; Brown, J.; Carpenter, S.; DAntonio, C.; Francis, R.; Franklin, J.; Macmahon, J.; Noss, R.; Parsons, D.; et al. The Report of the Ecological Society of America Committee on the Scientific Basis for Ecosystem Management. Ecol. Appl. 1996, 6, 665–691. [Google Scholar] [CrossRef] [Green Version]
- McLeod, K.L.; Lubchenco, S.J.; Palumbi, R.; Rosenberg, A.A. Scientific Consensus Statement on Marine Ecosystem-Based Management. Signed by 221 Academic Scientists and Policy Experts with Relevant Expertise and Published by the Communication Partnership for Science and the Sea. 2005. Available online: http://compassonline.org/?q=EBM (accessed on 15 February 2021).
- FAO. Fisheries Management. 2. The Ecosystem Approach to Fisheries; FAO: Rome, Italy, 2003; Volume 4, p. 112. [Google Scholar]
- UN. Report of the World Summit on Sustainable Development, Johannesburg; UN: New York, NY, USA, 2002; p. 170. [Google Scholar]
- UN. The Futre We Want: Outcome document of the United Nations Conference on Sustainable Development; UN: New York, NY, USA, 2012; p. 41. [Google Scholar]
- UN. The Sustainable Development Goals Report 2016; UN: New York, NY, USA, 2016; p. 56. [Google Scholar]
- Hobday, A.J.; Smith, A.D.; Stobutzki, I.C.; Bulman, C.; Daley, R.; Dambacher, J.M.; Deng, R.A.; Dowdney, J.; Fuller, M.; Furlani, D.; et al. Ecological risk assessment for the effects of fishing. Fish. Res. 2011, 108, 372–384. [Google Scholar] [CrossRef]
- MSC. Marine Stewardship Council Fisheries Assessment Methodology and Guidance to Certification Bodies Including Default Assessment Tree and Risk-Based Framework; Version 2.1; MSC: London, UK, 2009. [Google Scholar]
- Zhang, C.I.; Kim, S.; Gunderson, D.; Marasco, R.; Lee, J.B.; Park, H.W.; Lee, J.H. An ecosystem-based fisheries assessment approach for Korean fisheries. Fish. Res. 2009, 100, 26–41. [Google Scholar] [CrossRef]
- Zhang, C.I.; Park, H.W.; Lim, J.H.; Kwon, H.C.; Kim, D.H. A study on indicators and reference points for the ecosystem-based resource assessment. J. Korean Soc. Fish. Technol. 2010, 46, 32–49. [Google Scholar] [CrossRef] [Green Version]
- Kruse, S.A.; Flysjö, A.; Kasperczyk, N.; Scholz, A.J. Socioeconomic indicators as a complement to life cycle assessment—An application to salmon production systems. Int. J. Life Cycle Assess. 2009, 14, 8–18. [Google Scholar] [CrossRef]
- Kim, D.H.; Zhang, C.I. Developing socioeconomic indicators for an ecosystem-based fisheries management approach: An application to the Korean large purse seine fishery. Fish. Res. 2011, 112, 134–139. [Google Scholar] [CrossRef]
- Seung, C.; Zhang, C.I. Developing socioeconomic indicators for fisheries off Alaska: A multi-attribute utility function approach. Fish. Res. 2011, 112, 117–126. [Google Scholar] [CrossRef]
- Park, H.W.; Zhang, C.I.; Kwon, Y.J.; Seo, Y.I.; Oh, T.Y. A study on the risk scoring and risk index for the ecosystem-based fisheries assessment. J. Kor. Soc. Fish. Tech. 2013, 49, 469–482. [Google Scholar] [CrossRef] [Green Version]
- Kim, H.; Kang, H.; Zhang, C.I.; Seo, Y.I. Risk-based fisheries assessment considering spatio-temporal component for Korean waters. Ocean. Coast. Manag. 2020, 192, 105209. [Google Scholar] [CrossRef]
- Zhang, C.I.; Hollowed, A.B.; Lee, J.B.; Kim, D.H. An IFRAME approach for assessing impacts of climate change on fisheries. ICES J. Mar. Sci. 2011, 68, 1318–1328. [Google Scholar] [CrossRef]
- Taranger, G.L.; Karlsen, Ø.; Bannister, R.J.; Glover, K.A.; Husa, V.; Karlsbakk, E.; Kvamme, B.O.; Boxaspen, K.K.; Bjørn, P.A.; Finstad, B.; et al. Risk assessment of the environmental impact of Norwegian Atlantic salmon farming. ICES J. Mar. Sci. 2015, 72, 997–1021. [Google Scholar] [CrossRef] [Green Version]
- Fanning, L.; Mahon, R.; McConney, P. Towards Marine Ecosystem-Based Management in the Wider Caribbean: 4 Implications of Land-based Activities in Small Islands for Marine EBM; Amsterdam University Press: Amsterdam, The Netherlands, 2011; p. 425. [Google Scholar]
- Yu, G.; Zhang, J.Y. Analysis of the impact on ecosystem and environment of marine reclamation-A case study in Jiaozhou Bay. Energy Procedia 2011, 5, 105–111. [Google Scholar] [CrossRef] [Green Version]
- Ministry of Oceans and Fisheries. 3rd Fisheries Resources Management Plan for 2021–2025; MOF: Sejong, Korea, 2021; p. 37.
- Korea Hydrographic and Oceanographic Agency. Available online: https://www.khoa.go.kr/ (accessed on 10 April 2021).
- Statistics Korea. Available online: http://kostat.go.kr/portal/korea/index.action (accessed on 10 April 2021).
- Yoon, S.C.; Zhang, C.I.; Seo, Y.I.; Kim, Z.G. Ecosystem-based resource assessment on coastal fisheries of Uljin in East Sea of Korea. J. Korean Soc. Fish. Technol. 2014, 50, 567–582. [Google Scholar] [CrossRef]
- Font, T.; Lloret, J. Biological and ecological impacts derived from recreational fishing in Mediterranean coastal areas. Rev. Fish. Sci. Aquac. 2014, 22, 73–85. [Google Scholar] [CrossRef]
- Cooke, S.J.; Cowx, I.G. The Role of Recreational Fishing in Global Fish Crises. BioScience 2004, 54, 857–859. [Google Scholar] [CrossRef]
- Muir, W.M.; Howard, R.D. Possible ecological risks of transgenic organism release when transgenes affect mating success: Sexual selection and the Trojan gene hypothesis. Proc. Natl. Acad. Sci. USA 1999, 96, 13853–13856. [Google Scholar] [CrossRef] [Green Version]
- Marine Aquaculture Task Force. Sustainable Marine Aquaculture: Fulfilling the Promise. Managing the Risks; Marine Aquaculture Task Force: Takoma Park, MD, USA, 2007. [Google Scholar]
- Martinez-Porchas, M.; Martinez-Cordova, L.R. World aquaculture: Environmental impacts and troubleshooting alternatives. Sci. World J. 2012, 2012. [Google Scholar] [CrossRef] [Green Version]
- O’Sullivan, A.J. Ecological effects of sewage discharge in the marine environment. Proc. R. Soc. Lond. Ser. B. Biol. Sci. 1971, 177, 331–351. [Google Scholar] [CrossRef]
- Teixeira, T.P.; Neves, L.M.; Araújo, F.G. Effects of a nuclear power plant thermal discharge on habitat complexity and fish community structure in Ilha Grande Bay, Brazil. Mar. Environ. Res. 2009, 68, 188–195. [Google Scholar] [CrossRef] [Green Version]
- Bosch-Belmar, M.; Milisenda, G.; Basso, L.; Doyle, T.K.; Leone, A.; Piraino, S. Jellyfish Impacts on Marine Aquaculture and Fisheries. Rev. Fish. Sci. Aquac. 2021, 29, 242–259. [Google Scholar] [CrossRef]
- Zohdi, E.; Abbaspour, M. Harmful algal blooms (red tide): A review of causes, impacts and approaches to monitoring and prediction. Int. J. Environ. Sci. Technol. 2019, 16, 1789–1806. [Google Scholar] [CrossRef]
- Mills, C.E. Jellyfish blooms: Are populations increasing globally in response to changing ocean conditions? Hydrobiologia 2001, 451, 55–68. [Google Scholar] [CrossRef]
- Ministry of Oceans and Fisheries. A Study on the Management Plan of Hot Waste Water for the Conservation of Marine Ecosystem; MOF: Seoul, Korea, 2007; p. 448.
- Ministry of Oceans and Fisheries. Report on Recreational Fishery Status; MOF: Sejong, Korea, 2017.
- Korea Hydro and Nuclear Power. Available online: https://www.khnp.co.kr/ (accessed on 10 April 2021).
- National Institute of Fisheries Science. Forecast and Breaking News on Jellyfish Bloom, Red Tide Bloom, Hypoxia, and Cold Pool. Available online: http://www.nifs.go.kr/bbs?id=newfish (accessed on 10 April 2021).
- Christensen, V.; Walters, C.J. Ecopath with Ecosim: Methods, capabilities and limitations. Ecol. Model. 2004, 172, 109–139. [Google Scholar] [CrossRef]
- Travers, M.; Shin, Y.J.; Shannon, L.; Cury, P. Simulating and testing the sensitivity of ecosystem-based indicators to fishing in the southern Benguela ecosystem. Can. J. Fish. Aquat. Sci. 2006, 63, 943–956. [Google Scholar] [CrossRef]
- Fulton, E.A.; Link, J.S.; Kaplan, I.C.; Savina-Rolland, M.; Johnson, P.; Ainsworth, C.; Horne, P.; Gorton, R.; Gamble, R.J.; Smith, A.D.M.; et al. Lessons in modelling and management of marine ecosystems: The Atlantis experience. Fish Fish. 2011, 12, 171–188. [Google Scholar] [CrossRef]
- Seo, Y.I.; Zhang, C.I.; Lee, J.B.; Cha, H.K. Stock assessment by ecosystem risk analysis of large purse seine fishery in the southern sea of Korea. Bull. Korean Soc. Fish. Technol. 2011, 47, 369–389. [Google Scholar] [CrossRef]
- Park, H.W.; Zhang, C.I. A study on the ecosystem-based resource management system of self-regulatory community fisheries. Bull. Korean Soc. Fish. Technol. 2008, 44, 345–352. [Google Scholar] [CrossRef] [Green Version]
- Kang, B.; Zhang, C.I.; Kim, H. An Evaluation Approach for Suitability of Education for Achieving Ecosystem-based Fisheries Management. J. Fishries Mar. Sci. Educ. 2019, 31, 392–405. [Google Scholar] [CrossRef]
- Park, H.W.; Choi, K.H.; Zhang, C.I.; Seo, Y.I.; Kim, H. A study on the ecosystem-based fisheries assessment by quality analysis in Jeonnam marine ranching ecosystem. J. Korean Soc. Fish. Technol. 2013, 49, 459–468. [Google Scholar] [CrossRef] [Green Version]
- Alsolami, L.S.; Abdelaty, M.; Zhang, C.I. An ecosystem-based fisheries assessment approach and management system for the Red Sea. Fish. Res. 2020, 227, 105551. [Google Scholar] [CrossRef]
- Hollowed, A.; Curchitser, E.; Stock, C.; Zhang, C. Trade-offs associated with different modeling approaches for assessment of fish and shellfish responses to climate change. Clim. Change 2013, 119. [Google Scholar] [CrossRef]
- UN. The Second Global Integrated Manrine Assessment: World Ocean Assessment 2; UN: New York, NY, USA, 2021; p. 905. [Google Scholar]
- Rice, J.C.; Rochet, M.J. A framework for selecting a suite of indicators for fisheries management. ICES J. Mar. Sci. 2005, 62, 516–527. [Google Scholar] [CrossRef] [Green Version]
- Weir, L.K.; Grant, J.W. Effects of aquaculture on wild fish populations: A synthesis of data. Environ. Rev. 2005, 13, 145–168. [Google Scholar] [CrossRef] [Green Version]
- Molony, B.W.; Lenanton, R.; Jackson, G.; Norriss, J. Stock enhancement as a fisheries management tool. Rev. Fish Biol. Fish. 2005, 13, 409–432. [Google Scholar] [CrossRef]
- Lorenzen, K.; Leber, K.M.; Blankenship, H.L. Responsible Approach to Marine Stock Enhancement: An Update. Rev. Fish. Sci. 2010, 18, 189–210. [Google Scholar] [CrossRef]
- Schmiing, M.; Diogo, H.; Serrão Santos, R.; Afonso, P. Marine conservation of multispecies and multi-use areas with various conservation objectives and targets. ICES J. Mar. Sci. 2015, 72, 851–862. [Google Scholar] [CrossRef] [Green Version]
- Stender, Y.; Jokiel, P.L.; Rodgers, K.S. Thirty years of coral reef change in relation to coastal construction and increased sedimentation at Pelekane Bay, Hawai’i. PeerJ 2014, 2014, e300. [Google Scholar] [CrossRef] [Green Version]
- Clarke Murray, C.; Agbayani, S.; Ban, N.C. Cumulative effects of planned industrial development and climate change on marine ecosystems. Glob. Ecol. Conserv. 2015, 4, 110–116. [Google Scholar] [CrossRef] [Green Version]
- Rim-Rukeh, A.; Agbozu, I.E. Impact of partially treated sewage effluent on the water quality of recipient Epie Creek Niger Delta, Nigeria using Malaysian Water Quality Index (WQI). J. Appl. Sci. Environ. Manag. March 2013, 17, 5–12. [Google Scholar]
- Werschkun, B.; Banerji, S.; Basurko, O.C.; David, M.; Fuhr, F.; Gollasch, S.; Grummt, T.; Haarich, M.; Jha, A.N.; Kacan, S.; et al. Emerging risks from ballast water treatment: The run-up to the International Ballast Water Management Convention. Chemosphere 2014, 112, 256–266. [Google Scholar] [CrossRef] [Green Version]
- Chang, S.; Stone, J.; Demes, K.W.; Piscitelli, M. Consequences of oil spills: A review and framework for informing planning. Ecol. Soc. 2014, 19, 26. [Google Scholar] [CrossRef] [Green Version]
- De Donno, A.; Idolo, A.; Bagordo, F.; Grassi, T.; Leomanni, A.; Serio, F.; Guido, M.; Canitano, M.; Zampardi, S.; Boero, F.; et al. Impact of stinging jellyfish proliferations along south Italian coasts: Human health hazards, treatment and social costs. Int. J. Environ. Res. Public Health 2014, 11, 2488–2503. [Google Scholar] [CrossRef] [PubMed]
- Danise, S.; Twitchett, R.J.; Little, C.T.S. Environmental controls on Jurassic marine ecosystems during global warming. Geology 2015, 43, 263–266. [Google Scholar] [CrossRef]


| Management Objective | Driving Force | Indicator |
|---|---|---|
| Sustainability | Leisure activities | Catch by leisure activities (S1) |
| Accident and disaster | Deaths by disaster (S2) | |
| Habitat quality | Aquaculture | Fish waste (H1) |
| Land-based pollution | Domestic sewage (H2) | |
| Industrial sewage (H3) | ||
| Industrial heated effluent (H4) | ||
| Leisure activities | Waste by leisure activities (H5) | |
| Biodiversity | Accident and disaster | Jellyfish bloom (B1) |
| Socio-economic benefit | Accident and disaster | Economic loss by Jellyfish (E1) |
| Magnitude | Abundance | Condition | Likelihood | Frequency | Range | Risk Score |
|---|---|---|---|---|---|---|
| Extremely small | Never or None | Optimal, Best | High degree of uncertainty | Never | <5% | 0.0 |
| Small | Part or a few | Negligible | Highly unlikely | Rarely | 5–20% | 0.5 |
| Moderately small | Some | Minor | Unlikely | Sometimes | 20–40% | 1.0 |
| Average | Considerable or average | Moderate | Ambiguous | Average | 40–60% | 1.5 |
| Moderately large | Many or Major | Major, significant | Likely | Often | 60–80% | 2.0 |
| Large | Most | Severe, highly significant | Highly likely | Frequently | 80–95% | 2.5 |
| Extremely large | All | Catastrophic, Worst | High degree of certainty | Always | >95% | 3.0 |
| Management Objective | Indicator | RS | ORI | SRI(FRI) | ERI | |||||||
|---|---|---|---|---|---|---|---|---|---|---|---|---|
| G | S | G | S | G | S | G | S | G | S | |||
| Sustainability | S1 | 1.5 | 1.5 | 1.5 | 2.0 | 1.8 | 2.2 | 2.4 | 1.7 | 2.1 | 2.0 | 2.0 |
| S2 | 1.5 | 2.5 | ||||||||||
| Habitat quality | H1 | 1.5 | 2.5 | 1.7 | 2.3 | |||||||
| H2 | 1.5 | 1.5 | ||||||||||
| H3 | 2.0 | 3.0 | ||||||||||
| H4 | 2.0 | 3.0 | ||||||||||
| H5 | 1.5 | 1.5 | ||||||||||
| Biodiversity | B1 | 2.0 | 2.0 | 2.0 | 2.0 | |||||||
| Socio-economic benefit | E1 | 2.0 | 2.5 | 2.0 | 2.5 | |||||||
Publisher’s Note: MDPI stays neutral with regard to jurisdictional claims in published maps and institutional affiliations. |
© 2021 by the authors. Licensee MDPI, Basel, Switzerland. This article is an open access article distributed under the terms and conditions of the Creative Commons Attribution (CC BY) license (https://creativecommons.org/licenses/by/4.0/).
Share and Cite
Kang, H.; Zhang, C.-I. A Concept and Framework of the Extended Ecosystem-Based Fisheries Assessment Approach Incorporating Other Driving Forces. J. Mar. Sci. Eng. 2021, 9, 545. https://0-doi-org.brum.beds.ac.uk/10.3390/jmse9050545
Kang H, Zhang C-I. A Concept and Framework of the Extended Ecosystem-Based Fisheries Assessment Approach Incorporating Other Driving Forces. Journal of Marine Science and Engineering. 2021; 9(5):545. https://0-doi-org.brum.beds.ac.uk/10.3390/jmse9050545
Chicago/Turabian StyleKang, Heejoong, and Chang-Ik Zhang. 2021. "A Concept and Framework of the Extended Ecosystem-Based Fisheries Assessment Approach Incorporating Other Driving Forces" Journal of Marine Science and Engineering 9, no. 5: 545. https://0-doi-org.brum.beds.ac.uk/10.3390/jmse9050545