Article

Critical In-Water Habitats for Post-Nesting Sea Turtles from the Southern Gulf of Mexico

by
Abigail Uribe-Martínez
1,2,
María de los Angeles Liceaga-Correa
1,* and
Eduardo Cuevas
1,2,3,*
1
Centro de Investigación y de Estudios Avanzados del Instituto Politécnico Nacional, Departamento de Recursos del Mar, Unidad Mérida, Merida 97310, Mexico
2
Facultad de Ciencias Naturales, Universidad Autónoma del Carmen, Ciudad del Carmen 24155, Mexico
3
Centro de Investigación de Ciencias Ambientales, Facultad de Ciencias Naturales, CONACYT-Universidad Autónoma del Carmen, Ciudad del Carmen 24155, Mexico
*
Authors to whom correspondence should be addressed.
J. Mar. Sci. Eng. 2021, 9(8), 793; https://0-doi-org.brum.beds.ac.uk/10.3390/jmse9080793
Submission received: 24 May 2021 / Revised: 1 July 2021 / Accepted: 4 July 2021 / Published: 23 July 2021
(This article belongs to the Special Issue Frontiers in Marine Animal Telemetry Research)

Abstract

:
Marine turtles are globally endangered species that spend more than 95% of their life cycle in in-water habitats. Nevertheless, most of the conservation, recovery and research efforts have targeted the on-land habitats, due to their easier access, where adult females lay their eggs. Targeting the large knowledge gaps on the in-water critical habitats of turtles, particularly in the Large Marine Ecosystem Gulf of Mexico, is crucial for their conservation and recovery in the long term. We used satellite telemetry to track 85 nesting females from their beaches after they nested to identify their feeding and residency habitats, their migratory corridors and to describe the context for those areas. We delimited major migratory corridors in the southern Gulf of Mexico and West Caribbean and described physical features of internesting and feeding home ranges located mainly around the Yucatan Peninsula and Veracruz, Mexico. We also contributed by describing general aggregation and movement patterns for the four marine turtle species in the Atlantic, expanding the knowledge of the studied species. Several tracked individuals emigrated from the Gulf of Mexico to as far as Nicaragua, Honduras, and the Bahamas. This information is critical for identifying gaps in marine protection and for deciphering the spatial connectivity in large ocean basins, and it provides an opportunity to assess potential impacts on marine turtle populations and their habitats.

1. Introduction

Restoration and conservation of endangered marine animal populations require large management efforts that may be better established and implemented from the perspective of marine spatial planning [1,2]. Large marine species groups (mammals, reptiles, birds, and fishes) have wide distribution ranges, and their conservation requires the comprehension of numerous coastal and marine ecosystems, together with national and multinational coordinated protection initiatives.
Sea turtles are pantropical and highly migratory large marine vertebrates that use sandy beaches and different pelagic and neritic habitats throughout their life cycle, and they require specific physical and biological conditions in their different habitats to successfully survive and maintain the viability of their populations in the long term [3,4]. The Gulf of Mexico (GoM) and the adjacent waters of the West Caribbean (WC) are important areas of distribution for these species, and some of the most important nesting populations in the world for hawksbill (Eretmochelys imbricata), green (Chelonia mydas), loggerhead (Caretta caretta), Kemp’s ridley (Lepidochelys kempii), and leatherback (Dermochelys coriacea) turtles occur in these regions [5,6,7,8,9].
The GoM is cataloged as a Large Ecosystem [10,11], and together with the WC, it harbors sea turtle populations that use the different habitats of GoM for development, feeding, sheltering, migration, mating, and nesting. While these reptiles are highly migratory, including multiple movements from residency sites to their mating and nesting beaches and back [12], they also display gregarious spatial distribution patterns, with individuals staying close together at their final residency sites, and they restrict their movements to an area where they can satisfy their needs during that life stage [13,14]. The Mexican Law (the General Law for Wildlife) defines such critical habitats as spatially restricted areas used by endangered species for feeding, resting, nursing, mating, or migrating, and they require special management and protection [15]. These aggregations are usually formed by individuals of more than one species and from distinct geographic and population origins, forming what is known as mix-stock aggregations [16,17,18].
Although there is a major need to increase the knowledge about the least studied groups of in-water sea turtle populations (immatures and reproductive males) [19,20], it is also recognized that the adult reproductive females segment has the highest value in terms of species recovery [21], making it vital to understand their spatial distribution patterns.
Sea turtle critical habitats can be located at distant and remote locations that pose a large challenge in studying them as it requires specialized and expensive resources. In this sense, animal telemetry has revolutionized the study of marine fauna movement, particularly satellite telemetry for studying large marine vertebrates such as sea turtles [22,23,24,25].
The spatial and movement ecology of sea turtles has been extensively studied using satellite tracking technology, including studies in the Caribbean Sea and GoM in the western Atlantic [18,26,27,28,29,30,31]; nevertheless, most of these studies have historically concentrated on the nesting beaches and in-water areas in the northern Gulf of Mexico, mainly due to funding availability. Some of these studies included evaluating the association of turtle movement with oceanographic features [32,33], threat impacts [31,34,35,36,37], and conservation and management information [38,39,40].
Previous studies have described the main threats to sea turtle populations and their habitats in the GoM and WC [36,41,42]. Some of the biggest concerns are the fishing and oil industry because of their severity and geographic scope [43,44,45]. Particularly in the GoM, vastly developed oil and fishing industries exist, which represent some of the major economic activities for Mexico and the USA, and they are the main resources for coastal human populations. However, these industries also pose very important threats for many large marine species, especially when their practices are not well regulated, or detrimental incidents occur [46].
In this sense, one of the global research priorities for sea turtles [47] is to increase our knowledge on their spatial distribution and movement, including the location of their single and multispecies aggregations. Therefore, information regarding the distribution areas of these protected species is vital to design strategies for conservation, management, threat mitigation, environmental contingency containment and ultimate restoration of their populations [48].
The objectives of this study were (i) to identify and spatially delimit the areas used during the internesting and feeding/residency stages by post-nesting individuals of four sea turtle species from their nesting beaches at the Mexican Atlantic littoral; (ii) to delimit their migratory corridors; and (iii) to describe the physical features of their home ranges and compare them among species. We used satellite telemetry for the location data acquisition, then movement and spatial ecology analysis techniques were applied for home range delimitation, and finally, multivariate statistics were used for describing spatial and ecological patterns of the critical habitats for sea turtles.

2. Materials and Methods

2.1. Study Area

Eighty-five (n = 85) post-nesting sea turtle females were captured and released from 47 nesting beaches in five Mexican states (Tamaulipas, Veracruz, Campeche, Yucatan, and Quintana Roo). The geographic scope of their movements was framed by the extreme coordinates 12.0°–30.5° N and −78.65°–−23.85° W (Figure 1).
The nesting beaches were selected based on their specific relevance in terms of the annual nesting numbers per species [6], as well as the occurring species and number of individuals tracked in past studies [26,49,50]. We aimed to track the individuals from the species and beaches underrepresented in previous studies and to verify the migratory patterns of individuals from large beaches where a few post-nesting individuals were previously tracked.

2.2. Turtle Tracking and Data Processing

Between April and September of 2016 and 2017, 85 satellite transmitters with the ARGOS system were attached to 85 post-nesting females of the hawksbill (N = 21, E. imbricata), green (N = 43, C. mydas), loggerhead (N = 12, C. caretta) and Kemp’s ridley (N = 9, L. kempii) species. Of those transmitters, 58 were TAM4510-3 Telonics, Inc., 15 were SPOT 352-B, 12 were SPLASH 10-309A tags, the last two models were manufactured by Wildlife Computers. Since all the transmitters operated with the ARGOS location system and were in the same broad geographic area, the general characteristics of the geographic coordinates were assumed to be standard, and the data processing was the same for all cases.
The females were randomly selected as they came out the sea for nesting, and after they finished laying their eggs, the individuals were captured, and the satellite tags were attached [51]. Once the individual was secured, any epibiont on the first two supracaudal scutes on the central dorsal line at the cranial extreme was manually removed, as it was the tag attachment area. Then, the carapace of the individual was measured using a flexible measuring tape, and then the area was repeatedly washed with fresh water and gently sanded to increase surface porosity. The attachment area was cleaned with alcohol of pharmaceutical level and dried with clean absorbent paper. The tags were attached using fast cure epoxy glue (Devco 5 min©), covered with fiberglass strips glued with the same epoxy, and a final covering of epoxy clay (Loctite Magic Steel©) at the tag base was done. Marine antifouling paint was applied after glue and clay cured, and the post-nesting individuals were released at the same point where they were captured.
The location records were collected through the standard telnet service by the Collecte Localisation Satellite (CLS). All records were standardized into an Access database and processed with R scripts [52] to address differences in the raw data provided by each tag model. ARGOS location classes (LC), i.e., 3, 2, 1, 0, A and B were used for these analyses, as an important and large proportion of the received locations are usually A and B. Records LC Z were excluded. CLS [53,54,55] established that the size of the error ellipse of the latter LCs while is larger than the others, they can also be accurate as the location is actually somewhere inside an error bi-variate ellipse around what it is expected to be the real location point, assuming that the smaller the ellipse, smaller the error.
If LC A and B are not considered, it is documented that up to 40% of recorded data is lost [55], such data loss should be minimized for a very expensive technology. CLS also implemented the Kalman filtering which significantly improved the A and B LC [55,56,57]. Finally, Boyd and Brightsmith [55] demonstrated that LC A accuracy is comparable to LC 1. Therefore, we included LCs A and B given the technological improvements, the large scale of the movements by large marine vertebrates [55], the fact that we applied additional filters, the algorithms implemented by CLS that have significantly improved data accuracy, and that other sea turtle tracking studies in the GoM [27,58] have successfully used the same location classes. Finally, the home range estimation from kernel utilization distributions also contends with outlier data; nevertheless, we acknowledge a possible area overestimation.
The location records were filtered to remove those values that are not coherent or realistic according to the known movement behavior by marine turtles [59,60]. To do so, we used the algorithm described in MacConnell et al. [61] implemented in the vmask function in the R argosfilter package [54], and we defined a filtering threshold of 5 km/h between two consecutive location records [62]. The same speed value was used for the four species as the threshold is wide enough as to include the usual behavior by all of them. In addition, any recordings on land were deleted using a land mask built from Global Administrative Areas [63]. A final visual verification was performed for extreme locations or odd turns on a linear track representation of each animal track.
As in other studies [26,42,64], all the location records for each of the tracked individuals were visually classified as either migrating (directed movement), internesting (areas where the movements were spatially restricted close to their nesting beach), or foraging (spatially restricted movements after migrating). The latter was also considered their residency area.

2.3. Critical Habitats Delineation

After filtering the point data for the tracked individuals, they were analyzed individually, considering the three identified stages (internesting, migrating and feeding/residency), for subsequent quantitative analyses.
For the locations categorized as feeding and internesting for each individual, kernel utilization distributions (KUD) [65] were calculated for both groups using the kernelUD function implemented in the R adehabitatHR package [66]. We used a spatial resolution of 1 km for the basis grid, and a smoothing factor (h) was calculated using the ad hoc method. The estimated home ranges were obtained based on the 80% isopleth of each KUD, which was assumed to be high enough to contribute managing the average location error by the ARGOS system [67,68]. For each individual, we also analyzed the core home range area used (50%) [18] to contrast with other studies. For both types of areas, the size was obtained using a metric projection (Lambert Conformal Conic) in square kilometers.
On the other hand, regarding the individuals’ movements, as the migratory location records are not regularly acquired because of their diving behavior, temporal and spatial discontinuities on the track may hinder the definition of the moving path.
In this study, the migratory location records were processed for each individual using the Brownian Bridge Movement Model (BBMM) to build a space-use surface [69]. The BBMM is based on conditional random walks that consider the elapsed time between the consecutive pairs of location records to calculate a probability surface showing the path an individual may have used to move between those locations, rather than having just fixed locations and assume a direct linear movement between them. The shorter the time elapsed between two consecutive locations (higher certainty), the narrower the possible used area; and on the contrary (Figure S1).
We used the brownian.bridge function implemented in the R package BBMM [70], with a fixed error location of 300 m based on the mean error estimated for the three tag models in this region [53] and a maximum time lag of 5000 min (3.47 days). These analyses were performed for each individual independently, a 90% isoline of space use from the created probability surface was considered to delimit the most likely area the satellite-tracked individuals used when moving between locations. Given the latter probability threshold, we obtained individual migratory polygons, and the dissolved spatial union of those polygons was assumed to be migratory corridors for these species [42,59]. Finally, we counted the number of individual polygons that intersected and used the Jenks distribution for defining categories that minimized the variability at their interior and maximized the difference among them. We defined four usage levels (low, medium, high, and very high) [71].
As evidence of the spatial connectivity and large-scale movements by sea turtles, we quantified the number of individuals moving from the Mexican Atlantic littoral towards other national waters outside the Mexican exclusive economic zone to establish as their final location. We had as destination regions the Gulf of Mexico (Cuba, EEUU, Mexico), Caribbean (particularly Belize, Nicaragua, and Honduras), and the Atlantic (the Bahamas Archipelago); and we also did the analysis at the country level.

2.4. Physical Features of Critical Habitats

To describe the physical environmental features of the critical areas for sea turtles, we used the previously delimited areas and evaluated some of the most common physical variables that influence megavertebrate movements and distribution patterns [42,64,72].
As location records are not systematic samples of the distribution of an individual, we implemented a sampling grid of 30 points that were regularly distributed inside the home range area (80% isopleth of the KUD) for each individual. On the other hand, the spatial characterization of sea turtle migrations was performed using sampling points every 10 km along a line that connected the consecutive location record classified as migrating.
The physical variables were the distance to the closest coast, bathymetry, and sea floor slope. While other studies have included nocturnal sea surface temperature and mean net primary productivity in their analysis, the known oceanic variability for the south GoM and WC, where main aggregations occurred, is low, and no differentiating conditions for sea turtle critical habitats were expected for those variables [73,74,75].
The closest coast to the critical habitats was defined using the Global Administrative Areas and the gDistance function was implemented for R [76], where the Cartesian minimum distance from each sampling point in the home ranges was obtained. The depth values were obtained using the GEBCO_2014 [77] grid (1 degree pixel size). This same bathymetry grid was transformed to seafloor slope percentage (Slope in Spatial Analyst Tools for ArcGIS v3.10), which was calculated by estimating the rise between two points, dividing the value by the distance between the two points, and multiplying it by 100. We built data matrices that included the values of physical variables for all the sampling points per individual and per migration stage, and this dataset was used to estimate the median and quantiles (because the data did not show a normal distribution) of each of these variables, per stage and species. In the case of migration corridors, we also obtained the total length (distance from the release point to the last location received), and mean speed for each individual during this stage.
We evaluated the statistical differences in the physical variables for the home range areas among species by applying the Kruskal–Wallis and Chi-square test, and pairwise Wilcoxon Rank Sum tests with adjustments for multiple testing, using the Benjamini method implemented in R.

2.5. Movement and Aggregation Patterns

Undoubtedly, the description of movements and aggregation patterns is highly relevant to understand how these species use the marine territory and discern patterns of how they may interact with their environment.
With the aim to identify patterns of individuals aggregation for these species, we built a data matrix with descriptive statistics (minimum, maximum, average, standard deviation, range) of the physical features for each individual feeding habitat, and another one with the descriptive statistics of the physical data for individual migratory tracks. For the latter, we added the length of the migration, average speed, and the destination region as a dummy variable. For standardization purposes, both matrices were 4th root transformed.
In order to define clusters of aggregation and movement patterns, a Euclidean dissimilarity matrix was built for both matrices, then a group average classification analysis was done, including a SIMPROF test (α = 0.5) that ran on the clusters to test their statistical significance. Finally, in order to know the quantitative assemblage of the variables configuring the clusters, a SIMPER test was performed to calculate the contribution of each variable to the final classification. All this multivariate analysis was performed using the program PRIMER7 (v.7.0.17, PRIMER-e, Albany, Auckland, New Zealand).

3. Results

In-water critical areas were identified and delimited for post-nesting sea turtle individuals of four different species from southern GoM and WC. Areas with the highest use were identified inside and outside these areas, and we characterized their spatial and movement patterns.
Green turtle individuals had the largest minimum carapace length (mean = 104.94 cm ± 6.81), while the Kemp’s ridley individuals had the smallest (mean = 64.41 cm ± 3.66) (Figure S2). The tagging period varied for each species according to their nesting season in this region, which was from April–May for the Kemp’s ridleys, May–June for the hawksbills and loggerheads, and July–August for the green turtles.

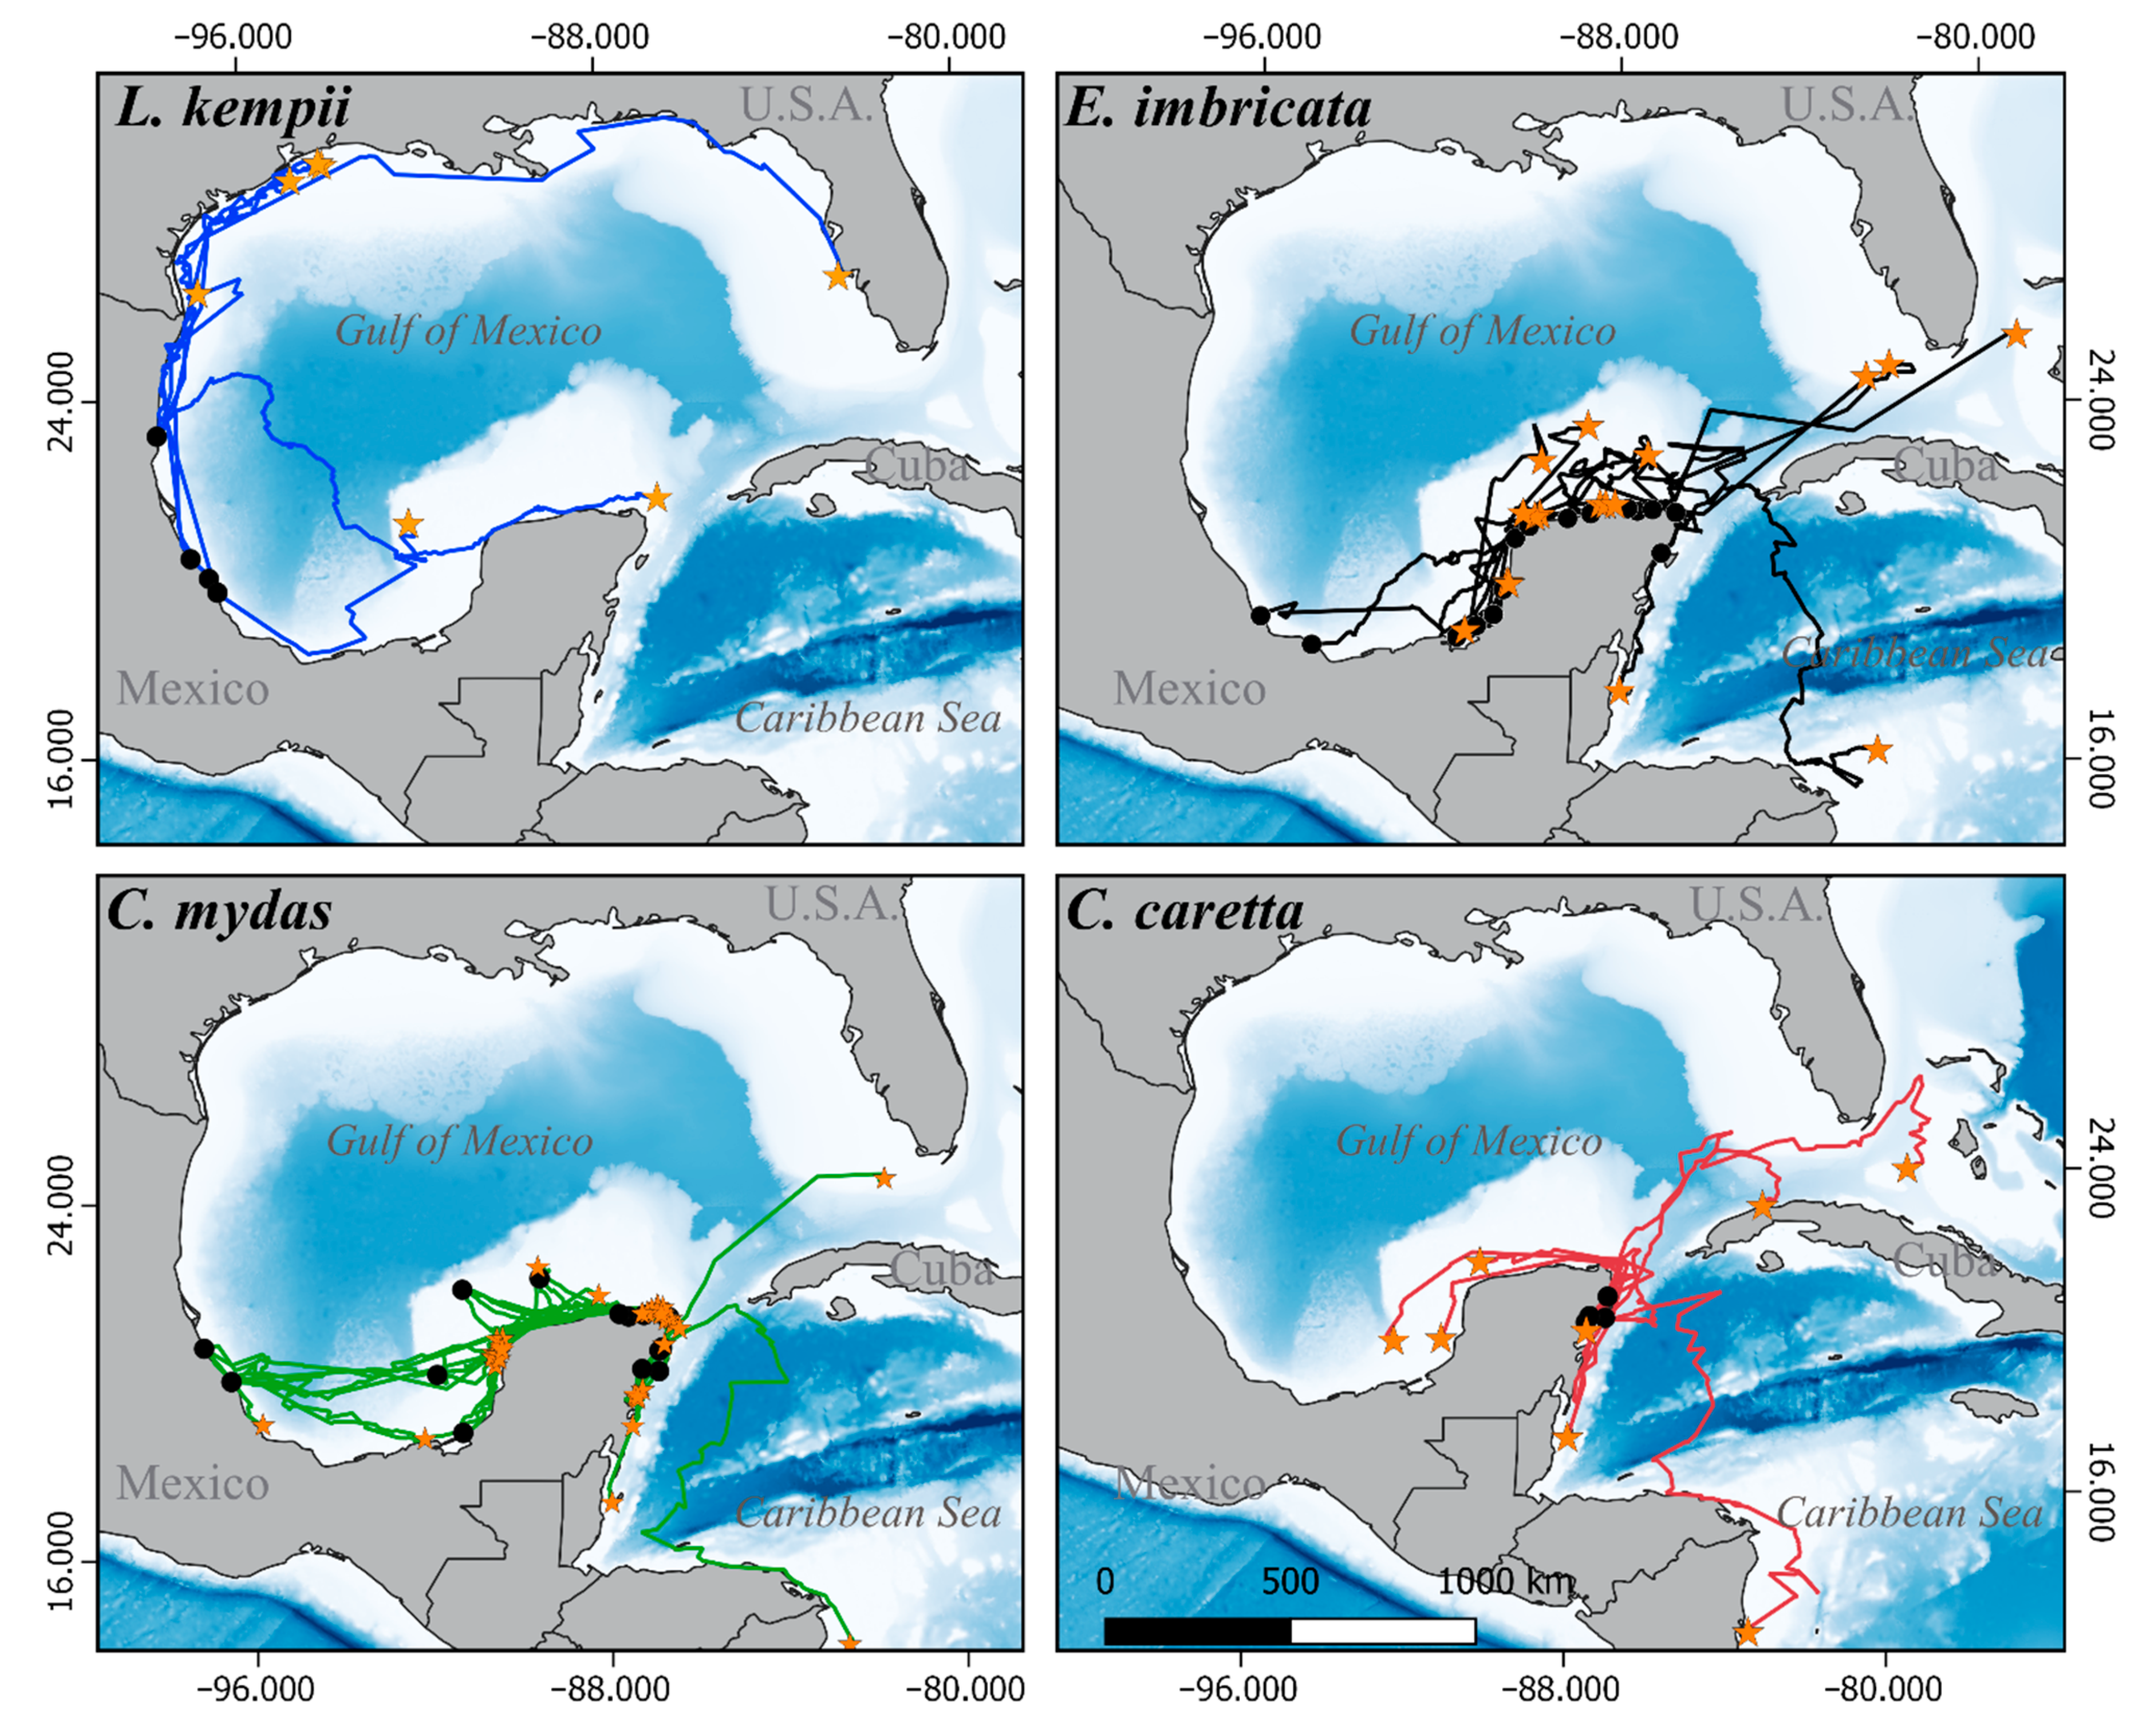
3.1. Satellite Tracking

The overall average tracking duration was 262.44 days (± 23.61 (SD)), and 35,763 location records were obtained after the filtering process, and those were used to define the critical habitats for these individuals (Table S1). Of the 85 individuals, 76 (89%) displayed internesting spatial behavior, and 64 (75%) displayed spatially restricted movements after migrating that were labeled as “foraging areas”. We were able to track only 69 migratory routes, due to lack of enough points along the movement of the other individuals (Figure 1).
Kemp’s ridley was the species that traveled the longest average distance (Table S2), followed by loggerheads, while hawksbills and greens had the shortest travels. Nevertheless, at least one individual of each species traveled more than 1500 km to their final feeding and residency habitats. A Kemp’s ridley made the longest trip of all the tracked individuals in this study (2700 km), traveling close to the shore of central Veracruz, Mexico, all the way to the north until reaching the central Florida shelf (Figure 1).

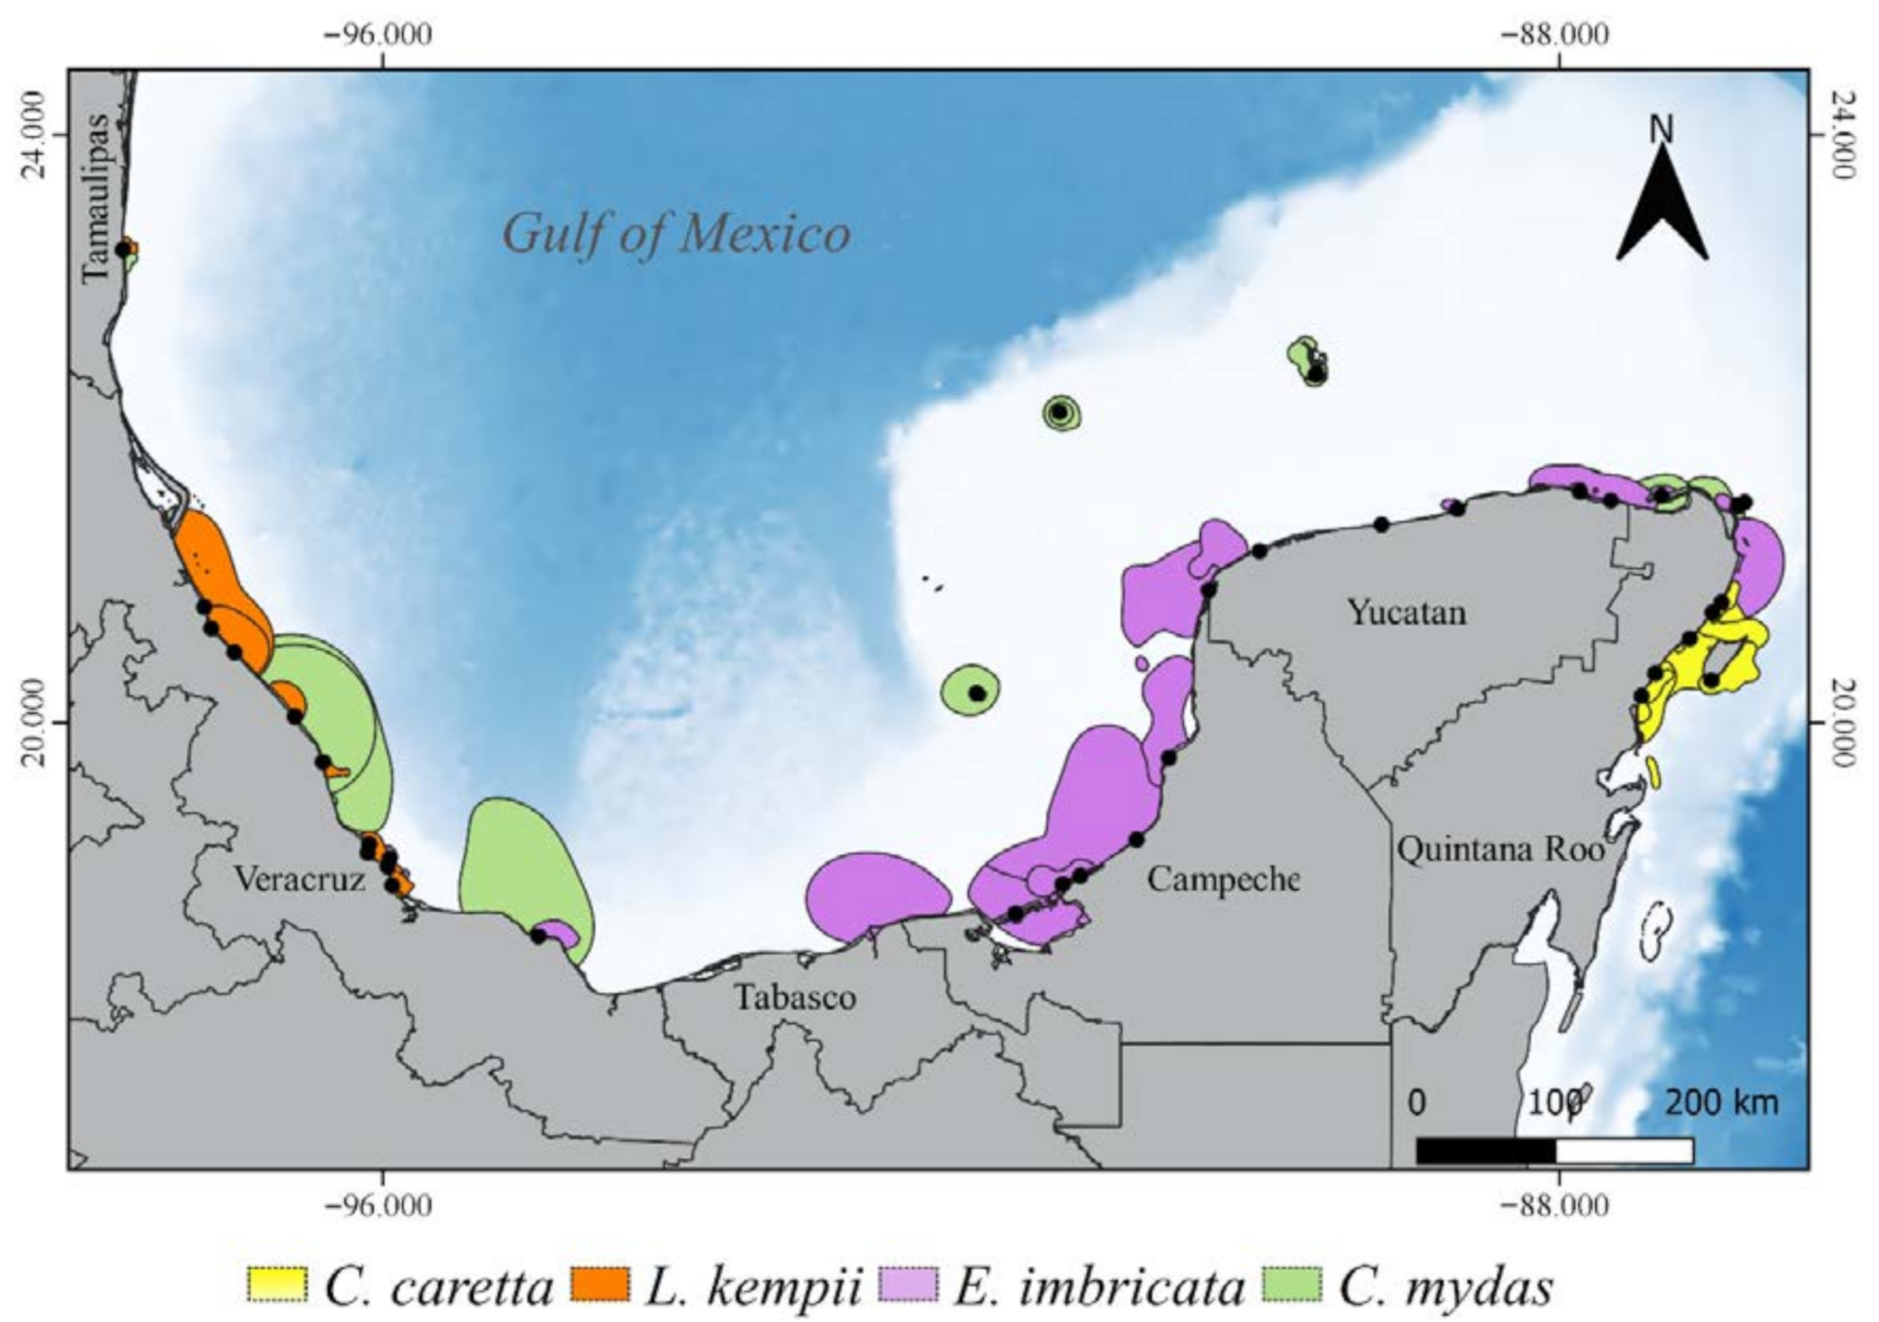
3.2. Critical Habitats Delineation

As several of the studied nesting beaches receive females of more than one species, internesting areas of different species overlapped, particularly with the Kemp’s ridley and green turtles at Veracruz (southwestern GoM), which was similar to loggerhead and hawksbill turtles at Quintana Roo (WC), and green and hawksbills at northeastern Yucatan Peninsula (Figure 2). On the west coast of the Yucatan Peninsula (Campeche), we could delimit internesting areas only for hawksbills, and at the cays in the Campeche Bank, including Alacranes Reef, only green turtle internesting areas were delimited.
Kemp’s ridleys and loggerheads also displayed the largest mean internesting areas, which was larger than 1000 km2, followed by hawksbills and greens (Table S3). When all the individual home ranges were joined in combined polygons, hawksbills covered the largest area during the internesting episodes, followed by green turtles (Figure 2).
On the other hand, most of the feeding and residency areas were around the Yucatan Peninsula and in front of the coast of Tabasco and Veracruz, although the Kemp’s ridleys had very large and important feeding areas in the north GoM. The latter species displayed the largest feeding home ranges, with an overall median value of 3200 km2 (Table S4). Hawksbill and green turtles displayed four to five times smaller mean feeding home ranges. The feeding home range areas were significantly different among some species (Kruskal–Wallis chi-squared = 12.997, df = 3, p < 0.05) (Figure 3, Table S4).
Sixty-five percent of the tracked green turtles established their residency area either at the northeastern (38%) or northwestern (27%) corners of the Yucatan Peninsula. Those areas have the utmost relevance, as they were also used during migratory movements by loggerhead and hawksbill individuals. Three green turtle individuals established their feeding home ranges outside of Mexican waters: one in the Florida Keys, another in Belize and the third in Nicaragua (Figure 1 and Figure 3). On the other hand, most of the hawksbill turtles (83%) established their final residency home ranges north of the Yucatan Peninsula, including some cays on the continental shelf; plus, one individual established at the Florida Keys, particularly on the Marquesas, another at the Bahamas, and a third at the border between Honduras and Nicaragua (Figure 1 and Figure 3).
Most of the loggerheads tracked from WC established their feeding and residency areas on the Campeche Bank inside the GoM (Figure 3), occupying known cays north and northwest of the Yucatan Peninsula, as well as a relatively large area on the continental slope close to Campeche Bay in front of Tabasco and Campeche. Finally, Kemp´s ridleys established residence areas both north (Louisiana and Texas) and south (isolated cays of the Bank of Campeche) GoM and north of WC (Figure 3). We only detected one case of a feeding area overlap between two species, which occurred between loggerheads and hawksbills at the northwestern corner of the Yucatan Peninsula.
While the most common behavior was to only stop until reaching their final residency and feeding area, some individuals had stopover sites (5 E. imbricata, 4 C. caretta, 2 C. mydas and, and 1 L. kempii), where they stayed up to 12 days before they continued migration to their final residency area. Most of the stopovers were at the middle or first third of their migration route, all but one (one loggerhead stopped on oceanic waters of WC) occurred on the continental shelf close to shore or associated with a submerged bank. The individuals of all species but C. mydas that displayed these stopovers completed migration routes between 500 and 1200 km in a straight line from their nesting beach to their final feeding and residency sites, often crossing oceanic ecoregions such the Campeche Bay at south GoM, from Yucatan Peninsula to Florida across the Loop Current, or from WC to Honduras and Nicaragua.
Regarding the migratory corridors, the northern coast of the Yucatan Peninsula harbors one of the most important ones for adult reproductive sea turtle females in the GoM, as individuals of the four species tended to move from the GoM towards the WC (35% overall; 35% C. mydas, 44% E. imbricata, 25% C. caretta and L. kempii) and slightly less so in the opposite direction (13% overall; 11% C. mydas, 28% E. imbricata) (Figure 4), and it is also an important segment of the migratory route from southern regions to the Florida Keys and central America. Additionally, the eastern littoral of the same peninsula represents an important migratory corridor for loggerhead, green and hawksbill turtles moving along the WC, as well as for some individuals moving towards Belize (Figure 4b–d) and out the GoM towards Central America (Honduras and Nicaragua) and the Florida Keys. To reach Central America, hawksbill, green and loggerhead individuals also took routes on oceanic waters, presumably using southward currents in the Caribbean basin, while those moving to Florida traveled along the north coast of the Yucatan Peninsula, entered the Current Loop moving towards the north, then traveled southeast to exit at sites where the current was the closest to the Florida shelf, and traveled to the keys.
Finally, the west GoM (Tamaulipas and Veracruz, Mexico; and Texas, USA) (Figure 4a) was used mainly by Kemp’s ridleys moving from Rancho Nuevo, Tamaulipas towards the south or north. One of the tracked females from the latter beach did not migrate on the continental shelf but crossed the deep basin of the GoM, taking advantage of different cyclonic and anticyclonic gyres (as observed in its migratory pattern), and is the first reported individual of this species which had followed this migratory route on its route to north WC (Figure 1 and Figure 4a).
It is remarkable that the two hawksbill turtles and all but one of the Kemp’s ridleys tracked from Veracruz (n = 8) did not migrate on the continental shelf on their way to the Yucatan Peninsula and the Florida Keys, but instead crossed over the Campeche Bay in waters deeper than 500 m (Figure 4a,c).
The spatial connectivity by migrating individuals showed spatial differences, and in all cases but Kemp’s ridleys, at least one individual of each species went out of the GoM (Figure 1 and Figure 5). The tracked individuals widely used the Mexican exclusive economic zone. Most of the individuals (53%) remained inside the GoM, and only 2% of the females established their feeding habitat in the Caribbean (Car) (Figure 5a) at Nicaragua, Honduras, and Bahamas (Figure 5b).
In terms of the territories of the countries, at least one individual of the four species moved out of the Mexican marine territory, and all species connected the Mexican and U.S. marine territories (Figure 5b). Some of the green, loggerhead and hawksbill individuals crossed over two other marine territories (Cuba, Belize, Honduras) before reaching their final feeding site in Honduras and Nicaragua. These patterns underscore the ecological role of sea turtles in connecting ocean basins and influencing energy fluxes, and they stress the indubitable multinational movements by these megavertebrates.

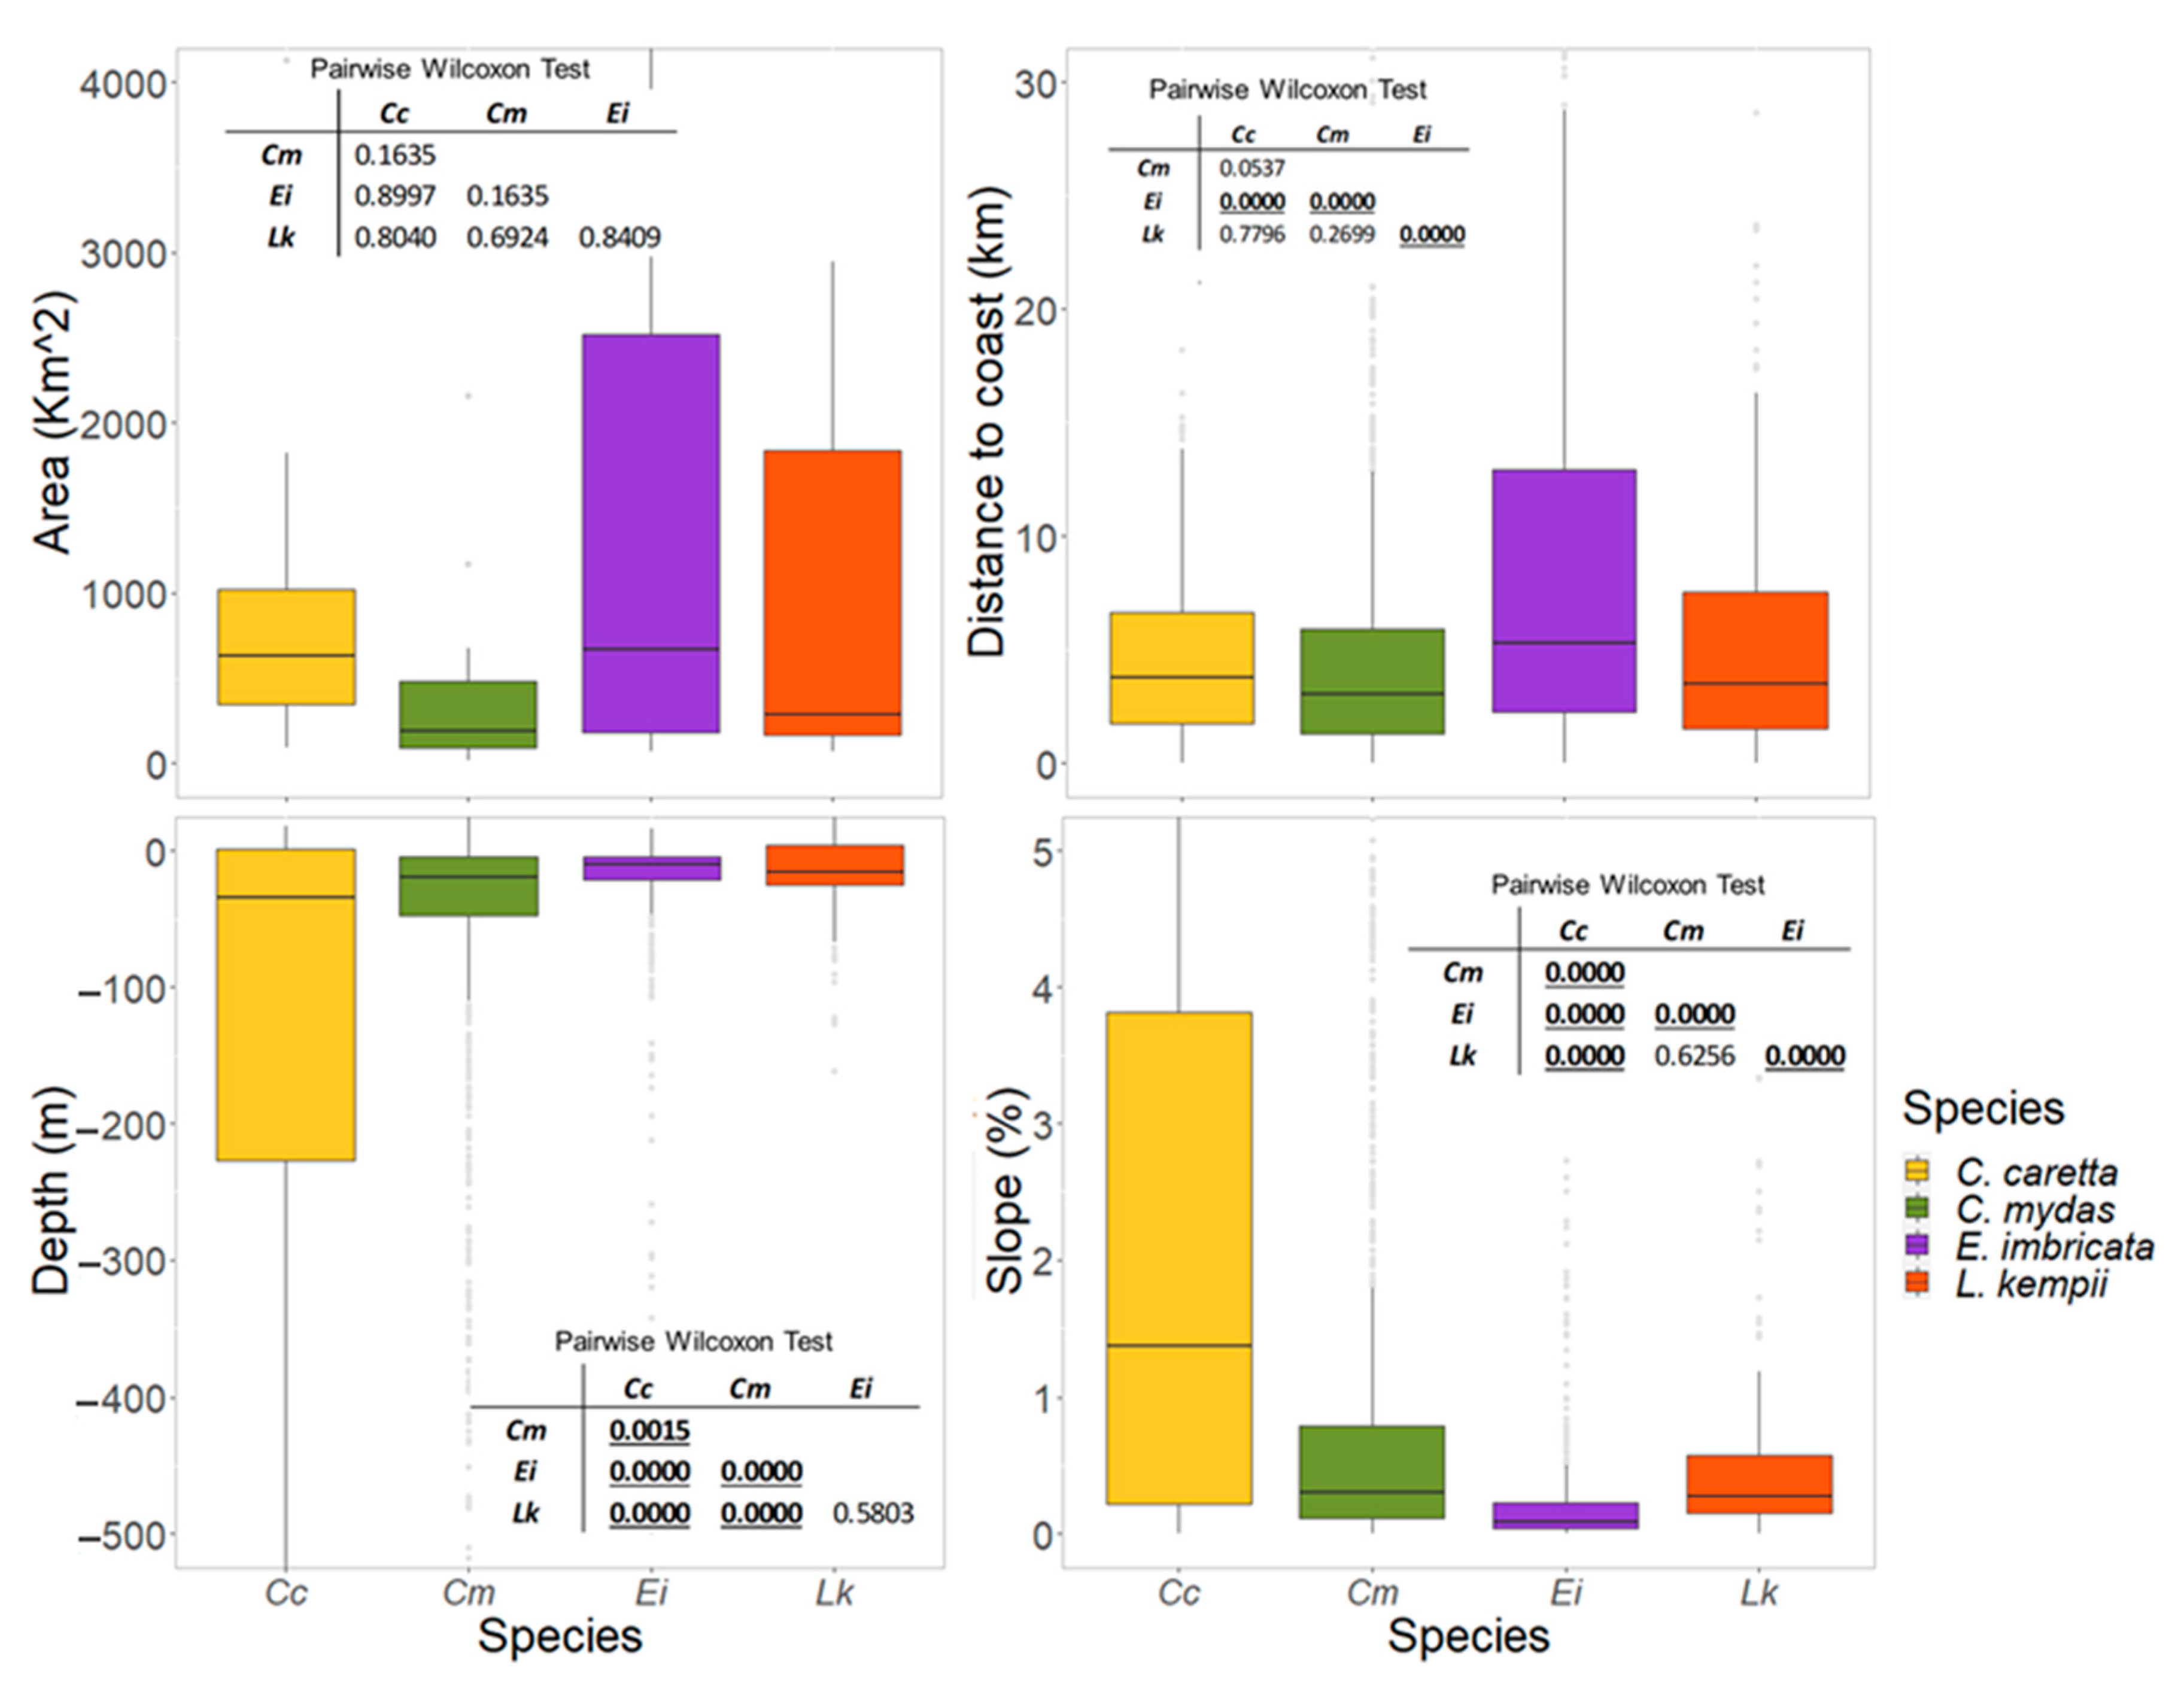
3.3. Physical Features of the Critical Habitats

3.3.1. Internesting Habitats

Hawksbills (median = 670 km2) and Kemp’s ridleys (median = 284 km2) displayed the largest internesting areas and had the largest variability (Figure 6), although they were not significantly different (Kruskal–Wallis chi-squared = 6.9534, df = 3, p-value = 0.0734) from the other two species (Figure 6, Table S3), and greens showed the smallest areas (median = 189 km2).
These habitats were close to shore and adjacent to their nesting beach, mostly located at less than 13 km (Q 75%) from shore. Hawksbills displayed the internesting habitat with the median furthest border from shore (Table S3), and it was significantly different from the other three species (Kruskal–Wallis chi-squared = 83.687, df = 3, p-value < 0.0001) (Figure 6).
In terms of depth and slope, the conditions among species were mostly statistically different (depth: Kruskal–Wallis chi-squared = 64.659, df = 3, p-value < 0.0001; slope: Kruskal–Wallis chi-squared = 368.69, df = 3, p-value < 0.0001), loggerheads showed the highest variability on a very narrow shelf at the Caribbean, while the other species displayed similar patterns (Figure 6).

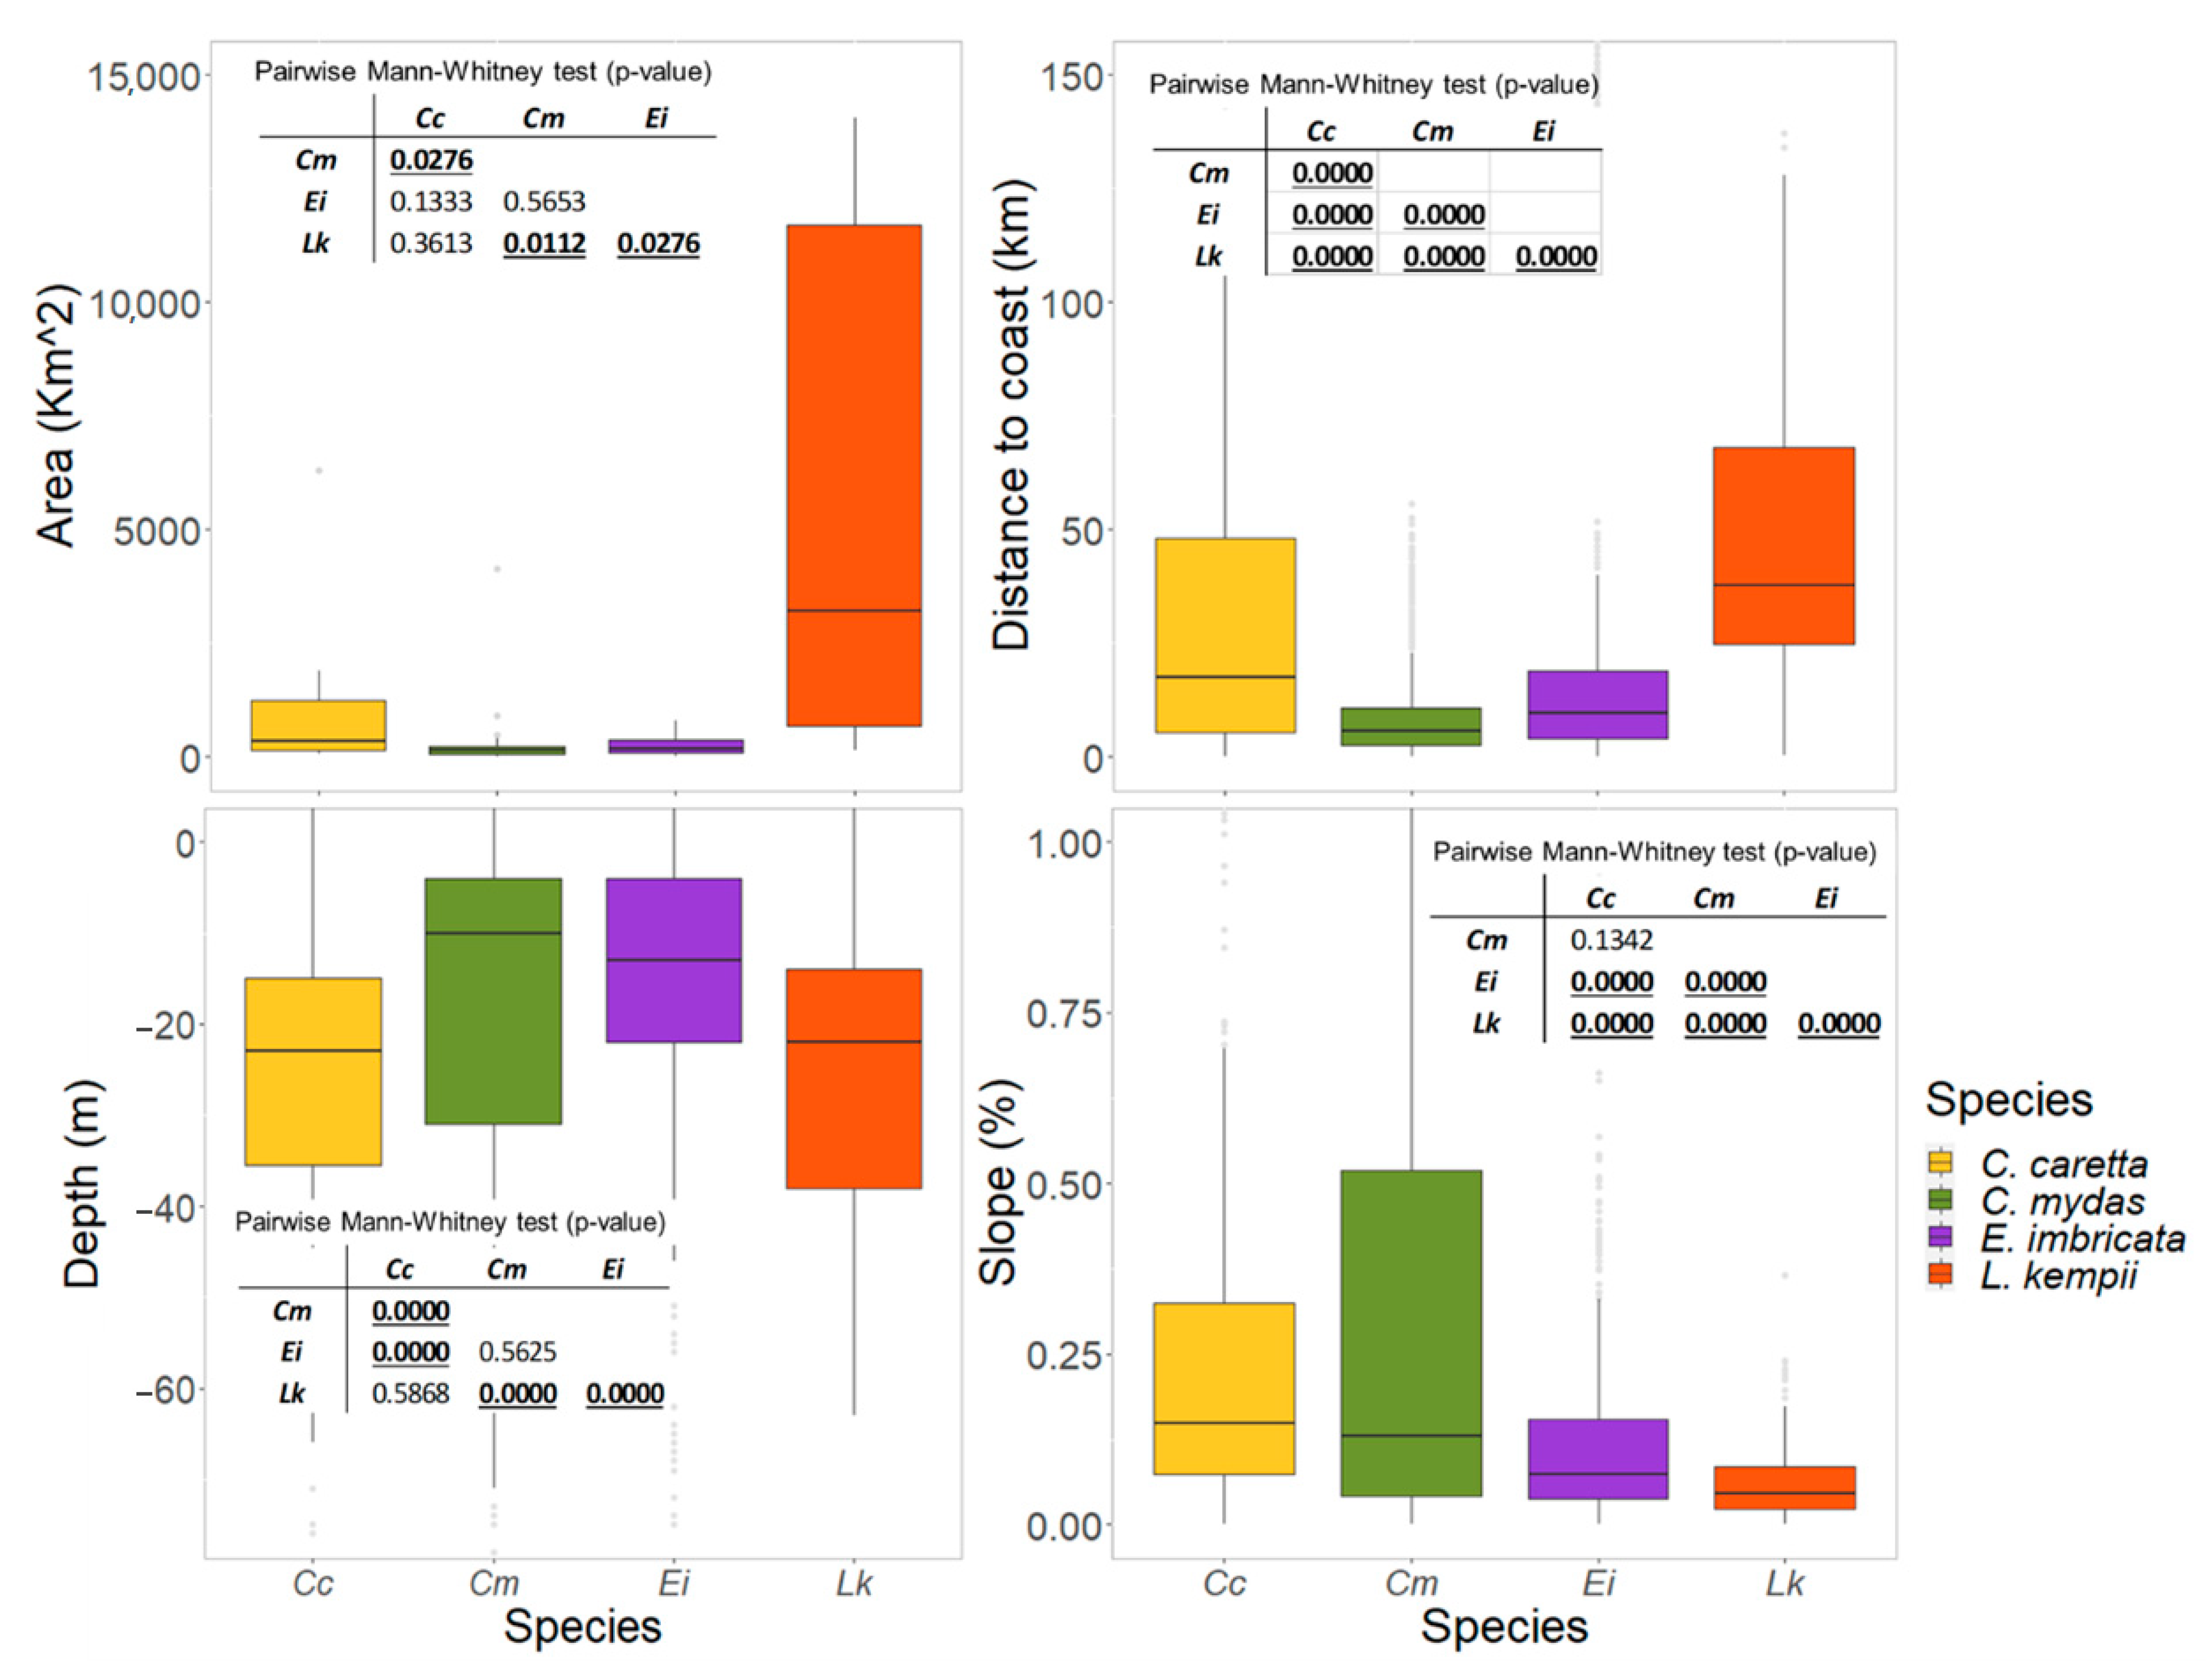
3.3.2. Feeding and Residency Areas

Most feeding home ranges were also established on the continental shelves, although some were located at the upper slope, with significantly larger areas displayed by Kemp’s ridleys (median = 3206 km2, Kruskal–Wallis chi-squared = 12.997, df = 3, p-value = 0.004643), and green turtles. More than 75% of the feeding home ranges were at depths less than 50 m, with very similar conditions for hawksbills and greens, and between loggerheads and Kemp’s ridleys (Figure 7 and Table S4).
The seafloor in feeding habitats for all the species are mainly flat areas and there are significant differences among species (H = 177.92, p < 0.0001). While loggerhead and green turtles showed the highest percentage of slope values (Table S4), hawksbills and Kemp’s ridleys occupied even flatter seafloor areas (Figure 7, Table S4).
The feeding home range areas for greens and hawksbills were at distances shorter than 20 km from shore overall, while the loggerheads and Kemp’s ridleys had feeding areas up to 100 km away from shore, with significant differences between the species (Kruskal–Wallis chi-squared = 346.88, df = 3, p-value < 0.0001) (Figure 7 and Table S4).

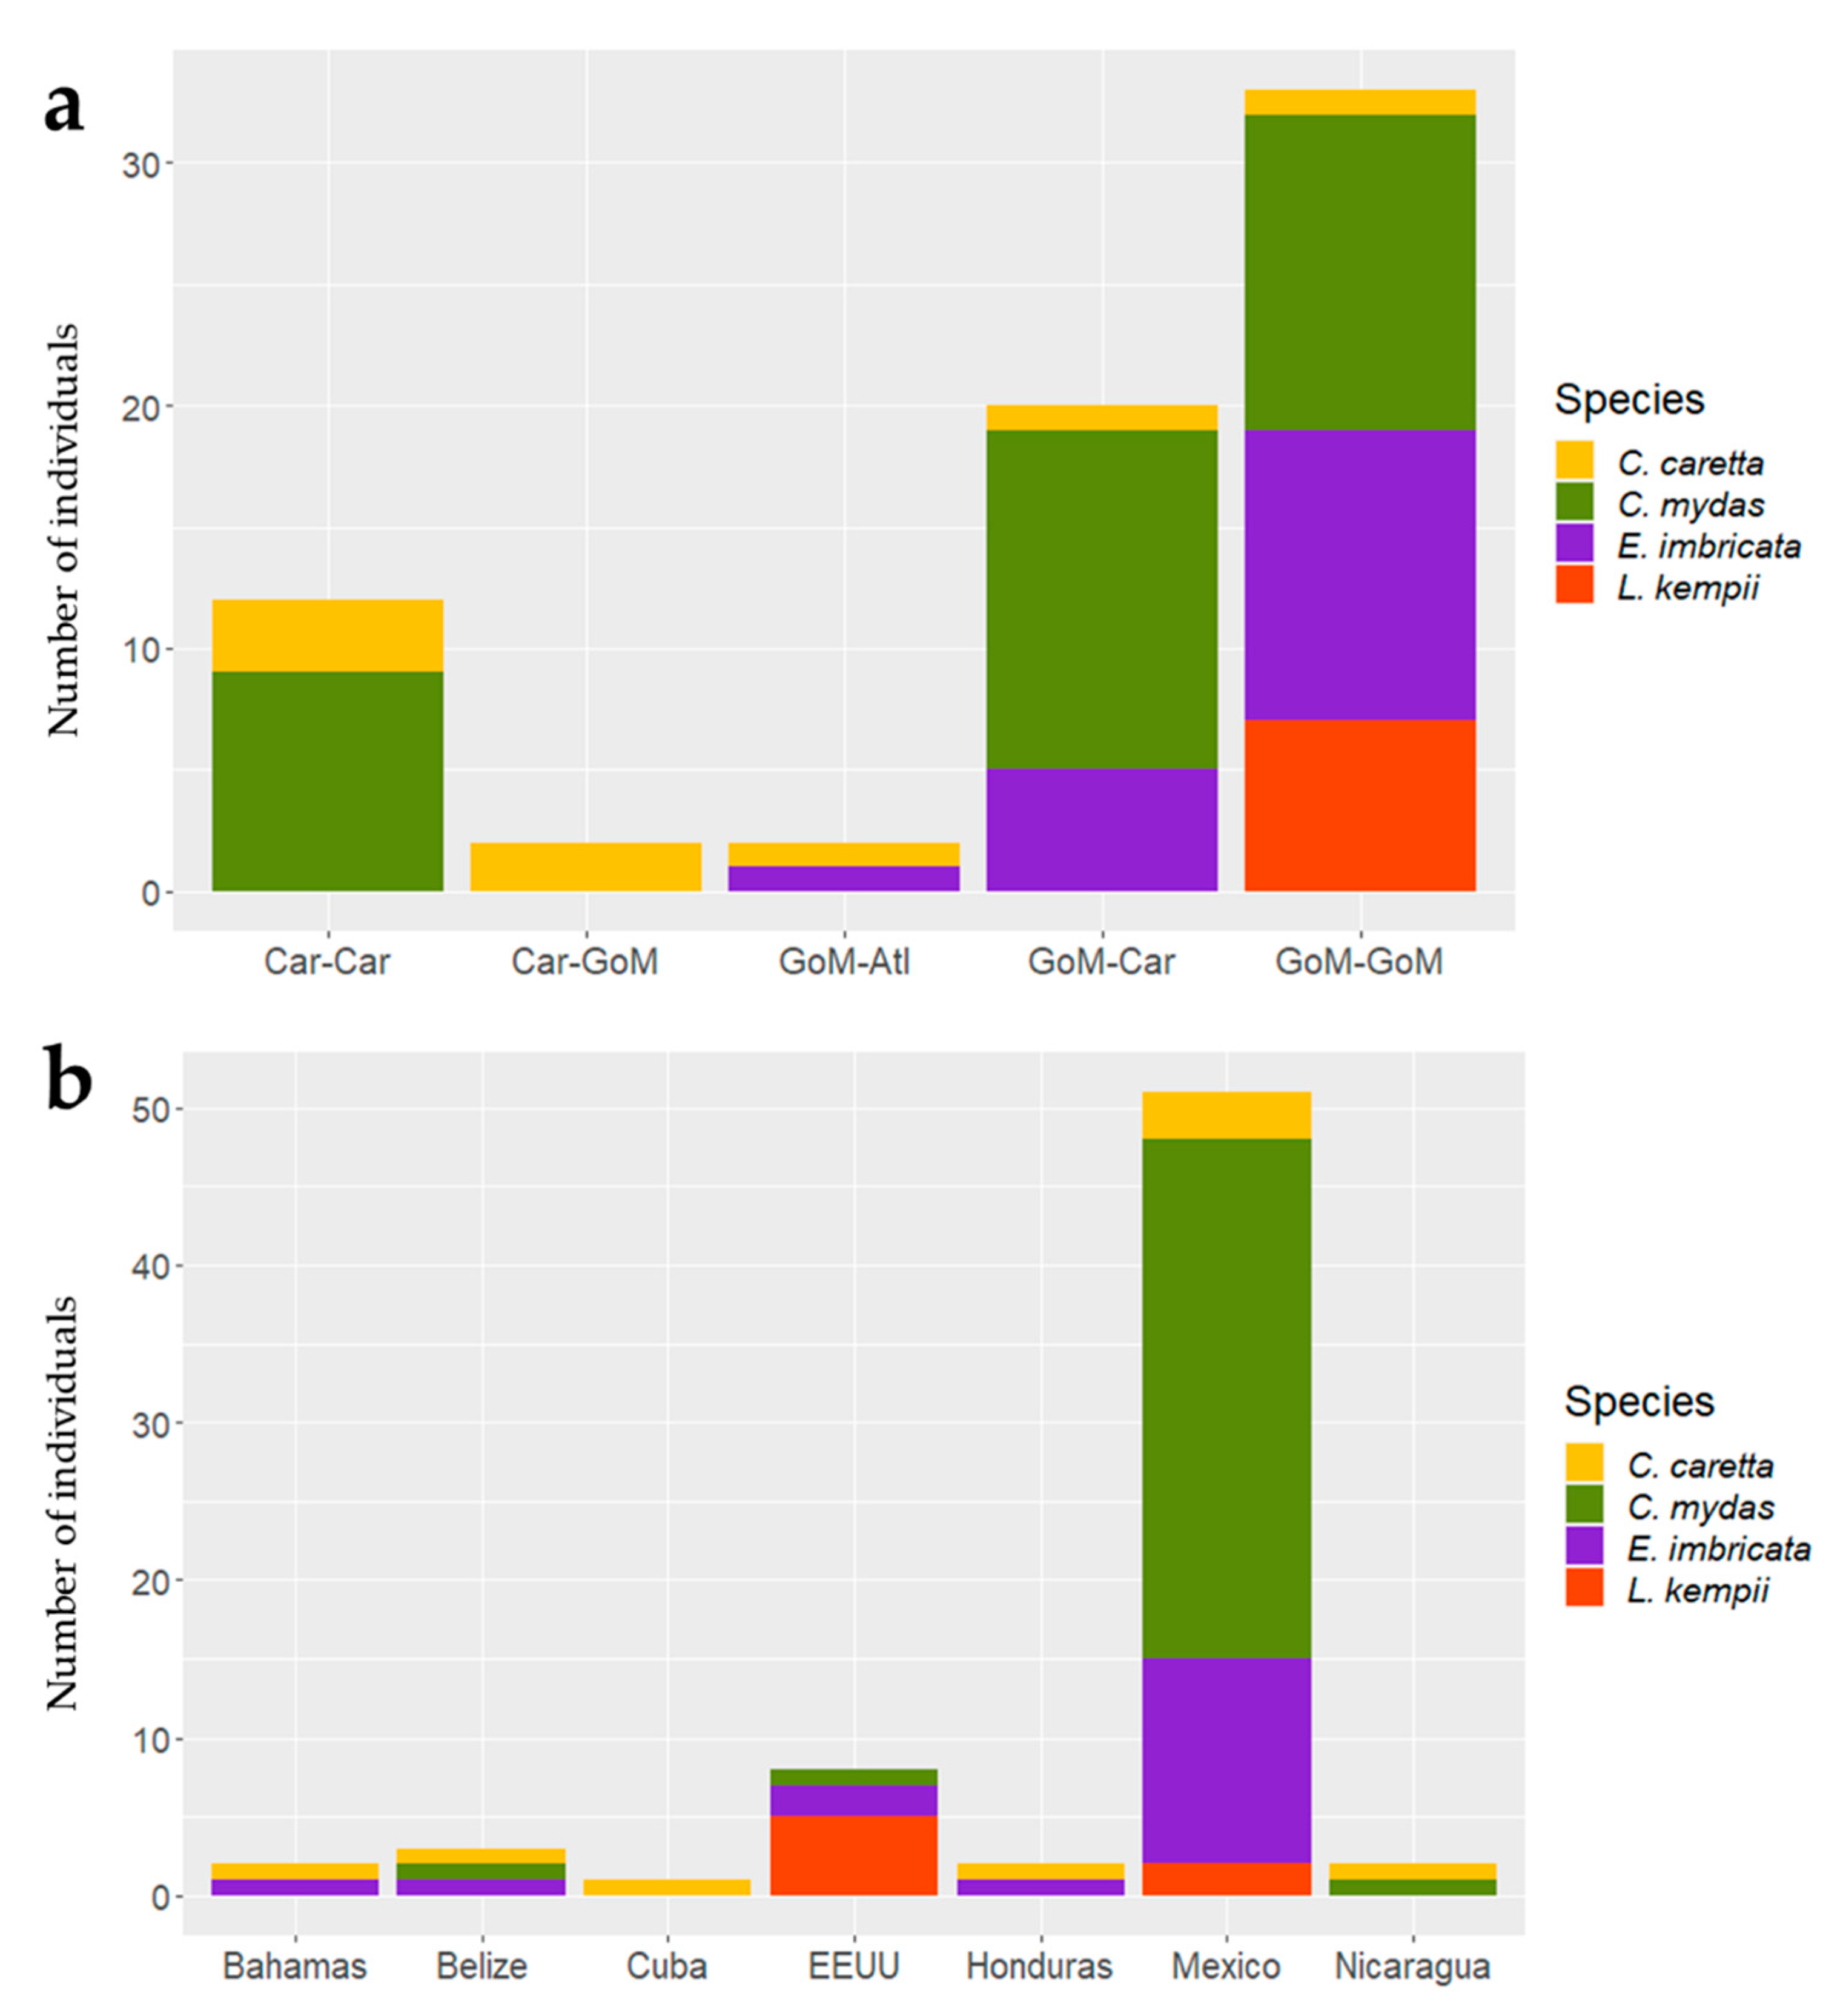
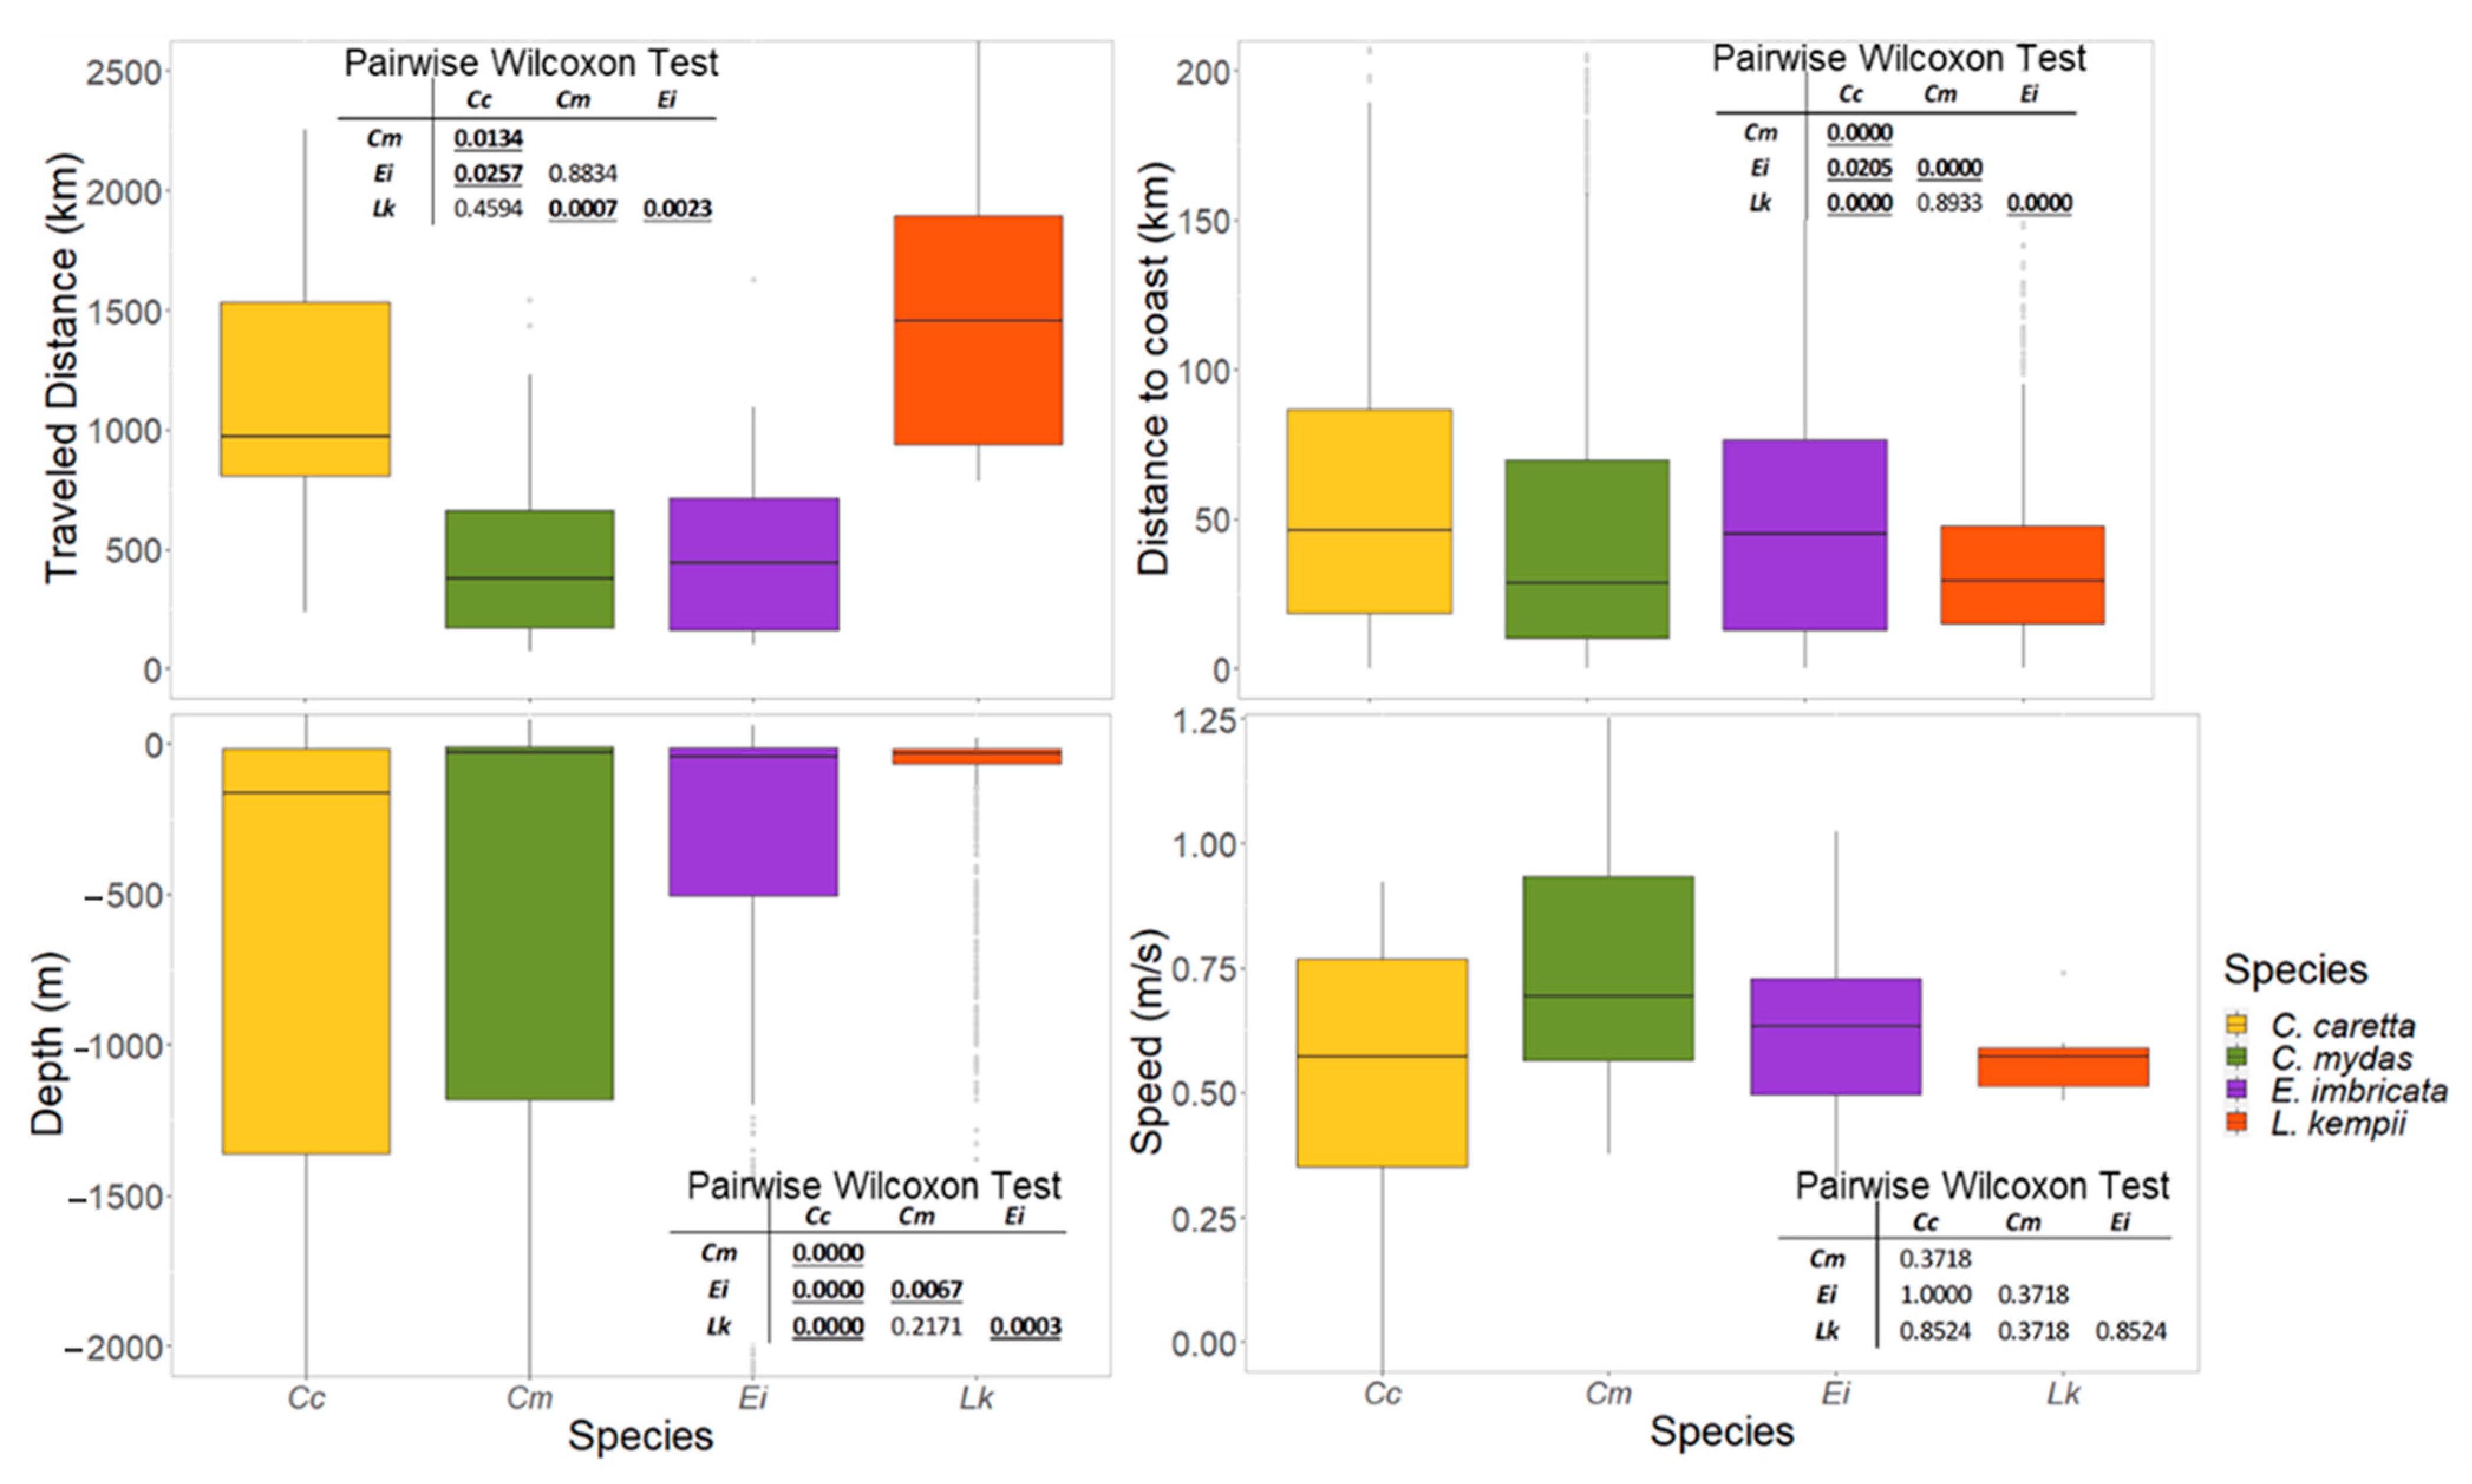
3.3.3. Movement and Aggregation Patterns

We defined six major feeding and residency home range clusters (statistically significant, SIMPROF, α = 0.5), which were formed by individuals of the four different species (Figure S3). The average similarity between the feeding home ranges was 60.04 (±17.5), with the home range area as the largest contributor (50.61% ± 20.00, SIMPER, α = 0.05), followed by the depth (maximum depth = 13.9%, depth range = 13.12% contribution).
Following the multivariate configuration (Figure S3), one of the main home range patterns labeled “a” describes feeding home ranges that are established very close to shore, and they have the smallest areas (17.93 km2 ± 7.82), particularly for green turtle individuals. Another distinctive pattern is “d”, which indicates medium-sized feeding areas (283.50 km2 ± 79.02) on the border of the continental shelf with an average distance of 96 km (± 46.55) from shore, and it was detected for hawksbills, greens and Kemp’s ridleys.
Pattern “h” is characterized by unusually large feeding areas (12,002.28 ± 17,491.84 km2) established in the neritic zone, which was mostly displayed by Kemp’s ridley individuals in the northern GoM but also by some green and loggerhead individuals in the Caribbean (Figure S3b). On the other hand, b, e, f, and g patterns were spatially and statistically similar (mean = 51.39% ± 7.62) and observed for 54% of the tracked individuals. These home ranges are medium sizes and established on the continental shelf with an average distance to shore of <30 km, and they were displayed by individuals of the four species. The home ranges of some loggerheads in this pattern were the only ones on the continental escarpment in southern GoM and the only one established in the Bahamas region.

3.3.4. Migratory Routes

In terms of the overall average distance to shore for the migratory routes, loggerheads and hawksbills traveled the furthest from shore, and the distances were significantly different among species (Kruskal–Wallis chi-squared = 85.011, df = 3, p-value < 0.0001) (Figure 8, Table S2). Loggerheads migrated in the deepest waters of all the species, followed by green turtles (Table S2), and the differences were also statistically significant (Kruskal–Wallis chi-squared = 69.269, df = 3, p-value < 0.0001). Finally, the travel speed was not significantly different among species (Kruskal–Wallis chi-squared = 5.0288, df = 3, p-value = 0.1697).
The classification of the migratory routes suggested 10 clusters (SIMPROF, p < 0.05), eight of which were selected and described because of their consistency in spatial movements (Figure S4). The average similarity value was 84% (SIMPER analysis), and the length of the migrations contributed on average 35.83% (±3.47 S.D.) to the cluster configuration, followed by the average depth (25.82% ± 6.51) and the distance to shore (17.20% ± 2.27).
Pattern “a” is characterized by migrations close to the continental shelf of the Mexican Caribbean, moving between north and south Quintana Roo, Mexico, in short local trips (mean = 164 km), while pattern “b” is formed by one loggerhead and one green turtle individual that migrated from north Quintana Roo (Mexico) to areas in Nicaragua by crossing open ocean waters in the Caribbean Sea. Pattern “d” is mostly dominated by Kemp’s ridley individuals that moved close to shore over the continental shelf with long travel distances (>1,000 km), they mostly moved towards the north GoM and mainly passed in front of the littoral of Texas, Louisiana, and Mississippi; however, one individual reached Alabama and Florida. Similar patterns were displayed by one green turtle moving along the southern GoM continental shelf close to shore, similar to the Kemp’s ridleys, and by one hawksbill individual that migrated from the southwestern Yucatan Peninsula towards the border of the Campeche Bank.
On the other hand, pattern “e” was characterized by individuals moving across open ocean waters and crossing ocean basins through deep waters (>1200 m on average) to reach feeding neritic habitats of the Campeche Bank and the Florida shelf. This pattern was displayed mostly by the green turtles (57%). Migratory pattern “f” was characterized by travels of medium distances (mean = 393.68 km) over the continental shelf inside the GoM. This pattern mainly occurred in the western and northern Yucatan Peninsula and from Tamaulipas to the Texas coasts. The individuals featuring this pattern were the greens (44%), hawksbills (44%), and Kemp’s ridleys (12%). Migratory pattern “j” was similar to the latter, but this movement was towards the Caribbean basin, while in contrast to “e”, the movements stayed inside the GoM.
Migratory pattern “h” included the post-nesting females tagged in their nesting beaches at cays in the Campeche Bank located further than 150 km from shore including the following areas: Alacranes Reef, Arenas and Arcas Cays. These turtles traveled approximately 500 km on average from the cays, staying inside the Yucatan shelf where they settled. As green turtles are the species that mostly nest on these cays, this pattern was observed for individuals of this species only.
Finally, migratory pattern “i” is characterized by short local migrations on the Yucatan shelf, close to shore (approximately 13 km), and the residency area remained over the Yucatan shelf.

4. Discussion

Given the overall sample number, this is the largest satellite tracking effort of marine fauna in Mexican territory. It is assumed that the results are reliably representative of sea turtle population patterns in terms of spatial and movement ecology in the Gulf of Mexico and Western Caribbean [78], which are paramount for restoring any faunal populations [79].
Nesting female sea turtles were chosen because there is great interest in understanding their movement and connections between nesting beaches, and residency areas [26,47]. Although variability in somatic and ethological conditions within the group is expected, it is unlikely to affect the general representativeness of the spatial distribution and configuration of the individuals in the study area. Satellite tracking studies are still very expensive, and this study is the largest in Mexico’s history for any species, and the number involved is large enough to assume a robust representativeness is achieved for the studied populations [28,78]. Additionally, the documented sea turtle fidelity to nesting grounds, migrating routes and feeding/residency areas support the representativeness of the movements of tracked individuals in this region, assuming that the individuals revisit those same critical habitats in future times, and other conspecifics also use those areas [14,79,80,81].
This study also contributed to improving species-level knowledge, approached the definition of the spatial ecology norm for the hawksbill and green turtles (as dozens of individuals were tracked) and complemented the known habitat utilization for loggerhead and Kemp’s ridley turtles [78].

4.1. Critical Habitats Delineation and Physical Features

Distinct quantitative approaches have been implemented for filtering and analyzing satellite telemetry data to delineate sea turtles’ critical habitats [27,31,50,51,82,83], but in the end, all of the approaches calculate kernel utilization distributions as basis for drawing the isolines that delimit the habitat polygon used by individuals [13], as we did in this study.
The internesting habitats are expected to be closely related to the nesting beaches, while we mostly observed this pattern, there were fewer than five individuals that extended their internesting habitat to include contiguous known nesting beaches, and doing brief one or two days excursions in which they may even have nested again. There were individuals that began migrating immediately after tagging, as it was their last nest. Given that most of the nesting individuals at the same beach share the same close to shore internesting critical habitat [84,85,86], it is expected that the internesting habitats for those females we did not acquire tracking data for are included in the delimited polygons for the same species and beach.
Spatial descriptions of sea turtle internesting habitats in the GoM are scarce, and it is crucial to target in-water habitat conservation efforts during the reproductive season and not only protect the beaches where the turtles spend a very brief time in their lifetime while nesting.
These areas are seasonally occupied by gravid females, and during this phase of their life, they are particularly vulnerable to fishing activities [26,36]. The Mexican norm NOM-029-PESC-2006 prohibits shark and ray captures in front of 25 nesting beaches at the Atlantic littoral in a fringe from the shoreline to 5 km into the open sea [87], but stronger law enforcement is still needed for actual on-site law implementation. Temporal closes in key and strategic zones, as well as the implementation of better fishing practices, are potentially feasible for better protecting these critical habitats [88,89,90].
On the other hand, as turtles spend most of their life in residency sites [14,27], those areas are expected to satisfy their feeding and sheltering requirements and are of particularly high relevance for conservation.
A temporal but also critical habitat for these highly migratory species are their stopovers sites. As reported in previous studies, the stopovers we detected for the four species occurred after or before crossing oceanic watersheds, as we found it usual in individuals that migrated a minimum of 500 km, and up to 1,200 km straight line from their nesting beach. Other studies have reported this same behavior for Kemp’s ridleys [27], hawksbills [26,91] and greens [91], and they agreed that those stops might be for temporary refueling, opportunistic feeding, or navigation and orientation purposes, as sea turtles are assumed to also use landmarks and physical cues for navigating [92,93,94]. We observed a few cases (E. imbricata and C. mydas) of individuals migrating on the continental shelf and displayed multiple short (1–2 days) stopovers, while stopovers after crossing oceanic watersheds tended to be >5 days. This behavior had been reported for green turtles, loggerheads and hawksbills [26,91,95].
More targeted research is still needed on those stopover locations to compare the food and shelter availability to their final feeding and residency home ranges. Some of the sites used as stopovers were also used as final residency sites by other individuals, so we could infer that those sites have optimal feeding and sheltering resources, but the decision of staying or not might be forced by philopatry and loyalty to different feeding sites, or it might be a territorial or a density-dependent condition, rather than the habitat quality.
The general patterns of home range sizes were confirmed in this study for Kemp’s ridleys and loggerheads [27,31]. The average feeding home range for Kemp’s ridleys in this study (>1,700 km2) was consistent with the size range previously reported (10–3,500 km2) [27,31,96]. The home range areas reported in this study for green turtles are consistent with those reported by Mendez et al. [49] for the same species in south GoM, suggesting that at least the sea turtles in Campeche Bank have particular space use patterns that configure small feeding areas.
Most of the tracked green turtle individuals in this study consistently established relatively small feeding areas on the continental shelves of the Yucatan Peninsula, Florida Keys, even in Honduras and Nicaragua. This pattern is explainable by the food availability in those regions, as has been previously suggested [97], and the small size of their home ranges could be related to the availability and distribution of their main prey (seagrasses), which could reduce the need for wide-ranged searches [19]. Outstandingly, depth did not seem to be a major limiting factor for sea turtle distribution in the southern GoM, consistently distributed in waters shallower than 50 m [27,31,98].
The home range distance to shore of the sea turtles in this study was consistent with other studies at the GoM [27,31], and on average, the habitats defined in this study were even closest to shore. Nevertheless, there are home ranges that are relatively far from shore, mainly on the Campeche Bank, probably because their food resources are widely distributed on this vast shallow continental shelf in contrast with other regions where the feeding areas are more restricted. All the feeding home ranges were consistently established in regions where human activities such as artisanal fisheries and the oil industry occur, at least in the south of the GoM [35,36].
As reported in other studies, the feeding home ranges in the middle of continental shelves tend to significantly differentiate from those closer to the shore areas. This may be a reflection of the optimal prey and shelter ‘islands’ they occupy when settled in the middle of the continental shelf, with significantly limiting factors outside of them. In this context, on-shelf isolated ‘islands’ have significant relevance as the first available safe stop for individuals crossing and traveling along the GoM and from the Caribbean Sea; therefore, they are steppingstones in the connectivity configuration for these imperiled species.

4.2. Migratory Corridors

In this study, we confirmed the migratory routes that were already reported for post-nesting individuals of Kemp´s ridley, hawksbill, green and loggerhead species from southern GoM and WC [26,50,59]. However, we also reported new migratory movements by individuals of some of these species. For instance, no Kemp’s ridley individual has been reported to migrate crossing the GoM through oceanic waters [27,59], as we did in this study. In addition, no previously published evidence existed for a migratory route from central Veracruz to Florida. Among thousands of nesting females, migratory variability is expected, and these new records expand the knowledge on migratory behavior for these species in the GoM.
This study also confirmed the crossed migratory pattern by post-nesting hawksbill turtles in the Yucatan Peninsula [26] by individuals nesting on the west coast tending to migrate and settle in the northeastern and eastern parts of the peninsula, and vice versa. On the other hand, it is remarkable that none of the green or hawksbill individuals from Veracruz became established in surrounding areas, but rather they migrated either to the Yucatan Peninsula or outside the GoM.
This study is the first formal reports of hawksbill and green turtle individuals migrating from the Mexican littoral to the Florida Keys to a particularly well-known aggregation area at Las Marquesas [99,100]; further targeted studies on the use of the Loop current for these migrations are ongoing. Additionally, the regions of Honduras and Nicaragua have been extensively reported as regional feeding grounds for these species from all over the Caribbean Sea [101,102,103,104,105,106,107]. There is an important threat particularly in Nicaragua because of a local and legal green turtle fishery that bycatches other marine turtle species [108]. This issue is of special concern, as this exception might have multinational implications on sea turtle conservation in the Western Caribbean. While the percent of individuals from a particular country may be small, as in this case, the sum of all the individuals who have been recorded moving to this zone, as a sample of the potential connection to Nicaragua, is major. Therefore, it is suggested that a multinational expert team should work to assess any impact on marine turtle recovery in the Caribbean as a result of this issue, as has been done in Latin America for other international predicaments [5,109].
In addition, this is the first published study on the migrating movements for loggerhead post-nesting females from the WC. Almost 50% of the tracked individuals moved out of the MEEZ and established in the Bahamas, Cuba, Nicaragua and at the border between Mexico and Belize. The areas of the Bahamas and northern Cuba have already been reported as final tracking sites for a few loggerheads from Florida [29,93,110], but no previous evidence existed for loggerheads from the GoM moving to Nicaragua or Belize. This information expands the basic biogeography knowledge about this species from the GoM and WC. Loggerheads are also locally established in Mexican waters where they are assumed to interact with local spiny lobster (Panulirus argus) fisheries, as they have been observed feeding on these invertebrates [111].
Finally, three-quarters of the tracked loggerheads moved from WC to the Campeche Bank inside the GoM, to a final site on the Yucatan shelf and to a large area on the continental escarpment at Campeche Bay. This area has been reported as a residency area for leatherback turtles from Panama [112], as well as for large pelagic vertebrates [113,114,115]. None of the tracked loggerheads that were established at the same foraging grounds on the Campeche Bank were reported by Hart et al. [64,96] and Foley et al. [29,110] for the loggerhead rookeries in Florida, suggesting important differences in spatial distribution and spatial use between these major populations in the Caribbean.
In the area of the migratory corridor at the north of the Yucatan Peninsula, there are three federal natural protected areas (Biosphere Reserves of Celestun and Ria Lagartos and Flora and Fauna Protection Area Yum Balam), which extend up to 10 km from shore in the best case. While the latter in-water cover represents a major challenge for surveillance and law enforcement by authorities, the extension is not enough to give legal certainty to these regionally important migratory corridors. The migratory corridor is also used by green turtle individuals from Cayman Island [103] and Cuba [116], loggerheads from the U.S. [96,117] and even partially by leatherbacks from Panama [112]. The usage by multiple individuals from different countries in the Atlantic gives the corridor international relevance and a strategic position. Its viability is paramount for the protection and recovery of multiple sea turtle populations in the Atlantic and underscores the relevance of translating this spatial scientific knowledge into national and international public policy for these imperiled species [24,118], such as improving the coverage of natural protected areas in these zones and jointly implementing mitigation strategies with fishing and oil industries in multisector efforts.
A similar context occurs for the eastern Yucatan Peninsula corridor, which is also used by leatherbacks from Panama [112], greens from Cuba and Cayman Island [103,116] and even olive ridleys, presumably moving from South America [119]. Similarly, given its geographical location, it is an area that must be transited for the Yucatan Channel that connects the WC with the north GoM and the north Atlantic.
Overall, green, hawksbill and Kemp’s ridley individuals nesting as far north as approximately 21.3° N latitude in the southern GoM littoral zone will normally cross deep waters through Campeche Bay to reach their final feeding area in neritic zones. This norm underscores the capability of these animals to move through oceanic waters in a straight way to their final residency site without necessarily having to travel a longer path along shore on the continental shelf.
Previous migratory patterns have been described for sea turtles in other studies [19], describing four distinct patterns. The broadest migratory pattern referred to individuals moving on oceanic areas (Type A1), often traveling medium to long distances, and was reported for green, loggerhead and hawksbill turtles. This broad pattern is similar to patterns “b, d, e, j” (Figure S4) in this study, but we include Kemp’s ridley, and the descriptions are more detailed, as we included changes in ocean basins. On the other hand, [19] also described local residence migrations (Type A3), which are described as relatively short migrations by hawksbill, green and loggerhead turtles. This last pattern coincides with the patterns “a, f, h, i” (Figure S4) described here for individuals displaying short migration distances on the continental shelf, often establishing in the same region as their nesting beach. As mentioned in the previous sections and reported before, we agree on the existence of different migration strategies by sea turtles, which show large behavioral plasticity that is unraveled as the number of tracked individuals increases. Further analysis to quantify the contribution rate of new migratory patterns and feeding area locations by newly tracked individuals is needed to further determine the priorities for future tracking post-nesting females in the GoM.

5. Conclusions

As the largest marine turtle-tracking project in the southern Gulf of Mexico and Western Caribbean to date, the biological and ecological information contributed by this study about four imperiled species is paramount for their recovery and conservation. At least two global priority research categories [47] are directly or indirectly addressed by this study, as well as the subprograms on knowledge, management and restoration specified in the National Recovery Plans for sea turtles in Mexico [118]. As merely publishing scientific knowledge may not be enough for real impacts on public politics, decision-making and ultimately endangered species recovery, it is paramount for this information to be adopted by decision-makers soon. One of the milestones and objectives of this study was to deliver basic ecological information for decision-making processes in oil industry management [119]. This information has already been submitted to Mexican authorities to define ecologically vulnerable regions in the MEEZ.
We expanded the knowledge frontiers on spatial and movement ecology for these imperiled species and provided original knowledge for underrepresented sea turtle populations in the southern GoM and WC, including the largest hawksbill rookeries in the West Atlantic [5], the second-largest loggerhead population in the GoM [9], and some of the most important secondary nesting beaches for endemic Kemp’s ridley turtles [6]. This study contributes to underscore the relevance of southern GoM sea turtle populations in the regional connectivity in the GoM and Caribbean Sea, and it brings this under-represented region in scientific literature closer to the better funded and published populations in the northern regions.
In addition, the delimitation of sea turtles’ critical habitats for migrating, internesting and feeding is useful for improving national laws, as well as multinational treaties for protecting and restoring marine turtles and their habitats. In general, the spatial distribution of these endangered species is paramount for the work of international treaties such as the Inter-American Sea Turtle Convention, the Convention on Biological Diversity, and the Convention on International Trade in Endangered Species of Wild Fauna and Flora.
As it has been repeatedly encouraged [18,34], given the multinational connectivity by marine megavertebrates in the GoM and WC, it is desirable to collaborate among the U.S., Mexico, Cuba and even Belize to jointly define the most critical hotspots for marine turtle aggregations, as well as to define the regional migratory corridors. Such an effort would be an outstanding milestone for better prioritizing international conservation and managing resource investments in this region.

Supplementary Materials

The following are available at https://0-www-mdpi-com.brum.beds.ac.uk/article/10.3390/jmse9080793/s1, Figure S1. Brownian Bridge Movement Model (BBMM) probability surface examples. Figure S2: Frequency distribution per species of the post-nesting individuals. Figure S3: Classification plots of the multiple physical variables assessed for the feeding and residency home ranges. Figure S4: Classification plots of the multiple physical variables assessed for the migratory routes. Table S1: Frequency and percentage distribution of the level classes for all acquired location records. Table S2: Descriptive statistics of physical variables recorded for migratory routes of post-nesting females of four sea turtle species. Table S3: Descriptive statistics of the internesting home range physical variables of post-nesting females of four sea turtle species. Table S4: Descriptive statistics of the feeding home range physical variables of post-nesting females of four sea turtle species.

Author Contributions

Conceptualization, resources, writing—review and editing, A.U.-M., M.d.l.A.L.-C. and E.C.; methodology, validation, formal analysis, investigation, data curation, writing—original draft preparation, A.U.-M. and E.C.; software, visualization, A.U.-M.; project administration, funding acquisition, M.d.l.A.L.-C. and E.C. All authors have read and agreed to the published version of the manuscript.

Funding

This research was funded by the Mexican National Council for Science and Technology—Mexican Ministry of Energy—Hydrocarbon Fund, project 201441. This is a contribution of the Gulf of Mexico Research Consortium (CIGoM). We acknowledge PEMEX’s specific request to the Hydrocarbon Fund to address the environmental effects of oil spills in the Gulf of Mexico, and the funding source did not participate in the design of this assessment.

Institutional Review Board Statement

The study was conducted according to the Mexican Environmental law under federal permit numbers SGPA/DGVS/09583/15, SGPA/DGVS/06438/17, SGPA/DGVS/03989/17, and SATI/PC/016/16.

Data Availability Statement

Some of the datasets presented in this article are not readily available because of restrictions by funding sources. Requests to access the datasets should be directed to M.A.L.-C. and E.C.

Acknowledgments

We would like to thank the project team who contributed to marine turtle tagging: S. Gallegos-Fernández, P.A. García-Alvarado, G. Mexicano-Cíntora, A.G. Ortíz-Méndez, D. Espinoza-Puch, E.B. Palafox-Juárez, H. Hernández-Núñez, E.R. Castro-Pineda, V. Guzmán-Hernández, R.J. González-Díaz-Mirón. Thank you to the students who participated in the subproject: R.A. Maldonado-Bandala, K. Coronel-Almeyda, D.A. Celis-Padilla. We would like to thank the National Commission of Natural Protected Areas that facilitated the field work through the directors of their regional offices (Planicie Costera y Golfo de México, Península de Yucatán), as well as by the directors and staff to the following natural protected areas: APFF Laguna Madre y Delta del Río Bravo, Santuario Playa de Rancho Nuevo, PN Sistema Arrecifal Veracruzano, APFF Sistema Arrecifal Lobos-Tuxpan, RB Los Tuxtlas, APFF Laguna de Términos, RB Los Petenes, RB Ría Celestún, PN Arrecife Alacranes, RB Ría Lagartos, Santuario Playa Río Lagartos, PN Isla Contoy, APFF Yum Balam, RB Caribe Mexicano, PN Arrecifes de Puerto Morelos, PN Tulum, PN Arrecifes de Cozumel, APFF Isla de Cozumel. In addition, the public and private institutions in charge of biological monitoring of sea turtle nesting who contributed and facilitated the turtle tagging, some staff of the former institutions also collaborated in turtle tagging: Acuario de Veracruz, Vida Milenaria, Comisión Federal de Electricidad, Universidad Veracruzana, Desarrollo sustentable, Grupo Tortuguero de la Laguna, Universidad Autónoma del Carmen, Universidad Autónoma de Campeche, Quelonios, Estación de Investigación Oceanográfica del Carmen, 7ª y 9ª Zonas Navales de la Secretaría de Marina Armada de México, SEMABICC-Gobierno de Campeche, Fileteras del Petén, Pronatura Península de Yucatán, CETMAR No. 17 Progreso, SEDUMA-Gobierno de Yucatán, Fundación Palace, Dorado Royale, H. Municipio de Solidaridad, Hotel Paradisus, Fundación de Parques y Musesos de Cozumel Quintana Roo, Karisma, Centro Ecológico Akumal, Fundación Bahía Príncipe, H. Ayuntamiento de Tulum, Flora, Fauna y Cultura de México, Parque Xcaret. Part of the manuscript writing and data analysis were done in collaboration with the UNACAR Project No. 026/DGIP/2020.

Conflicts of Interest

The authors declare no conflict of interest. The funders had no role in the design of the study; in the collection, analyses, or interpretation of data; in the writing of the manuscript; or in the decision to publish the results.

References

  1. Lennox, R.J.; Engler-Palma, C.; Kowarski, K.; Filous, A.; Whitlock, R.; Cooke, S.J.; Auger-Méthé, M. Optimizing marine spatial plans with animal tracking data. Can. J. Fish. Aquat. Sci. 2019, 76, 497–509. [Google Scholar] [CrossRef] [Green Version]
  2. Augé, A.A.; Dias, M.P.; Lascelles, B.; Baylis, A.M.M.; Black, A.; Boersma, P.D.; Catry, P.; Crofts, S.; Galimberti, F.; Granadeiro, J.P.; et al. Framework for mapping key areas for marine megafauna to inform Marine Spatial Planning: The Falkland Islands case study. Mar. Policy 2018, 92, 61–72. [Google Scholar] [CrossRef] [Green Version]
  3. Spotila, J.R. Sea Turtles: A Complete Guide to the Biology, Behavior, and Conservation; The Johns Hopkins University Press: Baltimore, MD, USA, 2004; 227p. [Google Scholar]
  4. Cuevas, E. Spatial and temporal dimensions of the critical habitat selection processes by sea turtles. Rev. Biol. Mar. Oceanogr. 2017, 52, 187–199. [Google Scholar] [CrossRef] [Green Version]
  5. Meylan, A.B.; Donnelly, M. Status justification for listing the hawksbill turtle (Eretmochelys imbricata) as critically endangered on the 1996 IUCN Red List of Threatened Animals. Chelonian Conserv. Biol. 1999, 3, 200–224. [Google Scholar]
  6. Dow-Piniak, W.E.; Eckert, K.L. Sea turtle nesting habitat in the Wider Caribbean Region. Endanger. Species Res. 2011, 15, 129–141. [Google Scholar] [CrossRef]
  7. Valverde, R.A.; Holzwart, K.R. Sea turtles of the Gulf of Mexico. In Habitats and Biota of the Gulf of Mexico: Before the Deepwater Horizon Oil Spill; Ward, S.H., Ed.; Springer Nature: New York, NY, USA, 2017; Volume 2, pp. 1189–1352. [Google Scholar]
  8. Caillouet, C.W., Jr.; Raborn, S.W.; Shaver, D.J.; Putman, N.F.; Gallaway, B.J.; Mansfield, K.L. Did declining carrying capacity for the Kemp’s Ridley sea turtle population within the Gulf of Mexico contribute to the nesting setback in 2010–2017? Chelonian Conserv. Biol. 2018, 17, 123–133. [Google Scholar] [CrossRef] [Green Version]
  9. Ceriani, S.S.; Casale, P.; Brost, M.; Leone, E.H.; Witherington, B.E. Conservation implications of sea turtle nesting trends: Elusive recovery of a globally important loggerhead population. Ecosphere 2019, 10, e02936. [Google Scholar] [CrossRef] [Green Version]
  10. Heileman, S.; Rabalais, N. Gulf of Mexico LME. In The UNEP Large Marine Ecosystem Report: A Perspective on Changing Conditions in LME’s of the World Regional Seas; Sherman, K., Hempel, G., Eds.; UNEP Regional Seas Report and Studies No. 182; UNEP: Nairobi, Kenya, 2008; pp. 673–698. [Google Scholar]
  11. Fanning, L.; Mahon, R.; McConney, P. Focusing on living marine resource governance: The Caribbean large marine ecosystem and adjacent areas project. Coast. Manag. 2009, 37, 219–234. [Google Scholar] [CrossRef]
  12. Putman, N. Marine migrations. Curr. Biol. 2018, 28, 952–1008. [Google Scholar] [CrossRef] [PubMed] [Green Version]
  13. Moorcroft, P.R.; Lewis, M.A. Mechanistic Home Range Analysis; Princeton University Press: Princeton, NJ, USA, 2006. [Google Scholar]
  14. Broderick, A.C.; Coyne, M.S.; Fuller, W.J.; Glen, F.; Godley, B.J. Fidelity and over-wintering of sea turtles. Proc. R. Soc. B 2007, 274, 1533–1539. [Google Scholar] [CrossRef]
  15. Diario de la Federación. Ley General de Vida Silvestre. Available online: http://www.diputados.gob.mx/LeyesBiblio/pdf/146_190118.pdf (accessed on 1 March 2021).
  16. Bowen, B.W.; Grant, W.S.; Hillis-Starr, Z.; Shaver, D.J.; Bjorndal, K.A.; Bolten, A.B.; Bass, A.L. Mixed-stock analysis reveals the migrations of juvenile hawksbill turtles (Eretmochelys imbricata) in the Caribbean Sea. Mol. Ecol. 2007, 16, 49–60. [Google Scholar] [CrossRef] [PubMed]
  17. Abreu-Grobois, F.A. Generalidades de las tortugas marinas. In Las Tortugas Marinas en México: Logros y Perspectivas para su Conservación; Gaona-Pineda, O., Barragán-Rocha, A.R., Eds.; Comisión Nacional de Áreas Naturales Protegidas: Mexico City, Mexico, 2016; pp. 19–34. [Google Scholar]
  18. Hart, K.M.; Iverson, A.R.; Fujisaki, I.; Lamont, M.M.; Bucklin, D.; Shaver, S.J. Sympatry or syntopy? Investigating drivers of distribution and co-occurrence for two imperiled sea turtles species in the Gulf of Mexico neritic waters. Ecol. Evol. 2018, 8, 12656–12669. [Google Scholar] [CrossRef] [PubMed] [Green Version]
  19. Godley, B.J.; Blumenthal, J.M.; Broderick, A.C.; Coyne, M.S.; Godfrey, M.H.; Hawkes, L.A.; Witt, M.J. Satellite tracking of sea turtles: Where have we been and where do we go next? Endanger. Species Res. 2008, 4, 3–22. [Google Scholar] [CrossRef]
  20. Cuevas, E.; Putman, N.F.; Uribe-Martínez, A.; López-Castro, M.C.; Guzmán-Hernández, V.; Gallegos-Fernández, S.A.; Liceaga-Correa, M.A.; Trujillo-Córdova, J.A.; González-Díaz-Mirón, R.J.; Negrete-Phillipe, A.; et al. First spatial distribution analysis of male sea turtles in the Southern Gulf of Mexico. Front. Mar. Sci. 2020, 7, 561846. [Google Scholar] [CrossRef]
  21. Heppell, S.S. Application on life-history theory and population model analysis to turtle conservation. Copeia 1998, 2, 367–375. [Google Scholar] [CrossRef] [Green Version]
  22. Hart, K.M.; Hyrenbach, K.D. Satellite telemetry of marine megavertebrates: The coming of age of an experimental science. Endanger. Species Res. 2009, 10, 9–20. [Google Scholar] [CrossRef]
  23. Hussey, N.E.; Kessel, S.T.; Aarestrup, K.; Cooke, S.J.; Cowley, P.D.; Fisk, A.T.; Harcourt, R.G.; Holland, K.N.; Iverson, S.J.; Kocik, J.F.; et al. Aquatic animal telemetry: A panoramic window into the underwater world. Science 2015, 348, 1–10. [Google Scholar] [CrossRef] [Green Version]
  24. Hays, G.C.; Ferreira, L.C.; Sequeira, A.M.M.; Meekan, M.G.; Duarte, C.M.; Bailey, H.; Bailleul, F.; Bowen, W.D.; Caley, M.J.; Costa, D.P.; et al. Key questions in marine megafauna movement ecology. Trends Ecol. Evol. 2016, 31, 463–475. [Google Scholar] [CrossRef] [Green Version]
  25. Jeffers, V.F.; Godley, B.J. Satellite tracking in sea turtles: How do we find our way to the conservation dividends? Biol. Conserv. 2016, 199, 172–184. [Google Scholar] [CrossRef] [Green Version]
  26. Cuevas, E.; Abreu-Grobois, F.A.; Guzmán-Hernández, V.; Liceaga-Correa, M.A.; van Damo, R.P. Post-nesting migratory movements of hawksbill turtles Eretmochelys imbricata in waters adjacent to the Yucatan Peninsula, Mexico. Endanger. Species Res. 2008, 10, 123–133. [Google Scholar] [CrossRef]
  27. Shaver, D.J.; Hart, K.M.; Fujisaki, I.; Rubio, C.; Sartain, A.R.; Peña, J.; Burchfield, P.M.; Gómez-Gámez, D.; Ortíz, J. Foraging area fidelity for Kemp’s ridleys in the Gulf of Mexico. Ecol. Evol. 2013, 3, 2002–2012. [Google Scholar] [CrossRef]
  28. Schofield, G.; Dimadi, A.; Fossette, S.; Katselidis, K.A.; Koutsoubas, D.; Lilley, M.K.S.; Luckman, A.; Pantis, J.D.; Karagouni, A.D.; Hays, G.C. Satellite tracking large numbers of individuals to infer population level dispersal and core areas for the protection of an endangered species. Divers. Distrib. 2013, 19, 834–844. [Google Scholar] [CrossRef]
  29. Foley, A.M.; Schroeder, B.A.; Hardy, R.; MacPherson, S.L.; Nicholas, M. Long-term behavior at foraging sites of adult female loggerhead sea turtles (Caretta caretta) from three Florida rookeries. Mar. Biol. 2014, 161, 1251–1262. [Google Scholar] [CrossRef] [PubMed] [Green Version]
  30. Putman, N.F.; Mansfield, K.L. Direct evidence of swimming demonstrates active dispersal in the sea turtle “Lost Years”. Curr. Biol. 2015, 25, 1221–1227. [Google Scholar] [CrossRef] [Green Version]
  31. Hart, K.M.; Iverson, A.R.; Fujisaki, I.; Lamont, M.M.; Bucklin, D.; Shaver, D.J. Marine threats overlap key foraging habitat for two imperiled sea turtle species in the Gulf of Mexico. Front. Mar. Sci. 2018, 5, 36. [Google Scholar] [CrossRef]
  32. Luschi, P.; Lutjeharms, J.R.E.; Lambardi, P.; Mencacci, R.; Hughes, G.R.; Hays, G.C. A review of migratory behavior of sea turtles off southeastern Africa. S. Afr. J. Sci. 2006, 102, 51–58. [Google Scholar]
  33. Cerritelli, G.; Bianco, G.; Santini, G.; Broderick, A.C.; Godley, B.J.; Hays, G.C.; Luschi, P.; Åkesson, S. Assessing reliance on vector navigation in the long-distance oceanic migrations of green sea turtles. Behav. Ecol. 2019, 30, 68–79. [Google Scholar] [CrossRef]
  34. Huang, H.W. Conservation hotspots for the turtles on the high seas of the Atlantic Ocean. PLoS ONE 2015, 10, e0133614. [Google Scholar] [CrossRef] [PubMed]
  35. Cuevas, E.; Guzmán-Hernández, V.; Uribe-Martínez, A.; Raymundo-Sánchez, A.; Herrera-Pavón, R. Identification of potential sea turtle bycatch hotspots using a spatially explicit approach in the Yucatan peninsula, Mexico. Chelonian Conserv. Biol. 2018, 17, 78–93. [Google Scholar] [CrossRef]
  36. Cuevas, E.; Liceaga-Correa, M.A.; Uribe-Martínez, A. Ecological vulnerability of two sea turtle species in the Gulf of Mexico: An integrated spatial approach. Endanger. Species Res. 2019, 40, 337–356. [Google Scholar] [CrossRef]
  37. Welch, H.; Hazen, E.L.; Briscoe, D.K.; Bograd, S.J.; Jacox, M.G.; Eguchi, T.; Benson, S.R.; Fahy, C.C.; Garfield, T.; Robinson, D.; et al. Environmental indicators to reduce loggerhead turtle bycatch offshore of Southern California. Ecol. Indic. 2019, 98, 657–664. [Google Scholar] [CrossRef]
  38. Moncada, F.G.; Hawkes, L.A.; Fish, M.R.; Godley, B.J.; Manolis, S.C.; Medina, Y.; Nodarse, G.; Webb, G.J.W. Patterns of dispersal of hawksbill turtles from the Cuban shelf inform scale of conservation and management. Biol. Conserv. 2012, 148, 191–199. [Google Scholar] [CrossRef]
  39. Dawson, T.M.; Formia, A.; Agamboué, P.D.; Asseko, G.M.; Boussamba, F.; Cardiec, F.; Chartrain, E.; Doherty, P.D.; Fay, J.M.; Godley, B.J.; et al. Designation and mangament for nesting olive ridley sea turtles using satellite tracking. Front. Mar. Sci. 2017, 4, 312. [Google Scholar] [CrossRef] [Green Version]
  40. Niviere, M.; Chambault, P.; Pérez, T.; Etienne, D.; Bonola, M.; Martin, J.; Barnéiras, C.; Védie, F.; Mailles, J.; Dumont-Dayot, É.; Gresser, J.; et al. Identification of marine key areas across the Caribbean to ensure the conservation of the critically endangered hawksbill turtle. Biol. Conserv. 2018, 233, 170–180. [Google Scholar] [CrossRef] [Green Version]
  41. Bolten, A.B.; Crowder, L.B.; Dodd, M.G.; MacPherson, S.L.; Musick, J.A.; Schroeder, B.A.; Witherington, B.E.; Long, K.J.; Snover, M.L. Quantifying multiple threats to endangered species: An example from loggerhead sea turtles. Front. Ecol. Environ. 2011, 9, 295–301. [Google Scholar] [CrossRef] [Green Version]
  42. Iverson, A.R.; Benscoter, A.M.; Fujisaki, I.; Lamont, M.M.; Hart, K.M. Migration corridors and threats in the Gulf of Mexico and Florida Straits for Loggerhead sea turtles. Front. Mar. Sci. 2020, 7, 208. [Google Scholar] [CrossRef]
  43. Wallace, B.P.; Stacey, B.A.; Cuevas, E.; Holyoake, C.; Lara, P.H.; Marcondes, A.C.J.; Miller, J.D.; Nijkamp, H.; Pilcher, N.J.; Robinson, I.; et al. Oil spills and sea turtles: Documented effects and considerations for response and assessment efforts. Endanger. Species Res. 2020, 41, 17–37. [Google Scholar] [CrossRef] [Green Version]
  44. Burges, M.G.; McDermott, G.R.; Owashi, B.; Reeves, L.E.P.; Clavelle, T.; Ovando, D.; Wallace, B.P.; Lewison, R.L.; Gaines, S.D.; Costello, C. Protecting marine mammals, turtles, and birds by rebuilding global fisheries. Science 2018, 359, 1255–1258. [Google Scholar] [CrossRef] [Green Version]
  45. Scales, K.L.; Hazen, E.L.; Jacox, M.G.; Castruccio, F.; Maxwell, S.M.; Lewison, R.L.; Bograd, S.J. Fisheries bycatch risk to marine megafauna is intensified in Lagrangian coherent structures. Proc. Natl. Acad. Sci. USA 2018, 115, 7362–7367. [Google Scholar] [CrossRef] [Green Version]
  46. Wallace, B.P.; Brosnan, T.; McLamb, D.; Rowles, T.; Ruder, E.; Schroeder, B.; Schwacke, L.; Stacy, B.; Sullivan, L.; Takeshita, R.; et al. Effects of the Deepwater Horizon oil spill on protected species. Endanger. Species Res. 2017, 33, 1–7. [Google Scholar] [CrossRef] [Green Version]
  47. Hamann, M.; Godfrey, M.H.; Seminoff, J.A.; Arthur, K.; Barata, P.C.R.; Bjorndal, K.A.; Bolten, A.B.; Broderick, A.C.; Campbell, L.M.; Carreras, C.; et al. Global research priorities for sea turtles: Informing management and conservation in the 21st century. Endanger. Species Res. 2010, 11, 245–269. [Google Scholar] [CrossRef] [Green Version]
  48. Hays, G.C.; Bailey, H.; Bograd, S.J.; Don-Bowes, W.; Campagna, C.; Carmichael, R.H.; Casale, P.; Chiaradia, A.; Costa, D.P.; Cuevas, E.; et al. Translating marine animal tracking data into conservation policy and management. Trends Ecol. Evol. 2019, 34, 459–473. [Google Scholar] [CrossRef] [Green Version]
  49. Méndez, D.; Cuevas, E.; Navarro, J.; González-Garza, B.I.; Guzmán-Hernández, V. Satellite tracking of Green turtle females Chelonia mydas and the evaluation of their home ranges in the north coast of the Yucatan Peninsula, Mexico. Rev. Biol. Mar. Oceanogr. 2013, 48, 497–509. [Google Scholar] [CrossRef] [Green Version]
  50. Vázquez, M.; Cuevas, E. Hábitats críticos de tortuga blanca (Chelonia mydas) y carey (Eretmochelys imbricata) en la península de Yucatán y su coincidencia espacial con zonas de pesca artesanal. In El uso del Conocimiento de las Tortugas Marinas Como Herramienta para la Restauración de sus Poblaciones y Hábitats Asociados en México; Cuevas-Flores, E., Guzmán-Hernández, V., Guerra-Santos, J.J., Rivas-Hernández, G.A., Eds.; Universidad Autónoma del Carmen: Ciudad del Carmen, Mexico, 2019; pp. 57–62. [Google Scholar]
  51. Gallegos-Fernández, S.A.; Cuevas, E.; Liceaga-Correa, M.A. Methodological processes for the placement of satellite transmitters in hard-shelled sea turtles on nesting beaches. Rev Biol. Mar. Oceanogr. 2018, 53, 147–156. [Google Scholar] [CrossRef] [Green Version]
  52. R Core Team. R: A Language and Environment for Statistical Computing; R Foundation for Statistical Computing: Vienna, Austria, 2019; Available online: https://www.R-project.org/ (accessed on 31 January 2020).
  53. Collecte Localisation Satellite. Argos User’s Manual 2007–2016. Available online: https://www.argos-system.org/wp-content/uploads/2016/08/r363_9_argos_users_manual-v1.6.6.pdf (accessed on 11 April 2021).
  54. Freitas, C.; Lydersen, C.; Ims, R.A.; Fedak, M.A.; Kovacs, K.M. A simple new algorithm to filter marine mammal Argos locations. Mar. Mammal Sci. 2012, 24, 315–325. [Google Scholar] [CrossRef]
  55. Boyd, J.D.; Brightsmith, D.J. Error properties of Argos satellite telemetry locations using least squares and Kalman filtering. PLoS ONE 2013, 8, e63051. [Google Scholar] [CrossRef] [PubMed] [Green Version]
  56. Lopez, R.; Malardé, J.P. Improving ARGOS Doppler Location Using Kalman Filtering; Collecte Localisation Satellites: Ramonville Saint-Agne, France, 2011. [Google Scholar]
  57. McClintock, B.T.; London, J.M.; Cameron, M.F.; Boveng, P.L. Modelling animal movement using the Argos satellite telemetry location error ellipse. Methods Ecol. Evol. 2015, 6, 266–277. [Google Scholar] [CrossRef]
  58. Shaver, D.J.; Hart, K.M.; Fujisaki, I.; Rubio, C.; Sartain-Iverson, A.R.; Peña, J.; Gómez-Gámez, D.; González-Días-Miron, R.J.; Burchfield, P.M.; Martinez, H.J.; et al. Migratory corridors of adult female Kemp’s ridley turtles in the Gulf of Mexico. Biol. Conserv. 2016, 194, 158–167. [Google Scholar] [CrossRef] [Green Version]
  59. Bentivegna, F.; Valentino, F.; Falco, P.; Zambianchi, E.; Hochscheid, S. The relationship between loggerhead turtle (Caretta caretta) movement patterns and Mediterranean currents. Mar. Biol. 2007, 151, 1605–1614. [Google Scholar] [CrossRef]
  60. Bailey, H.; Fossette, S.; Bograd, S.J.; Shillinger, G.L.; Swithenbank, A.M.; Georges, J.Y.; Gaspar, P.; Strömber, K.H.P.; Paladino, F.V.; Spotila, J.R.; et al. Movement patterns for a critically endangered species, the Leatherback turtle (Dermochelys coriacea), linked to foraging success and population status. PLoS ONE 2012, 7, e36401. [Google Scholar] [CrossRef]
  61. McConnell, B.J.; Chambers, C.; Fedak, M.A. Foraging ecology of southern elephant seals in relation to the bathymetry and productivity of the Southern Ocean. Antarct. Sci. 1992, 4, 393–398. [Google Scholar] [CrossRef] [Green Version]
  62. Luschi, P.; Hays, G.C.; Del Seppia, C.; Marsh, R.; Papi, F. The navigational feats of green sea turtles migrating from Ascencion Island investigate by satellite telemetry. Proc. R. Soc. Lond. B 1998, 265, 2279–2284. [Google Scholar] [CrossRef]
  63. Hijmans, R.J.; Kapoor, J.; Wieczorek, J.; Garcia, N.; Maunahan, A.; Rala, A.; Mandel, A. Gadm database of Global Administrative Areas: 2016. Available online: https://gadm.org/ (accessed on 7 July 2021).
  64. Hart, K.M.; Lamont, M.M.; Iverson, A.R.; Smith, B.J. The importance of the northeastern Gulf of Mexico to foraging loggerhead sea turtles. Front. Mar. Sci. 2020, 7, 330. [Google Scholar] [CrossRef]
  65. Worton, B.J. Kernel methods for estimating the utilization distribution in home-range studies. Ecology 1989, 70, 164–168. [Google Scholar] [CrossRef]
  66. Calenge, C. The package adehabitat for the R software: A tool for the analysis of space and habitat use by animals. Ecol. Model. 2006, 197, 516–519. [Google Scholar] [CrossRef]
  67. Bradshaw, C.J.A.; Sims, D.W.; Hays, G.C. Measurement error causes scale-dependent threshold erosion of biological signals in animal movement data. Ecol. App. 2007, 17, 628–638. [Google Scholar] [CrossRef] [Green Version]
  68. Lowther, A.D.; Lydersen, C.; Fedak, M.A.; Lovell, P.; Kovacs, K.M. The Argos-CLS Kalman filter: Error structures and state-space modelling relative to fastloc GPS data. PLoS ONE 2015, 10, e0124754. [Google Scholar] [CrossRef]
  69. Horne, J.S.; Garton, E.O.; Krone, S.M.; Lewis, J.S. Analyzing animal movements using Brownian bridges. Ecology 2007, 88, 2354–2363. [Google Scholar] [CrossRef]
  70. Nielson, R.M.; Sawyer, H.; McDonald, T.L. R Package ‘BBMM’ Brownian Bridge Movement Model. WEST, Inc., 2015. Available online: https://www.west-inc.com (accessed on 7 July 2020).
  71. North, M.A. A method for implementing a statistically significant number of data classes in the Jenks algorithm. In Proceedings of the Sixth International Conference, Fuzzy Systems and Knowledge Discovery (IEEE), Tianjin, China, 14–16 August 2009; pp. 35–38. [Google Scholar]
  72. Block, B.A.; Jonsen, I.D.; Jorgensen, S.J.; Winship, A.J.; Shaffer, S.A.; Bograd, S.J.; Hazen, E.L.; Foley, E.L.; Breed, G.A.; Harrison, A.L.; et al. Tracking apex marine predator movements in a dynamic ocean. Nature 2011, 475, 86–90. [Google Scholar] [CrossRef] [PubMed]
  73. Muller-Karger, F.E.; Walsh, J.J.; Evans, R.H.; Meyers, M.B. On the seasonal phytoplankton concentration and sea surface temperature cycles of the Gulf of Mexico as determined by satellites. J. Geophys. Res. Ocean 1991, 96, 12645–12665. [Google Scholar] [CrossRef] [Green Version]
  74. Uribe-Martínez, A.; Liceaga-Correa, M.A.; Cuevas, E. Idoneidad ambiental de las tortugas marinas en el Golfo de México: Visión futura en un océano más caliente. In Vulnerabilidad de las Zonas Costeras de Latinoamérica al Cambio Climático; Botello, A., Villanueva, S., Gutiérrez, J., Rojas-Galaviz, L., Eds.; UJAT/UNAM/UAC: Campeche, Mexico, 2017; pp. 379–414. [Google Scholar]
  75. Uribe-Martínez, A.; Aguirre-Gómez, R.; Zavala-Hidalgo, J.; Ressl, R.; Cuevas, E. Oceanographic units of the Gulf of Mexico and adjacent areas: The monthly integration of surface biophysical features. Geofísica Int. 2019, 58, 295–315. [Google Scholar] [CrossRef]
  76. Bivand, R.; Rundel, C. R Package: Misc-gDistance: Distance between Geometries. Available online: https://rdrr.io/rforge/rgeos/man/misc-gDistance.html (accessed on 12 May 2021).
  77. General Bathymetric Chart of the Oceans. Available online: https://www.gebco.net/ (accessed on 12 May 2021).
  78. Sequeira, A.M.M.; Heupel, M.R.; Lea, M.A.; Eguíluz, V.M.; Duarte, C.M.; Meekan, M.G.; Thums, M.; Calich, H.J.; Carmichael, R.H.; Ferreira, L.C.; et al. The importance of sample size in marine megafauna tagging studies. Ecol. Appl. 2019, 29, e01947. [Google Scholar] [CrossRef] [PubMed]
  79. Hulin, V.; Guillon, J.M. Female philopatry in a heterogeneous environment: Ordinary conditions leading to extraordinary ESS sex ratios. BMC Evol. Biol. 2007, 7, 13. [Google Scholar] [CrossRef] [PubMed] [Green Version]
  80. Lee, P.L.M.; Luschi, P.; Hays, G.C. Detecting female precise natal philopatry in green turtles using assignment methods. Mol. Ecol. 2007, 16, 61–74. [Google Scholar] [CrossRef] [PubMed]
  81. Stiebens, V.A.; Merino, S.E.; Roder, C.; Chain, F.J.J.; Lee, P.L.M.; Eizaguirre, C. Living on the edge: How philopatry maintains adaptive potential. Proc. R. Soc. B 2013, 280, 20130305. [Google Scholar] [CrossRef] [Green Version]
  82. Stokes, L.L.; Broderick, A.C.; Canbolat, A.F.; Candan, O.; Fuller, W.J.; Glen, F.; Levy, Y.; Rees, A.F.; Rilov, G.; Snape, R.T.; et al. Migratory corridors and foraging hotspots: Critical habitats identified for Mediterranean green turtles. Divers. Distrib. 2015, 21, 665–674. [Google Scholar] [CrossRef]
  83. Mettler, E.K.; Clyde-Brockway, C.E.; Sinclair, E.M.; Paladino, F.V.; Honarvar, S. Determining critical inter-nesting, migratory, and foraging habitats for the conservation of East Atlantic green turtles (Chelonia mydas). Mar. Biol. 2020, 167, 106. [Google Scholar] [CrossRef]
  84. Zbinden, J.A.; Aebischer, A.; Margaritoulis, D.; Arlettaz, R. Insights into the management of sea turtle internesting are through satellite telemetry. Biol. Conserv. 2007, 137, 157–162. [Google Scholar] [CrossRef]
  85. Shillinger, G.L.; Swithenbank, A.M.; Bograd, S.J.; Bailey, H.; Castelton, M.R.; Wallace, B.P.; Spotila, J.R.; Paladino, F.V.; Piedra, R.; Block, B.A. Identification of high-use internesting habitats for eastern Pacific leatherback turtles: Role of the environment and implications for conservation. Endanger. Species Res. 2010, 10, 215–232. [Google Scholar] [CrossRef] [Green Version]
  86. Shaver, D.J.; Hart, K.M.; Fuhisaki, I.; Bucklin, D.; Iverson, A.R.; Rubio, C.; Backof, T.F.; Burchfield, P.M.; González-Díaz-Mirón, R.J.; Dutton, P.H.; et al. Inter-nesting movements and habitat-use of adult female Kemp’s ridley turtles in the Gulf of Mexico. PLoS ONE 2017, 12, e0174248. [Google Scholar] [CrossRef]
  87. Diario Oficial de la Federacion—Secretaria de Gobernacion. Available online: https://www.dof.gob.mx/nota_detalle.php?codigo=5381585&fecha=11/02/2015 (accessed on 11 April 2021).
  88. Kakai, T. Assessing the effectiveness of LED lights for the reduction of sea turtle bycatch in an artisanal gillnet fishery—A case study from north of Kenya. WIO J. Mar. Sci. 2019, 18, 37–44. [Google Scholar] [CrossRef] [Green Version]
  89. Putman, N.F.; Hawkins, J.; Gallaway, B.J. Managing fisheries in a world with more sea turtles. Proc. R. Soc. B 2020, 287, 20200220. [Google Scholar] [CrossRef]
  90. Bielli, A.; Alfaro-Shigueto, J.; Doherty, P.D.; Godley, B.J.; Ortiz, C.; Pasara, A.; Wang, J.H.; Mangel, J.C. An illuminating idea to reduce bycatch in the Peruvian small-scale gillnet. Biol. Conserv. 2020, 241, 108277. [Google Scholar] [CrossRef]
  91. Dujon, A.M.; Schofield, G.; Lester, R.E.; Esteban, N.; Hays, G.C. Fastloc-GPS reveals daytime departure and arrival during long-distance migration and the use of different resting strategies. Mar. Biol. 2017, 164, 187. [Google Scholar] [CrossRef]
  92. Healy, S.D.; Braithwaite, V.A. The role of landmarks in small- and large-scale navigation. In Spatial Cognition, Spatial Perception: Mapping the Self and Space; Dolins, F.L., Mitchell, R.W., Eds.; Cambridge University Press: New York, NY, USA, 2010; pp. 152–179. [Google Scholar]
  93. Painter, K.J.; Plochocka, A.Z. Efficiency of island homing by sea turtles under multimodal navigating strategies. Ecol. Modell. 2019, 391, 40–52. [Google Scholar] [CrossRef]
  94. Johnsen, S.; Lohmann, K.J.; Warrant, E.J. Animal navigation: A noisy magnetic sense? J. Exp. Biol. 2020, 223, jeb164921. [Google Scholar] [CrossRef]
  95. Baudouin, M.; Thoisy, B.; Chambault, P.; Brzins, R.; Entraygues, M.; Kelle, L.; Turny, A.; Le Maho, Y.; Chevallier, D. Identification of key marine areas for conservation based on satellite tracking of post-nesting migrating green turtles (Chelonia mydas). Biol. Conserv. 2015, 184, 36–41. [Google Scholar] [CrossRef]
  96. Hart, K.M.; Lamont, M.M.; Fujisaki, I.; Tucker, A.D.; Carthy, R.R. Common coastal foraging areas for loggerheads in the Gulf of Mexico: Opportunity for marine conservation. Biol. Conserv. 2012, 145, 185–194. [Google Scholar] [CrossRef]
  97. van Dam, R.P.; Diez, C.E.; Balazs, G.H.; Colón-Colón, L.A.; McMillan, W.O.; Schroeder, B. Sex-specific migration patterns of hawksbill turtles breeding at Mona Island, Puerto Rico. Endanger. Species Res. 2008, 4, 85–94. [Google Scholar] [CrossRef] [Green Version]
  98. Hays, G.C.; Metcalfe, J.D.; Walne, A.W. The implications of lung-regulated buoyancy control for dive depth and duration. Ecology 2004, 85, 1137–1145. [Google Scholar] [CrossRef] [Green Version]
  99. Bresette, M.J.; Witherington, B.E.; Herren, R.M.; Bagley, D.A.; Gorham, J.C.; Traxler, S.L.; Crady, C.K.; Hardy, R. Size-class partitioning and herding in a foraging group of green turtles Chelonia mydas. Endanger. Species Res. 2010, 9, 105–116. [Google Scholar] [CrossRef]
  100. Herren, R.M.; Bagley, D.A.; Bresette, M.J.; Holloway-Adkins, K.G.; Clark, D.; Witherington, B.E. Sea turtle abundance and demographic measurements in a marine protected area in the Florida Keys, USA. Herpetol. Conserv. Biol. 2018, 13, 224–239. [Google Scholar]
  101. Tröeng, S.; Evans, D.R.; Harrison, E.; Lagueux, C.J. Migration of green turtle Chelona mydas from Tortuguero, Costa Rica. Mar. Biol. 2005, 148, 435–447. [Google Scholar] [CrossRef]
  102. Tröeng, S.; Dutton, P.H.; Evans, D. Migration of hawksbill turtles Eretmochelys imbricate from Tortuguero, Costa Rica. Ecography 2005, 28, 394–402. [Google Scholar] [CrossRef]
  103. Blumenthal, J.M.; Solomon, J.L.; Bell, C.D.; Austin, T.J.; Ebanks-Petrie, G.; Coyne, M.S.; Broderick, A.C.; Godley, B.J. Satellite tracking highlights the need for international cooperation in marine turtle management. Endanger. Species Res. 2006, 2, 51–61. [Google Scholar] [CrossRef] [Green Version]
  104. Horrocks, J.A.; Krueger, B.H.; Fastigi, M.; Pemberton, E.L.; Eckert, K.L. International movements of adult female hawksbill turtles (Eretmochelys imbricata): First results from the Caribbean’s Marine Turtle Tagging Centre. Chelonian Conserv. Biol. 2011, 10, 18–25. [Google Scholar] [CrossRef]
  105. Hawkes, L.A.; Tomás, J.; Revuelta, O.; León, Y.M.; Blumenthal, J.M.; Broderick, A.C.; Fish, M.; Raga, J.A.; Witt, M.J.; Godley, B.J. Migratory patterns in hawksbill turtles described by satellite tracking. Mar. Ecol. Prog. Ser. 2012, 461, 223–232. [Google Scholar] [CrossRef] [Green Version]
  106. Revuelta, O.; Hawkes, L.A.; León, Y.M.; Godley, B.J.; Raga, J.A.; Tomás, J. Evaluating the importance of Marine Protected Areas for the conservation of hawksbill turtles Eretmochelys imbricata nesting in the Dominican Republic. Endanger. Species Res. 2015, 27, 169–180. [Google Scholar] [CrossRef] [Green Version]
  107. Becking, L.E.; Christianen, M.J.A.; Nava, M.I.; Miller, N.; Willis, S.; van Dam, R.P. Post-breeding migration routes of marine turtles from Bonaire and Klein Bonaire, Caribbean Netherlands. Endanger. Species Res. 2016, 30, 117–127. [Google Scholar] [CrossRef] [Green Version]
  108. Lagueux, C.J.; Campbell, C.L.; Strindberg, S. Artisanal green turtle, Chelonia mydas, fishery of Caribbean Nicaragua: I. Catch rates and trends, 1991–2011. PLoS ONE 2014, 9, e94667. [Google Scholar] [CrossRef]
  109. Mortimer, J.A.; Meylan, P.A.; Donnelly, M. Whose turtles are they, anyway? Mol. Ecol. 2007, 16, 17–18. [Google Scholar] [CrossRef]
  110. Foley, A.M.; Schroeder, B.A.; Hardy, R.; MacPherson, S.L.; Nicholas, M.; Coyne, M.S. Postnesting migratory behavior of loggerhead sea turtles Caretta caretta from three Florida rookeries. Endanger. Species Res. 2013, 21, 129–142. [Google Scholar] [CrossRef] [Green Version]
  111. Eggleston, D.B.; Lipcius, R.N.; Miller, D.L.; Coba-Cetina, L. Shelter scaling regulates survival of juvenile Caribbean spiny lobster Panulirus argus. Mar. Ecol. Prog. Ser. 1990, 62, 79–88. [Google Scholar] [CrossRef]
  112. Aleska, K.T.; Sasso, C.R.; Nero, R.W.; Evans, D.R. Movements of leatherback turtles (Dermochelys coriacea) in the Gulf of Mexico. Mar. Biol. 2018, 165, 158. [Google Scholar] [CrossRef]
  113. Kraus, R.T.; Wells, R.J.D.; Rooker, J.R. Horizontal movements of Atlantic blue marlin (Makaira nigricans) in the Gulf of Mexico. Mar. Biol. 2011, 158, 699–713. [Google Scholar] [CrossRef]
  114. Hueter, R.E.; Tyminski, J.P.; de la Parra, R. Horizontal movements, migration patterns, and population structure of whale sharks in the Gulf of Mexico and northwestern Caribbean Sea. PLoS ONE 2013, 8, e71883. [Google Scholar] [CrossRef]
  115. Cuevas-Gómez, G.A. Identificación de Áreas de Crianza para el Tiburón Martillo Sphyrna lewini (Griffith y Smith, 1834) en el sur del GOLFO de México Usando Datos Dependientes de la Pesca. Master’s Thesis, El Colegio de la Frontera Sur, Campeche, Mexico, 2018. [Google Scholar]
  116. Sea Turtle Conservancy. Available online: https://www.conserveturtles.org/sea-turtle-tracking-list-of-sea-turtle-tracking-projects/ (accessed on 11 April 2021).
  117. Girard, C.; Tucker, A.; Calmettes, B. Post-nesting migrations of loggerhead sea turtles in the Gulf of Mexico: Dispersal in highly dynamic conditions. Mar. Biol. 2009, 156, 1827–1839. [Google Scholar] [CrossRef]
  118. Dunn, D.C.; Harrison, A.L.; Curtice, C.; DeLand, S.; Donnelly, B.; Fujioka, E.; Heywood, E.; Kot, C.Y.; Poulin, S.; Whitten, M.; Åkesson, S.; et al. The importance of migratory connectivity for global ocean policy. Proc. R. Soc. B 2019, 286, 20191472. [Google Scholar] [CrossRef]
  119. Eckert, K.; Azanza-Ricardo, J.; Barrientos-Muñoz, K.G.; Barrios-Garrido, H.; Bevan, E.; Baumbach, D.; Berkel, J.; Campbell, C.L.; Cuevas, E.; Charles, K.; et al. Sea Turtles of the Caribbean. State of the World’s Sea Turtle (SWOT). Available online: https://www.seaturtlestatus.org/articles/2020/2/25/sea-turtles-of-the-caribbean (accessed on 31 April 2021).
Figure 1. Migratory routes of the Kemp’s ridley (L. kempii), hawksbill (E. imbricata), green (C. mydas), and loggerhead (C. caretta) individuals that were satellite-tracked from their nesting beaches (black dots) on the Atlantic coast of Mexico, to their final feeding and residency sites (orange stars).
Jmse 09 00793 g001
Figure 2. Internesting areas delimited for post-nesting sea turtle individuals of four species satellite-tracked from their nesting beaches (black dots, [4]) in the Gulf of Mexico and West Caribbean.
Jmse 09 00793 g002
Figure 3. Final feeding and residency habitats of individuals from four sea turtle species satellite-tracked from the Gulf of Mexico and the Western Caribbean.
Jmse 09 00793 g003
Figure 4. Use intensity of migratory corridors for adult reproductive females of Kemp’s ridley (a), hawksbills (b), green (c) and loggerhead (d) turtles nesting on the Atlantic coast of Mexico. The color scale is based on the use intensity that in this case alludes to the number of individuals that used the corridor.
Jmse 09 00793 g004
Figure 5. Spatial connectivity of the ocean basins in the West Atlantic (a) depicted by the individuals of the four sea turtle species moving from the Mexican littoral, and the connectivity between national water (b) in the West Atlantic. (Car: Caribbean, GoM: Gulf of Mexico, Atl: Atlantic).
Jmse 09 00793 g005
Figure 6. Descriptive statistics and hypothesis test for the physical variables of internesting home ranges of post-nesting sea turtles. A pairwise Wilcoxon Rank Sum hypothesis test is presented as inset table for comparisons between species.
Jmse 09 00793 g006
Figure 7. Physical variables for feeding and residency home ranges of the post-nesting sea turtles of four distinct species satellite-tracked from their nesting beaches at the Gulf of Mexico and West Caribbean. A pairwise Wilcoxon Rank Sum hypothesis test is presented as inset table for comparisons between species.
Jmse 09 00793 g007
Figure 8. Descriptive statistics and hypothesis test for physical variables for migratory corridors of post-nesting sea turtles of the four distinct species satellite-tracked from their nesting beaches at the Gulf of Mexico and West Caribbean. A pairwise Wilcoxon Rank Sum hypothesis test is presented as inset table for comparisons between species.
Jmse 09 00793 g008
Publisher’s Note: MDPI stays neutral with regard to jurisdictional claims in published maps and institutional affiliations.

