Article

The Relationship between Psycholinguistic Features of Religious Words and Core Dimensions of Religiosity: A Survey Study with Japanese Participants

1
Department of Psychology, Hiroshima University, Hiroshima 739-8524, Japan
2
Department of Psychology, University of Fribourg, CH-1700 Fribourg, Switzerland
*
Author to whom correspondence should be addressed.
Submission received: 1 October 2020 / Revised: 4 December 2020 / Accepted: 9 December 2020 / Published: 15 December 2020
(This article belongs to the Special Issue Research with the Centrality of Religiosity Scale (CRS))

Abstract

:
Previous studies have reported that religious words and religiosity affect mental processes and behaviors. However, it is unclear what psycholinguistic features of religious words (e.g., familiarity, imageability, and emotional aspects) are associated with each dimension of personal religiosity (intellect, ideology, public practice, private practice, and experience). The purpose of this study was to examine whether and how the above-mentioned psycholinguistic features of religious words correlate with each of the core dimensions of religiosity. Japanese participants evaluated four psycholinguistic features of twelve religious words using a 5-point Semantic Differential scale for familiarity and imageability and a 9-point Self-Assessment Manikin (SAM) scale for emotional valence and emotional arousal. The participants also rated their own religiosity using the Japanese version of the Centrality of Religiosity Scale (JCRS). The results of the study revealed that (1) the scales measuring the psycholinguistic features of religious words were statistically reliable; (2) the JCRS was reliable; (3) the familiarity, emotional valence, and emotional arousal of religious words and each mean dimensional score of the JCRS score correlated positively with each other; and (4) highly religious people had higher familiarity and higher emotional arousal to religious words than non-religious people, whereas highly religious people had higher emotional valence to religious words in comparison with non-religious and religious people. In addition, religious people had higher familiarity to religious words than non-religious people. Taken together, these findings suggest that psycholinguistic features of religious words contribute to the detection of religiosity.

1. Introduction

Maybe the most known and indicative quote that shows the association of language and religion is the beginning of the Book of John in the Bible, which says, “In the beginning was the Word, and the Word was with God, and the Word was God.” This quote shows how central the word is to, in this case, Christian belief. In addition, for Shinto, which is one of eastern religions in Japan, a Japanese word kotodama means that words include the power of gods (kami or kamisama in Japanese) lying in prayers’ words (Hara 2001). Thus, words play essential roles for religions and their practices.
Religious words generally refer to religious and immaterial concepts, such as abstract ideas (e.g., God), religious practices (e.g., meditation), and religious experiences (e.g., enlightenment), whereas other types of abstract words do not refer specifically to religious concepts (e.g., rule). They also have psycholinguistic features, such as familiarity (i.e., familiar or unfamiliar), imageability (i.e., imageable or non-imageable), emotional valence (i.e., positive or negative), and emotional arousal (i.e., calm or excited). These psycholinguistic features are also regarded as lexicosemantic and emotional features, not performative or pragmatic features (e.g., Citron et al. 2014). The psycholinguistic features have been measured by subjective ratings (e.g., Benjafield and Muckenheim 1989). Moreover, the usage of religious words affects mental processes and behaviors. For example, the use of religious words influences political opinions (Williams et al. 2017) through priming effects, as well as prosocial behaviors (Preston and Ritter 2013; Shariff et al. 2016). However, although many studies have identified some psycholinguistic features (e.g., familiarity and imageability) of words in different languages (Benjafield et al. 1993; Benjafield and Muckenheim 1989; Boukadi et al. 2016; Brysbaert and New 2009; Citron et al. 2014; Gilhooly and Hay 1977; Gilhooly and Logie 1980; Guasch et al. 2016; Juhasz et al. 2015; Kambara and Umemura, forthcoming; Pratt and Goss 1977; Stadthagen-Gonzalez and Davis 2006; Stratton et al. 1975; Yao et al. 2017; Yee 2017), so far no study has identified the psycholinguistic features of religious words and explored their relationships with other religious factors (e.g., personal religiosity).

1.1. Religiosity

Previous studies have demonstrated connections between religiosity and individuals’ behaviors or their attitudes. For example, church attendance significantly decreases the occurrence of the behavior of cheating on one’s partner (Bloodgood et al. 2008) and has significant positive effects on moral attitudes (Scheepers et al. 2002). Religiosity and religious commitment were also associated with gratitude (Aghababaei et al. 2018; Rosmarin et al. 2011). Recalling spiritual experiences enhanced feelings of awe, small self, and spiritual humility (Preston and Shin 2017).
In addition, religiosity was also related to individuals’ use of religious words. Specifically, people with a religious affiliation tend to use more religious words (e.g., Jesus), positive words (e.g., love), and social words (e.g., family) on social media, whereas people without religious affiliation tend to use more physical (e.g., head), negative (e.g., hate), and cognitive words (e.g., expected; Ritter et al. 2014; Yaden et al. 2018). Other recent findings have also shown that Christians and Buddhists differentially use words on social media (Chen and Huang 2019). These findings suggest that religiosity affects participants’ behaviors or attitudes including the usage of religious words. However, how religiosity is associated with the evaluations of psycholinguistic features of religious words has yet to be studied.
Regarding the context of Japanese culture, some previous studies have investigated Japanese religiosity in Japan and the United States (e.g., McClenon 1993; Tarn et al. 2005). In addition, Clobert (2020) reported that there are differences between religiosity components in Western and Eastern religions. On the other hand, no study has clarified how Japanese participants evaluate religious words. Therefore, we set this as a goal of the present study.

1.2. Study Goals and Hypotheses

The main goal of this study is to examine the relationships between some psycholinguistic features of religious words (i.e., familiarity, imageability, emotional valence, and emotional arousal) and the five core dimensions of religiosity (i.e., intellect, ideology, public practice, private practice, and experience; see Huber and Huber 2012). These psycholinguistic features of words are subjective ratings of lexicosemantic (i.e., familiarity and imageability) and emotional features (i.e., emotional valence and emotional arousal) of words (e.g., Citron et al. 2014), whereas the five core dimensions of religiosity were identified by the Centrality of Religiosity Scale, which measures the intellectual dimensions, the dimensions of ideology, public practice, private practice, and experience (Huber and Huber 2012). To test the link of the psycholinguistic features of religious words among each other and with the five core dimensions of religiosity, we posed two hypotheses in this study.
First, we hypothesized that the familiarity, imageability, emotional valence, and emotional arousal of religious words would be significantly associated with each core dimension of religiosity (intellect, ideology, public practice, private practice, and experience; see Huber and Huber 2012). One of the reasons for this hypothesis was that religious people are likely to be familiar with, imagine, prefer, and be excited about religious words in their daily life. This hypothesis is consistent with a previous study, which examined the relationship between people with a religious affiliation and their language usage in social media (Yaden et al. 2018).
Second, we hypothesized that, for religious words, familiarity positively correlates with imageability. Familiarity is associated with recent exposure to a word (Clark and Paivio 2004), whereas imageability is associated with the capacity of a word to activate non-verbal imagery (Paivio et al. 1968). If people can imagine the content of certain words, they feel familiar with these words. Many studies provided support for this idea (Benjafield et al. 1993; Benjafield and Muckenheim 1989; Boukadi et al. 2016; Citron et al. 2014; Gilhooly and Hay 1977; Gilhooly and Logie 1980; Guasch et al. 2016; Juhasz et al. 2015; Kambara and Umemura, forthcoming; Pratt and Goss 1977; Stadthagen-Gonzalez and Davis 2006; Stratton et al. 1975; Yao et al. 2017; Yee 2017); however, they did not deal with religious words specifically, which is therefore done in the present investigation.
In the present study, the authors made four predictions. First, the psychological scales aimed at identifying the psycholinguistic features of religious words would be statistically reliable. Second, the JCRS would also be statistically reliable. Third, the four psycholinguistic features of religious words (familiarity, imageability, emotional valence, and emotional arousal) would correlate positively with all the five dimensions of the JCRS (intellect, ideology, public practice, private practice, and experience). Fourth, familiarity would positively correlate with imageability.

2. Method

2.1. Participants and Procedure

To realize the goal of the study, we asked Japanese participants (students from Hiroshima University and interested lay people) to evaluate psycholinguistic features of religious words and their own religiosity. Two hundred and seventy-nine participants (191 women, 70%) joined this study. The mean age of the participants was 20.70 years old (SD = 3.98). Participants’ religious affiliation was not assessed in this study, since this study focused only on the religiosity of the participants in general, without focusing on specific religions and differences among them. All participants were native Japanese speakers. Authors individually asked each participant to join this survey study at or around Hiroshima University. After participants could understand and accept this survey study, they started answering the questionnaire. They provided written informed consent, and the study was approved by the ethics committee of Graduate School of Education at Hiroshima University.

2.2. Religious Words

We collected word stimuli based on a previous study (Ritter and Preston 2013) and our own knowledge, considering that Japanese people have different religious affiliations (e.g., Tarn et al. 2005). Twelve religious words were picked for this study (kamisama (God), meisou (meditation), satori (enlightenment), inori (praying), shigonosekai (afterlife), shuukyou (religion), tamashii (soul), danjiki (fasting), seiten (holy book), gishiki (ceremony), yogen (prophecy), and ai (love)). Although this is a relatively small number compared with other types of words investigated by other researchers (e.g., Brysbaert and New 2009), this corresponds with previous studies on religious words (Ritter and Preston 2013) and it is also due to the decision of using only religious words referring to religious concepts.
Given that only Japanese words were used in this study, we should clarify the psycholinguistic features of Japanese religious words. We selected familiarity, imageability, emotional valence, and emotional arousal as the psycholinguistic features measured in this study, following a common practice in the literature (Benjafield et al. 1993; Benjafield and Muckenheim 1989; Boukadi et al. 2016; Citron et al. 2014; Gilhooly and Hay 1977; Gilhooly and Logie 1980; Guasch et al. 2016; Juhasz et al. 2015; Kambara and Umemura, forthcoming; Pratt and Goss 1977; Stadthagen-Gonzalez and Davis 2006; Stratton et al. 1975; Yao et al. 2017; Yee 2017). These psycholinguistic features would also be subjectively lexicosemantic and emotional features of religious words, not performative or pragmatic features (e.g., Citron et al. 2014).
Using a paper-based questionnaire, all participants subjectively evaluated the Familiarity, Imageability, Emotional Valence, and Emotional Arousal of each religious word (the authors capitalized the first letter of the psycholinguistic features written in the method and results sections for clarification). First, the Familiarity and Imageability ratings of each religious word were evaluated on a 5-point Semantic Differential scale, ranging from 1 (unfamiliar/unimageable) to 5 (familiar/imageable; Osgood et al. 1957). Second, the Emotional Valence and Emotional Arousal ratings of each religious word were evaluated using the Self-Assessment Manikin (SAM), in which the participants chose one of nine manikins who visually expressed an Emotional Valence on a scale from 1 (unpleasant) to 9 (pleasant), and Emotional Arousal on a scale from 1 (calm) to 9 (excited; Bradley and Lang 1994; Lang 1980). In the paper-based questionnaire, all religious words used Japanese Katakana characters, which are one of three Japanese characters (i.e., Katakana, Hiragana, and Kanji).

2.3. The Japanese Version of the CRS (JCRS)

To identify the centrality and the multidimensional structure of the religiosity of Japanese participants, the English version of the Centrality of Religiosity Scale (CRS; Huber and Huber 2012) was translated into the Japanese language (JCRS). The CRS measures the personal importance of five core dimensions of religiosity (public practice, private practice, religious experience, ideology, and intellect) and derives an index for the centrality of religiosity in the personality. In the 17 years since the first publication of the CRS (Huber 2003), 610 applications of this scale have been documented in various countries including Christian and non-Christian religious cultures (Islam: 106, Judaism: 3, Buddhism: 11, Hinduism: 18; Huber et al., 2020). This broad interreligious reception of the CRS can be taken as an indication of the interreligious applicability of the scale.
The JCRS was translated from the English version, whose validity and reliability have been previously evaluated (Huber and Huber 2012). The entire scale included twenty items, which is the long interreligious form denoted as CRSi-20 by the authors. The long interreligious version of the CRSi-20 has shorter derivates i.e., the CRSi-14 with 14 items and the CRSi-7 with 7 items. The counterpart of the interreligious version of the CRS is the non-interreligious version, which is suitable for Abrahamitic religious traditions (i.e., Judaism, Islam, and Christianity). Same as for the interreligious version, there is a short, intermediate, and long form, CRS-5, CRS-10, and CRS-15, respectively. The CRSi-20 contains all items and allows for the derivation of each shorter version.
Each of the scales contains an equal number of items for each of the core dimensions of ideology (ide), intellect (int), experience (exp), private practice (priv), and public practice (publ). Consequently, the CRS-5 has one item each, the CRS-10 has two items and the CRS-15 has three items per core dimension. In the interreligious versions, the core dimensions of private practice and religious experience are supplemented by one item each resulting in the CRSi-7 (ide: 1 item; int: 1 item; exp: 2 items; priv: 2 items; publ: 1 item), the CRSi-14 (ide: 2 items; int: 2 items; exp: 4 items; priv: 4 items; publ: 2 items), and the CRSi-20 (ide: 3 items; int: 3 items; exp: 5 items; priv: 6 items; publ: 3 items). According to the authors of the scale, the supplemented items and their original counterpart in the interreligious version are merged together by taking only the highest (maximum) value of both. This procedure guarantees that each dimension receives equal weight in the composite scores, which are calculated as the average of all items. The composite score is called the CRS-index and ranges from a minimum of 1 to a maximum of 5. It allows for further categorization of the respondents’ scores according to the ranking of non-religious, religious, and highly religious individuals.
We asked participants to choose the most appropriate number from 1 (associated with never or not at all) to 5 (associated with very often or very much so) after reading each item (see Appendix A, Table A1 for Japanese and English formulation of the questions). The translation from the English version to the JCRS did not involve a back-translation; however, all versions of the JCRS have proven to be reliable (for details see the results section). To guarantee an appropriate psychometric function of the translated CR-Scale, we ran an exploratory as well as confirmatory factor analyses (more on this in Section 2.5).

2.4. Preliminary Data Check

The CRS as a psychometric tool for the assessment of religiosity was introduced to the Japanese context for the first time. Especially the validation of the CRS demanded that attention be given to the quality of the data collected. Visual inspection of the data revealed that none of the items sample distributions are close to normal (see histograms in Appendix B for details). Therefore, in the analyses, we neither assumed normality of the data nor multivariate normality, leading to a simplified procedure during the exploratory factor analysis and adaptation of the estimator and data level in the confirmatory factor analysis. More on this issue will be described in the following paragraphs.

2.5. Analyses

The analyses of all features of religious words (Familiarity, Imageability, Emotional Valence, and Emotional Arousal) and the JCRS consisted of two steps. First, we calculated Cronbach’s alphas to evaluate the psycholinguistic features of religious words and the JCRS. This step was necessary to examine the reliability of each item on the scale.
Based on previous studies (Ackert et al. 2020a; Demmrich 2020; Esperandio et al. 2019; Huber and Huber 2012), we conducted an exploratory factor analysis (EFA) using a maximum likelihood extraction method with the extraction of one factor. Thereby, the plausibility of the assessment of the concept of the centrality of religiosity with all versions of the CRS could be examined. After the EFA reasonableness check, we conducted a confirmatory factor analysis (CFA) on all CRS versions with a factor structure proposed by the authors of the scale. Huber and Huber (2012) suggested a five factors solution—i.e., one latent variable for each core dimension—with a second-level factor for the intermediate (CRS-10 and CRSi-14) and long (CRS-15 and CRSi-20) versions and with one factor of centrality of religiosity for the short versions (CRS-5 and CRSi-7). The examined CFA models are depicted in Figure 1, Figure 2, Figure 3, Figure 4, Figure 5 and Figure 6. Models for the CRS-5 (Figure 1) and CRSi-7 (Figure 2) have one latent variable with five reflective items. Each item represents one of the core dimensions of the CRS. The models for the intermediate and long versions of the CRS each have a single second-level latent variable representing the concept of the centrality of religiosity. Moreover, the centrality of religiosity itself reflects on five first-level latent variables representing the core dimensions of the CRS with two reflective items each for the CRS-10 (Figure 3) and the CRSi-14 (Figure 4) or three reflective items for the CRS-15 (Figure 5) and CRSi-20 (Figure 6). The distortion of the sample distributions does not allow for the usage of the maximum likelihood (ML) estimator, not even the robust ML (MLR). As an alternative to the ML estimation, the presented CFA analyses are conducted with the weighted least squares estimator with a correction regarding the mean and variance distortion (WLSMV) by setting the data level to be ordered categorically for all items of the CRS. We decided against a bootstrapping procedure because the sample mainly consisted of undergraduates; therefore, bootstrapping could result in negative values for the CRS items. Model global goodness of fit is examined according to recommendations by Hu and Bentler (1999) with: R M S E A   0.06 ,   90 %   C I 0.06 ,   p c l o s e > 0.05 , S R M R 0.08 , C F I 0.95 , and T L I 0.95 .
Second, four Pearson’s correlation analyses were performed, correlating the subjects’ JCRS scores with each of the four psycholinguistic features. In addition, we performed one-way analysis of variance (ANOVA) tests to examine differences of psycholinguistic features (Familiarity, Imageability, Emotional Valence, and Emotional Arousal) among three groups categorized by the mean JCRSi-7 score (i.e., non-religious, religious, and highly religious groups; see Huber and Huber 2012). The following thresholds were used for the three groups. First, the mean JCRSi-7 scores of the non-religious group were ranged from 1.0 to 2.0. Second, the mean JCRSi-7 scores of the religious group were ranged from 2.1 to 2.9. Third, the mean JCRSi-7 scores of the highly religious group were ranged from 3.0 to 5.0. After the one-way ANOVA tests, we performed post-hoc analyses for multiple comparisons between groups by using Bonferroni’s correction. While a CFA was conducted in Mplus, version 8.3, the other analyses were conducted in SPSS.

3. Results

3.1. Psycholinguistic Features of Religious Words

To examine whether the four psycholinguistic features of religious words were reliable, we calculated Cronbach’s alphas. The Cronbach’s alphas for Familiarity, Imageability, Emotional Valence, and Emotional Arousal were α = 0.89, α = 0.85, α = 0.75, and α = 0.82, respectively. Thus, the four psycholinguistic features of religious words were reliable, since the Cronbach’s alphas of the four psycholinguistic features were higher than 0.70 (Cortina 1993). The mean scores and standard deviations of the four psycholinguistic features of religious words are shown in Table 1. First, the mean Familiarity scores were higher for God, praying, and love than the half score of the scale (3), while those were lower for meditation, enlightenment, afterlife, religion, soul, fasting, holy book, ceremony, and prophecy than the half score of the scale (3). Second, the mean Imageability scores were higher for God, meditation, enlightenment, praying, religion, fasting, holy book, ceremony, prophecy, and love than the half score of the scale (3), whereas the mean Imageability scores of afterlife and soul were lower than the half score of the scale (3). Third, the mean scores of Emotional Valence were higher for God, enlightenment, praying, religion, soul, holy book, and love than the half score of the SAM scale (5), while those were lower for afterlife, fasting, ceremony, and prophecy than the half score of the SAM scale (5). The mean Emotional Valence score of meditation was the half score of the SAM scale (5). Forth, the mean Emotional Arousal score of love was only higher than the half score of the SAM scale (5), whereas the others were lower than the half score of the SAM scale (5).

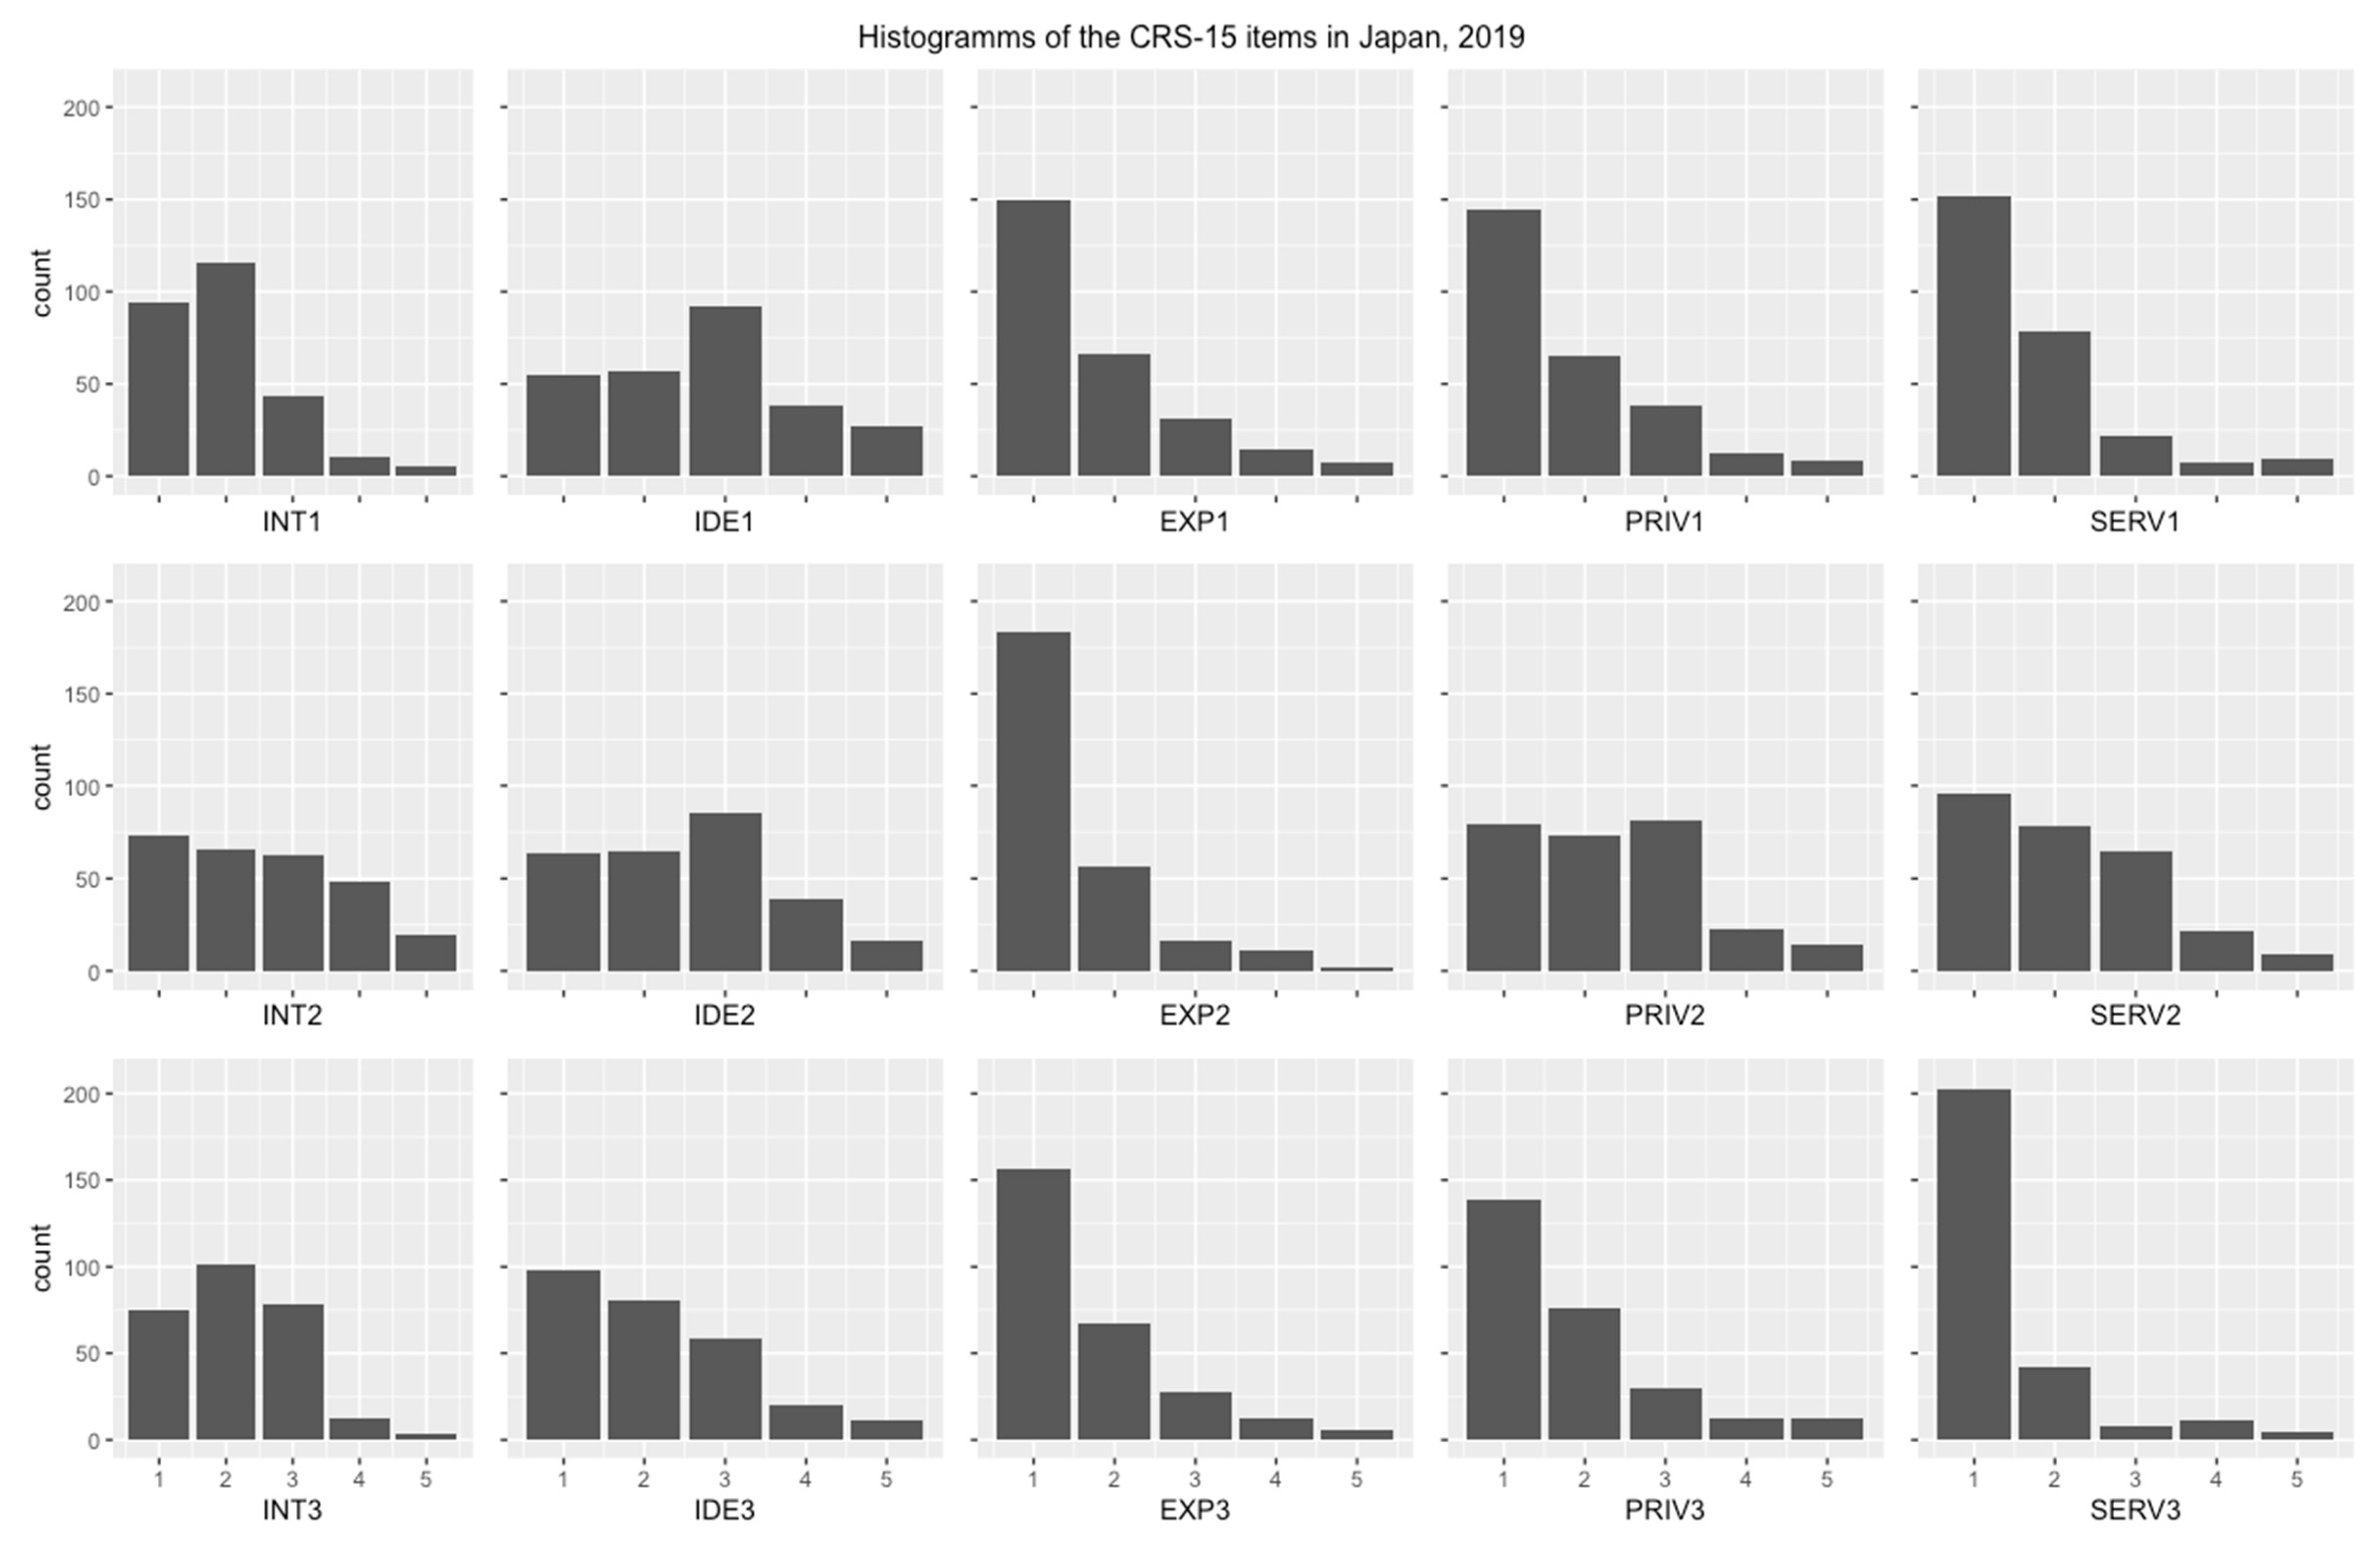
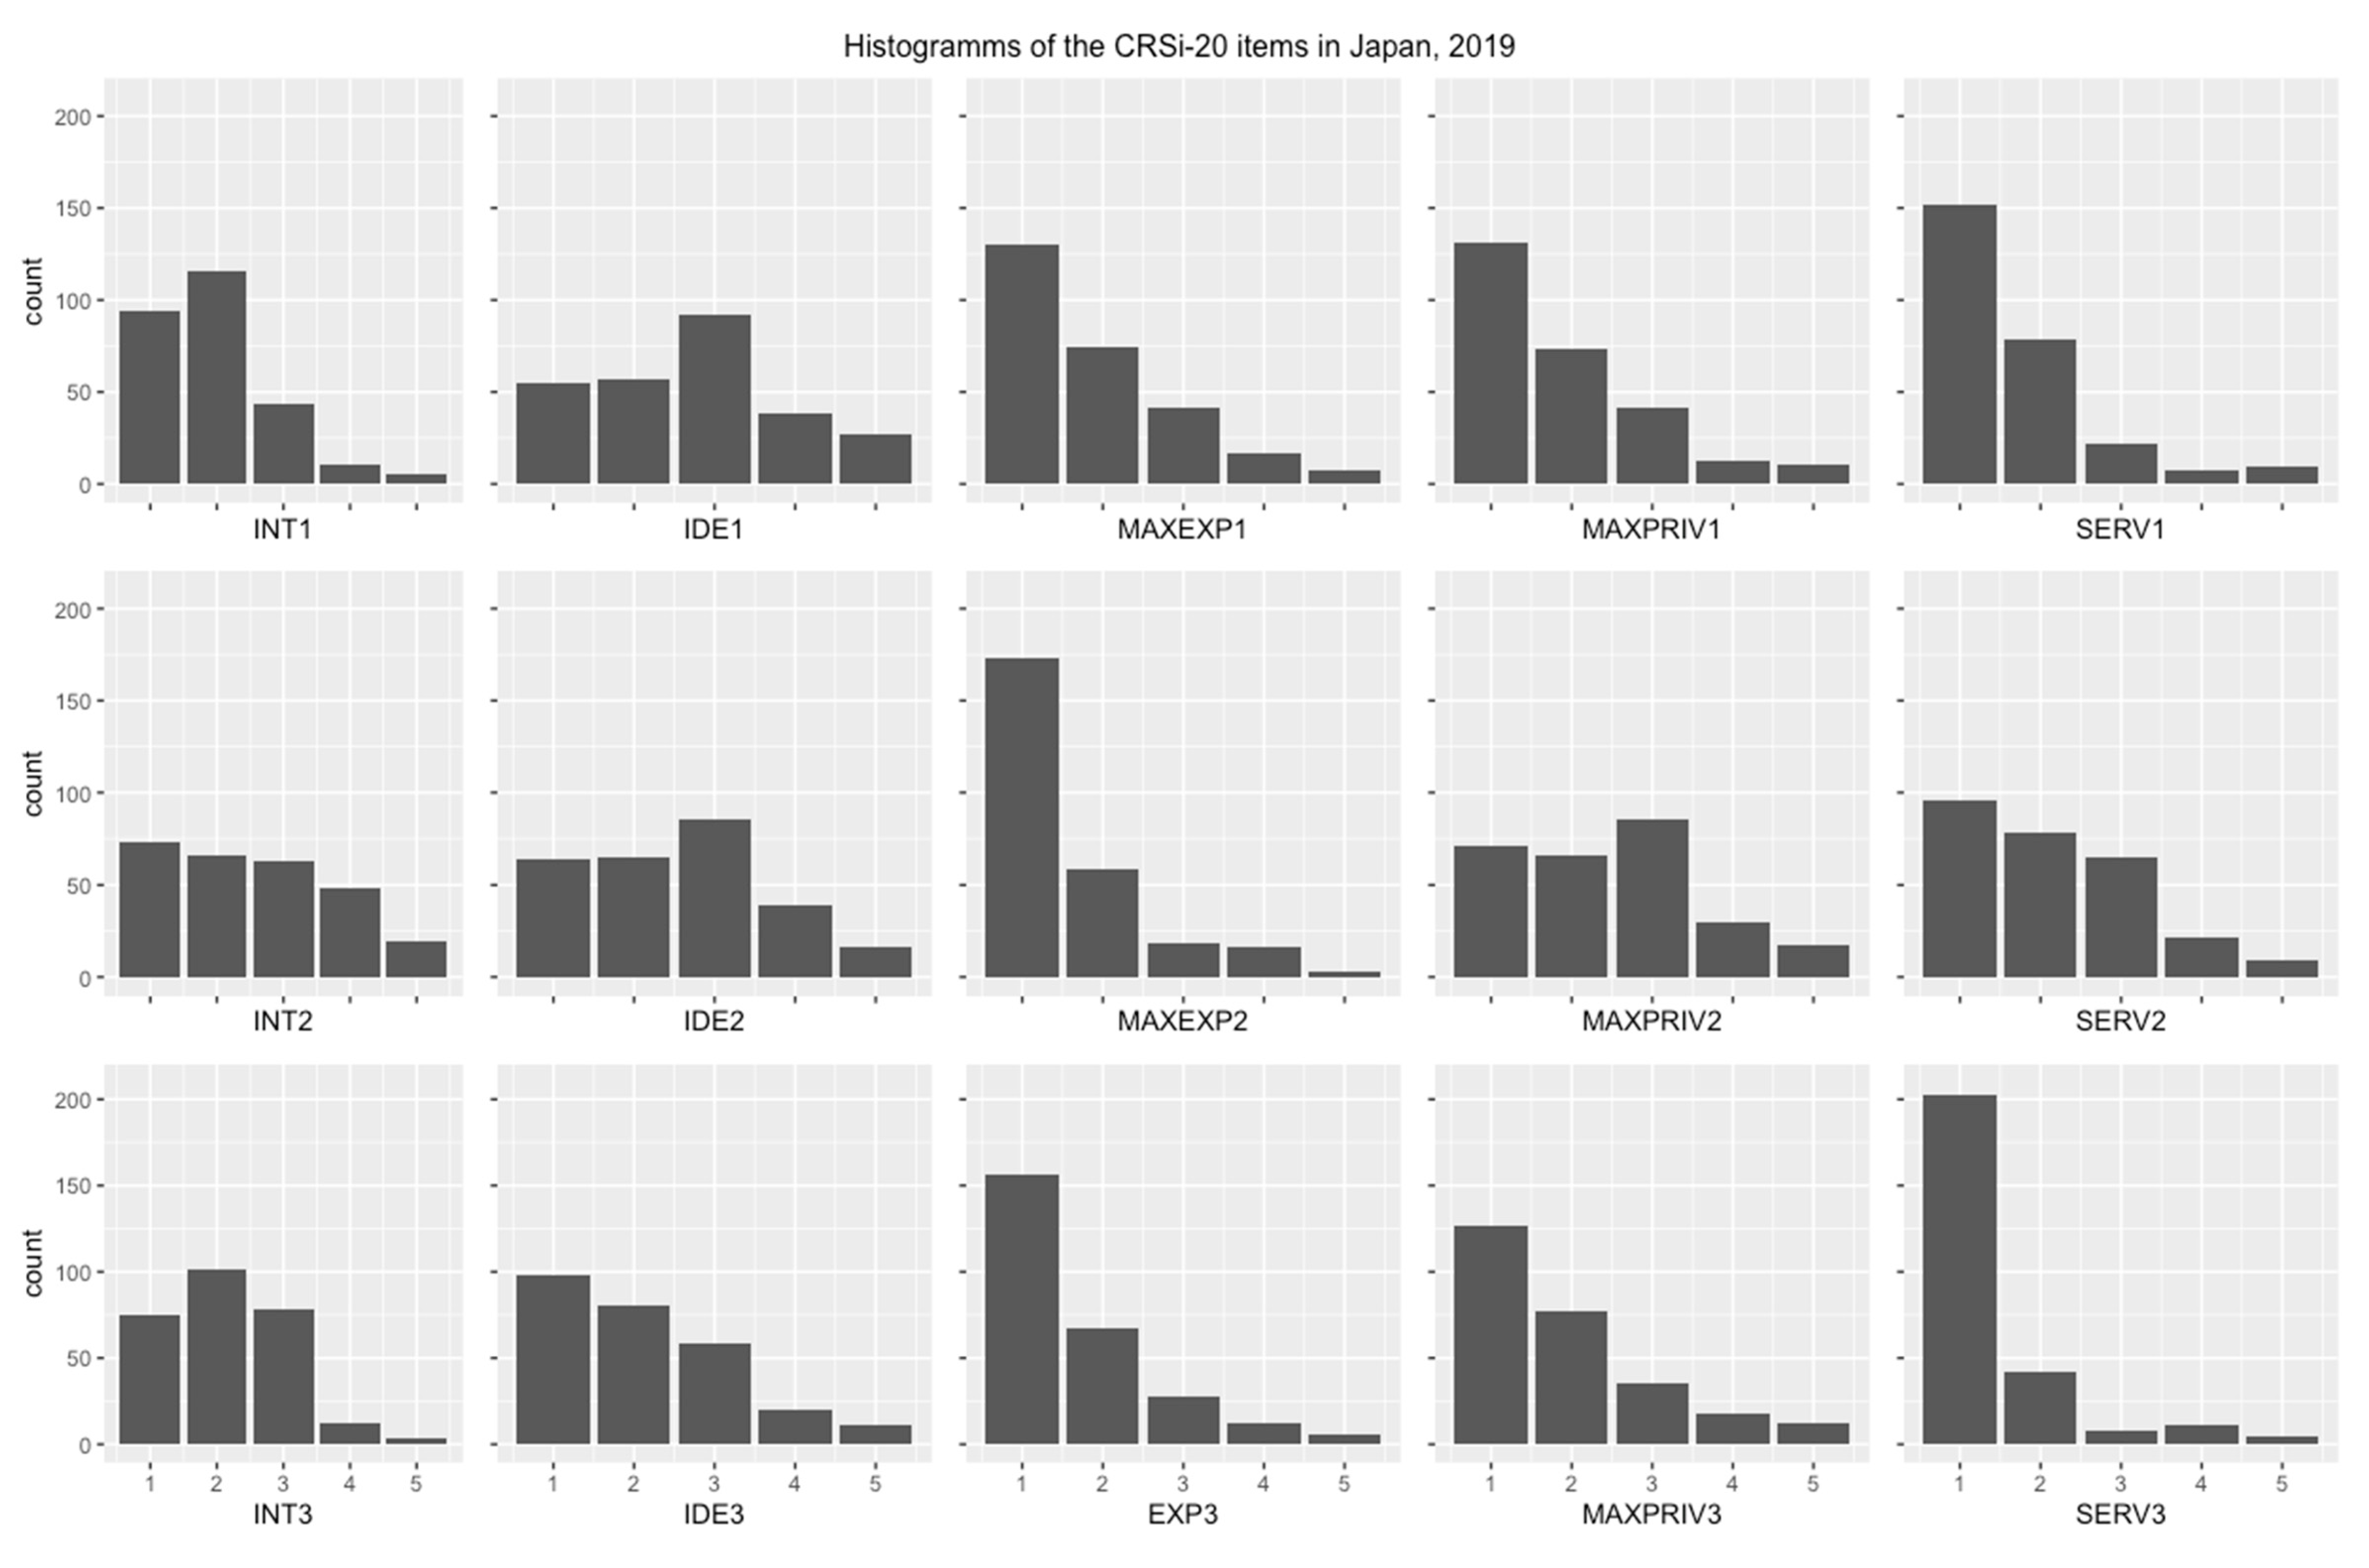
3.2. The Japanese Version of the CRS

To determine whether the Japanese interreligious version of the CRS (JCRSi-20) reliably measures religiosity, we conducted both an EFA and CFA. Regarding the pair items in the interreligious versions of the CRS 4/4b, 5/5b, 9/9b, 10/10b, and 14/14b (see Appendix A for the exact items), we calculated the maximum value (e.g., if a person rated item 4 with five points and item 4b with two points, the person’s score was five on item 4/4b, according to the original validation of the CRS; Huber and Huber 2012).

3.3. Exploratory Factor Analyses

We conducted an EFA using a maximum likelihood extraction with the extraction of one factor (see Table 2 for an overview). The reason for this decision was the unequal distributions of the items as can be seen in the histograms in Appendix B. The EFA aimed to test the idea that all items in all subscales of the CRS can be explained by one factor, which is the theoretical construct of the centrality of religiosity. In that case, the CFA would follow for the proper subscales. If a sufficient part of the variance was common to all items, we proceeded with a five-factor solution as previous studies had already conceptually and empirically suggested for the intermediate and long CRS versions (Ackert et al. 2020a; Demmrich 2020; Esperandio et al. 2019; Huber and Huber 2012). The EFA results showed that the data from each subscale is suitable for factor analysis. The Kaiser-Mayer-Olkin criterion ranges between minimum K M O = 0.81 and maximum K M O = 0.92 and Bartlett’s test for sphericity is significant for every subscale. Explained variance ranged between 47% and 52% with one extracted factor.
Regarding the item loadings, none of the items in the EFAs had a loading lower than 0.40. That is, all had at least 0.43 up to 0.83 for the interreligious (see Table 3 for details) and a minimum of 0.43 and a maximum of 0.80 for the Abrahamitic versions (see Table 4 for details).

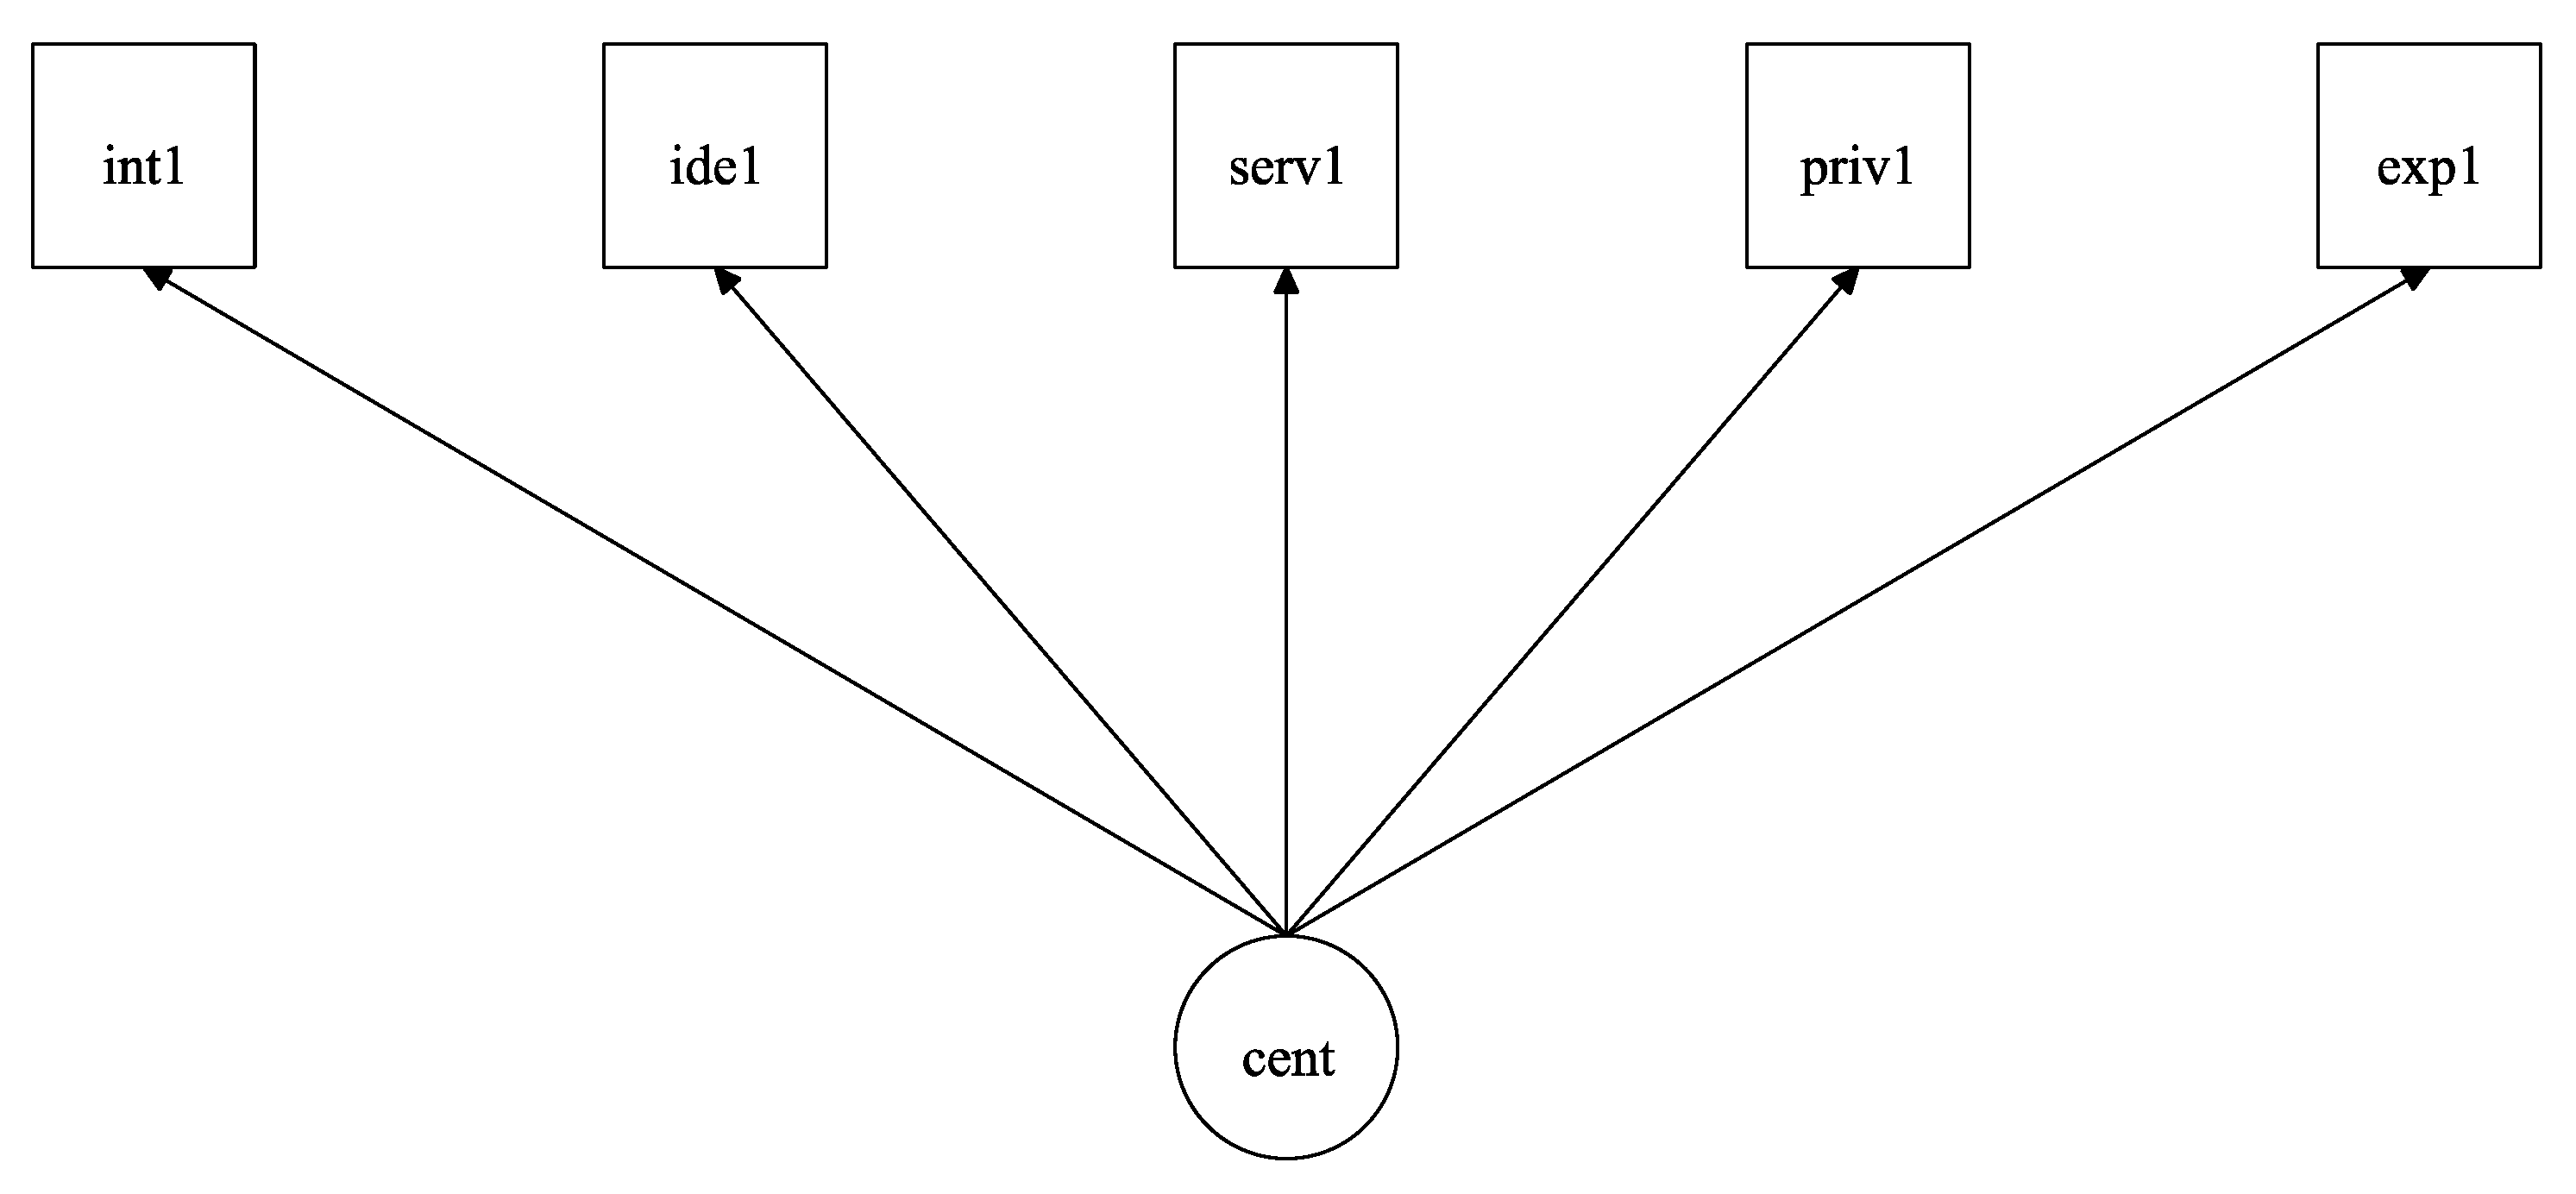
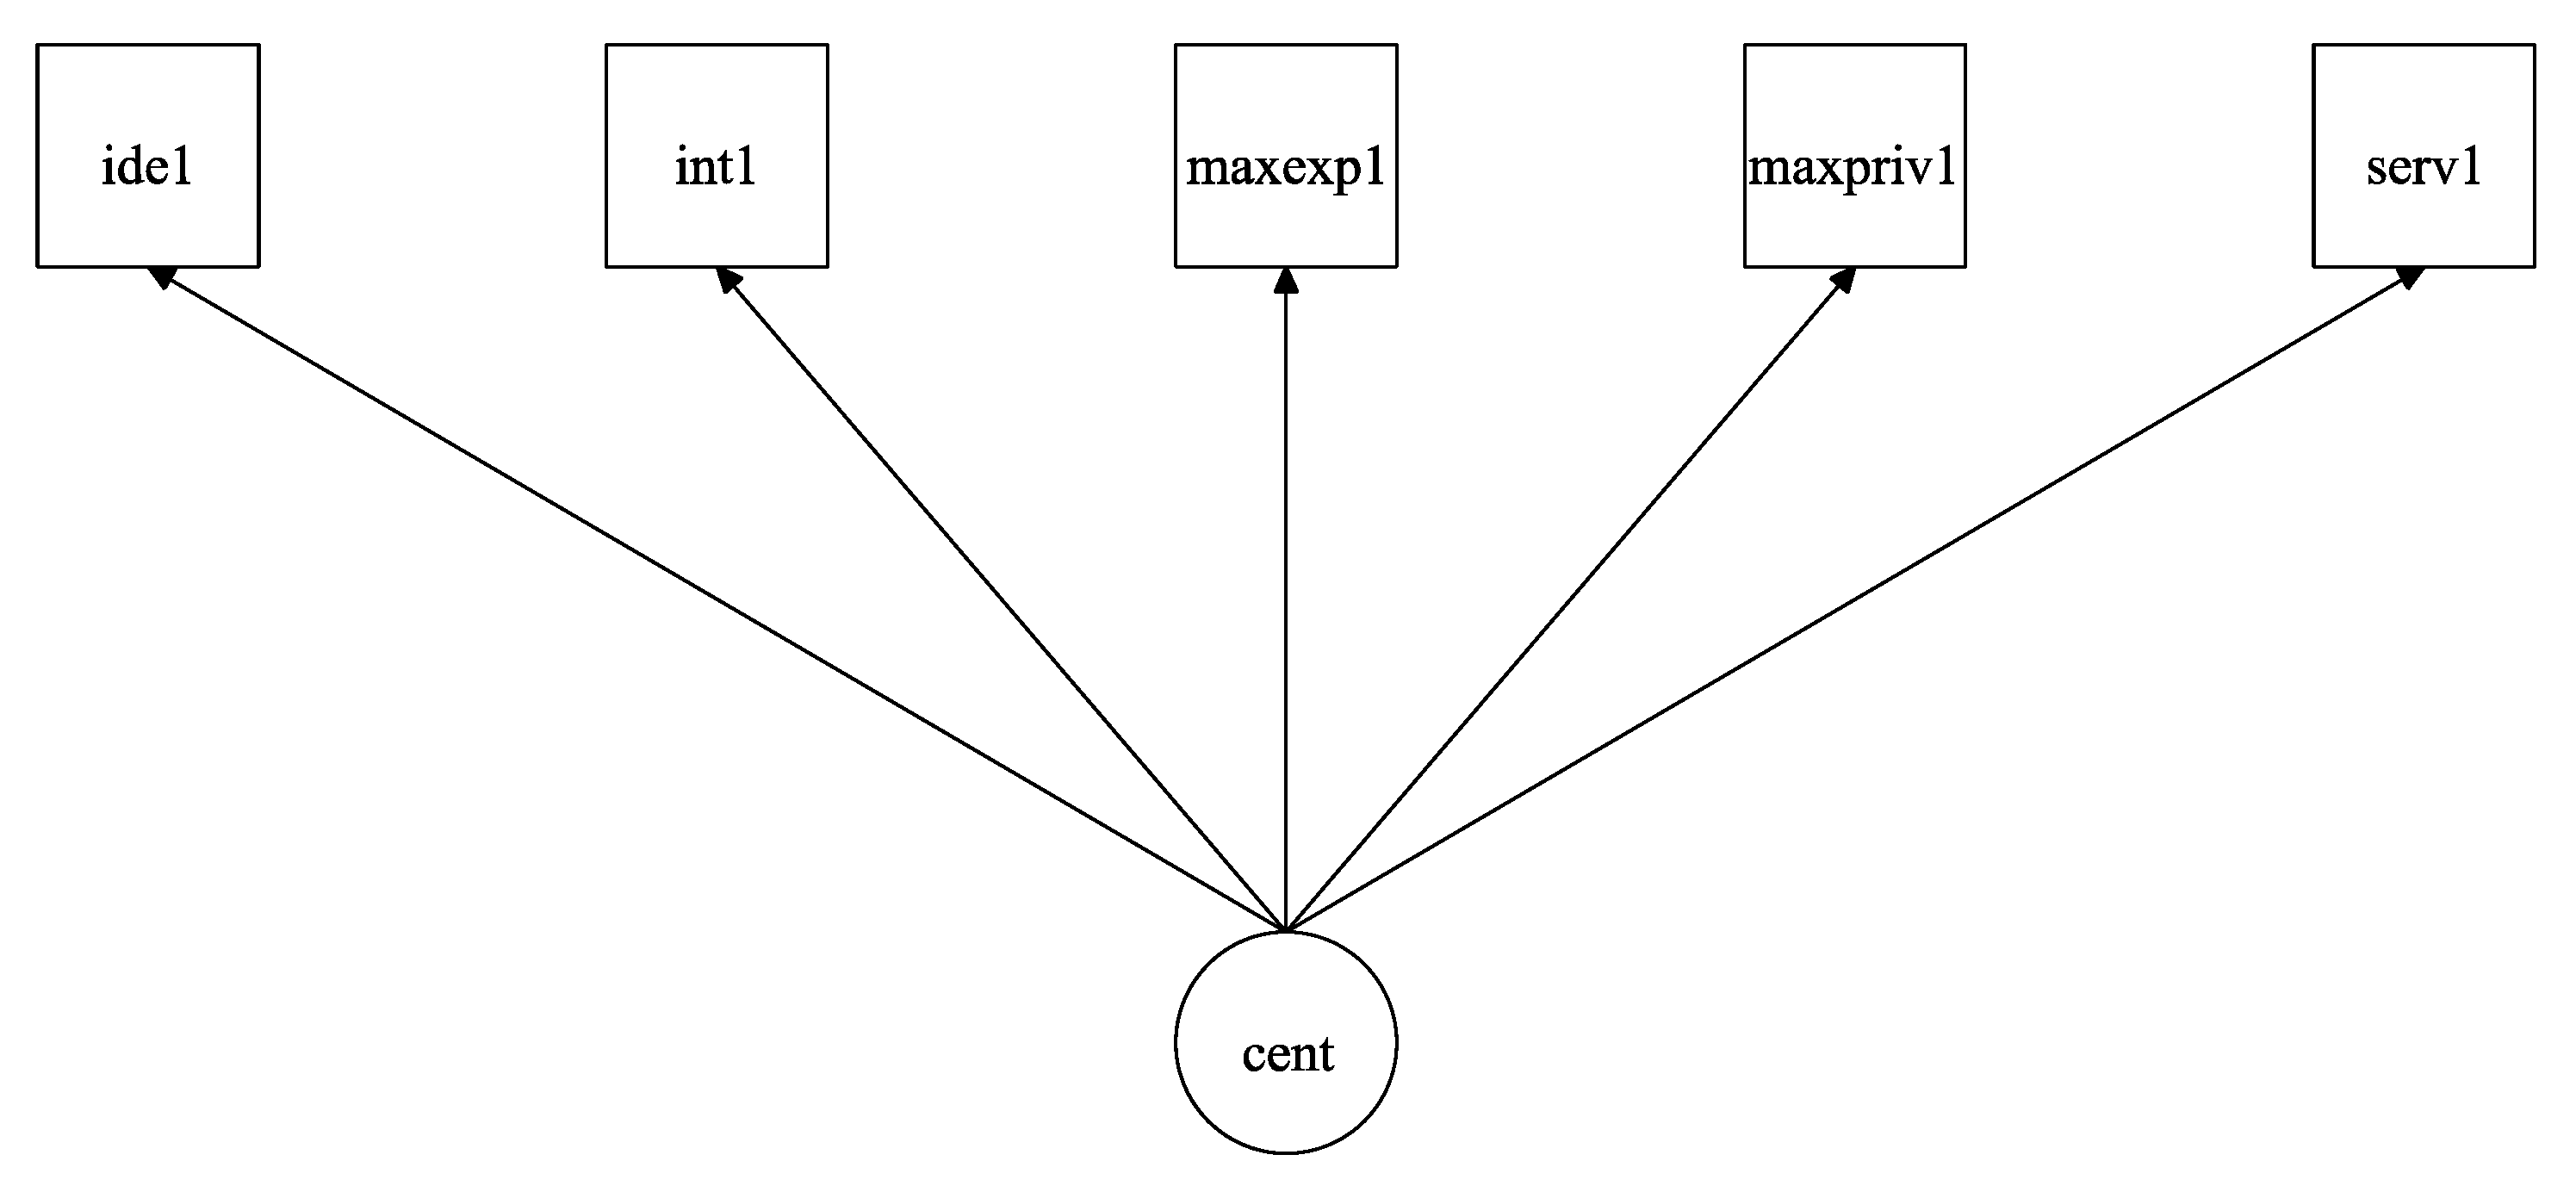
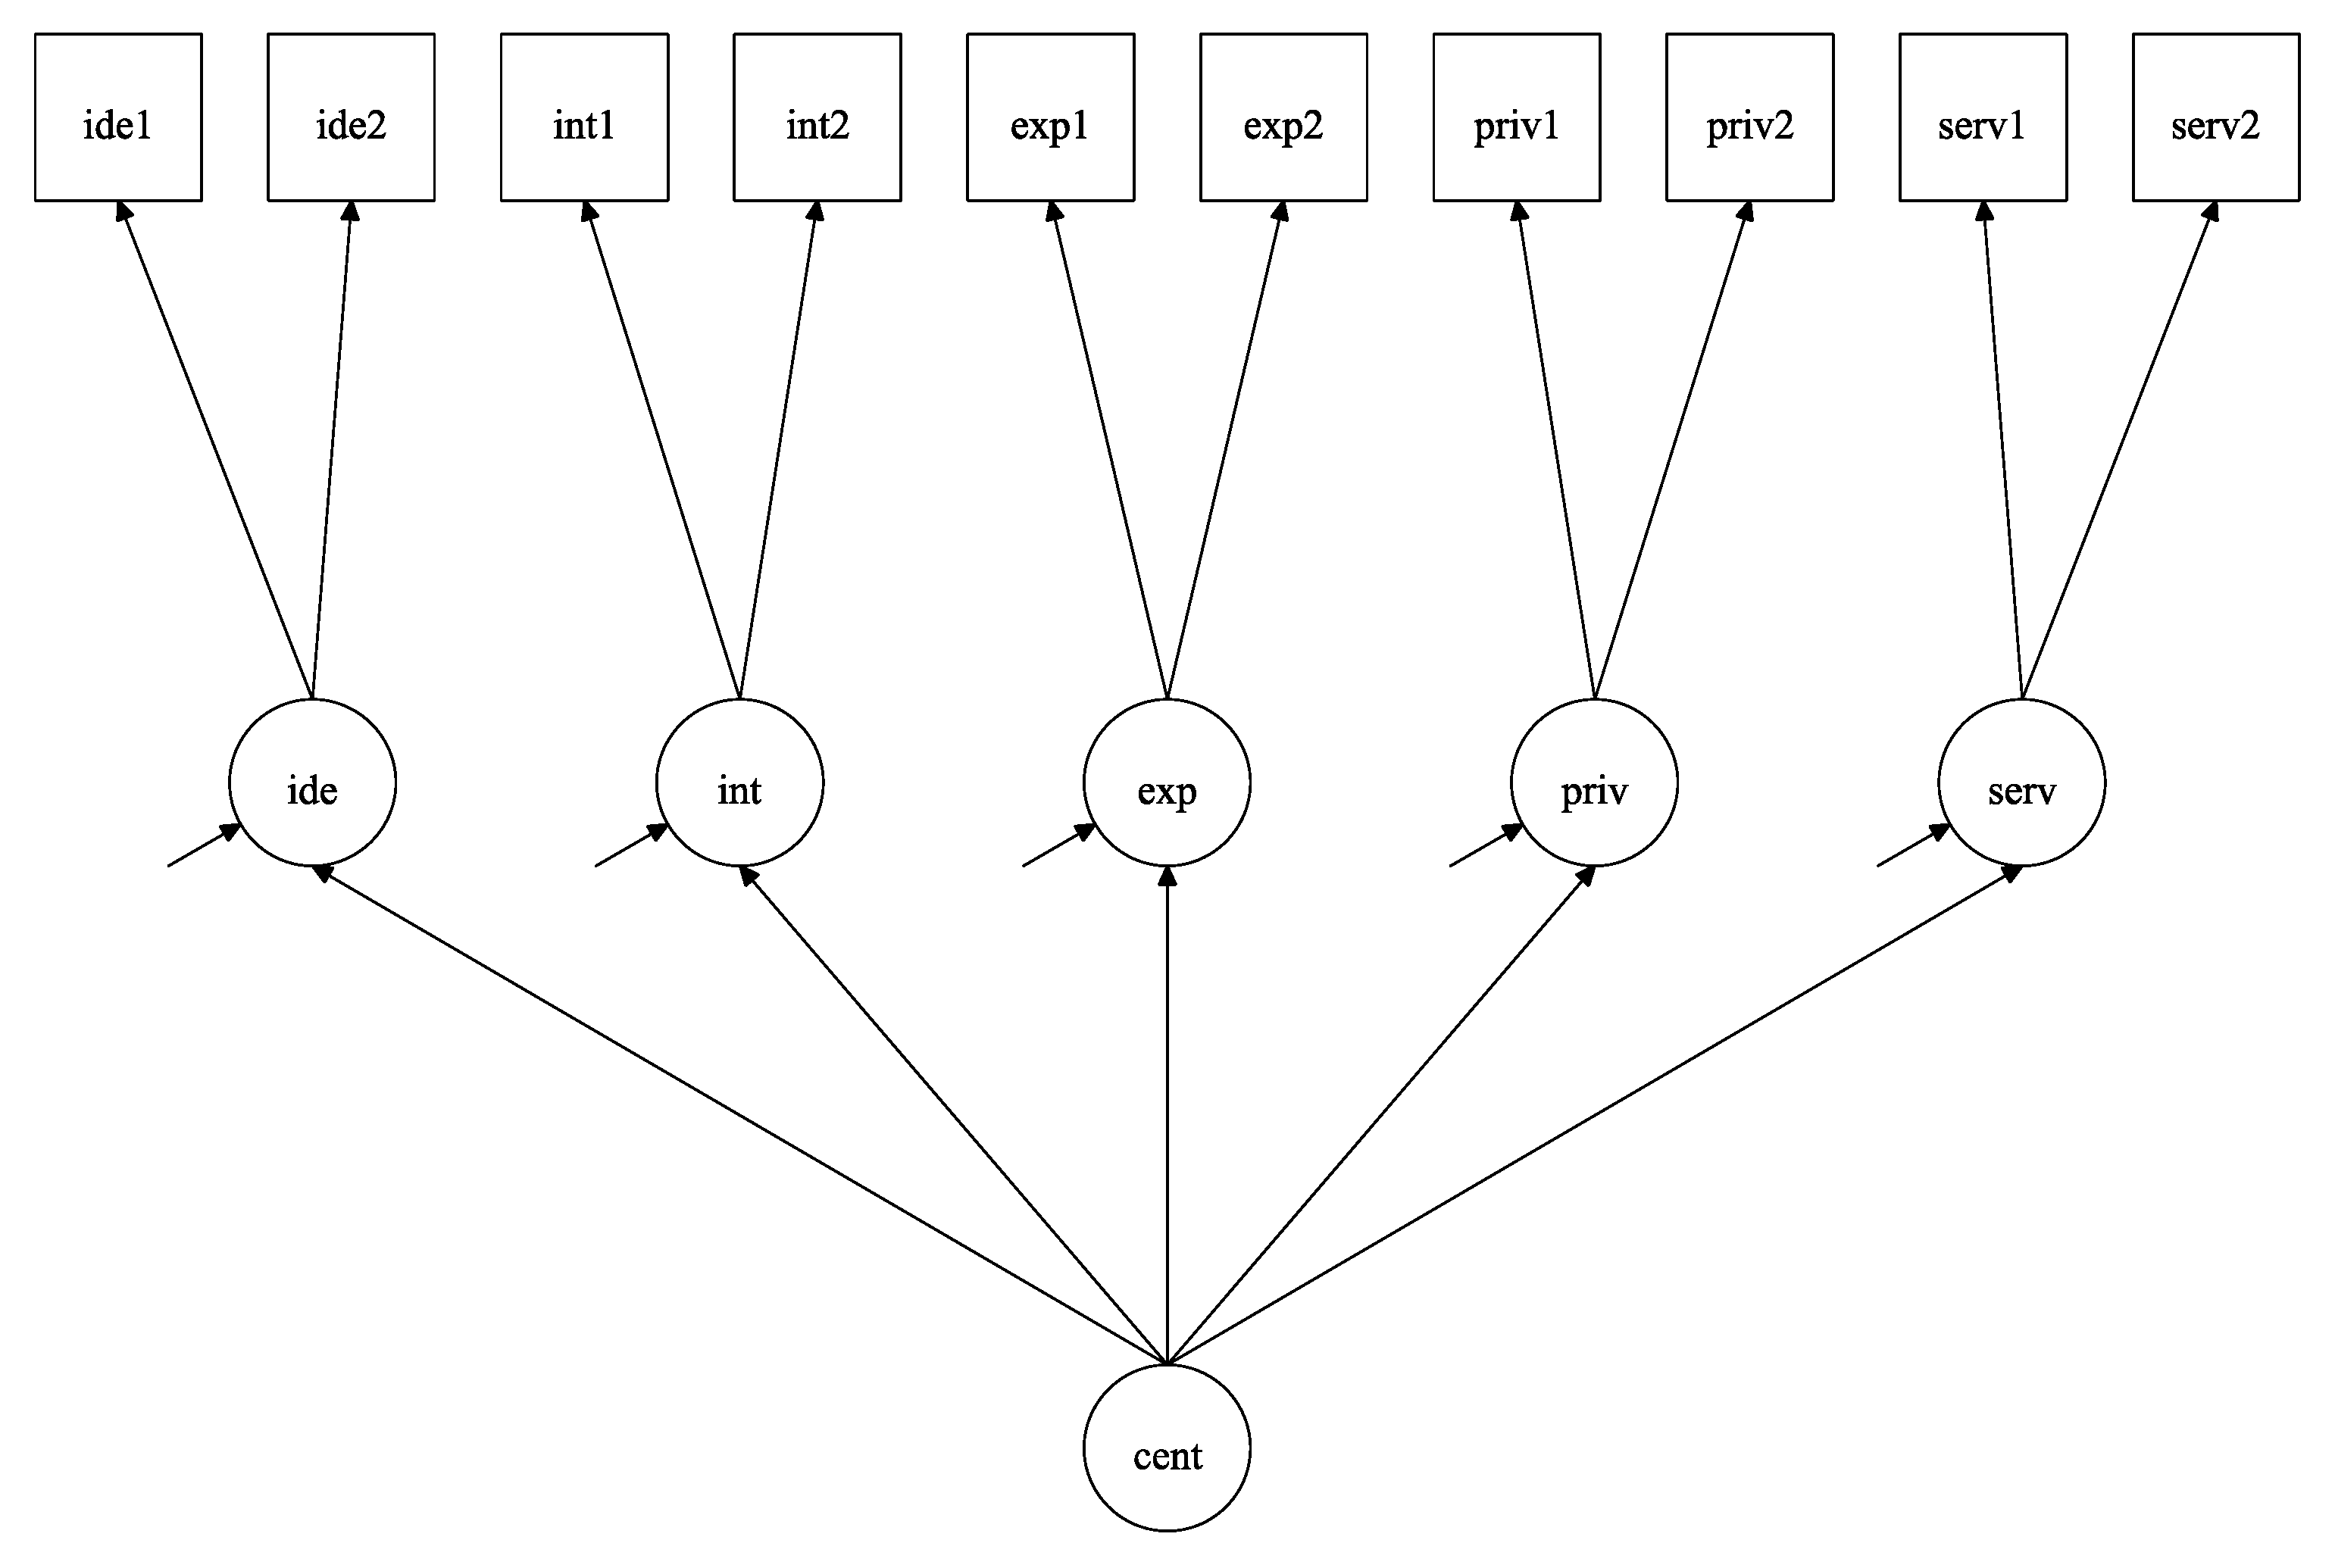
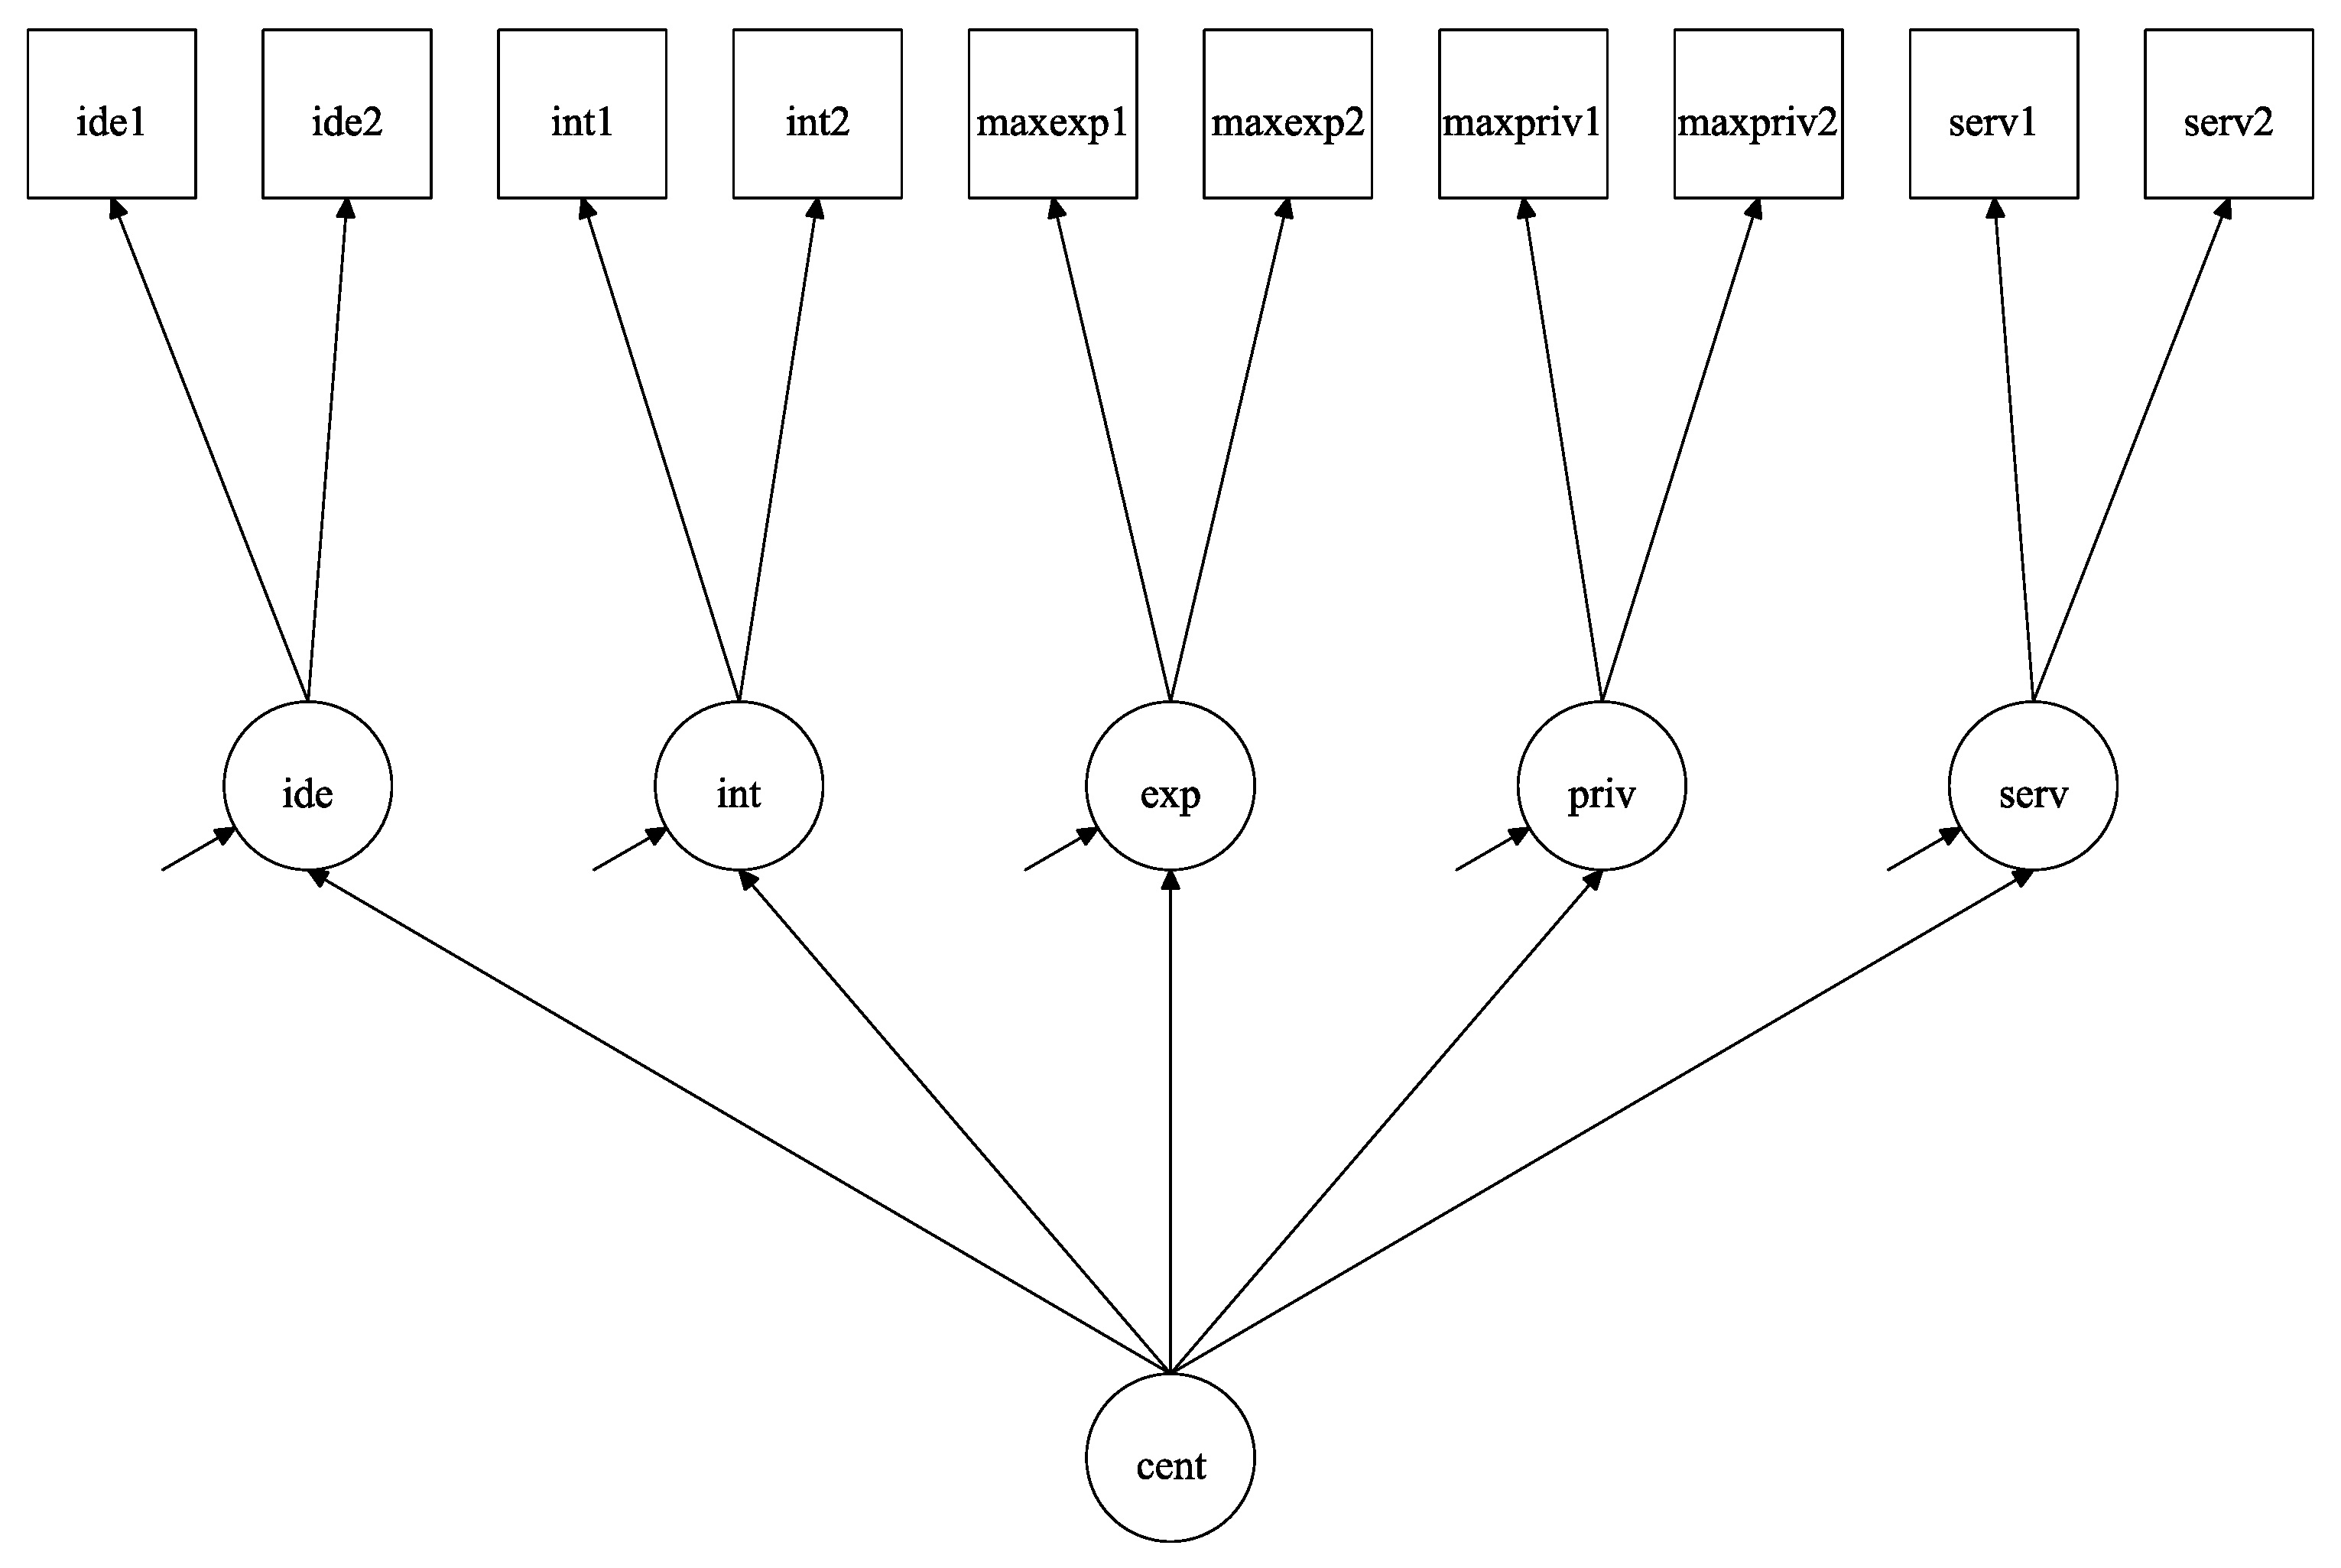
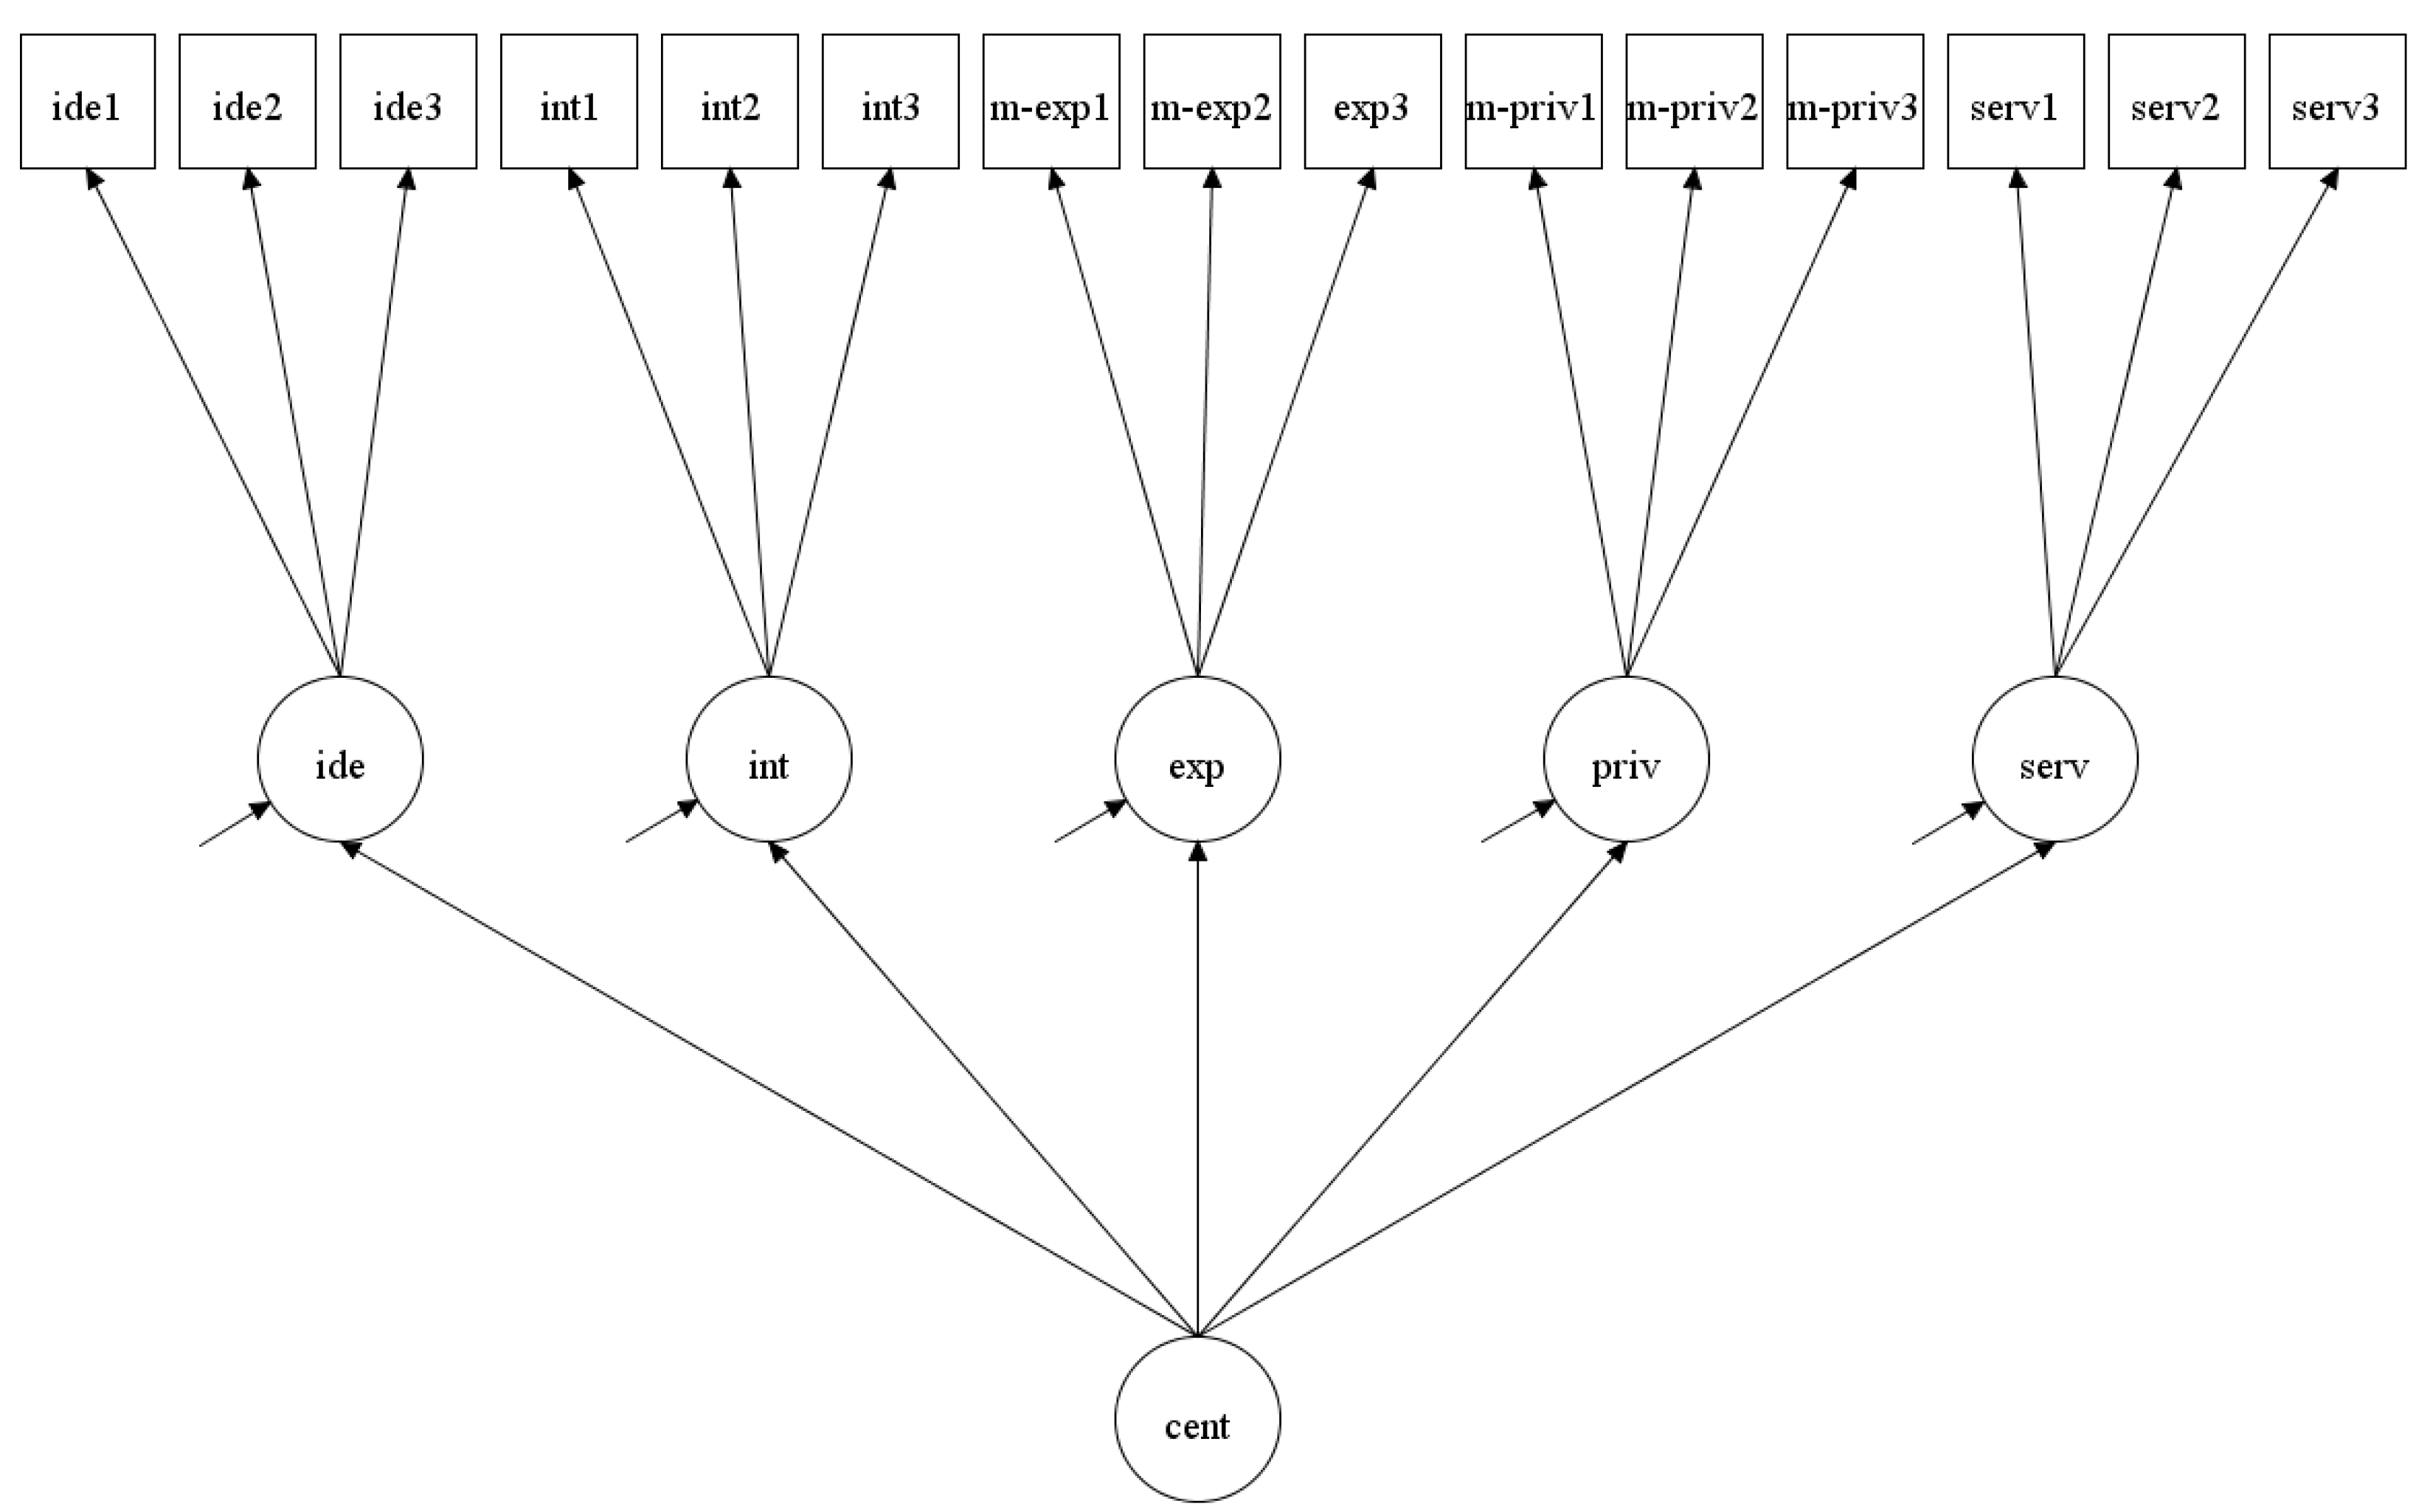
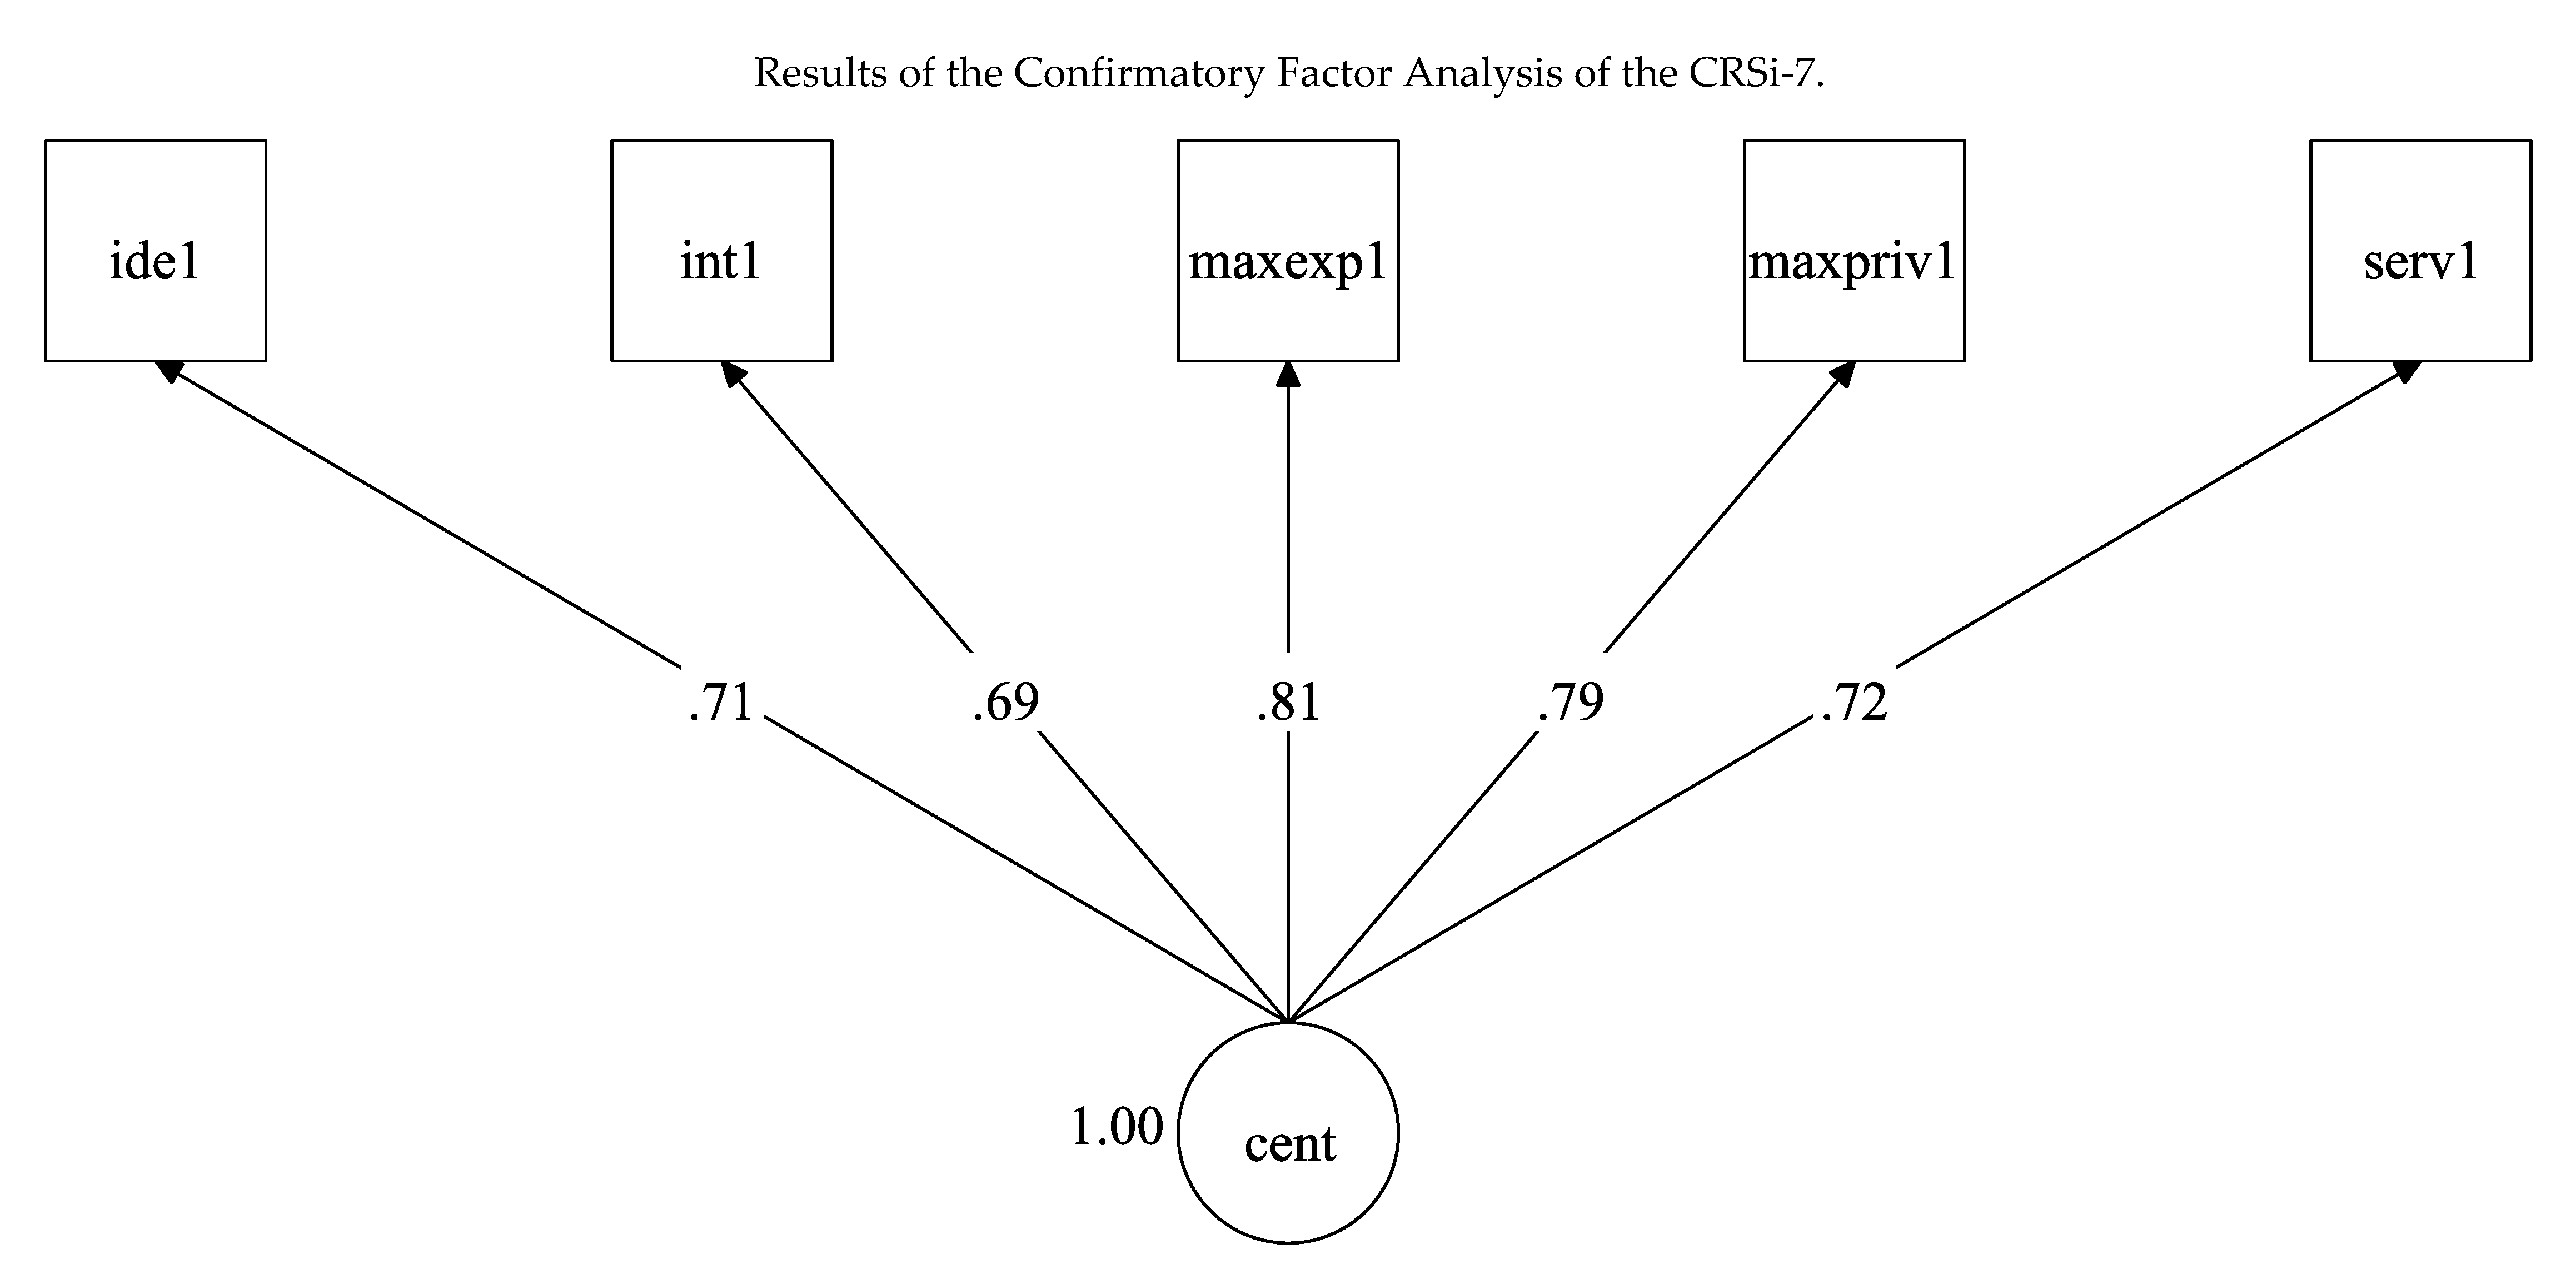
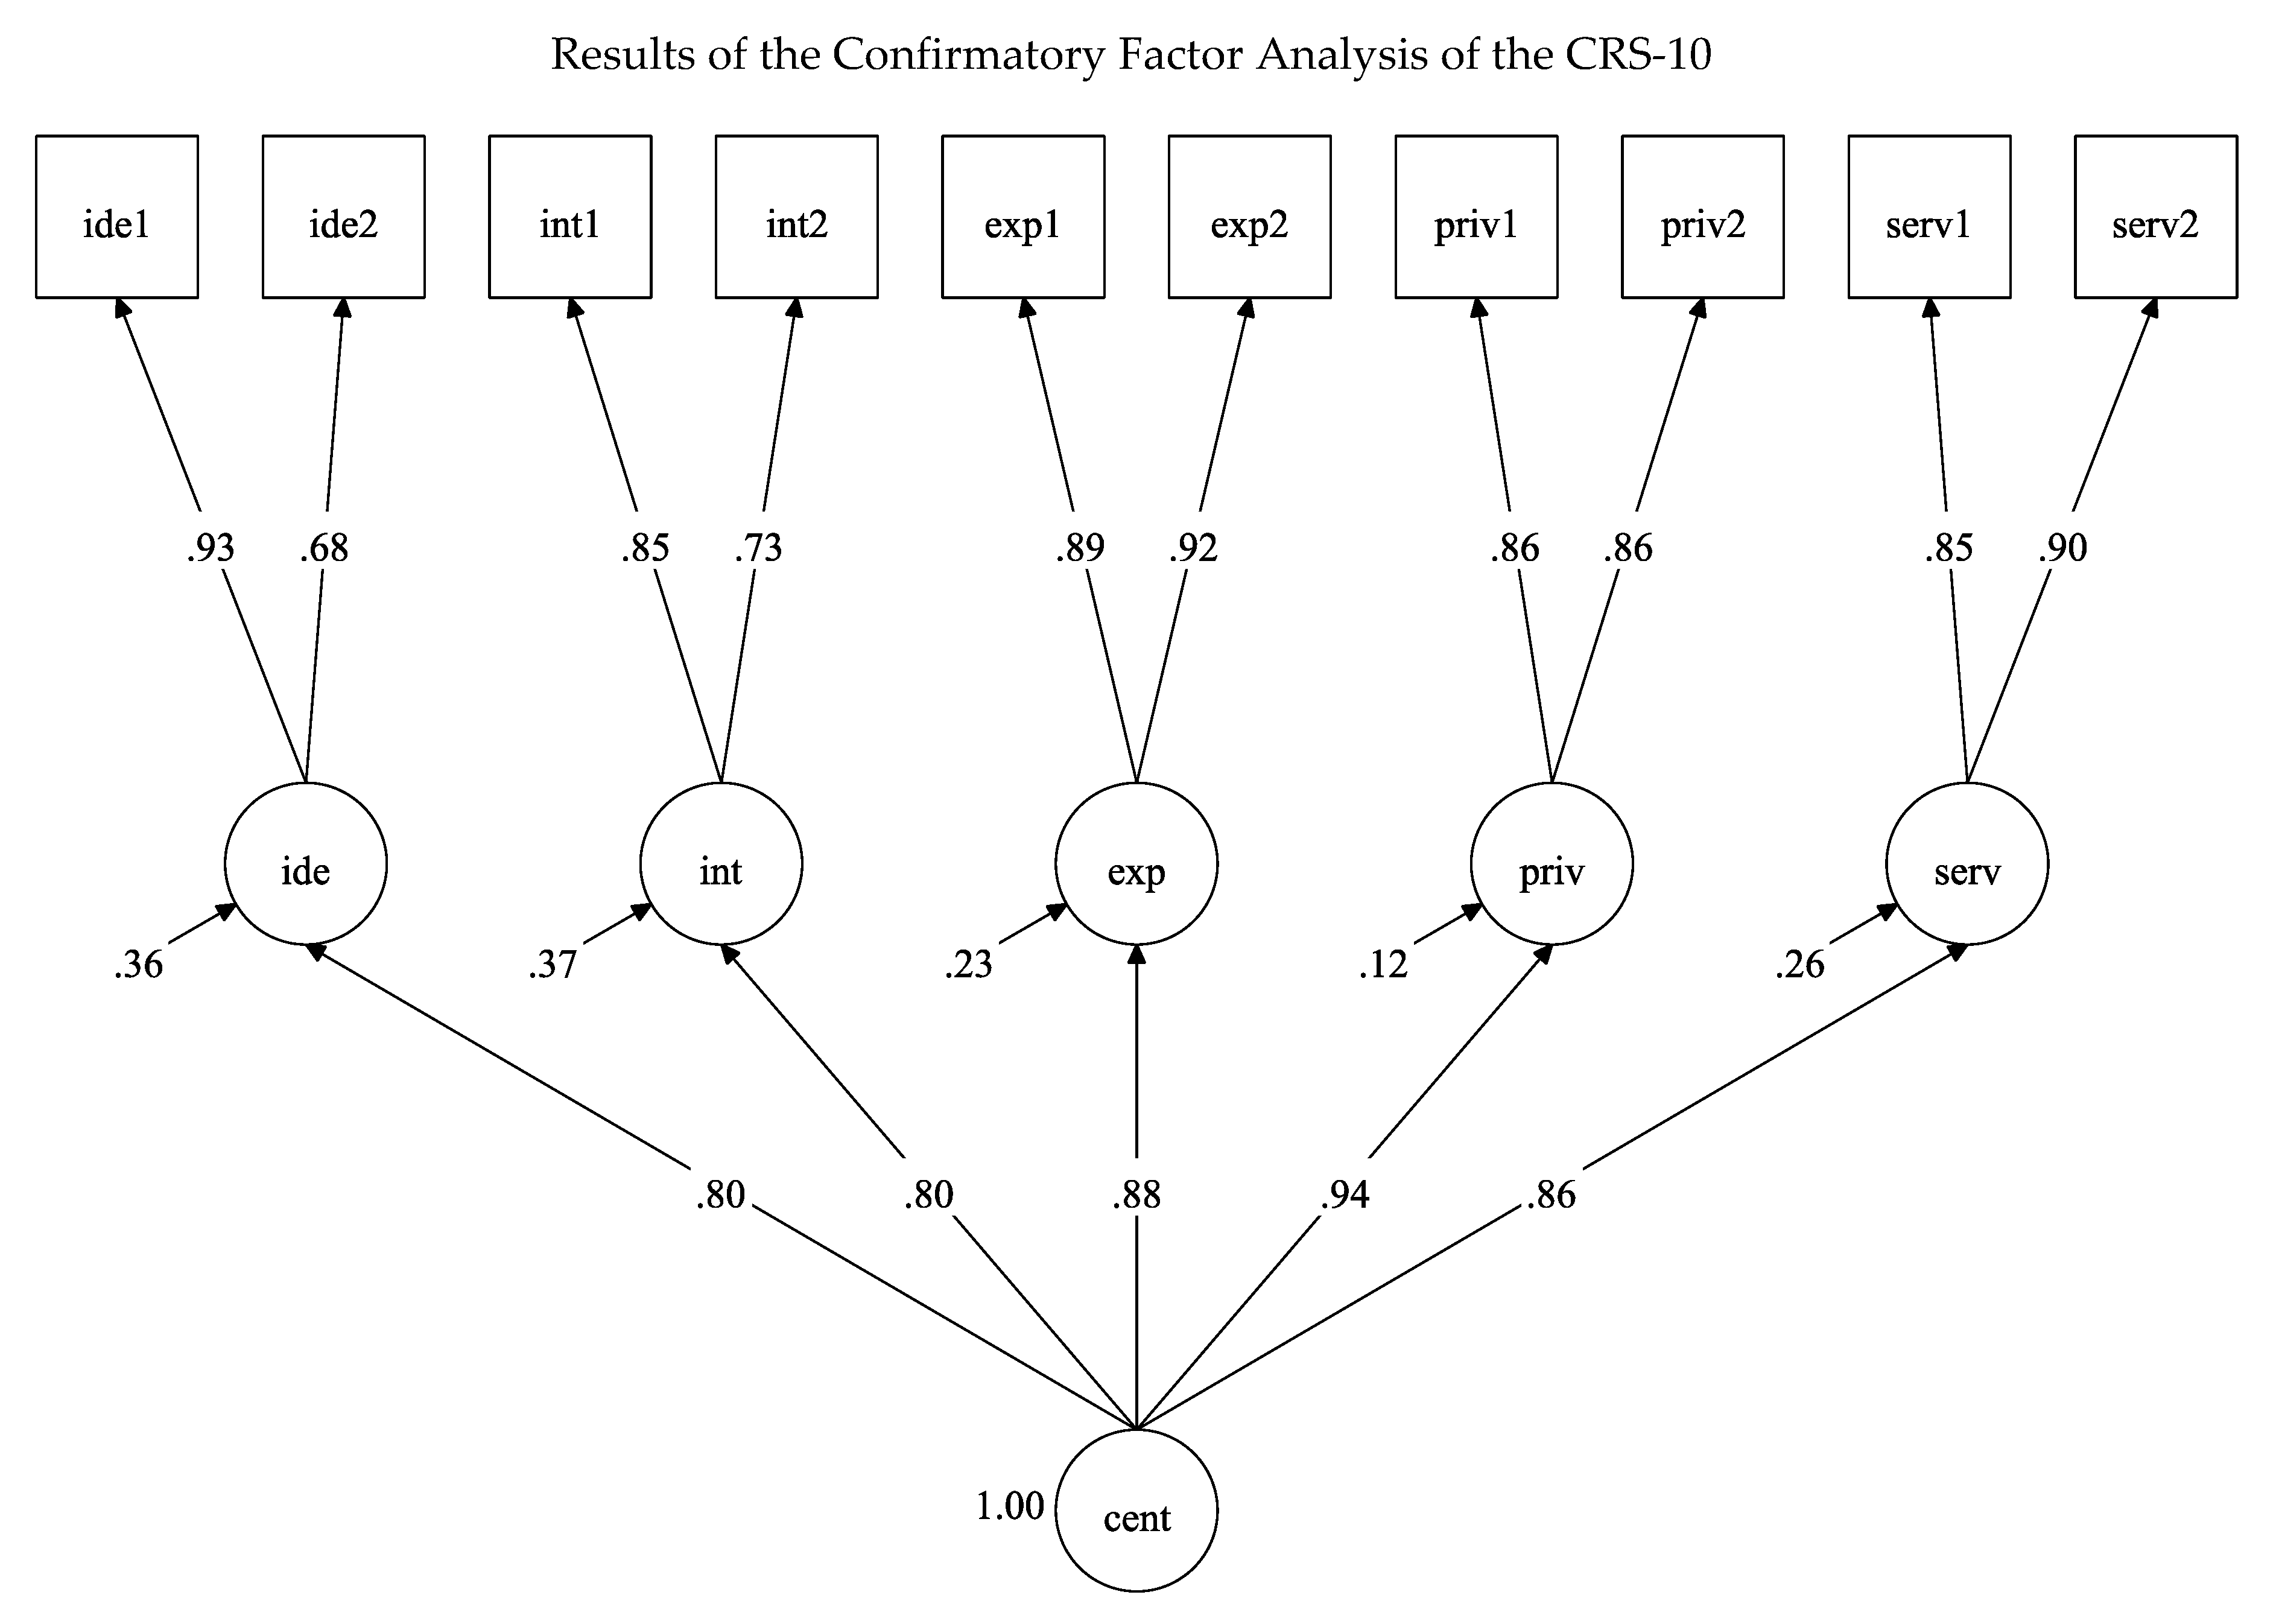
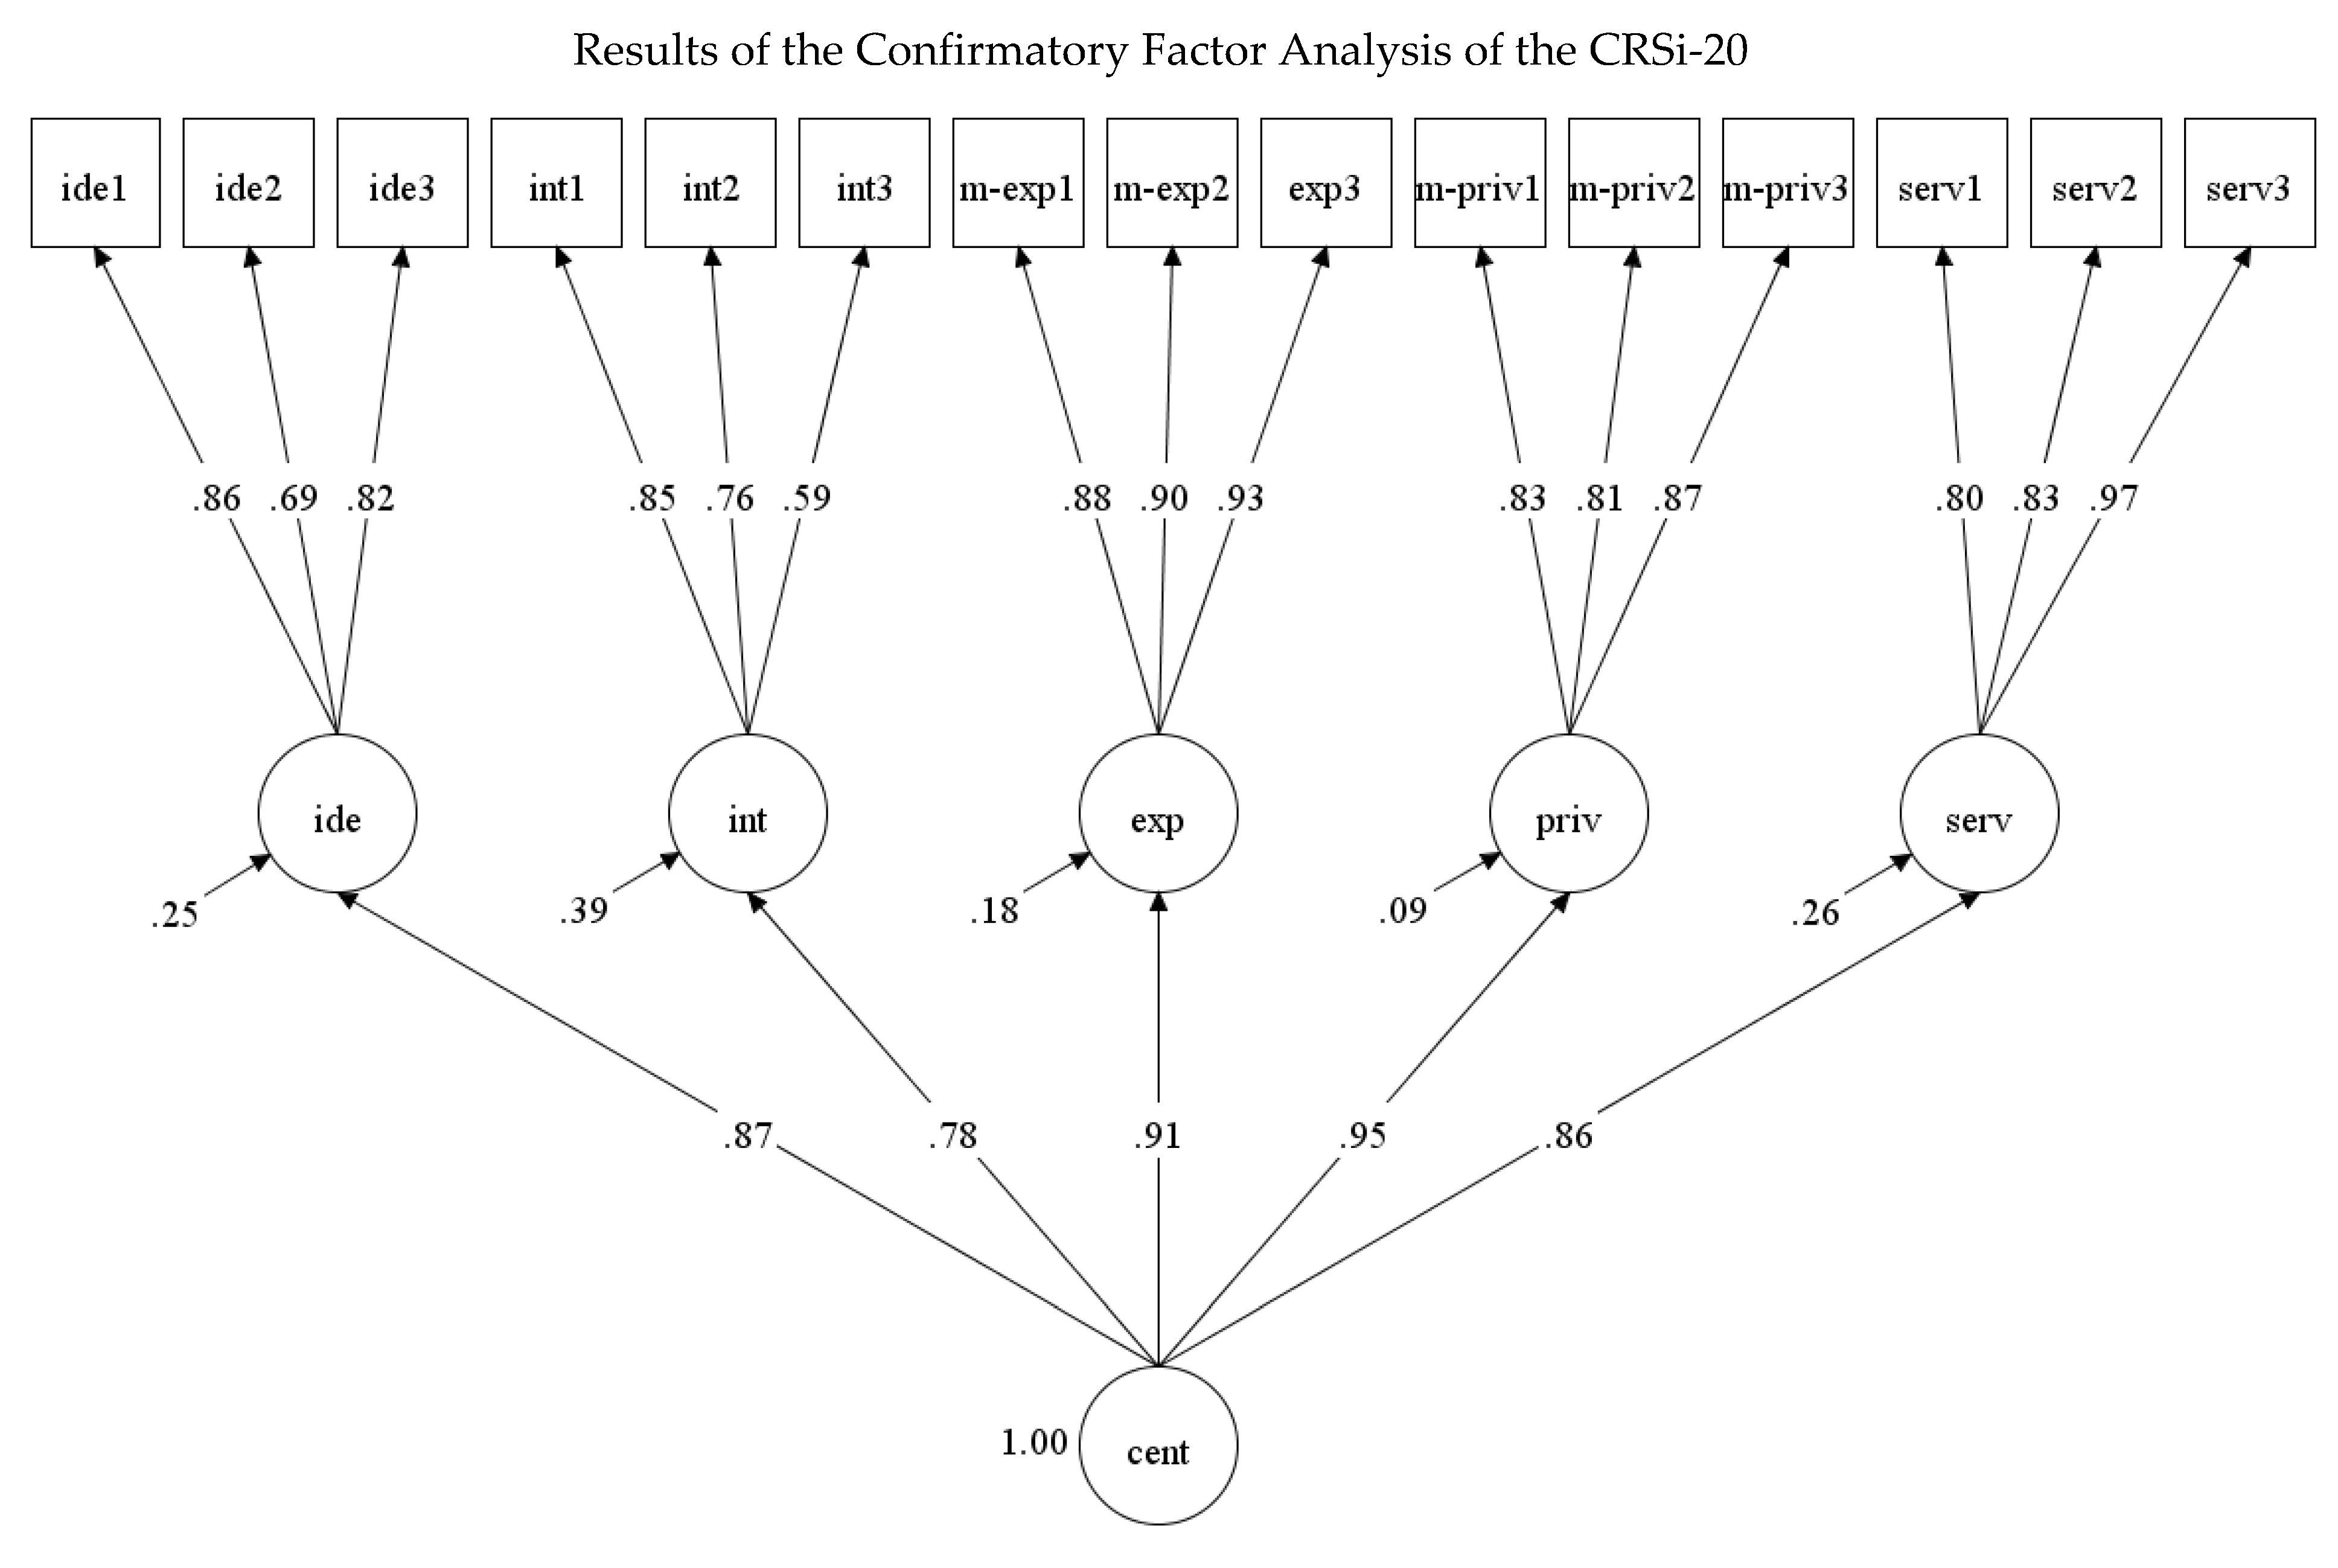
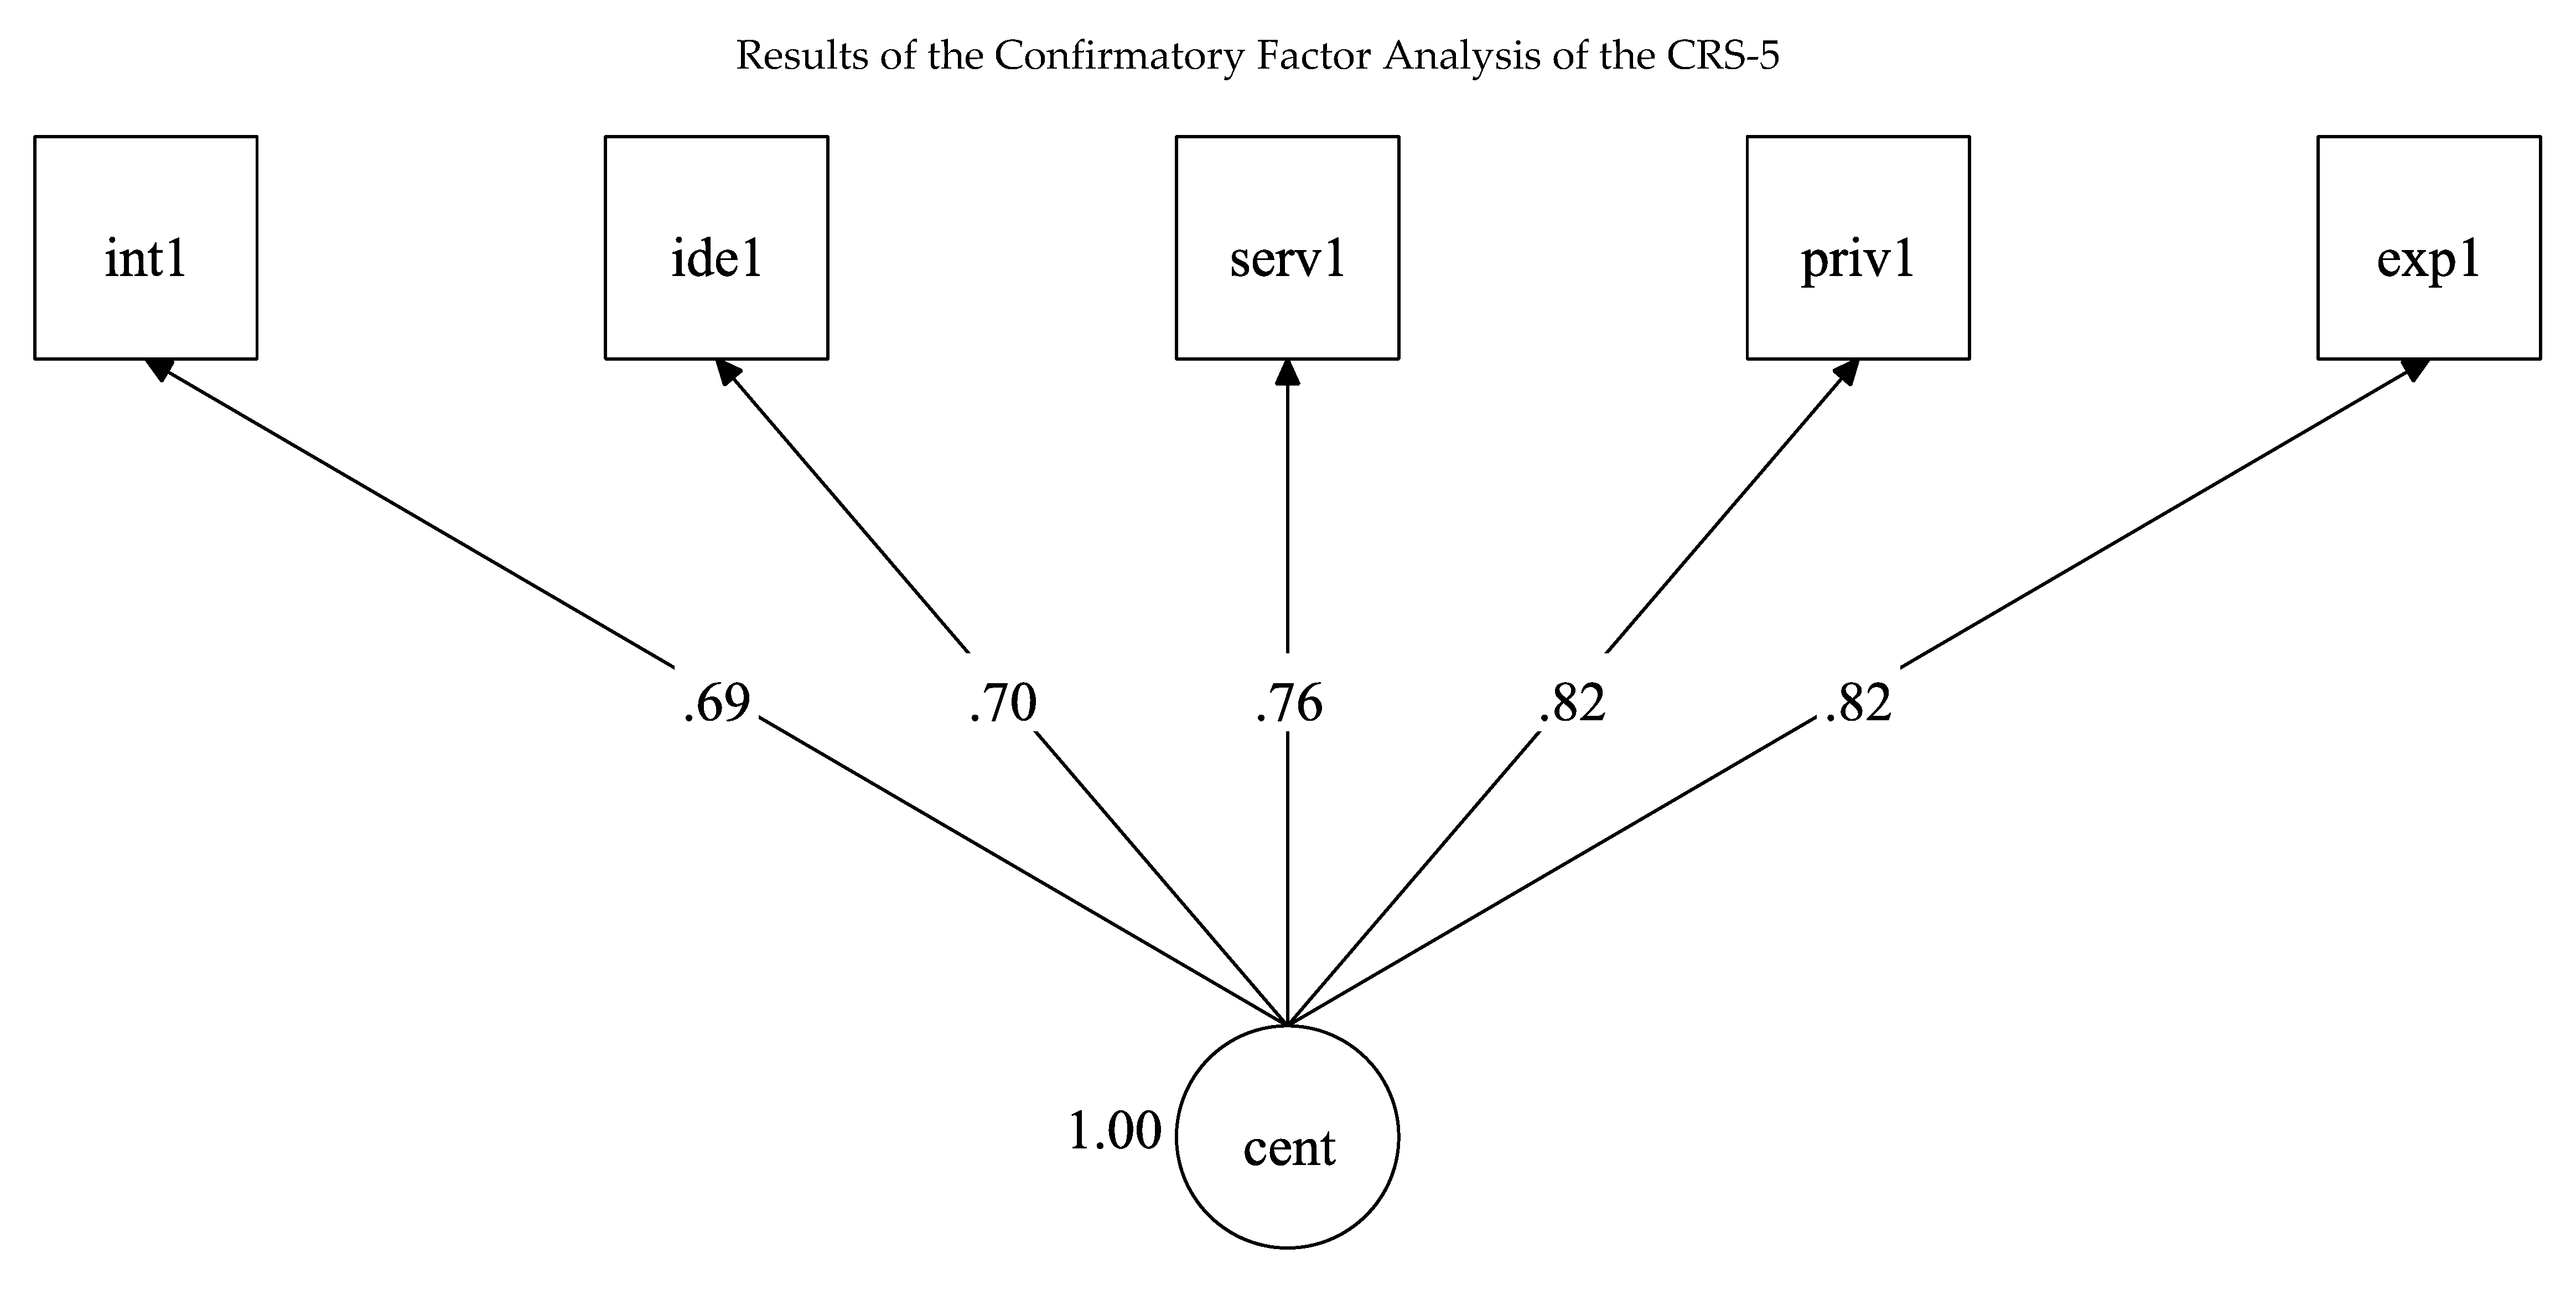
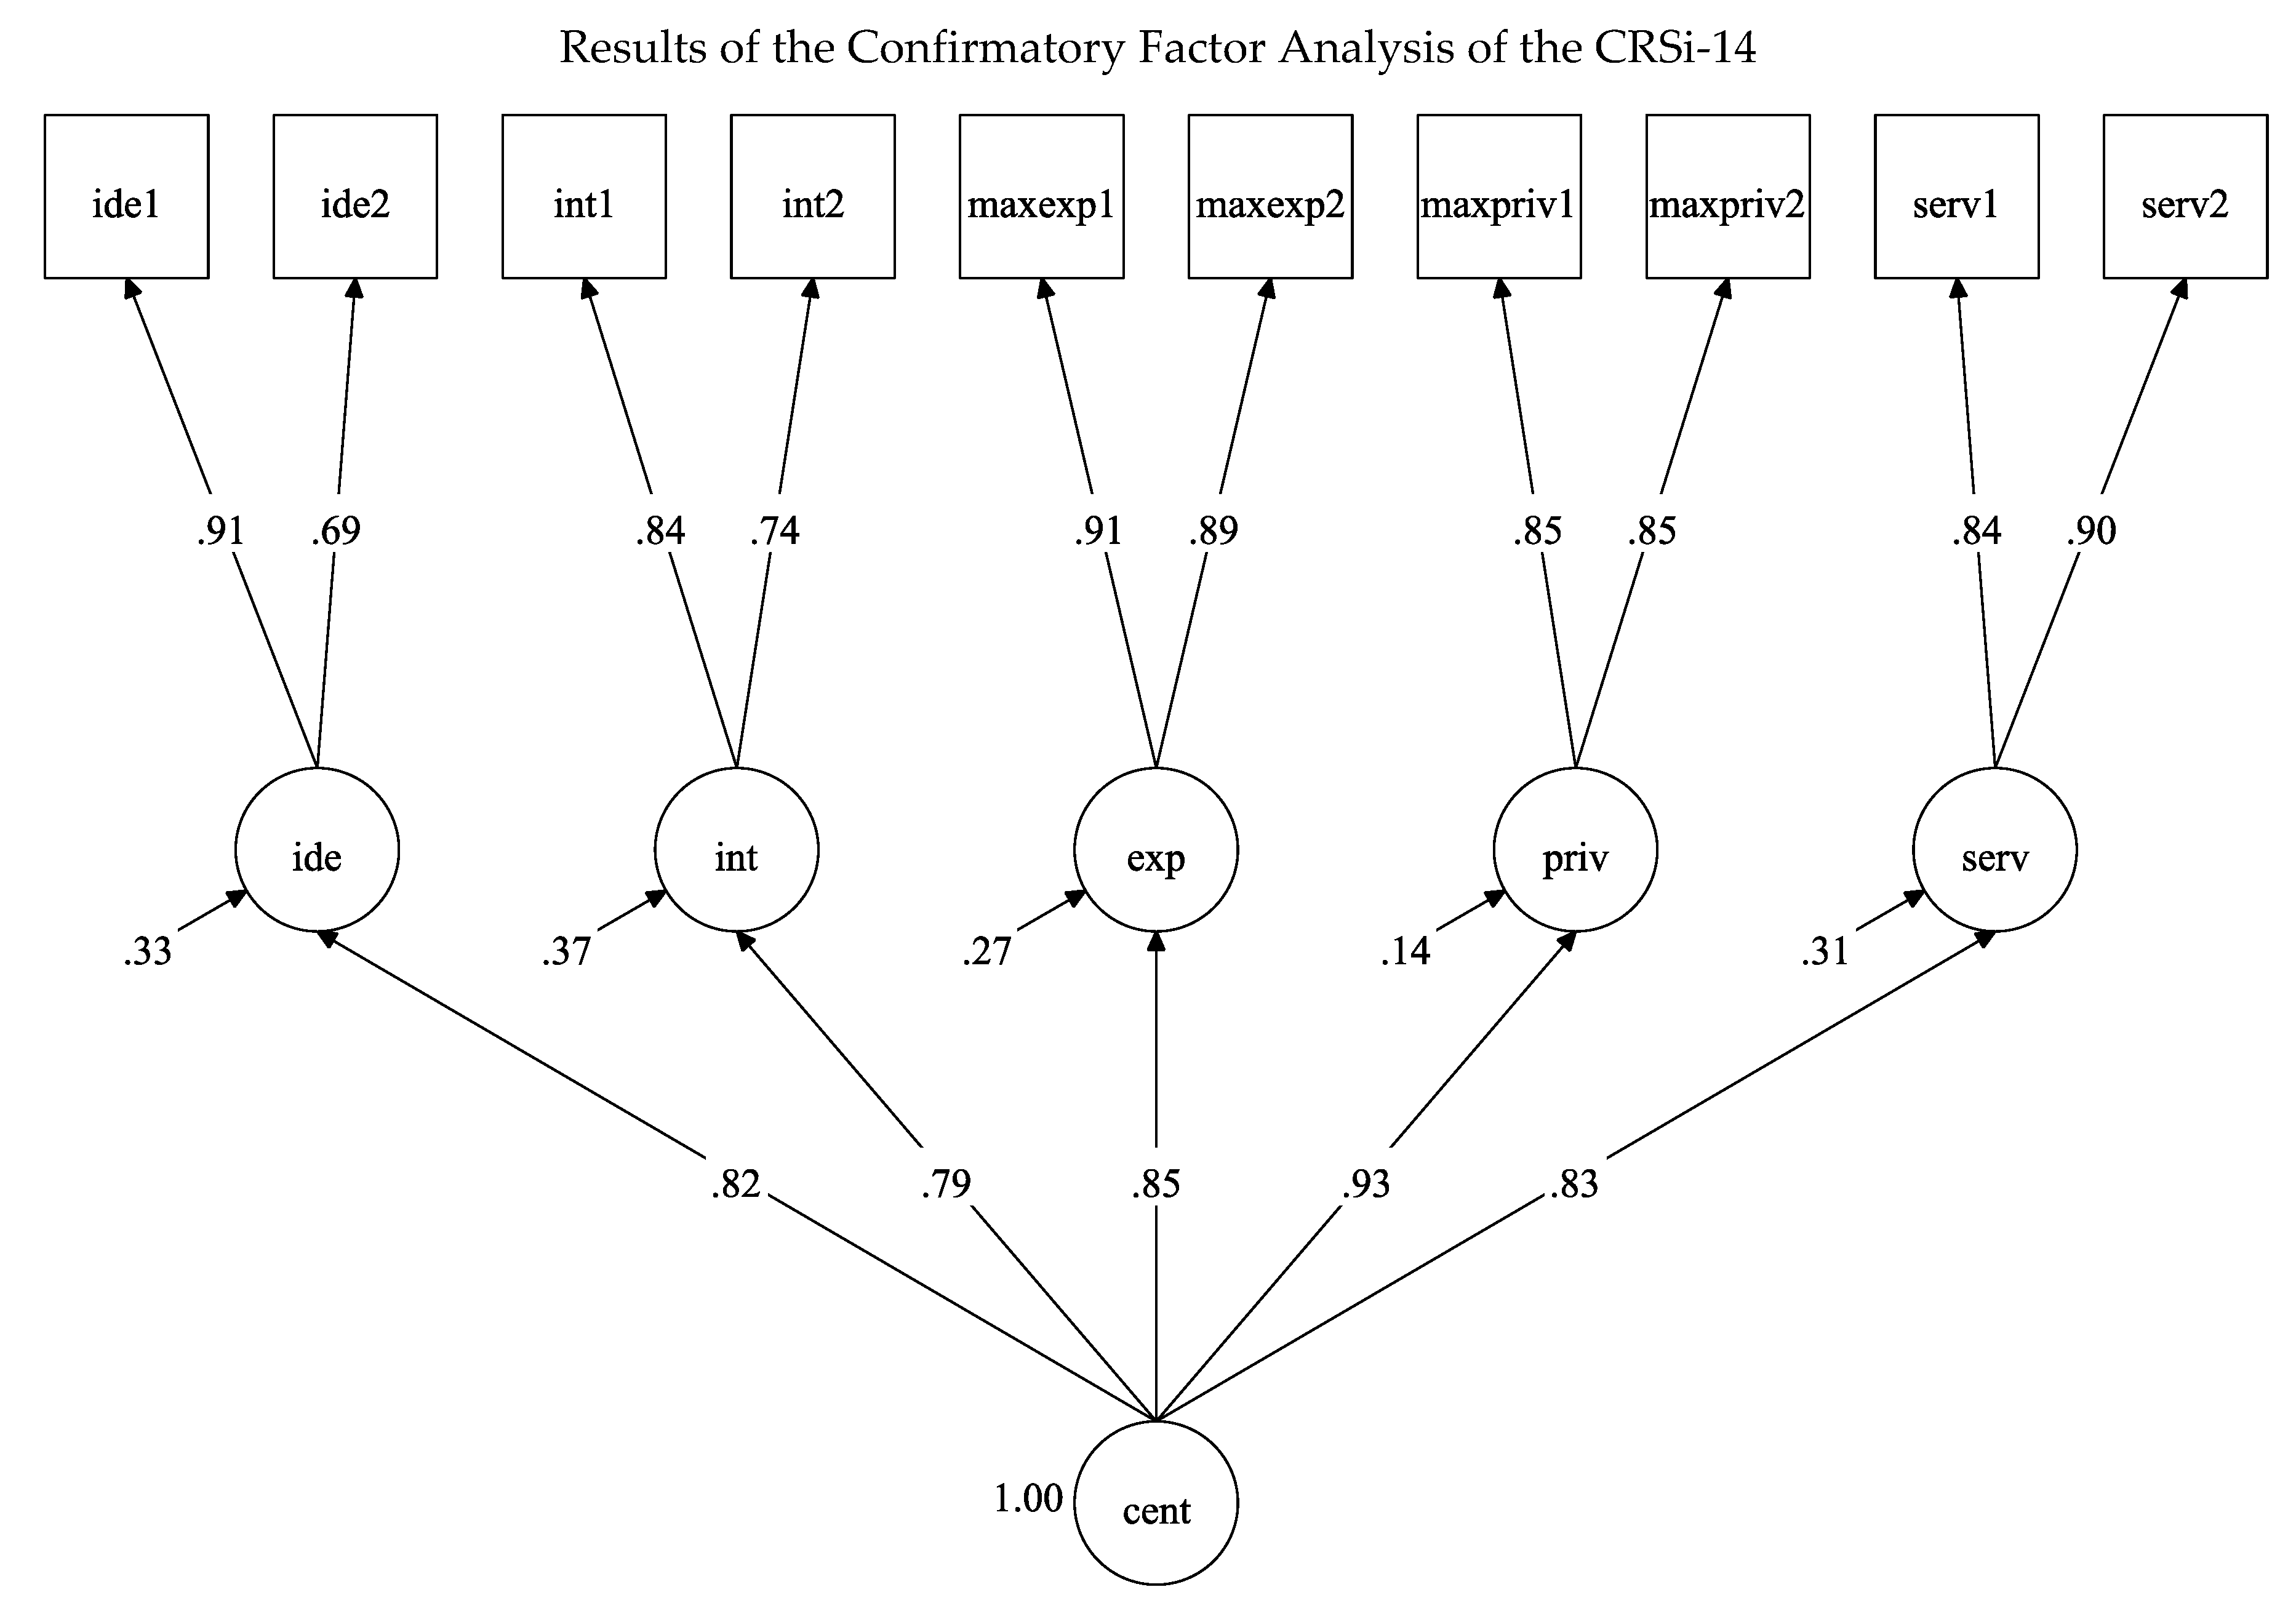
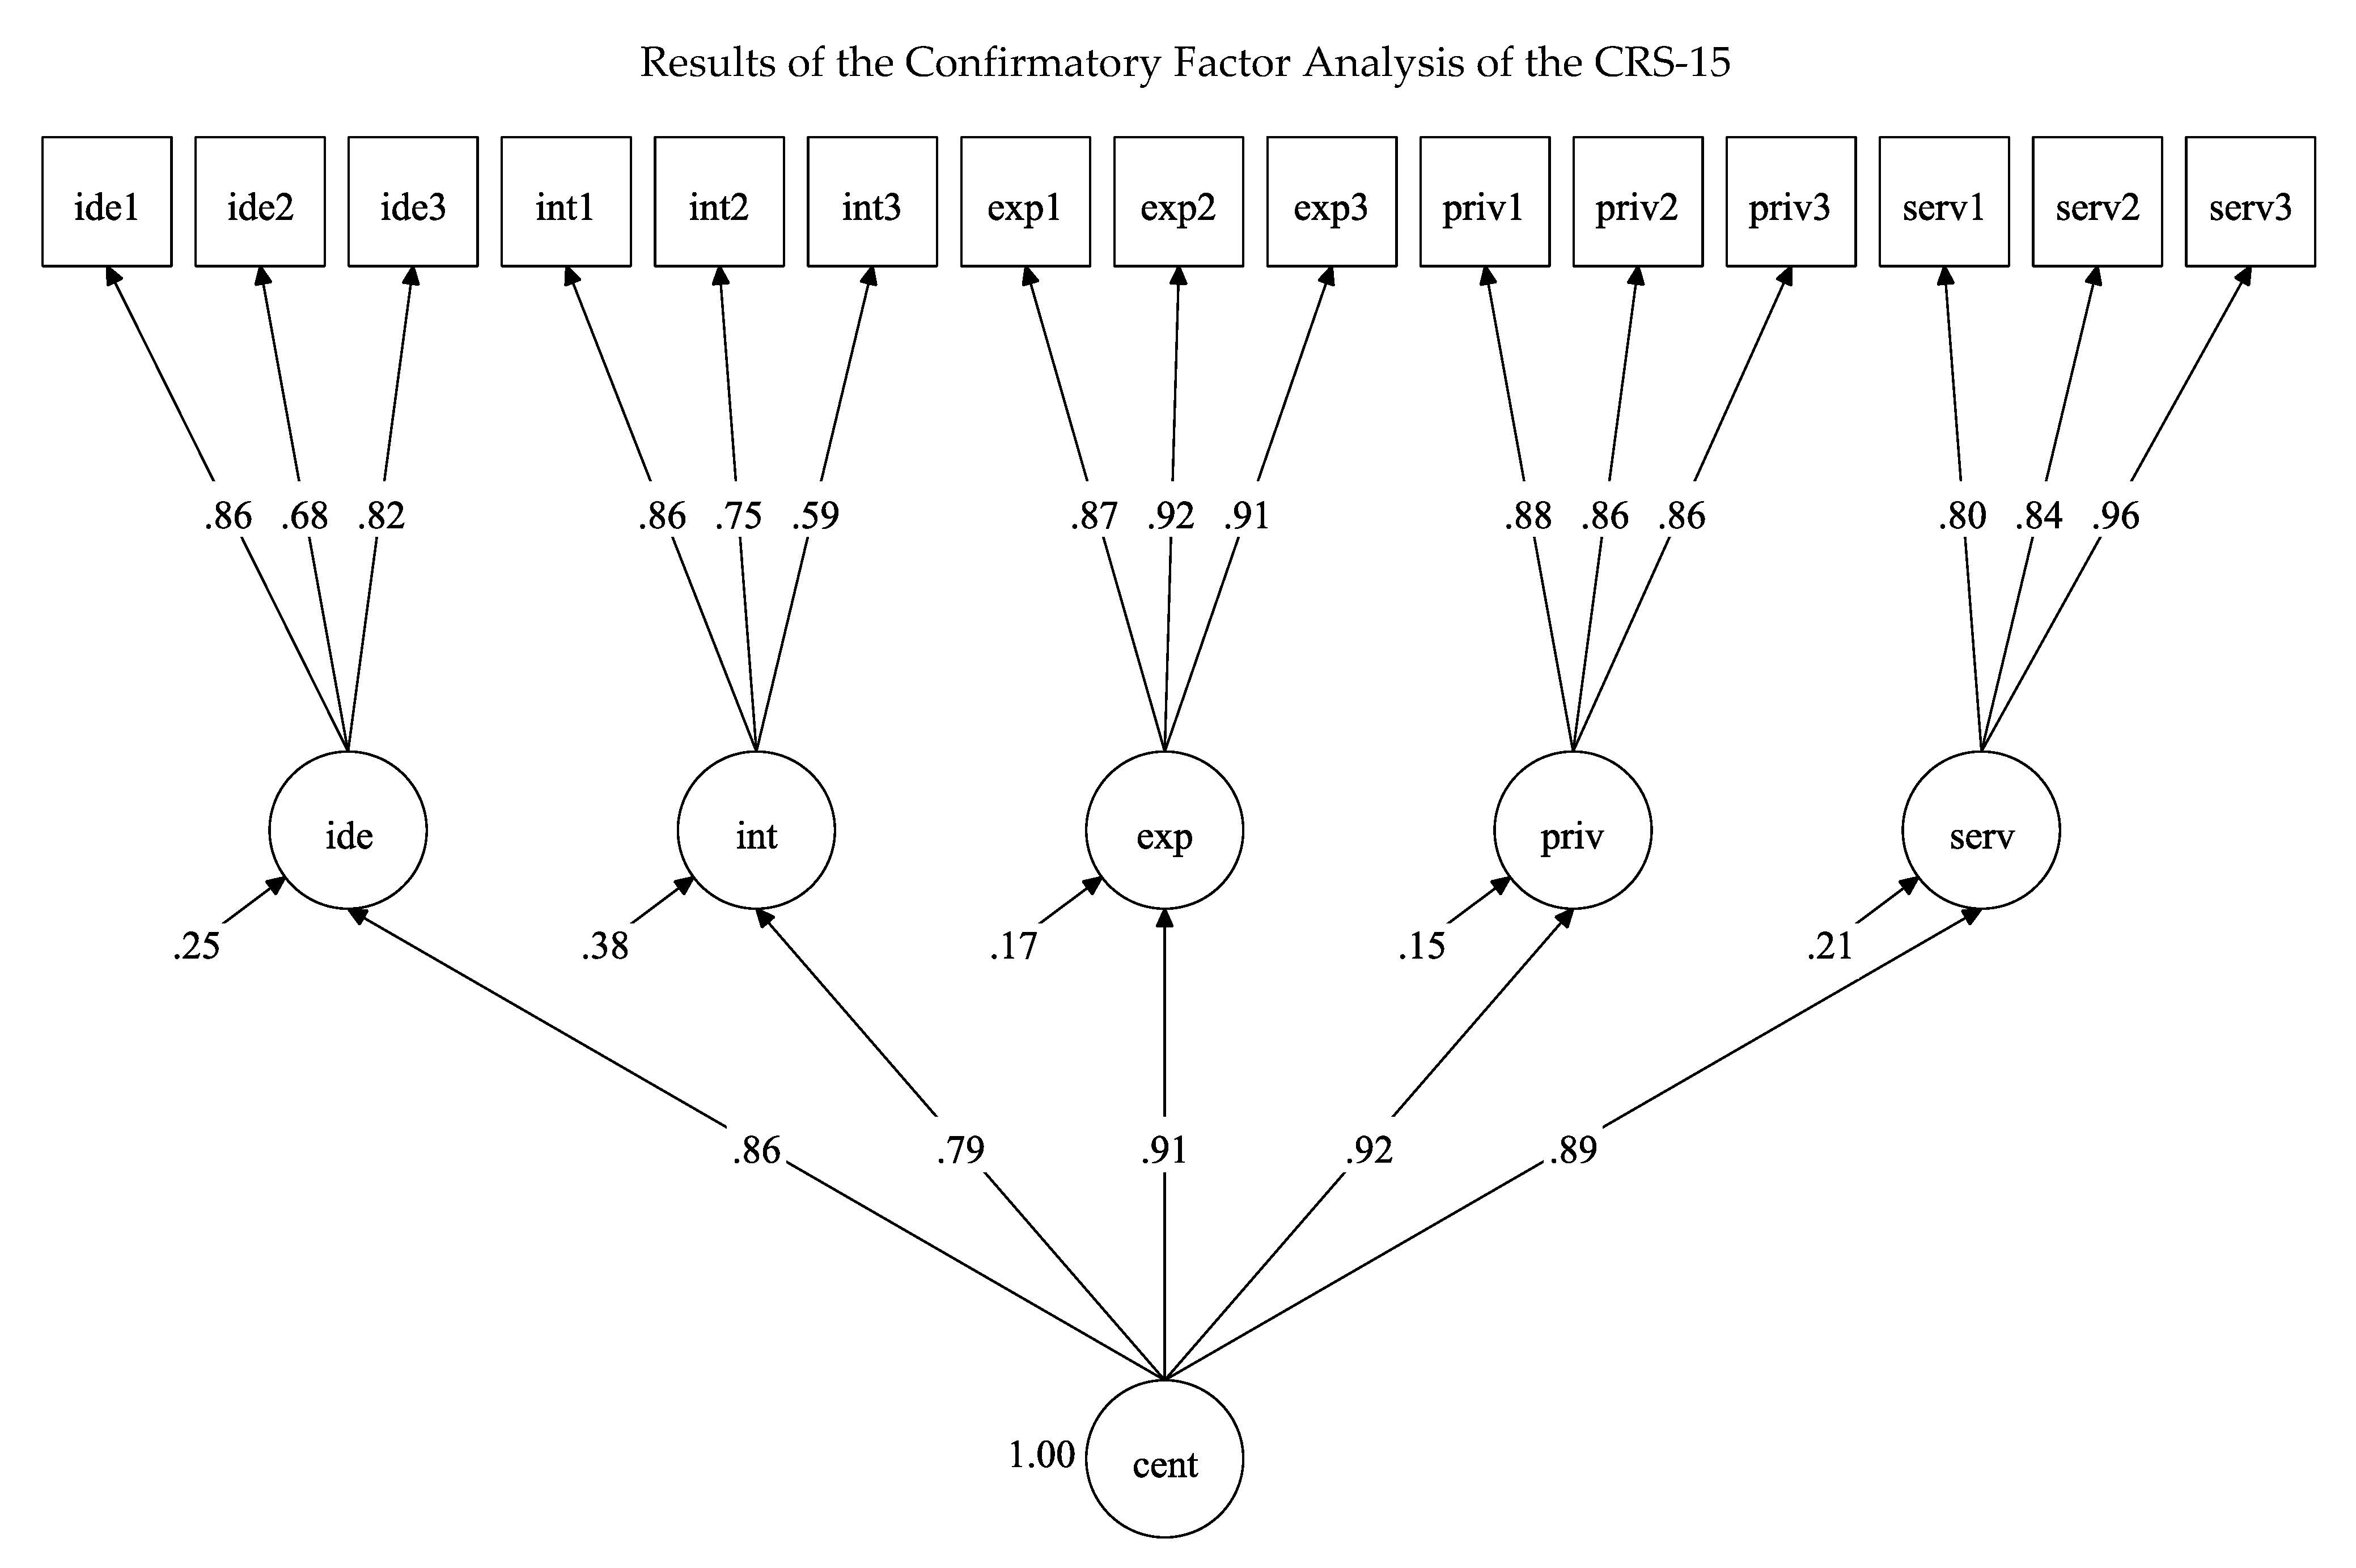
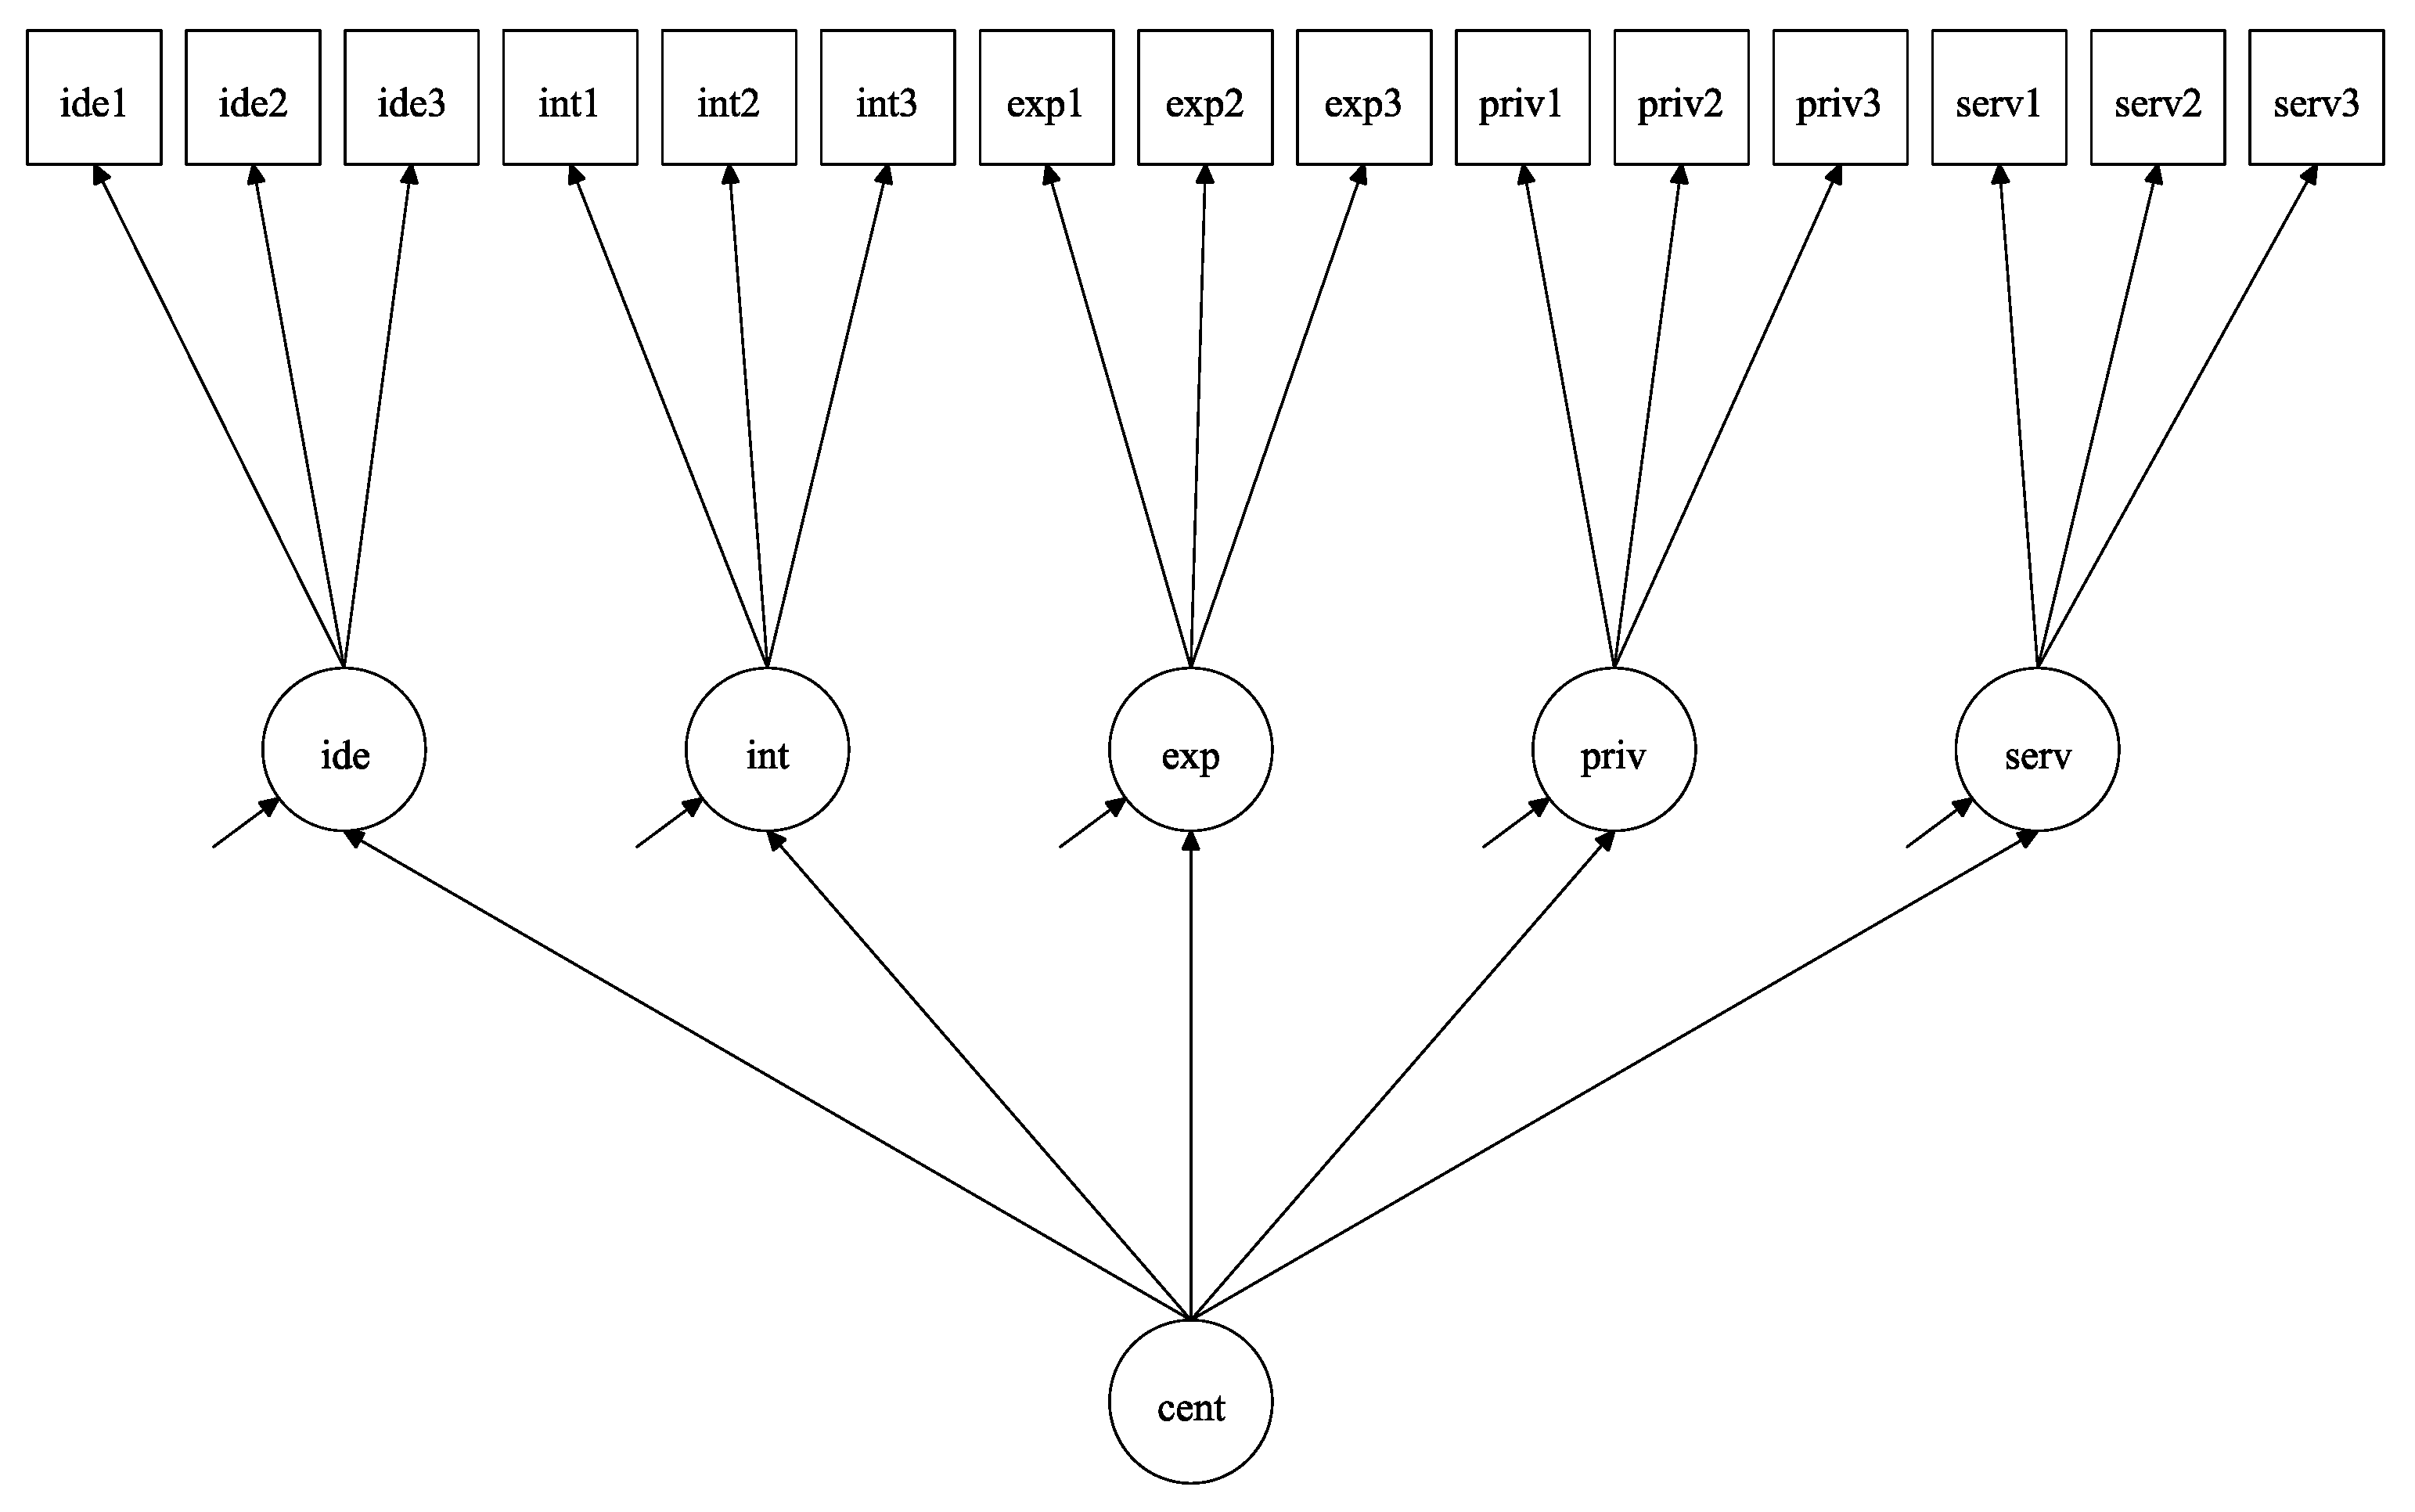
3.4. Confirmatory Factor Analyses

We also conducted a CFA to examine whether the originally postulated factorial structure (Huber 2003) can be reproduced with the given Japanese sample. The global model fit indices of the CRS versions showed comparative fit indices ranging from CFI = 0.98 (short versions) to CFI = 0.96 (long versions), the Tucker-Lewis index was either TLI = 0.95 or TLI = 0.96 among the subscales, the root mean square error of approximation fluctuated between RMSEA = 0.13 (CRSi-7) and RMSEA = 0.09 (CRS-15 and CRSi-20), and the standardized root mean square residual varies from SRMR = 0.03 (short versions) to SRMR = 0.05 (long versions). These model fit indices were all good in our Japanese sample, except for the RMSEA. The RMSEA met the suggested cutoff of 0.08 (MacCallum et al. 1996) with its lower level of the 90% confidence interval. However, the cut off is violated by the RMSEA’s point estimate and the upper level of the 90% confidence interval (see Table 5 for more details).
Regarding the local fit, all factor loadings in all of the analyses were significant, at least at the α 0.05 level. For the short versions, factor loadings ranged between λ i n t 1 = 0.69 and λ p r i v 1 = λ e x p 1 = 0.82 (see Figure A3 and Figure A4 in Appendix C). In the models of the intermediate versions, the factor loadings of the first level varied between λ i d e 1 = 0.93 and λ i d e 2 = 0.68 , while the factor loadings of the second level varied between λ p r i v = 0.94 and λ i n t = 0.79 (see Figure A5 and Figure A6 in Appendix C). Last but not least, the factor loadings of the long versions of the CRS in the first level varied between λ s e r v 3 = 0.97 and λ i n t 3 = 0.59 (see Figure A7 and Figure A8 in Appendix C). At the second level, the factor loadings ranged between λ p r i v = 0.95 and λ i n t = 0.78 . The local fit corroborated the item reliability in all Japanese versions of the CRS. With these factor loadings, the squared factor loadings showed the proportion of explained variance in the indicators themselves. Table 6 presents the standardized proportions of explained variance in the Abrahamitic versions of the CRS. The values ranged from R 2 p r i v 1 = 0.47 to R 2 e x p 3 = 0.96 . Therefore, we concluded that the items contribute, at least saliently, to large proportions of the underlying latent variables.
Concerning the explained proportions of the first level latent variables in the confirmatory factor models of the CRS-10 and CRS-15, there was a range from R 2 i n t = 0.62 to R 2 p r i v = 0.89 . Every core dimension was largely explained by the underlying second level latent variable of the centrality of religiosity (see Table 7, for more details).
The explained variance of the items in the interreligious versions of the CRS revealed a similar picture as the Abrahamitic versions of the CRS, where the R 2 range between R 2 i n t 3 = 0.35 and R 2 s e r v 3 = 0.95 . This showed that substantially large proportions of the CRS indicators were explained by the underlying factor or factors (see Table 8 for more details).
As for the proportions of explained variance of the first level latent variables in the confirmatory factor models of the CRSi-20 and CRSi-14 versions, the R 2 varied between R 2 i n t = 0.61 and R 2 p r i v = 0.91 . Therefore, it can be said that major proportions of the variance of the first level latent variables are explained by the underlying second-level factor of centrality of religiosity (see Table 9 for more details).
One caveat of modeling the confirmatory factor analysis with categorical data is that the metric interpretation of the estimates is not guaranteed. We raise attention to this issue in the discussion section.
As in a previous study on the CRS (Huber and Huber 2012), we calculated Cronbach’s alphas for all the dimensions (intellect, ideology, public practice, private practice, and experience). The Cronbach’s alphas of each dimension of the JCRSi-20 are α = 0.71 (intellect), α = 0.80 (ideology), α = 0.84 (public practice), α = 0.84 (private practice), and α = 0.89 (experience). These results indicate that the JCRS has reliable subscales in the long interreligious version since each Cronbach’s alpha was higher than 0 .70 (Cortina 1993).
In addition, based on previous findings (see Huber and Huber 2012), we calculated the CRS-index, which let us separate the sample into three meaningful groups: non-religious, religious, and highly religious. Specifically, in Huber and Huber (2012), the CRSi-7 was employed to identify non-religious, religious, and highly religious people in 21 countries. A total of 171 participants (whose scores ranged between 1.00 and 2.00 points) were included in the non-religious group, 80 participants in the religious group (mean JCRSi-7 score: 2.10 to 2.90), and 26 participants in the highly religious group (mean JCRSi-7 score: 3.00 to 5.00). Data of two participants involving missing data were also excluded.

3.5. Correlations among Psycholinguistic Features of Religious Words and Dimensions of Religiosity

We conducted Pearson’s correlation analysis to evaluate the relationships between the four psycholinguistic features in religious words (Familiarity, Imageability, Emotional Valence, and Emotional Arousal) and five dimensions of religiosity (see Table 10). As a result, Familiarity, Emotional Valence, and Emotional Arousal correlated positively with each mean dimensional score of religiosity (ideology, intellect, public practice, private practice, and experience). However, Imageability weakly correlated or did not correlate with each dimension of the CRS. Interestingly, all the psycholinguistic features of religious words also correlated positively with each other.

3.6. Differences in Psycholinguistic Features of Religious Words between Non-Religious and Religious/Highly Religious Groups

We also conducted t-tests to examine the differences in Familiarity, Imageability, Emotional Valence, and Emotional Arousal between the non-religious group ( N = 171 ), the religious group ( N = 80 ), and the highly religious group ( N = 26 ). Results of analysis of variance (ANOVA) among the three groups showed significances of Familiarity ( F ( 2 , 271 ) = 13.57 ,   p < 0.01 ), Emotional Valence ( F ( 2 , 263 ) = 12.33 ,   p < 0.01 ), and Emotional Arousal ( F ( 2 , 263 ) = 5.32 ,   p < 0.01 ) among the groups, whereas there were no significant differences in Imageability between the non-religious and religious/highly religious groups. In addition, three findings emerged from the post-hoc analyses. First, Familiarity of the religious group and the highly religious group was higher than that of the non-religious group ( p < 0.01 ). Second, Emotional Valence of the highly religious group was greater than that of the non-religious group and the religious group ( p < 0.01 ). Third, Emotional Arousal of the highly religious group was higher than that of the non-religious group. These results also supported the positive correlations between the psycholinguistic features of religious words (Familiarity, Emotional Valence, and Emotional Arousal) and each dimension of religiosity (intellect, ideology, public practice, private practice, and experience), as mentioned above.

4. Discussion

The purpose of this study was to examine whether some psycholinguistic features of religious words were positively correlated with a scale measuring an individual’s religiosity (JCRS). We obtained four main findings. First, four of the scales used to identify the psycholinguistic features of religious words (familiarity, imageability, emotional valence, and emotional arousal) were statistically reliable. Second, the JCRS was also statistically reliable. Third, the psycholinguistic features of religious words (familiarity, emotional valences, and emotional arousal) and the mean dimensional score of the JCRS (intellect, ideology, public practice, private practice, and experience) correlated positively with each other. Fourth, highly religious people had more familiarity and emotional arousal to religious words than non-religious people, while highly religious people had more emotional valence to religious words than non-religious and religious people. In addition, religious people had more familiarity to religious words than non-religious people. In sum, these findings suggest that psycholinguistic features of religious words contribute to the detection of multi-dimensional religiosity.

4.1. Psycholinguistic Features of Religious Words

In this study, the familiarity, imageability, emotional valence, and emotional arousal scales of religious words were statistically reliable. In addition, we found that familiarity, imageability, emotional valence, and emotional arousal positively correlated with each other. These findings showed that each psycholinguistic feature of religious words could associate with others. Familiar religious words might be encoded and remembered more than unfamiliar religious words, and familiar religious words would be evaluated as more imageable, preferable, and exciting than unfamiliar religious words. The implications are supported by previous studies. For instance, familiar stimuli were more preferable than unfamiliar stimuli (e.g., Namba and Kambara 2020). In addition, imageable religious words would clearly mean the word meanings, which include lexicosemantic (e.g., familiarity) and emotional features (e.g., emotional valence and emotional arousal), compared to unimageable religious words. Previous findings showed that lexicosemantic features (e.g., familiarity and imageability) correlated with each other, while emotional features (emotional valence and arousal) also correlated with lexicosemantic features (e.g., Citron et al. 2014). In addition, previous findings of word learnings would support these implications. For example, a previous study of word learning showed that repetitions of word learning facilitate associations between words and meanings (e.g., Kambara et al. 2013). This finding is in line with numerous previous results, which have identified the familiarity and imageability of diverse words in different languages (Benjafield et al. 1993; Benjafield and Muckenheim 1989; Boukadi et al. 2016; Citron et al. 2014; Gilhooly and Hay 1977; Gilhooly and Logie 1980; Guasch et al. 2016; Juhasz et al. 2015; Pratt and Goss 1977; Stadthagen-Gonzalez and Davis 2006; Stratton et al. 1975; Yao et al. 2017; Yee 2017). The results of the present and previous studies imply that imageable words are perceived as more familiar, preferable, and exciting than unimageable words (Yee 2017). Furthermore, preferable religious words were also more exciting than unpreferable religious words, since emotional valence of stimuli associates with emotional arousal of stimuli by using non-verbal SAM scales (e.g., Bradley and Lang 1994). Although previous studies, which used verbal Likert scales to detect emotional valence and emotional arousal of real words, reported that there would be a quadratic relation between emotional valence and emotional arousal of real words (e.g., Citron et al. 2014; Yao et al. 2017), the differences between this study and previous studies would be affected by the differences of scales and words. Thus, these findings suggest that for various words, including religious words, familiarity, imageability, emotional valence, and emotional arousal could be strongly associated with one another.

4.2. The Japanese Version of the Centrality of Religiosity Scale

All versions of the JCRS showed statistically reliable results in this study. Our outcomes are consistent with the results obtained for other versions of the CRS (e.g., Ackert et al. 2020a, 2020b; Demmrich 2020; Esperandio et al. 2019; Huber and Huber 2012) regarding the local and the global fit indices. Thus, our scale can be considered to be a Japanese version of the CRS. The only point of discussion would be the unsatisfactory fitting RMSEA indices, which normally indicate a lack of parsimony in the models. However, in the case with the JCRS, the higher RMSEA values go along with the simpler models, which is running again the argument of model parsimony. Therefore, we rely on CFI, TLI, and SRMR, which all show good to excellent model fit. The poor fit with the RMSEA should be further examined in future studies with the CRS in Japan. Upcoming samples should be more diverse in terms of religious and educational background, age, and region of habitation in Japan and other Eastern counties (e.g., Lee and Kuang 2020).
We recommend using the short versions (CRS-5 and CRSi-7) in future investigations if the main goal of the study is not religiosity itself but where religiosity is included as a variable of interest (e.g., Lee and Kuang 2020; Riegel 2020). However, if the primary goal of the study is the investigation of the structure of religiosity, we encourage the use of the long versions (CRS-15 and CRSi-20; e.g., Perveen and Malik 2020; Rożnowski and Zarzycka 2020; Zarzycka et al. 2020). The intermediate versions (CRS-10 and CRSi-14) offer a compromise between the frugality of the short versions and the structural finesse of the long versions if needed (e.g., for an application, Friedrich-Killinger 2020).
Modeling the CRS in the confirmatory factor analyses with categorical data levels and weighted least square estimators was a compromise done to handle the non-normal distributed data. We are aware of the consequences of such a decision. Therefore, we point out that the estimates are not to be interpreted in the usual metric way. Categorical data forces the interpretation into thresholds that are—regarding the number of items and models in this study—too numerous to be included in this paper even as a supplement. As this examination primarily focuses on the religious words and their characteristics, we leave out the statistical discussion of the CRS thresholds for all the tested models.

4.3. The Relationships Between the Familiarity with Religious Words and Religiosity

Familiarity, emotional valence, and emotional arousal through religious words positively correlated with all dimensions of religiosity, including intellect, ideology, public practice, private practice, and experience. These findings suggest that psycholinguistic features (subjective evaluations) of religious words would constitute new measurements to detect religiosity. Previous studies have shown that religiosity associate with the word usage on social media including Twitter and Facebook (Chen and Huang 2019; Thomas et al. 2019; Yaden et al. 2018). In addition, a previous study examined understanding of religious words in an experiment, although religiosity was not detected (Ritter and Preston 2013). This study firstly identified that the core dimensions of religiosity (i.e., intellect, ideology, public practice, private practice, and experience) correlated with psycholinguistic features (i.e., familiarity, imageability, emotional valence, and emotional arousal) of religious words by the survey methods. In line with other perspectives, we also found that religious people were familiar with, prefer, and were excited by religious words. This finding is also consistent with previous studies. For instance, Yaden et al. (2018) reported that people with a religious affiliation used significantly more religious words on social media, such as “Jesus” and “soul,” than people without any religious affiliation. Based on the results of the present and previous studies, religious people may pay attention to religious words. Finally, the imageability weakly correlated or did not correlate with each dimension of religiosity. In this study, we used some abstract words (e.g., afterlife and soul). Imageability was strongly associated with concreteness (e.g., Altarriba et al. 1999). Therefore, the concreteness of religious words could affect the imageability and the correlations between imageability and each mean dimensional score of the JCRS.

4.4. Limitations and Future Research Directions

This study has some limitations. First, we included only native speakers of Japanese who live in Japan. Also, to identify language and cultural effects, future studies should collect data from more diverse language and cultural cohorts. Second, participants’ religious affiliation was not assessed in this study. This study focused only on the religiosity of the participants in general, without focusing on specific religions and differences among them. However, the inclusion of participants’ religious affiliation would likely contribute interesting results. For instance, as for the original religions (e.g., Shinto) that exist in Japan, future studies could establish whether there is any difference between Shinto adherents who practice intensely and those who have a vague cultural association with Shinto. Finally, other psycholinguistic features (e.g., concreteness, abstractness, age of acquisition, context availability, and so on) were not used in this study. Future studies need to also include these psycholinguistic features and determine their relationships with religiosity.

5. Conclusions

In conclusion, this study aimed to investigate whether psycholinguistic features of religious words, namely, familiarity, imageability, emotional valence, and emotional arousal correlated positively with the mean dimensional scores of the JCRS, which was used to measure the religiosity of Japanese participants. First, the scales assessing the psycholinguistic features of religious words were statistically reliable. Second, the JCRS was also statistically reliable. Third, the psycholinguistic features of the religious words (familiarity, emotional valence, and emotional arousal) and the JCRS correlated positively with each other. Fourth, highly religious people had familiarity and emotional arousal to religious words more than non-religious people, while highly religious people had emotional valence to religious words more than non-religious and religious people. In addition, religious people had familiarity to religious words more than non-religious people. On the other hand, the imageability weakly correlated or did not correlate with each dimension of religiosity. These results might be because the religious words used in this study included some abstract words. In sum, these findings suggest that psycholinguistic features of religious words contribute to the detections of multi-dimensional religiosity. The findings also implied that when researchers measure the psycholinguistic features of religious words, they would identify the core dimensions of religiosity.

Author Contributions

Conceptualization, T.K. and T.U.; methodology, T.K.; software, T.K., T.U., and M.A.; validation, T.K., T.U., and M.A.; formal analysis, T.K., T.U., and M.A.; investigation, T.K., T.U., and Y.Y.; resources, T.K.; data curation, T.K., and Y.Y.; writing—original draft preparation, T.K., T.U., and M.A.; writing—review and editing, T.K., T.U., and M.A.; visualization, T.K., T.U., and M.A.; supervision, T.K., T.U., and M.A.; project administration, T.K.; funding acquisition, T.K. All authors have read and agreed to the published version of the manuscript.

Funding

The authors (T.K. and T.U.) were supported by Hiroshima University Grant-in-Aid for Scientific Research (to T.K.), KAKENHI Grant-in-Aid for Research Activity Start-up (to T.K.), KAKENHI Grant-in-Aid for Early-Career Scientists (to T.K. and T.U.), and KAKENHI Grant-in-Aid for Scientific Research (C) (to T.K.). In addition, this research was conducted as part of the School of Education Joint Research Project 2020 at Hiroshima University, and received research support from the School of Education.

Acknowledgments

We would like to thank Stefan Huber who provided many advices to improve this study. We would like to also thank Sabrina Sovilla BSc in Psychology, who is a graduate student at the University of Bern for English language editing.

Conflicts of Interest

The authors declare no conflict of interest.

Appendix A

Table A1. Japanese version of the Centrality of Religiosity Scale (JCRS) translated from the English version of the Centrality of Religiosity Scale (Huber and Huber 2012).
JapaneseEnglishItem Designation in Statistical Models
1. どのくらい頻繁に宗教的問題について考えますか。1. How often do you think about religious issues?int1
2. どの程度, 神や神聖な何かが存在すると信じていますか。2. To what extent do you believe that God or something divine exists?ide1
3. どのくらい頻繁に宗教的儀式に参加していますか。3. How often do you take part in religious services?serv1
4. どのくらい頻繁に祈りますか。4. How often do you pray?priv1
4b. どのくらい頻繁に瞑想しますか。4b. How often do you meditate?priv1a
5. どのくらい頻繁に神や神聖な何かが人生に介入する感じを経験しますか。5. How often do you experience situations in which you have the feeling that God or something divine intervenes in your life?exp1
5b. どのくらい頻繁に全てとつながる感じを経験しますか。5b. How often do you experience situations in which you have the feeling that you are in one with all?exp1a
6. 宗教的な話題を学ぶことにどのくらい興味がありますか。6. How interested are you in learning more about religious topics?int2
7. どの程度死後の世界を信じていますか。
例) 魂の不滅, 死者の復活, 生まれ変わり
7. To what extent do you believe in an afterlife? (e.g., immortality of the soul, resurrection of the dead or reincarnation)ide2
8. 宗教的儀式に参加することはどのくらい重要ですか。8. How important is it to take part in religious services?serv2
9. 祈りはどのくらい重要ですか。9. How important is personal prayer for you?priv2
9b. 瞑想はどのくらい重要ですか。9b. How important is meditation for you?priv2a
10. どのくらい頻繁に神や神聖な何かがあなたとの交流や, あなたに何かを明らかにしようとする感じを経験しますか。10. How often do you experience situations in which you have the feeling that God or something divine wants to communicate or to reveal something to you?exp2
10b. どのくらい頻繁に神聖な力によって触れられる感じを経験しますか。10b. How often do you experience situations in which you have the feeling that you are touched by a divine power?exp2a
11. どのくらい頻繁にラジオ, テレビ, インターネット, 新聞もしくは本を通じて, 宗教的問題を把握していますか。11. How often do you keep yourself informed about religious questions through radio, television, internet, newspapers, or books?int3
12. あなたの意見では, どのくらいの確率で高次の力が本当に存在するでしょうか。12. In your opinion, how probable is it that a higher power really exists?ide3
13. 宗教団体と関係を持つことはあなたにとってどのくらい重要ですか。13. How important is it for you to be connected to a religious community?serv3
14. 日々の状況から影響を受けた時は, どのくらい頻繁に自発的に祈りますか。14. How often do you pray spontaneously when inspired by daily situations?priv3
14b. 日々の状況から影響を受けた時は, どのくらい頻繁に聖なるものと自発的につながろうとしますか。14b.How often do you try to connect to the divine spontaneously when inspired by daily situations?priv3a
15. 神や聖なる何かが存在している感じをどのくらい頻繁に経験しますか。15. How often do you experience situations in which you have the feeling that God or something divine is present?exp3
Note. 5-item JCRS (JCRS-5) includes 1, 2, 3, 4, and 5; 10-item JCRS (JCRS-10) includes 1, 2, 3, 4, 5, 6, 7, 8, 9, and 10; 15-item JCRS (JCRS-15) includes 1, 2, 3, 4, 5, 6, 7, 8, 9, 10, 11, 12, 13, 14, and 15; 7-item JCRS interreligious (JCRSi-7) includes 1, 2, 3, maximum of 4/4b, and maximum of 5/5b; 14-item JCRS interreligious (JCRSi-14) includes 1, 2, 3, maximum of 4/4b, maximum of 5/5b, 6, 7, 8, maximum of 9/9b, and maximum of 10/10b; 20-item JCRS interreligious (JCRSi-20) includes 1, 2, 3, maximum of 4/4b, maximum of 5/5b, 6, 7, 8, maximum of 9/9b, maximum of 10/10b, 11, 12, 13, maximum of 14/14b, and 15. Regarding the items 4/4b, 5/5b, 9/9b, 10/10b, and 14/14b, we calculated the maximum value for each of the following pairs: 4 and 4b, 5 and 5b, 9 and 9b, 10 and 10b, and 14 and 14b in JCRSi-7, JCRSi-14, and JCRSi-20, in the statistical models they are designated with the prefix “max” based on Huber and Huber (2012).

Appendix B

Figure A1. Histograms of CRS-15 items. Int = intellect; ide = ideology; serv = public practice; priv = private practice; exp = experience. The number after the item name indicates the position of the item within the core dimension items. The upper row contains the items of the CRS-5, adding the middle row constitutes the items of the CRS-10, and including the lower row you get all items of the CRS-15.
Religions 11 00673 g0a1
Figure A2. Histograms of CRSi-20 items. Int = intellect; ide = ideology; serv = public practice; priv = private practice; exp = experience; max = this prefix means that out of two items, only the one with the higher value for this core dimension is processed in the analysis. The number after the item name indicates the position of the item within the core dimension items. The upper row contains the items included in the CRSi-7, adding the middle row constitutes the items of the CRSi-14, and including the lower row you get all items of the CRSi-20.
Religions 11 00673 g0a2

Appendix C

Figure A3. Results of the confirmatory factor analysis of the CRS-5. The numbers in the plot represent standardized estimates. Cent = centrality of religiosity; int = intellect; ide = ideology; serv = public practice; priv = private practice; exp = experience. The number after the item name indicates the position of the item within the core dimension items. Squares depict manifest and circles latent variables. Residual arrows are not shown for the manifest variables. The numbers on the arrows are factor loadings. The model is identified by setting the variance of the latent variable “cent” to 1.00. All reported estimates are significant at least α 0.05 level.
Religions 11 00673 g0a3
Figure A4. Results of the confirmatory factor analysis of the CRSi-7. Numbers in the plot represent standardized estimates. Cent = centrality of religiosity; int = intellect; ide = ideology; serv = public practice; priv = private practice; exp = experience; max = this prefix means that out of two items, only the one with the higher value for this core dimension is processed in the analysis. The number after the item name indicates the position of the item within the core dimension items. Squares depict manifest and circles latent variables. Residual arrows are not shown for the manifest variables. The numbers on the arrows are factor loadings. The model is identified by setting the variance of the latent variable “cent” to 1.00. All reported estimates are significant with at least α 0.05 level.
Religions 11 00673 g0a4
Figure A5. Results of the confirmatory factor analysis of the CRS-10. The numbers in the plot represent standardized estimates. Cent = centrality of religiosity; int = intellect; ide = ideology; serv = public practice; priv = private practice; exp = experience. The number after the item name indicates the position of the item within the core dimension items. Squares depict manifest and circles latent variables. Residual arrows are not shown for the manifest variables. Numbers on arrows are factor loadings. The model is identified by setting the variance of the second level latent variable “cent” and the factor loading of each item with the suffix “1” to be equal 1. All reported estimates are significant at least α 0.05 level.
Religions 11 00673 g0a5
Figure A6. Results of the confirmatory factor analysis of the CRSi-14. The numbers in the plot represent standardized estimates. Cent = centrality of religiosity; int = intellect; ide = ideology; serv = public practice; priv = private practice; exp = experience; max = this prefix means that out of two items, only the one with the higher value for this core dimension is processed in the analysis. The number after the item name indicates the position of the item within the core dimension items. Squares depict manifest and circles latent variables. Residual arrows are not shown for the manifest variables. Numbers on arrows are factor loadings. The model is identified by setting the variance of the second level latent variable “cent” and the factor loading of each item with the suffix “1” to be equal 1. All reported estimates are significant at least α 0.05 level.
Religions 11 00673 g0a6
Figure A7. Results of the confirmatory factor analysis of the CRS-15. The numbers in the plot represent standardized estimates. Cent = centrality of religiosity; int = intellect; ide = ideology; serv = public practice; priv = private practice; exp = experience. The number after the item name indicates the position of the item within the core dimension items. Squares depict manifest and circles latent variables. Residual arrows are not shown for the manifest variables. Numbers on arrows are factor loadings. The model is identified by setting the variance of the second level latent variable “cent” and the factor loading of each item with the suffix “1” to be equal 1. All reported estimates are significant at least α 0.05 level.
Religions 11 00673 g0a7
Figure A8. Results of the confirmatory factor analysis of the CRSi-20. Numbers in the plot represent standardized estimates. Cent = centrality of religiosity; int = intellect; ide = ideology; serv = public practice; priv = private practice; exp = experience; m = this prefix means that out of two items, only the one with the higher value for this core dimension is processed in the analysis. The number after the item name indicates the position of the item within the core dimension items. Squares depict manifest and circles latent variables. Residual arrows are not shown for the manifest variables. Numbers on arrows are factor loadings. The model is identified by setting the variance of the second level latent variable “cent” and the factor loading of each item with the suffix “1” to be equal 1. All reported estimates are significant at least α 0.05 level.
Religions 11 00673 g0a8

References

  1. Ackert, Michael, Erekle Maglakelidze, Irina Badurashvili, and Stefan Huber. 2020a. Validation of the short forms of the centrality of religiosity scale in Georgia. Religions 11: 57. [Google Scholar] [CrossRef] [Green Version]
  2. Ackert, Michael, Prutskova Elena, and Zabaev Ivan. 2020b. Validation of the short forms of centrality of religiosity scale in Russia. Religions 11: 577. [Google Scholar] [CrossRef]
  3. Aghababaei, Naser, Agata Blachnio, and Masoume Aminikhoo. 2018. The relations of gratitude to religiosity, well-being, and personality. Mental Health, Religion & Culture 21: 408–17. [Google Scholar]
  4. Altarriba, Jeanette, Lisa M. Bauer, and Claudia Benvenuto. 1999. Concreteness, context availability, and imageability ratings and word associations for abstract, concrete, and emotion words. Behavior Research Methods, Instruments, & Computers 31: 578–602. [Google Scholar]
  5. Benjafield, John, and Ron Muckenheim. 1989. Dates of entry and measures of imagery, concreteness, goodness, and familiarity for 1046 words sampled from the Oxford English Dictionary. Behavior Research Methods, Instruments, & Computers 21: 31–52. [Google Scholar]
  6. Benjafield, John, Kris Frommhold, Tom Keenan, Ron Muckenheim, and Dierk Mueller. 1993. Imagery, concreteness, goodness, and familiarity ratings for 500 proverbs sampled from the Oxford Dictionary of English Proverbs. Behavior Research Methods, Instruments, & Computers 25: 27–40. [Google Scholar]
  7. Bloodgood, James M., William H. Turnley, and Peter Mudrack. 2008. The influence of ethics instruction, religiosity, and intelligence on cheating behavior. Journal of Business Ethics 82: 557–71. [Google Scholar] [CrossRef]
  8. Boukadi, Mariem, Cirine Zouaidi, and Maximiliano A. Wilson. 2016. Norms for name agreement, familiarity, subjective frequency, and imageability for 348 object names in Tunisian Arabic. Behavior Research Methods 48: 585–99. [Google Scholar] [CrossRef] [Green Version]
  9. Bradley, Margaret M., and Peter J. Lang. 1994. Measuring emotion: The self-assessment manikin and the semantic differential. Journal of Behavioral Therapy and Experimental Psychiatry 25: 49–59. [Google Scholar] [CrossRef]
  10. Brysbaert, Marc, and Boris New. 2009. Moving beyond Kučera And Francis: A critical evaluation of current word frequency norms and the introduction of a new and improved word frequency measure for American English. Behavior Research Methods 41: 977–90. [Google Scholar] [CrossRef] [Green Version]
  11. Chen, Chih-Yu, and Tsung-Ren Huang. 2019. Christians and Buddhists are comparably happy on Twitter: A large-scale linguistic analysis of religious differences in social, cognitive, and emotional tendencies. Frontiers in Psychology 10: 113. [Google Scholar] [CrossRef] [PubMed] [Green Version]
  12. Citron, Francesca M. M., Brendan S. Weekes, and Evelyn C. Ferstl. 2014. How are affective word ratings related to lexicosemantic properties? Evidence from the Sussex Affective Word List. Applied Psycholinguistics 35: 313–31. [Google Scholar] [CrossRef] [Green Version]
  13. Clark, James M., and Allan Paivio. 2004. Extensions of the Paivio, Yuille, and Madigan (1968) norms. Behavior Research Methods, Instruments, & Computers 36: 371–83. [Google Scholar]
  14. Clobert, Magali. 2020. East versus West: Psychology of religion in East Asian cultures. Current Opinion in Psychology 40: 61–66. [Google Scholar] [CrossRef] [PubMed]
  15. Cortina, Jose M. 1993. What is coefficient alpha? An examination of theory and applications. Journal of Applied Psychology 78: 98–104. [Google Scholar] [CrossRef]
  16. Demmrich, Sarah. 2020. How to measure Bahái religiosity: The CRSi-20 for Baháis as a first reliable and valid measurement. Religions 11: 29. [Google Scholar] [CrossRef] [Green Version]
  17. Esperandio, Mary Rute Gomes, Hartmut August, Juan José Camou Viacava, Stefan Huber, and Márcio Luiz Fernandes. 2019. Brazilian validation of Centrality of Religiosity Scale (CRS-10BR and CRS-5BR). Religions 10: 508. [Google Scholar] [CrossRef] [Green Version]
  18. Friedrich-Killinger, Sonja. 2020. Centrality of religiosity as a resource for therapy outcome? Religions 11: 155. [Google Scholar] [CrossRef] [Green Version]
  19. Gilhooly, Kenneth. J., and D. Hay. 1977. Imagery, concreteness, age-of-acquisition, familiarity, and meaningfulness values for 205 five letter words having single-solution anagrams. Behavior Research Methods & Instrumentation 9: 12–17. [Google Scholar]
  20. Gilhooly, Kenneth. J., and Robert. H. Logie. 1980. Age-of-acquisition, imagery, concreteness, familiarity, and ambiguity measures for 1944 words. Behavior Research Methods & Instrumentation 12: 395–427. [Google Scholar]
  21. Guasch, Marc, Pilar Ferré, and Isabel Fraga. 2016. Spanish norms for affective and lexico-semantic variables for 1400 words. Behavior Research Methods 48: 1358–69. [Google Scholar] [CrossRef] [PubMed]
  22. Hara, Kazuya. 2001. The word “is” the thing: The “kotodama” belief in Japanese communication. ETC: A Review of General Semantics 58: 279–91. [Google Scholar]
  23. Hu, Li-tze, and Peter M. Bentler. 1999. Cutoff Criteria for Fit Indexes in Covariance Structure Analysis: Conventional Criteria Versus New Alternatives. Structural Equation Modeling-a Multidisciplinary Journal 6: 1–55. [Google Scholar] [CrossRef]
  24. Huber, Stefan, Ackert Michael, and Herbert Scheiblich. 2020. Religiosität in unterschiedlichen Religionskulturen—Vergleiche auf der Basis der Centrality of Religiosity. Cultura & Psyché 1. [Google Scholar] [CrossRef]
  25. Huber, Stefan, and Odilo W. Huber. 2012. The Centrality of Religiosity Scale (CRS). Religions 3: 710–24. [Google Scholar] [CrossRef]
  26. Huber, Stefan. 2003. Zentralität und Inhalt. Ein neues Multidimensionales Messinstrument der Religiosität [Centrality and Content. A New Multidimensional Model for the Measurement of Religiosity]. Opladen: Springer Fachmedien Wiesbaden, vol. 9. [Google Scholar]
  27. Juhasz, Barbara J., Yun-Hsuan Lai, and Michelle L. Woodcock. 2015. A database of 629 English compound words: Ratings of familiarity, lexeme meaning dominance, semantic transparency, age of acquisition, imageability, and sensory experience. Behavior Research Methods 47: 1004–19. [Google Scholar] [CrossRef] [Green Version]
  28. Kambara, Toshimune, Takashi Tsukiura, Yayoi Shigemune, Akitake Kanno, Rui Nouchi, Yukihito Yomogida, and Ryuta Kawashima. 2013. Learning-dependent changes of associations between unfamiliar words and perceptual features: A 15-day longitudinal study. Language Sciences 35: 80–86. [Google Scholar] [CrossRef]
  29. Kambara, Toshimune, and Tomotaka Umemura. Forthcoming. The relationships between initial consonants in Japanese sound symbolic words and familiarity, multi-sensory imageability, emotional valence, and arousal. Journal of Psycholinguistic Research. accepted.
  30. Lang, Peter J. 1980. Behavioral treatment and bio-behavioral assessment: Computer applications. In Technology in Mental Health care Delivery Systems. Edited by Joseph B. Sidowski, James H. Johnson and Thomas A. Williams. Norwood: Ablex Publishing, pp. 119–37. [Google Scholar]
  31. Lee, John Chi-Kin, and Xiaoxue Kuang. 2020. Validation of the Chinese version of the centrality of religiosity scale (CRS): Teacher perspectives. Religions 11: 266. [Google Scholar] [CrossRef]
  32. MacCallum, Robert C., Michael W. Browne, and Hazuki M. Sugawara. 1996. Power analysis and determination of sample size for covariance structure modeling. Psychological Methods 1: 130–49. [Google Scholar] [CrossRef]
  33. McClenon, James. 1993. Surveys of anomalous experience in Chinese, Japanese, and American samples. Sociology of Religion 54: 295–302. [Google Scholar] [CrossRef]
  34. Namba, Shushi, and Toshimune Kambara. 2020. Semantics based on the physical characteristics of facial expressions used to produce Japanese vowels. Behavioral Sciences 10: 157. [Google Scholar] [CrossRef] [PubMed]
  35. Osgood, Charles E., George J. Suci, and Percy H. Tannenbaum. 1957. The Measurement of Meaning. Urbana: University of Illinois Press. [Google Scholar]
  36. Paivio, Allan, John C. Yuille, and Stephen A. Madigan. 1968. Concreteness, imagery, and meaningfulness values for 925 nouns. Journal of Experimental Psychology 76: 1–25. [Google Scholar] [CrossRef] [PubMed]
  37. Perveen, Aisha, and Sadia Malik. 2020. Influence of family violence on the marital quality in Pakistani muslims: Role of personal factors. Religions 11: 470. [Google Scholar] [CrossRef]
  38. Pratt, Donald F., and Albert E. Goss. 1977. Age, familiarity, imagery, pronunciability, and meaningfulness of verbal units of factual information. Bulletin of the Psychonomic Society 9: 325–28. [Google Scholar] [CrossRef]
  39. Preston, Jesse Lee, and Faith Shin. 2017. Spiritual experiences evoke awe through the small self in both religious and non-religious individuals. Journal of Experimental Social Psychology 70: 212–21. [Google Scholar] [CrossRef] [Green Version]
  40. Preston, Jesse Lee, and Ryan S. Ritter. 2013. Different effects of religion and God on prosociality with the ingroup and outgroup. Personality and Social Psychology Bulletin 39: 1471–83. [Google Scholar] [CrossRef]
  41. Riegel, Ulrich. 2020. Centrality of religiosity, attitude towards christianity and post-critical belief: Comparing three measures of religiosity. Religions 11: 46. [Google Scholar] [CrossRef] [Green Version]
  42. Ritter, Ryan S., and Jesse Lee Preston. 2013. Representations of religious words: Insights for religious priming research. Journal for the Scientific Study of Religion 52: 494–507. [Google Scholar] [CrossRef]
  43. Ritter, Ryan S., Jesse Lee Preston, and Ivan Hernandez. 2014. Happy tweets: Christians are happier, more socially connected, and less analytical than atheists on Twitter. Social Psychological and Personality Science 5: 243–49. [Google Scholar] [CrossRef]
  44. Rosmarin, David H., Steven Pirutinsky, Adam B. Cohen, Yardana Galler, and Elizabeth J. Krumrei. 2011. Grateful to God or just plain grateful? A comparison of religious and general gratitude. The Journal of Positive Psychology 6: 389–96. [Google Scholar] [CrossRef]
  45. Rożnowski, Bohdan, and Beata Zarzycka. 2020. Centrality of religiosity as a predictor of work orientation styles and work engagement: A moderating role of gender. Religions 11: 387. [Google Scholar] [CrossRef]
  46. Scheepers, Peer, Manfred Te Grotenhuis, and Frans Van Der Slik. 2002. Education, religiosity, and moral attitudes: Explaining cross-national effect differences. Sociology of Religion 63: 157–77. [Google Scholar] [CrossRef]
  47. Shariff, Azim F., Aiyana K. Willard, Teresa Andersen, and Ara Norenzayan. 2016. Religious priming: A meta-analysis with a focus on prosociality. Personality and Social Psychology Review 20: 27–48. [Google Scholar] [CrossRef]
  48. Stadthagen-Gonzalez, Hans, and Colin J. Davis. 2006. The Bristol norms for age of acquisition, imageability, and familiarity. Behavior Research Methods 38: 598–605. [Google Scholar] [CrossRef]
  49. Stratton, R. Paul, Kenneth A. Jacobus, and Bonnie Brinley. 1975. Age-of-acquisition, imagery, familiarity and meaningfulness norms for 543 words. Behavior Research Methods & Instrumentation 7: 1–6. [Google Scholar]
  50. Tarn, Derjung M., Lisa S. Meredith, Marjorie Kagawa-Singer, Shinji Matsumura, Seiji Bito, Robert K. Oye, Honghu Liu, Katherine L. Kahn, Shunichi Fukuhara, and Neil S. Wenger. 2005. Trust in one’s physician: The role of ethnic match, autonomy, acculturation, and religiosity among Japanese and Japanese Americans. Annals of Family Medicine 3: 339–47. [Google Scholar] [CrossRef] [Green Version]
  51. Thomas, Justin, Aamna Al Shehhi, and Ian Grey. 2019. The sacred and the profane: Social media and temporal patterns of religiosity in the United Arab Emirates. Journal of Contemporary Religion 34: 489–508. [Google Scholar] [CrossRef]
  52. Williams, Gary A., AnaMarie C. Guichard, and JungHa An. 2017. The effects of name and religious priming on ratings of a well-known political figure, President Barack Obama. PLoS ONE 12: e0180676. [Google Scholar] [CrossRef] [Green Version]
  53. Yaden, David B., Johannes C. Eichstaedt, Margaret L. Kern, Laura K. Smith, Anneke Buffone, David J. Stillwell, Michal Kosinski, Lyle H. Ungar, Martin E. P. Seligman, and H. Andrew Schwartz. 2018. The language of religious affiliation: Social, emotional, and cognitive differences. Social Psychological and Personality Science 9: 444–52. [Google Scholar] [CrossRef]
  54. Yao, Zhao, Jia Wu, Yanyan Zhang, and Zhenhong Wang. 2017. Norms of valence, arousal, concreteness, familiarity, imageability, and context availability for 1100 Chinese words. Behavior Research Methods 49: 1374–85. [Google Scholar] [CrossRef] [Green Version]
  55. Yee, Lydia T. S. 2017. Valence, arousal, familiarity, concreteness, and imageability ratings for 292 two-character Chinese nouns in Cantonese speakers in Hong Kong. PLoS ONE 12: e0174569. [Google Scholar] [CrossRef]
  56. Zarzycka, Beata, Rafał P. Bartczuk, and Radosław Rybarski. 2020. Centrality of religiosity scale in Polish research: A curvilinear mechanism that explains the categories of centrality of religiosity. Religions 11: 64. [Google Scholar] [CrossRef] [Green Version]
Figure 1. The confirmatory factor analysis model for the CRS-5. int = intellect; ide = ideology; serv = public practice; priv = private practice; exp = experience. The number after the item name indicates the position of the item within the core dimension items. Squares depict manifest and circles latent variables. Residual arrows are not shown for the manifest variables.
Religions 11 00673 g001
Figure 2. The confirmatory factor analysis model for the CRSi-7. int = intellect; ide = ideology; serv = public practice; priv = private practice; exp = experience; max = this prefix means that out of two items, only the one with the higher value for this core dimension is proceeded in the analysis. The number after the item name indicates the position of the item within the core dimension items. Squares depict manifest and circles latent variables. Residual arrows are not shown for the manifest variables.
Religions 11 00673 g002
Figure 3. The confirmatory factor analysis model for the CRS-10. int = intellect; ide = ideology; serv = public practice; priv = private practice; exp = experience. The number after the item name indicates the position of the item within the core dimension items. Squares depict manifest and circles latent variables. Residual arrows are not shown for the manifest variables. Residuals for the latent variables are shown as arrows starting in blank space.
Religions 11 00673 g003
Figure 4. The confirmatory factor analysis model for the CRSi-14. int = intellect; ide = ideology; serv = public practice; priv = private practice; exp = experience; max = this prefix means that out of two items, only the one with the higher value for this core dimension is proceeded in the analysis. The number after the item name indicates the position of the item within the core dimension items. Squares depict manifest and circles latent variables. Residual arrows are not shown for the manifest variables. Residuals for the latent variables are shown as arrows starting in blank space.
Religions 11 00673 g004
Figure 5. The confirmatory factor analysis model for the CRS-15. int = intellect; ide = ideology; serv = public practice; priv = private practice; exp = experience. The number after the item name indicates the position of the item within the core dimension items. Squares depict manifest and circles latent variables. Residual arrows are not shown for the manifest variables. Residuals for the latent variables are shown as arrows starting in blank space.
Religions 11 00673 g005
Figure 6. The confirmatory factor analysis model for the CRSi-20. int = intellect; ide = ideology; serv = public practice; priv = private practice; exp = experience; m = this prefix means that out of two items, only the one with the higher value for this core dimension is proceeded in the analysis. The number after the item name indicates the position of the item within the core dimension items. Squares depict manifest and circles latent variables. Residual arrows are not shown for the manifest variables. Residuals for the latent variables are shown as arrows starting in blank space.
Religions 11 00673 g006
Table 1. Mean scores and standard deviations of psycholinguistic features of religious words.
Religious WordsM (SD)
Japanese (English)FamiliarityImageabilityEmot. ValenceEmot. Arousal
kamisama (God)3.59 (1.27)3.50 (1.18)6.41 (1.52)3.52 (2.23)
meisou (meditation)2.95 (1.36)3.58 (1.26)5.00 (1.37)2.24 (1.85)
satori (enlightenment)2.84 (1.39)3.06 (1.30)5.20 (1.45)2.13 (1.76)
inori (praying)3.75 (1.20)4.07 (1.03)5.57 (1.80)3.16 (2.28)
shigonosekai (afterlife)2.39 (1.39)2.13 (1.27)4.18 (2.23)2.86 (2.19)
shuukyou (religion)2.89 (1.43)3.46 (1.31)5.01 (1.91)4.09 (2.43)
tamashii (soul)2.96 (1.31)2.57 (1.30)5.13 (1.46)3.92 (2.53)
danjiki (fasting)2.09 (1.35)3.68 (1.27)2.91 (1.72)3.13 (2.30)
seiten (holy book)2.70 (1.57)3.12 (1.61)5.76 (2.27)3.87 (2.43)
gishiki (ceremony)2.68 (1.28)3.57 (1.23)4.78 (1.66)4.33 (2.51)
yogen (prophecy)2.54 (1.28)3.22 (1.31)4.60 (1.75)4.89 (2.57)
ai (love)4.15 (0.91)3.88 (1.21)7.54 (1.66)5.81 (2.42)
Note. M = mean score; SD = standard deviation; Emot. = emotional. The range of Familiarity was from 1 (unfamiliar) to 5 (familiar), whereas the range of Imageability was also from 1 (unimageable) to 5 (imageable). In addition, the range of Emot. Valence was from 1 (unpleasant) to 9 (pleasant), while the range of Emot. Arousal was from 1 (calm) to 9 (excited). These mean scores and standard deviations were calculated in SPSS when Cronbach’s alphas were also calculated with listwise deletions based on all variables.
Table 2. Results of the exploratory factor analysis of the CRS scales.
VersionKMOBartlett’sExplained Variance
Sphericitypdf
CRS-50.82508.699<0.0011052%
CRS-100.871422.91<0.0014548%
CRS-150.922568.079<0.00110549%
CRSi-70.81477.296<0.0011050%
CRSi-140.861352.954<0.0014547%
CRSi-200.922491.698<0.00110548%
Note. N = 269; CRS = Centrality of Religiosity Scale; CRSi = interreligious CRS; KMO = Kaiser-Meyer-Olkin criterion; p = probability level; df = degrees of freedom.
Table 3. EFA extracted loadings for interreligious CRS subscale items.
ItemCRSi-20CRSi-14CRSi-7
int10.630.650.65
ide10.690.690.65
serv10.680.700.71
max exp10.790.770.76
max priv10.750.750.75
int20.540.55
ide20.550.54
serv20.640.70
max exp20.800.73
max priv20.700.73
int30.43
ide30.68
serv30.76
exp30.83
max priv30.80
Note. EFA = Exploratory Factor Analysis; int = intellect; ide = ideology; serv = public practice; exp = experience; priv = private practice; max = the item is calculated as the maximum value of the two concurrent items on this dimension of the interreligious scale. For example, max priv1 is the maximum value of the prayer and meditation items from which only the higher score is taken. The numbers behind the abbreviations indicate the item’s position within its proper core dimension.
Table 4. EFA extracted loadings for CRS subscale items.
ItemCRS-15CRS-10CRS-5
int10.650.660.66
ide10.680.680.63
serv10.710.730.74
priv10.780.770.77
exp10.780.760.77
int20.540.55
ide20.530.51
serv20.670.72
priv20.740.74
exp20.800.76
int30.43
ide30.67
serv30.78
priv30.77
exp30.80
Note. Int = intellect; ide = ideology; serv = public practice; exp = experience; priv = private practice. The numbers behind the abbreviations indicate the item’s position within its proper core dimension.
Table 5. Results of the confirmatory factor analyses with all versions of the CRS.
ModelNpar χ 2 dfpRMSEALLULpcloseCFITLISRMR
CRS-52522.995<0.0010.120.070.170.0110.980.960.03
CRS-1055111.8430<0.0010.100.080.12<0.0010.970.960.04
CRS-1580288.8585<0.0010.090.080.11<0.0010.960.950.05
CRSi-72526.245<0.0010.130.080.180.0040.980.950.03
CRSi-1455104.5030<0.0010.100.080.12<0.0010.970.960.04
CRSi-2080289.1485<0.0010.090.080.11<0.0010.960.950.05
Note. N = 269. Npar = number of parameters; df = degrees of freedom; p = probability level; RMSEA = root mean squared error of approximation; LL = lower level of 90% confidence interval of RMSEA; UL = upper level of 90% confidence interval of RMSEA; CI = confidence interval; pclose = close fit function’s probability level for RMSEA; CFI = comparative fit index; TLI = Tucker-Lewis index; SRMR = standardized root mean error.
Table 6. R 2 of the items of the CRS in the confirmatory factor analysis.
ItemCRS-15CRS-10CRS-5
int10.870.930.50
ide10.680.68
serv10.82
priv10.860.850.47
exp10.750.74
int20.59
ide20.870.890.68
serv20.920.92
priv20.91
exp20.880.860.67
int30.870.86
ide30.86
serv30.800.850.57
priv30.840.90
exp30.96
Note. R 2 = amount of explained variance; int = intellect; ide = ideology; serv = public practice; priv = private practice; exp = experience. The number after the item name indicates the position of the item within the core dimension items. CRS = centrality of religiosity scale.
Table 7. R 2 of the first level latent variables of the CRS in the confirmatory factor analysis.
ItemCRS-15CRS-10
ide0.750.64
int0.620.63
serv0.830.77
priv0.850.89
exp0.790.74
Note. R 2 = amount of explained variance; int = intellect; ide = ideology; serv = public practice; priv = private practice; exp = experience. CRS = centrality of religiosity scale.
Table 8. R 2 of the items of the interreligious CRS in the confirmatory factor analysis.
ItemCRSi-20CRSi-14CRSi-7
ide10.740.830.51
ide20.470.47
ide30.68
int10.720.710.47
int20.570.56
int30.35
max exp10.770.830.65
max exp20.810.79
exp30.87
max priv10.690.720.62
max priv20.660.73
max priv30.76
serv10.640.710.53
serv20.690.81
serv30.95
Note. R 2 = amount of explained variance; int = intellect; ide = ideology; serv = public practice; priv = private practice; exp = experience; max = this prefix means that out of two items, only the one with the higher value for this core dimension is processed in the analysis. The number after the item name indicates the position of the item within the core dimension items. CRSi = interreligious centrality of religiosity scale.
Table 9. R 2 of the first level latent variables of the interreligious CRS in the confirmatory factor analysis.
ItemCRSi-20CRSi-14
ide0.750.67
int0.610.63
serv0.820.73
priv0.910.86
exp0.740.69
Note. R 2 = amount of explained variance; int = intellect; ide = ideology; serv = public practice; priv = private practice; exp = experience. CRSi = interreligious centrality of religiosity scale.
Table 10. Correlations among psycholinguistic features in religious words and each dimension of religiosity.
FIVAintideservpriv
I0.62 **
V0.41 **0.44 **
A0.25 **0.22 **0.37 **
int0.27 **0.12 *0.28 **0.19 **
ide0.35 **0.21 **0.32 **0.25 **0.49 **
serv0.22**0.060.22 **0.15 *0.61 **0.51 **
priv0.31 **0.14 *0.26 **0.17 **0.54 **0.67 **0.67 **
exp0.22 **0.090.20 **0.23 **0.50 **0.68 **0.65 **0.73 **
Note. F = Familiarity; I = Imageability; V = Emotional Valence; A = Emotional Arousal; int = intellect; ide = ideology; serv = public practice; priv = private practice; exp = experience; ** p < 0.01, * p < 0.05.
Publisher’s Note: MDPI stays neutral with regard to jurisdictional claims in published maps and institutional affiliations.

