Article

Bifactor Models of Religious and Spiritual Struggles: Distinct from Religiousness and Distress

1
Department of Psychological Sciences, Case Western Reserve University, Cleveland, OH 44106, USA
2
Department of Psycholog, Bowling Green State University, Bowling Green, OH 43403, USA
*
Author to whom correspondence should be addressed.
Submission received: 5 March 2016 / Revised: 24 May 2016 / Accepted: 30 May 2016 / Published: 7 June 2016

Abstract

:
The Religious and Spiritual Struggles Scale (RSS) measures important psychological constructs in an underemphasized section of the overlap between religion and well-being. Are religious/spiritual struggles distinct from religiousness, distress, and each other? To test the RSS’ internal discriminant validity, we replicated the original six-factor measurement model across five large samples (N = 5705) and tested the fit of a restricted bifactor model, which supported the mutual viability of multidimensional and unidimensional scoring systems for the RSS. Additionally, we explored a bifactor model with correlated group factors that exhibited optimal fit statistics. This model maintained the correlations among the original factors while extracting a general factor from the RSS. This general factor’s strong correlations with religious participation and belief salience suggested that this factor resembles religiousness itself. Estimating this general factor seemed to improve Demonic and Moral struggles’ independence from religiousness, but did not change any factor’s correlations with neuroticism, depression, anxiety, and stress. These distress factors correlated with most of the independent group factors corresponding to the original dimensions of the RSS, especially Ultimate Meaning and Divine struggles. These analyses demonstrate the discriminant validity of religious/spiritual struggles and the complexity of their relationships with religiousness and distress.

1. Introduction

Religious and spiritual (R/S) aspects of life present a variety of challenges. Over the course of the lifespan many people experience R/S struggle, defined as tension and conflict about sacred matters within oneself, with others, and with the supernatural [1,2]. R/S struggles occur commonly, though not often severely [3,4]. A growing subdomain of psychological research on R/S examines the causes, consequences, and subjective experience of R/S struggle (for reviews, see [1,2,5,6,7,8]). Over 80 new publications related to R/S struggle have appeared since the turn of the millennium [8]. Exline [1] reviewed the broad relationships between R/S struggle and health outcomes of both psychological and physical natures.
Although many people experience religion and spirituality as a source of comfort (e.g., [9]), meaning [10], or help in coping [11], this dominant trend may overshadow the difficulties people experience in their R/S relationships, behaviors, and identity development. R/S struggle foreshadows losses in both mental and physical health [12,13], and relates positively to depression [14], suicidality [15], and even higher mortality rates [13]. These findings have appeared robustly across religious traditions and socio-demographic groups thus far [4,16]. R/S struggle might ultimately hold the potential for personal growth and transformation, although only a few empirical studies have shown support for this position as of yet [17]. Better insight on R/S struggle might clarify the roles it plays in suffering and growth and inspire new means of therapeutic intervention or new public health initiatives. Further evidence of R/S struggle’s relevance to well-being may help emphasize the need to address R/S struggles directly in counseling contexts rather than only treating its symptoms or circumstances [18].
To advance understanding of R/S struggle through quantitative empirical research, Exline, Pargament, Grubbs, and Yali [19] developed the Religious and Spiritual Struggles (RSS) Scale. The RSS measures a range of normative R/S struggles. This multidimensional measure demonstrated good psychometric qualities, including predictive validity and an efficient measurement model. This original model comprises six correlated dimensions:
(1)
Divine: conflict or insecurity in one’s relationship with God
(2)
Demonic: persecution or temptation by the devil or evil spirits
(3)
Interpersonal: conflicts with people or groups related to religion/spirituality
(4)
Moral: concerns with the morality of one’s actions and desires
(5)
Ultimate Meaning: doubting the importance, purpose, or meaning of one’s life as a whole
(6)
Doubt: discomfort with religious or spiritual doubts and questions
Exline and colleagues also estimated a total RSS score from the mean of all subscales’ 26 items.
All RSS factors correlate positively with depressive symptoms, anxiety, state anger, and loneliness [19]. Most RSS factors relate positively and moderately to other measures of R/S struggle constructs, such as anger at God and religious fear, guilt, and doubt. The Divine, Demonic, and Moral subscales appear to converge with attributions of R/S struggles to God, the devil or evil spirits, or oneself, respectively. RSS factors also relate negatively with life satisfaction and meaning in life, admitting some exceptions due in part to domain specificity. For example, meaning in life relates most strongly to meaning struggle, but does not relate to moral struggle. Conversely, moral struggle relates to attributions of personal responsibility for specific R/S struggles, but meaning struggle does not. In original analyses, religiousness also related more to Demonic and Moral struggles than to Ultimate Meaning struggle or to total RSS scores; religiousness did not relate to other RSS factors.
These nuances motivate further study of distinctions among the six subdomains of the RSS, especially with respect to distress and religiousness. Does the RSS merely measure religious expressions of ordinary distress, or expressions of religiousness from particularly distressed people? Neither seems likely given the modest strength of correlations among these constructs as measured independently [19,20,21], as well as evidence of moderators of these relationships [22]. Nonetheless, these theoretical simplifications warrant further disproof if one must reject them and conceptualize R/S struggles as independent constructs.

1.1. Measurement Methodology

Exline and colleagues [19] found good fit statistics for the first-order measurement model of the RSS’ six correlated latent factors in confirmatory factor analysis (CFA). Nonetheless, these analyses left some room for doubts. Primarily, the latent factor model did not test the viability of a second-order factor corresponding to the total RSS score. Strong correlations among the first-order factors (rs = 0.31–0.66, median = 0.51) build evidence for a second-order factor that could represent R/S struggle in general, but a CFA of this model can more precisely quantify support for any single factor that affects all six dimensions of the RSS, which could also include religiousness or distress. Secondarily, model estimation and evaluation methods did not accommodate the ordinal measurement of skewed latent distributions inherent in the design of the RSS and the nature of R/S struggles, which are rarely severe, especially in non-clinical populations [20,21].
Finally, original replications did not test the invariance of the measurement model to ensure that the RSS assessed the same set of constructs in each population without interference from group-specific response biases. The original analyses pooled data from three university samples into one combined sample. These samples shared many demographic features: majorities of each sample were women and ethnically white, and ages varied very little. However, religious affiliations and regions varied somewhat more. One sample came from a university located on the Pacific coast with an institution-level affiliation to Christianity, whereas the others came from religiously unaffiliated universities in the Midwest. Any heterogeneity in latent structures for the RSS and other factors across these samples may have undermined the original analyses’ accuracy. We intend to address each of these limitations throughout this study.

1.1.1. Model Configuration

Second-order factor models can test the validity of a general latent factor that explains why a set of first-order factors correlate. This is a popular method for validating total scores for questionnaires with several subscales, such as the RSS. However, Reise, Moore, and Haviland [23] recommend confirmatory bifactor analysis to compare unidimensional and multidimensional scale scoring alternatives. In a restricted bifactor model, the general factor represents a hypothetical cause of any covariance common to all indicators (in our case, 26 RSS items), which also load on separate, orthogonal group factors. A second-order factor model nests within this less constrained bifactor model and often produces poorer model fit statistics, because it requires that indicators relate to the second-order factor in fractional proportion to their first-order factors’ loadings on the second-order factor (the proportionality constraint).
For example, “Felt troubled about doubts or questions about religion or spirituality” could only relate to a second-order factor of general R/S struggle as strongly as it relates to other Doubt struggle items in general (i.e., its factor loading), and only as strongly as Doubt struggle relates to second-order R/S struggle (the second-order factor loading). Realistically, neither of these correlations would equal 1.0, so the product of these loadings (the correlation between the item and the second-order factor) would necessarily be the smallest of these three numbers, potentially by an inaccurately large margin. For instance, if this item loaded strongly on its first-order factor (e.g., λDoubt = 0.80), and latent Doubt struggle loaded moderately on the second-order factor (e.g., λgeneral = 0.50), this model would limit the item’s correlation with the second-order factor to moderate strength at most (implied λgeneral = 0.40). Though the proportionality constraint prohibits indicators from relating more strongly to the second-order factor than to their first-order factors, a bifactor model allows either correlation (loading) to exceed the other.
If a single latent general factor truly affects responses to all RSS items, it may disproportionately affect some items belonging to a single group factor (e.g., the aforementioned Doubt struggle item). The proportionality constraint arises from an implication of second-order models: first-order factors completely mediate all effects of the second-order factor on the items. A second-order model could allow limited exceptions to the proportionality constraint and incorporate some direct effects by estimating direct loadings on the general factor for some items, but each additional loading would increase the model’s likelihood of empirical underidentification and the estimator’s chances of failing to converge or produce valid parameter estimates. Only bifactor models facilitate estimation of direct, unmediated effects from a general factor on all items at once.
Bifactor models achieve this advantage through an alternate assumption: instead of assuming that first-order group factors fully mediate the effects of a general factor, a bifactor model assumes that the general factor does not relate to the group factors at all. This too may limit the model’s accuracy, but probably to a lesser degree in the case of the RSS. We do not posit some distal, latent influence on all R/S struggles that only affects item responses indirectly through its effects on latent R/S struggles. Instead, we would expect some mixture of domain-specific influences on struggles of particular kinds (e.g., skepticism could produce doubt) and broader, general, unrelated influences on all struggles, such as distress or religiousness, or perhaps something more unique to R/S struggle.
The proportionality constraint may also distort loadings at either level if indicators that share a first-order factor vary in relatedness to other indicators that share the second-order factor. For example, if one indicator (e.g., cloud cover) represents a unique part of a first-order factor (climate) that varies independently of the second-order factor (latitude), that indicator should load strongly on the first-order factor, but not relate to the second-order factor, unlike other indicators (sunlight intensity). Nonetheless, a second-order factor model implies that the indicator’s correlation with the second-order factor equals the product of the indicator’s loading and the first-order factor’s loading on the second-order factor. Such conflicts between empirical reality and second-order models of covariance structure contribute to overall misfit for second-order models, but need not invalidate bifactor models. We do not suspect the RSS of containing any items that relate only to a first-order group factor and not to any general factor, but we cannot rule this out without estimating general factor loadings, nor do we see benefits to imposing the proportionality constraint on a bifactor model of the RSS. For these reasons, we favored bifactor models in our analyses.
A bifactor model’s two sets of loadings also provide a quantitative basis for judging whether a single general factor or multiple group factors explain greater overall amounts of indicators’ covariance. If a general factor explains most of the covariance in a set of measures (as distress or religiousness could in the RSS), this result favors a unidimensional model over a multidimensional model, and vice versa. If indicators load with similar and adequate strength on both general and group factors, this supports the viability of both measurement models.
Our application benefits from this additional advantage of bifactor models over second-order models. After establishing the validity of a general factor of R/S struggle, the six original dimensions of the RSS will need to demonstrate their uniqueness from this primary common factor to retain discriminant validity. In other words, if R/S struggles cohere well enough across the original six dimensions to be described by one scale score representing general R/S struggle, do we still need to think of more specific dimensions (e.g., Doubt struggle) as meaningfully unique from this broader dimension of R/S struggle in general? If the group factors retain some uniqueness, could religiousness or distress then render any of these dimensions redundant, if not the entire RSS?

1.1.2. Model Estimation

The original CFA of the RSS [19] used maximum likelihood estimation on Likert-type rankings treated as interval data for the purpose of these and other correlation analyses. Instead, Reise and colleagues [23] recommend polychoric correlations for CFA of Likert scale data (see also [24]). The two-stage polychoric correlation procedure first estimates values of latent, continuous, normally distributed dimensions to stand in for observed responses on ordinal (including Likert-type) scales, then calculates bivariate correlations between these estimated values. Because polychoric correlations use standard normal latent distributions, they equal the latent covariances.
Most people report low levels of R/S struggles (as measured with other questionnaires) [20,21], indicating positively skewed distributions (with more frequent responses toward the low ends of their scales). Thus we expected to violate the assumption of normal latent distributions when using polychoric correlations. Latent variables with nonnormal distributions bias polychoric correlations upward very slightly (bias < 2%) [25,26]. However, measuring continuous latent variables with a small number of ordered options (as many Likert-type scales do, including the RSS) introduces much greater downward bias in product-moment correlations estimated between the latent variables, even if they follow normal distributions [27,28,29]. Thus as an alternative to CFA estimation using covariance matrices, polychoric correlation matrices usually introduce less bias than they correct, which helps survey data meet assumptions of the popular maximum likelihood (ML) estimator.
Nonetheless, several authors [24,26,30,31,32,33,34,35] argue against ML estimation of common factor models based on polychoric correlations. ML estimation using polychoric correlations generates conservatively biased fit statistics and standard errors [36], and may result in more convergence errors and improper solutions [37]. Unweighted least squares estimation [38] with mean and variance adjustments (ULSMV) [39] seems marginally preferable to ML for polychoric covariances of ordinal data [40,41].1 If ULSMV estimation fails to converge, diagonally weighted least squares estimation (WLSMV) may produce a comparably robust alternative solution with only marginally more susceptibility to bias [42].
The original CFA of the RSS reported no convergence issues with ML estimation, but did not use all available data simultaneously [19], which may have circumvented any such problems that might have arisen in a more complex model. The measurement model’s fit statistics also suggested room for marginal improvements. Could this have resulted from the downward bias of ML estimation, a lack of polychoric correlations, or an ignored general factor? This study examined these possibilities.

1.1.3. Measurement Invariance

When comparing correlations across samples, using multi-group structural equation modeling (SEM) with invariant measurement models can help ensure that differences in correlations across samples do not result from biased measurement. Establishing that items load on the same factors (configural invariance) with the same strengths (metric invariance) across samples enables direct comparison of latent correlations by eliminating the possibility that certain items only relate to latent factors of interest in some samples, not all. For instance, if the Interpersonal struggle item, “Felt angry at organized religion”, related much more strongly to latent Interpersonal struggle in populations with specific R/S affiliations than in unaffiliated populations, this would cause latent correlations to reflect the influence of this particular item more strongly in the affiliated populations. Constraining loading estimates to equality across samples prevents the meanings of correlations from varying across samples, but worsens SEM fit statistics if the loadings vary greatly across samples [43].
Since sampling error causes loading estimates to vary across samples from even a single population, measurement invariance tests retain the null hypothesis of identical measurement across groups unless separate estimation of parameters in each group improves SEM fit statistics significantly. Cheung and Rensvold [44] recommend using a minimal improvement threshold with the comparative fit index, ∆CFI > 0.01, as an indication of significant variance in parameters being tested. This method can also test the invariance of items’ thresholds used in polychoric correlations (strong invariance), which enables unbiased comparisons of latent means to determine which populations tend to score lower or higher than others. Testing the invariance of items’ residual variances or uniquenesses (strict invariance) matters as well when using classical test theory assumptions to score a questionnaire by averaging or summing numerical responses, because this scoring method includes all common and unique item variance in its scale scores. Since Exline and colleagues [19] used this classical test theory scoring method, the exactness of their comparisons across samples depends on classical test theory’s assumptions of strict measurement invariance. Measurement invariance tests would help to address any concern that strict invariance does not hold; if it does, this will facilitate general comparisons of RSS data across diverse populations.

1.2. The Present Study

These improvements on conventional methods raise interesting questions within the basic CFA replication paradigm. The original CFA of the RSS measurement model [19] used ML estimation; will the model still fit well using ULSMV estimation from polychoric correlations in a larger sample? Will a bifactor structure improve the model’s fit? Will the items’ dual loadings favor a unidimensional or multidimensional model? Will bifactor models replicate across samples as accurately as the simpler, original measurement model?
The RSS provides an especially intriguing opportunity to investigate the psychological implications of a bifactor measurement model. As a newly explored set of psychological constructs, the RSS has yet to resolve its placement in the overlapping domains of distress and religiousness/spirituality. Thus far, the Demonic, Moral, and Ultimate Meaning subscales have exhibited stronger relationships with religiousness than the Divine, Interpersonal, and Doubt subscales, whereas relationships with depressive symptoms, anxiety, anger, and loneliness appear relatively consistent across all subscales [19]. The unidimensional or second-order models of the RSS produce a total score that correlates more strongly to these measures of mental health than to religiousness, unlike the Demonic and Moral subscales. All these correlations are positive, yet Ultimate Meaning struggle correlates negatively with religiousness.
How will forcing orthogonality among the group factors of the RSS in a bifactor model affect their correlations with measures of distress and religiousness? Will these measures relate more strongly to the general factor of the RSS than to its group factors? If so, this would imply that religiousness or distress relate to R/S struggle in general, not just some of its specific domains. If estimating a general factor reduces the group factors’ correlations with religiousness or distress by partialing out their common covariance, this would improve the group factors’ independence from these potential confounds.
Happily, these questions have arisen after we completed collection of data on all measures of interest in five large studies of subtly different populations, providing a wealth of information and no shortage of statistical power for these analyses. Hence, we adopt a coordinated or integrative data analytic strategy based on exploration and replication [45,46,47]. We only employ null hypothesis significance tests to arbitrate analytic decisions, rather than using them as the basis of psychological inferences, and we emphasize effect sizes throughout, following the lead of modern methodologists (e.g., [48]).

2. Method

2.1. Participants and Procedure

Survey protocols varied across samples and collection times (all during 2012–2015; Exline et al. [19] used data from Fall 2012 and Spring 2013 as their Study 2). We recruited participants in three of our five samples from undergraduate introductory psychology courses held at three universities in the USA. Undergraduates received partial course credit for participating online in a larger survey. Two of these universities are in the Great Lakes region of the Midwest; one is large and public (N = 1946 with some RSS data), the other midsized and private (N = 1019). The third is a private Christian university near the Pacific coast (N = 1102). The west coastal Christian undergraduates tended to participate earlier in their educations than the others, and the Midwestern private undergraduates tended to participate later (Table 1).

2.1.1. Amazon Mechanical Turk Samples

We recruited adult internet workers from the USA through Amazon Mechanical Turk (MTurk) for our two other studies’ samples. MTurk is a web platform and online marketplace that allows individuals to offer monetary compensation, processed via Amazon, to adult workers in exchange for completing tasks of various length, including surveys. Its worker population provides survey data of comparable or superior validity to undergraduate samples, and tends to represent a more diverse range of ages, locations, and of course, occupations and educational backgrounds [49,50,51,52,53,54,55,56,57]. MTurk workers over-represent nonreligious subpopulations [58], which, consistent with the goals of this project, allows for increased power to detect differences related to nonreligious participants in samples. MTurk has proven useful in a number of prior studies of religion-based constructs [19].
Participants for one MTurk survey responded to an advertisement on the MTurk database for a survey entitled “Two-Part Study of Personality, Beliefs, and Behavior” that offered $3.00 USD in MTurk credit for completing the survey. To ensure that participants provided adequate attention to the survey task, rather than answering at random or without regard to instructions and item content, we included several attention check items (e.g., in a longer measure, including an item that instructs participants to “Please select ‘disagree’” for that item). Participants who fail attention checks might not be providing meaningful, reliable data in response to other items. Thus, among 1397 consenting participants, we excluded 12% (n = 172) who failed an attention check, and an additional 25 who failed another attention check (3% of those who received it). Of the 1200 participants who satisfied our screening criteria, 1158 (97%) continued this survey past the RSS.
Participants in the other MTurk survey responded to an offer to earn $2.00 upon completion. As in the general MTurk sample, we used attention check items to ensure that participants provided adequate attention, and we excluded participants who failed attention checks. Among 2062 consenting adult participants, we excluded 6% (n = 124) who failed an attention check.
We then assessed belief in the existence of a god or gods using a forced-choice item modified from the General Social Survey. This second MTurk survey only invited complete responses from participants who expressed doubt or disbelief that any gods exist. Henceforth we refer to this as the nontheistic MTurk sample, and to the other as the general MTurk sample. To avoid self-selection bias, we titled this survey “Emotions, Beliefs, and Attitudes”, emphasizing its content rather than its intent as a study of nonbelief. The consent form specified that the survey would include questions related to religious/nonreligious matters, among other topics.
We excluded 60% (1139 of 1904 continuing participants) who expressed at least some belief in a god or gods (i.e., selected “I find myself believing in a god or gods at some of the time, but not at others,” “While I have doubts, I feel that I do believe in a god or gods,” or “I know that a god or gods really exist, and I have no doubts about it”). Among the remaining 765 participants, 19% endorsed, “I know that no god or gods exist, and I have no doubts about it,” 33% endorsed, “While it is possible that a god or gods exist, I do not believe in the existence of a god or gods,” 32% endorsed, “I don’t know whether there is a god or gods, and I don’t believe there is any way to find out,” and 17% endorsed, “I don’t know whether there is a god or gods, but it may be possible to find out.” Last, we excluded 25 more participants who failed another attention check (5% of those who received it). Of the 740 nontheistic participants who passed these attention checks, 638 (86%) continued the survey past the RSS. In both MTurk samples, as in the university samples, we only report other statistics regarding participants who provided at least some RSS data.

2.1.2. Demographics

Respondents in the MTurk samples tended to participate later in life and across a more even distribution of ages than the university samples’ undergraduates (Table 2). Majorities of all samples’ participants identified as women by birth, ethnically white, heterosexual, born in the USA, and raised to speak English (Table 2, Table 3 and Table 4). Majorities of the university samples reported no romantic relationship at the time of participation. The MTurk samples reported more evenly distributed relational statuses.
Religion distributions varied across samples. Large majorities affiliated with Christianity in the west coastal Christian and Midwestern public university samples (Table 4). The Midwestern private university and general MTurk samples represented Christian and unaffiliated students more evenly. In the nontheistic MTurk sample, 21% listed a religious affiliation, nonbelief in divine entities notwithstanding. Each non-Christian affiliation comprised less than 5% of each sample.

2.2. Measures

2.2.1. Religious and Spiritual Struggles (RSS) Scale [13]

The RSS measured the extent to which participants had experienced six dimensions of R/S struggle over their previous few months with 26 statements (four per dimension except Divine and Doubt, which have five items each) rated on a five-point Likert-type scale with the following options: not at all/does not apply, a little bit, somewhat, quite a bit, and a great deal.2 Divine struggle subsumes relational problems with God (e.g., “felt angry at God”), including perceptions and fears of abandonment and punishment. Demonic struggle subsumes supernatural evil interference (e.g., “felt attacked by the devil or evil spirits”) including temptation. Interpersonal struggle subsumes conflict with religious people and groups (e.g., “felt angry at organized religion”), including victimization and ostracism. Moral struggle subsumes personal ethical difficulties (e.g., “felt torn between what I wanted and what I knew was morally right”) and guilt. Ultimate meaning struggle subsumes doubts about personal and existential significance (e.g., “felt as though my life had no deeper meaning”). Doubt struggle subsumes distressing uncertainty about R/S beliefs (e.g., “felt confused about my religious/spiritual beliefs”).

2.2.2. Religiousness

Previous studies (e.g., [3,59,60]) have used the following measures of religiousness in research on attitudes toward God. They have demonstrated good internal reliability and convergent validity with other religious constructs.

Religious Belief Salience (RBS) [61]

Four statements (e.g., “My religious/spiritual beliefs lie behind my whole approach to life”) rated for agreement on a 12-point Likert-type scale measured the personal significance of participants’ religious beliefs. Verbal anchors only appeared above the options we ranked lowest (does not apply; I have no religious/spiritual beliefs), second lowest (strongly disagree), and highest (strongly agree) for ordinal quantitative analyses.

Religious Participation (RP) [9]

Participants rated their frequencies of eight behaviors (e.g., “prayed or meditated”, “thought about religious/spiritual issues”) in the previous week on a six-point Likert-type scale with the following options: not at all, once, a few times, on most days, daily, and more than once per day. We excluded the last two items pertaining to hearing from God from all analyses because only relatively recent participants received them.

2.2.3. Distress

Center for Epidemiologic Studies—Depression scale (CES-D) [62]

Participants rated their frequencies of eight depressive symptoms during the past week (e.g., “felt depressed”, “felt lonely”) on a four-point Likert-type scale with the following options: rarely or none of the time (less than 1 day); some or a little of the time (1–2 days); occasionally or a moderate amount of time (3–4 days); and most or all of the time (5–7 days). Two additional items rated on the same scale represented an absence of or reprieve from depression (“felt hopeful about the future” and “were happy”). This measure has been validated for many populations (e.g., [63,64]).

Generalized Anxiety Disorder Seven-Item Scale (GAD-7) [65]

Participants rated their frequencies of seven anxiety-related problems during the past two weeks (e.g., “trouble relaxing”, “becoming easily annoyed or irritable”) on a four-point Likert-type scale with the following options: not at all, several days, more than half the days, and nearly every day. A large German study validated this measure for the general population [66].

Perceived Stress Scale [67]

Participants rated their frequencies of seven stressful experiences during the past month (e.g., “felt nervous and ‘stressed’”, “been upset because of something that happened unexpectedly”) on a five-point Likert-type scale with the following options: never, almost never, sometimes, fairly often, and very often. Three additional items rated on the same scale represented a sense of control and ease (“felt that things were going your way”, “felt that you were on top of things”, and “been able to control the irritations in your life”), the theoretically opposite pole of the latent stress dimension. Recent research has validated this measure for undergraduates [68].

Big Five Inventory—Neuroticism Subscale [69]

Participants rated 44 statements about themselves for agreement on a five-point Likert scale ranging from strongly disagree to strongly agree. These statements measure the five most essential traits in personality theory [70]. We focused on neuroticism, the characteristic tendency to experience frequent or intense negative emotions, impulses, and thoughts. This construct shares heritable influences with anxiety [71]. Only eight items pertained to neuroticism (e.g., “I am depressed, blue”), three of which indicate low neuroticism or high emotional stability (e.g., “I am relaxed and handle stress well”), the theoretically opposite pole of the latent neuroticism dimension. This measure converges well with other neuroticism measures [72]. We only used data from the other 36 items to identify participants with excessively invariant response patterns.

3. Results

We conducted all analyses in R [73]. We report only standardized loadings and correlations instead of raw covariances.

3.1. Exclusion Criteria

Before conducting primary analyses, we excluded participants with insufficiently effortful responding (IER) patterns based on the number of identical responses each participant gave across all items of the RSS. We ignored the lowest response option, not at all/does not apply, since many people might legitimately experience no R/S struggles whatsoever. We found an absolute minimum of participants across all samples (n = 8 of N = 5863) chose the same option (excluding the lowest) 23 out of 26 possible times. We assumed this represented the most extreme degree of invariant responding that might occur legitimately. This threshold also resembles the highest empirically derived cutoff that identified IER with 99% specificity for a 300-item questionnaire (25) [74]. Thus we excluded 106 participants (1.8%) who gave the same response between 2 and 5 to at least 24 RSS for clear IER, but retained 842 participants (14.4%) who chose the lowest response option, not at all/does not apply, for at least 24 questions. Preferring to retain invalid responses rather than exclude valid responses, we implemented this screening technique (long string) [75] more permissively than Johnson [76], who used it to exclude 3.5% of another Web-based survey’s participants. Four of our samples would have set a lower threshold by our criterion: absolute minima within samples occurred first at 17 (n = 0), 17 (1), 19 (0), 21 (3), and 24 (0) identical responses.
We also excluded participants who failed an attention check embedded in the RSS. The participants of both MTurk studies and the 900 most recent participants from the university samples received an item with the RSS that instructed them to choose a specific response option. Of the 2697 participants without missing responses to this item, we excluded 68 (2.5%) who failed to comply. Of these 68, 15 also met the long string criterion for exclusion. Those failing the attention check also tended to give a higher number of identical responses to the RSS (median = 13) than those who passed (median = 5; Hedges’ g = 1.8; Kendall’s τ scaled to r = 0.20 [77]).
We used the forestplot package [78] to visualize comparisons of effect size estimates and confidence intervals across all samples and the total sample. In the overall sample with 95% confidence based on a negative binomial regression model [79], we would expect the mean number of identical responses to be between 2.0 and 2.8 times larger among people who fail this attention check (Figure 1a). Conversely, the odds of a participant failing the attention check increase by 19%–28% for every unit increase in the number of identical responses based on a logistic regression model with 95% confidence (Figure 1b) [80]. These relationships support the convergent validity of these criteria for identifying IER.
However, the general MTurk sample had fewer, rarer failures (n = 5 of 1158 or 0.4%) than the nontheistic MTurk sample and the private Midwestern university (ns = 21 of 638 or 3.4%, and 8 of 288 or 2.9%, respectively; Fisher’s exact test of independence p < 0.001). The latter pair of samples also had rarer failures than the west coastal Christian and public Midwestern universities (ns = 11 of 211 or 5.5%, and 23 of 401 or 6.1%, respectively; Fisher’s exact test of independence p = 0.128; for all five samples, Fisher’s exact test of independence p < 0.001). The relationship between attention check failure and number of identical responses also strengthened in the university samples (see Figure 1a,b; for interaction of attention and sample in negative binomial model, likelihood ratio χ²(4) = 13.7, p = 0.008). This suggests greater awareness of attention checking items among MTurk workers, and demonstrates the value of using both independent screening criteria to exclude a greater portion of invalid data.
The exclusion criteria jointly reduced the total sample size to N = 5705 (97.3%). They reduced the west coastal Christian university’s sample to n = 1069 (97.0%), the Midwestern public university’s sample to 1870 (96.1%), the Midwestern private university’s sample to 1006 (98.7%), the general MTurk sample to 1149 (99.2%), and the nontheistic MTurk sample to 611 (95.8%).

3.2. Exploratory Factor Analyses of the RSS

We began our reanalysis of the latent structure of the RSS by performing exploratory factor analyses of the items. These analyses provided a purely empirical basis for judging whether the items’ covariance structure would naturally support the original six-factor measurement model, and if this would change when extracting a general factor. Using the psych package [81], we estimated polychoric correlations for all pairs of RSS items separately in each of our five samples. We then performed exploratory factor analysis of each sample’s polychoric correlation matrix using minres (ordinary, unweighted least squares) estimation to extract six factors, which we rotated using the oblimin oblique criterion. These analyses produced good fit statistics for the west coastal Christian and Midwestern public university samples (Tucker–Lewis Indices (TLIs) = 0.96 and 0.97, root mean square errors of approximation (RMSEAs) = 0.05, df-corrected root mean square residuals (RMSRs) = 0.01–0.02), acceptable fit for the Midwestern private university and unscreened MTurk samples (TLIs = 0.92 and 0.94, RMSEAs = 0.08 and 0.07, RMSRs = 0.02), and very poor fit for the nontheistic MTurk sample (TLI = 0.20, RMSEA = 0.36, RMSRs = 0.04).
In this last case, symptoms of over-factoring manifested. Items belonging to the Divine and Demonic subscales loaded together on the first factor, with Demonic items loading more weakly (Demonic λ1 = 0.46–0.59; Divine λ1 = 0.66–0.90). Demonic items also loaded on the sixth factor (λ6 = 0.41–0.53), as did item 13 from the Interpersonal subscale (“felt angry at organized religion”), which loaded negatively (λ6 = −0.46; on the Interpersonal factor, λ3 = 0.79). This suggests nontheistic people may differentiate less between divine and demonic agents as targets for attributions of any R/S struggles they experience with respect to supernatural entities. Extracting only five factors offered little improvement in the fit statistics (TLI = 0.25, RMSEA = 0.35, df-corrected RMSR = 0.04), but produced a factor pattern with reasonably simple structure (all primary λs ≥ 0.63, all secondary λs ≤ 0.30), in which Divine and Demonic items shared the first factor.
As in Exline and colleagues [19], the first eigenvalue of the RSS items greatly exceeded the others in all samples. Its magnitude ranged from 12 to 14, exceeding the next largest by 8–11, or factors of 3–5. This predominant general factor and strong factor correlations (median = 0.41 across samples) imply a plausible bifactor structure [23].
Exploratory bifactor analyses using Schmid and Leiman’s [82] transformation of the initial six-factor solutions supported the presence of a general factor in all five samples. For loadings on the general factors across samples, median λgeneral = 0.59–0.70; all λgeneral > 0.32, except item 13 in the nontheistic MTurk sample (λgeneral = 0.19). Ratios of general factors’ eigenvalues to group factors’ largest eigenvalues = 3–5. Median percentages of general variance in each item = 46%–62%. These results suggest that the RSS items’ common covariance (i.e., excluding unique residual variances) split relatively evenly between the general factor and all group factors.

3.3. Confirmatory Factor Analyses of the RSS

We fit all structural equation models (SEMs) to polychoric correlations using ULSMV estimation in the lavaan package [83]. We note a few exceptions to these estimation methods below. All χ², CFI, and RMSEA fit statistics used variance-scaling and mean-adjusting corrections [39]. We calculated ω reliabilities for factors using the semTools package [84]. This formula, presented by Green and Yang [85] as ρ X X ¯ , does not assume equal loadings across any factor’s indicators, and it uses the observed (not model-implied) total covariance to estimate reliability conservatively.

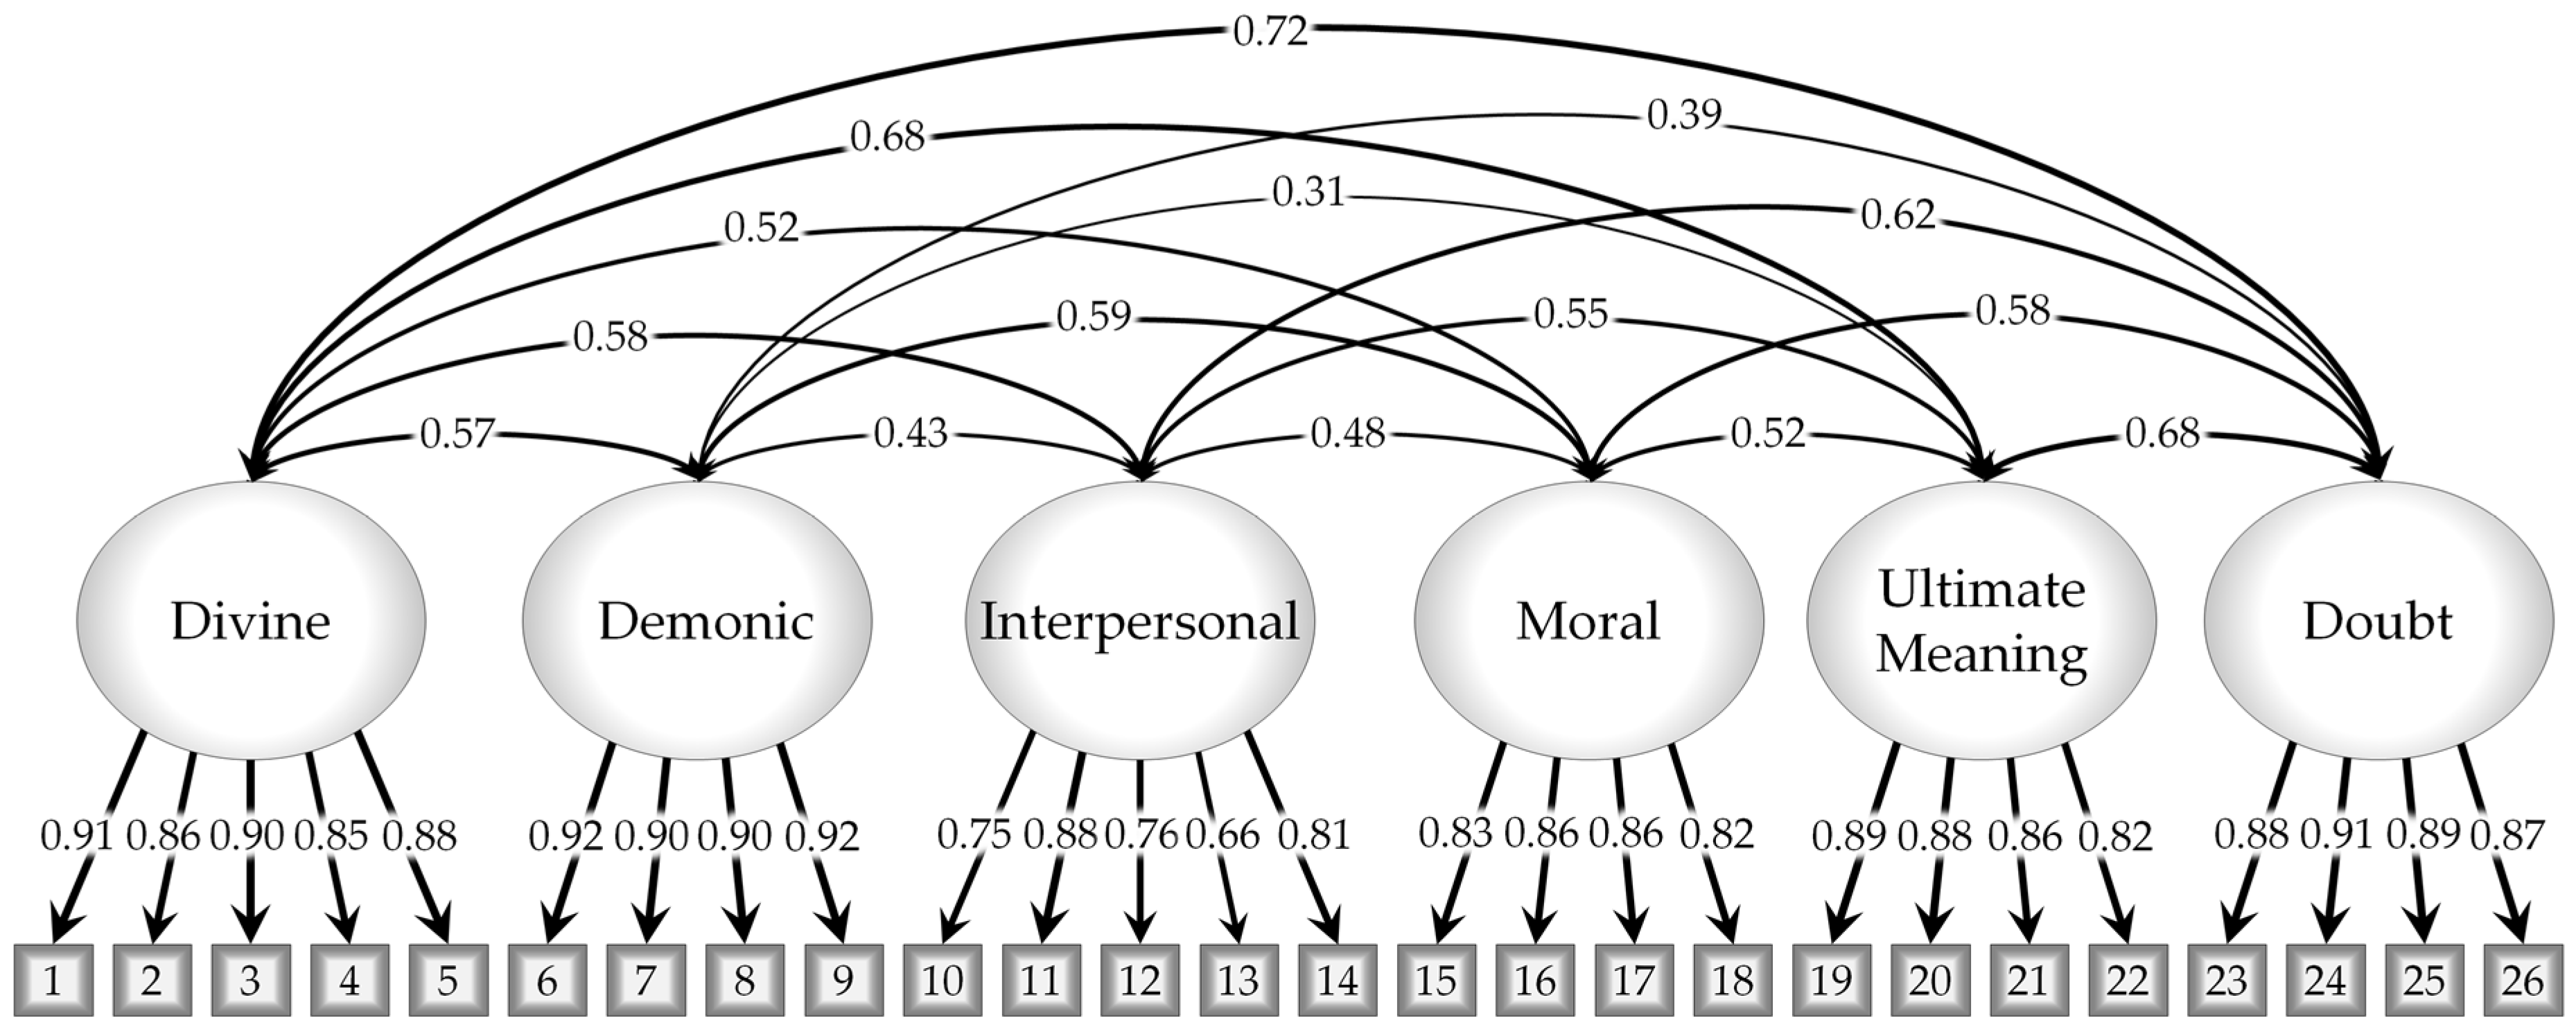
3.3.1. Original Measurement Model

We tested the original RSS measurement model [19] for measurement invariance across all five samples. Constraining the loadings, thresholds, residuals, and latent variances and covariances to have equal estimates across samples resulted in an optimal blend of model parsimony and replicability across samples and good fidelity to the empirical covariance structure (χ²(1,976) = 4790, CFI = 0.96, RMSEA = 0.04, weighted root mean square residual (WRMR) = 6.12; Figure 2). Estimating thresholds, residuals, and latent variances and covariances independently in each sample did not improve the model’s fit statistics enough to justify the loss of parsimony (metric vs. configural ΔCFI = 0.002, strict vs. metric ΔCFI = −0.006, constrained variances vs. metric ΔCFI = −0.005, covariances vs. metric ΔCFI = −0.007), but latent means differed significantly across samples (constrained means vs. strong invariance ΔCFI = −0.069; Table 5). Reliability also varied across samples and factors (Table 6).
Ultimately, fit statistics compared well with Exline and colleagues’ [19] original results for the RSS. Their use of ML estimation without polychoric correlations did not prevent an accurate, positive conclusion regarding the validity of the RSS. The strict invariance of the RSS across these populations indicates that calculating latent scores from averages of responses should not have introduced substantially unequal biases in their analyses of correlations with other variables.

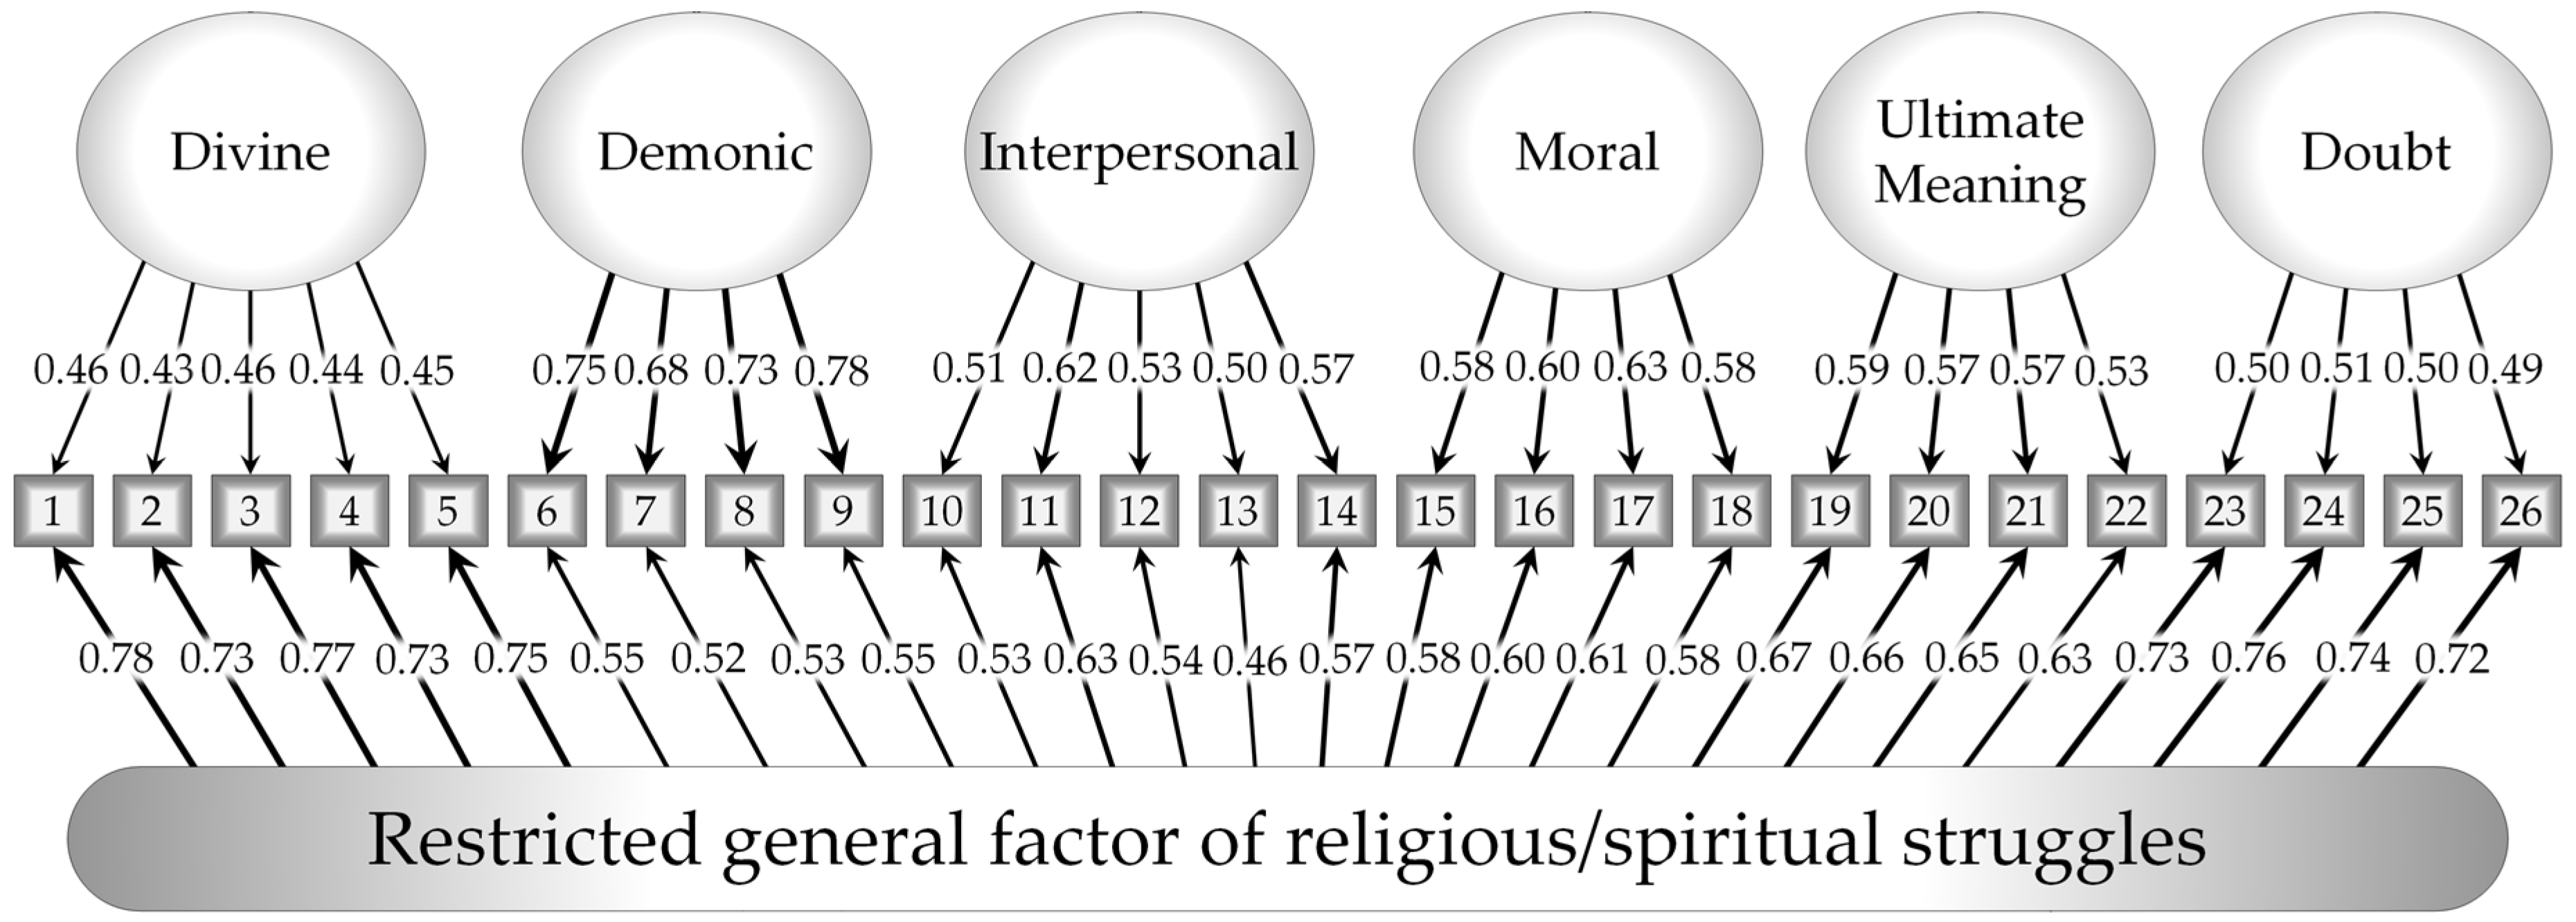
3.3.2. Restricted Bifactor Measurement Model

A restricted bifactor model of the RSS maintained good fit statistics with the same measurement invariance constraints (χ²(1,961) = 5277, CFI = 0.96, RMSEA = 0.04; WRMR = 6.55; Figure 3). Surprisingly, each invariance constraint improved model fit (metric vs. configural invariance ΔCFI = 0.0023, strict vs. metric ΔCFI = 0.007, constrained variances vs. metric ΔCFI = 0.023). All items loaded fairly strongly on both the general factor (λgeneral = 0.46–0.78) and their respective group factors (λs = 0.43–0.78). These loadings sufficed to estimate all factors well, which supports both the multidimensional and unidimensional frameworks for the RSS. Reliabilities differed from the original model by less than 0.03, and the general factor’s reliability also varied across samples (Table 6).
In most items, the general factor explained a slightly larger amount of covariance than the group factors. However, this model appeared to fit marginally worse than the original model due to the constrained group factor covariances. The general factor represented an explanation for these covariances, but did not allow any two factors to covary more with each other than with all other factors. For instance, by sharing one general factor, the relatively unique Demonic items (λgeneral = 0.52–0.55, λgroup = 0.68–0.78, all first-order factor rs = 0.31–0.59) may have attenuated loadings for relatively similar Divine and Doubt items (λgeneral = 0.72–0.78, λgroup = 0.43–0.51, factor r = 0.72). Therefore, next we tested a bifactor model with free covariances among group factors and an orthogonal general factor.

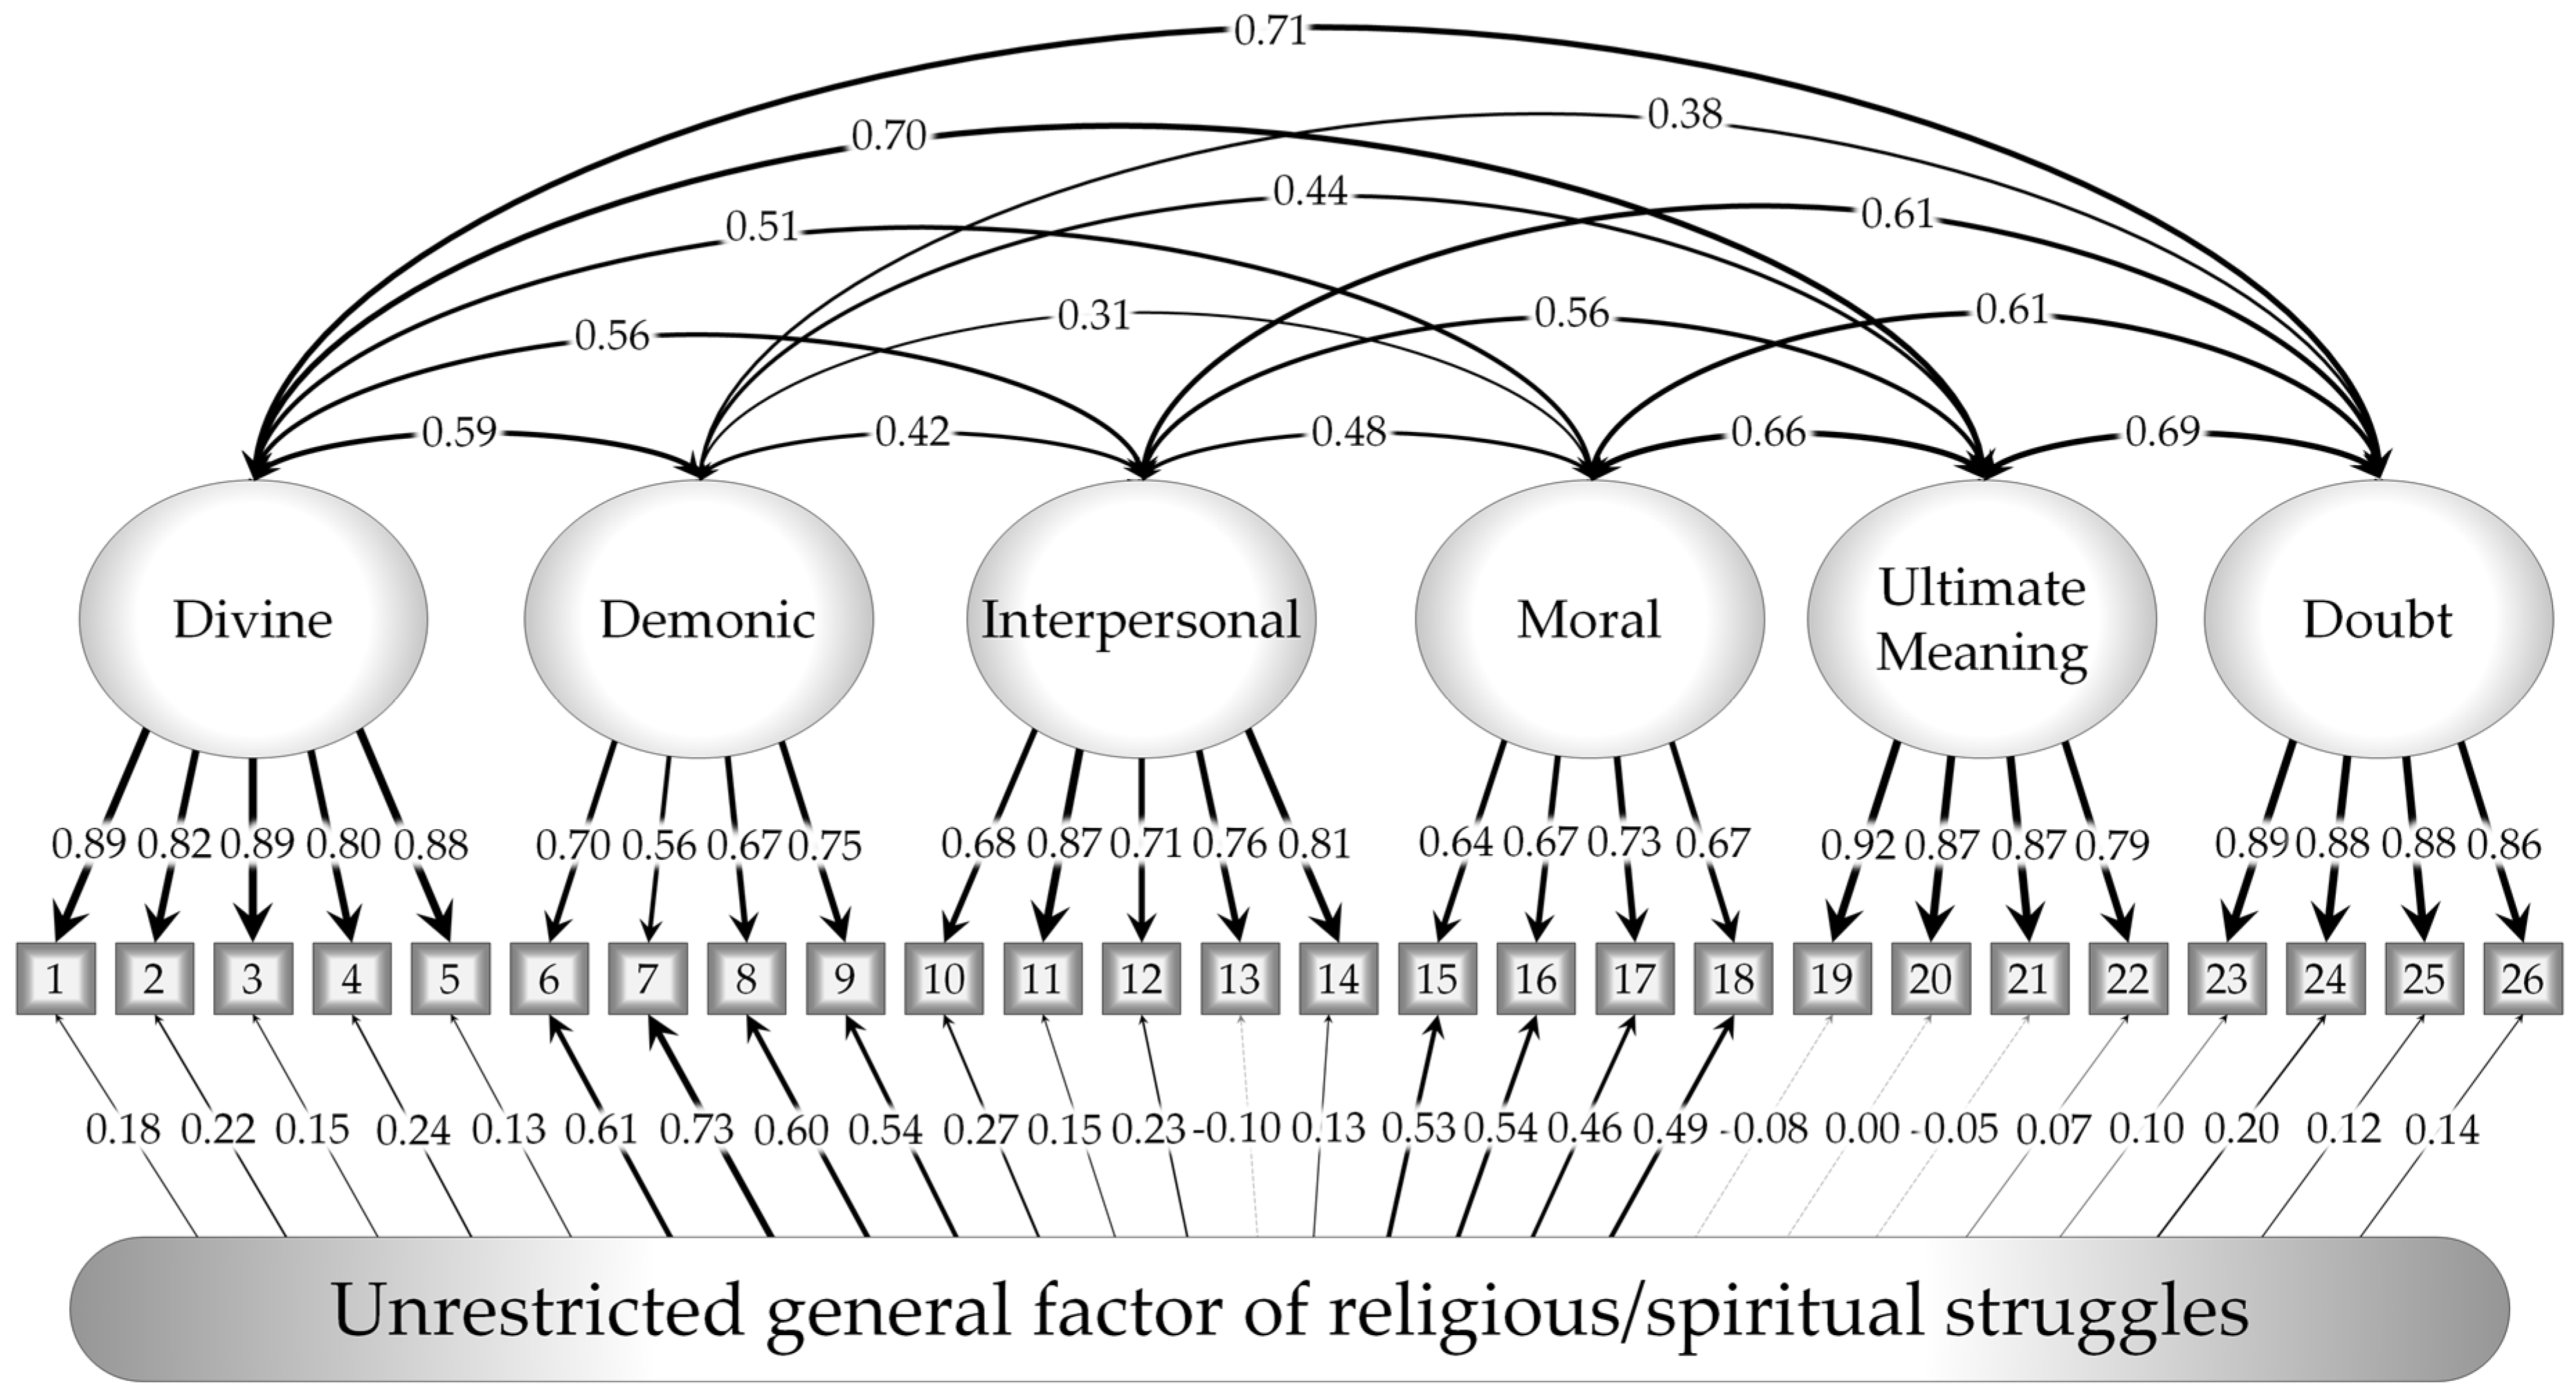
3.3.3. Unrestricted Bifactor Measurement Model

This model produced the best fit statistics of all RSS CFAs (χ²(1,946) = 4126, CFI = 0.97, RMSEA = 0.03, WRMR = 5.49; Figure 4). It continued to perform well in measurement invariance testing, achieving strict measurement invariance (metric vs. configural invariance ΔCFI = −0.002,4 strict vs. metric ΔCFI = −0.002) with invariant latent factor covariances and variances (constrained covariances vs. metric invariance ΔCFI = −0.006; variances vs. metric ΔCFI = −0.008). This model’s ω reliabilities did not differ from the other models’ values by more than 0.04.
Group factor correlations strongly resembled those from the original model without a general factor (|Δr| = 0.01–0.03), except for the correlations among Demonic, Moral, and Ultimate Meaning struggles. Correlations with Ultimate Meaning struggle increased for both Demonic (Δr = 0.13) and Moral struggles (Δr = 0.14). The Demonic-Moral correlation lost almost half its strength (Δr = 0.28), presumably because these factors’ common covariance transferred to the general factor. Loadings on the Moral and Demonic group factors also decreased (ΔλMoral = −0.13–−0.19; ΔλDemonic = −0.17–−0.34); others changed very little in either direction (Δλgroup = −0.10–0.07). This supports the comparability of this model’s group factor structure to the original structure, as do extremely high correlations between corresponding factors’ regression scores (rs = 0.980–0.999, except Demonic r = 0.723, and Moral r = 0.861). We believe the lower loadings and convergent factor score correlations for the Demonic and Moral factors resulted from the general factor absorbing relatively large portions of the covariance in these factors’ indicators.
Initially the unrestricted general factor did not facilitate a clear psychological interpretation. The general factor of the restricted bifactor model more clearly represented a common latent factor of R/S struggle constructed specifically to explain correlations among different kinds of R/S struggles and render their group factors independent. The general factor of the unrestricted bifactor model clearly did not have the same effect, because the strong group factor covariances from the original model remained mostly unaltered. Furthermore, items loaded much more weakly on this general factor than on the restricted model’s general factor. Only Demonic items loaded strongly on the general factor (λgeneral = 0.54–0.73), and Moral items loaded moderately (λgeneral = 0.46–0.54); all other items had weak or insignificant loadings (λgeneral = −0.10–0.27). To avoid building further results on sampling error and to maintain a focus on replication of theory-driven results, we chose not to trim insignificant loadings, but that option seems open to future replications. Regardless, this general factor related disproportionately to Demonic and Moral items, not unlike religiousness in Exline and colleagues’ initial study of the RSS [19].
Following these efforts to optimize the RSS measurement model, we returned to the question of whether a bifactor structure would alter the RSS group factors’ relationships with religiousness and distress. Incorporating these related constructs into the SEM would also create an opportunity to learn more about the psychologically ambiguous general factor. Hence we turn next to SEMs of the RSS, religiousness, and distress.

3.4. Structural Equation Models with Religiousness and Distress

3.4.1. Exclusion criteria, Measurement Invariance, and Latent Distributional Differences

Before including our measures of religiousness and distress, we screened their data in preparation for measurement invariance testing. Despite the aforementioned advantages of ULSMV estimation, using it in lavaan necessitated listwise deletion of incomplete response sets.5 We tested measurement invariance for each measure separately, but only used data from participants with complete responses on all measures used here so that results would better reflect the degree of measurement invariance attainable for the SEM that included all measures. Therefore, analyses in this section exclude the nontheistic MTurk sample entirely, because its participants did not receive the Perceived Stress Scale (PSS) [67] nor the religious belief salience measure (RBS) [61], and only 42 completed the religious participation (RP) measure [9].
Only the Big Five Inventory (BFI) [69] contained a sufficient number of items (some reverse-coded) to check for long strings of invariant responding. Of the original 5863 participants who responded to the RSS, an absolute minimum of three participants gave identical responses to 38 out of 44 BFI items. As with the RSS, we excluded 140 participants (2.4%) with more than 38 identical responses, though only 69 of these participants met all other criteria. Altogether, these criteria further reduced the west coastal Christian university’s sample size by 159 (n = 910), the Midwestern public university’s by 321 (1549), the Midwestern private university’s by 172 (834), and the general MTurk sample size by 136 (1013), resulting in a final sample of N = 4306 (75.5% of valid RSS data or 73.4% of the original sample).Unidimensional measurement model CFAs achieved good fit statistics for RBS, RP, and anxiety, but only acceptable fit for neuroticism, perceived stress, and depression (Table 7). Strict equality constraints improved fit for all factor models except depression, which achieved metric invariance. Latent variances did not vary significantly for depression (∆CFI = −0.001 vs. metric-invariant model), anxiety (∆ = −0.005 vs. strict model), and RBS (∆CFI = −0.001 vs. strict), but varied significantly across samples for other factors, as did latent means for all factors (Table 8). The strictly invariant model of depression fit significantly worse than the metric-invariant model; nonetheless, we used it to estimate latent mean differences with a minimum of avoidable bias while avoiding modifications.
The west coastal Christian university had much higher latent means for religiousness, as expected. Only this sample produced a particularly low reliability estimate for religious participation; all other reliabilities exceeded 0.73. The general MTurk sample did not show any signs of over-representing nonreligious populations, despite evidence of this in other studies [58]. However, the MTurk sample had slightly lower distress means, and more variance in all latent factors. We suspect that these differences may reflect the sample’s greater diversity of education, occupation, and (greater) age.

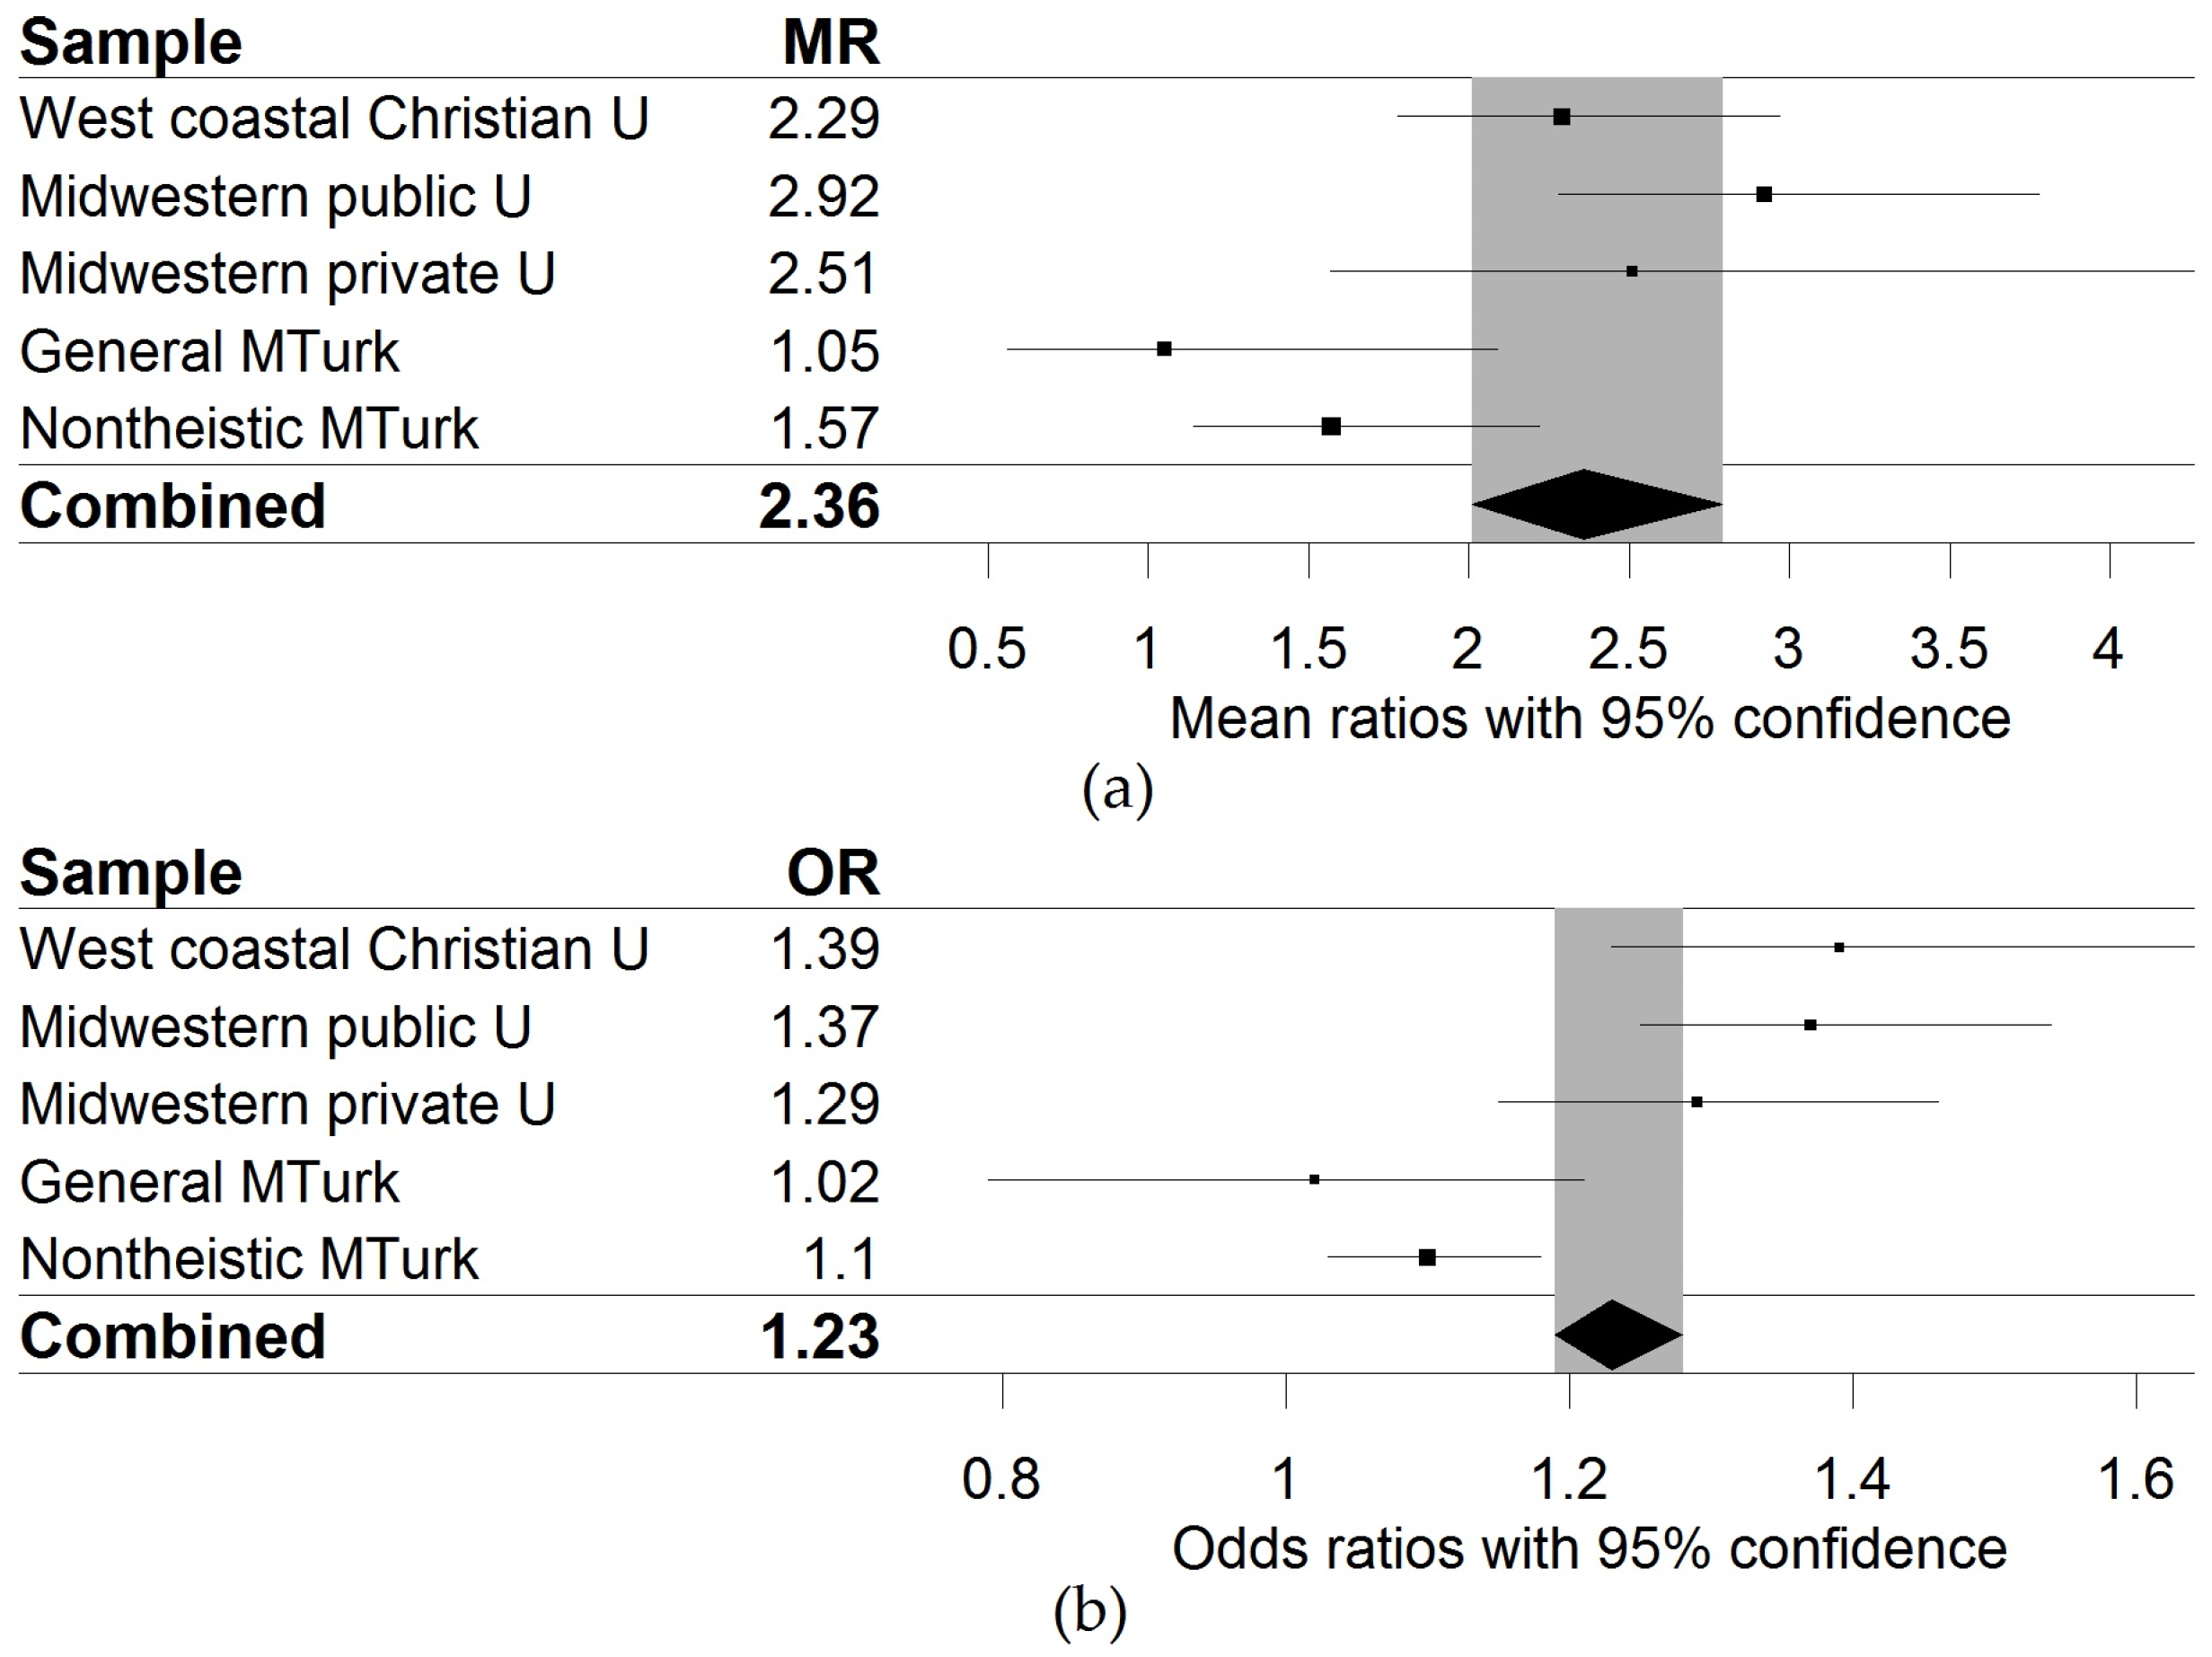
3.4.2. Latent Correlations

The following sections present results from large multi-group SEMs that analyzed the latent correlations among R/S struggles, religiousness, and distress. These correlations varied across samples. However, invariance tests ensured consistency of factor measurement across samples.
The first of these sections establishes a theoretical baseline for these latent correlations as estimated using the original measurement model of the RSS with only six correlated first-order factors and simple structure (i.e., one loading per item). Subsequent sections present and compare corresponding correlations derived from similar SEMs using a restricted (i.e., orthogonal group factors) bifactor measurement model for the RSS first, and then using an unrestricted bifactor measurement model with correlated group factors. These comparisons across four populations and three SEMs permitted thorough consideration of whether R/S struggles might relate strongly enough to religiousness or distress to threaten their discriminant validity if one models R/S struggles with either one or many dimensions.
Without establishing measurement invariance directly across these models, we can only assume that all latent factors correspond approximately across models. This seems defensible for all factors with unchanged measurement models, but the six psychological constructs originally represented by the RSS factors may not correspond so closely to the group factors in the bifactor measurement models, and the general factors surely must change when restricting versus freely estimating group factor correlations. We consider the effects of these changes across models on latent correlations, but avoid exact statistical comparisons in light of possible measurement variance transferring from deliberate changes in the RSS measurement model to indirect changes in other factors’ models.

Original RSS Measurement Model

We first estimated an SEM with the original measurement models for the RSS and all measures of religiousness and distress, allowing all latent factors to covary freely. This model fit adequately (χ²(10,436) = 23,974, CFI = 0.91, RMSEA = 0.04, WRMR = 4.20) and maintained strict measurement invariance across samples (strict vs. metric invariance ∆CFI = −0.007, metric vs. configural ∆CFI = 0.004).
Across the Midwestern public and private university and general MTurk samples, as in the original sample [19], strong positive relationships arose between the Demonic struggle factor and the religiousness factors (both RBS and RP; rs = 0.53–0.61; Table 9). Moderate relationships arose between the Moral struggle factor and religiousness (rs = 0.32–0.46). Other struggles exhibited weaker correlations with religiousness, all either positive or insignificantly negative (rs = −0.07–0.27), except Ultimate Meaning struggle (rs = −0.18–0.08).
The west coastal Christian university sample presented exceptions to each of the above. Here, the two religiousness factors related more negatively to all struggles. In this sample, RBS and RP only related positively to Demonic struggle, but much less than in the other samples (rs = 0.10 and 0.17, respectively), and insignificantly to Moral struggle (both rs = −0.05). Other struggles related negatively and moderately overall (rs = −0.19–−0.42), setting aside a more weakly negative correlation between Interpersonal struggle and RP (r = −0.09).
The RSS factors’ latent correlations with all distress factors emerged as uniformly positive and more stable across samples than with religiousness. Ultimate Meaning struggle generally related the most strongly to distress (rs = 0.41–0.64), followed by Divine struggle (rs = 0.33–0.56). Other struggles related more moderately (rs = 0.10–0.42), except Interpersonal struggle and depression in the west coastal Christian university sample (r = 0.52).

Restricted Bifactor RSS Measurement Model

Next, we estimated this SEM with the restricted bifactor measurement model substituted for the original RSS model. This yielded acceptable fit statistics (χ²(10,440) = 24,284, CFI = 0.91, RMSEA = 0.04, WRMR = 4.31), but also produced invalidly large correlations (|r| > 1) between religiousness factors and all R/S struggle factors. Using diagonally weighted least squares instead of unweighted least squares did not resolve this problem. Using maximum likelihood (ML) estimation on polychoric correlations produced non-convergence errors, as it tends to [36]. However, treating the data as continuous for the purpose of ML estimation allowed the model to converge with interpretable parameter estimates.
ML estimation produced a very poor CFI = 0.66 in spite of other fairly good fit statistics (χ²(9,570) = 16,510, RMSEA = 0.03, standardized root mean square residual (SRMR) = 0.06). We chose not to evaluate these fit statistics according to absolute thresholds for acceptability of fit, given evidence of downward bias in fit statistics when using maximum likelihood estimation on ordinal data from several simulation studies [24,26,30,31,32,33,34,35,36,37]. In light of other indications of adequate fit for the same model using ULSMV estimation or other RSS measurement models, as well as support from measurement model CFAs of each questionnaire considered separately, we assumed acceptable model specification, and only evaluated fit statistics relatively for this model across levels of invariance. It only achieved partial metric invariance (∆CFI < 0.01) after allowing loadings for two items to remain freely estimated.6 We report the following parameter estimates from this SEM, but urge caution in comparing them directly to other models’ estimates and in interpreting them as true population parameters. Relative to estimates produced with polychoric correlations and ULSMV estimation, ML estimates suffer more bias in the form of attenuated loadings and covariances.
The general factor of the RSS correlated inconsistently with the two religiousness factors across samples. It correlated most strongly and positively with RBS and RP in the Midwestern private university sample (rs = 0.32 and 0.51, respectively), more weakly in the Midwestern public university and general MTurk samples (rs = 0.10–0.22), and negatively in the west coastal Christian university sample (rs = −0.26 and −0.17). Religiousness correlations with the RSS group factors appeared more stable across samples, but shifted toward more negative values like the correlations in the west coastal Christian university sample with the original RSS measurement model. Correlations only remained moderately positive at most across samples for Demonic (rs = 0.18–0.36) and Moral struggles (rs = 0.02–0.26), but ranged from moderately negative to insignificant for other struggles (rs = −0.34–0.05).
As with the original RSS measurement model, the RSS group factors’ relationships with the distress factors varied less across samples, and all correlations remained positive or insignificant. Moderate correlations with distress factors manifested for the general RSS factor (rs = 0.25–0.40) and Ultimate Meaning struggle (rs = 0.21–0.54). Two moderate correlations also appeared in the west coastal Christian university sample between Divine struggle and perceived stress (r = 0.35) and between Interpersonal struggle and depression (r = 0.29). Overall, other R/S struggle factors correlated weakly or insignificantly with distress (rs = −0.07–0.25).

Unrestricted Bifactor RSS Measurement Model

Third, we estimated the SEM using the bifactor model of the RSS with correlated group factors and the conventional measurement models for RBS and RP, neuroticism, the PSS, anxiety, and the CES-D. This SEM achieved marginally better fit statistics than the SEM with the original RSS measurement model (χ²(10,380) = 22,534, CFI = 0.92, RMSEA = 0.03; WRMR = 3.98) and again maintained strict invariance acceptably (strict vs. metric invariance ∆CFI = −0.006).7
Loadings on the general factor of the RSS changed slightly from those estimated in CFA of its measurement model alone. Loadings strengthened for Moral struggle items (λgeneral = 0.49–0.61), the second Demonic item (about evil temptation; λgeneral = 0.82), and some Interpersonal (λgeneral = −0.12–0.38) and other Demonic items (λgeneral = 0.60–0.68). All other loadings weakened (λgeneral = −0.06–0.29).
The unrestricted general factor of the RSS correlated much more positively with factors of religiousness than in the restricted bifactor RSS SEM. However, these correlations remained inconsistent (with a similar pattern of inconsistency) across samples. RBS and RP correlated with the RSS’ general factor positively and most strongly in the Midwestern private and public university samples (rs = 0.67–0.74), followed by the general MTurk sample (rs = 0.50 and 0.53), with only moderately positive correlations in the west coastal Christian university sample (rs = 0.41 and 0.38).
As in the SEM using the original RSS measurement model, religiousness correlated more negatively to the RSS group factors in the west coastal Christian university sample (rs = −0.27–−0.01), especially RBS with Divine, Ultimate Meaning, and Doubt struggles (rs = −0.42–−0.39). Across the other three samples, weak or insignificant correlations had mixed valences (rs = −0.19–0.16), except for moderately positive correlations with Demonic struggle in the general MTurk sample (both rs = 0.34). Overall, this reduction in the correlations of religiousness with RSS group factors, particularly Demonic and Moral struggle, suggested that the general factor had absorbed much of the RSS factors’ positive covariance with religiousness, improving its already sufficient discriminant validity.
Correlations with distress changed very little relative to the SEM with the original RSS measurement model. As in this SEM, all RSS group factors’ correlations with all distress factors remained consistently positive. Again, Ultimate Meaning struggle correlated most (rs = 0.41–0.65), followed by Divine struggle (rs = 0.35–0.50). Other struggles also correlated with distress positively and moderately (rs = 0.20–0.43), with two exceptions. On the high end, Interpersonal struggle correlated strongly with depression in the west coastal Christian university sample (r = 0.53); on the low end, Demonic struggle correlated insignificantly with perceived stress in the Midwestern private university sample (r = 0.15). The general factor only correlated significantly with anxiety in the Midwestern private university sample (r = 0.19; all other rs = −0.11–0.16). These results establish fairly consistent, positive relationships with distress that vary among different kinds of R/S struggle.

4. Discussion

This study sought to update the measurement model for the Religious and Spiritual Struggles Scale (RSS) [19] and replicate it across five distinct samples, with special attention devoted to the effects of modern SEM methodology and bifactor structures on the RSS factors’ relationships with religiousness and distress. We wished to thoroughly test the latent structure of the RSS for stability and applicability across adult populations with varying degrees of religiousness, and to scrutinize its discriminant validity as a unique set of constructs.

4.1. Measurement Validation

Results seem very encouraging for the measurement characteristics of the RSS. Its fit statistics have improved with these methodological updates since Exline and colleagues’ [19] initial analyses using normal-theory maximum likelihood estimation. Model parameters remained mostly as described there, and cohered well to the intended structure of the measure.
Strict measurement invariance held across two regions of the USA, across one relatively religious sample and one relatively nonreligious sample, and across other demographic differences between university students and the MTurk community. Strict invariance exhibits the robustness of this measure against typical demographic variation within the USA. This result also absolves Exline and colleagues’ study of any confound between comparisons of correlations across samples and biasing due to calculating factor scores by averaging item response ranks. Exploratory factor analysis of the nontheistic MTurk sample raised interesting questions about structural discriminant validity within supernatural struggles (Divine and Demonic) among nonbelievers, but confirmatory factor analysis suggested that these questions can await other nontheistic samples without urgency.
The restricted bifactor model lent new support to the relatively untested unidimensional scoring approach for the RSS, while taking nothing away from the multidimensional approach that Exline and colleagues [19] supported more directly. Its mutually strong loading pairs and equivalently good fit statistics upheld the validity of all factors in question, both narrow and broad. Thus the nature of R/S struggles appears at once both complex and coherent, unified and diverse. Its multifaceted and potentially hierarchical nature bode well for research applications at all levels of depth and detail, whether assessing types of R/S struggle discretely or holistically. For modern research powered by SEM, the unrestricted bifactor model offers minor improvements on the already good fit of the original measurement model. It did not alter the internal structure of the original RSS factors substantially, though Demonic and Moral struggles seemed much more independent of each other and slightly more related to Ultimate Meaning struggle.

4.2. Religiousness, Distress, and Discriminant Validity

Further research seems warranted particularly for the unrestricted bifactor model with correlated group factors. Adding this general factor to the original model improved its fit statistics consistently and seemed to improve discriminant validity with religiousness overall. However, what kind of construct this general factor represents—whether mere method error or something more psychologically meaningful—remains debatable, as does the question of whether the group factors have changed in this model versus the original. Loadings and factor score correlations suggest they have not changed, but latent correlations with religiousness indicate some subtle changes. The general factor correlates very strongly with religiousness, especially among our Midwestern university populations. We did not expect correlations to differ across populations in the USA, but our evidence of several differences in correlations with religiousness also warrants further study.
The comparative stability of moderate correlations with distress speaks to the importance of addressing R/S struggles in the course of efforts to improve human experience in general, whether by reducing suffering or promoting growth. Implications here seem quite clear: R/S struggles often accompany negative emotions, but vary independently for the most part, and may play an important role in the course of coping with life’s challenges. This holds true regardless of how one measures distress or how one uses the RSS. Bifactor modeling did not show strong effects on the RSS group factors’ correlations with distress. Essentially no changes occurred with the unrestricted bifactor model. The restricted bifactor model may have transferred some positive covariance to its general factor, reducing correlations slightly between distress and the RSS group factors.
To some extent these results lend the restricted and unrestricted bifactor models of the RSS to slightly different applications. If discriminant validity with distress presents a special concern, the restricted bifactor model may help reduce correlations with the Ultimate Meaning and Divine struggle factors. If discriminant validity with religiousness matters more in a given application, the unrestricted bifactor model may improve the Demonic and Moral struggle factors’ independence.
No other factors gave cause for so much as mild concern about external discriminant validity throughout our analyses, except arguably the unrestricted general factor of the RSS, which correlated quite strongly with religiousness in the Midwestern university samples. Given weaker evidence of this correlation in the other samples and somewhat inconsistent performance with religiousness across populations, we cannot conclude that this general factor clearly represents a facet of religiousness itself. Nonetheless, we predict that the unrestricted bifactor model of the RSS would decrease group factor correlations with religiousness to varying degrees in new samples, as this pattern occurred consistently across all our samples.
If the RSS’ unrestricted general factor does not represent a novel construct, it improves the independence of its original constructs. Perhaps its relationship with religiousness implies a transition in the content of R/S struggles between levels of religious involvement and embeddedness. Demonic and Moral struggles seem more compatible with an ideological investment in Christian doctrinal orthodoxy than other R/S struggles, whereas Divine, Interpersonal, Ultimate Meaning, and Doubt struggles seem somewhat more controversial or unorthodox, though not rarer. If the unrestricted general factor represents a common contribution of religiousness to Demonic and Moral struggles, this might allow SEM to isolate these struggles’ more domain-specific variance, thus avoiding the need for separate measures of religiousness for statistical control.
Conversely, if the unrestricted general factor differs irreducibly from religiousness, it may represent a valuably distinct aspect of R/S experience. If this construct contributes to Demonic and Moral struggles independently of religiousness, further insights on its nature might aid prediction, explanation, or intervention as methods for these purposes continue to develop. Longitudinal research would enable a test of independent prediction over time and other tests of construct validity.
Cross-cultural research would more stringently test the measurement invariance of the RSS in general and the unrestricted general factor in particular. If the unrestricted general factor’s loadings depend heavily on these American cultural and largely Christian religious contexts, the latent factor might amount to little more than uninterpretable nuisance covariance. However, if its structure proves more robustly universal, this result would support its meaningfulness as a psychological entity. Intermediate results might suggest interesting possibilities as well. For instance, if Demonic item loadings vary across cultures according to their religious affiliations or spiritual beliefs, but Moral item loadings and the general factor’s correlation with religiousness remain consistent, this might imply that only Demonic struggle depends on varying religious beliefs across cultures. If the Demonic factor correlations also support this conclusion when using the original measurement model, but the unrestricted bifactor model continues to produce a more independent Demonic factor across cultures, then that latter factor might represent the more universal form of Demonic struggle that depends less on religious context. Analogous possibilities also exist for Moral struggles.

4.3. Methodological Observations

These results suggest that researchers should devote more careful consideration to the comparison of religiously mixed populations to populations with specific religious affiliations. Concerns about the heterogeneity of Internet worker populations seem comparatively minimal. Our close comparisons between university samples and MTurk samples (even one with selective sampling) reinforce the already well-established viability of MTurk populations for psychological research. The west coastal Christian university sample proved to be the least comparable sample—even less like the other university samples than the general MTurk sample. We cannot rule out other differences in the west coastal Christian sample as potential causes of differences in their results, but given much less evidence of differences in the general MTurk sample despite its very different distributions of age, education, and location, religion seems the most plausible cause of variance.
Some challenges arose concerning SEM estimator convergence and invalidly large latent correlations when employing bifactor models, especially in larger, multi-group SEMs. Our ability to circumvent these problems using different estimators, equality constraints across groups, and by avoiding the use of polychoric correlations in the restricted bifactor SEM, suggest the need for a better understanding of how these choices affect convergence rates. Bifactor models with polychoric correlations particularly seemed to increase the incidence of improper correlation estimates.
Using multi-group SEM to estimate latent correlations among many factors presents probably the largest burden of complexity and computational labor8 as compared to calculations of conventional correlations among scores that treat responses as continuous numerical data and average them. Results did not reveal any clear threats to the simpler scoring methods of classical test theory as applied to these measures; in fact, the strong, relatively even loadings and strict invariance of the simple structure SEM indicated ideal conditions for these methods. Nonetheless, validation via our more demanding methods should precede the use of more basic methods in general, and provided us maximally rigorous, exact tests and exceptionally strong evidence of replicability across populations. Moreover, though the restricted bifactor CFA effectively validated the use of a total score for all RSS items [23], a total score would not divide items’ covariance into group factor variance and general factor variance; it would conflate these two influences despite their theoretical independence. Only through SEM could we gain the insights described here regarding the different sets of correlations of the RSS’ group and general factors with religiousness and distress.

4.4. Limitations and Future Directions

Our multi-group SEMs ventured outside well-researched applications of measurement invariance testing. We do not know whether Cheung and Rensvold’s [44] guidelines for acceptable changes in fit statistics across levels of invariance apply in measurement invariance tests of such complex SEMs across four samples, especially using estimators for ordinal data and scaled fit statistics. Direct tests of partial invariance across different measurement models of the same factors would also help determine to what extent estimating an unrestricted general factor changes the identity of the group factors relative to a model without bifactor structure. These issues necessitate more advanced simulation studies and measurement invariance testing methods than we could find.
We deliberately limited the complexity of our latent factor measurement modeling strategies to test simple structures and basic bifactor structures for the RSS only. Future analyses should extend this multi-sample framework to explore modification indices and attempt to replicate any subtle improvements these might identify. For instance, the unrestricted bifactor model of the RSS suggests one could trim many insignificant loadings. Very strong latent correlations between the two religiousness factors and among the four distress factors would permit simpler representations of their external relationships via general factors. We considered bifactor structures for these measures as well, but we do not report them here.
Longitudinal research would help to address the remaining questions of whether these factors maintain stability over time or change together in the ways one would expect from their correlations. Longitudinal data might also offer limited gains in the capacity for causal inference, but only true experimentation could serve this need directly. Innovative, ethically sensitive manipulations of religiousness, R/S struggle, and distress could prove most valuable for resolving the ambiguity of causal directions involved in these relationships.
Behavioral data or observer reports from relationally close others could reduce our vulnerability to biases in self-reports such as acquiescence, self-enhancement, and extreme responding. These alternative measurement methods would enhance our basis for judging discriminant validity and the degree of relatedness among our constructs of interest. If collected in tandem with these self-report measures, they could further test measurement validity as well.
In light of global variations in culture and R/S experiences and beliefs, this research could greatly benefit from cross-cultural replication. Our conclusions depend entirely on a sample of predominantly white Christians from the USA. Others have noted that as a western, educated, industrialized, rich, and democratic population (WEIRD) [86], the USA may represent the global population poorly in many senses. Future work should consider both the context of different belief systems such as nontheistic, polytheistic, or animistic religions, and the influences of regional norms on expressions of religious beliefs and negative emotions. Furthermore, less socially or cognitively complex populations test the limits of discriminant validity for closely related constructs, which may lose their independence, as Saucier [87] demonstrated with personality structure across culture. Similarly, complexity of latent structure may increase with age. Preliminary results from analyses of retrospectively reported R/S struggles in childhood and adolescence support this hypothesis [88]. Therefore, future sampling efforts should also seek participants from younger and older age groups.
Other available opportunities for measurement invariance testing remain unexplored in our samples. Our MTurk samples included a wide range of ages, and all samples may have enough men to test invariance by gender. Ethnic and R/S subsamples have small enough sizes to threaten power for invariance tests across these groups, but some of our more thoroughly invariant samples may permit pooling across populations for certain purposes. Ongoing data collection efforts will also expand some of these samples over time. Future analyses should avoid pooling the west coastal Christian university’s data with other samples when testing relationships between the RSS factors and religiousness, given the uniquely more negative relationships we observed for this sample. Denominational differences among Christians may pose another untested explanation for the uniqueness of this sample’s correlations relative to the other largely Christian samples. Evidence of denominational differences in the relationships between religiousness and well-being [89] and between religious coping and adjustment to major surgery [90] also implies that relationships between the RSS factors and distress may vary across denominations. Preliminary evidence of other demographic differences in RSS factor scores suggests that other influences abound [91]. This line of research has many potential nuances left to consider.

5. Conclusions

The Religious and Spiritual Struggles Scale (RSS) [19] effectively measures its six varieties of R/S struggle as well as a more general factor of total R/S struggle. The RSS shows no signs of measurement bias across five demographically and religiously diverse populations in the USA, though the latent constructs it measures differ in distribution. R/S struggles vary mostly independently of religiousness and distress; these factors correlate with R/S struggles to unequal degrees, but never so strongly as to threaten their discriminant validity. An unrestricted bifactor model of the RSS shows mixed potential to reduce the original subscales’ correlations with religiousness and gain deeper insights on the nature of these relationships, which seem clearest with Demonic and Moral struggles. Ultimate Meaning and Divine struggles stand out as the strongest connections to distress. A restricted bifactor model may help to partition these relationships into weaker, struggle-specific relationships and a more general relationship with R/S struggle as an abstract gestalt.

Acknowledgments

We wish to express our gratitude to the John Templeton Foundation for funding this research (Grant #36094). We did not receive funds for covering the costs to publish in open access.

Author Contributions

Nick Stauner conceived and designed the analyses and wrote the manuscript. Julie J. Exline, Joshua B. Grubbs, Kenneth I. Pargament, David F. Bradley and Alex Uzdavines conceived and designed the surveys and directed data collection and management. Julie J. Exline, Joshua B. Grubbs and Kenneth I. Pargament contributed edits following the manuscript’s preparation, and David F. Bradley contributed during its revisions. Alex Uzdavines contributed methodological advice and support on measurement invariance testing.

Conflicts of Interest

The authors declare no conflict of interest. The founding sponsors had no role in the design of the study; in the collection, analyses, or interpretation of data; in the writing of the manuscript, and in the decision to publish the results.

Abbreviations

The following abbreviations are used in this manuscript:
BFIBig Five Inventory [69]
CES-DCenter for Epidemiological Studies—Depression scale [62]
CFAconfirmatory factor analysis
CFIcomparative fit index
CIconfidence interval
GMTgeneral MTurk
MLmaximum likelihood
MTurkAmazon Mechanical Turk
MWUMidwestern public university
MWRMidwestern private university
NMTnontheistic MTurk
PSSPerceived Stress Scale [67]
R/Sreligious and spiritual
RSSReligious and Spiritual Struggles Scale [19]
RBSreligious belief salience [61]
RPreligious participation [9]
RMSEAroot mean square error of approximation
RMSRdf-corrected root mean square residual
SEMstructural equation model
TLITucker–Lewis index
ULSMVunweighted least squares with mean and variance adjustments
WLSMVdiagonally weighted least squares with mean and variance adjustments
WRMRweighted root mean square residual
WCCwest coastal Christian university

References

  1. Julie J. Exline. “Religious and spiritual struggles.” In APA Handbook of Psychology, Religion, and Spirituality: Context, Theory, and Research. Edited by Kenneth I. Pargament, Julie J. Exline and James W. Jones. Washington: American Psychological Association, 2013, vol. 1, pp. 459–75. [Google Scholar]
  2. Kenneth I. Pargament, Nichole A. Murray-Swank, Gina M. Magyar, and Gene G. Ano. “Spiritual struggle: A phenomenon of interest to psychology and religion.” In Judeo-Christian Perspectives on Psychology. Edited by William R. Miller and Harold D. Delaney. Washington: American Psychological Association, 2005. [Google Scholar]
  3. Julie J. Exline, Crystal L. Park, Joshua M. Smyth, and Michael P. Carey. “Anger toward God: Social-cognitive predictors, prevalence, and links with adjustment to bereavement and cancer.” Journal of Personality and Social Psychology 100 (2011): 129–48. [Google Scholar] [CrossRef] [PubMed]
  4. Hisham Abu-Raiya, Kenneth I. Pargament, Neal Krause, and Gail Ironson. “Robust links between religious/spiritual struggles, psychological distress, and well-being in a national sample of American adults.” American Journal of Orthopsychiatry 85 (2015): 565–75. [Google Scholar] [CrossRef] [PubMed]
  5. Julie J. Exline, and Eric D. Rose. “Religious and spiritual struggles.” In Handbook of the Psychology of Religion and Spirituality, 2nd ed. Edited by Raymond F. Paloutzian and Crystal L. Park. New York: Guilford, 2013, pp. 380–98. [Google Scholar]
  6. Aaron Murray-Swank, and Nichole A. Murray-Swank. “Spiritual and religious problems: Integrating theory and clinical practice.” In APA Handbook of Psychology, Religion, and Spirituality: An Applied Psychology of Religion and Spirituality. Edited by Kenneth I. Pargament, Annette Mahoney and Edward P. Shafranske. Washington: American Psychological Association, 2013, vol. 2, pp. 421–37. [Google Scholar]
  7. Kenneth I. Pargament. Spiritually Integrated Psychotherapy: Understanding and Addressing the Sacred. New York: Guilford, 2007. [Google Scholar]
  8. Nick Stauner, Julie J. Exline, and Kenneth I. Pargament. “Religious and spiritual struggles as concerns for health and well-being.” Horizonte 14 (2016): 48–75. [Google Scholar] [CrossRef]
  9. Julie J. Exline, Ann M. Yali, and William C. Sanderson. “Guilt, discord, and alienation: The role of religious strain in depression and suicidality.” Journal of Clinical Psychology 56 (2000): 1481–96. [Google Scholar] [CrossRef]
  10. Crystal L. Park. “Religion and meaning.” In Handbook of the Psychology of Religion and Spirituality. Edited by Raymond F. Paloutzian and Crystal L. Park. New York: Guilford, 2013. [Google Scholar]
  11. Kenneth I. Pargament. The Psychology of Religion and Coping: Theory, Practice, and Research. New York: Guilford, 1997. [Google Scholar]
  12. J. Irene Harris, Christopher R. Erbes, Brian E. Engdahl, Henry Ogden, Raymond H. A. Olson, Ann Marie M. Winskowski, Kelsey Campion, and Saari Mataas. “Religious distress and coping with stressful life events: A longitudinal study.” Journal of Clinical Psychology 68 (2012): 1276–86. [Google Scholar] [CrossRef] [PubMed]
  13. Kenneth I. Pargament, Harold G. Koenig, Nalini Tarakeshwar, and June Hahn. “Religious struggle as a predictor of mortality among medically ill elderly patients: A two-year longitudinal study.” Archives of Internal Medicine 161 (2001): 1881–85. [Google Scholar] [CrossRef] [PubMed]
  14. Steven Pirutinsky, David H. Rosmarin, Kenneth I. Pargament, and Elizabeth Midlarsky. “Does negative religious coping accompany, precede, or follow depression among Orthodox Jews? ” Journal of Affective Disorders 132 (2011): 401–5. [Google Scholar] [CrossRef] [PubMed]
  15. Kelly M. Trevino, Michael J. Balboni, Angelika A. Zollfrank, Tracy A. Balboni, and Holly G. Prigerson. “Negative religious coping as a correlate of suicidal ideation in patients with advanced cancer.” Psychooncology 23 (2014): 936–45. [Google Scholar] [CrossRef] [PubMed]
  16. Hisham Abu-Raiya, and Kenneth I. Pargament. “Religious coping among diverse religions: Commonalities and divergences.” Psychology of Religion and Spirituality 7 (2015): 24–33. [Google Scholar] [CrossRef]
  17. Kenneth I. Pargament, Kavita M. Desai, and Kelly M. McConnell. “Spirituality: A pathways to posttraumatic growth or decline? ” In Handbook of Posttraumatic Growth: Research and Practice. Edited by Lawrence G. Calhoun and Richard G. Tedeschi. Mahwah: Lawrence Erlbaum, 2006, pp. 121–37. [Google Scholar]
  18. Tracey E. Robert, and Virginia A. Kelly, eds. Critical Incidents in Integrating Spirituality into Counseling. Alexandria: American Counseling Association, 2014.
  19. Julie J. Exline, Kenneth I. Pargament, Joshua B. Grubbs, and Ann M. Yali. “The Religious and Spiritual Struggles scale: Development and initial validation.” Psychology of Religion and Spirituality 6 (2014): 208–22. [Google Scholar] [CrossRef]
  20. Christopher G. Ellison, and Jinwoo Lee. “Spiritual struggles and psychological distress: Is there a dark side of religion? ” Social Indicators Research 98 (2010): 501–17. [Google Scholar] [CrossRef]
  21. George Fitchett, Patricia E. Murphy, Jo Kim, James L. Gibbons, Jacqueline R. Cameron, and Judy A. Davis. “Religious struggle: Prevalence, correlates and mental health risks in diabetic, congestive heart failure, and oncology patients.” International Journal of Psychiatry in Medicine 34 (2004): 179–96. [Google Scholar] [CrossRef] [PubMed]
  22. Kelly M. McConnell, Kenneth I. Pargament, Christopher G. Ellison, and Kevin J. Flannelly. “Examining the links between spiritual struggles and symptoms of psychopathology in a national sample.” Journal of Clinical Psychology 62 (2006): 1469–84. [Google Scholar] [CrossRef] [PubMed]
  23. Steven P. Reise, Tyler M. Moore, and Mark G. Haviland. “Bifactor models and rotations: Exploring the extent to which multidimensional data yield univocal scale scores.” Journal of Personality Assessment 92 (2010): 544–59. [Google Scholar] [CrossRef] [PubMed]
  24. Francisco P. Holgado Tello, Salvador Chacón Moscoso, Isabel Barbero García, and Enrique Vila Abad. “Polychoric versus Pearson correlations in exploratory and confirmatory factor analysis of ordinal variables.” Quality and Quantity, the International Journal of Methodology 44 (2010): 153–66. [Google Scholar] [CrossRef]
  25. Ana M. Quiroga. “Studies of the polychoric correlation and other correlation measures for ordinal variables.” Ph.D. Thesis, Uppsala University, Uppsala, Sweden, 1992. [Google Scholar]
  26. David B. Flora, and Patrick J. Curran. “An empirical evaluation of alternative methods of estimation for confirmatory factor analysis with ordinal data.” Psychological Methods 9 (2004): 466–91. [Google Scholar] [CrossRef] [PubMed]
  27. Kenneth A. Bollen, and Kenney H. Barb. “Pearson’s r and coarsely categorized measures.” American Sociological Review 46 (1981): 232–39. [Google Scholar] [CrossRef]
  28. Maxine S. Stern. “The Effect of Grouping on the Correlation Coefficient.” In Paper presented at the Annual Meeting of the American Sociological Association, Denver, CO, USA, 1971.
  29. Peter B. Wylie. “Effects of coarse grouping and skewed marginal distributions on the Pearson product moment correlation coefficient.” Educational and Psychological Measurement 36 (1976): 1–7. [Google Scholar] [CrossRef]
  30. Emin Babakus, Carl E. Ferguson Jr., and Karl G. Jöreskog. “The sensitivity of confirmatory maximum likelihood factor analysis to violations of measurement scale and distributional assumptions.” Journal of Marketing Research 24 (1987): 222–28. [Google Scholar] [CrossRef]
  31. Conor V. Dolan. “Factor analysis of variables with 2, 3, 5 and 7 response categories: A comparison of categorical variable estimators using simulated data.” British Journal of Mathematical and Statistical Psychology 47 (1994): 309–26. [Google Scholar] [CrossRef]
  32. Edward E. Rigdon, and Carl E. Ferguson Jr. “The performance of the polychoric correlation coefficient and selected fitting functions in confirmatory factor analysis with ordinal data.” Journal of Marketing Research 28 (1991): 491–97. [Google Scholar] [CrossRef]
  33. Diana Mîndrilă. “Maximum likelihood (ML) and diagonally weighted least squares (DWLS) estimation procedures: A comparison of estimation bias with ordinal and multivariate non-normal data.” International Journal of Digital Society 1 (2010): 60–66. [Google Scholar] [CrossRef]
  34. Wei C. Wang, and Everarda G. Cunningham. “Comparison of alternative estimation methods in confirmatory factor analyses of the general health questionnaire.” Psychological Reports 97 (2005): 3–10. [Google Scholar] [CrossRef] [PubMed]
  35. Andre Beauducel, and Philipp Y. Herzberg. “On the performance of maximum likelihood versus means and variance adjusted weighted least squares estimation in CFA.” Structural Equation Modeling: A Multidisciplinary Journal 13 (2006): 186–203. [Google Scholar] [CrossRef]
  36. Nick Stauner. “Estimators for Structural Equation Modeling of Nonnormal Likert Scale Data.” Poster presented at the Convention of the American Psychological Association, Toronto, ON, Canada, August 2015; Available online: http://www.slideshare.net/NickStauner/estimators-for-structural-equation-models-of-likert-scale-data-57210233 (accessed on 2 June 2016).
  37. Pui-Wa Lei. “Evaluating estimation methods for ordinal data in structural equation modeling.” Quality and Quantity 43 (2009): 495–507. [Google Scholar] [CrossRef]
  38. Bengt Muthén. “A general structural equation model with dichotomous, ordered categorical and continuous latent variable indicators.” Psychometrika 49 (1984): 115–32. [Google Scholar] [CrossRef]
  39. Albert Satorra, and Peter M. Bentler. “Corrections to test statistics and standard errors in covariance structure analysis.” In Latent Variables Analysis: Applications for Development Research. Edited by Alexander von Eye and Clifford C. Clogg. Thousand Oaks: Sage Publications, 1994. [Google Scholar]
  40. Mijke Rhemtulla, Patricia É. Brosseau-Liard, and Victoria Savalei. “When can categorical variables be treated as continuous? A comparison of robust continuous and categorical SEM estimation methods under suboptimal conditions.” Psychological Methods 17 (2012): 354–73. [Google Scholar] [CrossRef] [PubMed]
  41. Fan Yang-Wallentin, Karl G. Jöreskog, and Hao Luo. “Confirmatory factor analysis of ordinal variables with misspecified models.” Structural Equation Modeling: A Multidisciplinary Journal 17 (2010): 392–423. [Google Scholar] [CrossRef]
  42. Carlos G. Forero, Alberto Maydeu-Olivares, and David Gallardo-Pujol. “Factor analysis with ordinal indicators: A Monte Carlo study comparing DWLS and ULS estimation.” Structural Equation Modeling: A Multidisciplinary Journal 16 (2009): 625–41. [Google Scholar] [CrossRef]
  43. Robert J. Vandenberg, and Charles E. Lance. “A review and synthesis of the measurement invariance literature: Suggestions, practices, and recommendations for organizational research.” Organizational Research Methods 3 (2000): 4–70. [Google Scholar] [CrossRef]
  44. Gordon W. Cheung, and Roger B. Rensvold. “Evaluating goodness-of-fit indexes for testing measurement invariance.” Structural Equation Modeling: A Multidisciplinary Journal 9 (2002): 233–55. [Google Scholar] [CrossRef]
  45. Daniel K. Mroczek, Eileen K. Graham, Joshua P. Rutsohn, Nicholas A. Turiano, Emily Bastarache, Lorien G. Elleman, and 13 study representatives from the IALSA Network. “Using Multi-Study Coordinated Analysis to Enhance Replicability: An Example Using Personality, Smoking, and Mortality Risk with 12 Longitudinal Data Sets.” In Paper presented at the 4th Biannual Conference of the Association for Research in Personality, St. Louis, MO, USA, 11–13 June 2015.
  46. Patrick J. Curran, and Andrea M. Hussong. “Integrative data analysis: The simultaneous analysis of multiple data sets.” Psychological Methods 14 (2009): 81–100. [Google Scholar] [CrossRef] [PubMed]
  47. Scott M. Hofer, and Andrea M. Piccinin. “Integrative data analysis through coordination of measurement and analysis protocol across independent longitudinal studies.” Psychological Methods 14 (2009): 150–64. [Google Scholar] [CrossRef] [PubMed]
  48. Geoff Cumming. “The new statistics: Why and how.” Psychological Science 25 (2014): 7–29. [Google Scholar] [CrossRef] [PubMed]
  49. Michael Buhrmester, Tracy Kwang, and Samuel D. Gosling. “Amazon’s Mechanical Turk: A new source of inexpensive, yet high-quality, data? ” Perspectives on Psychological Science 6 (2011): 3–6. [Google Scholar] [CrossRef] [PubMed]
  50. Samuel D. Gosling, Simine Vazire, Sanjay Srivastava, and Oliver P. John. “Should we trust web-based studies? A comparative analysis of six preconceptions about internet questionnaires.” American Psychologist 59 (2004): 93–104. [Google Scholar] [CrossRef] [PubMed]
  51. Winter Mason, and Siddharth Suri. “Conducting behavioral research on Amazon’s Mechanical Turk.” Behavior Research Methods 44 (2012): 1–23. [Google Scholar] [CrossRef] [PubMed]
  52. Linda J. Skitka, and Edward G. Sargis. “The Internet as psychological laboratory.” Annual Review of Psychology 57 (2006): 529–55. [Google Scholar] [CrossRef] [PubMed]
  53. Danielle N. Shapiro, Jesse Chandler, and Pam A. Mueller. “Using Mechanical Turk to study clinical populations.” Clinical Psychological Science 1 (2013): 213–20. [Google Scholar] [CrossRef]
  54. Joseph K. Goodman, Cynthia E. Cryder, and Amar Cheema. “Data collection in a flat world: The strengths and weaknesses of Mechanical Turk samples.” Journal of Behavioral Decision Making 26 (2013): 213–24. [Google Scholar] [CrossRef]
  55. Gabriele Paolacci, and Jesse Chandler. “Inside the Turk: Understanding Mechanical Turk as a participant pool.” Current Directions in Psychological Science 23 (2014): 184–88. [Google Scholar] [CrossRef]
  56. Gabriele Paolacci, Jesse Chandler, and Panagiotis G. Ipeirotis. “Running experiments on Amazon Mechanical Turk.” Judgment and Decision Making 5 (2010): 411–19. [Google Scholar]
  57. Jon Sprouse. “A validation of Amazon Mechanical Turk for the collection of acceptability judgments in linguistic theory.” Behavior Research Methods 43 (2011): 155–67. [Google Scholar] [CrossRef] [PubMed]
  58. Andrew R. Lewis, Paul A. Djupe, Stephen T. Mockabee, and Joshua Su-Ya Wu. “The (Non) Religion of Mechanical Turk Workers.” Journal for the Scientific Study of Religion 54 (2015): 419–28. [Google Scholar] [CrossRef]
  59. Benjamin T. Wood, Everett L. Worthington Jr., Julie J. Exline, Ann M. Yali, Jamie D. Aten, and Mark R. McMinn. “Development, refinement, and psychometric properties of the Attitudes Toward God Scale (ATGS-9).” Psychology of Religion and Spirituality 2 (2010): 148–67. [Google Scholar] [CrossRef]
  60. Julie J. Exline, Kenneth I. Pargament, Todd W. Hall, and Valencia A. Harriott. “Predictors of growth from spiritual struggle among Christian undergraduates: Religious coping and perceptions of helpful action by God are both important.” Journal of Positive Psychology. (forthcoming).
  61. Bruce E. Blaine, and Jennifer Crocker. “Religiousness, race, and psychological well-being: Exploring social psychological moderators.” Personality and Social Psychology Bulletin 21 (1995): 1031–41. [Google Scholar] [CrossRef]
  62. Elena M. Andresen, Judith A. Malmgren, William B. Carter, and Donald L. Patrick. “Screening for depression in well older adults: Evaluation of a short form of the CES-D.” American Journal of Preventive Medicine 10 (1994): 77–84. [Google Scholar] [PubMed]
  63. Michael Irwin, Kamal H. Artin, and Michael N. Oxman. “Screening for depression in the older adult: Criterion validity of the 10-item Center for Epidemiological Studies Depression Scale (CES-D).” Archives of Internal Medicine 159 (1999): 1701–4. [Google Scholar] [CrossRef] [PubMed]
  64. Wendy Zhang, Nadia O’Brien, Jamie I. Forrest, Kate A. Salters, Thomas L. Patterson, Julio S. G. Montaner, Robert S. Hogg, and Viviane D. Lima. “Validating a shortened depression scale (10 item CES-D) among HIV-positive people in British Columbia, Canada.” PLoS ONE 7 (2012): e40793. [Google Scholar] [CrossRef] [PubMed]
  65. Robert L. Spitzer, Kurt Kroenke, Janet B. W. Williams, and Bernd Löwe. “A brief measure for assessing generalized anxiety disorder: The GAD-7.” Archives of Internal Medicine 166 (2006): 1092–97. [Google Scholar] [CrossRef] [PubMed]
  66. Bernd Löwe, Oliver Decker, Stefanie Müller, Elmar Brähler, Dieter Schellberg, Wolfgang Herzog, and Philipp Y. Herzberg. “Validation and standardization of the Generalized Anxiety Disorder Screener (GAD-7) in the general population.” Medical Care 46 (2008): 266–74. [Google Scholar] [CrossRef] [PubMed]
  67. Sheldon Cohen, Tom Kamarck, and Robin Mermelstein. “A global measure of perceived stress.” Journal of Health and Social Behavior 24 (1983): 386–96. [Google Scholar] [CrossRef]
  68. Jonathan W. Roberti, Lisa N. Harrington, and Eric A. Storch. “Further psychometric support for the 10-item version of the perceived stress scale.” Journal of College Counseling 9 (2006): 135–47. [Google Scholar] [CrossRef]
  69. Oliver P. John, Eileen M. Donahue, and Robert L. Kentle. The Big Five Inventory: Versions 4a and 54. Berkeley: Institute of Personality and Social Research, University of California, 1991. [Google Scholar]
  70. Robert R. McCrae, and Paul T. Costa Jr. “A five-factor theory of personality.” In Handbook of Personality: Theory and Research, 2nd ed. Edited by Lawrence A. Pervin and Oliver P. John. New York: Guilford Press, 1999. [Google Scholar]
  71. John M. Hettema, Carol A. Prescott, and Kenneth S. Kendler. “Genetic and environmental sources of covariation between generalized anxiety disorder and neuroticism.” American Journal of Psychiatry 161 (2004): 1581–87. [Google Scholar] [CrossRef] [PubMed]
  72. Christopher J. Soto, and Oliver P. John. “Ten facet scales for the Big Five Inventory: Convergence with NEO PI-R facets, self-peer agreement, and discriminant validity.” Journal of Research in Personality 43 (2009): 84–90. [Google Scholar] [CrossRef]
  73. R. Core Team. “R: A Language and Environment for Statistical Computing.” R Foundation for Statistical Computing. 2015. Available online: http://www.R-project.org/ (accessed on 2 June 2016).
  74. Jason L. Huang, Paul G. Curran, Jessica Keeney, Elizabeth M. Poposki, and Richard P. DeShon. “Detecting and deterring insufficient effort responding to surveys.” Journal of Business and Psychology 27 (2012): 99–114. [Google Scholar] [CrossRef]
  75. Justin A. DeSimone, Peter D. Harms, and Alice J. DeSimone. “Best practice recommendations for data screening.” Journal of Organizational Behavior 36 (2015): 171–81. [Google Scholar] [CrossRef]
  76. John A. Johnson. “Ascertaining the validity of individual protocols from web-based personality inventories.” Journal of Research in Personality 39 (2005): 103–29. [Google Scholar] [CrossRef]
  77. Andrew R. Gilpin. “Table for conversion of Kendall’s Tau to Spearman’s Rho within the context measures of magnitude of effect for meta-analysis.” Educational and Psychological Measurement 53 (1993): 87–92. [Google Scholar] [CrossRef]
  78. Max Gordon, and Thomas Lumley. “Forestplot: Advanced Forest Plot Using ‘Grid’ Graphics (Version 1.3).” 2015. Available online: http://CRAN.R-project.org/package=forestplot (accessed on 2 June 2016).
  79. Fiona McElduff, Mario Cortina-Borja, Shun-Kai Chan, and Angie Wade. “When t-tests or Wilcoxon-Mann-Whitney tests won’t do.” Advances in Physiology Education 34 (2010): 128–33. [Google Scholar] [CrossRef] [PubMed]
  80. Statistical Consulting Group. “FAQ: How do I Interpret Odds Ratios in Logistic Regression? ” Available online: http://www.ats.ucla.edu/stat/mult_pkg/faq/general/odds_ratio.htm (accessed on 14 July 2015).
  81. William Revelle. “Psych: Procedures for Personality and Psychological Research.” 2015. Available online: http://CRAN.R-project.org/package=psych (accessed on 2 June 2016).
  82. John Schmid, and John M. Leiman. “The development of hierarchical factor solutions.” Psychometrika 22 (1957): 53–61. [Google Scholar] [CrossRef]
  83. Yves Rosseel. “lavaan: An R package for structural equation modeling.” Journal of Statistical Software 48 (2012): 1–36. [Google Scholar] [CrossRef]
  84. semTools Contributors. “semTools: Useful Tools for Structural Equation Modeling (R Package Version 0.4–11).” 2016. Available online: http://cran.r-project.org/package=semTools (accessed on 2 June 2016).
  85. Samuel B. Green, and Yanyun Yang. “Reliability of summed item scores using structural equation modeling: An alternative to coefficient alpha.” Psychometrika 74 (2009): 155–67. [Google Scholar] [CrossRef]
  86. Joseph Henrich, Steven J. Heine, and Ara Norenzayan. “Most people are not WEIRD.” Nature 466 (2010): 29. [Google Scholar] [CrossRef] [PubMed]
  87. Gerard Saucier. “The Big Two as a common-denominator model of personality-attribute structure.” In Strong Cross-Cultural Tests of Personality Models. Paper presented at the 4th Biennial Conference of the Association for Research in Personality, St. Louis, MO, USA, 11–13 June 2015.
  88. Steffany J. Homolka, and Julie J. Exline. “Measuring Adolescent Religious and Spiritual Struggles: A Retrospective Pilot Study.” In Paper presented at the Society for Research in Child Development’s Religion and Spirituality Pre-Conference, Philadelphia, PA, USA, 18 March 2015. and at the 123rd annual APA Convention, Toronto, ON, Canada, 6–9 August 2013.
  89. Andrew P. Tix, and Patricia A. Frazier. “Mediation and moderation of the relationship between intrinsic religiousness and mental health.” Personality and Social Psychology Bulletin 31 (2005): 295–306. [Google Scholar] [CrossRef] [PubMed]
  90. Andrew P. Tix, and Patricia A. Frazier. “The use of religious coping during stressful life events: Main effects, moderation, and mediation.” Journal of Consulting and Clinical Psychology 66 (1998): 411–22. [Google Scholar] [CrossRef] [PubMed]
  91. Nick Stauner, Julie J. Exline, and Kenneth I. Pargament. “The demographics of religious and spiritual struggles in the USA.” In Belief and Nonbelief are Complex: Longitudinal, Demographical, and Cognitive Perspectives. Paper presented at the Convention of the Society for the Scientific Study of Religion, Newport Beach, CA, USA, 23–25 October 2015.
  • 1If available, the polychoric instrumental variable estimator would offer further improvements on ULSMV estimation.
  • 2Throughout we list the lowest-ranked response options first and the highest-ranked options last. Most of our analyses did not treat these data as numeric. When using maximum likelihood estimation, we assigned the lowest-ranked option a value of one and increased this by one unit for each rank (e.g., a five represented the highest-ranked option on a five-point scale).
  • 3We used WLSMV estimation for this test of metric invariance because ULSMV could not produce scaled fit statistics for the configural model.
  • 4We used unscaled CFIs for this test of metric invariance because neither ULSMV nor WLSMV could compute scaled fit statistics for the configural model. Cheung and Rensvold [44] did not specify whether their criteria for measurement invariance apply equally to scaled or unscaled fit statistics.
  • 5Mplus can use ULSMV with pairwise complete data.
  • 6The fourth CES-D item and the 13th RSS item (an interpersonal struggle item) as it loaded on the restricted general factor required freely estimated loadings. These loadings varied more across samples than all others in the configural model (standardized s²λ = 0.03 and 0.02, respectively). Scaling corrections worsened these models’ fit statistics dramatically (∆CFI = −0.218 with partial metric invariance). Without these corrections, these models did not indicate a significant lack of full metric invariance (full metric vs. configural invariance ∆CFI = −0.005).
  • 7The configural model failed to calculate scaled fit statistics and robust standard errors, and produced inadmissible parameter estimates in the west coastal Christian university sample. A single-group version with that sample showed no such problems, but failed to converge with the Midwestern public university data using ULSMV or WLSMV estimation. Using ML without polychoric correlations, this model converged with no problems (other than a poor CFI statistic), and the multi-group version established metric invariance (∆CFI = −0.005 vs. configural). Again, scaled fit statistics gave marginally more, technically significant cause for concern (∆CFI = −0.011). We deemed this concern negligible, since this same minor difference in outcomes as in the restricted bifactor RSS SEM only necessitated free estimation of two loadings across that model’s groups. Furthermore, the unscaled fit statistics for the WLSMV-estimated multi-group models also indicated metric invariance (∆CFI = −0.002 vs. configural), and no inadmissible parameters resulted from the strictly invariant model using ULSMV estimation, which fit acceptably.
  • 8Our largest SEM took over a day to converge using the newest Intel processor overclocked to 4.5 GHz. (Lavaan currently uses only one core per SEM.) Using maximum likelihood estimation without polychoric correlations reduced processing time drastically, as did using simpler SEMs or pooling data into one sample, but our interests prohibited these shortcuts.
Figure 1. (a) Forest plot of ratios of mean equal responses if attention check is failed vs. passed; (b) Forest plot of odds ratios for attention check failure per equal response. Combined N = 2697; MR = mean ratio; OR = odds ratio; U = university.
Religions 07 00068 g001
Figure 2. Original measurement model of the RSS. Squares represent items. Ovals represent latent factors. Line weights correspond to their path coefficients, which are standardized. See Table 5 for latent means and variances. Thresholds and residuals are omitted.
Religions 07 00068 g002
Figure 3. Restricted bifactor measurement model of the RSS. Squares represent items. Ovals represent latent factors. Line weights correspond to their path coefficients, which are standardized. See Table 5 for latent means and variances. Thresholds and residuals are omitted.
Religions 07 00068 g003
Figure 4. Unrestricted bifactor model of the RSS. Squares represent items. Ovals represent latent factors. Line weights correspond to their path coefficients, which are standardized. Loadings with dashed grey lines differed insignificantly from zero (p > 0.08). See Table 5 for latent means and variances. Thresholds and residuals are omitted.
Religions 07 00068 g004
Table 1. Educational statuses across samples.
SampleFreshmenSophomoresJuniorsSeniorsOthers
WCC76%16%4%2%2%
MWU61%23%9%4%2%
MWR53%27%11%8%1%
High School or LessPartial CollegeTwo-Year, Trade, or TechnicalBachelor’sMaster’s
GMT11%31%8%36%12%
NMT14%34%11%31%10%
Note: WCC = west coastal Christian university; MWU = Midwestern public university; MWR = Midwestern private university; GMT = general MTurk; NMT = nontheistic MTurk.
Table 2. Ages, genders, ethnicities, birthplaces, and first languages across samples.
AgeGenderEthnicity
SampleMedianMADWomenMenWhiteAsianBlackLatinOther or MultipleBorn in the USAEnglish as First Language
WCC18163%37%67%10%8%4%10%89%86%
MWU19166%34%63%15%6%6%10%97%98%
MWR19154%46%65%15%8%2%9%80%81%
GMT31660%39%74%5%8%5%8%96%97%
NMT29651%46%77%3%3%5%12%93%96%
Note: WCC = west coastal Christian university; MWU = Midwestern public university; MWR = Midwestern private university; GMT = general MTurk; NMT = nontheistic MTurk; MAD = median absolute deviation. In the MTurk samples, 1% (GMT) and 3% (NMT) designated genders other than man or woman from birth (e.g., transgender and withheld options).
Table 3. Sexual orientations and relationship statuses across samples.
Sexual Orientation Relationship Status
SampleHetero-SexualBisexualHomosexualOther or WithheldSingleIn a RelationshipCohabitingMarriedDivorcedOther or Withheld
WCC97%1%2%74%24%1%
MWU92%3%3%2%54%43%2%1%
MWR93%3%2%2%64%33%1%1%
GMT87%7%3%3%29%19%15%36%6%2%
NMT79%10%7%6%36%20%15%23%3%2%
Table 4. Religious affiliations across samples.
SampleChrisitian: Unspecified/OtherProtestantCatholicJewishBuddhistHinduMuslimOtherMixedAgnosticNoneAtheist
WCC66%30%2%0%0%0%0%1%0%
MWU24%19%30%1%0%0%0%0%1%7%9%4%
MWR13%12%18%4%2%4%2%2%1%13%14%8%
GMT15%19%11%2%2%1%1%6%3%17%10%13%
NMT2%3%5%1%3%1%1%1%24%19%22%
Note: WCC = west coastal Christian university; MWU = Midwestern public university; MWR = Midwestern private university; GMT = general MTurk; NMT = nontheistic MTurk; MAD = median absolute deviation. In the MTurk samples, 1% (GMT) and 3% (NMT) designated genders other than man or woman from birth (e.g., transgender and withheld options).
Table 5. Latent means (and variances) for RSS factors across samples and measurement models.
SampleModelDivineDemonicInterpersonalMoralUltimate MeaningDoubtGeneral
WCCOriginal1.0 (4.5)2.5 (5.7)0.6 (1.3)0.9 (2.2)−0.3 (4.0)0.3 (3.5)
Restricted−15.2 (1.2)−10.6 (4.1)−6.3 (0.6)−8.0 (1.0)−13.8 (1.7)−13.8 (1.1)16.3 (3.3)
Unrestricted0.4 (4.5)0.4 (3.3)0.3 (1.0)−0.2 (1.3)−0.3 (5.7)−0.1 (4.0)0.6 (0.2)
MWUOriginal0.50.90.30.10.00.1
Restricted−3.0−1.9−1.2−1.9−2.9−2.93.5
Unrestricted0.40.40.2−0.20.00.00.1
MWROriginal0.00.00.00.00.00.0
Restricted0.00.00.00.00.00.00.0
Unrestricted0.00.00.00.00.00.00.0
GMTOriginal0.20.60.4−0.6−0.0−0.3
Restricted7.16.23.23.35.75.7−6.9
Unrestricted0.41.40.4−0.1−0.1−0.2−0.2
NMTOriginal0.1−0.80.5−0.80.4−0.3
Restricted13.810.46.26.811.811.5−13.7
Unrestricted0.61.10.60.20.4−0.0−0.5
Note: WCC = west coastal Christian university; MWU = Midwestern public university; MWR = Midwestern private university; GMT = general MTurk; NMT = nontheistic MTurk. The MWR sample’s means served as a comparative baseline. All models used strict, latent variance, and latent covariance constraints across samples. Therefore, the WCC variance estimates apply to all samples.
Table 6. Reliability coefficient ω for RSS factors across samples.
SampleDivineDemonicInterpersonalMoralUltimate MeaningDoubtGeneral
WCC0.830.890.830.820.770.690.90
MWU0.9510.020.870.880.780.7810.01
MWR0.850.890.770.840.760.730.89
GMT0.780.860.780.820.750.680.98
NMT0.750.850.770.780.740.680.81
Note: WCC = west coastal Christian university; MWU = Midwestern public university; MWR = Midwestern private university; GMT = general MTurk; NMT = nontheistic MTurk. Calculations used the original measurement model, except for the general factor, which used the restricted model.
Table 7. Measurement model fit, invariance, and reliability statistics for religiousness and distress.
ReligiousnessDistress
StatisticBelief SalienceParticipationDepressionAnxietyNeuroticismPerceived Stress
CFI1.000.990.900.990.970.92
RMSEA0.010.050.090.050.060.09
WRMR2.496.387.182.984.667.52
Metric ∆CFI0.0000.0010.0280.0050.0150.056
Strict ∆CFI0.0000.022−0.0130.0050.0160.084
Reliability ω0.96–0.980.50–0.820.77–0.910.86–0.910.77–0.890.75–0.91
Note: Fit and reliability statistics apply to strictly invariant models; “Strict ∆CFI” compares strictly invariant models’ CFIs to metric models’; “Metric ∆CFI” compares metric models’ CFIs to configural models’; Reliabilities varied by sample, only once below 0.73 for the west coastal Christian university.
Table 8. Latent means (and variances) for religiousness and distress factors across samples.
ReligiousnessDistress
SampleBelief SalienceParticipationDepressionAnxietyNeuroticismPerceived Stress
WCC5.2 (5.7)2.4 (0.6)0.1 (0.4)0.2 (2.3)−0.1 (0.4)0.2 (0.8)
MWU0.9 (8.1)0.5 (1.4)0.1 (0.5)0.3 (2.6)0.1 (0.4)0.1 (0.7)
MWR0.0 (10.4)0.0 (1.7)0.0 (0.5)0.0 (2.3)0.0 (0.4)0.0 (0.5)
GMT0.5 (21.7)0.3 (2.2)−0.3 (0.9)−0.3 (4.2)−0.2 (0.8)−0.4 (1.5)
Note: WCC = west coastal Christian university; MWU = Midwestern public university; MWR = Midwestern private university; GMT = general MTurk; The MWR sample’s means served as a comparative baseline. All models used strict invariance constraints across samples.
Table 9. Latent correlations between factors of the RSS and factors of religiousness and distress.
RSS FactorMeasurement ModelReligiousnessDistress
Belief SalienceParticipationDepressionAnxietyNeuroticismPerceived Stress
DivineOriginal−0.35/0.00/0.24/0.17−0.19/0.10/0.24/0.150.56/0.45/0.46/0.460.49/0.42/0.44/0.440.44/0.33/0.38/0.350.50/0.43/0.42/0.51
Restricted−0.13/−0.14/−0.13/−0.02−0.07/−0.18/−0.34/−0.030.25/0.11/0.16/0.120.24/0.14/0.04/0.040.20/0.09/0.11/0.060.35/0.14/0.16/0.18
Unrestricted−0.40/−0.17/0.05/0.06−0.24/−0.08/0.06/0.040.57/0.46/0.44/0.460.50/0.41/0.41/0.430.45/0.36/0.39/0.350.50/0.44/0.39/0.50
DemonicOriginal0.10/0.53/0.57/0.590.17/0.58/0.60/0.610.35/0.30/0.28/0.210.33/0.26/0.30/0.250.21/0.10/0.16/0.160.31/0.23/0.22/0.22
Restricted0.18/0.28/0.18/0.270.24/0.36/0.20/0.370.14/0.09/0.09/0.090.15/0.07/0.03/0.080.09/−0.03/−0.00/0.100.17/0.03/0.02/0.06
Unrestricted−0.10/0.10/0.02/0.34−0.01/0.16/0.10/0.340.41/0.38/0.29/0.220.39/0.28/0.24/0.250.29/0.22/0.22/0.200.37/0.31/0.15/0.22
Inter-personalOriginal−0.23/−0.04/0.13/−0.07−0.09/0.14/0.27/0.020.52/0.33/0.33/0.350.42/0.28/0.30/0.340.31/0.22/0.26/0.250.35/0.22/0.26/0.28
Restricted−0.06/−0.15/−0.21/−0.14−0.00/−0.07/−0.20/−0.070.29/0.07/0.11/0.140.15/0.07/−0.06/0.090.08/0.01/0.05/0.100.17/−0.02/0.05/0.09
Unrestricted−0.27/−0.16/−0.05/−0.17−0.13/0.01/0.10/−0.100.53/0.33/0.30/0.340.43/0.27/0.26/0.320.33/0.24/0.26/0.260.36/0.22/0.22/0.27
MoralOriginal−0.05/0.38/0.46/0.33−0.05/0.34/0.42/0.320.36/0.30/0.34/0.350.31/0.29/0.34/0.360.23/0.19/0.32/0.260.31/0.26/0.36/0.36
Restricted0.06/0.26/0.25/0.200.02/0.09/0.02/0.160.18/0.06/0.14/0.140.13/0.12/0.06/0.090.08/0.05/0.14/0.100.20/0.08/0.21/0.19
Unrestricted−0.19/−0.01/−0.03/0.02−0.18/−0.06/−0.06/−0.020.40/0.34/0.34/0.390.34/0.29/0.28/0.370.27/0.29/0.39/0.320.34/0.32/0.34/0.38
Ultimate MeaningOriginal−0.42/−0.18/0.06/−0.18−0.25/−0.05/0.08/−0.180.60/0.54/0.56/0.640.47/0.42/0.47/0.550.48/0.41/0.55/0.540.45/0.46/0.48/0.59
Restricted−0.23/−0.32/−0.25/−0.31−0.15/−0.26/−0.31/−0.310.42/0.36/0.44/0.540.23/0.25/0.21/0.350.31/0.24/0.35/0.440.31/0.27/0.31/0.44
Unrestricted−0.42/−0.18/0.05/−0.19−0.25/−0.06/0.08/−0.180.60/0.54/0.56/0.650.46/0.42/0.47/0.560.48/0.41/0.55/0.540.44/0.46/0.48/0.59
DoubtOriginal−0.34/−0.01/0.26/0.16−0.20/0.06/0.20/0.070.42/0.31/0.32/0.320.36/0.30/0.32/0.350.37/0.28/0.36/0.290.33/0.26/0.32/0.33
Restricted−0.15/−0.16/−0.03/0.05−0.04/−0.21/−0.34/−0.050.15/−0.03/0.01/−0.020.12/0.02/−0.07/−0.010.20/0.03/0.07/0.080.20/−0.06/0.04/0.01
Unrestricted−0.39/−0.15/0.09/0.05−0.24/−0.08/0.05/−0.040.43/0.31/0.30/0.310.36/0.28/0.29/0.330.39/0.30/0.36/0.290.33/0.27/0.29/0.32
GeneralRestricted−0.26/0.10/0.32/0.19−0.17/0.22/0.51/0.190.39/0.40/0.34/0.360.33/0.32/0.40/0.390.26/0.28/0.28/0.250.26/0.36/0.30/0.36
Unrestricted0.41/0.67/0.74/0.500.38/0.69/0.71/0.53−0.05/0.04/0.13/0.08−0.04/0.09/0.19/0.11−0.11/−0.08/0.03/0.02−0.06/0.00/0.16/0.09
Note: Slashes divide correlations by sample in the following order: west coastal Christian university/Midwestern public university/Midwestern private university/general MTurk. SEMs using the original and unrestricted bifactor measurement models for the RSS used strict measurement invariance constraints. The restricted bifactor RSS SEM used partial metric invariance constraints.

