A Systems Approach to Building Community Capacity and Resilience


Department of Civil Engineering, University of Colorado, Boulder, CO 80309-0428, USA
Challenges 2020, 11(2), 28; https://0-doi-org.brum.beds.ac.uk/10.3390/challe11020028
Submission received: 24 September 2020
/
Revised: 15 October 2020
/
Accepted: 17 October 2020
/
Published: 20 October 2020
Abstract
:Capacity and resilience are two closely aligned concepts in human development. They both contribute to increasing the ability of societies to cope with and adapt to challenging and adverse perturbations that may affect systems the societies depend upon. A traditional approach to building capacity and resilience at the community scale is to address in a fragmented manner specific issues at play in institutional, socio-economic, environmental, and infrastructure systems that may prevent the delivery of adequate community services and meeting development goals. This compartmentalized approach, driven by a need to reach some form of satisfactory community equilibrium, fails to recognize the interactions and interconnectedness that exist among community systems, which, if addressed, could solve multiple issues more effectively. It also does not account for the complex, adaptive, and dynamic nature of communities. A resilient community is more than just a collection of well-functioning silos. This paper proposes a system dynamics approach to account for the dynamic and adaptive nature of communities when developing capacity-building strategies toward strengthening their ability to deliver services and deal with adverse events. A case study of small-scale community capacity assessment around the service of wastewater and sewage treatment published elsewhere is presented to illustrate the proposed approach.
1. Introduction
The year 2020 is likely to be remembered in future history books as a critical year in human and economic development. The COVID-19 pandemic is the latest in a series of global crises that have affected humanity during the first two decades of the 21st century. The economic crisis of 2008 and subsequent recession, the worldwide food and energy insecurity starting in 2007, and the 2020 pandemic have exposed the fragility, multiple vulnerabilities, and flaws in our economic and social systems and revealed numerous forms of injustice and inequality (ecological, racial, social, economic, and gender). They have also pushed more people worldwide into poverty [1] and negatively impacted peace worldwide [2].
The crises mentioned above have also added confusion and uncertainty about how to intervene appropriately and on time in the multiple evolving systems that humanity depends on. They have been unfolding in a world already facing challenges that started way into the 20th century and are likely to continue in the foreseeable future. These challenges include climate change disruptions; national and global security; population growth and migration; rapid urbanization; the security of water, energy, land, and food resources; the access to shelter, health and education; transportation and communication services; disaster risk and emergencies management; environmental protection and natural resource management; and resource management in transboundary and conflict-prone areas.
Over the past 30 years, all these challenges have been recognized as affecting peace and human development, predominately for the planet’s poorest segments. In response to these challenges, multiple initiatives have been proposed toward building a more sustainable, stable, resilient, and equitable world where all humans have a fulfilling and prosperous livelihood and live with dignity and peace. This underlying goal led to the publication of reports such as Common Future [3] and Agenda 21 [4] that emphasized integrating sustainability in policies at different scales. Likewise, An Agenda for Peace [5] provided the start of an action plan for peace alongside sustainability. More recent agendas and road maps of human development for the 21st century include the Millennium Development Goals (1990–2015) and the current Sustainable Development Goals (SDGs, 2015–2030). The latter represents a comprehensive plan of action that involves people, planet, prosperity, peace, and partnerships (the 5Ps) in high-, middle, and low-income countries [6] and consists of six trajectories of transformation [7]. This plan of action will likely take many years way into the 21st century since it has to overcome the setbacks associated with the crises of the past 20 years [8,9] and prepare for any possible future crises [10].
As noted by the UNDP [1] and Sumner et al. [9], there is a need to readjust human development to reflect the new normal of 2020 and beyond, as it is now even more challenging to identify what we want to sustain and how to do it. Questions arise as to (i) what a post-pandemic world will look like for a growing and more urbanized world’s population [11]; (ii) how to build back better (rather than return to old normal) more resilient and equitable inclusive societies that put all people back at the center of human and economic development [10]; and (iii) how to build capacity at different social scales (household, community, national, and regional) to cope and adapt to adverse events and challenging conditions.
As we come to terms with deciding what a world past 2020 looks like, a new mindset needs to be embraced by humanity to address the challenges mentioned above and handle potential future crises. The mindset must recognize that these global challenges share many common characteristics that make human development interventions more challenging to plan, design, and implement. First, they affect predominately the most vulnerable sections of humanity, many of whom have limited or no voice or representation. Second, they involve multiple interconnected components (social, economic, cultural, and technical), are specific to the context and scale of the landscape in which they unfold, and often transcend national boundaries requiring regional and international collaboration. As a result, the uncertain, ambiguous, and unpredictable nature of these challenges makes tools from systems and complexity science more appropriate than reductionistic tools to capture their dynamics, explore different intervention scenarios, and develop integrated solutions. The value proposition of a systems approach also requires that decisionmakers and practitioners be trained as systems thinkers and acquire the basic skills necessary to use these tools.
The new mindset must also promote collective activities at different scales (local, national, and regional), which, as noted by the UNDP [1], are urgently needed to prevent further decline in human development in the future. According to Moritz [12], to avoid such deterioration and avoid socio-economic instability worldwide, there is a need for a new trajectory that addresses simultaneously short-term improvements to the current situation and long-term sustainability planning along five tracks: (1) repair what is currently most damaged; (2) rethink change without going back to how things were, i.e., without rebuilding vulnerability; (3) reconfigure change so that it can happen; (4) restart change with a new mindset; (5) and report how change progresses with the ability for course correction. Simply put, yesterday’s human development tools have a limited range of application in developing the world of tomorrow. New tools need to be designed to operate in a new structure.
The five changing tracks of Moritz [12] mentioned above emphasize the importance of community capacity building and resilience in the overall discussion on sustainable development for the 21st century. These two concepts are not new and have been part of the development vocabulary for a long time. A traditional approach to building capacity and resilience at the community scale is to identify and address in a fragmented manner specific issues at play in institutional, economic, social, environmental, and infrastructure systems that may prevent the delivery of community services and meeting development goals. This compartmentalized approach, driven by a need to reach some form of satisfactory community equilibrium, fails to recognize the interconnectedness among community systems, which, if addressed, could solve multiple issues more effectively. It also does not account for possible forms of synergy and trade-off at play between these systems and the changing, adaptive, and dynamic nature of communities [13]. Expanding on a remark by Pfefferbaum et al. [14] that “building a resilient community involves more than assembling a collection of resilient individuals,” a resilient community is more than a collection of well-functioning static silos such as institutions and infrastructure.
The bottom line is that the concepts of community capacity and resilience must be updated, reimagined, and redefined for the context of a post-2020 pandemic world. A more comprehensive and systemic approach to capacity and resilience is needed to explore possible synergies and trade-offs at play in community development. The approach cuts horizontally across multiple vertical silos of community development. For instance, how does building one form of capacity to achieve a specific goal such as providing a reliable service (e.g., water, energy, food, transportation, etc.) would affect achieving another goal associated with a different type of service over time. Likewise, how does the interaction between various systems at play at the community level (e.g., institutional, sociocultural, infrastructure, environmental, economic, etc.) contribute to community resilience as the community is exposed to small and large adverse events over time?
This paper proposes a system dynamics approach to account for the dynamic and adaptive nature of communities when developing capacity-building strategies to strengthen their ability to deliver services and deal with adverse events. The value proposition of the approach proposed herein is multifold: (i) it captures the multiple interactions at play between the systems that contribute to community capacity and resilience; (ii) it simulates the coping and adaptation aspects of community change; and (iii) it accounts for nonlinear interactions between community systems. A case study of small-scale community (village size) capacity assessment around the service of wastewater and sewage treatment published elsewhere [15] is presented to illustrate the proposed approach.
2. Capacity Analysis
2.1. Definitions of Capacity
The concept of capacity is critical in the overall discussion of human development. It is synonymous with the ability of different stakeholders (e.g., individuals, households, institutions, governments, etc.) to achieve specific goals and satisfy their needs. As noted by Lavergne and Saxby [16], capacity can take multiple forms, tangible ones such as infrastructure and institutions, and less tangible ones such as skills, social fabric, values and motivations, habits, attitudes, tradition, culture, etc.
Among the multiple definitions of capacity available in the literature, the Canadian International Development Agency (CIDA) captures well the concept of capacity in its various expressions and at different scales as: “the abilities, skills, understandings, attitudes, values, relationships, behaviors, motivations, resources and conditions that enable individuals, organizations, networks/sectors, and broader social systems to carry out functions and achieve their development objectives over time” [17].
Likewise, the Deutsche Gesellschaft für Internationale Zusammenarbeit (GIZ) links capacity to sustainable development as “the ability of people, organizations, and societies as a whole to manage their affairs successfully and to continuously adapt in response to changing conditions” [18].
Different organizations have identified various categories of capacity. For example, the Tearfund [19] considers individual, social, natural, and economic categories of capacity. The World Federation of Engineering Organizations [20] considers six pillars of capacity, which according to this organization, “must always be in place if a nation is to have sufficient and stable technical and decision-making capacity to meet the prerequisites of sustainability.” They include individual, institutional, technical, decision-making, business, and resource and supply capacities.
Another way of classifying capacity is to consider how capacity plays a role in community development when dealing with the stressors and shocks associated with events of diverse adversity. Inherent capacity relates to how community stakeholders cope with these events. Likewise, adaptive capacity describes how they adapt to these events over time. In this context, capacity can be understood as counteracting the vulnerability (susceptibility) that community stakeholders may be facing in such circumstances. The vulnerability to capacity ratio, the level of exposure to an event, and its degree of adversity can be interpreted as three parameters that define risks as follows:
In this equation, the “exposure” varies between 0 (no exposure) and 100% (full exposure). The variable “event” varies over a specific scale based on the event adversity and impact level. It should be noted that all variables in this equation depend on time.
Regardless of how capacity is defined, it is generally agreed that capacity (i) is critical to the success of human development; (ii) is a vital attribute of resilient, peaceful, and sustainable communities; (iii) takes time to acquire with multiple twists and turns and sometimes some setbacks, and (iv) is scale- and context-specific. Capacity can be assessed (qualitatively or quantitatively) using performance indicators where the performance can take forms such as “decision making, leadership, service delivery, financial management, ability to learn and adapt, pride and innovation, organizational integrity and many others” [21].
2.2. Capacity Building
The role that capacity plays at the community level depends on the existing enabling or constraining aspect of the community’s environment. In a landscape of specific context and scale, capacity can be built through a process referred to as capacity building, starting with an initial level of capacity (i.e., a capacity baseline). In Chapter 37 of Agenda 21 [4], capacity building is defined as encompassing “the country’s human, scientific, technological, organizational, institutional and infrastructure capacity to help societies develop secure, stable and sustainable economies, governments, and other institutions through mentoring, training, education, physical projects, the infusion of financial and other resources, and most importantly, the motivation and inspiration of people to improve their lives.”
Likewise, the World Federation of Engineering Organizations [20] defines capacity building in an integrated manner as: “... the building of human, institutional and infrastructure capacity to help societies develop secure, stable and sustainable economies, governments, and other institutions through mentoring, training, education, physical projects, the infusion of financial and other resources, and most importantly, the motivation and inspiration of people to improve their lives.”
It is noteworthy that capacity building is sometimes referred to as capacity development in the development literature. The UNDP [22] defines it as follows: “a process through which individuals, organizations, and societies obtain, strengthen, and maintain the capabilities to set and achieve their own development objectives over time.”
Even though there is no one-size-fits-all approach to capacity building that would work for all community landscapes, capacity building represents a strategic means to an end, which is to create sustainable, peaceful, and resilient communities. This process has unique characteristics:
- It is about creating an enabling environment with context-specific development (individual, institutional, organizational) strategies.
- It is scale (physical and temporal) dependent and cannot be easily extrapolated from one scale to another.
- It does not happen by itself and builds on local ownership and self-reliance.
- It promotes partnership and long-lasting broad-based community participation.
- It takes time and depends on the capacity baseline and the enabling aspect of the environment in which it unfolds. The higher the baseline, the faster the capacity building can be expected to take place.
2.3. Capacity Assessment
The process of capacity building at the community level is not random. It starts with a capacity assessment, which helps define the baseline on which community capacity can be built. In community development, capacity assessment is usually part of community appraisal. Its goal is to learn as much as possible about the community by collecting and analyzing data and transforming these data into useful information. Community appraisal provides a local context consisting of the community’s operating environment, cultural setting, and development level. It also includes information about the more global context of the country and region in which the community resides. In general, at the end of the appraisal phase, the community’s baseline profile is established. It defines the overall state of community development, its multiple patterns of behavior, and its structural components.
Overall, community appraisal is carried out with the full participation of the community members and different stakeholders, individuals, households, and institutions. Ideally, the baseline profile defines the community as it sees itself, not as outsiders understand it, through its strengths, weaknesses, opportunities, challenges, threats, forms of capacity and vulnerability, resources, and the hazards or adverse events it might be exposed to. In summary, the baseline profile helps identify the enabling and constraining factors in the community in which capacity building projects unfold.
The methodology used to carry out community appraisal comes from the social sciences and uses tools from Participatory Action Research (PAR). More information about PAR tools can be found in the literature [23,24,25,26,27], among others. PAR methods focus mostly on collecting and analyzing primary and secondary, and qualitative and quantitative data dealing with sociocultural issues. In addition to these issues, other community attributes are observed and mapped: environmental, economic, technical, human resources, etc. The results of the appraisal phase are usually presented in a matrix or tabular form or by other means of data representation (sketches, drawings, videos, etc.) around the following topics: stakeholders and beneficiaries, gender, partnership, capacity, vulnerability, vulnerable groups, social network, and uncertainty.
Another critical aspect of community appraisal is to be able to identify what the community can do and cannot do in the short term with its existing baseline capacity. It is also about determining what level of community development the community aspires to (i.e., its capacity needs), over what time frame, and addressing existing gaps between current and desired capacities. Answers to these questions help identify, rank, plan, prioritize, and implement community development interventions in building capacity over time. These answers also help in selecting the most appropriate technical solutions for the community.
2.4. Mapping Capacity
This section considers a modified version of a framework developed by researchers at the University of Virginia, Charlottesville (UVC) [15,28,29]. It was initially designed to assess the capacity of small-scale developing communities (village size) to manage the delivery of local community municipal sanitation services (MSS) related to drinking water supply (DWS), wastewater and sewage treatment (WST), and the management of solid waste (MSW). The framework referred to as UVC below can be generalized to conduct a capacity analysis for the delivery of other types of community services as well such as education, health, energy, food, shelter, transportation, education, telecommunication, the management of critical infrastructure, and the prevention of violence and injury.
The UVC capacity framework considers eight categories of capacity involved in delivering MSS services: service level, institutional, human resources, technical resources, economic and finances, energy, environmental, and social and cultural. Each category consists of several requirements (or constituents). For each category of capacity in the UVC framework, a capacity factor is calculated as the weighted sum of its requirement scores. Table 1 shows an example of an analysis carried out by Bouabid [15] and Bouabid and Louis [28] to assess the capacity of a rural village consisting of 230 households and a population of 1250 in Morocco to adopt a new wastewater treatment plant management strategy. In this table, each requirement is rated with a score ranging between 0 and 100 and broken down into five rating groups with 20 units each. Each group has characteristics specific to the context in which the analysis is carried out—in this case, a small low-income community in southern Morocco. This detailed case study was selected to illustrate the methodology presented below.
The UVC framework uses a weakest link or pessimistic rule decision criterion to determine the capacity factor with the lowest score among all the capacity factors (except the service level). According to Bouabid [15], the lowest capacity factor, referred to as the Community Capacity Assessment CA, can be understood as the place in the community that is most vulnerable and where intervention to improve a specific service is first needed. It can also be interpreted as a measure of the stage of development of a community and its readiness to provide the service.
To do so, Bouabid [15] introduces a community capacity level (CCL) ranging over a five-point scale. Table 2 shows how CCL is related to CA. For the example shown in Table 1, the community has a CCL equal to 2 because technical capacity is the limiting factor in the capacity assessment with a value of 24. In other words, until technical issues related to the service of wastewater and sewage treatment are addressed first, the community only has the capacity to “manage systems for small collections of residential units,” and a limited level of local service can be provided. Once addressed, human resources capacity and economic and financial capacity are to be addressed next.
The challenge for the village considered in Table 1 is to create a development action plan for wastewater and sewage treatment over time (5–10 years minimum), starting with a low capacity baseline, which can be challenging at first. Furthermore, that baseline limits the range of technical solutions that could be implemented for wastewater and sewage treatment, at least in the short-term (e.g., wetlands, stabilization ponds, pit latrines, as suggested by Bouabid). As capacity increases over time (i.e., CA and CCL increase), more advanced technical solutions (e.g., sewer systems with treatment) could be introduced to provide a better service. Selecting the most appropriate technical solution rests in the community members’ hands in consultation with outside experts.
It should be noted that the UVC approach is quite conservative, as it uses a pessimistic rule criterion to calculate the value of the Community Capacity Assessment CA. As noted by Bouabid [15], other measures could be used instead, such as calculating CA as the weighted average of all capacity factors with weights reflecting the importance of different capacity types. Another observation made by Bouabid [15] is that the scores in Table 1 are best guesses only. A sensitivity analysis might also be needed to analyze the impact of their variation on deciding what solutions are appropriate.
3. Modeling Capacity Interdependency
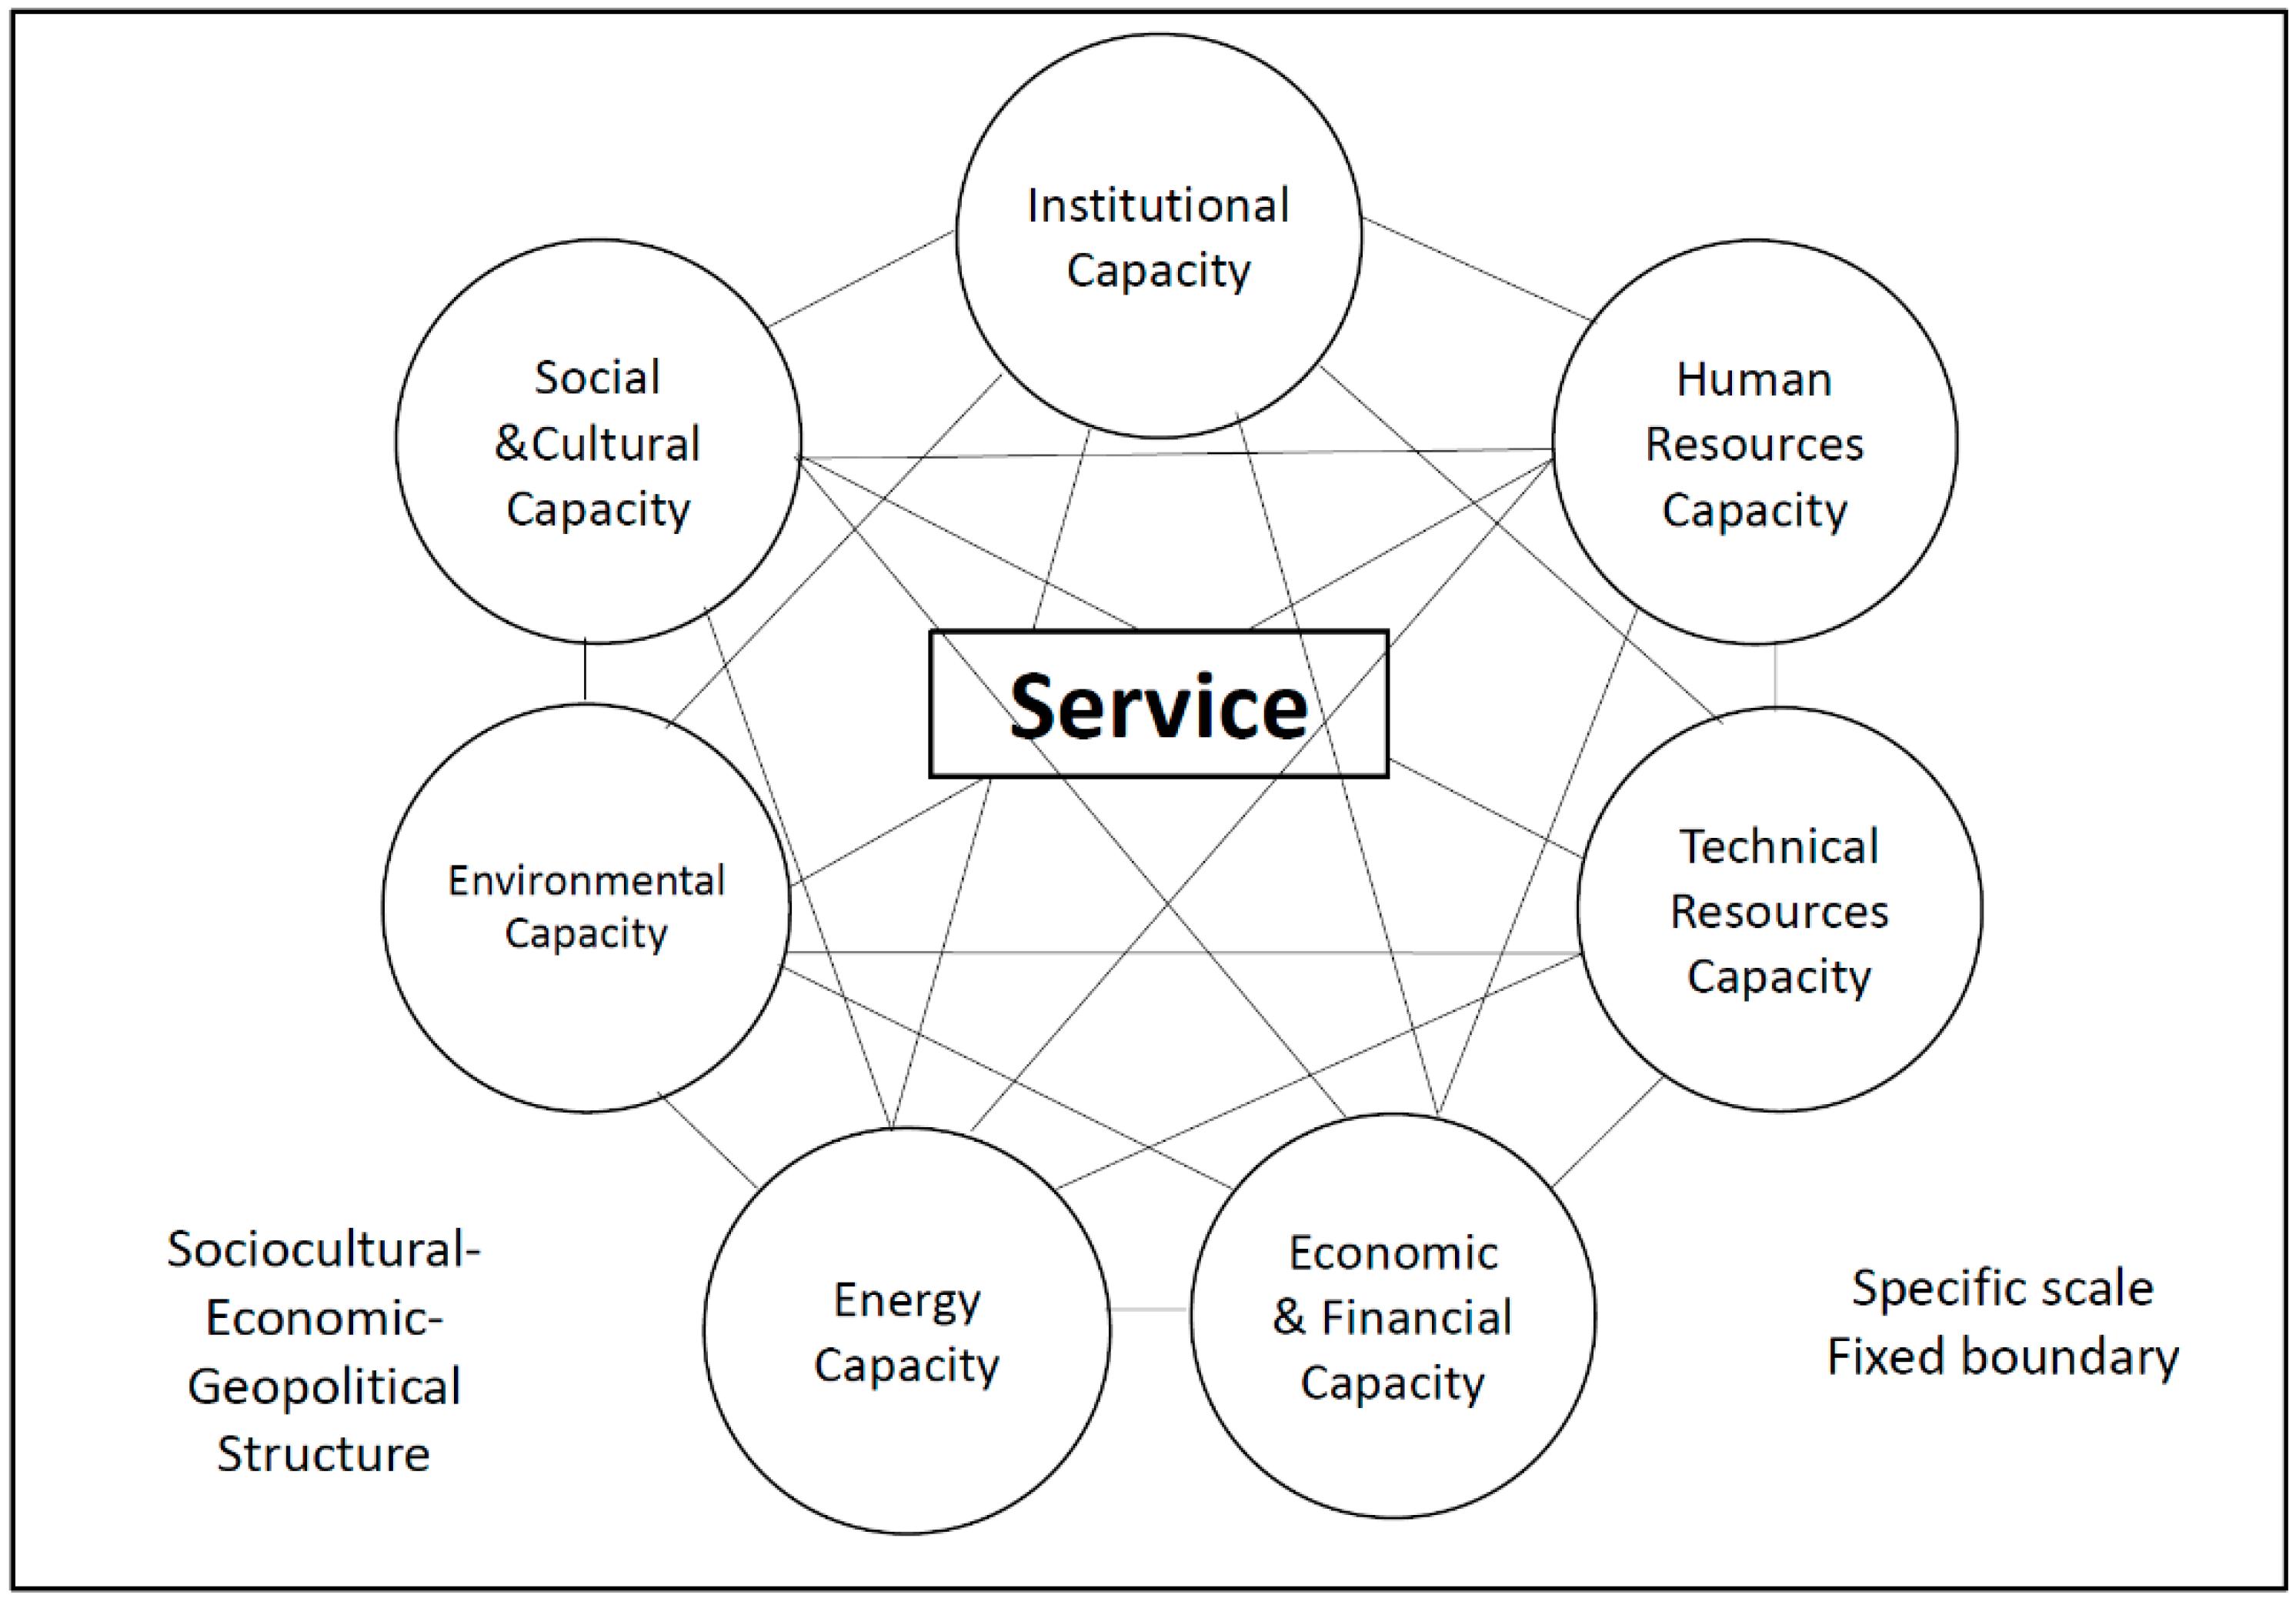
A limitation of the UVC framework presented above is that it does not account for any interdependency that may exist among the different categories of capacity necessary to provide a specific service at the community level. A modified version of that framework is shown in Figure 1, where seven of the eight UVC capacity categories are considered for analysis. It is assumed that all seven categories and their respective requirements are somehow interconnected and contribute to the overall capacity of a community to provide one type of service in an enabling open landscape with a sociocultural, economic, and geopolitical structure at a specific scale and defined by an arbitrary boundary.
Appropriate requirements (Ni, i = 1–7) need to be met for each category of capacity considered in Figure 1. Using the same weakest link criterion as Bouabid [15] and Ahmad [29], the Community Capacity Assessment CA for the type of service considered in Figure 1 is equal to
Each capacity factor CFi (i = 1–7) is equal to
where Cij and wij (j = 1–Ni) represent respectively the requirements scores and weights associated with the i-th capacity factor CFi (i = 1–7). Compared to the original UVC framework, each capacity factor CFi in Equation (2) is now assumed to depend somehow on the other six (CFk, k ≠ i). Likewise, in Equation (3) each requirement score Cij is assumed to depend somehow on all other possible requirement scores (Ckl, k ≠ i, l ≠ j). This formulation accounts for the various feedback mechanisms at play among the different categories of capacity.
In general, it is not possible to account for all possible linkages between the different types of capacity and their requirements in the delivery of all types of community services. Nevertheless, it is possible to identify those that are more likely to play a critical role in community development projects. Table 3 gives a non-exhaustive list of such requirements.
In this section, we present the application of a soft systems approach (cross-impact analysis) and a hard systems approach (system dynamics) to account explicitly for the linkages between the seven types of capacity shown in Figure 1.
3.1. Cross-Impact Analysis
Cross-impact analysis, also called double-causality analysis, is a mathematical method developed to analyze weakly (soft) structured systems for which theory-based computational (hard) models do not work due to the system’s complexity, uncertainty, and disciplinary heterogeneity [30,31,32,33]. Different formulations of cross-impact analysis differ on how system components inter-relations are formulated (probabilistically or deterministically) and whether a qualitative, quantitative, or mixed approach is used to describe causalities [34]. The cross-impact analysis is used herein to map and analyze how the six capacity categories influence and depend on each other.
Let us consider a system consisting of n interacting variables. Cross-impact analysis of that system can be represented by a (n × n) cross-impact matrix with zero diagonal terms and n2-n off-diagonal terms. The off-diagonal terms define the double causality between the n interacting variables, how each variable (row) directly influences or impacts the other variables, and how each variable (column) depends on or is sensitive to the other variables. It should be noted that the cross-impact matrix, also referred to as the matrix of direct influence (MDI) by Godet [35], is not necessarily symmetric. The strengths of the binary influence between two variables can be described qualitatively using qualifiers such as high, medium, or low, or scored semi-quantitatively over an appropriate scale. The selected scale is specific to the system being analyzed and must include a narrative that explains the meaning of the qualifiers and scores.
Table 4 shows an example of a cross-impact matrix for the n = 7 categories of capacity considered in Figure 1. The off-diagonal terms of the matrix represent possible (among many) feedback mechanisms n interlinkages that exist as two categories of capacity interact interdependently. Semi-quantitative scores have been assigned to describe the strength (enabling influence) between interacting categories of capacity, two at a time. The scores were assumed to range between 0 for no influence; 1 for low enabling influence; 2 for medium enabling influence; and 3 for strong enabling influence. In this example, possible constraining influences (with negative scores) are not considered.
It should be noted that the scores in each of the 42 off-diagonal terms of the double-causality matrix of Table 4 were suggestively assigned to illustrate the methodology. These scores are not associated with any actual case study, only guessed based on the author’s experience with small-scale low-income communities (village size) like the one in Morocco considered in Table 1. Ideally and in practice, actual values (or a range of values) at the community level would have to be selected in a participatory manner by groups of stakeholders (e.g., community members, government representatives, outsiders) with different types of expertise during community appraisal as discussed in Section 2.3. In general, that selection requires time, brainstorming, and consensus-building between all parties involved [36]. The last remark about Table 4 is that it involves a high level of aggregation since each category of capacity contains multiple requirements, as indicated in Table 1.
Following the MICMAC (cross-impact matrix multiplication applied to classification) methodology of cross-impact analysis proposed by Godet [35], Arcade et al. [36], and Duperrin and Godet [37], Table 4 was used to calculate the net direct influence (impact) of each category of capacity on the other six and the net direct dependence (sensitivity) of each type of capacity on the other six. This was done by summing the row scores and column scores of the double-causality matrix, respectively. The net influence values represent how each category of capacity affects the overall system, whereas the net dependence values represent the effect the system has on each type.
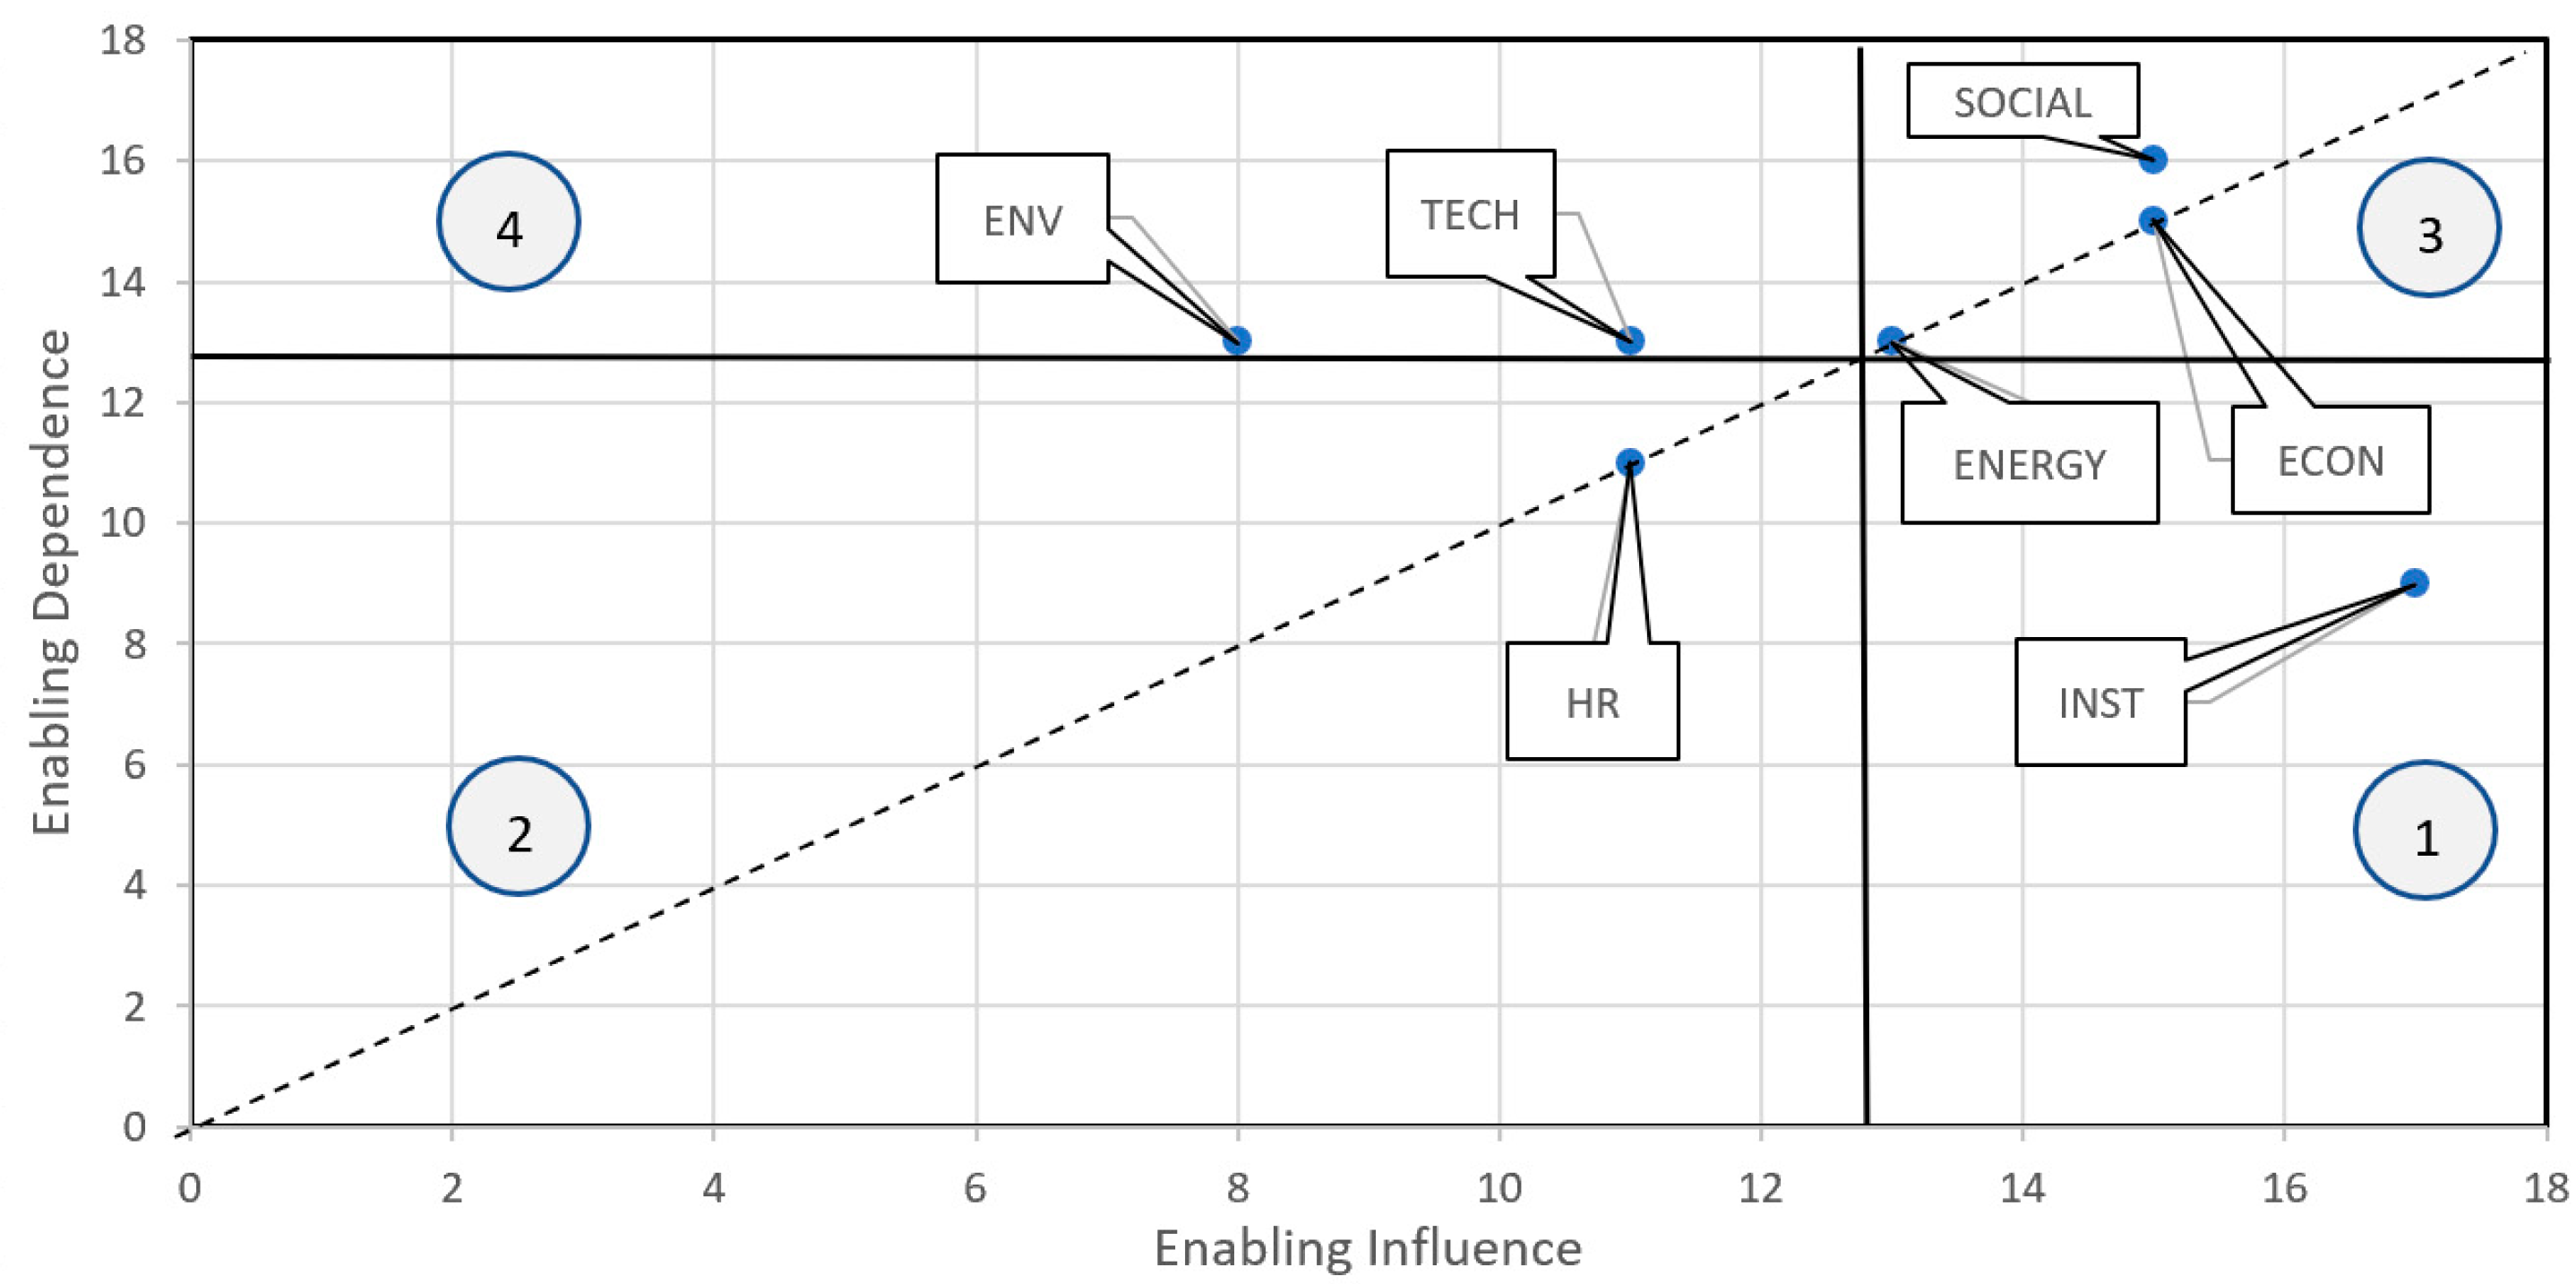
The degree of dependence and influence values are plotted on a single influence (x) vs. dependence (y) graph (Figure 2). The average direct influence and dependence value for all domains is 12.9. The graph can then help to separate the categories of capacity into several sectors. According to Arcade et al. [36], they include:
- influential variables (sector 1) with high influence and low dependence; e.g., institutional capacity;
- excluded variables (sector 2) with low influence and dependence; e.g., human resources capacity;
- relay variables (sector 3) with high influence and dependence; e.g., social, economic, and energy capacity; and
- dependent variables (sector 4) with low influence and high dependence; e.g., environmental and technical capacity.
With high influence and low dependence, the institutional capacity has higher leverage and dominance among all types of capacity for the service being considered. The high influence and dependence of social capacity, economic capacity, and energy capacity make these forms of capacity more challenging to address for the service being considered since their influence and dependence cannot be separated through feedback mechanisms.
On the other side of the dependence vs. influence spectrum in Figure 2 are the low influence and high dependence categories of capacity that are the outputs of other capacity interactions. They include environmental capacity and technical capacity. In general, these subordinate domains are “strong indicators of the ‘health’ of the entire system of variables” [38]. Finally, the human resources capacity is located in the low influence and low dependence sector in Figure 2. As such, it does not seem to be as significant to the service delivery as the other categories of capacity but should not be ignored. By being located on the first diagonal of Figure 2, the effect of the other seven categories of capacity on HR is the same as the effect of HR on these types of capacity.
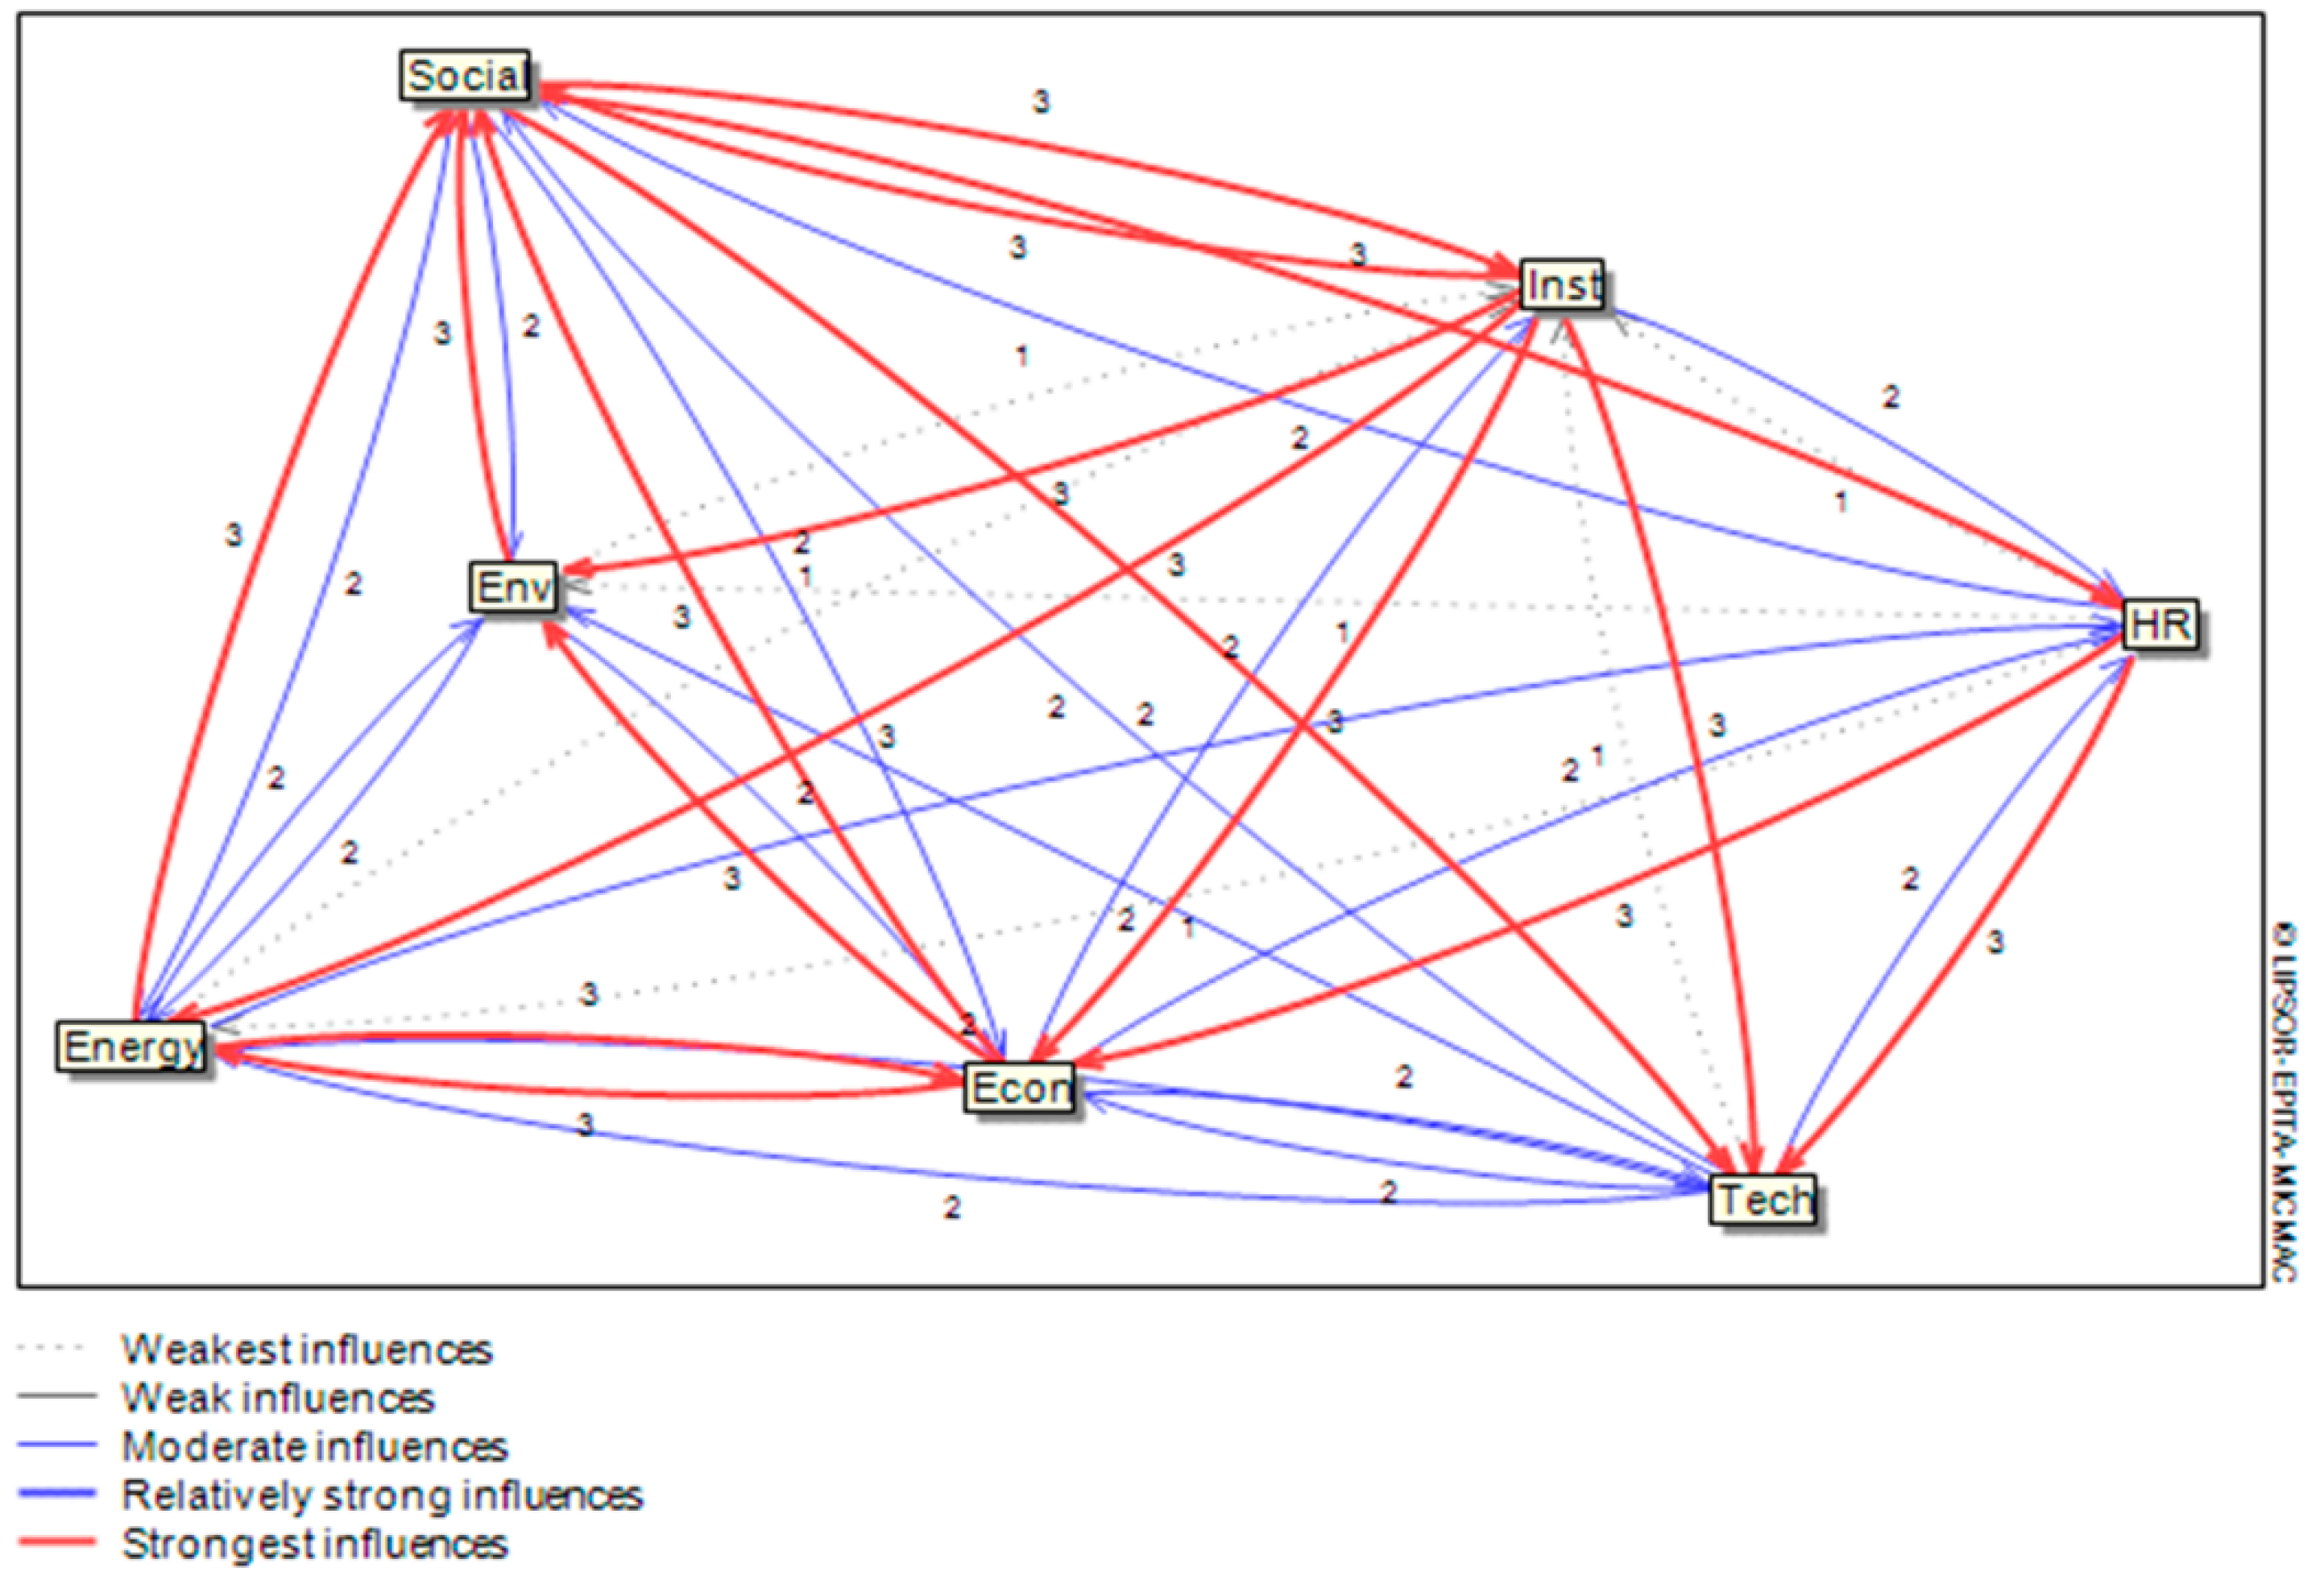
Another way of representing the linkages between the seven categories of capacity is to use a network representation. In network analysis, the cross-impact matrix of Table 4 translates into a valued-directed graph that shows how the seven categories of capacity are connected. The graph is shown in Figure 3 and was created using the MICMAC software (www.en.laprospective.fr) developed by Godet [39].
Compared to Figure 2, this graph shows the different levels of capacity interdependence. The centrality of each node in Figure 3, that is, “the contribution the node makes to the network structure,” can be determined using different measures [40]. For instance, using the degree of centrality as a measure, the eight categories of capacity have out-degree centralities (sum of values of outgoing links) of 17, 11, 11, 15, 13, 8, and 15. They also have in-degree centralities (sum of values of ingoing links) of 9, 11, 13, 15, 13, 13, and 16. The out-degree centrality indicates the enabling influence of one category of capacity on the others. The in-degree centrality shows the enabling dependence of one type of capacity on the others.
Other measures and properties, such as the cohesion and shape of the network, node betweenness, and linkage cohesion, can be inferred to describe the network in Figure 3. According to Borgatti et al. [41], these measures and properties help identify the “underlying processes that account for observed relationships among variables,” which can be processes of transmission, adaptation, binding, or exclusion.
3.2. System Dynamics Analysis
If linkages do exist among the different types of community capacity involved in delivering a specific type of service, the values of the capacity assessment CA and community capacity level CCL are likely to be different from those determined using the traditional UVC approach. As a result, different conclusions may then be reached about the stage of community development, whether the community has the capacity to manage new systems, and the technologies that are most appropriate to provide the service.
The system dynamics (SD) method was used to account for possible linkages between different capacity types. It is a relatively new branch of systems science that originated with Dr. Forrester’s work at the Massachusetts Institute of Technology in the 1960s and 1970s [42]. A review of the method and its multiple applications can be found in some landmark books [43,44,45], among many others. The unique characteristics of the SD method that warrant its use in modeling the dynamics of complex systems include being able to (i) study how systems continuously change over time due to possible changes in and relationships among components and changes in the overall direction of systems allowing for both qualitative and quantitative modeling; (ii) account for systems nonlinearities, and feedback mechanisms; (iii) illustrate that as the structure of a system changes, so does its behavior and vice-versa. All SD models presented below were developed using the STELLA Architect version 2.0 software from isee systems (www.iseesystems.org). This software platform uses a visual and graphical programming approach consisting of stocks, flows, converters, and connectors icons. It enables the users to focus on the structure and behavior of dynamic systems rather than solving systems of nonlinear first order equations explicitly.
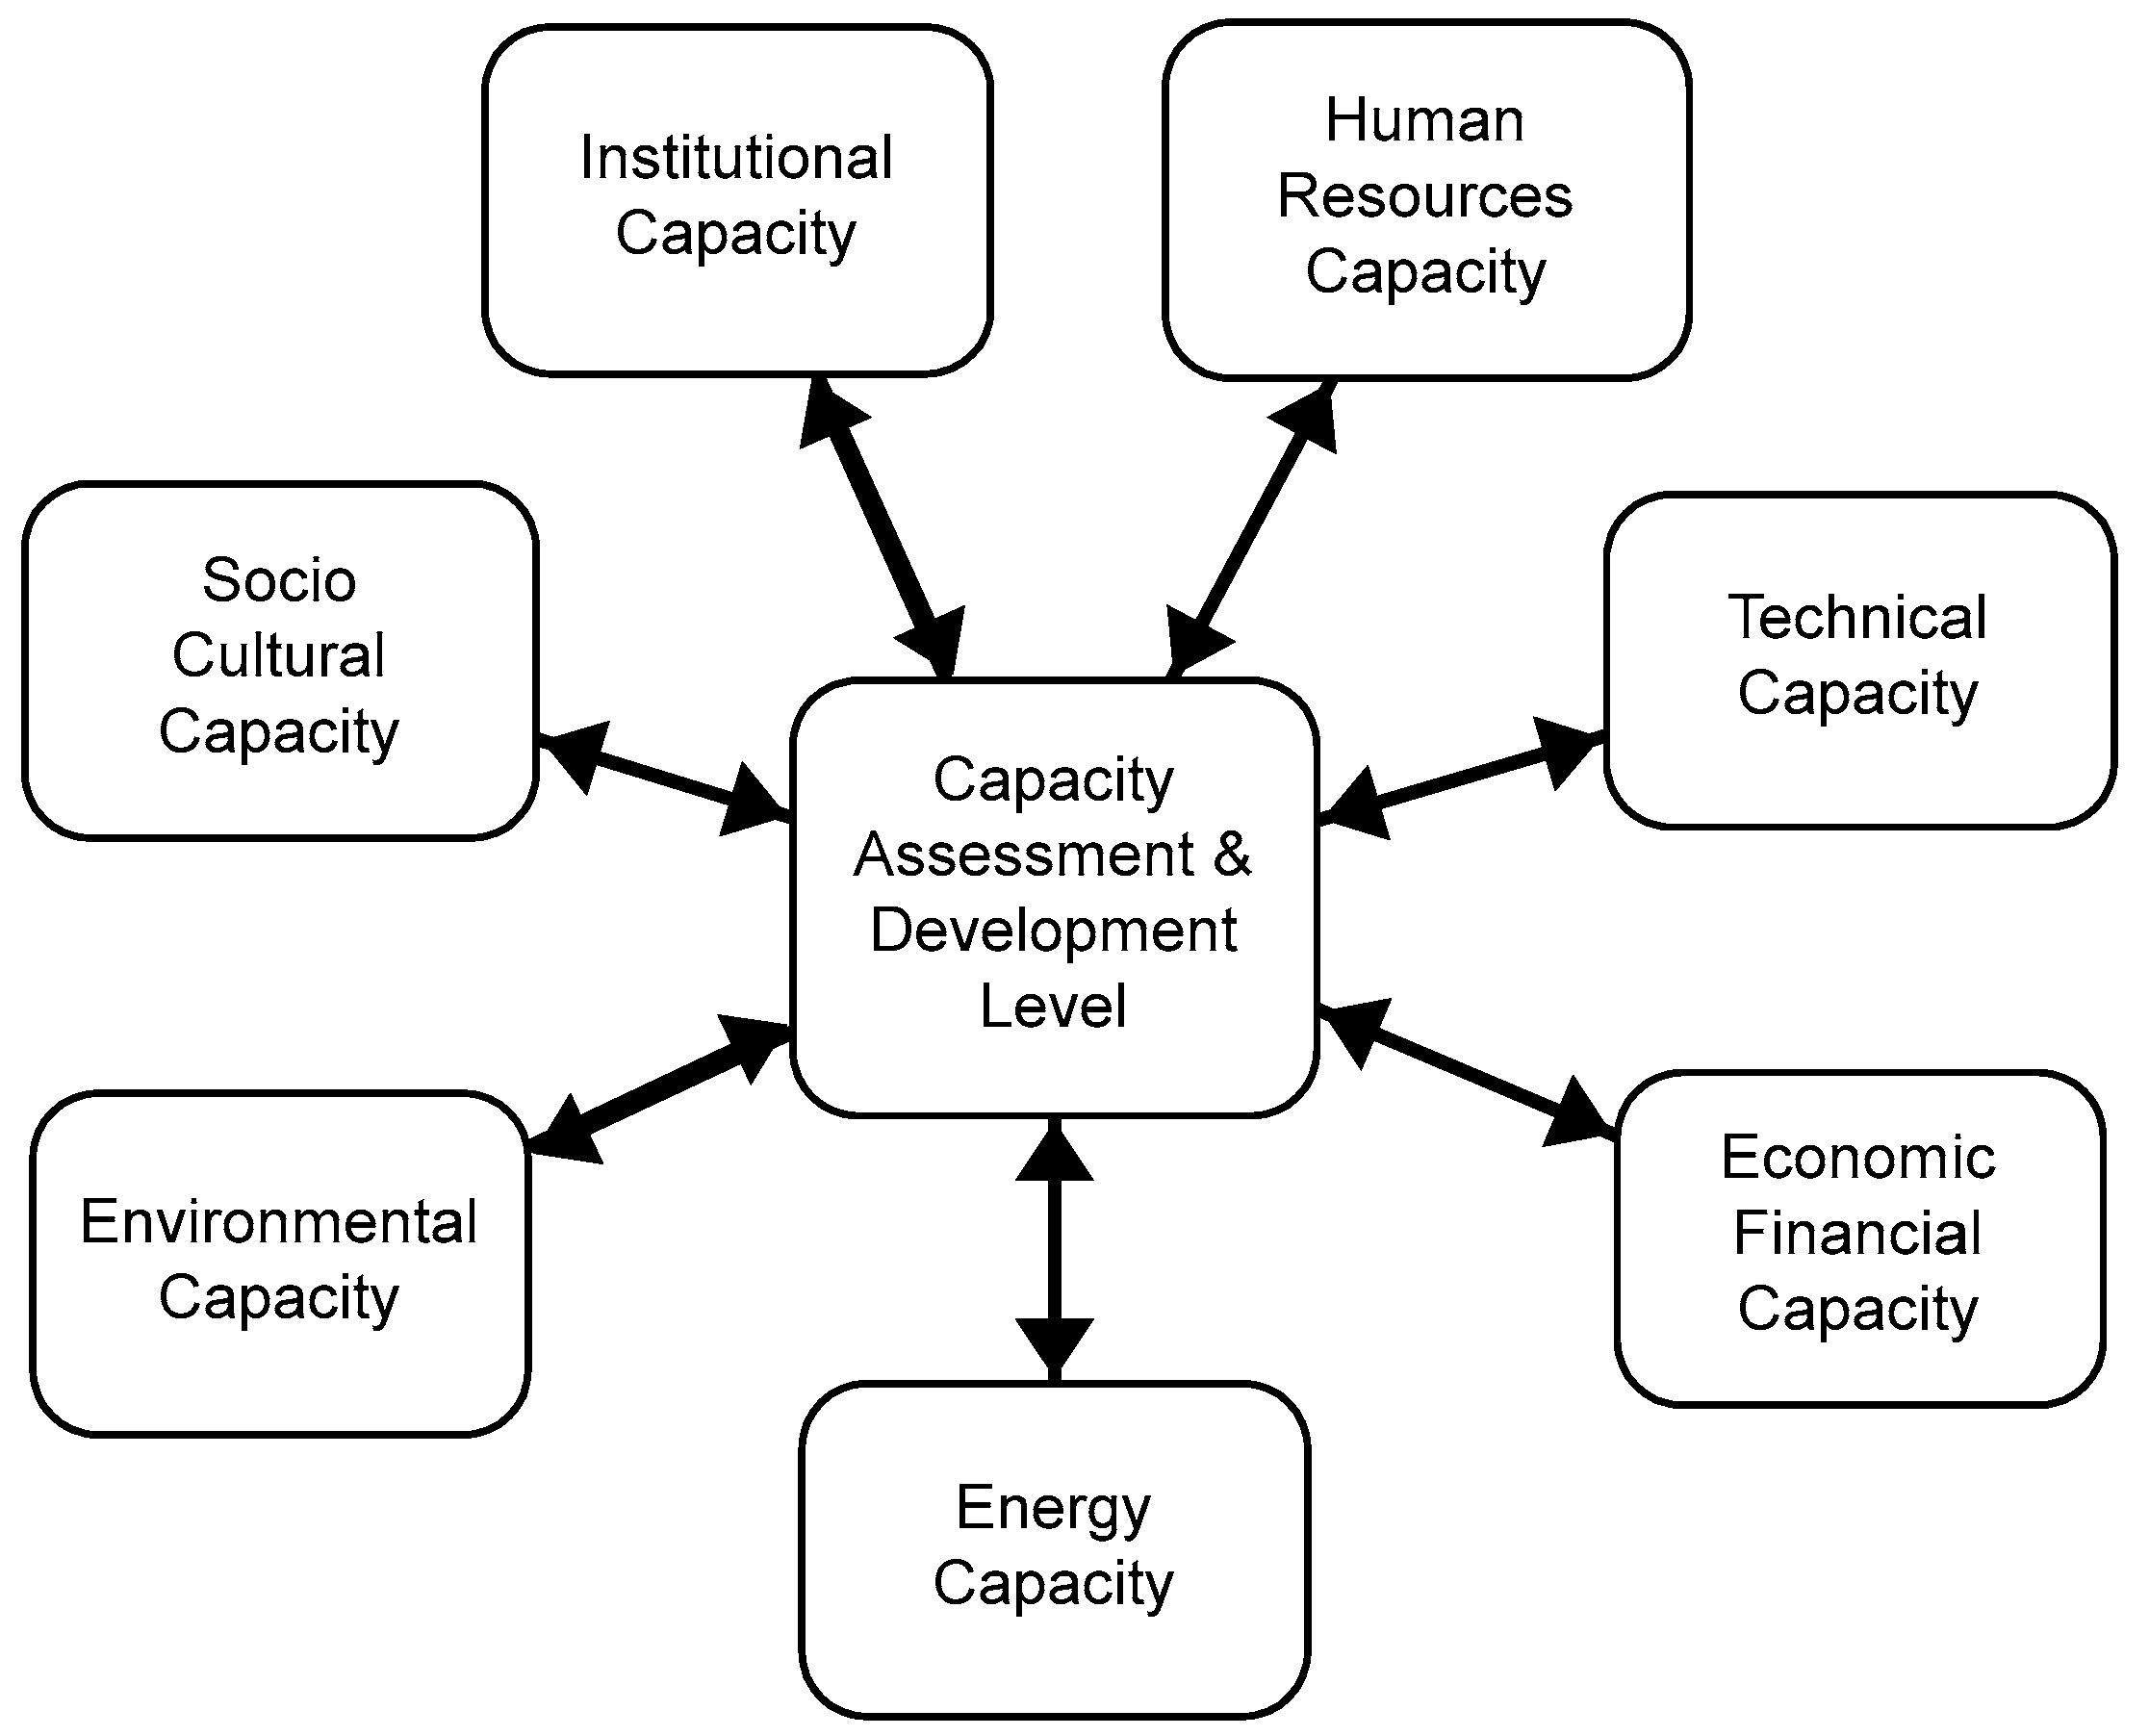
Figure 4 shows an SD model consisting of seven capacity modules. The central module determines the community capacity assessment CA and community capacity level CCL necessary to deliver a specific type of service. It also accounts for how each category of capacity influences the other six based on the scores in Table 4.
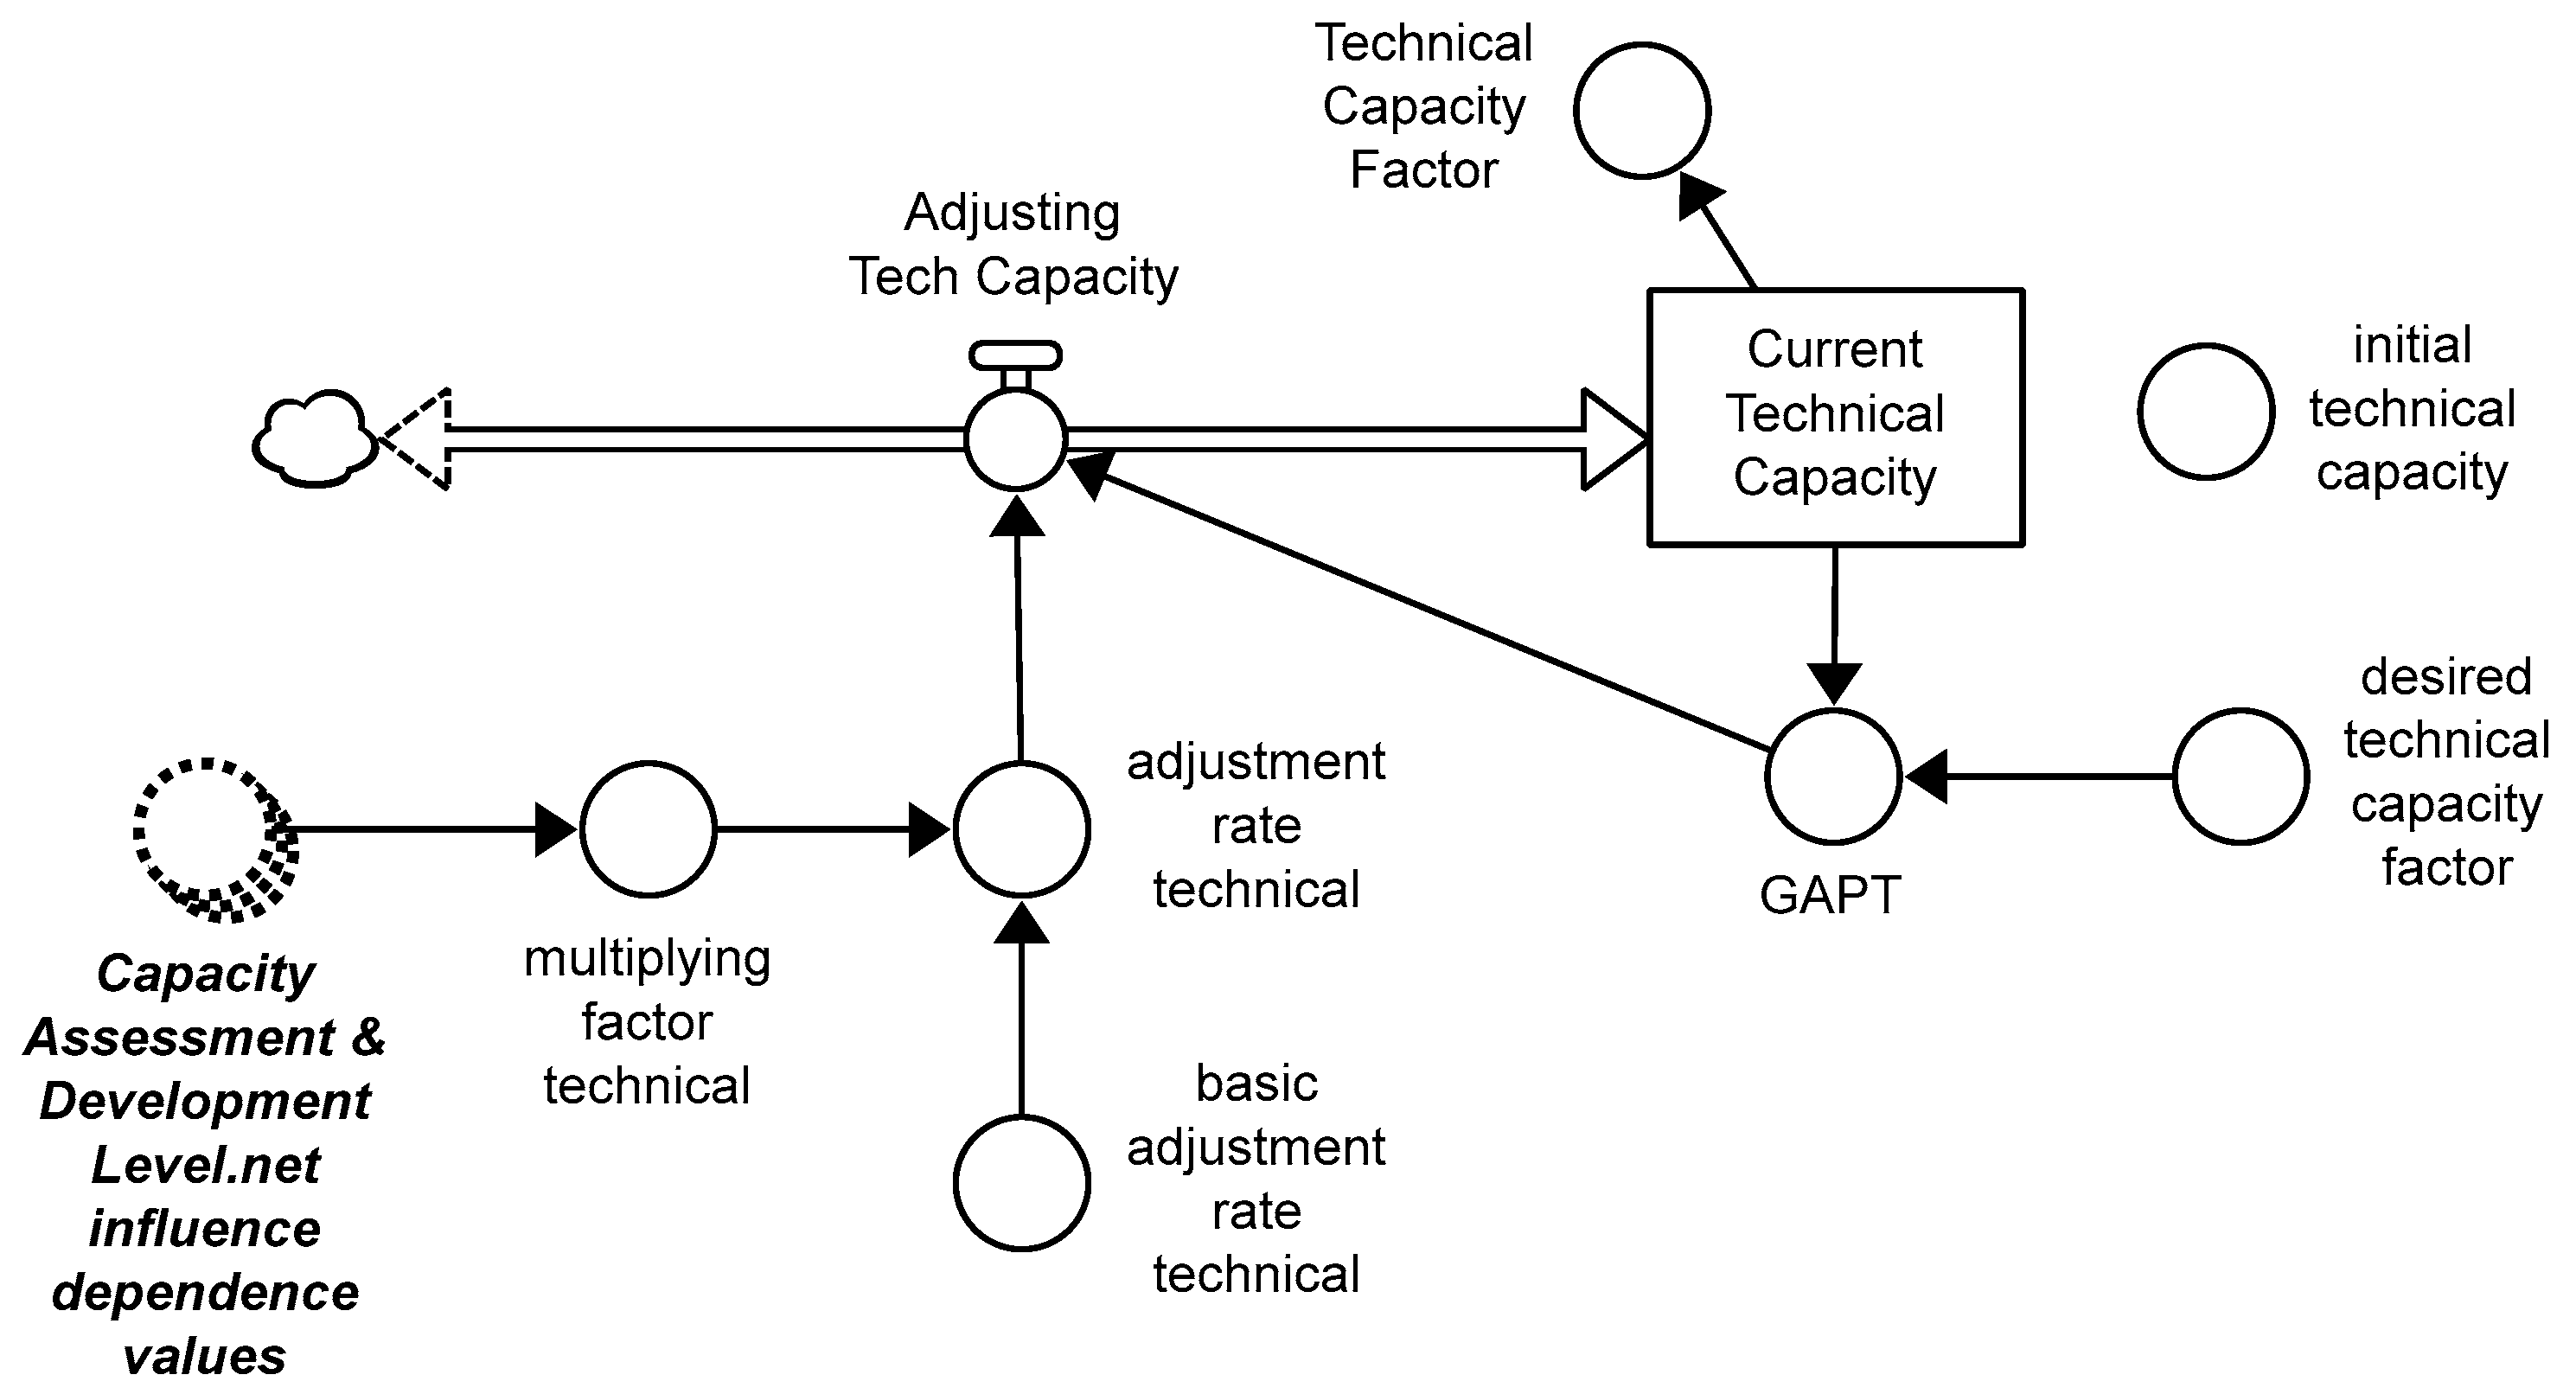
Figure 5 shows the structure of the technical capacity module; all other modules have the same structure. The capacity factor CFi (technical capacity) is assumed to change with time, starting with an initial value and at a rate, dCFi/dt, that depends on a basic adjustment rate multiplied by a multiplying factor that captures the dependency (sensitivity) of the capacity of interest on the other ones. The rate of capacity change also depends on the gap between the current value of the capacity factor and a desired value. A biflow is used in Figure 5 to account for possible increases or decreases in the capacity factor over time.
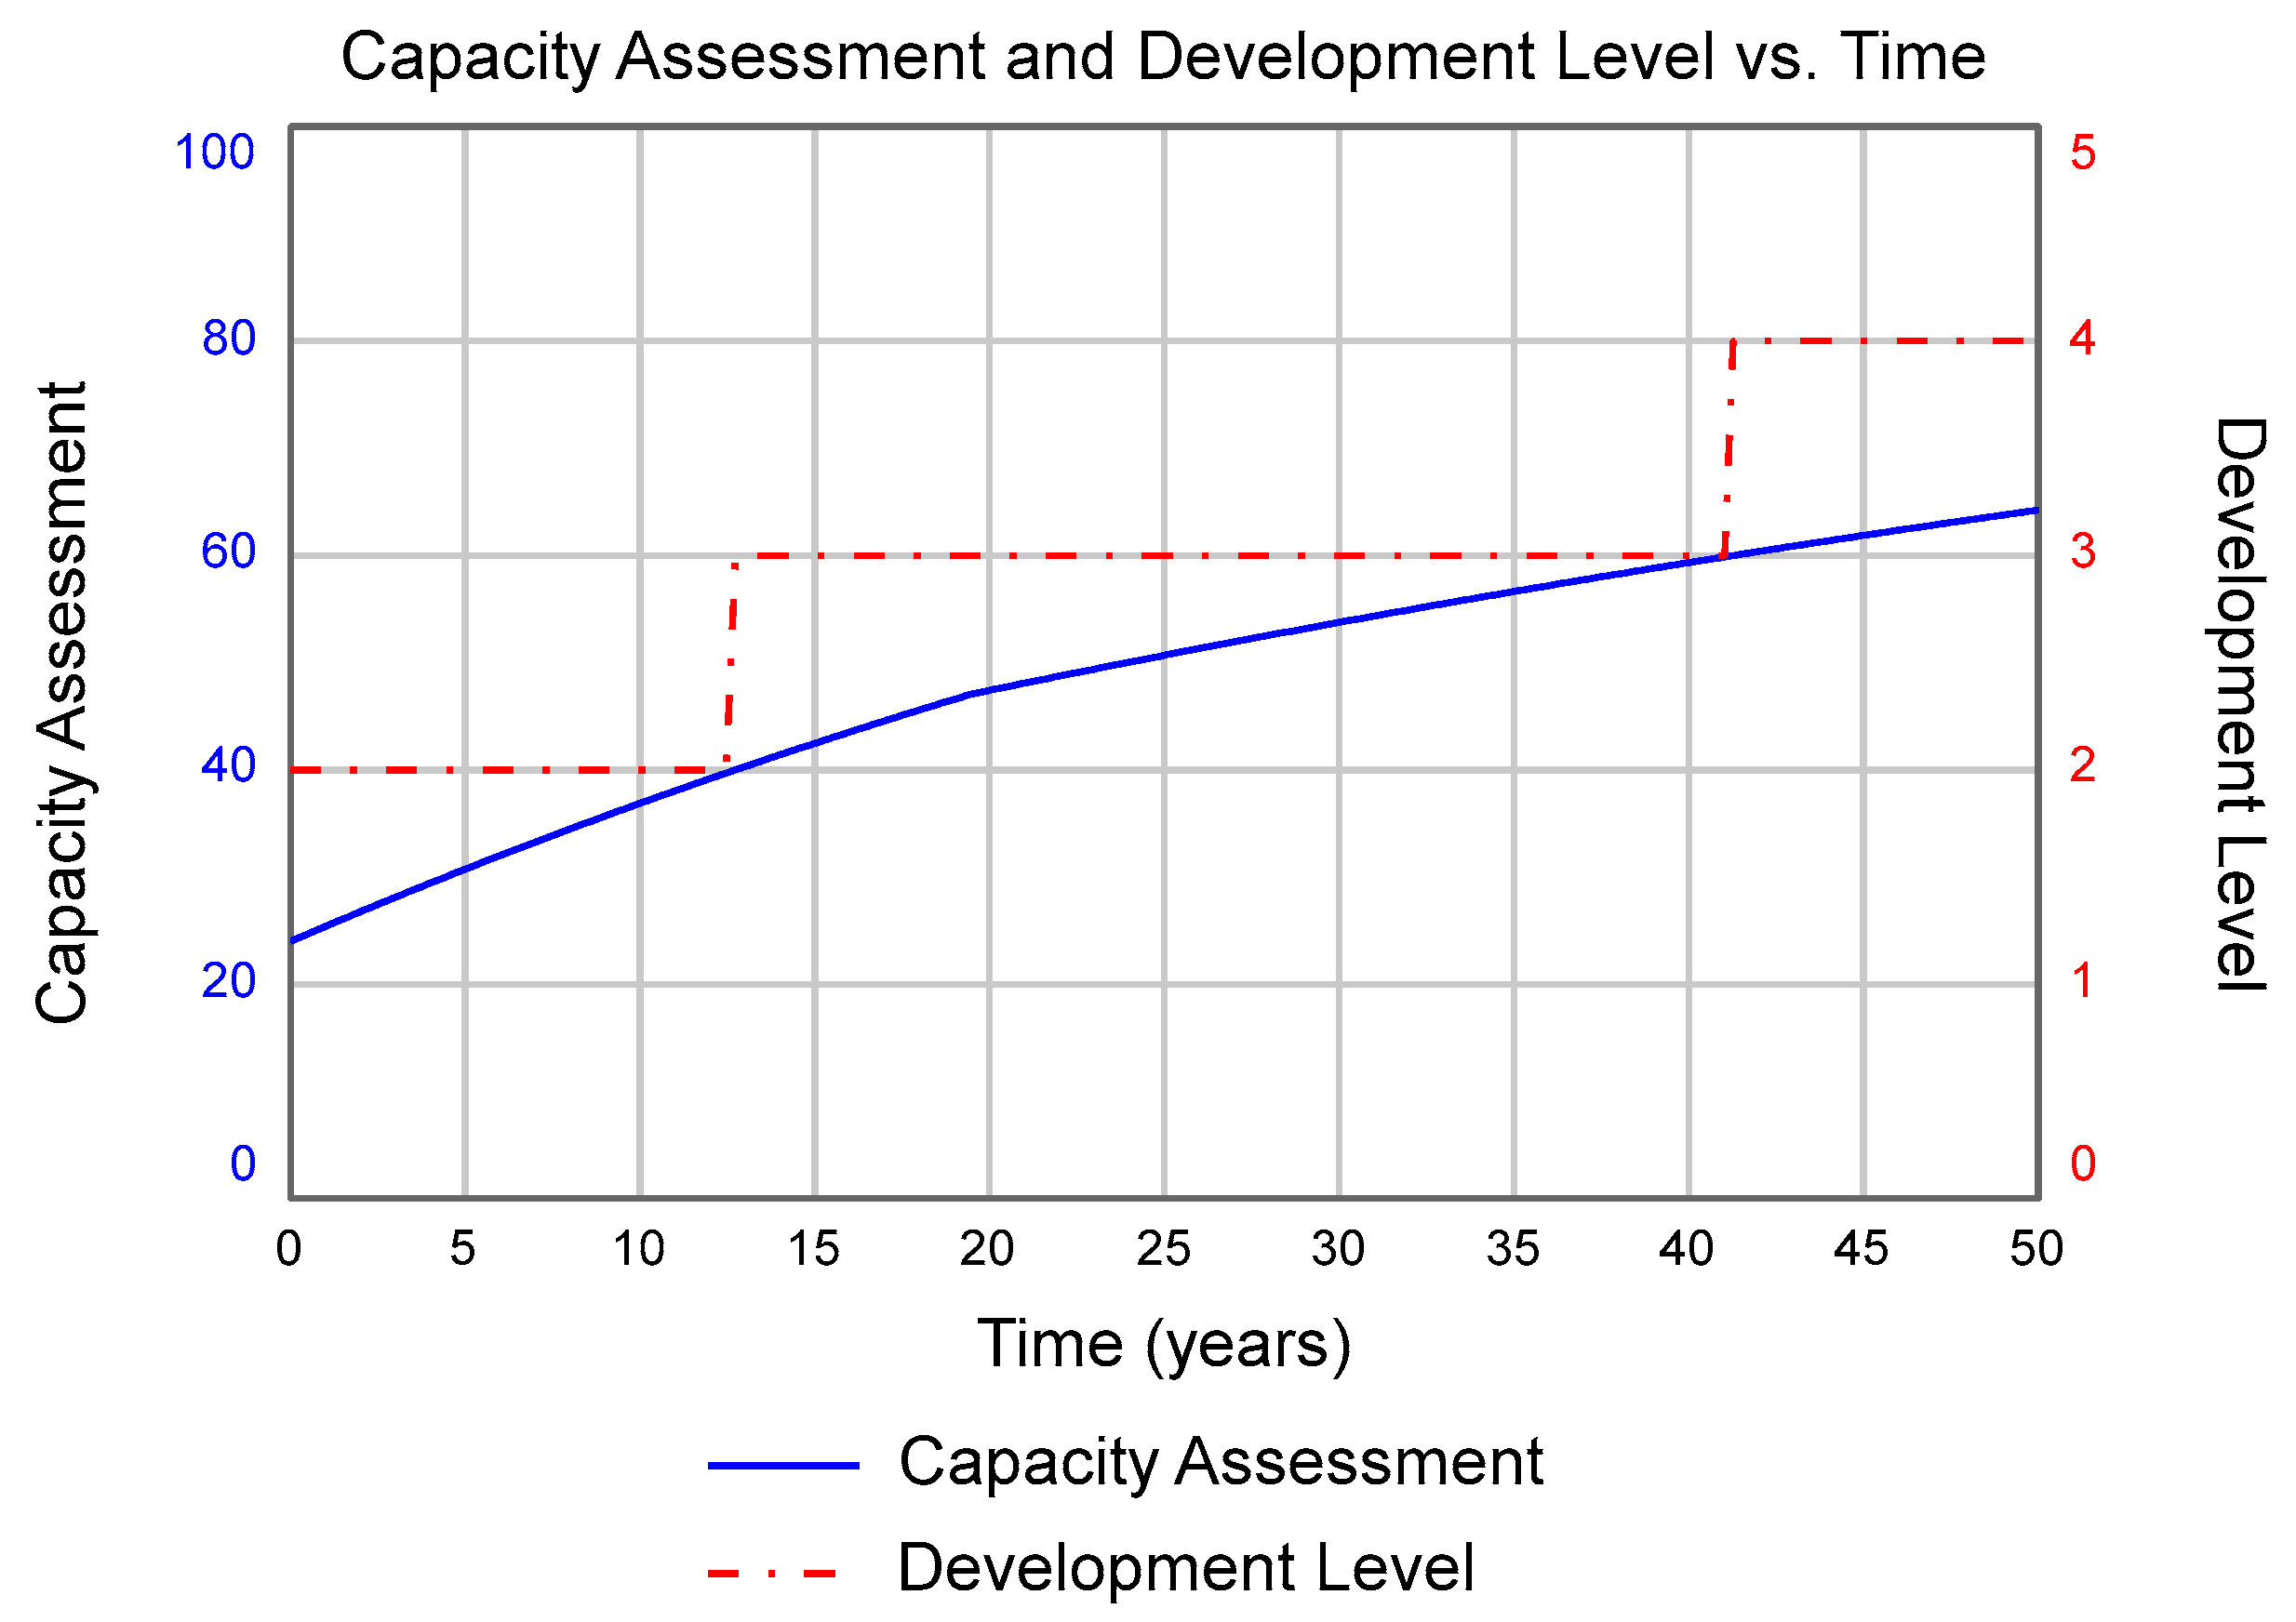
Figure 6 shows an example of applying the SD model to the case study of wastewater and sewage treatment (WSM) described in Table 1. The initial values of the capacity factors were selected from that table, all desired capacity factors were taken equal to 100, and all basic adjustment rates equal to 0.01/year. The multiplying factors for each type of capacity are equal to the average values of dependency in Table 4. They are interpreted as an average measure of how sensitive each capacity type is to the others.
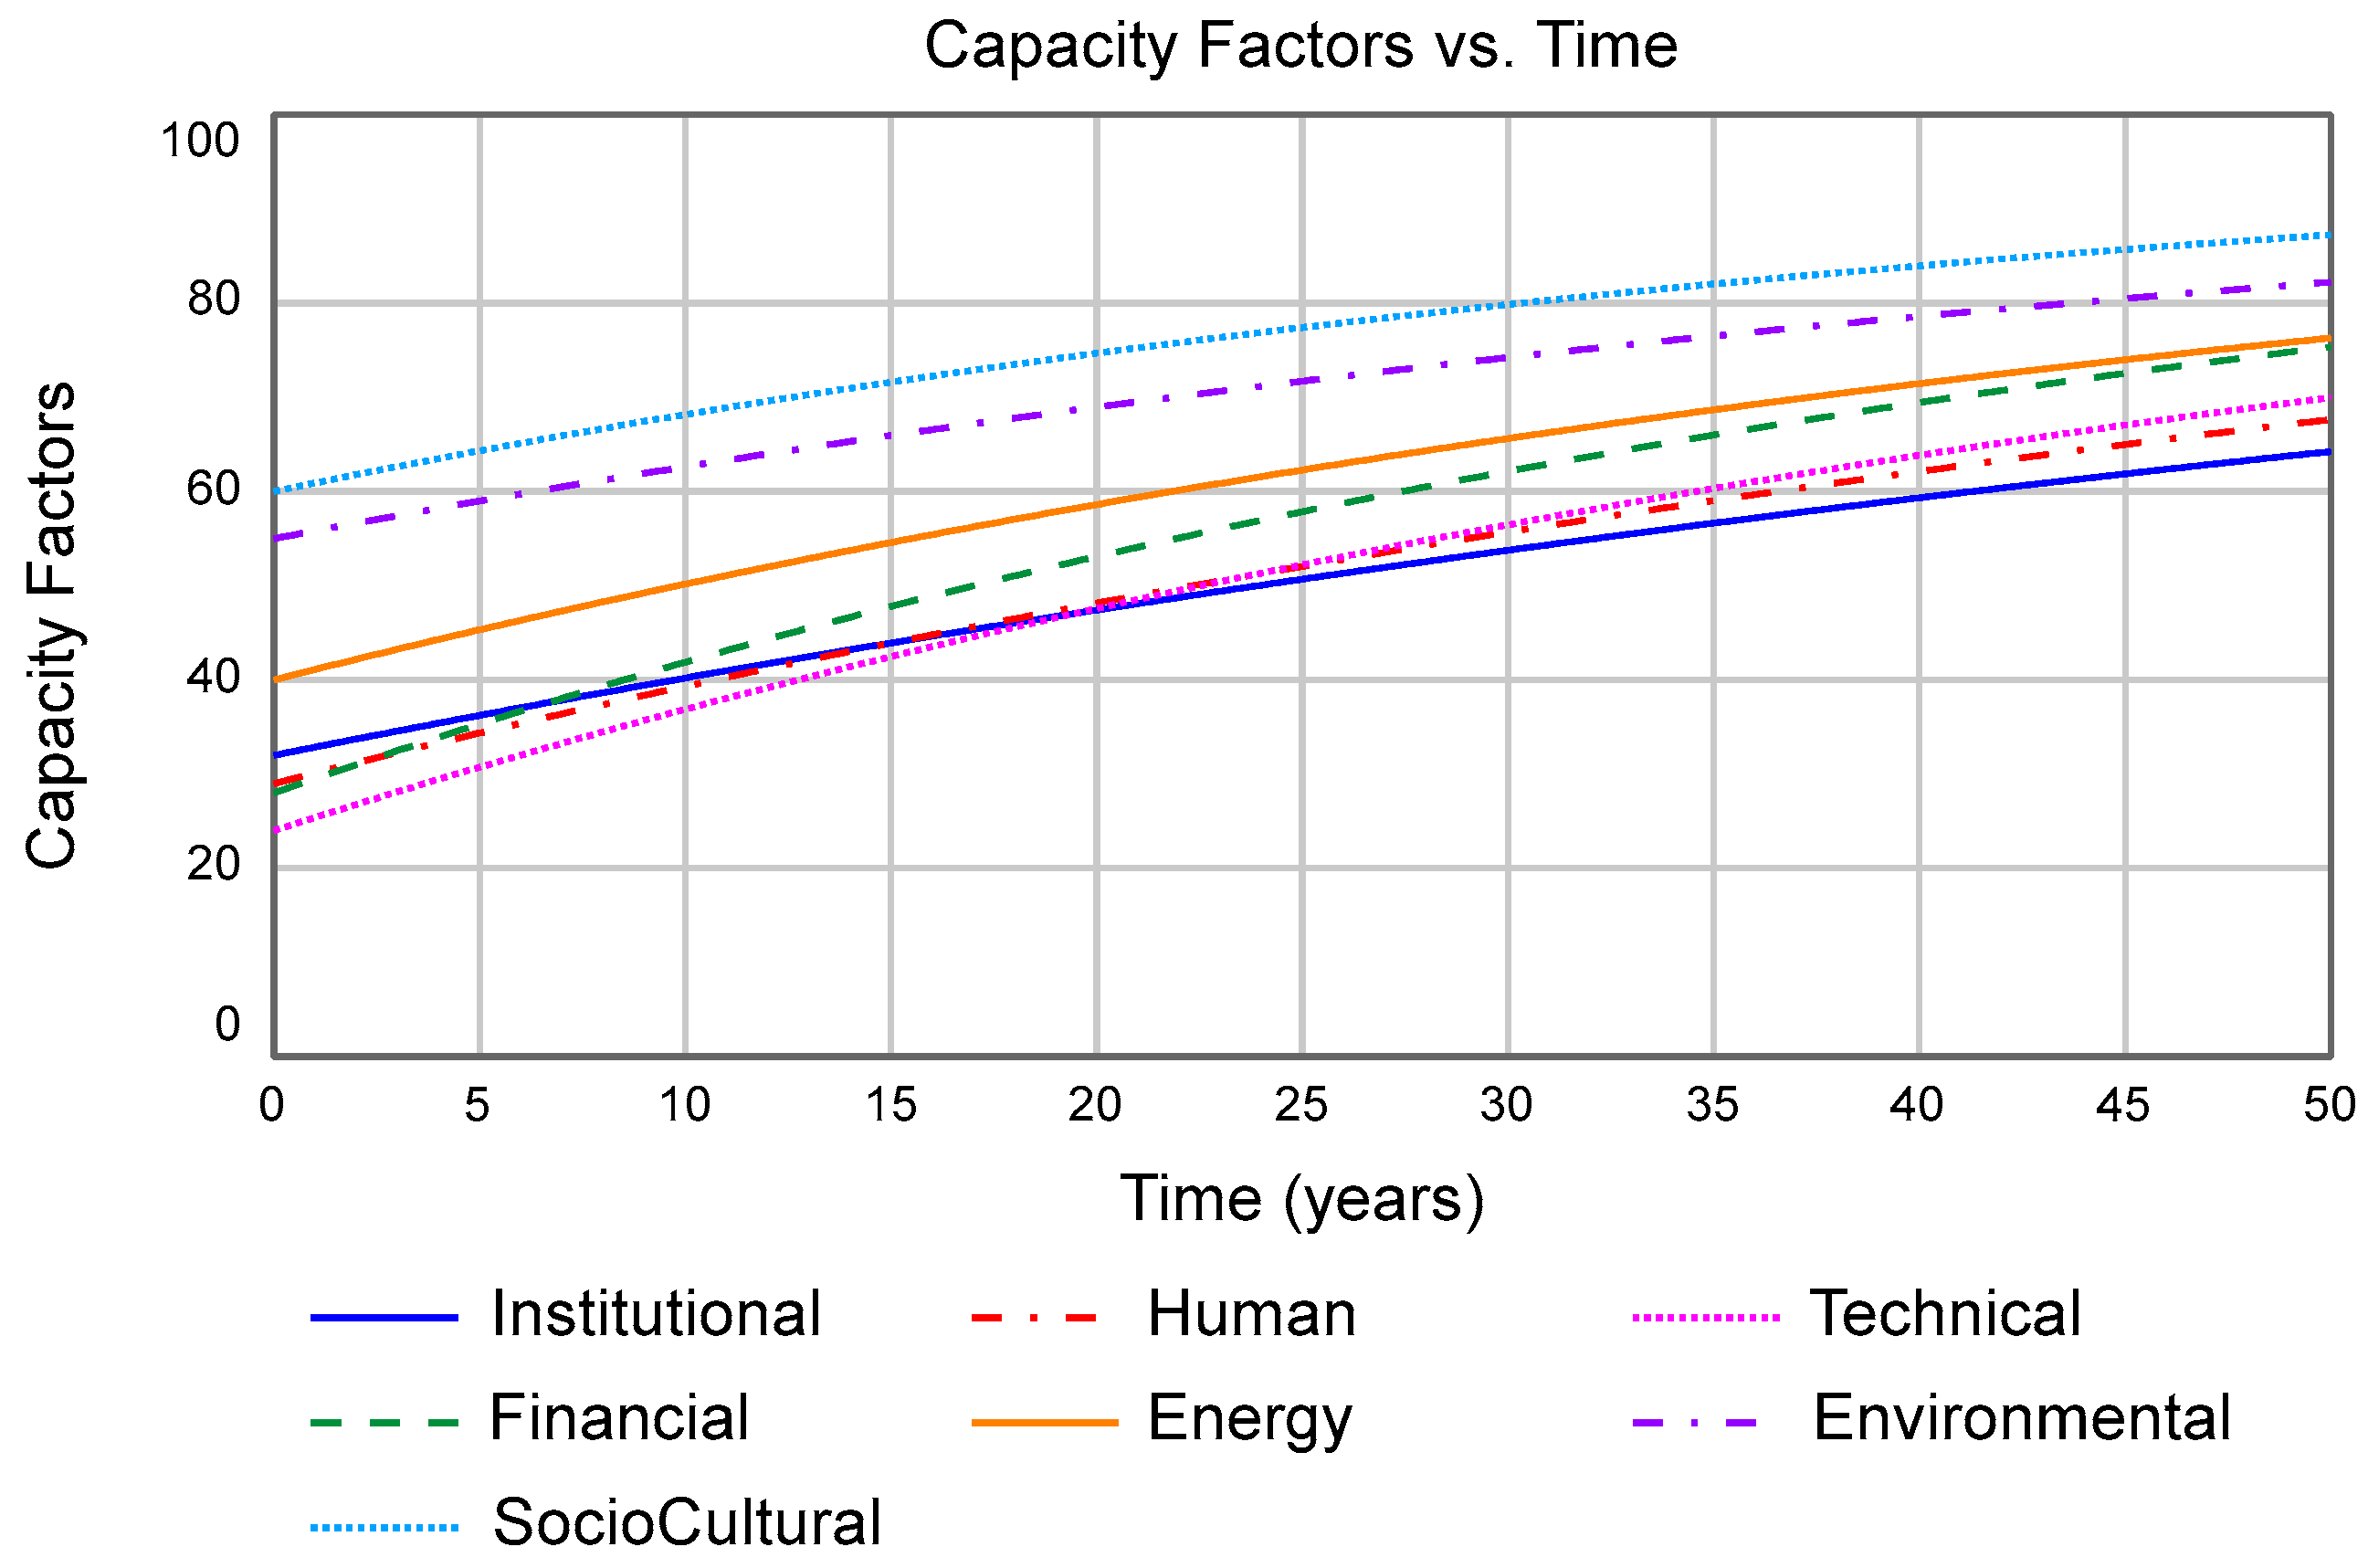
In Figure 6, the community capacity assessment CA increases over time, starting with an initial value of 24 and a community capacity level of 2. Over 50 years, the capacity assessment rises to a value of 64, and the community transitions from being initially only able to manage systems for small collections of residential units (CCL = 2) to have the capacity to manage community based-systems (CCL = 3) from years 12 to 41, and to serve multiple communities from a centralized system (CCL = 4) until year 50. Figure 7 shows how the seven individual factors increase with time. The weakest capacity type is technical for about 20 years but changes to institutional after that. In other words, any community development action plan and strategy will have to adapt to community changes over time. A user-friendly version of this model can be found on the web at https://exchange.iseesystems.com/public/bernardamadei/capacity.
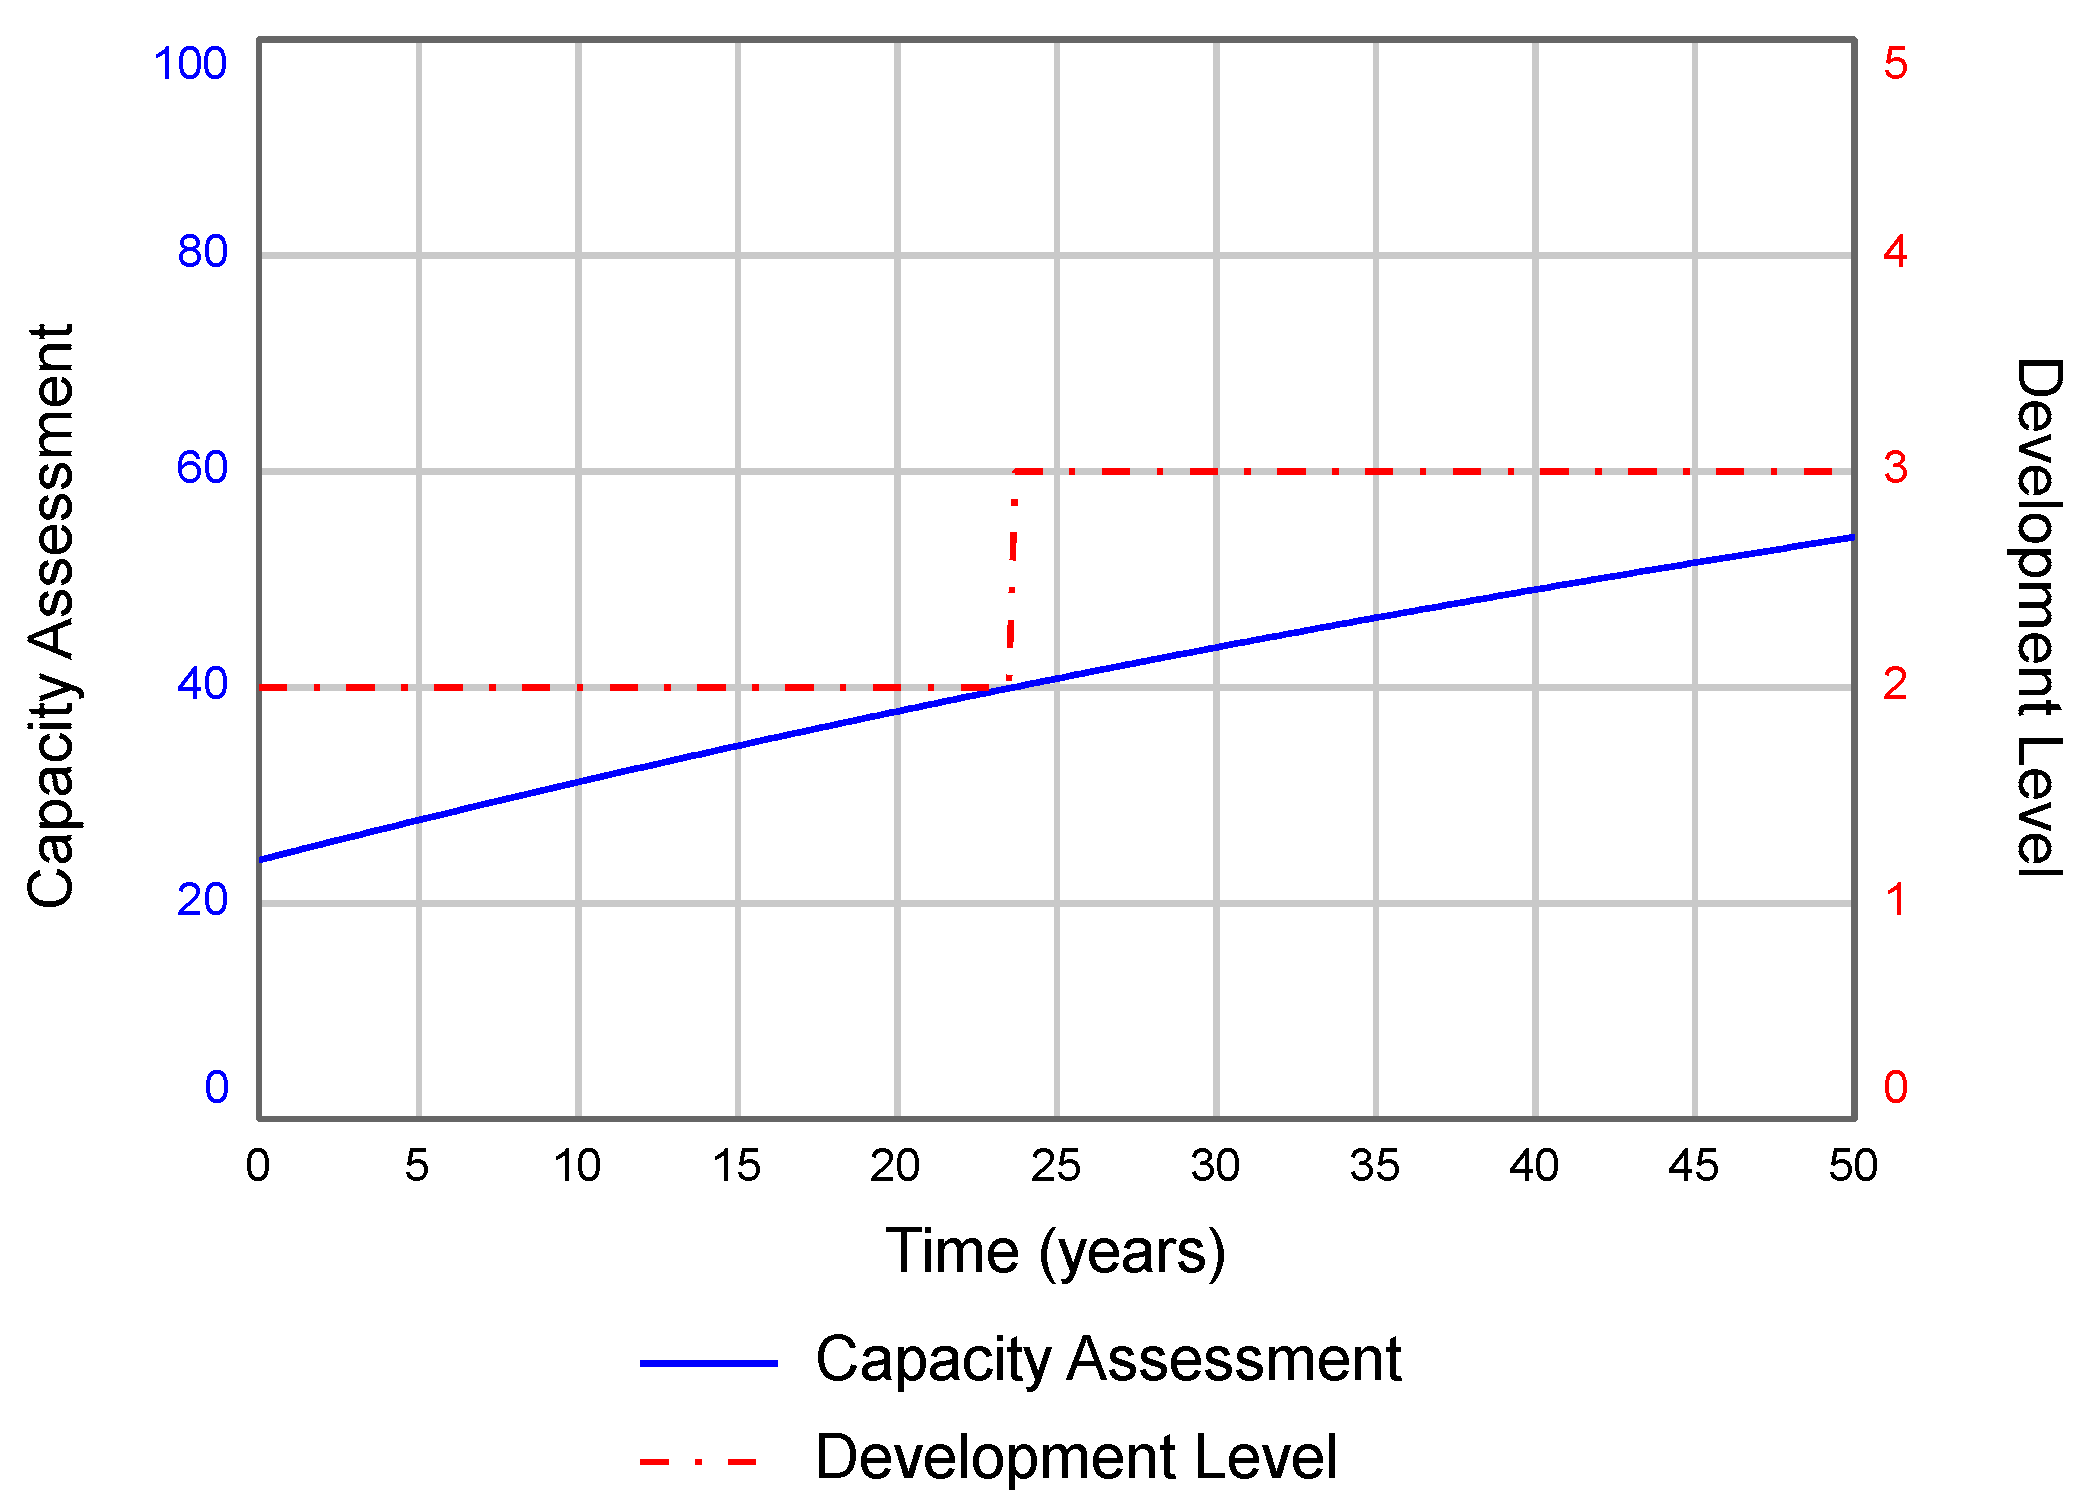
The same analysis was carried out for comparison sake, assuming no dependency among all types of capacity. As shown in Figure 8, the capacity assessment reaches a value of 54 after 50 years, and the community capacity level never reaches a value of 4. Technical capacity remains the weakest link over the 50 years.
3.3. Additional Analysis
The conclusions reached above are interesting but not surprising since all components in the double capacity matrix of Table 4 are enabling. In the present formulation (Figure 5), the enabling influence increases the actual adjustment rates of all capacity categories even though their basic adjustment rates are constant. Compared to Figure 7, Figure 6 shows that accounting for the enabling influence among the different capacity types in the analysis gives a more optimistic picture of how the community can quickly provide improved wastewater and sewage treatment over time.
For comparison, an additional capacity analysis was carried out to explore how a constraining environment among all seven capacity types would affect the capacity assessment. In this case, all 72 offdiagonal terms in Table 4 were assumed to have negative values; in other words, each type of capacity negatively influences the others. The constraining influence can be low (−1), medium (−2), or strong (−3). As a result, all net influence and dependence values of Table 2 and the multiplying factors in each module of Figure 4 become negative. In this example, all basic adjustment rates were taken equal to 0.001/year.
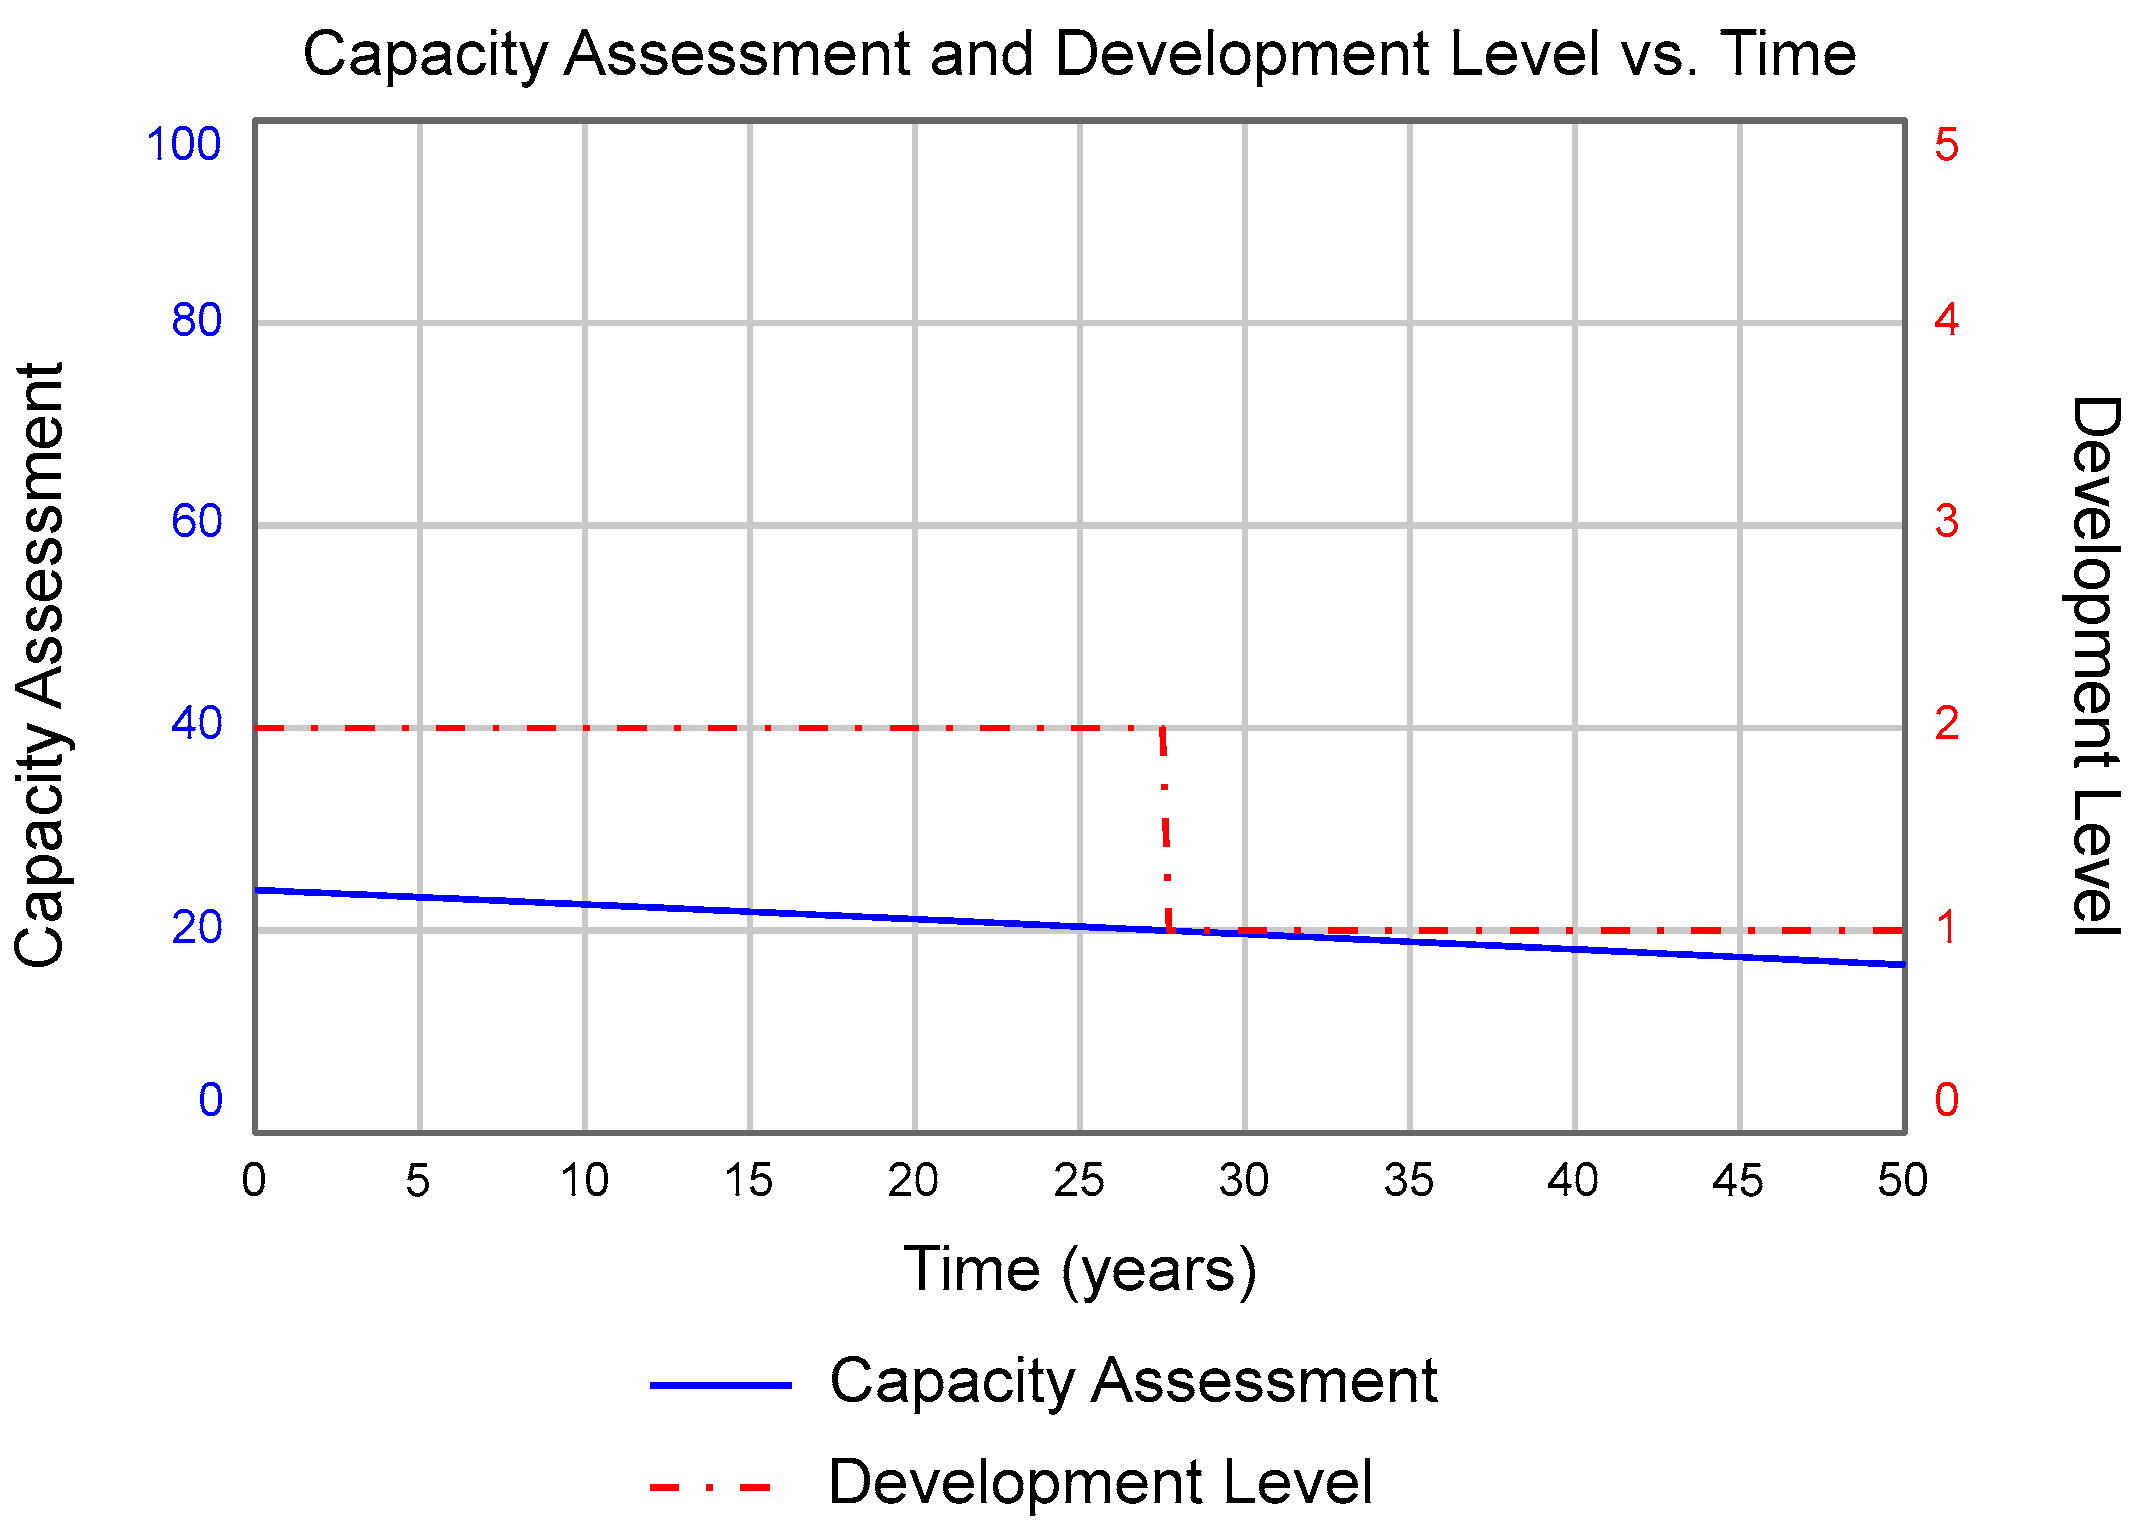
Figure 9 shows that even though the basic adjustment rates are positive, the capacity assessment CA decreases from an initial value of 24 to 17 over 50 years due to the constraining influences. The community capacity level decreases from a value of 2 to 1 after 28 years. In other words, the community is losing its capacity to manage the service of wastewater and sewage treatment with time.
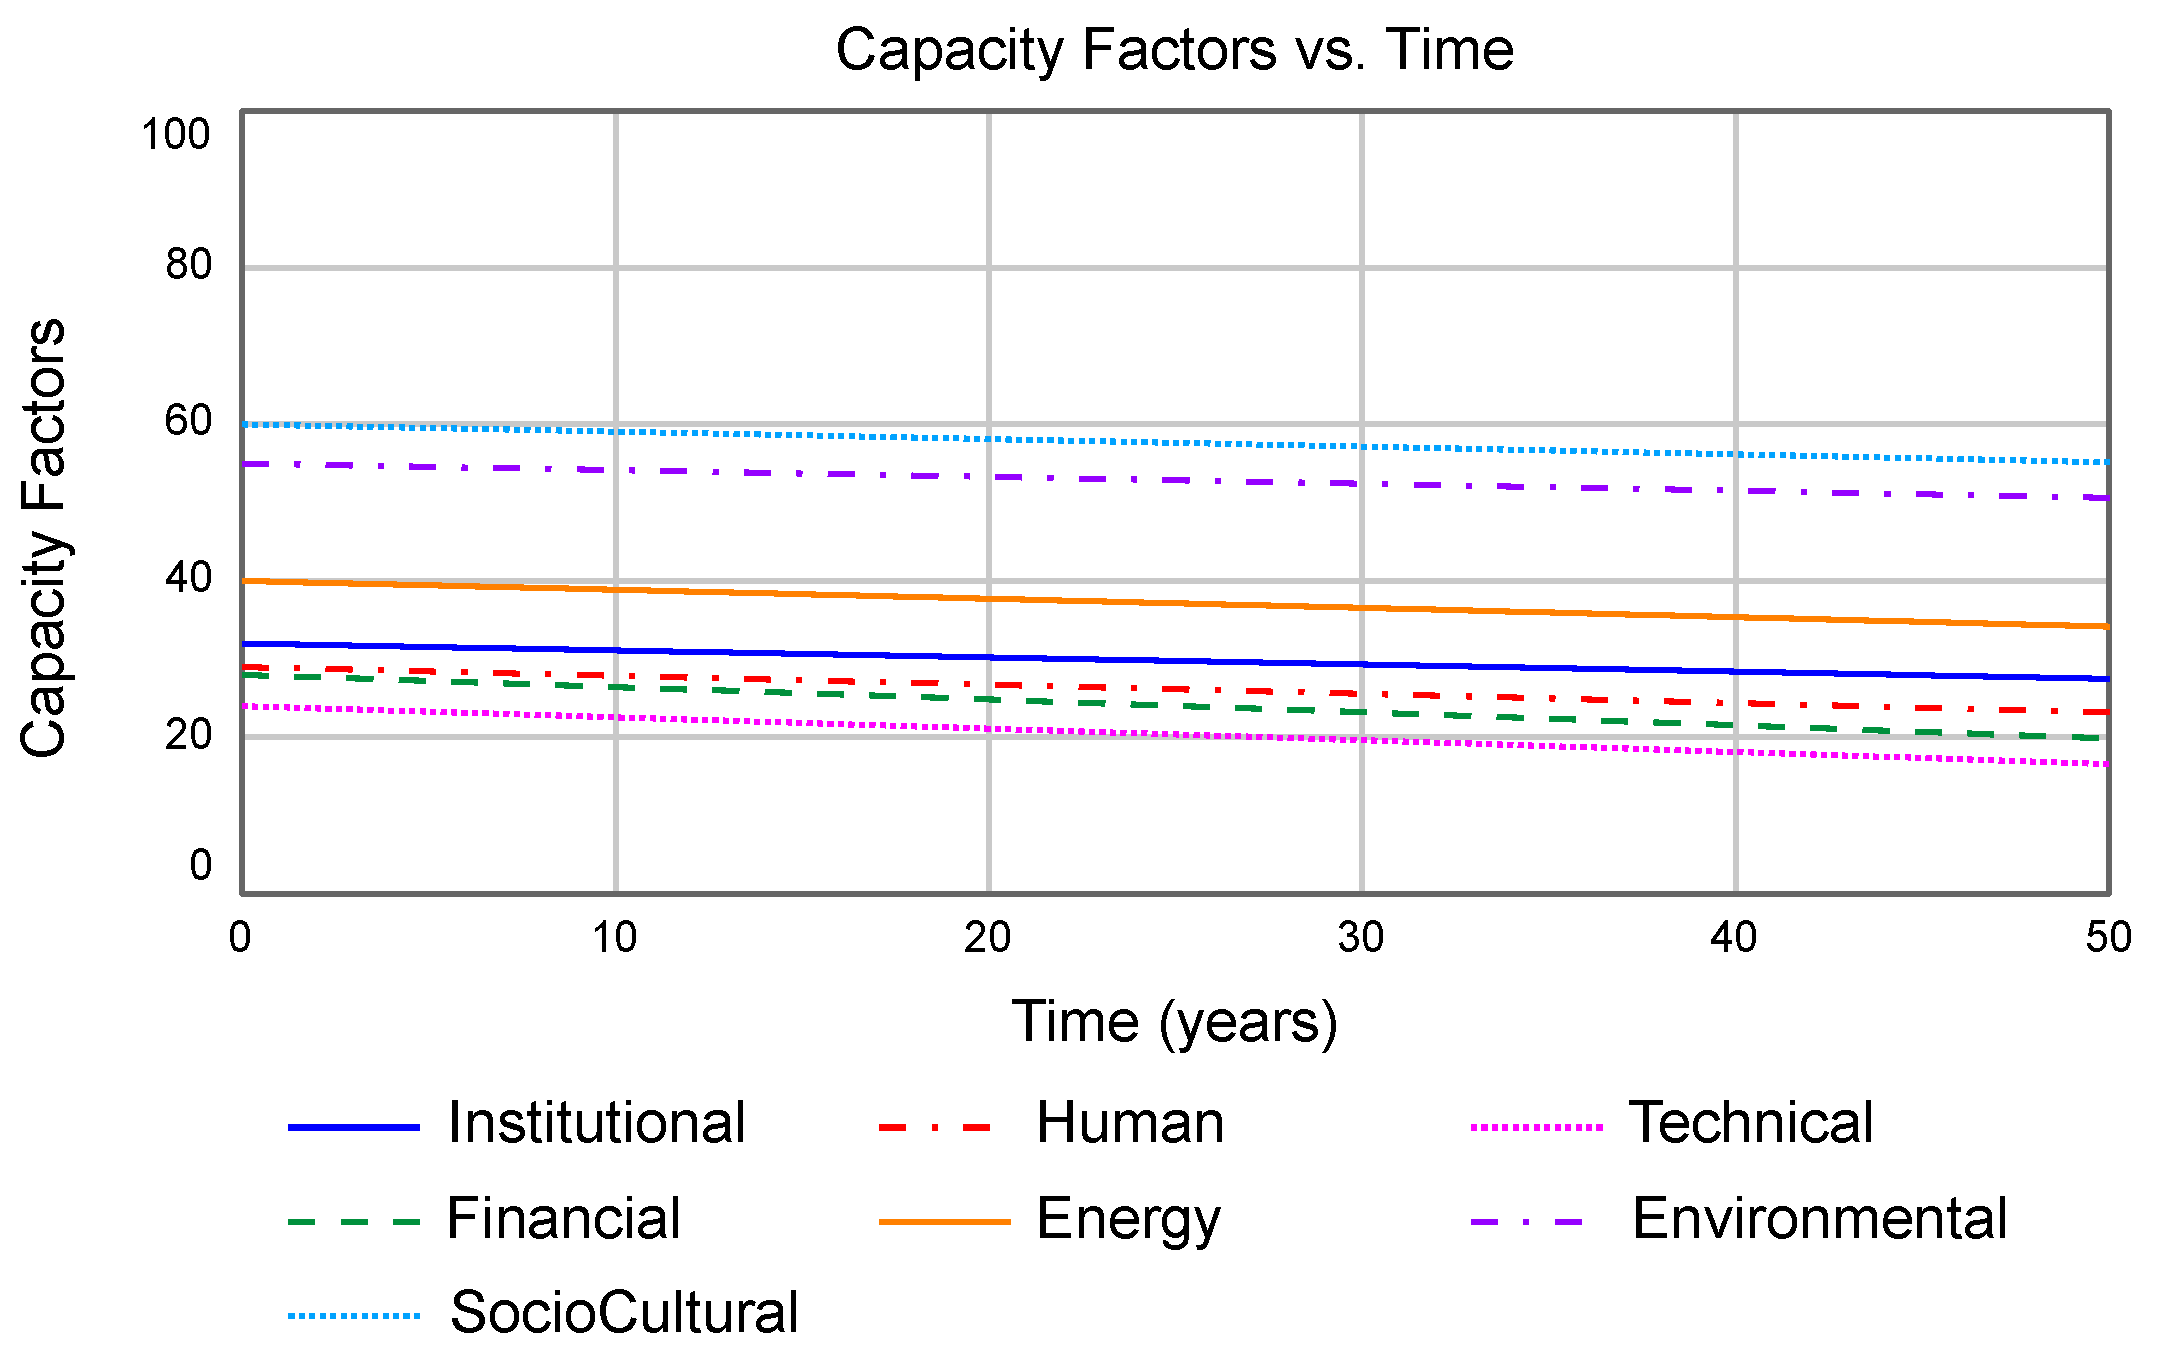
Finally, Figure 10 shows the corresponding decrease of the seven individual factors over time. It can be seen that the weakest capacity type remains technical for 50 years.
3.4. Multi-Service Approach
The approach described above applies to one type of service at a time. The situation becomes challenging when several interdependent types of service need to be provided simultaneously to the community. In that case, the community capacity assessment CA needs to be determined first for each type of service of interest, considering various forms of influence and dependence among the categories of capacity supporting that service (Table 4). In doing so, there is no guarantee, however, that the same type of capacity would constrain all types of service and that the corresponding community capacity levels would be the same for the different types of service. For instance, a community may manage community-based water supply systems (CCL = 3) but cannot manage telecom or transportation services (CCL = 1). In some other cases, managing well one type of service may have direct or indirect consequences on delivering another type of service and requires trade-offs. An example would be deciding on prioritizing water resources for electricity production instead of agriculture, or vice versa.
Accounting for all the linkages at play in providing multiple services at the community level daily requires policymakers and practitioners to adopt advanced system-based decision making. One approach would be to determine the limiting capacity, CA, and community capacity levels for each service type. The service with the lowest CCL value is then addressed first by considering its dependence and influence on the other service types and other community-related limiting factors. Another approach would be to carry out a cross-impact analysis for all services combined. Consider, for instance, two services, the integrated cross-impact matrix for both interconnected services would be (14 × 14) in size, and two inter-related stock-and-flow diagrams similar to that of Figure 1 would have to be created, one per service of interest.
Regardless of the multi-service approach used, deciding which service and which capacity type of that service to address first will impact the choice of technology and infrastructure needed for that service. When considering several service types, the different technical solutions must be coordinated, preferably synergistic, and not create unintended consequences on each other.
4. From Capacity to Resilience
Closely related to community capacity is that of resilience. According to the NRC [46], it is defined as “the ability [of individuals, groups, communities] to prepare and plan for, absorb, recover from, or more successfully adapt to [actual or potential] adverse events.” Another way to look at community resilience is the ability to cope with challenging conditions and adapt to a new normal. In general, community resilience across the literature encompasses four basic tenets: mitigation, preparedness, response, and recovery. Development and sustainable development may follow.
Resilience in community development is often described as an acquired capacity to cope with and adapt to various forms of stress and shock associated with adverse natural and non-natural events, which can be small or large. In some cases, events of extreme extent may lead to disasters which are defined as “a serious disruption of the functioning of a community or a society at any scale due to hazardous events interacting with conditions of exposure, vulnerability, and capacity, leading to one or more of the following: human, material, economic and environmental losses and impacts” [47].
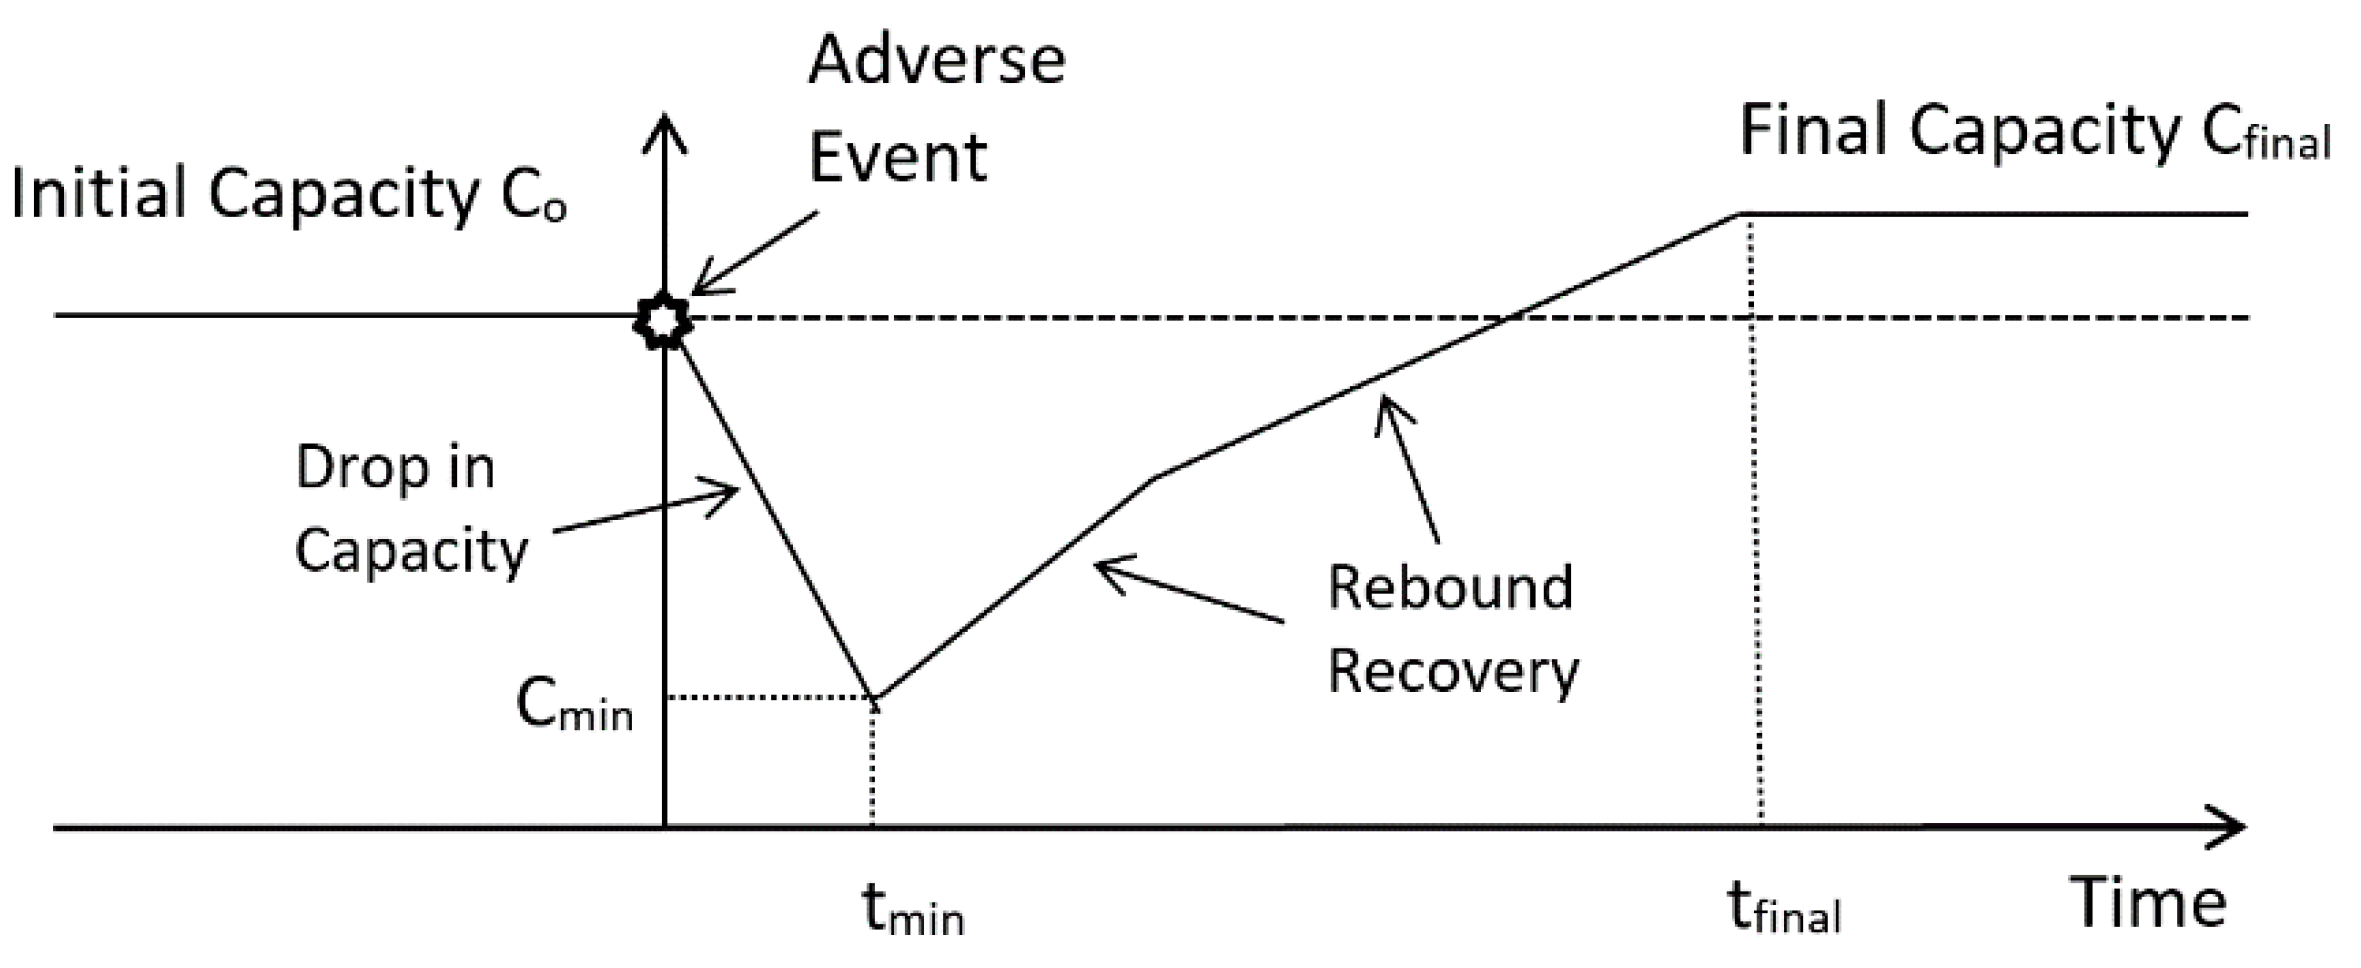
In general, regardless of the initial level of acquired capacity, events are likely to reverse some community development progress, which may have been built over several years or decades. To illustrate that statement, let us consider Figure 11, which shows how the overall capacity of a community C(t) to provide multiple services (e.g., water supply, wastewater and sewage treatment, energy, food, health, telecom, transportation, security, etc.) varies with time following an event or stressor of some sort.
Immediately after the event, the overall community capacity drops from its initial value Co to a lower level Cmin at time tmin. The magnitude and rate of the drop depend on many factors, such as the severity of the stressor, its duration, and its surprising effect on the community. The drop is followed by some response and several periods of recovery (new normal conditions), coping, and adaptation, which hopefully leads, after a certain amount of time tfinal, to a final capacity Cfinal larger than the initial one. This value becomes the new initial community-acquired capacity for the next event. The ratio Cfinal/Co could be interpreted as a possible measure of resilience.
The initial community capacity affects, to a great extent, the size of the immediate capacity drop, the recovery time, and the recovery rate dC/dt. The larger the initial acquired capacity (i.e., the more resilient the community is initially) and better prepared a community is with its mitigation plans, the lower the drop, the faster the recovery, and the steeper the rebound. In developing communities, where the initial resilience (acquired capacity) is low to start with, the drop in capacity will likely be large, the time to recover will be large, and the rebound rate will be low, flat, or even negative. In that case, the response curve in Figure 11 must not go below minimum human standards.
Other factors besides the initial level of capacity may control the overall shape of the curve in Figure 11. They include the risk of secondary disasters, the clarity of policy and direction, collective motivation, good communications, technical assistance, the availability of funds to reboot the economy, cash flow, and the reusing of salvaged material, among others. It is noteworthy that the previous remarks apply to a given community, for a given event, and a specific context and physical scale.
It should be noted, however, that even though a community may possess all of the positive attributes of mitigation, preparedness, response, and recovery, it is still likely that the recovery part of Figure 11 may consist of a series of up and down “new normal” conditions, especially when faced with unusual events [49]. Furthermore, a community may show all the signs of being resilient, yet some parts may be more prepared than others. The opposite is also true as some community parts may be resilient, and yet the entire community is not.
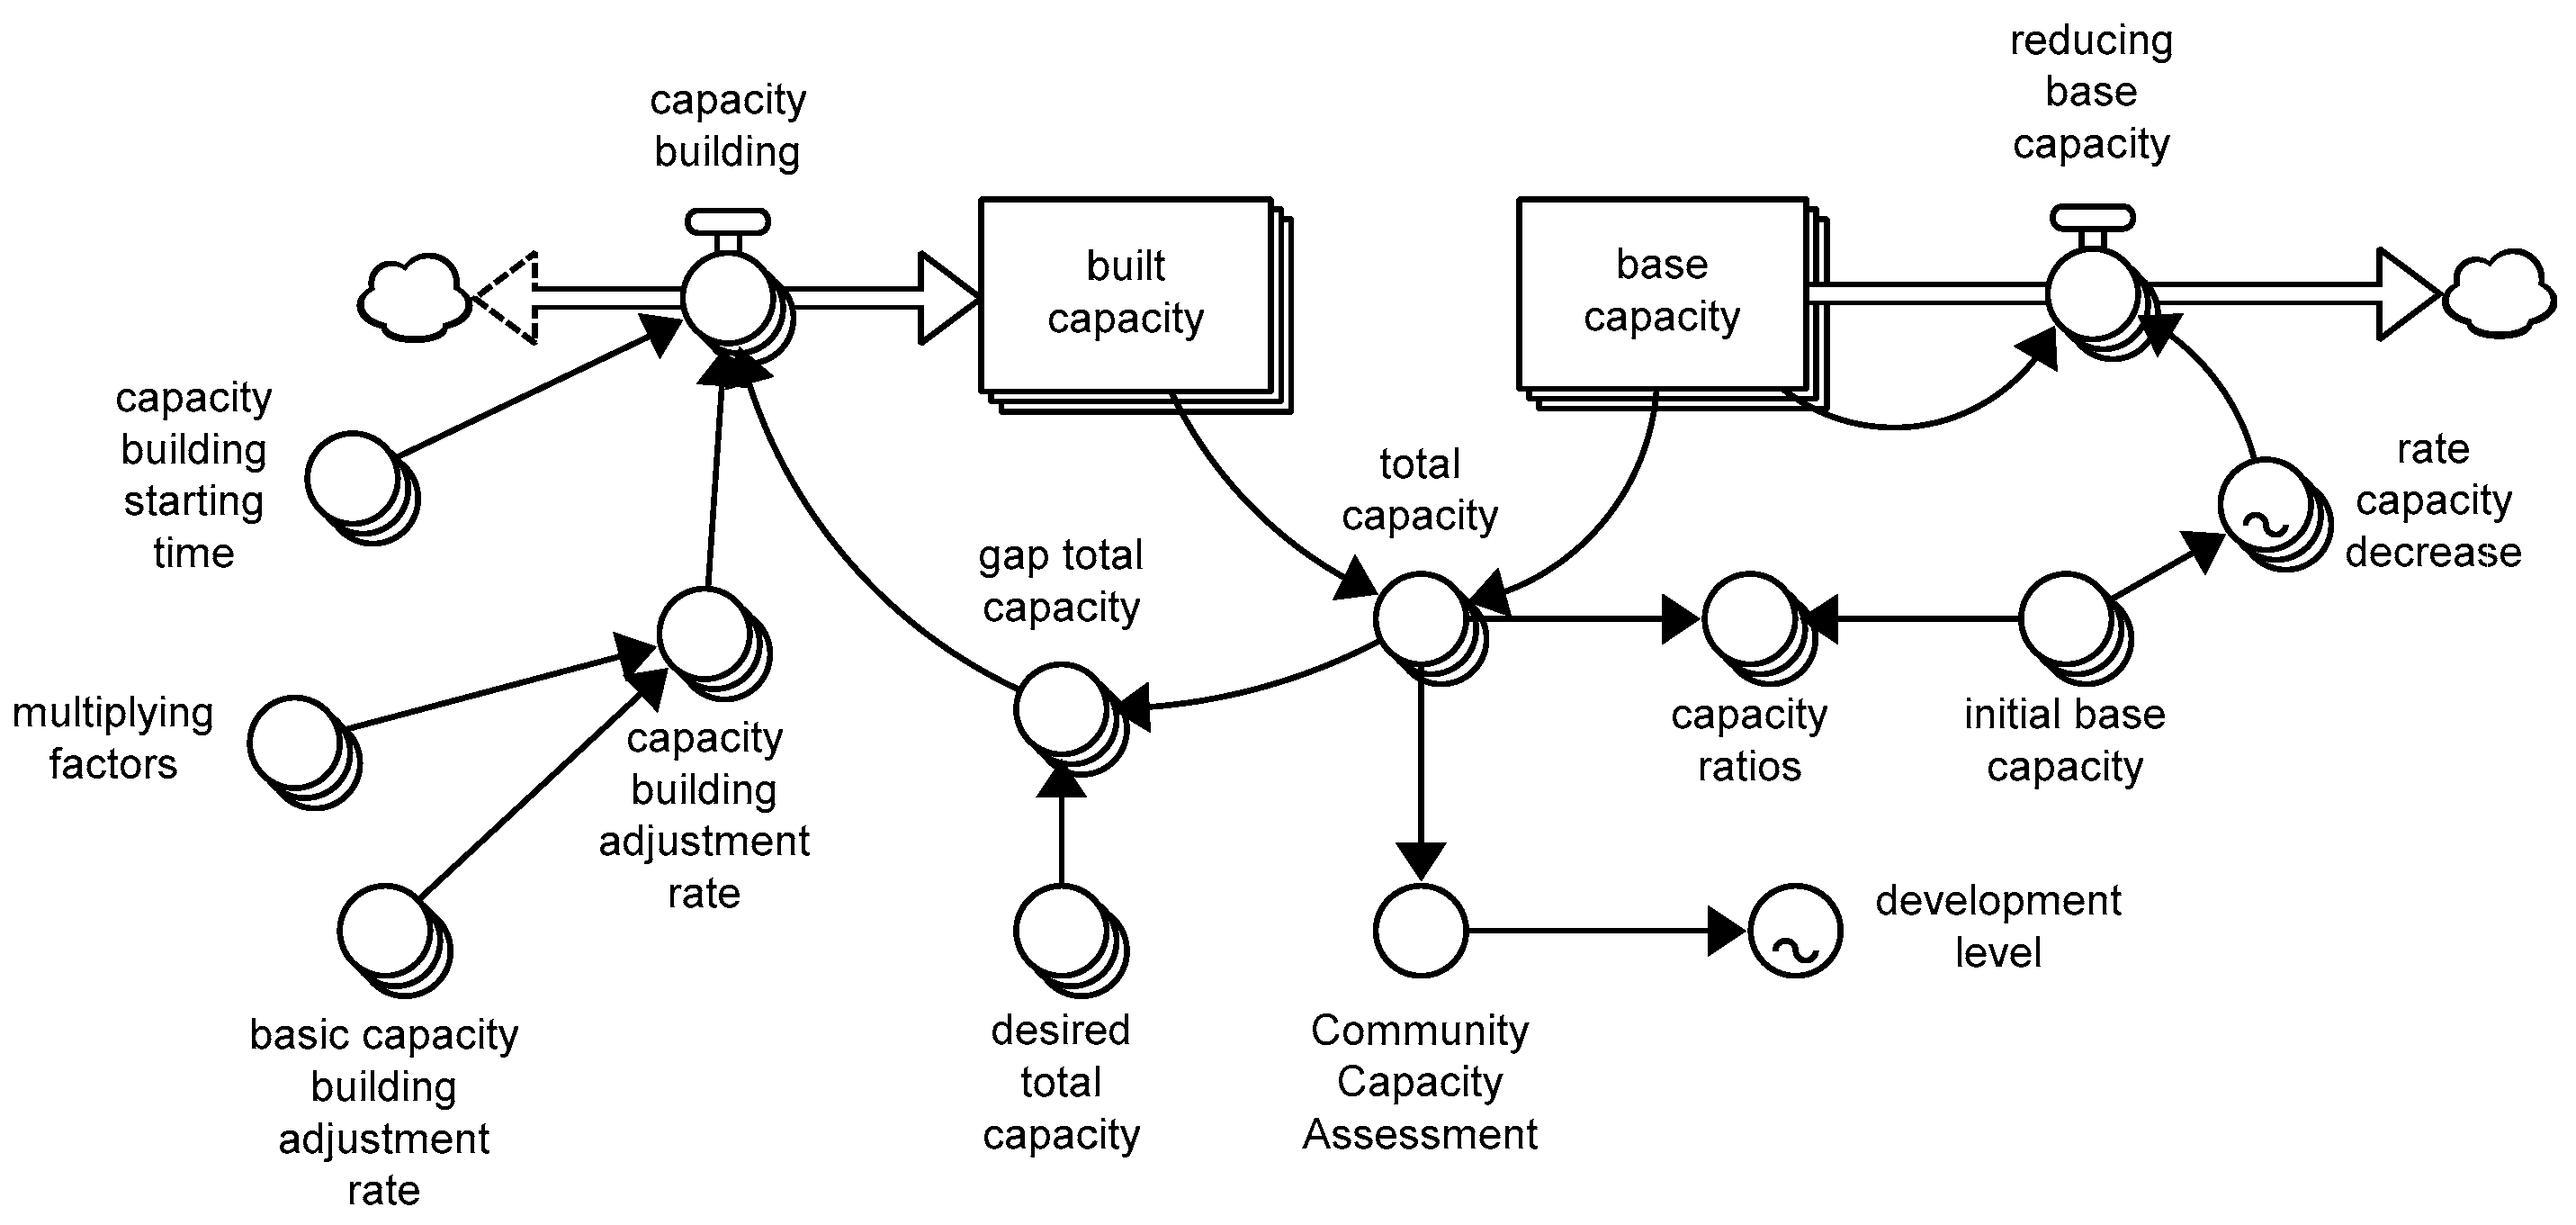
An attempt was made to model the dynamic of Figure 11 using the SD method. The stock-and-flow model is shown in Figure 12 and consists of two variables, base (initial acquired) capacity and built capacity, represented by two stocks. A user-friendly version of this model can be found on the web at https://exchange.iseesystems.com/public/bernardamadei/resilience-capacity.
Each stock is a (7 × 1) array that represents how the seven types of capacity (measured in capacity units, cu) considered in this paper change with time (in months). Following an event at time t =0, all seven types of base capacity are assumed to drop exponentially at a specific rate (per unit of time), which can be constant, time-dependent, or dependent on the value of the initial capacity.
For each type of capacity, capacity building starts at a time selected by the user. It is defined in Figure 12 by a (7 × 1) array “capacity building starting time” expressed in the present example in fractions of a month following the event. At any given time, the total (acquired) capacity is the sum of the decreasing base capacity and the increasing built capacity. For each capacity type, the built capacity is assumed to increase at a rate that is the product between a (fixed or time-dependent) capacity-building adjustment rate and the difference between desired total capacity and current capacity. The rate is the product of a basic rate (0.01/month) and a multiplying factor equal to the average value of dependency in Table 4, which is a measure of how sensitive each type of capacity is to the others.
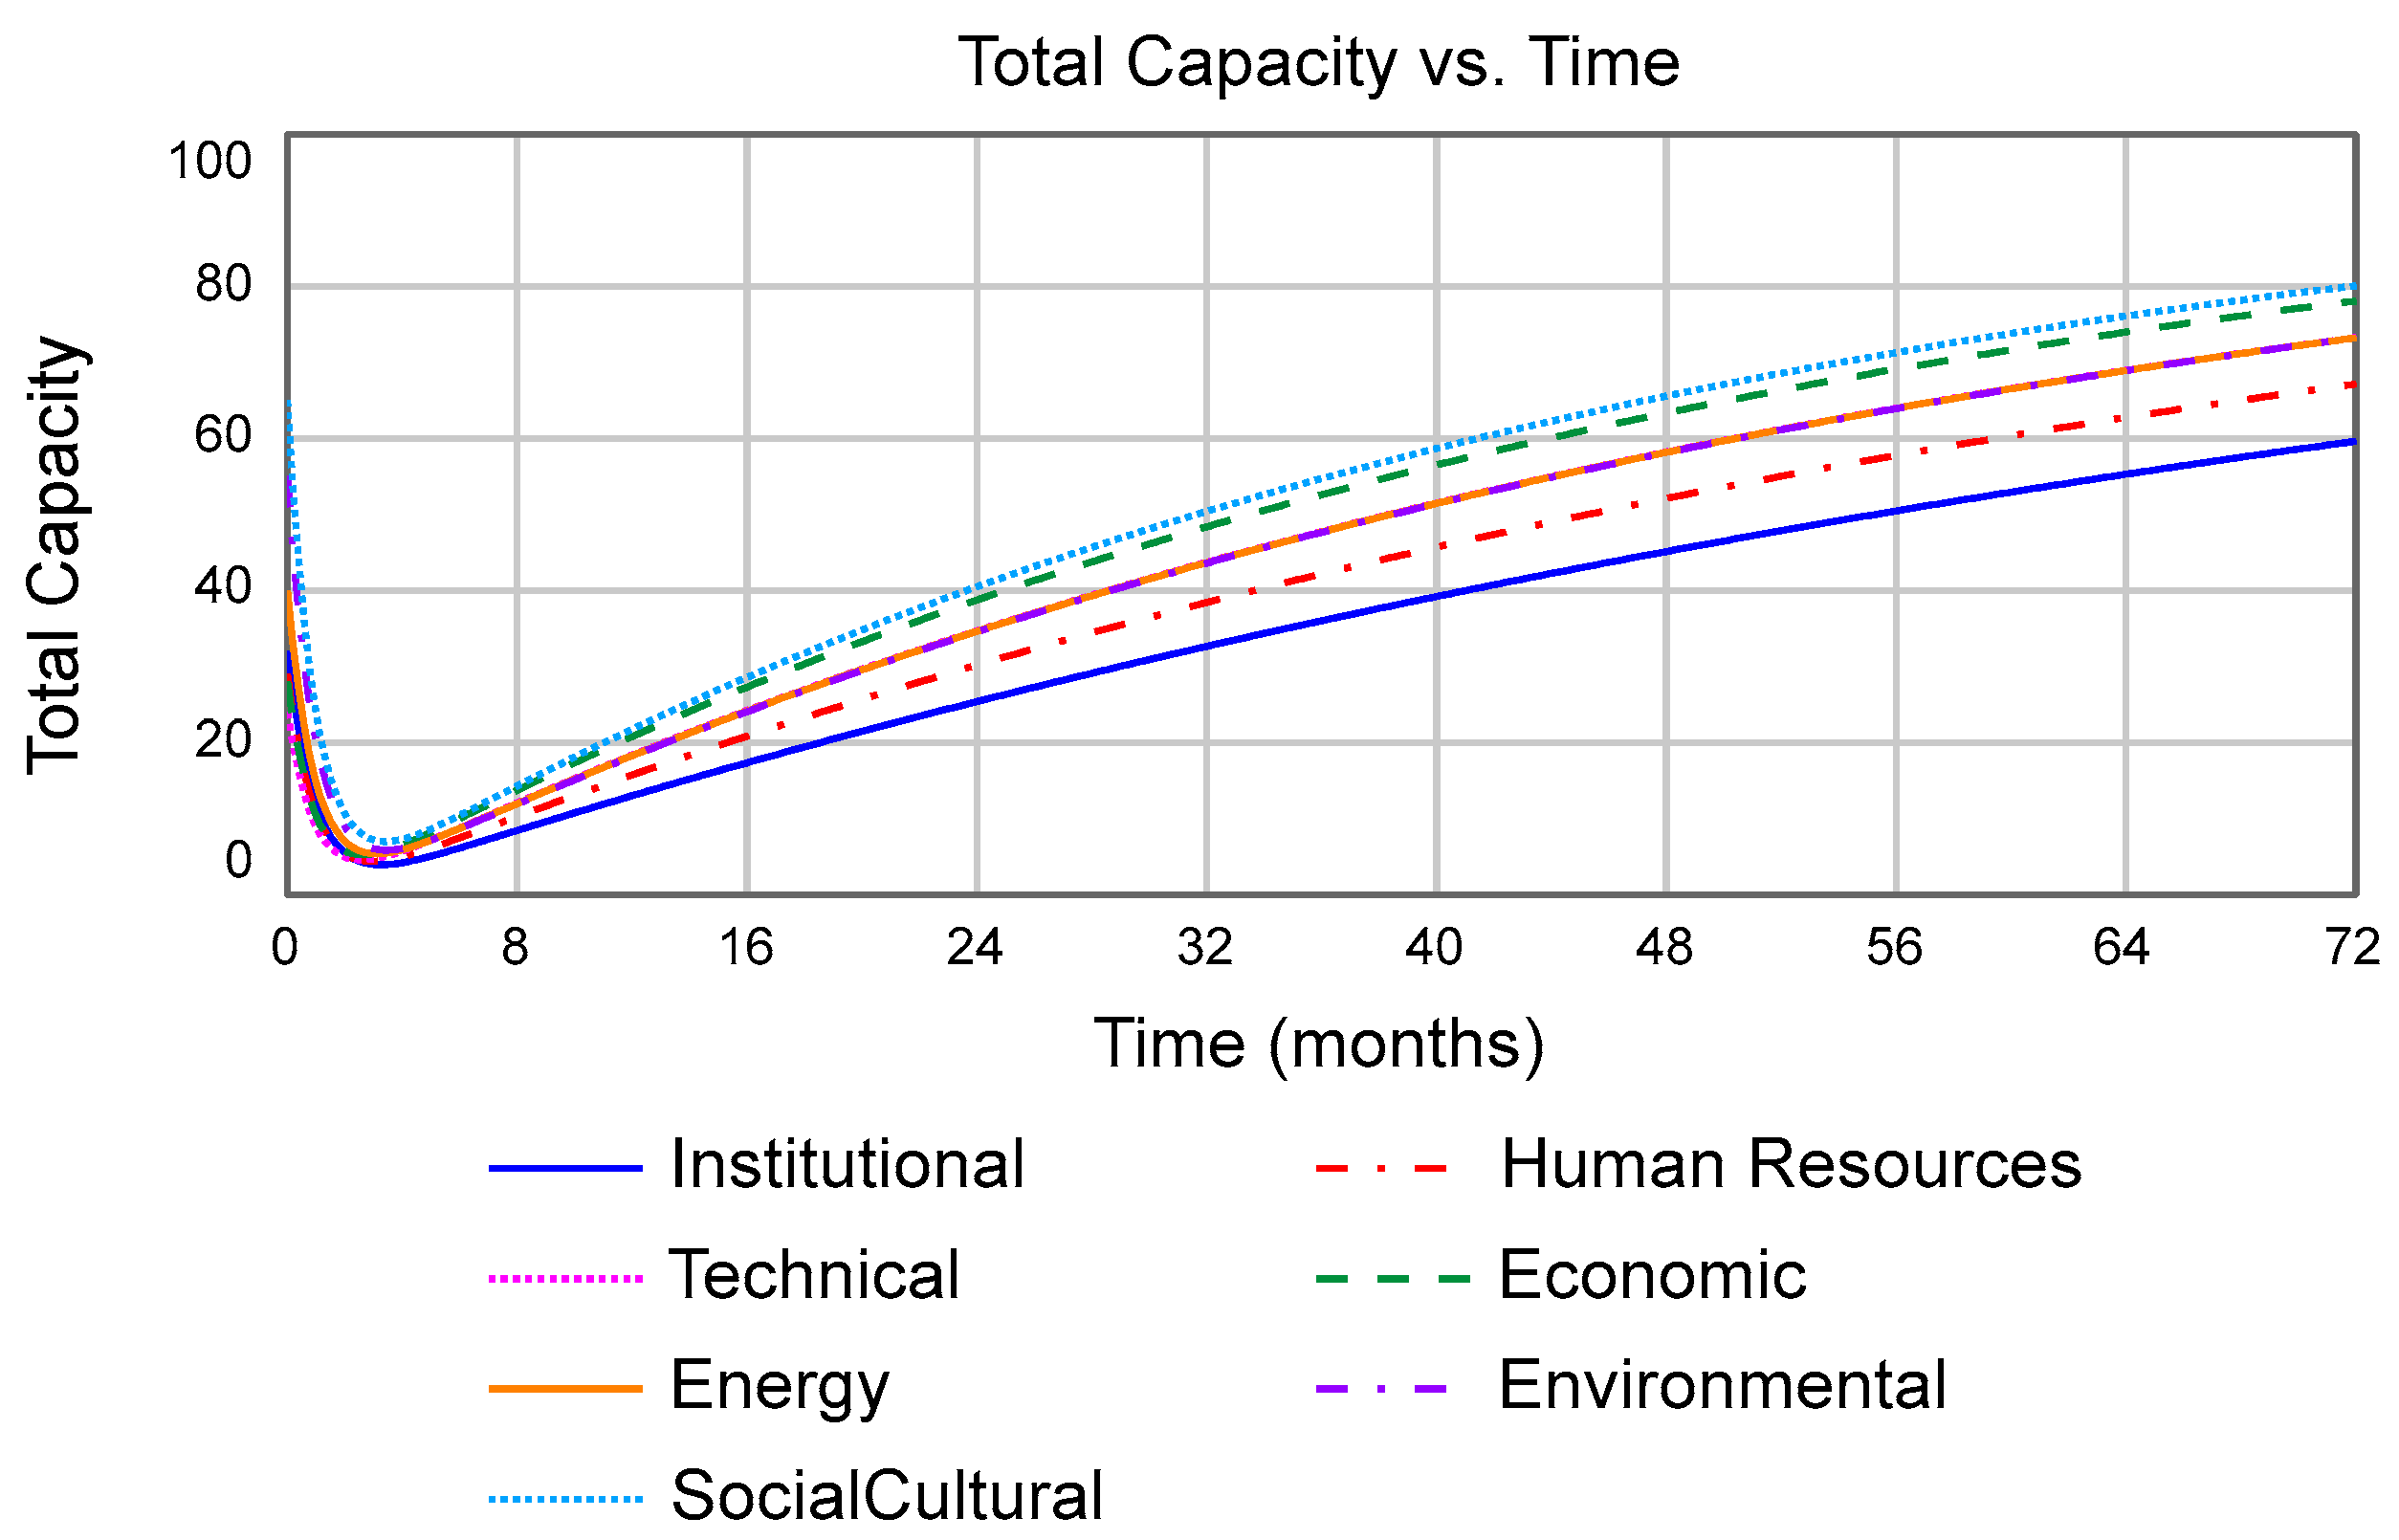
A biflow is used in Figure 12 to capture the change of built capacity and account for the enabling (positive value) or constraining (negative value) influence of the different types of capacity on a specific one. Figure 13 shows the variation of the seven categories of capacity over six years (72 months) for the wastewater and sewage service example of Table 1 and Table 4. Although the institutional capacity is not the lowest initially (see Table 1), it remains the weakest as service is being recovered due to the influence of the other capacity types.
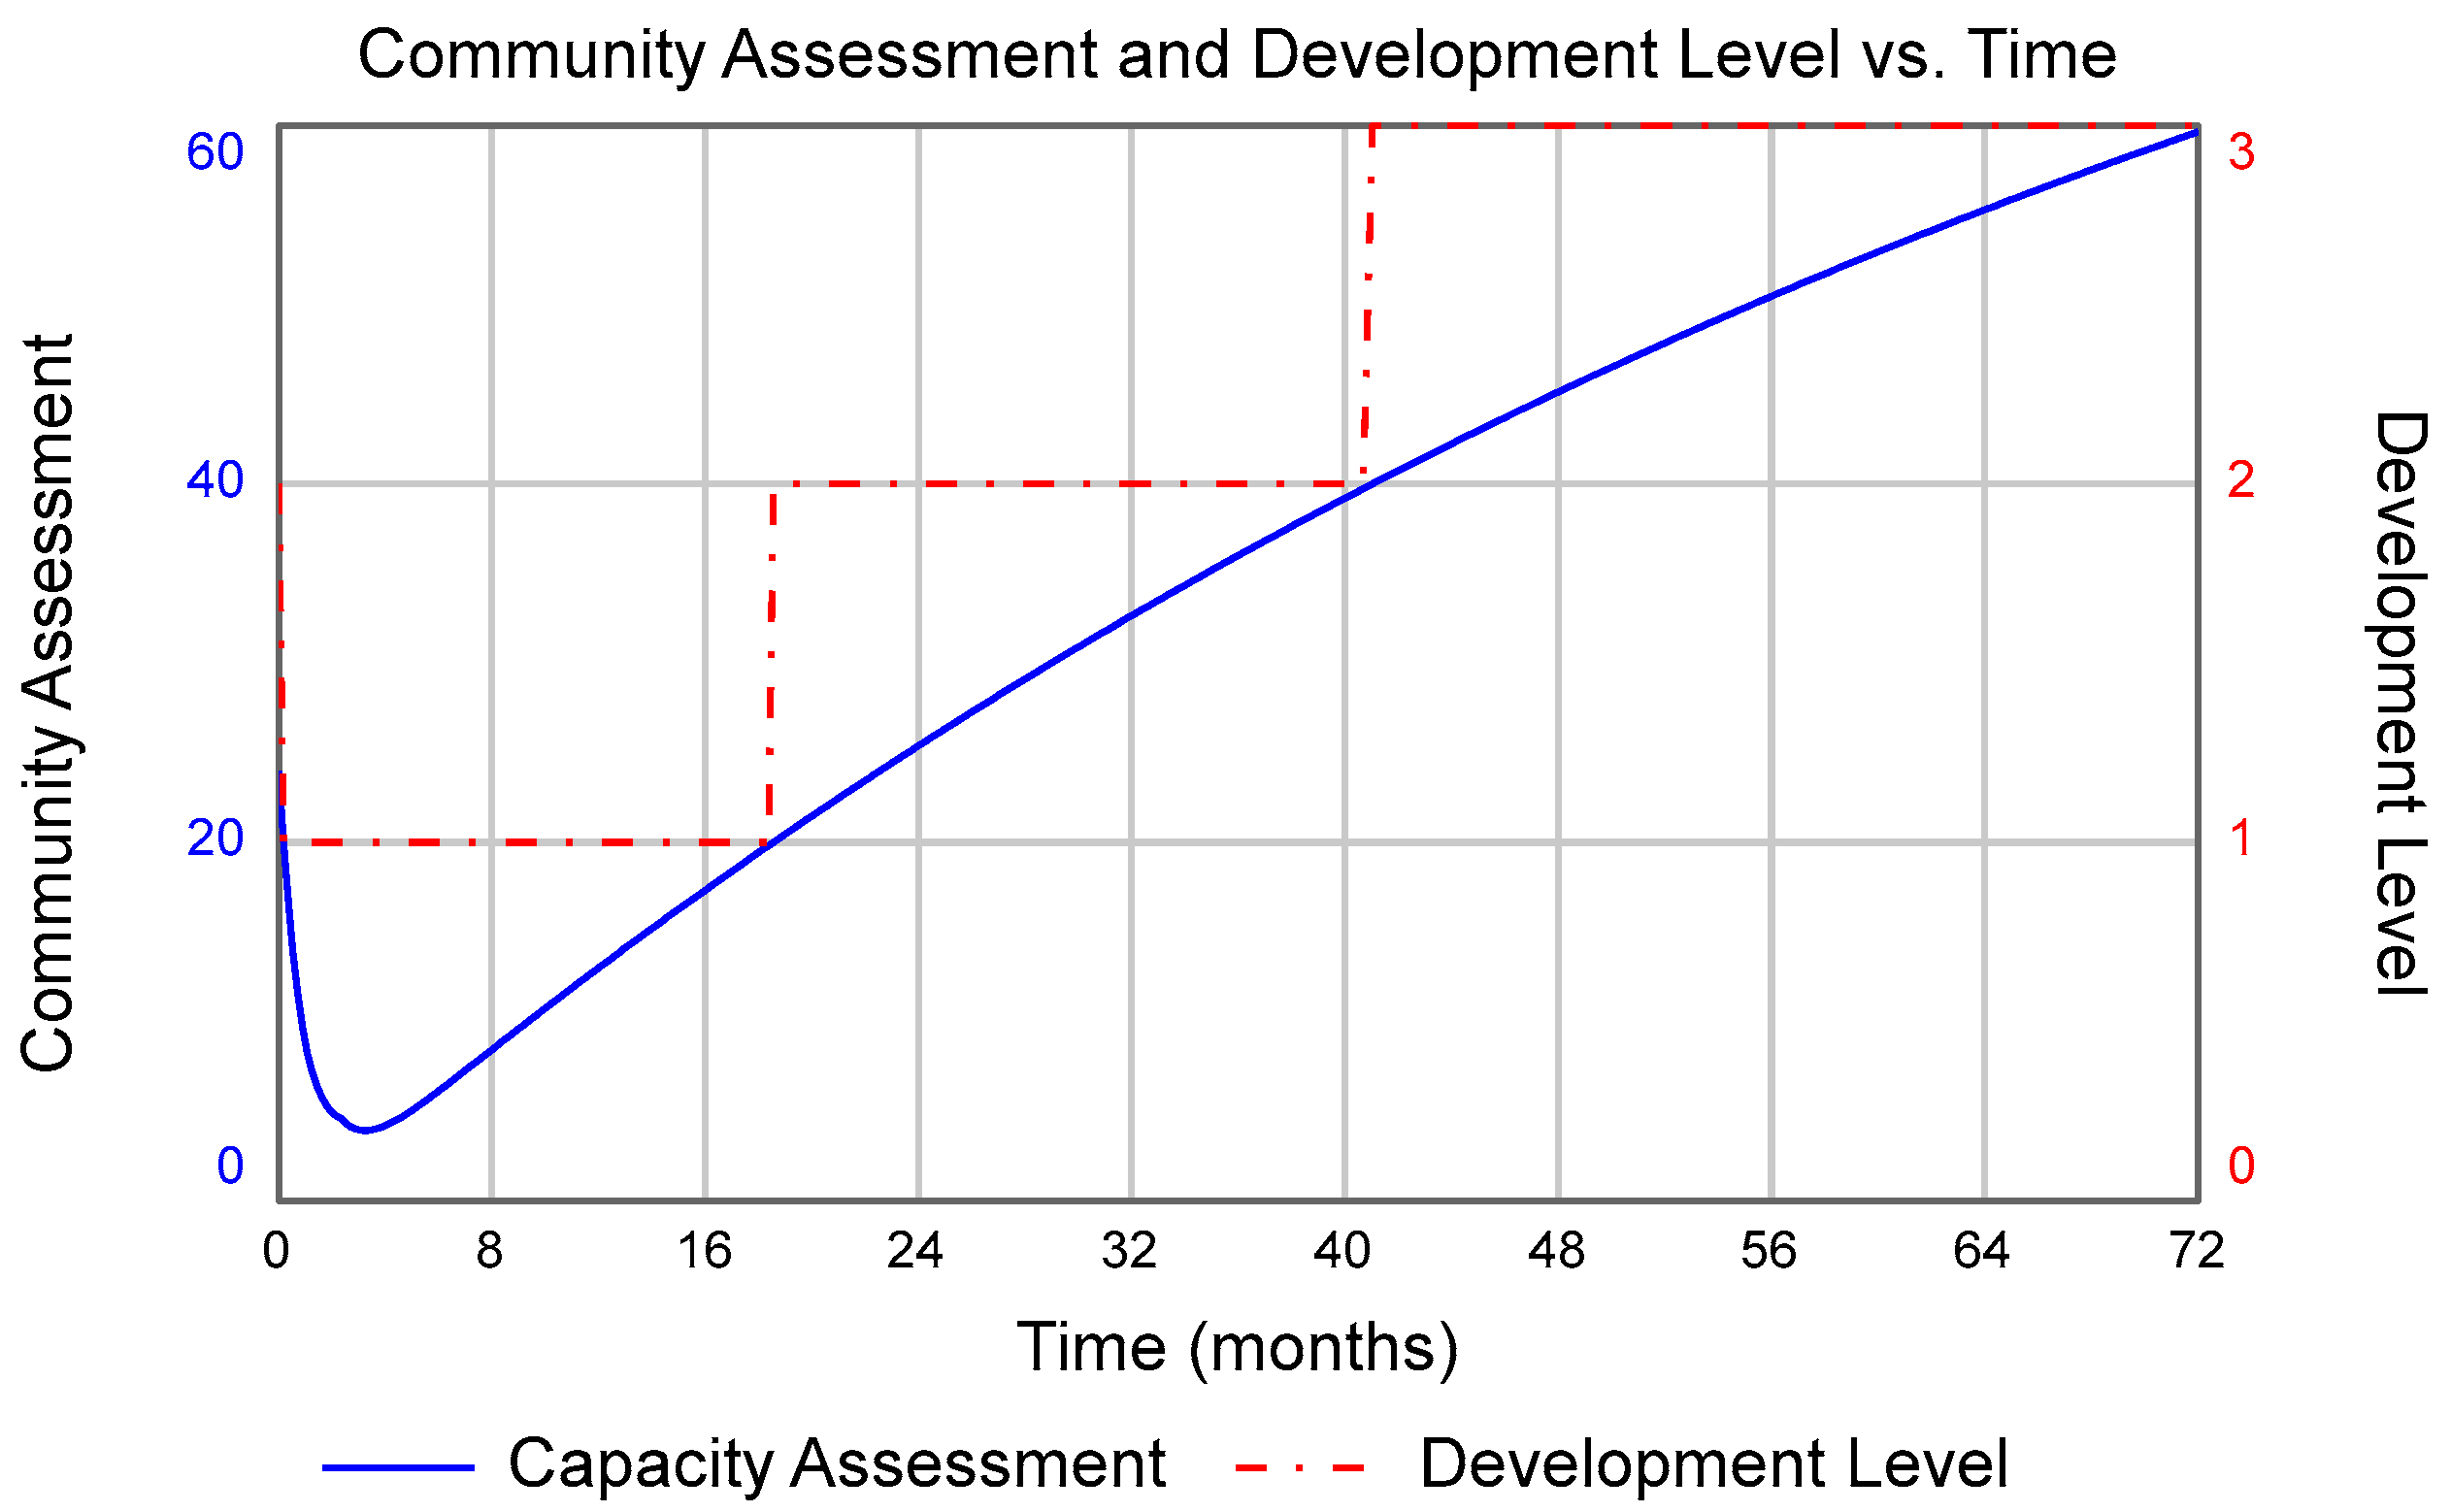
Figure 14 shows the corresponding variation of the community capacity assessment CA (weakest capacity type) and level of community development over time. In the present example, as recovery occurs, the community can manage more sophisticated community-based systems since its level of development: from not having the capacity to manage the service (level 1) to managing community-based systems (level 3).
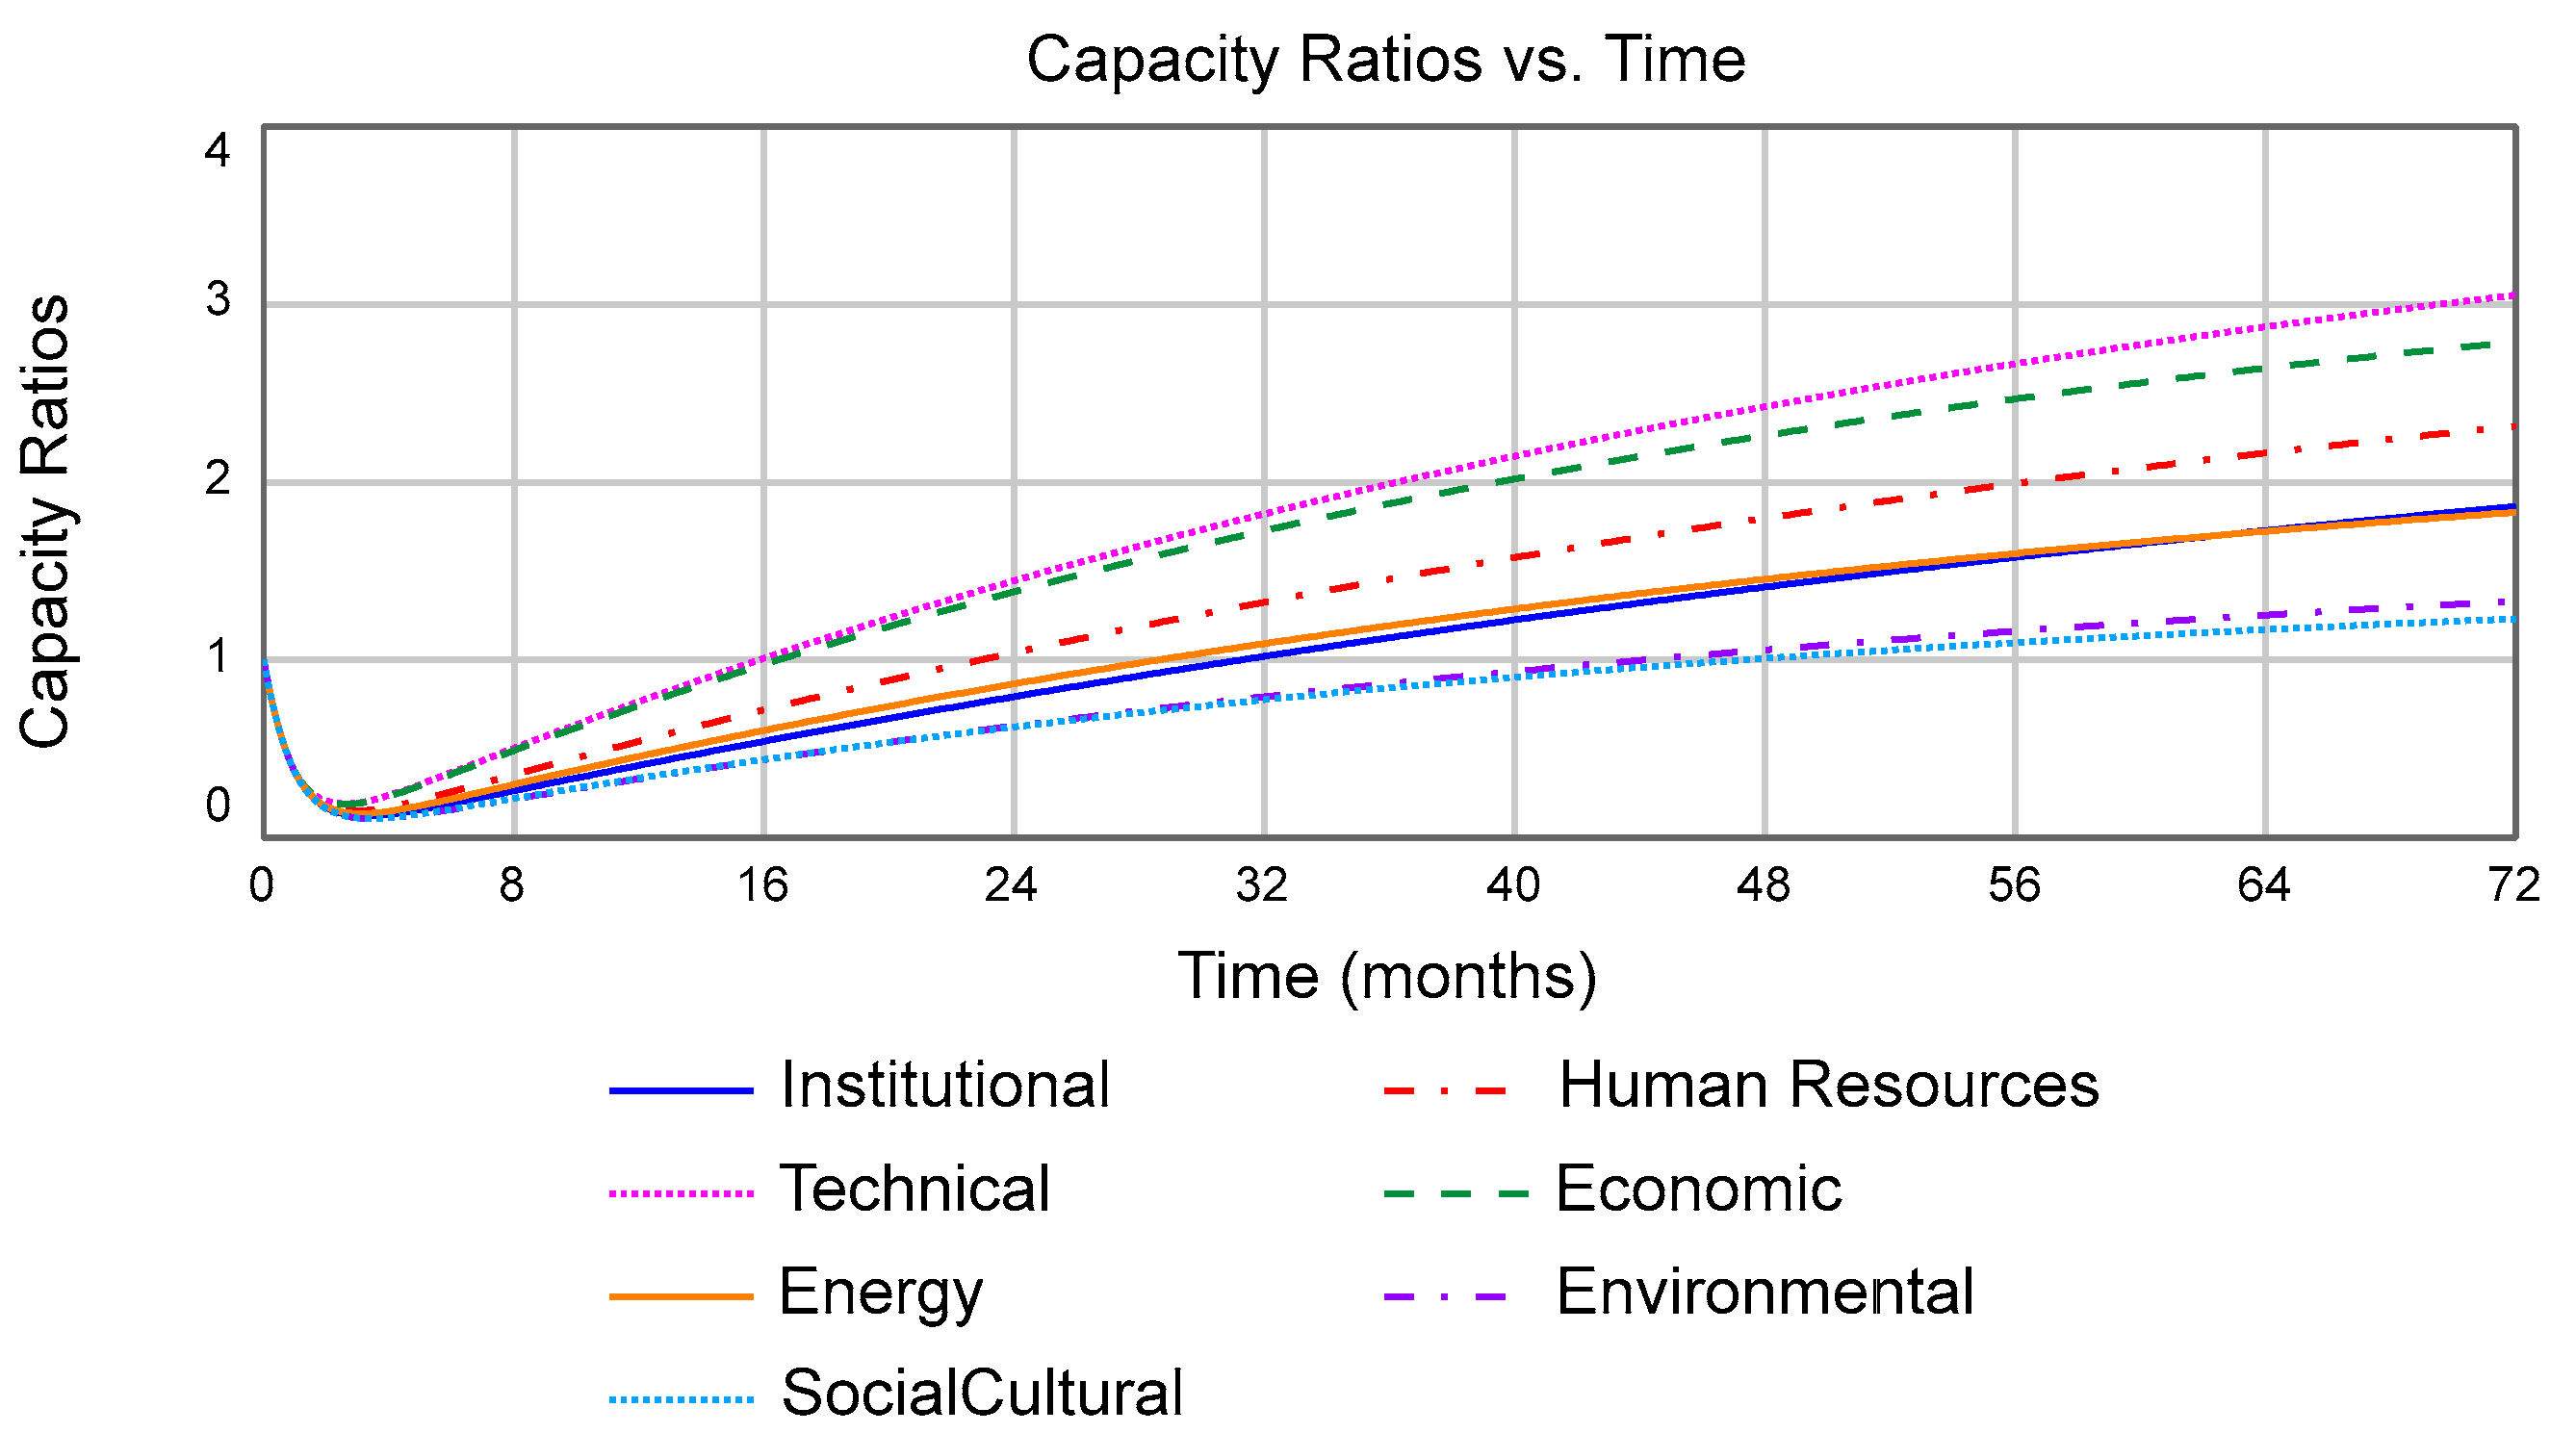
Finally, Figure 15 shows the variation of the ratios between the current acquired categories of capacity and their initial values with time. These ratios can be interpreted as a measure of resilience for each category of capacity.
5. Conclusions
Building community capacity and resilience is critical to preventing societies from declining in human development, descending into crises, and avoiding socio-economic instability as humanity is facing multiple challenges, including the recent COVID-19 epidemic. As emphasized in the SDGs [6,7], there is a need to simultaneously improve the current capacity of communities and plan their long-term sustainability. The challenge is how to develop such a preventive plan of action for communities of different contexts and scales.
The capacity and resilience of communities to deal with adverse events and challenging conditions are not static concepts as they develop over time. Understanding such variation with time enables decisionmakers and practitioners to implement solutions and strategies appropriate to the current conditions. As seen in this paper, the level of community development dictates what solutions a community can manage to provide specific services. It also dictates what technology options to choose from to provide these services [15]. Many mistakes have been made in the development field where technical solutions proposed by outsiders were not in sync with communities’ capacity to implement, operate, and maintain these solutions.
As illustrated in the case study of the low-income community presented in this paper, adding the interdependence between the seven types of capacity initially proposed in the UVC framework when identifying the weakest type of capacity CA and level of development can be used to account for possible enabling and constraining factors affecting each type of capacity. The numerical examples proposed in this paper show that an enabling influence between the capacity types gives a more optimistic perspective of what the community can handle. On the other hand, any constraining influence is more pessimistic. Additional numerical examples could be run where the influence scores between capacity types in Table 4 change in time and vary between positive enabling and negative constraining values. This can be explored using the user interfaces of the models available on the web.
A resilient community is more than a collection of well-functioning silos of capacity. The value proposition of the systems approach used in this paper to evaluate community capacity and resilience is threefold. First, both capacity and resilience are represented as states created through the interaction of multiple dynamic systems that unfold within a community. This must be compared to traditional reductionistic approaches to capacity and resilience, focusing on meeting specific independent targets. Second, the approach can capture the complexity of community coping and adapting mechanisms when faced with adverse events. Finally, the approach proposed herein considers multiple nonlinear interactions between these systems, which are not traditionally included in reductionistic approaches to community capacity and resilience.
The systems approach presented in this paper was applied to a small-scale low-income community (village level) and in a specific context. Its basic constructs could be extended to communities of larger scales and in different contexts. Regardless of the scale and context, however, to be effective, the systems approach requires that a detailed community capacity and vulnerability assessment be initially carried out. Furthermore, the decisionmakers and practitioners involved in community development must be willing to adopt a new mindset of systems thinking when working in partnership with other stakeholders [50].
The resilience SD model presented herein captures the importance of mitigation and preparation in controlling how quickly acquired capacity decreases immediately following an adverse event. It also emphasizes how the starting time of capacity building influences the shape of the recovery curve and the rate of recovery. Once the recovery occurs, community development increases and more advanced technologies can be selected to provide services.
The model presented herein considers the variation of seven types of capacity. An overall community capacity could also be calculated as the weighted average of these seven types. The model could also be extended to include the response of a community to multiple adverse events. For instance, a secondary event may occur during the recovery phase or even before it even starts.
The proposed approach can also be used to explore the consequences of unexpected events, including cascading events and secondary events that only occur when systems interact.
Finally, the systems approach proposed herein can be adapted to other capacity analysis frameworks that use different categories of capacity to analyze the delivery of one or multiple services. As an example, Hudson and Moriarty [51] and Adanke et al. [52] review some WASH-related (water, sanitation, and hygiene) frameworks and propose a new one consisting of nine building blocks which include institutions, policy and legislation, finance, planning, infrastructure management and development, monitoring, and regulation and accountability, learning and adaptation, and water resources management.
Funding
This research received no external funding.
Conflicts of Interest
The author declares no conflict of interest.
References
- United Nations Development Programme (UNDP). COVID-19 and Human Development: Assessing the Crisis, Envisioning the Recovery. Available online: http://hdr.undp.org/en/hdp-covid (accessed on 15 September 2020).
- Institute for Economics & Peace (IEP). Global Peace Index 2020: Measuring Peace in a Complex World. Available online: http://visionofhumanity.org/app/uploads/2020/06/GPI_2020_web.pdf (accessed on 14 June 2020).
- World Commission on Environment and Development (WCED). Our Common Future; Oxford University Press: Oxford, UK, 1987. [Google Scholar]
- United Nations Conference on Environment and Development (UNCED). Agenda 21. Available online: http://www.un.org/esa/sustdev/documents/agenda21/english/Agenda21.pdf (accessed on 16 January 2017).
- Boutros-Ghali, B. An agenda for peace: Preventive diplomacy, peacemaking, and peacekeeping. Int. Relat. 1992, 11, 201–218. [Google Scholar]
- United Nations (UN). The Millennium Development Goals Report 2015. Available online: https://www.un.org/millenniumgoals/2015_MDG_Report/pdf/MDG%202015%20rev%20(July%201).pdf (accessed on 15 August 2020).
- Sachs, J.D.; Schmidt-Traub, G.; Mazzucato, M.; Messner, D.; Nakicenovic, N.; Rockström, J. Six transformations to achieve the sustainable development goals. Nat. Sustain. 2019, 2, 805–814. [Google Scholar] [CrossRef]
- Lu, J. What Will COVID-19 Do to the Sustainable Development Goals. Available online: https://www.undispatch.com/what-will-covid-19-do-to-the-sustainable-development-goals/ (accessed on 1 June 2020).
- Sumner, A.; Hoy, C.; Ortiz-Juarez, E. Estimates of the Impact of Covid-19 on Global Poverty; WIDER Working Paper 2020/43; UNU-WIDER: Helsinki, Finland, 2020. [Google Scholar]
- United Nations (UN). Shared Responsibility, Global Security: Responding to the Socio-Economic Impacts of COVID-19. Available online: https://unsdg.un.org/resources/shared-responsibility-global-solidarity-responding-socio-economic-impacts-covid-19 (accessed on 2 June 2020).
- Institute for Economics and Peace (IEP). COVID-19 and Peace. Available online: http://visionofhumanity.org/app/uploads/2020/06/COVID19-and-Peaceweb.pdf (accessed on 14 June 2020).
- Moritz, R.E. To Reinvent the Future, We Must All Work Together. Available online: https://www.weforum.org (accessed on 17 July 2020).
- Zolli, A.; Healy, A.M. Resilience—Why Things Bounce Back; Free Press: New York, NY, USA, 2012. [Google Scholar]
- Pfefferbaum, R.L.; Pfefferbaum, B.; Van Horn, R.L. The Communities Advancing Resilience Toolkit (CART): An intervention to build community resilience to disasters. J. Public Health Manag. Pract. JPHMP 2013, 19, 250–258. [Google Scholar] [CrossRef] [PubMed]
- Bouabid, A. Requirements Analysis for Sustainable Sanitation Systems in Low Income-Countries. Master’s Thesis, University of Virginia, Charlottesville, VA, USA, 2004. [Google Scholar]
- Lavergne, R.; Saxby, J. Capacity Development: Vision and Implications. Available online: https://www.researchgate.net/publication/242480268_Capacity_Development_Vision_and_implications (accessed on 15 October 2020).
- Bolger, J. Capacity Development: Why, What and How. Available online: https://www.researchgate.net/publication/268354675_Capacity_development_Why_what_and_how (accessed on 15 October 2020).
- Deutsche Gesellschaft für Internationale Zusammenarbeit, GmBh (GIZ). Supporting Capacity Development: A Guiding Framework for Practitioners. Available online: https://www.giz.de/en/downloads/giz2018-en-orientierungsrahmen-capacity-development.pdf (accessed on 19 September 2020).
- Hansford, R. Reducing Risks of Disasters in Our Community. Available online: http://learn.tearfund.org/~/media/Files/TILZ/Publications/ROOTS/English/Disaster/ROOTS%209%20Reducing%20risk%20of%20disaster.pdf (accessed on 1 June 2019).
- World Federation of Engineering Organizations (WFEO). Guidebook for Capacity Building in the Engineering Environment; WFEO: Paris, France, 2010. [Google Scholar]
- Morgan, P. Capacity and Capacity Development—Some Strategies. Available online: http://nsagm.weebly.com/uploads/1/2/0/3/12030125/strategies_for_capacity_development_cida_1998.pdf (accessed on 15 October 2020).
- United Nations Development Progamme (UNDP). Capacity Development: A UNDP Primer. Available online: http://www.undp.org/content/dam/aplaws/publication/en/publications/environment-energy/www-ee-library/climate-change/capacity-development-a-undp-primer/CDG_A%20UNDP%20Primer.pdf (accessed on 15 October 2020).
- Cornwall, A.; Jewkes, R. What is participatory research? Soc. Sci. Med. 1995, 41, 1667–1676. [Google Scholar] [CrossRef]
- Park, P. People, knowledge and change in participatory research. Manag. Learn. 1999, 30, 141–157. [Google Scholar] [CrossRef]
- Fals-Borda, O.; Rahman, M.A. (Eds.) Action and Knowledge: Breaking the Monopoly with Participatory Action Research; The Apex Press: New York, NY, USA, 1991. [Google Scholar]
- Chambers, R. Participatory Workshops: A Sourcebook of 21 Sets of Ideas and Activities; Earthscan Publications Ltd.: London, UK, 2005. [Google Scholar]
- Scheyvens, R.; Storey, D. Development Fieldwork: A Practical Guide; Sage Publication: Thousand Oaks, CA, USA, 2003. [Google Scholar]
- Bouabid, M.; Louis, G. Capacity factors for evaluating water and sanitation infrastructure choices for developing communities. J. Environ. Manag. 2015, 161, 335–343. [Google Scholar] [CrossRef] [PubMed]
- Ahmad, T.T. A Classification Tool for Selecting Sanitation Service Options in Lower-Income Communities. Master’s Thesis, University of Virginia, Charlottesville, VA, USA, 2004. [Google Scholar]
- Gordon, T.J. Cross-impact analysis. In Futures Research Methodology, 3rd ed.; Glenn, J.C., Gordon, T.J., Eds.; Introduction to the Futures Methods Research Series; United Nations University, Millennium-Project: Washington, DC, USA, 2014. [Google Scholar]
- Gordon, T.J.; Hayward, H. Initial experiments with the Cross-Impact Matrix Method of forecasting. Futures 1968, 1, 110–116. [Google Scholar] [CrossRef]
- Glenn, J.C. Introduction to the futures research methods series. In Futures Research Methodology, 2nd ed.; Glenn, J.C., Gordon, T.J., Eds.; United Nations University, Millennium-Project: Washington, DC, USA, 2003. [Google Scholar]
- Glenn, J.C.; Gordon, T.J. The AC/UNU Millennium Project. In Futures Research Methodology, 2nd ed.; Glenn, J.C., Gordon, T.J., Eds.; United Nations University, Millennium-Project: Washington, DC, USA, 2003. [Google Scholar]
- Asan, S.S.; Asan, U. Qualitative cross-impact analysis with time consideration. Technol. Forecast. Soc. Chang. 2007, 74, 627–644. [Google Scholar] [CrossRef]
- Godet, M. The art of scenarios and strategic planning: Tools and pitfalls. Technol. Forecast. Soc. Chang. 2000, 65, 3–22. [Google Scholar] [CrossRef]
- Arcade, J.; Godet, M.; Meunier, F.; Roubelat, F. Structural analysis with the MICMAC method and the Actor’s strategy with the MACTOR method. In Futures Research Methodology, 3rd ed.; Glenn, J.C., Gordon, T.J., Eds.; United Nations University, Millennium-Project: Washington, DC, USA, 2014. [Google Scholar]
- Duperrin, J.C.; Godet, M. Méthode de Hierarchisation des Elements d’un Système. Available online: https://core.ac.uk/display/58778603 (accessed on 1 October 2019).
- Ritchie-Dunham, J.L.; Rabbino, H.T. Managing with Clarity: Identifying, Aligning, and Leveraging Strategic Resources; John Wiley and Sons: New York, NY, USA, 2001. [Google Scholar]
- Godet, M. Introduction to La Prospective: Seven key ideas and one scenario method. Futures 1986, 18, 134–157. [Google Scholar] [CrossRef]
- Newman, M.E.J. Networks: An Introduction; Oxford University Press: Oxford, UK, 2010. [Google Scholar]
- Borgatti, S.P.; Everett, M.G.; Johnson, J.C. Analyzing Social Networks; Sage Publications Ltd.: Thousand Oaks, CA, USA, 2013. [Google Scholar]
- Forrester, J.W. Industrial Dynamics; Pegasus Communications: Waltham, MA, USA, 1971. [Google Scholar]
- Richmond, B. An Introduction to Systems Thinking, STELLA Software; ISEE Systems, Inc.: Lebanon, NH, USA, 2004. [Google Scholar]
- Sterman, J. Business Dynamics: Systems Thinking and Modeling for a Complex World; McGraw Hill Education: New York, NY, USA, 2000. [Google Scholar]
- Ford, A. Modeling the Environment; Island Press: Washington, DC, USA, 2010. [Google Scholar]
- National Research Council (NRC). Disaster Resilience: A National Imperative; The National Academies Press: Washington, DC, USA, 2012. [Google Scholar]
- United Nations Office for Disaster Risk Reduction (UNDRR). Disaster (Definition). Available online: https://www.undrr.org/terminology/disaster (accessed on 20 September 2020).
- Hynes, M.; (US Army Corps of Engineers, Washington, DC, USA). Personal communication, 2013.
- Norris, F.; Stevens, S.P.; Pfefferbaum, B.; Wyche, K.F.; Pfefferbaum, R.L. Community resilience as a metaphor, theory, set of capacities, and strategy for disaster readiness. Am. J. Community Psychol. 2008, 41, 127–150. [Google Scholar] [CrossRef] [PubMed]
- Benson, T.; Marlin, S. The Habit-Forming Guide to Becoming a Systems Thinker; The Waters Foundation Systems Thinking Group Publ.: Pittsburgh, PA, USA, 2017. [Google Scholar]
- Hudson, A.; Moriarty, P. Understanding the WASH System and Its Building Blocks: Building Strong WASH Systems for the SDGs. Available online: https://www.ircwash.org/resources/understanding-wash-system-and-its-building-blocks (accessed on 8 September 2020).
- Adanke, M.; Hailegiorgis, B.; Butterworth, J. A Local Systems Analysis for Rural Water Services Delivery in South Ari and Mile, Ethiopia. Available online: https://www.globalwaters.org/SWS (accessed on 8 September 2020).
Figure 1.
Seven interconnected categories of capacity considered for the delivery of a specific community service in an environment with a specific structure, context, and scale.
Figure 1.
Seven interconnected categories of capacity considered for the delivery of a specific community service in an environment with a specific structure, context, and scale.

Figure 2.
Graph showing the values of the degrees of direct net influence and dependence for all seven categories of capacity: INST (institutional); HR (human resources); TECH (Technical); ECON (Economic); ENERGY; ENV (Environmental); SOCIAL (social/cultural). The graph consists of four sectors defined by the average values (12.85) of the net influence and dependence of Table 4.

Figure 3.
Value-directed network showing how all seven categories of capacity interact. This graph was created using the MICMAC software developed by Godet (1986). Inst.: institutional; HR: human resources; Tech.: Technical; Econ.: Economic/Financial; Env.: Environmental.
Figure 3.
Value-directed network showing how all seven categories of capacity interact. This graph was created using the MICMAC software developed by Godet (1986). Inst.: institutional; HR: human resources; Tech.: Technical; Econ.: Economic/Financial; Env.: Environmental.

Figure 4.
The modular structure of the stock-and-flow diagram.

Figure 5.
Stock-and-flow diagram of the technical capacity module.

Figure 6.
Variation of community capacity assessment and community capacity (development) level with time assuming capacity dependency and an enabling environment.
Figure 6.
Variation of community capacity assessment and community capacity (development) level with time assuming capacity dependency and an enabling environment.

Figure 7.
Variation of the seven capacity factors with time assuming capacity dependency and an enabling environment.
Figure 7.
Variation of the seven capacity factors with time assuming capacity dependency and an enabling environment.

Figure 8.
Variation of community capacity assessment and community development with time. No capacity dependency is assumed.
Figure 8.
Variation of community capacity assessment and community development with time. No capacity dependency is assumed.

Figure 9.
Variation of community capacity assessment and community capacity (development) level with time for a constraining environment.
Figure 9.
Variation of community capacity assessment and community capacity (development) level with time for a constraining environment.

Figure 10.
Variation of the seven capacity factors with time assuming capacity dependency and a constraining environment.
Figure 10.
Variation of the seven capacity factors with time assuming capacity dependency and a constraining environment.

Figure 11.
Variation of community capacity following a disaster or crisis (adapted from Hynes, [48]) Not to scale.
Figure 11.
Variation of community capacity following a disaster or crisis (adapted from Hynes, [48]) Not to scale.

Figure 12.
Stock-and-flow system dynamics representation of the dynamic of Figure 11.
Figure 12.
Stock-and-flow system dynamics representation of the dynamic of Figure 11.

Figure 13.
Variation of the seven categories of capacity over 72 months (six years).

Figure 14.
Variation of community capacity assessment and community development over 72 months (six years) assuming capacity dependency and an enabling environment.
Figure 14.
Variation of community capacity assessment and community development over 72 months (six years) assuming capacity dependency and an enabling environment.

Figure 15.
Variation of the ratio between current and initial capacity for all seven types of capacity over 72 months (six years).
Figure 15.
Variation of the ratio between current and initial capacity for all seven types of capacity over 72 months (six years).


Table 1.
Example of wastewater and sewage treatment capacity assessment for a small village in Morocco (from [15,28]). Bold letters apply to the case study being analyzed.
| Capacity Types | Requirements | 1–20 | 21–40 | 41–60 | 61–80 | 81–100 | Score |
|---|---|---|---|---|---|---|---|
| Service | (l/d/c) | <20 | 20–40 | 41–60 | 61–80 | >80 | 40 |
| Capacity factor | 40 | ||||||
| Institutional | Body of legislation | None | Basic | Intermediate | Complete | Advanced | 30 |
| Associated regulations | None | Basic | Intermediate | Complete | Advanced | 30 | |
| Admin. agencies | None | National | Regional | State | Local | 50 | |
| Admin. processes | None | Basic | Intermediate | Complete | Advanced | 25 | |
| Governance | None | Basic | Regional | State | Local | 25 | |
| Capacity factor | 32 | ||||||
| Human Resources | Professional labor | None | Collection supervisor | Collection supervisor; Treatment supervisor | Engineer; Chemist; Admin.; Collection treatment supervisor | Engineer; Chemist; Admin. manager; Collection treatment manager | 15 |
| Skilled labor | None | Mechanics; Clerk | Lab. technician; Mechanics; Clerk; Electrician | Lab. technician; Maintenance technician; Operator; Admin. assistant | Lab. technician; Maintenance technician; Operator; Admin. assistant; IT technician | 40 | |
| Unskilled labor | None | Maintenance worker | Maintenance worker; Plant worker | Maintenance assistant; Operator assistant | 30 | ||
| Illiterate labor | None | Caretaker | Maintenance helper | 30 | |||
| Capacity factor | 29 | ||||||
| Technical | Operations | None | Individual disposal | Collection; Pumping; Prelim. treatment | Collection; Pumping; Complete treatment; Bacteriological analysis | Monitoring pumping station; Monitoring treatment; Bacteriological analysis; Chemical/biological analysis | 30 |
| Maintenance | None | Sceptic tank pump | Clean collector systems; Maintain pumps | Collector systems; Station pumps; Treatment equipment | Collector systems; Station pumps; Treatment equipment IT systems | 10 | |
| Adaptation | None | Rarely | Occasionally | Usually | Frequently | 25 | |
| Supply chain | None | National supplier | Regional supplier | National manufacturer Regional distributor | National manufacturer Local distributor | 30 | |
| Capacity factor | 24 | ||||||
| Financial | Private sector % | None | International | National | Regional | Local | 50 |
| Bonds rating | None | National | Regional | State | Local | 10 | |
| User fees | None | Uniform flat rate | Single block rate | Increasing block rate | Increasing block rate | 30 | |
| Budget | None | Basic accounting | Annual | Tracked annually | Tracked quarterly | 30 | |
| Asset values | None | Real estate | Real estate; Equipment | Real estate; Equipment; Cash | Real estate; Equipment; Cash; Stocks | 30 | |
| Debt rating | None | (ccc) | (bb) | (bbb) | (a-aa) | 10 | |
| Capacity factor | 27 | ||||||
| Energy | Primary source | None | Non Convenional | Conventional | Mid-voltage source | High-voltage source | 50 |
| Back up | None | Generator < 20 HP | Generator < 40 HP | Generator < 60 HP | Generator > 60 HP | 10 | |
| % of budget | Very high | High | Moderate | Low | Very low | 50 | |
| Outage rate | Very high | High | Moderate | Low | Very low | 50 | |
| Capacity factor | 40 | ||||||
| Environmental | Quality and sensitivity | Very low | Low | Moderate | High | Very high | 50 |
| Quantity | Very low | Low | Moderate | High | Very high | 65 | |
| Capacity factor | 57.5 | ||||||
| Social/Cultural | Community | Very low | Low | Moderate | High | Very high | 50 |
| Stability | Very low | Low | Moderate | High | Very high | 50 | |
| Equity | Very low | Low | Medium | High | Very high | 65 | |
| Castes | Very high | High | Medium | Low | Very low | 85 | |
| Participation of women | Very low | Low | Moderate | High | Very high | 50 | |
| Capacity factor | 60 | ||||||
| Capacity Assessment CA | Community Capacity Level CCL | Description |
|---|---|---|
| 1–20 | 1 | No local capacity to manage the service. No formal public service is provided. |
| 21–40 | 2 | Capacity to manage systems for small collections of residential units. Limited local service is provided. |
| 41–60 | 3 | Capacity to manage community-based systems. A mix of public and informal private service is provided. |
| 61–80 | 4 | Capacity to serve multiple communities from a centralized system. Regional public service is provided. |
| 81–100 | 5 | The community has the capacity to manage a centralized system, along with individual service to more remote units. Regional public and selective private service provided. |
| Capacity Type | Description | Possible Requirements |
|---|---|---|
| Institutional | Components of the institutional framework necessary to provide the services | Body of legislation and standards; agency regulations; administrative agencies and processes; governance; democratic decision making; advocacy; levels of corruption, injustice, and inequities; professional organizations; foundations; councils |
| Human Resources | Labor available to provide services (management, operation, and maintenance) and workers levels of training | Availability of professional services; skilled and unskilled labor |
| Technical | Standards, logistics, and tactics necessary to address the components of infrastructure to provide the services | Procurement; operations; maintenance (preventative, corrective, crisis); adaptation (upgrading); supply chain (availability of spare parts); technical literature; standards; codes of practice; technical skill training; monitoring |
| Economic/Financial | Production, distribution, and consumption aspects of economic systems and financing of services | Private/public sector investment; user fees; financial asset values; debts vs. assets; bond rating to fund projects; availability of loans; funding opportunities; financial procurement and flow |
| Energy | Availability, costs, and reliability of energy necessary to provide the services | Primary sources; backup systems; budget dedicated to energy; the outage rate |
| Environmental | Natural resources available needed to implement the solutions and their vulnerability | Quantity and quality; carrying capacity level; availability of renewable resources; stock vs. recharge |
| Social/Cultural | Community structure and components, networks and cohesion, households and their interaction, value systems | Sense of community and cooperation; values; stability; gender and equity; conflict management; vulnerable groups and casts; participation in decision making; social networks and power structure; leadership; partnerships; women participation |
Table 4.
Cross-impact analysis among the seven categories of capacity. Inst.: institutional; HR: human resources; Tech.: Technical; Econ.: Economic/Financial; Env.: Environmental.
Table 4.
Cross-impact analysis among the seven categories of capacity. Inst.: institutional; HR: human resources; Tech.: Technical; Econ.: Economic/Financial; Env.: Environmental.
| Inst. | HR | Tech. | Econ. | Energy | Env. | Social | Net Influence | |
|---|---|---|---|---|---|---|---|---|
| Inst. | 0 | 2 | 3 | 3 | 3 | 3 | 3 | 17 |
| HR | 1 | 0 | 3 | 3 | 1 | 1 | 2 | 11 |
| Tech. | 1 | 2 | 0 | 2 | 2 | 2 | 2 | 11 |
| Econ. | 2 | 2 | 2 | 0 | 3 | 3 | 3 | 15 |
| Energy | 1 | 2 | 2 | 3 | 0 | 2 | 3 | 13 |
| Env. | 1 | 0 | 0 | 2 | 2 | 0 | 3 | 8 |
| Social | 3 | 3 | 3 | 2 | 2 | 2 | 0 | 15 |
| Net Dependence | 9 | 11 | 13 | 15 | 13 | 13 | 16 | 90 |
| Average Dependence | 1.28 | 1.57 | 1.86 | 2.14 | 1.86 | 1.86 | 2.28 |
Publisher’s Note: MDPI stays neutral with regard to jurisdictional claims in published maps and institutional affiliations. |
© 2020 by the author. Licensee MDPI, Basel, Switzerland. This article is an open access article distributed under the terms and conditions of the Creative Commons Attribution (CC BY) license (http://creativecommons.org/licenses/by/4.0/).
Share and Cite
MDPI and ACS Style
Amadei, B. A Systems Approach to Building Community Capacity and Resilience. Challenges 2020, 11, 28. https://0-doi-org.brum.beds.ac.uk/10.3390/challe11020028
AMA Style
Amadei B. A Systems Approach to Building Community Capacity and Resilience. Challenges. 2020; 11(2):28. https://0-doi-org.brum.beds.ac.uk/10.3390/challe11020028
Chicago/Turabian StyleAmadei, Bernard. 2020. "A Systems Approach to Building Community Capacity and Resilience" Challenges 11, no. 2: 28. https://0-doi-org.brum.beds.ac.uk/10.3390/challe11020028
Note that from the first issue of 2016, this journal uses article numbers instead of page numbers. See further details here.