Application of Machine Learning Models for Survival Prognosis in Breast Cancer Studies †


1
Faculty of Mathematics and Informatics, Sofia University “St. Kliment Ohridski”, 5 James Bourchier Blvd., Sofia 1164, Bulgaria
2
Institute of Mathematics and Informatics, Bulgarian Academy of Sciences, Acad. G.Bonchev Str., Block 8, Sofia 1113, Bulgaria
*
Author to whom correspondence should be addressed.
†
This paper is an extended version of our paper published in The 18th International Conference on Artificial Intelligence: Methodology, Systems, Applications, AIMSA 2018, Varna, Bulgaria, 12–14 September 2018.
Information 2019, 10(3), 93; https://0-doi-org.brum.beds.ac.uk/10.3390/info10030093
Submission received: 21 January 2019
/
Revised: 23 February 2019
/
Accepted: 27 February 2019
/
Published: 3 March 2019
(This article belongs to the Special Issue Artificial Intelligence—Methodology, Systems, and Applications)
Abstract
:The application of machine learning models for prediction and prognosis of disease development has become an irrevocable part of cancer studies aimed at improving the subsequent therapy and management of patients. The application of machine learning models for accurate prediction of survival time in breast cancer on the basis of clinical data is the main objective of the presented study. The paper discusses an approach to the problem in which the main factor used to predict survival time is the originally developed tumor-integrated clinical feature, which combines tumor stage, tumor size, and age at diagnosis. Two datasets from corresponding breast cancer studies are united by applying a data integration approach based on horizontal and vertical integration by using proper document-oriented and graph databases which show good performance and no data losses. Aside from data normalization and classification, the applied machine learning methods provide promising results in terms of accuracy of survival time prediction. The analysis of our experiments shows an advantage of the linear Support Vector Regression, Lasso regression, Kernel Ridge regression, K-neighborhood regression, and Decision Tree regression—these models achieve most accurate survival prognosis results. The cross-validation for accuracy demonstrates best performance of the same models on the studied breast cancer data. As a support for the proposed approach, a Python-based workflow has been developed and the plans for its further improvement are finally discussed in the paper.
1. Background
In the last decade, high-throughput technologies have been massively used alongside clinical tests to study various diseases to decipher the underlying biological mechanisms and devise novel therapeutic strategies. The generated high-throughput data often correspond to measurements of different biological entities (e.g., gene expression, RNA transcripts, proteins), represent various views on the same entity (e.g., genetic, epigenetic), and are created through different technologies (e.g., microarrays, next generation sequencing, etc.) [1,2]. The data are heterogeneous, of different types and formats. However, in fact it is still very difficult to distinguish tumors even by experts using modern methods such as immunohistochemistry, DNA, or RNA hybridization. There is an intensive and rapid development of new knowledge-based diagnostic methods for tumor detection with the extended use of tools of bioinformatics, computer science, statistics, and machine learning. Aside from that, many of these methods are difficult for integration and combination in a meaningful workflow. With the advent of a large development and application of machine learning (ML) methods in cancer studies, they have become more accurate and based on the discovery of new enriched knowledge about origin, classification, prognosis, and therapy. Our work comprises ML methodologies for survival prognosis time in breast cancer. We apply and compare the performance of eight ML methods for prediction of survival time and several parameter-based methods for cross-validation of the applied approaches.
Breast cancer is a cancer, manifesting in women mostly (more than 99%) and concerns approximately one in eight women over their lifetime [3]. According to American Cancer Society, the average 10-year survival rate is 83%. If the cancer is located only in the breast, the five-year relative survival rate of patients with breast cancer is 99%. Sixty-two percent of all cases are diagnosed at this stage.
The objective of this study is to assess the efficiency and accuracy of the used ML models for survival time prediction in breast cancer patients.
2. Problem Description
The accurate prediction of survival rate in patients with breast cancer remains a challenge due to the increasing complexity of cancer, treatment protocols, and various patient population samples. Reliable and well-validated predictions could assist in a better way personalized care and treatment, and improve the control over the cancer development. Usually in good clinical practices, clinicians use data collected from different sources as medical records, clinical laboratory tests, and studies aiming more precise diagnostics, therapy, and disease-development prognosis.
There is a definite increase in the use of classification-based approaches in contemporary medical diagnostics. Cancer studies are the major target in using contemporary bioinformatics, statistics, and ML techniques for the purposes of more accurate and rapid diagnostics. In the scope of constantly growing significance of predictive and personalized medicine, there is a rapidly growing demand to apply machine learning-driven models to make predictions and prognosis in cancer studies [4].
At first sight, all these classification-based approaches use various and heterogeneous medical data and can inflate the quality of diagnostics. On the contrary, numerous recent developments in computer science, data science, and ML assist in the decrease of errors in overall diagnostics. The use of artificial intelligence techniques for classification in cancer studies provides more informative knowledge-based background for prediction and prognosis of cancer to be tested more meticulously and rapidly, in a short time [5].
Prediction and prognosis of cancer development are focused on three major domains: risk assessment or prediction of cancer susceptibility, prediction of cancer relapse, and prediction of cancer survival rate. The first domain comprises prediction of the probability of developing certain cancer prior to the patient diagnostics. The second issue is related to prediction of cancer recurrence in terms of diagnostics and treatment, and the third case is aimed at prediction of several possible parameters characterizing cancer development and treatment after the diagnosis of the disease: survival time, life expectancy, progression, drug sensitivity, etc. The survivability rate and the cancer relapse are dependent very much on the medical treatment and the quality of the diagnosis [6].
About 40% of all ML studies on breast cancer prediction were focused on predicting patient survivability. There is a variety of examples of machine learning-based approaches applied to different datasets. The obvious trend is that all the major studies with clinical data mostly use models related to artificial neural networks (ANN) and support vector machines (SVM), and use statistical methods for validation. In this way, some problems with classification and validation have been overcome. There is an obvious demand to improve the ML impact in survival time prediction studies in breast cancer in the scope of generality, better accuracy, and validation. These challenges are also in the scope of our work [7].
3. Related Work
Artificial intelligence and, in particular, ML models have a visible history in cancer research and practical implementation [4]. Most of these works employ ML methods for modeling the progression of cancer and identify informative factors that are used afterwards in a classification scheme, concerning mostly cancer susceptibility, recurrence, and survival [8].
The use of different ML models in cancer research provides vast room for various applications. ANNs and decision trees (DTs) have been used in cancer detection and diagnosis for nearly 30 years [4,6,9]. Different models based on SVM applied to cancer prognosis issues have been used for about a couple of decades [10]. Other models for prediction of cancer development and outcome have also been used for several studies. Today, less than a half of data science and bioinformatics methodologies are used by ML-driven models with a wide range of applications, from diagnostics to prediction and prognosis in cancer. All these research studies are concerned with using ML methods to identify, classify, detect, or distinguish tumors and other malignancies, as well as to predict cancer development.
Breast cancer survival time prediction studies based on ML models occupy a significant part of the contemporary research in this area. There are several studies considering the effect of an ensemble of ML techniques to predict the survival time in breast cancer. Their technique shows better accuracy on their breast cancer dataset compared to previous results [11]. Several papers concern different problems in applying ML algorithms for breast cancer prediction. The authors experimented on breast cancer data using C5 algorithm with bagging [9] to predict breast cancer survivability. Other authors gain 93% accuracy of survivability in breast cancer prediction [10]. Some of the studies were focused on a comparative analysis of the performance of the applied supervised learning classifiers such as Naïve Bayes, SVM-radial basis function (RBF) kernel, RBF neural networks, DTs (J48), and simple CART to find the best classifier in breast cancer datasets [12].
Many problems with the use of ML methods in breast cancer predictions studies are related to the lack of efficient and precise validation. One can admit that the use of ML models can improve the accuracy of survival prediction, but the choice of proper validation approach is of great value for studying the breast cancer time of survivability. Among the most common methods for evaluation of the performance of the applied model are the cross-validation methods. Cross-validation is very suitable for ML-based modeling and is used for training and for testing the datasets [13].
An obvious trend in the examined works also includes integration of mixed data of clinical and lab origin. This makes it possible to also use data science models as well as technologies for data integration and subsequent normalization and classification for the purposes of a predictive study [14,15]. A reasonable semantic data integration approach can provide better quality of the input datasets for using ML models for prediction of survival time of breast cancer.
Recent applications of deep learning (DL) models in cancer research demonstrate rich opportunities for their wide use and, aside from that, have left open some problems with their application to particular types of problems. For example, some cases of efficient use of DL or DL-related models for integrative data analysis have been developed and discussed in [16]. Here the authors explored the potential of DL-based approaches for classification and identification of meaningful disease subtypes from multi-platform pattern-type cancer data. Another study [17] presents a DL-based multi-omics model providing optimal differential clustering for survival rate of patients. Both studies are based on integrative data analysis approaches which can effectively extract unified representation of latent features to capture with a certain level of robustness.
The aim of this paper is to investigate different ML techniques in the case of the analysis of breast cancer. We focus on a few ML techniques for analyzing an amount of existing count data such as Support Vector Regression, Kernel Ridge, K-neighborhood regression, Decision Tree, and Multi-layer perceptron regression. We have primarily integrated the provided count data and studied these various ML methods for survival prognosis purposes, and discussed their results. Thus, our work is oriented towards attaining maximal accuracy of survival time prediction based on preliminary defined features and their integrative use. The amount of data, the particular kinds of data—count data in our case and image data in most examples of effective application of deep learning techniques—as well as the aim of the discussed study predispose us to use “classical” ML models instead of DL.
The motivation of our research is based on a thorough literature search on the application of different ML models in cancer research. Large parts of these models have good performance on cancer data [18,19], which emphasizes the experience of using ML techniques in cancer, in particular in breast cancer research. The use of ML also gives some more freedom in model design, targeting the improvement in accuracy and lower error rate in cancer diagnosis [8].
4. Data Description
In breast cancer research a lot of different data types and formats are used and generated. Some of very important research studies using ML for breast cancer used data from: imaging analysis (MRI), clinical records, histological data, expression analysis, populations studies, and a combination of these [8].
Data used in our study is based on clinical records, including patient age, stage of tumor development, tumor size, and the living status of the respective patient. There is also data concerning different types of therapies and surgery intervention, thus many features related to disease developing—tumor size, age at diagnosis, tumor stage, information about applied surgeries, and applied treatments such as chemotherapy, hormone therapy, etc. are included in the raw data. The data was taken from The Cancer Genome Atlas—TCGA portal https://cancergenome.nih.gov/. The data is heterogeneous, and many records contain incomplete information. Only for patients with breast cancer after surgery features, prognosis to determine the survival rate is made.
Two datasets from breast cancer studies are used in the discussed study. The first dataset contains profiles of 498 patients as well as corresponding clinical information. The second breast cancer dataset also contains genomic profiles data and clinical information for 2000 patients. Different types of available data and information sources are shown in Figure 1. The same type of information is provided by different sources in different formats. We integrate all data both horizontally and vertically.
4.1. Data Preprocessing
For initial data preprocessing we developed a software module in Python (Python version 3.7.x) with library scikit-learn [20,21] for reading and normalizing the raw data files. The module we developed automatically discovers the delimiter which separates each attribute in the raw data files. Each file has a header with rows, containing specific information about the file, the technology applied for generation of this file, types and number of attributes, and references to other files (clinical data files have reference to genomic related data files via file ID). Our programming module reads this information and uses it to create a so-called semi-structure. This semi-structure contains attributes which exist in each kind of data: clinical and aggregated genomic data.
The software module reads this information in and uses it to create a so-called semi-structure. This semi-structure contains attributes which exist in each type of data. Data types include clinical, expression profiles, and CNV (Figure 1). This module is used to build a semi-structure repeatedly and iteratively, record by record. Each record is built from fields/attributes (all values from one record). For each record we store aggregated information for all fields in one data structure, which contains two parameters—field name and number of repeated fields [13]. After fields are added to the data semi-structure, they are imported into our database. The database consists of two layers: first, a non-relational document-oriented database—a class of databases that store their data in the form of documents. These databases are horizontally scalable and much more flexible than the relational databases [22]. In addition, the second layer is a graph database—a class of databases which store data in the form of graph and uses a technique called index-free adjacency meaning. In a graph database the main emphasis is on the connection between data [22]. In the document-oriented database we apply a restriction (called ‘data schema’) based on the generated semi-structure. The applied data schema over each record for each kind of data joins data in different formats and from different sources. For each kind of data, this data schema always contains ID and the Sample ID (representing the name of the subject, as provided in the clinical information).
The approach, using the semi-structure, is used to integrate all heterogeneous data into one database. In this way, the horizontal data integration is performed. Two layers of the semi-structure—for each kind of data (containing only attributes which exist in each record) and for all kinds of data (containing ID and Sample ID), are used for vertical data integration. In this way we create a network of relations between all kinds of data to manage them.
4.2. Data Integration
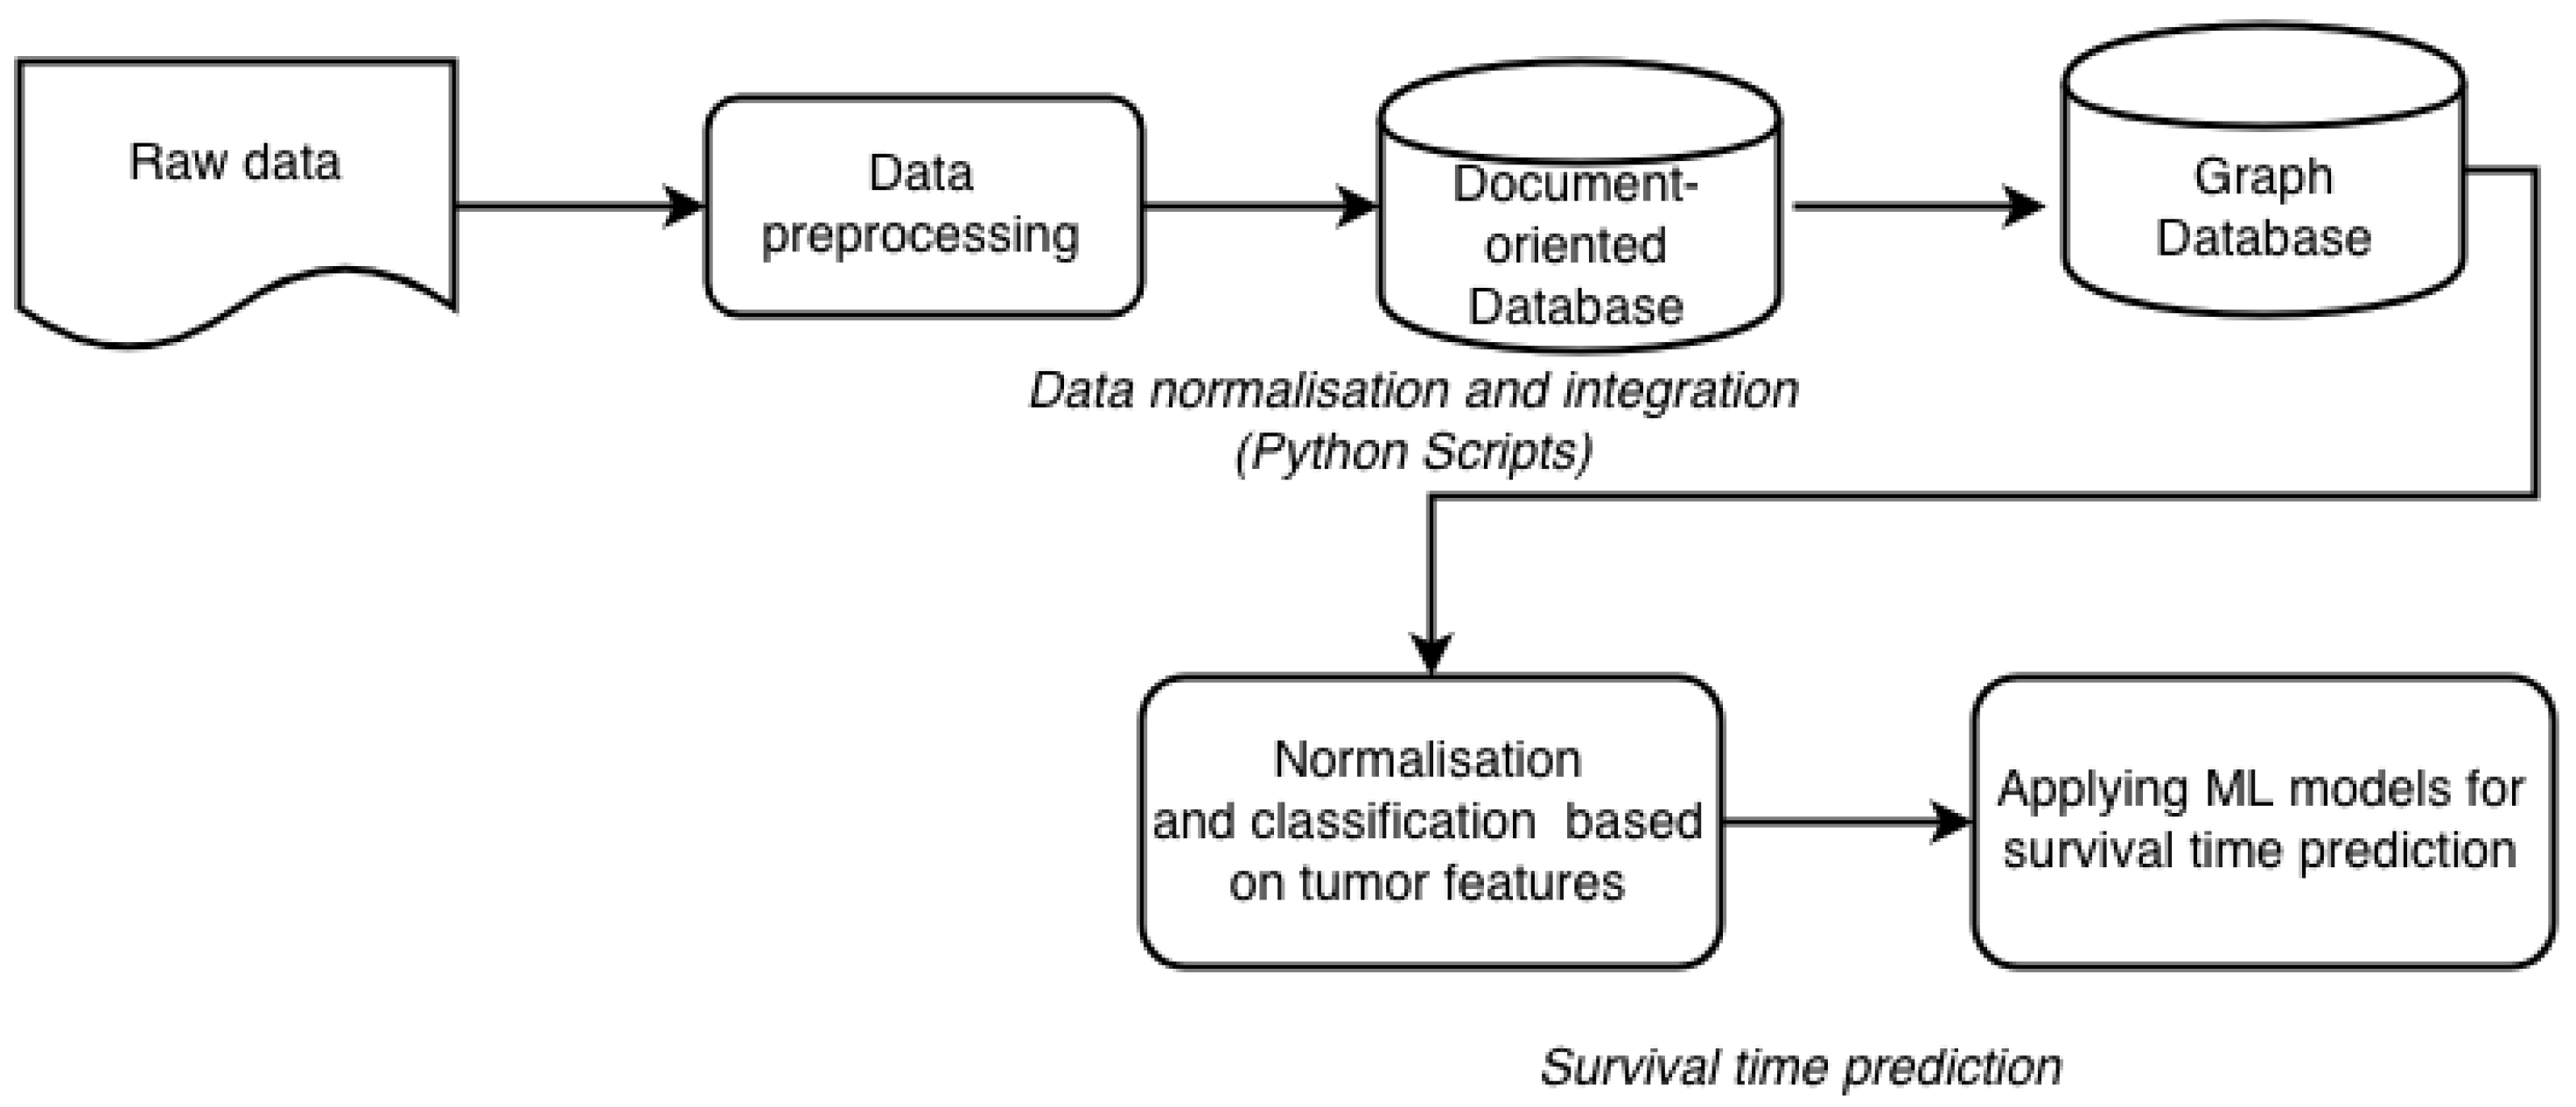
By definition, data integration is a process of combining data of different types and from disparate sources, and consolidating it into meaningful and valuable information. For data integration we employ the newly generated network of relations. In these networks, nodes represent patients and edges represent similarities between patient profiles. The similarity means that two patients are related to each other by multiple proteins. These networks of relations can be applied to groups of patients and to associate these groups with distinct clinical features. The network has two layers. The first layer, covering internal relationships, is built with relations, generated from raw data. The raw data contains description of each patient, with related expression data, copy number variants and clinical information. This information is transformed into relationships between patients and expressed proteins. The second layer is based on semantically linked data from external knowledge sources. These sources provide information about additional proteins related to those existing in our dataset. These new relations are stored in our graph database. To use the additional information from the external knowledge sources we link them within our network via hyperlinks (URLs). This way we can avoid a visual incomprehensibility that would be caused by the redundancy of information. These two layers are combined into one network with different weights for each relation. Our approach to data integration consists of several steps (Figure 2).
All the data from the experimental datasets are integrated horizontally with NoSQL (MongoDB) technology and represented as a semi-structure. As a result, via horizontal data integration we unite separately all clinical data in one semi-structure, all expression data in one semi-structure and all mutation specific data (copy number variants, CNV) in other semi-structures. In MongoDB we store the raw data in JSON format and the metadata as a semi-structure for all components (clinical record, expression profile and CNV) also in JSON format. Regarding vertical integration we first need to find relations between already built semi-structures for clinical records, expression profiles, and CNV data. These relationships are managed by the graph database Neo4j [14]. For example, patient A with semi-structure ID, [attributes] is related to patient B with semi-structure ID, [attributes]. In this relation ID is the important key, while the attributes provide general information about the type of data record (clinical, expression, CNV). By generating such relationships, we built a network, different for each studied patient. In addition to the clinical records of the patients, this network includes information about expression profiles, CNV, and the mutated proteins. In this way we can detect and link all patients also through a specific set of expressed and mutated proteins, which can be used in further cancer studies.
5. Novel Feature
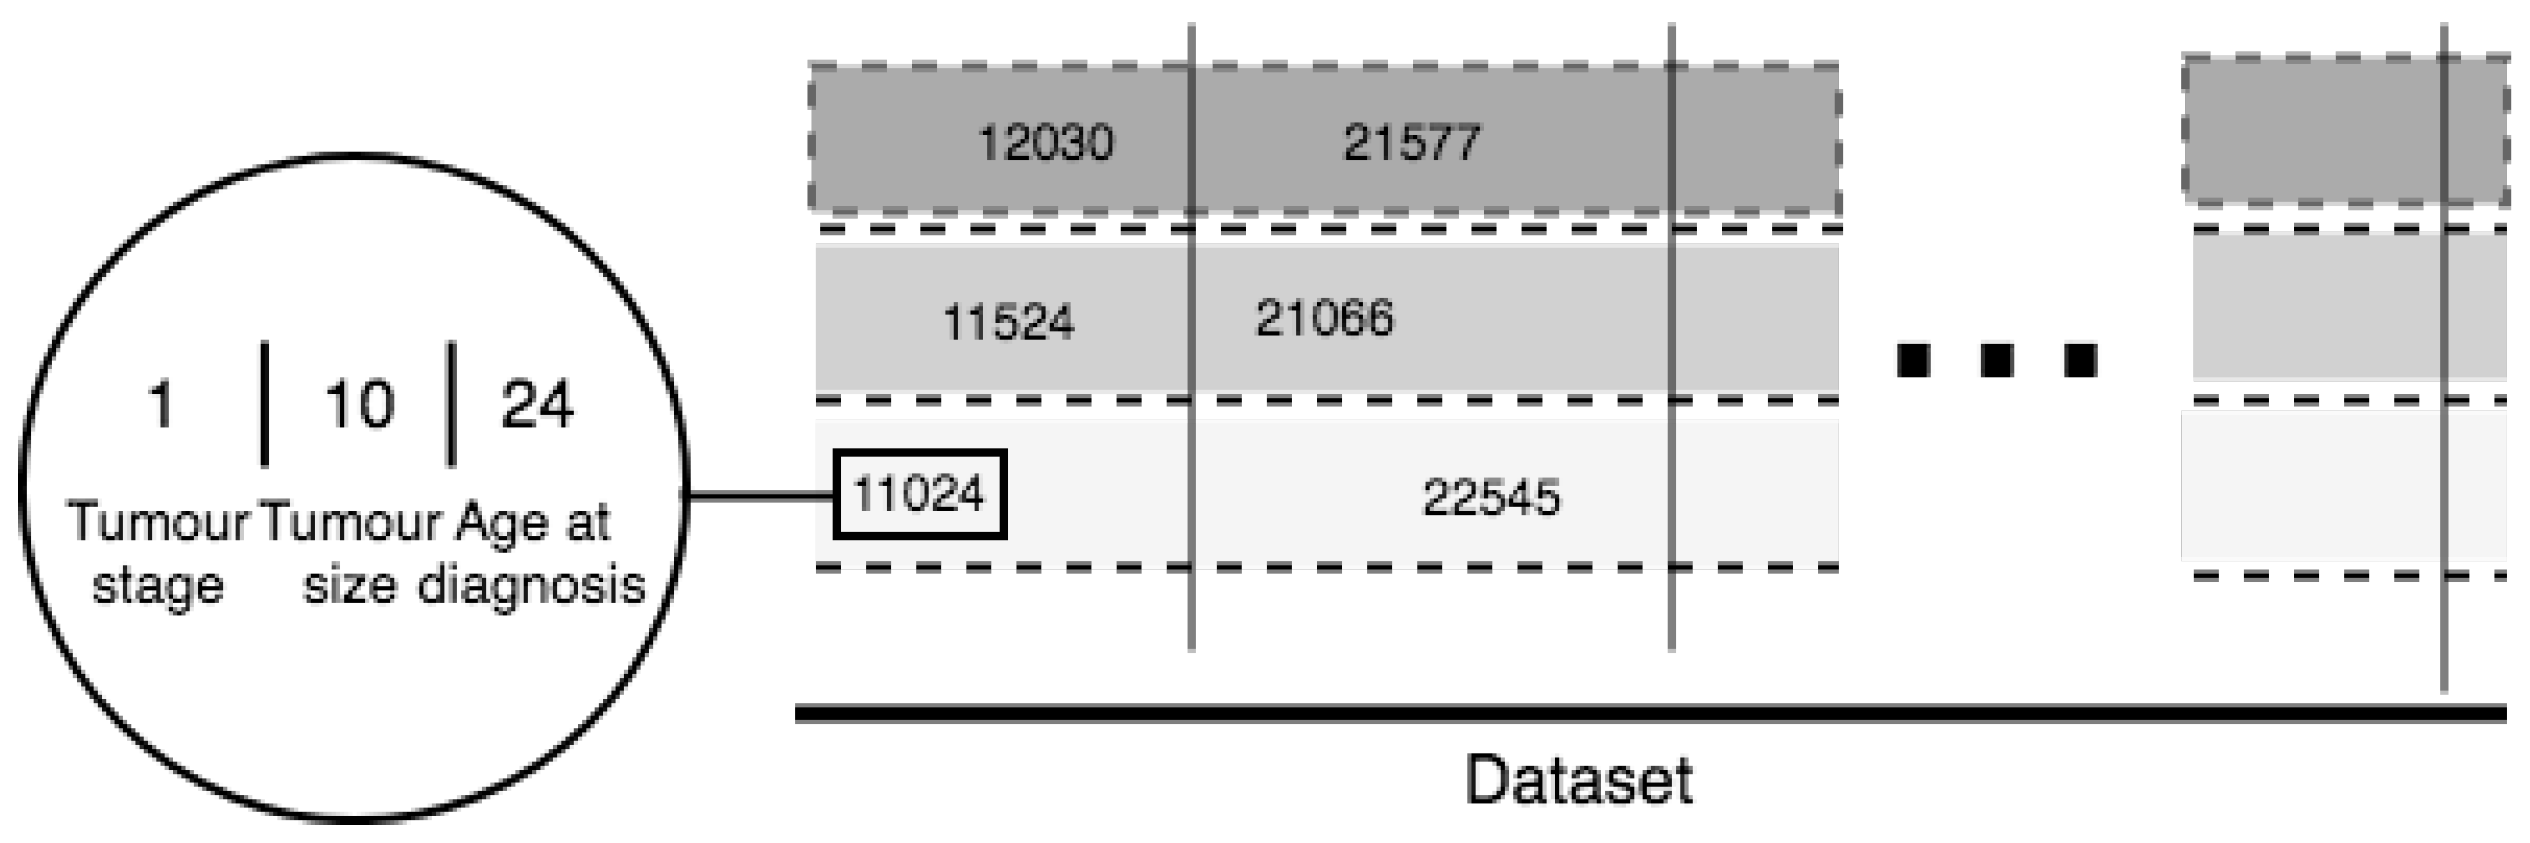
For the purposes of our study we developed a novel and universal predictive parameter—Tumor-Integrated Clinical Feature (TICF). This feature is built by numerically concatenating the tumor stage, tumor size, and age at diagnosis (Figure 3) in this exact order. The order of concatenation of these clinical parameters is important because of the ranking of clinical information about tumor development and its relevance to the patient survival rate. Specifically, a patient with a tumor in stage four, will have a shorter survival time compared to patients with a tumor in stage two. The next feature—tumor size—is added second because with an increase of the tumor size the survival rate of the patient is reduced. The tumor size is the second feature also because it is less important for the survival time than the stage of the tumor. The third used feature is the age at the time of diagnosis, where older patients have a lower survival rate. If the order of concatenation of these TICF-composing features would differ, patients with distant survival-related features would be incorrectly grouped. In this manner, we provide a normalized distance between patients, essential in our subsequent ML approaches to survival time prediction.
As already mentioned, TICF consists of three concatenated parameters: tumor stage, tumor size, and age at diagnosis. The columns virtually group the patients by TICF, regarding the first number—the tumor stage. The rows (split by dotted lines) sort patients according to the values of the TICF referring to the tumor size and age at diagnosis—from left to right following the growth of numerical axis. The introduced in the study TICF has been compared to the Nottingham Prognostic Index (NPI) which is used to determine prognosis following surgery for breast cancer [23]. TICF has shown better results than NPI.
6. Suggested Methodology
For the purposes of survival time prognosis, we normalize both datasets based on the TICF feature by removing the mean and scaling to unit variance. Scaling and centering happen independently on each feature by computing the relevant statistics on the samples in the training set. Mean and standard deviation are then stored to be used in later data analysis applying the transform method. Standardization of a dataset is a common requirement for many ML classifiers: they might behave badly if the individual feature does not more or less look like standard normally distributed data (with 0 mean and unit variance). Since we are aiming to use ML approaches for the purposes of our study, we prepare the data as follows: we apply splitting mechanism on our datasets to get the testing and training datasets.
The applied approach for normalization is based on the standard deviation of the training set to be able later to apply the same transformation on the testing set. An alternative standardization is based on scaling the features aiming to get them between a given minimum and maximum value, often between zero and one, or so that the maximum absolute value of each feature is scaled to unit size. The motivation to use this scaling includes robustness to very small standard deviations of features and preserving zero entries in sparse data.
The next stage in our methodology is to apply ML models to predict the survival time and to validate them. The used ML models include Support Vector Machine-Regression (SVR) with different kernels: RBF, Linear, and Polynomial, as well as Lasso regression, Kernel Ridge regression, K-neighborhood regression, decision tree and multi-layer perceptron (MLP) regression. More formally, a support vector machine-based method constructs a hyperplane or set of hyperplanes in a high- or infinite-dimensional space, which can be used for classification, regression, or other tasks such as outlier detection. Intuitively, a good separation is achieved by the hyperplane that has the largest distance to the nearest training-data point of any class (the so-called functional margin), which bears a lower generalization error of the classifier [24]. We use also Stochastic Gradient Descent model (SGD)—an algorithm for training a wide range of models in ML, including (linear) SVM, logistic regression and graphical models. When combined with the backpropagation algorithm, it is the de facto standard algorithm for training ANNs. Decision Tree Regressor creates a binary tree model that predicts the value of a target variable based on several input variables. Each interior node corresponds to one of the input variables; there are edges to children for each of the possible values of that input variable. Each leaf represents a value of the target variable given the values of the input variables represented by the path from the root to the leaf. Kernel Ridge Regression (KRR) combines ridge regression (linear least squares with l2-norm regularization) with kernel trick. Thus, trains a linear function in the space, induced by the respective kernel and the data. For non-linear kernels, this corresponds to a non-linear function in the original space. The form of the model learned by KRR is identical to SVR. However, different loss functions are used: KRR uses squared error loss while SVR uses epsilon-insensitive loss, both combined with l2 regularization. In contrast to SVR, fitting a KRR model can be done in closed-form and is typically faster for medium-sized datasets. On the other hand, the learned model is non-sparse and thus slower than SVR, which learns a sparse model for epsilon > 0, at prediction-time. The MLP regressor model optimizes the squared-loss using LBFGS or stochastic gradient descent. K-neighbors regressor—a supervised learning method based on k-nearest neighbor, which is a type of instance-based learning, where the function is only approximated locally, and all computation is deferred until classification. The target is predicted by local interpolation of the targets associated with the nearest neighbors in the training set. Lasso (Least Absolute Shrinkage and Selection Operator) is a supervised regression analysis-based method that performs both variable selection and regularization to enhance the prediction accuracy and interpretability of the model [25].
We chose these models because they have shown good results for survival time prediction [15]. We validate the results by using randomly smaller subsets of both raw and integrated data. On the next step these sets are used for cross-validation. In our ML workflow we use four different cross-validation and splitting mechanisms:
- Leave One Out—data are split each time in one chunk of training data and only one element falls into the test set
- Leave P Out—provides train/test datasets. This results in testing on all distinct samples of size p, while the remaining n-p samples form the training set in each iteration
- K-fold cross-validation—provides train/test indices to split data in train/test sets. Splits the dataset into k consecutive folds (without shuffling by default). Each fold is then used once as a validation parameter while the k-1 remaining folds form the training set. The advantage of this method is that all observations are used for both training and validation, and each observation is used for validation exactly once. 10-fold cross-validation is commonly used, but in general k remains an unfixed parameter
- ShuffleSplit—returns random chosen data for the training and testing sets. Such validation models can be used to estimate any quantitative measure of fit that is appropriate for both the data and the model.
7. Results and Discussion
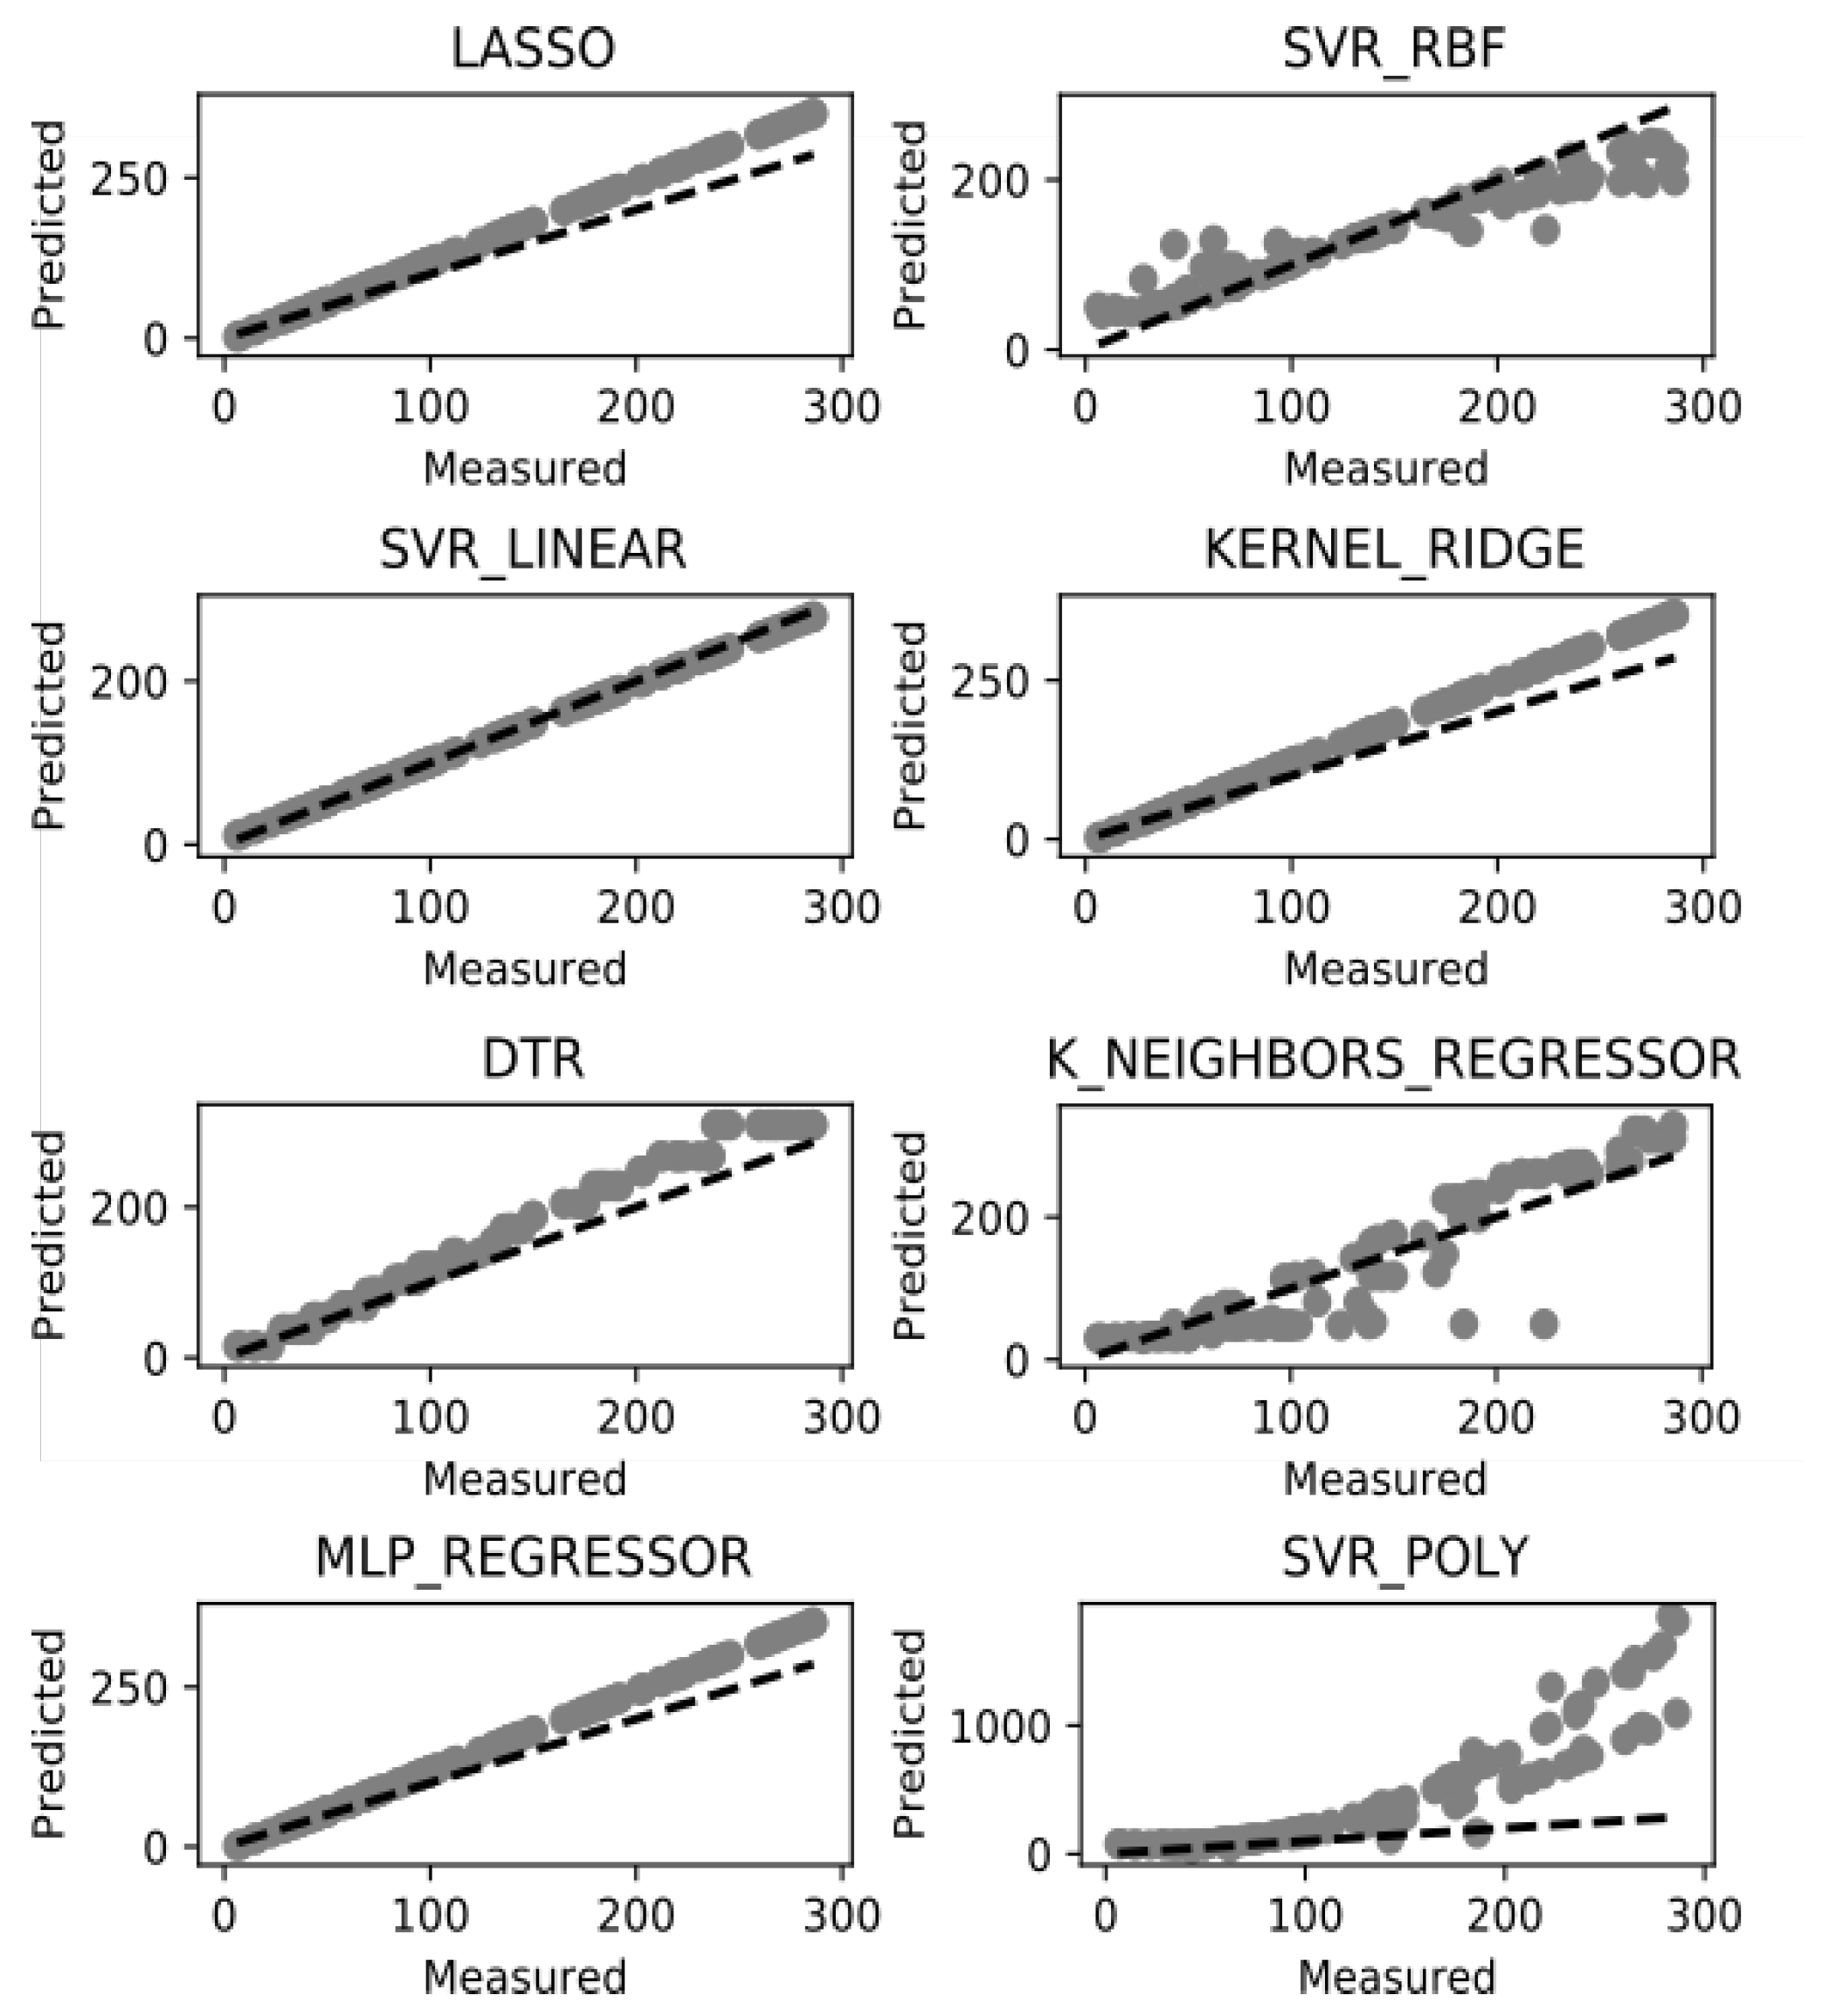
The suggested methodology for survival time prediction in breast cancer has been used with the aim of data classification. It is based on the k-neighbor classifier. The used groups of data are unbalanced and there are groups with small number of patient records which is an obvious obstacle to predict the survival time rate. In this line the test data is clustered in 5 groups using K-fold algorithm. After the dataset is normalized and classified, we can apply the above listed ML models for survival time prediction. The potential of these models is in the improving accuracy of prediction by better training of the dataset, which also depends on the data by itself. Figure 4 illustrates the performance of the eight experimented ML methods in terms of accuracy. All results are based on our newly introduced TCIF feature for prognosis of survival time from the examined dataset. TICF has been compared with NPI in our previous research [23] and showed better results in accuracy for survival time prediction.
Among the models, presented on Figure 4, there are five models: SVR-linear, Lasso, Kernel Ridge, DTR, and MLP regressor which have shown more accurate survival prognosis results than the others. Among these superior in accuracy models, the SVR-Linear model has best performance. Among the inferior used ML models in accuracy, the K_Neighbours_Regressor (KNR) has more dispersed values and the SVR-Poly and SVR-RBF are of similar performance. The DTR model can be considered as an intermediate in accuracy between the “good” and the “bad” ML models. Such results can be discussed both in the context of the models and in the context of the data. From the models’ point of view the linear (and possibly the simpler) models (with less preconditions) work better on such dataset, because of the low variation of the values, and better training of such data as used in the study. The remaining models which consider non-linear or polynomial-based methods are sparser in accuracy of such type of the data. On the other side the distribution of the introduced TCIF feature is close to normal which balances the dataset by having more cases in the second and third stage of the cancer development than in the first and fourth stage. This fact additionally emphasizes the appropriate normalization of the data by using the TICF integrated feature.
The implied understanding of accuracy is based on binary term but the survival time is given in months for any particular patient. The so-defined accuracy of survival time is the ratio of the predicted score related to the mean score values of the test datasets. We predict how many months remain in terms of survival time prognosis as compared to those given in the test dataset.
The validation of the used ML models for survival time prognosis has strong relation with the way we split the data for testing and training. In our case we use for data normalization standard deviation, min-max values, and max absolute values for managing the test and training datasets. For each ML model we use, a suitable approach for data normalization is included in our workflow.
For validation of the ML models for survival time prognosis we split the training dataset in 5 subsets by the K-fold approach (k = 5). After that for cross-validation we test each split dataset against the whole, trained dataset (Figure 5). In K-fold cross-validation, the original sample is randomly partitioned into k equal sized subsamples. Of the k subsamples, a single subsample is retained as the validation data for testing the model, and the remaining k—1 subsamples are used as training data [26,27]. We based our cross-validation approach on four parameters for evaluation. Two of the parameters: trained R2 (coefficient of determination) and explained variance, are related to the success of the accurate prognosis of the survival time and the other two: negative mean square log error and negative mean absolute error, are related to the error level of the fitted ML models. The results shown in Figure 5 underline that the introduced by us TCIF feature has very good performance in accuracy. The outcomes of the cross-validation assessment (as related to the success of the accurate prognosis) showed the superiority of the same ML models for prognosis of survival time: Lasso, Kernel Ridge, DTR, KNR, and SVR-Linear. The KNR is included in this list of models, instead the MLP regressor, which proved to have worse accuracy and error level in cross-validation. The DTR model also demonstrates good performance in accuracy. In the context of error level, the used parameters in our cross-validation design—negative mean square log error, and negative mean absolute error—show lower error level for Lasso model and also have acceptable values for other linear models as SVR-Linear, KNR, Kernel Ridge aside from the DTR model to a certain extent. This discussion also can be confirmed by the values of the cross-validation parameters for the applied models, given in Table 1. The highest values for the R2 have Lasso, Kernel Ridge, DTR, KNR and SVR-Linear (varying from 1.000 to 0.983) and this is confirmed by the values of the explained variance. The error level presented by the cross-validation parameters of negative mean absolute error and negative median absolute error confirms the adequate choice of the applied ML models by assigning lowest values to the same listed above models. To a great extent these outcomes concerning models with better accuracy are similar to the ones published in other studies [27,28]. The used variety and combinations of ML models have slight advantage over the ones that uses a single ML approach [18].
For our study we used hardware resources with the following specification: 2 x Intel(R) Xeon(R) CPU E5-2620 0 @ 2.00GHz, RAM 32GB DDR3 1333 MHz. The parameter settings of each applied model were tested in various numerical values. The best outcomes in accuracy and running time (Table 1 and Table 2), given in the paper, were obtained by using parameters settings for linear models: C = 1 and Gamma = auto, which is equal to 1/n_features. For the DTR model the initial setting max_depth is chosen to be equal to 4, which again is a default parameter setting from the used scikit-learn Python library [12]. For Kernel_Ridge we also used the default parameter setting, alpha = 1, kernel = “linear”, degree = 3. MLP_Regressor has hidden layer size = 500. KNR parameter settings are default with n_neighbor = 5. Lasso is also with default parameters with alpha = 1.
The processing time of the ML models used in the study are not time demanding except the ML Regressor and the SVR_Poly to a certain extent. All other models have compatible running time. The favorable models in the study in terms of success of accurate prognosis and lower error level: SVR-linear, KNR, Kernel Ridge aside from the DTR showed also good to very acceptable processing time which explains the efficiency of their use.
8. Conclusions and Future Work
This paper discusses an original approach to integration of data from two cancer studies concerning all details of the records. This approach is based on horizontal and vertical integration by using document-oriented and graph databases which demonstrate good performance and no data losses. A set of ML-based models have been applied for survival time prognosis in breast cancer and the corresponding results are analyzed in the paper. A new TICF integrated feature for classification and analysis of survival prognosis was suggested and experimented in eight different ML models. Furthermore, the behavior of these methods was compared in the context of our particular task. The SVR-Linear, Lasso, Kernel Ridge, KNR, and DTR showed most accurate survival prognosis results. The cross-validation for accuracy of the used models shows best performance for the same models.
The main advantages of the presented work are the definition and use of a new integrated feature (TICF) and the proper combination of several ML models which gives definite originality of our study and confirms the related results of other authors working with ML techniques applied to breast cancer prognosis [18,27,28].
A potential future development of the presented work is to apply ML models to other data with different features, concerning the survival prognosis of the patients. We also plan to make some substantial improvements of our Python-based workflow and in particular to make it a web-based application with additional services.
Author Contributions
Writing original draft I.M. and D.V.; Writing—review and editing M.N. and I.M. developed the code for the analysis. All authors read and approved the final manuscript.
Funding
The research presented in this paper has been supported by Project BG05M2OP001-1.001-0004 “Universities for Science, Informatics and Technologies in the e-Society (UNITe)” funded by Operational Program Science and Education for Smart Growth, co-funded by the European Union through the European Structural and Investment Funds. The development of the discussed workflow has been partly supported by the Bulgarian NSF within the “GloBIG: A Model of Integration of Cloud Framework for Hybrid Massive Parallelism and its Application for Analysis and Automated Semantic Enhancement of Big Heterogeneous Data Collections” Project, Contract DN02/9/2016.
Conflicts of Interest
The authors declare no conflict of interest.
References
- Hull, R.; Wodtke, W.D.; Weissenfels, J.; Weikum, G.; Patil, R.S.; Fikes, R.E.; Patel-schneider, P.F.; Mckay, D.; Finin, T.; Gruber, T.R.; et al. Managing Semantic Heterogeneity in Databases: A Theoretical Perspective. In Proceedings of the Sixteenth ACM SIGACT-SIGMOD-SIGART Symposium on Principles of Database Systems, Tucson, AZ, USA, 11–15 May 1997; pp. 51–61. [Google Scholar]
- Ullman, J. Information Integration Using Logical Views. In Proceedings of the International Conference on Database Theory, Delphi, Greece, 8–10 January 1997; Springer: Berlin/Heidelberg, Germany, 1997; pp. 19–40. [Google Scholar]
- DeSantis, C.E.; Ma, J.; Goding Sauer, A.; Newman, L.A.; Jemal, A. Breast cancer statistics, 2017, racial disparity in mortality by state. CA Cancer J. Clin. 2017, 67, 439–448. [Google Scholar] [CrossRef] [PubMed]
- Cruz, J.A.; Wishart, D.S. Applications of Machine Learning in Cancer Prediction and Prognosis. Cancer Inform. 2006, 2. [Google Scholar] [CrossRef]
- Weston, A.D.; Hood, L. Systems Biology, Proteomics, and the Future of Health Care: Toward Predictive, Preventative, and Personalized Medicine. J. Proteome Res. 2004, 3, 179–196. [Google Scholar] [CrossRef] [PubMed] [Green Version]
- Tattersall, M.H.N.; Ellis, P.M.; Butow, P.N.; Hagerty, R.G.; Dimitry, S. Communicating prognosis in cancer care: A systematic review of the literature. Ann. Oncol. 2005, 16, 1005–1053. [Google Scholar]
- Futschik, M.E.; Sullivan, M.; Reeve, A.; Kasabov, N. Prediction of clinical behaviour and treatment for cancers. Appl. Bioinform. 2003, 2, 53–58. [Google Scholar]
- Kourou, K.; Exarchos, T.P.; Exarchos, K.P.; Karamouzis, M.V.; Fotiadis, D.I. Machine learning applications in cancer prognosis and prediction. Comput. Struct. Biotechnol. J. 2015, 13, 8–17. [Google Scholar] [CrossRef] [PubMed] [Green Version]
- Liu, Y.; Wang, C.; Zhang, L. Decision Tree Based Predictive Models for Breast Cancer Survivability on Imbalanced Data. In Proceedings of the 3rd International Conference on Bioinformatics and Biomedical Engineering, iCBBE 2009, Beijing, China, 11–13 June 2009; pp. 1–4. [Google Scholar]
- Delen, D.; Walker, G.; Kadam, A. Predicting breast cancer survivability: A comparison of three data mining methods. Artif. Intell. Med. 2005, 34, 113–127. [Google Scholar] [CrossRef] [PubMed]
- Djebbari, A.; Liu, Z.; Phan, S.; Famili, F. An ensemble machine learning approach to predict survival in breast cancer. Int. J. Comput. Biol. Drug Des. 2008, 1, 275–294. [Google Scholar] [CrossRef] [PubMed]
- Lisboa, P.; Wong, H.; Harris, P.; Swindell, R. A Bayesian neural network approach for modelling censored data with an application to prognosis after surgery for breast cancer. Artif. Intell. Med. 2003, 28, 1–25. [Google Scholar] [CrossRef]
- Seker, H.; Odetayo, M.O.; Petrovic, D.; Naguib, R.N.; Bartoli, C.; Alasio, L.; Lakshmi, M.S.; Sherbet, G.V. Assessment of nodal involvement and survival analysis in breast cancer patients using image cytometric data: Statistical, neural network and fuzzy approaches. Anticancer Res. 2002, 22, 433–438. [Google Scholar] [PubMed]
- Halevy, A.Y. Answering queries using views: A survey. VLDB J. 2001, 10, 270–294. [Google Scholar] [CrossRef] [Green Version]
- Zhang, H.; Guo, Y.; Li, Q.; George, T.J.; Shenkman, E.A.; Bian, J. Data Integration through Ontology-Based Data Access to Support Integrative Data Analysis: A Case Study of Cancer Survival. In Proceedings of the IEEE International Conference on Bioinformatics and Biomedicine, Kansas City, MO, USA, 13–16 November 2017; pp. 1300–1303. [Google Scholar]
- Liang, M.; Li, Z.; Chen, T.; Zeng, J. Integrative Data Analysis of Multi-Platform Cancer Data with a Multimodal Deep Learning Approach. IEEE/ACM Trans. Comput. Biol. Bioinform. 2015, 12, 928–937. [Google Scholar] [CrossRef] [PubMed]
- Chaudhary, K.; Poirion, O.B.; Lu, L.; Garmire, L.X. Deep Learning–Based Multi-Omics Integration Robustly Predicts Survival in Liver Cancer. Clin. Cancer Res. 2018, 24, 1248–1259. [Google Scholar] [CrossRef] [PubMed]
- Abreu, P.H.; Santos, M.S.; Abreu, M.H.; Andrade, B.; Silva, D.C. Predicting Breast Cancer Recurrence Using Machine Learning Techniques: A Systematic Review. ACM Comput. Surv. 2016, 49, 52. [Google Scholar] [CrossRef]
- Aloraini, A. Different Machine Learning Algorithms for Breast Cancer Diagnosis. Int. J. Artif. Intell. Appl. 2012, 3, 21–30. [Google Scholar] [CrossRef]
- Pedregosa, F.; Varoquaux, G.; Gramfort, A.; Michel, V.; Thirion, B.; Grisel, O.; Blondel, M.; Prettenhofer, P.; Weiss, R.; Dubourg, V.; et al. Scikit-learn: Machine Learning in Python. J. Mach. Learn. Res. 2011, 12, 2825–2830. [Google Scholar]
- Python Release Python 3.7.0. Available online: https://www.python.org/downloads/release/python-370/ (accessed on 2 March 2019).
- Nayak, A.; Poriya, A.; Poojary, D. Article: Type of NOSQL databases and its comparison with relational databases. Int. J. Appl. Inf. Sys. 2013, 5, 16–19. [Google Scholar]
- Mihaylov, I.; Nisheva, M.; Vassilev, D. Machine Learning Techniques for Survival Time Prediction in Breast Cancer. In Proceedings of the 18th International Conference on Artificial Intelligence: Methodology, Systems, Applications, AIMSA 2018, Varna, Bulgaria, 12–14 September 2018; Springer: Cham, Switzerland; pp. 186–194. [Google Scholar]
- Gupta, S.; Tran, T.; Luo, W.; Phung, D.; Kennedy, R.L.; Broad, A.; Campbell, D.; Kipp, D.; Singh, M.; Khasraw, M.; et al. Machine-learning prediction of cancer survival: A retrospective study using electronic administrative records and a cancer registry. BMJ Open 2014, 4. [Google Scholar] [CrossRef] [PubMed]
- Have, C.T.; Jensen, L.J. Are graph databases ready for bioinformatics? Bioinformatics 2013, 29, 3107–3108. [Google Scholar] [CrossRef] [PubMed] [Green Version]
- McLachlan, G.; Do, K.; Ambroise, C. Analyzing Microarray Gene Expression Data; Wiley: New York, NY, USA, 2004. [Google Scholar]
- Lindqvist, N.; Price, T. Evaluation of Feature Selection Methods for Machine Learning Classification of Breast Cancer; Degree Project in Computer Science; KTH Royal Institute of Technology: Stockholm, Sweden, 2018. [Google Scholar]
- Akay, M.F. Support vector machines combined with feature selection for breast cancer diagnosis. Expert Syst. Appl. 2009, 36, 3240–3247. [Google Scholar] [CrossRef]
Figure 1.
Raw data structure.

Figure 2.
Workflow of data integration and subsequent processing included in our framework.

Figure 3.
TICF complex feature.

Figure 4.
Survival time prediction success rate.

Figure 5.
Error rate of Machine learning models applied for survival time prediction. Where on the x axis are the groups and on the y axis are shown accuracy and error rate estimate measures.
Figure 5.
Error rate of Machine learning models applied for survival time prediction. Where on the x axis are the groups and on the y axis are shown accuracy and error rate estimate measures.


Table 1.
Aggregated results of cross-validation.
| ML Model | Train R2 | Explained Variance | Negative Mean Absolute Error | Negative Median Absolute Error | ||||
|---|---|---|---|---|---|---|---|---|
| Mean | StD | Mean | StD | Mean | StD | Mean | StD | |
| LASSO | 1.000 | 0.000 | 1.000 | 0.000 | −0.356 | 0.020 | −0.326 | 0.025 |
| SVR-RBF | 0.318 | 0.038 | 0.341 | 0.032 | −45.742 | 5.224 | −34.455 | 5.594 |
| SVR-LINEAR | 0.983 | 0.007 | 0.986 | 0.006 | −7.288 | 1.935 | −6.109 | 1.509 |
| KERNEL RIDGE | 0.999 | 0.000 | 0.999 | 0.000 | −1.853 | 0.340 | −1.686 | 0.454 |
| DTR | 0.996 | 0.000 | 0.996 | 0.427 | −5.624 | 0.427 | −4.636 | 0.467 |
| KNR | 0.988 | 0.001 | 0.988 | 0.001 | −7.007 | 1.384 | −4.725 | 0.744 |
| ML REGRESSION | 0.603 | 0.029 | 0.607 | 0.028 | −39.592 | 7.001 | −34.549 | 10.064 |
| SVR-POLY | 0.884 | 0.007 | 0.887 | 0.009 | −20.354 | 3.290 | −15.581 | 5.382 |
Table 2.
Execution time of the applied ML models per iteration. in terms of time of training, predict and total time which are sum of the train plus predict time.
Table 2.
Execution time of the applied ML models per iteration. in terms of time of training, predict and total time which are sum of the train plus predict time.
| ML Model | Train (s) | Predict (s) | Total (s) |
|---|---|---|---|
| LASSO | 0.027842999 | 0.000209093 | 0.028052092 |
| SVR-RBF | 0.070589066 | 0.001976013 | 0.072565079 |
| SVR-LINEAR | 0.050335884 | 0.000173092 | 0.050508976 |
| KERNEL RIDGE | 0.106621981 | 0.002275944 | 0.108897924 |
| DTR | 0.028145075 | 0.000221968 | 0.028367043 |
| KNR | 0.070935965 | 0.001635075 | 0.072571039 |
| ML REGRESSION | 3.409966946 | 0.00106287 | 3.411029816 |
| SVR-POLY | 0.479592085 | 0.001157999 | 0.480750084 |
© 2019 by the authors. Licensee MDPI, Basel, Switzerland. This article is an open access article distributed under the terms and conditions of the Creative Commons Attribution (CC BY) license (http://creativecommons.org/licenses/by/4.0/).
Share and Cite
MDPI and ACS Style
Mihaylov, I.; Nisheva, M.; Vassilev, D. Application of Machine Learning Models for Survival Prognosis in Breast Cancer Studies. Information 2019, 10, 93. https://0-doi-org.brum.beds.ac.uk/10.3390/info10030093
AMA Style
Mihaylov I, Nisheva M, Vassilev D. Application of Machine Learning Models for Survival Prognosis in Breast Cancer Studies. Information. 2019; 10(3):93. https://0-doi-org.brum.beds.ac.uk/10.3390/info10030093
Chicago/Turabian StyleMihaylov, Iliyan, Maria Nisheva, and Dimitar Vassilev. 2019. "Application of Machine Learning Models for Survival Prognosis in Breast Cancer Studies" Information 10, no. 3: 93. https://0-doi-org.brum.beds.ac.uk/10.3390/info10030093
Note that from the first issue of 2016, this journal uses article numbers instead of page numbers. See further details here.