Interoperability Conflicts in Linked Open Statistical Data


Information Systems Lab, University of Macedonia, Egnatia 156, 54636 Thessaloniki, Greece
*
Author to whom correspondence should be addressed.
Information 2019, 10(8), 249; https://0-doi-org.brum.beds.ac.uk/10.3390/info10080249
Submission received: 31 May 2019
/
Revised: 24 July 2019
/
Accepted: 24 July 2019
/
Published: 27 July 2019
(This article belongs to the Special Issue Linked Open Data)
Abstract
:An important part of Open Data is of a statistical nature and describes economic and social indicators monitoring population size, inflation, trade, and employment. Combining and analyzing Open Data from multiple datasets and sources enable the performance of advanced data analytics scenarios that could result in valuable services and data products. However, it is still difficult to discover and combine Open Statistical Data that reside in different data portals. Although Linked Open Statistical Data (LOSD) provide standards and approaches to facilitate combining statistics on the Web, various interoperability challenges still exist. In this paper, we propose an Interoperability Framework for LOSD, comprising definitions of LOSD interoperability conflicts as well as modelling practices currently used by six official open government data portals. Towards this end, we combine a top-down approach that studies interoperability conflicts in the literature with a bottom-up approach that studies the modelling practices of data portals. We define two types of LOSD schema-level conflicts, namely naming conflicts and structural conflicts. Naming conflicts result from using different URIs. Structural conflicts result from different practices of modelling the structure of data cubes. Only two out of the 19 conflicts are currently resolved and 11 can be resolved according to literature.
1. Introduction
Governments, public authorities, and companies are increasingly opening up the data they produce or collect [1]. Today, more than 2600 Open Data portals around the globe provide access to Open Data. Statistical data comprise a major part of Open Data. They typically refer to economic and social statistics monitoring the population size, inflation, trade, and employment but also to aggregated governmental data such as the number of government vehicles per public authority. Statistical data are structured as “data cubes” that comprise measures (e.g., unemployment rate) and dimensions describing the measures (e.g., country and year).
Combining data cubes from different data portals may unleash the full potential of Open Data [2,3,4,5,6] based on Business Intelligence analytics [7]. Linked data is a promising paradigm towards this direction, since it facilitates data integration on the Web. In data cubes, linked data has the potential to realize the vision of performing advanced data analytics on previously isolated data cubes across the Web [8].
Data cubes can be modelled as RDF graphs using vocabularies such as the RDF data cube (QB) vocabulary [9], a World Wide Web Consortium (W3C) recommendation for modelling Linked Open Statistical Data (LOSD). Other vocabularies include the Simple Knowledge Organization System (SKOS) vocabulary [10], which is also a W3C standard, and the Extended Knowledge Organization System (XKOS) vocabulary [11]. SKOS allows defining the structure and contents of code lists. XKOS is an extension of SKOS that enables modelling hierarchical structures with multiple levels.
In practice, however, creating LOSD remains a complex task due to modelling challenges that arise either because the application of existing vocabularies (which we call modelling practice) is not always clear or because of the absence of standard vocabularies [12]. As a result, LOSD are not published in a uniform way and remain isolated and non-interoperable.
The problem of data interoperability has been thoroughly studied in the past in the context of databases and data warehouses (e.g., in [3,13,14,15]). In particular, different types of interoperability conflicts (e.g., schema conflicts and data conflicts) have been defined that inhibit the interoperability of data residing in databases and data warehouses [16].
The aim of this paper is to define a framework comprising (i) interoperability conflicts in LOSD and (ii) modelling practices of portals with LOSD. To this end, we adopt a two-fold approach that (i) theoretically translates interoperability conflicts of databases and data warehouses to LOSD interoperability conflicts (top-down) and (ii) studies the modelling practices of six data portals that result in LOSD interoperability conflicts (bottom-up).
The rest of the paper is organized as follows: Section 2 presents the background knowledge required to understand the contents of this research and Section 3 describes the approach of this research. Section 4 presents details on the six investigated LOSD portals and Section 5 present interoperability conflicts of traditional databases and data warehouses. Thereafter, Section 6 defines LOSD interoperability conflicts and Section 7 evaluates the current state of LOSD interoperability conflicts. Finally, Section 8 discusses the results and identifies open research issues.
2. Background
This Section presents the theoretical background required to understand this study. In particular, (i) we describe the Data Cube model that is used to structure multidimensional data, and (ii) we present the main concepts of LOSD.
2.1. The Data Cube Model
The Data Cube model aims to cover the needs of the Online Analytical Processing (OLAP) and data warehouse systems [17]. Although a data cube has been defined in various ways, all definitions agree that it comprises [4,18,19,20]: (1) measures, which represent numerical values (e.g., unemployment), and (2) dimensions that provide contextual information on the measures (e.g., geospatial or temporal dimension). Dimensions are populated with a set of distinct values (e.g., a temporal dimension can be populated with values “2018”, “2019” etc.). Finally, different granularities of a dimension can be represented by hierarchical levels. For instance, a geospatial dimension may have levels such as country, region, city etc.
A data cube, for example, that measures unemployment rate in European countries (measure) is described by the time, the country, and the age group (dimensions). The distinct values of the time dimension could be “2017”, “2018”, and “2019”, while of the country dimension “GR”, “IT”, and “FR”. Similarly, the age-group dimension can be populated with values “00–24”, “25–49”, and “50+”. All dimensions have a single hierarchical level. Additional hierarchical levels, however, could be used, for example, in the geospatial dimension by including, apart from countries, values for regions.
2.2. Linked Statistical Data
Linked data technologies are based on the Semantic Web philosophy and are mainly about publishing structured data in RDF format using URIs rather than focusing on the ontological level or inferencing [21].
The QB vocabulary [9] is a W3C standard for publishing statistical data on the Web based on the principles of linked data. The core class of the QB vocabulary is qb:DataSet that represents a data cube. A data cube comprises a set of dimensions (qb:DimensionProperty) and measures (qb:MeasureProperty), as well as attributes (qb:AttributeProperty) that are used to represent structural metadata such as the unit of measurement. Finally, the observations of a data cube a represented as instances of qb:Observation.
A common practice for populating the values of the dimensions is to re-use predefined values included in code lists. For example, the values of a geospatial dimension can be populated by values included in a code list defining the geographical or administrative divisions of a country. Code lists can be specified using either the QB vocabulary or the SKOS vocabulary. The values of code lists may have hierarchical relations which can be expressed using the SKOS vocabulary (e.g., using the skos:narrower property), the QB vocabulary (e.g., using the qb:parentChildProperty) or the XKOS vocabulary (e.g., using the xkos:isPartOf property).
Finally, the UK Government Linked Data Working Group [22] has developed a set of common resources such as dimensions (e.g., sdmx:timePeriod, sdmx:refArea, and sdmx:sex), measures sdmx:obsValue, attributes, and code lists that are widely used for creating LOSD. The definitions of these concepts are based on SDMX.
3. Research Approach
This paper combines a top-down with a bottom-up approach to define interoperability conflicts in LOSD.
The top-down approach translates the interoperability conflicts of traditional databases and data warehouses found in the literature to LOSD interoperability conflicts. To this end, we first studied the two types of interoperability conflicts of databases and data warehouses, namely schema and data conflicts, as well as their sub-types (see Section 5). We decided to exclude data conflicts from our research because they strongly depend on the specific values of the data cubes, hence we cannot create generic definitions. We then transformed the definitions of conflicts to LOSD interoperability conflicts based on the following assumptions:
- Database attributes can be conceptually mapped to the main QB components of a data cube’s structure (i.e., measure, dimension, and attribute properties). For example, assuming that a “Sales” database entity includes a “Country” attribute and, in addition, a “SalesQuantity” attribute to indicate the quantity of sales in each country, “SalesQuantity” can be mapped to an instance of qb:MeasureProperty and “Country” to an instance of qb:DimensionProperty.
- The names of the database attributes are mapped to RDF properties (i.e., URIs) of the corresponding QB components. In the previous example, “Country” can be mapped to sdmx-dimension:refArea.
- Database records can be mapped to qb:Observation triples.
The bottom-up approach studies modelling practices of LOSD portals to understand the interoperability conflicts they create. To this end, we selected six data portals i.e., the data portals of (i) the Scottish Government (https://statistics.gov.scot/), (ii) the UK Department for Communities and Local Government (DCLG) (http://opendatacommunities.org/), (iii) the environmental department of the Flemish Government (VLO) (https://id-ontwikkel.milieuinfo.be/), (iv) the Official Statistics in Japan (e-Stat) (http://data.e-stat.go.jp/lodw/), (v) the Italian National Institute of Statistics (ISTAT) that hosts the Italian census 2011 (http://datiopen.istat.it/), and (vi) the Irish CSO data portal that hosts the 2011 Irish Census (http://data.cso.ie/). These data portals were selected because (i) they are official open government data portals, (ii) they publish open government data as LOSD, and (iii) they have published a relatively large amount of datasets (see Section 4).
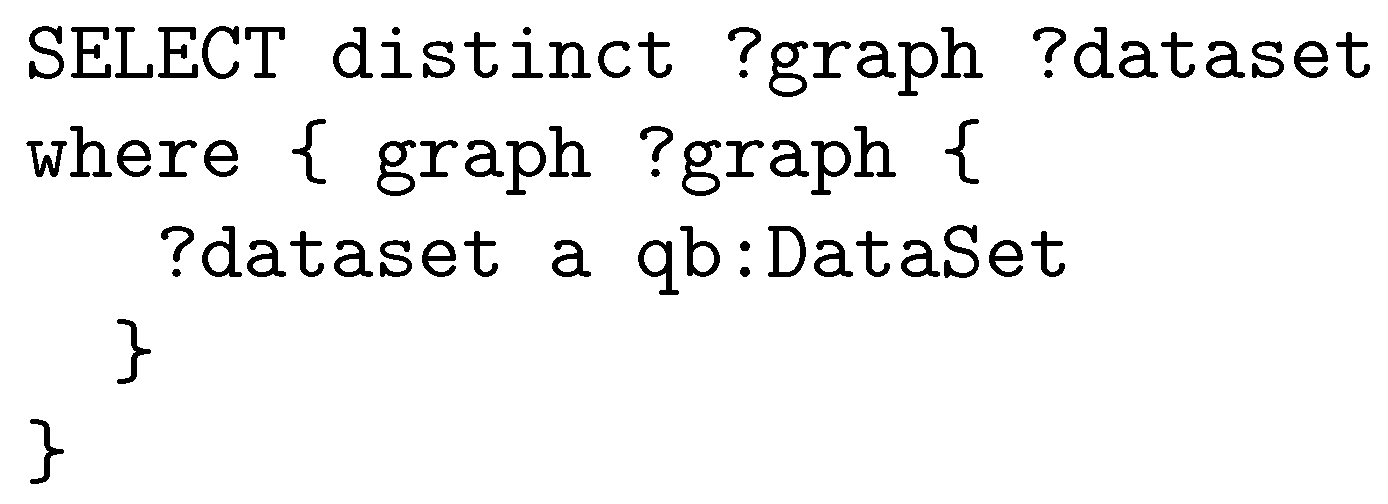
We visited each data portal several times and executed SPARQL queries to their SPARQL endpoints to identify and understand their modelling practices. In particular, we first used SPARQL queries to understand the general policy used by data portals for publishing data cubes. For example, the results of the SPARQL query in Figure 1 presents the graphs that include datasets in a data portal. Then, we searched data cubes for the components that are linked to the core class of the QB vocabulary namely qb:DataSet. We used the results to create consecutive SPARQL queries until we finish exploring and completely understanding the structure of the data cube. At the same time, we also checked the qb:Observation of the data cubes. For example in order to identify the name (i.e., URI) used for the measure property, we identified the qb:DataStructureDefinition resource of the data cubes and, through this, the corresponding resource that is instance of qb:MeasureProperty (e.g., eg:unemployment). In addition, we also searched in the observations of the data cube to understand how they use the measure property.
We labelled LOSD conflicts as Open or Solved. Conflicts are considered to be Solved when all data portals adopt the same practice and as Open when they result from different practices of data portals. Finally, we studied the practices suggested by nine LOSD experts [12] to understand which open conflicts can be currently resolved following a specific practice and which need to be further investigated.
4. Portals with Linked Open Statistical Data
Today, a large volume of LOSD is provided on the Web through dedicated open government data portals. This subsection describes the datasets of six official data portals launched by organizations and public authorities, namely the data portals of the Scottish and Japan’s (e-Stat) governments, the data portal of the environmental department of the Flemish government (VLO), of DCLG in the UK, and the data portals that host the Italian (ISTAT) and Irish (Irish CSO) 2011 censuses. The details of all data portals including number of data cubes, number of observations, and others are presented in Table 1.
The Scottish Government provides official data on “Neighborhood Statistics” as LOSD. In particular, it provides access to 238 data cubes classified into 18 themes such as housing and transport. In addition, DCLG provides LOSD that describe various indicators including local government finance and housing and homelessness. In particular, they provide access to 167 data cubes classified into 14 themes (e.g., homelessness and societal well-being). VLO provides nine data cubes that describe gas emissions in Flanders as LOSD, while the portal site of the Official Statistics in Japan (e-Stat) provides 78 data cubes from seven sources of statistics including a population census, an economic census, and a labor force survey [23]. Finally, two censuses have been published as LOSD: (i) the Italian census 2011 published by the Italian National Institute of Statistics (ISTAT) with 8 cubes, and (ii) the Irish Census 2011 with 682 cubes.
The number of measures and dimensions of the data cubes provided by the data portals relates to the number of published data cubes; many cubes usually implies a large number of distinct measures and dimensions. DCLG, for example, uses the largest number of measures (156) and distinct dimensions (205), while the data cubes of e-Stat have only 6 measures and 36 distinct dimensions. A special case is ISTAT that uses the same number (8) of data cubes and measures (each data cube has one distinct measure).
The geospatial and temporal dimensions are the most commonly used dimensions of the data cubes. All data portals use geospatial dimensions of different hierarchical levels (e.g., region, province, district). e-Stat uses the largest number of geospatial values (941,506) followed by ISTAT (426,725). A peculiarity of the Irish Census is that they publish different data cubes for each geographical level. For example, they provide 12 data cubes that measure unemployment, one for each of the 12 geographical levels, hence, resulting in many data cubes. In addition, all data portals except for the Irish Census use a temporal dimension and populate it with values from different levels (e.g., years, quarters). From the two censuses, the Irish CSO does not use a temporal dimension as all data refer to the same time period (i.e., 2011), while ISTAT uses a temporal dimension with a fixed value.
All numerical values have been computed using SPARQL queries. For example, the SPARQL query presented in Figure 2 was used to count the number of distinct measure properties.
Finally, a large volume of LOSD are also published by several, unofficial third-party activities. For example, Eurostat’s data portal for linked data (http://eurostat.linked-statistics.org/), which was created during a research project, includes more than 5000 cubes. Moreover, few statistical datasets from the European Central Bank, World Bank, UNESCO and other international organizations have been also transformed into linked data using the QB vocabulary in a third-party activity [24]. Finally, 2011 census data from Greece [25] and historical censuses from the Netherlands [26] are also available as LOSD.
5. Interoperability Conflicts of Databases and Data Warehouses
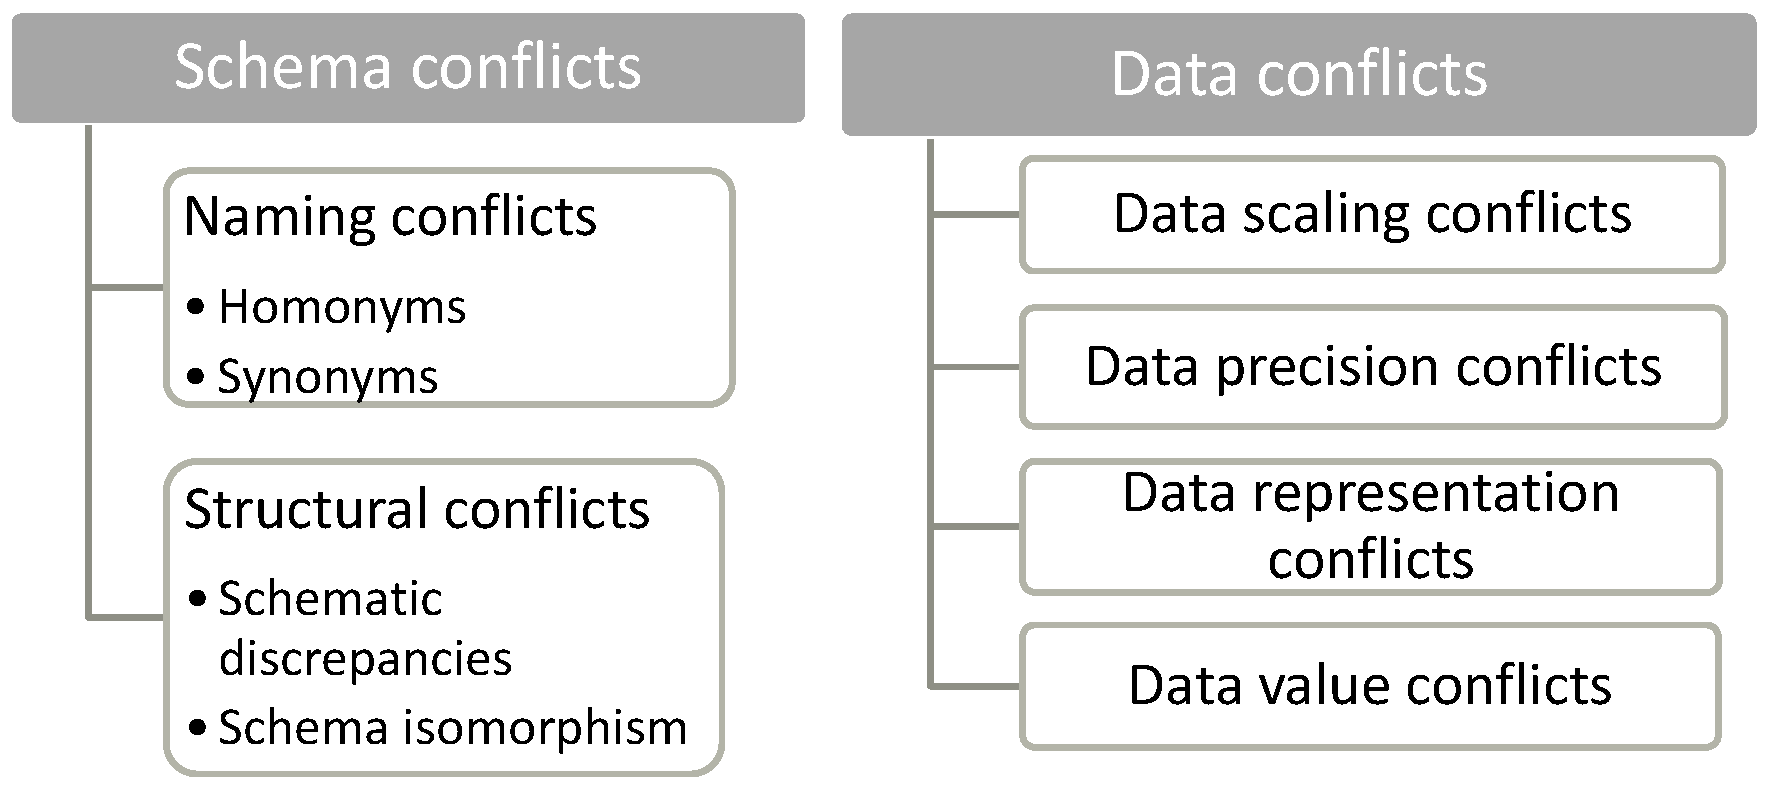
A recent study [16] conducted a systematic literature review of the interoperability conflicts of traditional databases and data warehouses and identified two main types of conflicts that can be also applied to LOSD, namely schema conflicts and data conflicts (Figure 3). Schema conflicts regard the database model while data conflicts the data included in the database tables. Schema conflicts can be further classified to naming conflicts and structural conflicts. Correspondingly, data conflicts can be further classified into data scaling conflicts, data precision conflicts, data representation conflicts, and data value conflicts.
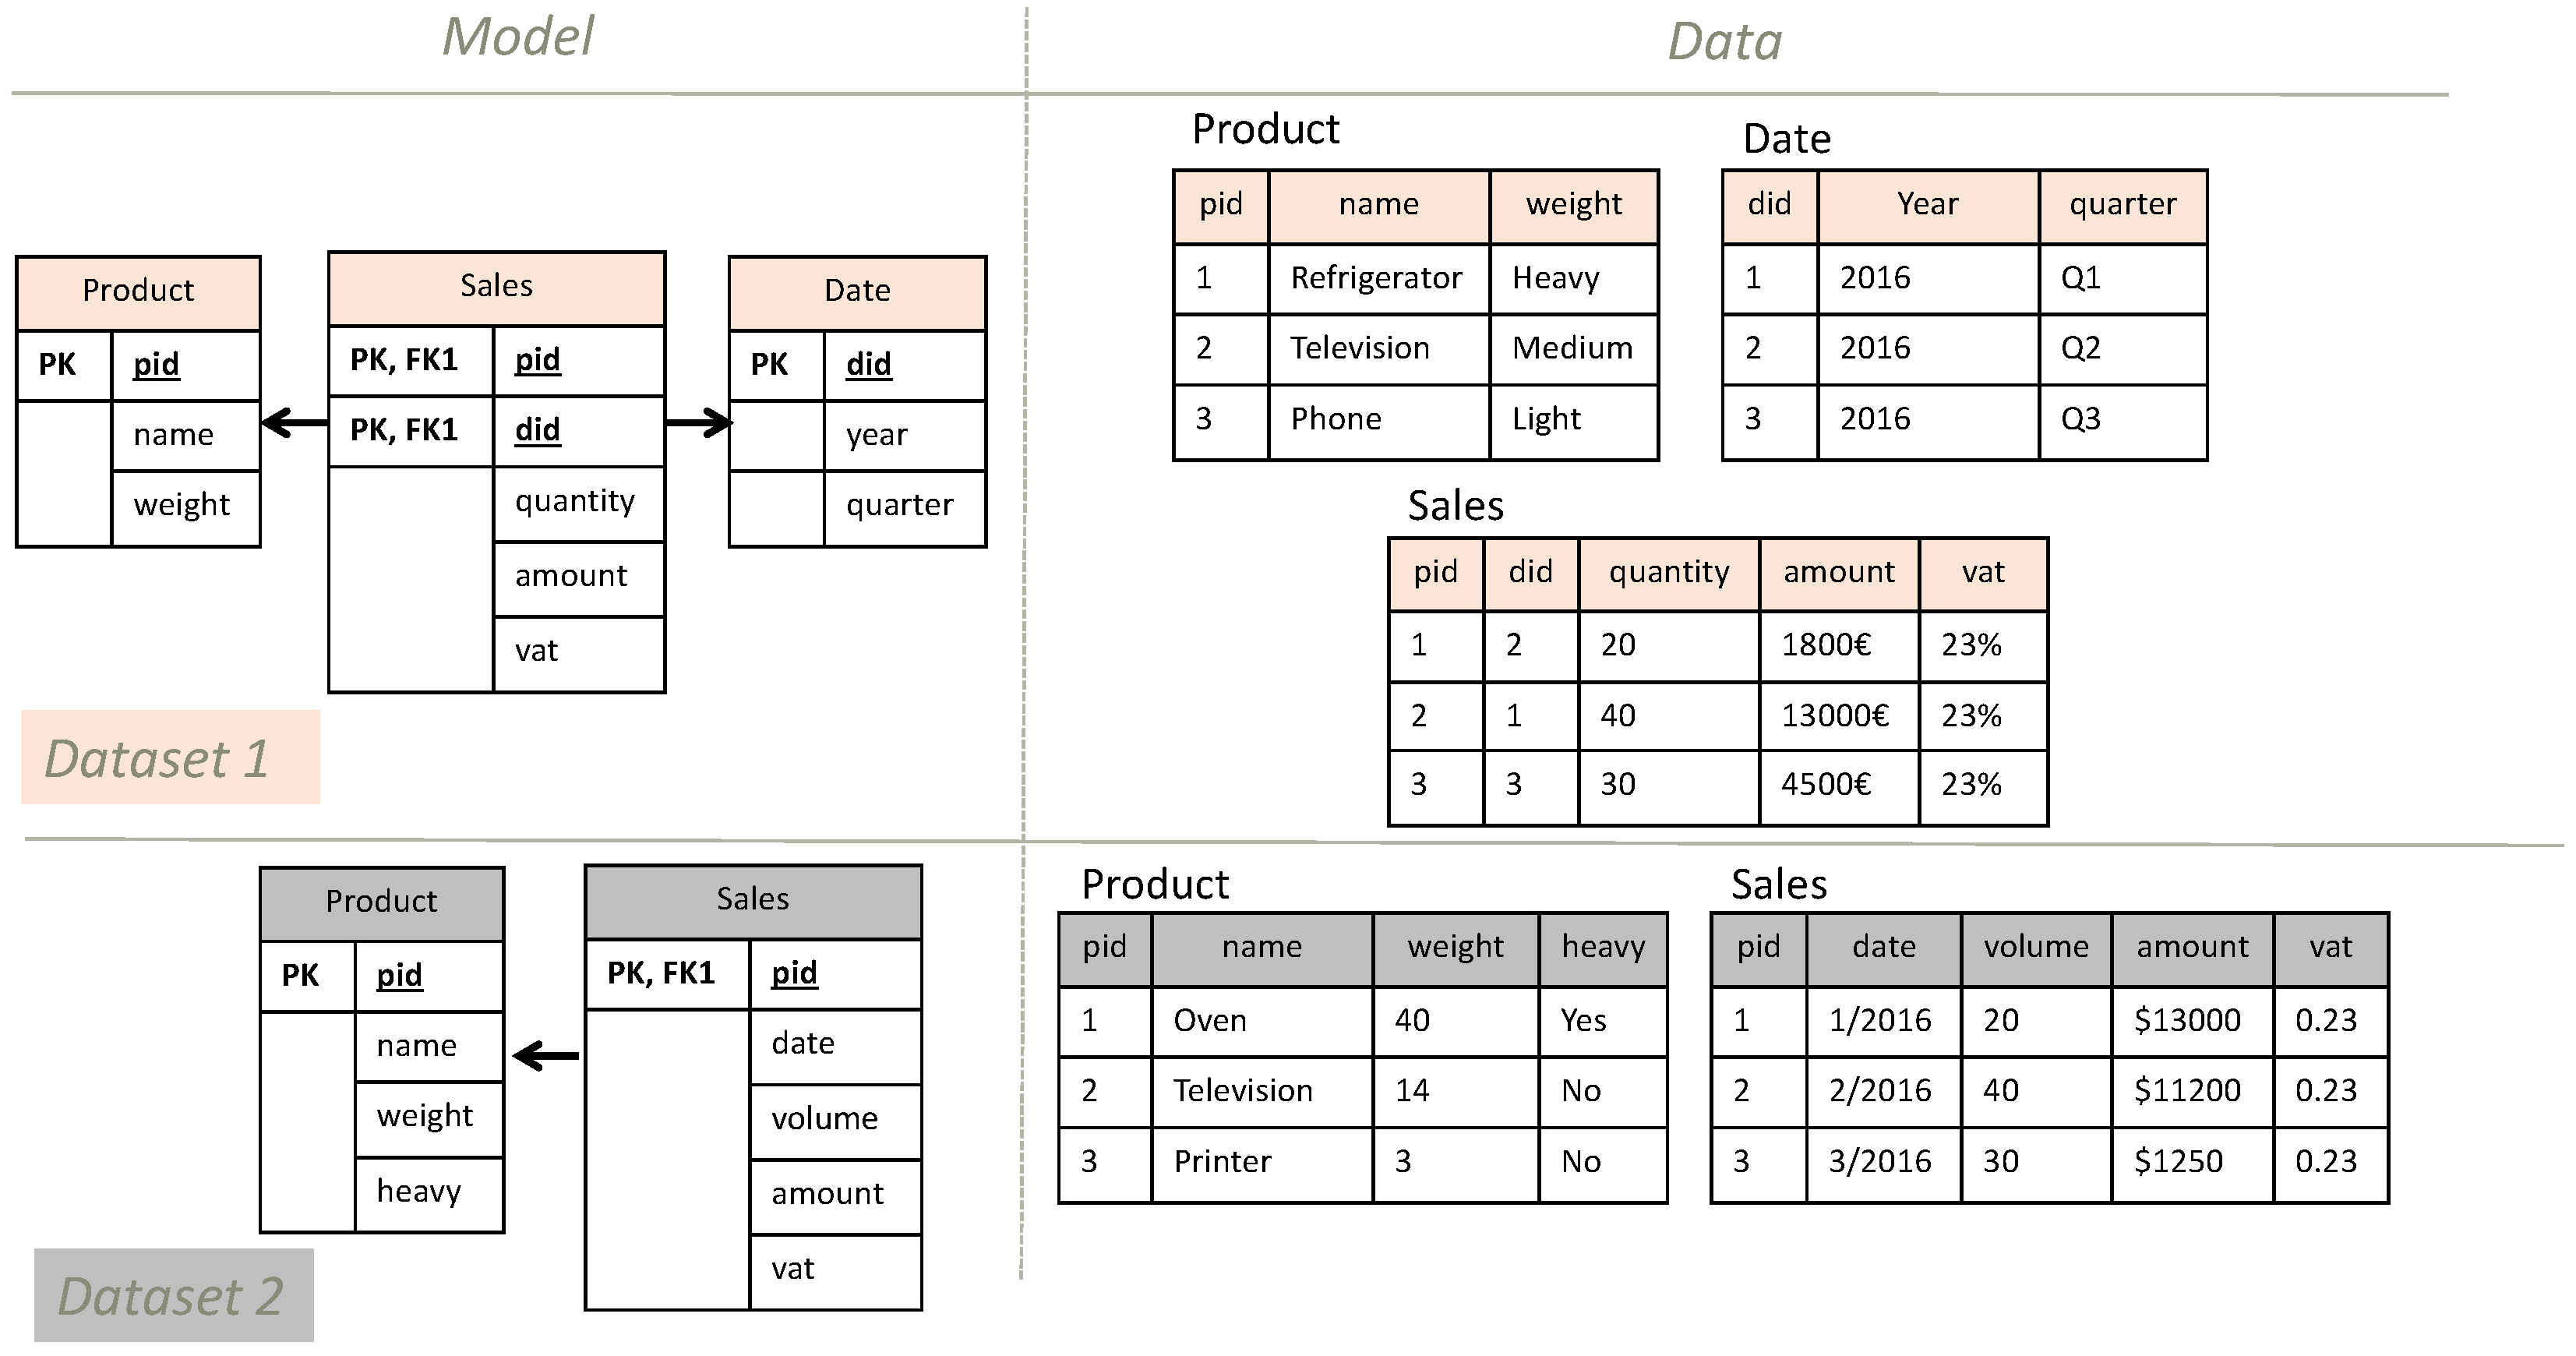
All types of conflicts are defined in the following subsections. In the definitions, we consider two database terms as “semantically similar” when they refer to the same concept, and “semantically unrelated” when they refer to different concepts. To facilitate the understanding of the definitions, we use the example of Figure 4. The example presents the database model and sample data of two datasets that describe a company’s sales. The database model of dataset 1 includes three entities, namely “Product”, “Sales”, and “Date”, while the database model of dataset 2 includes two entities, namely “Product” and “Sales”. Accordingly, in the data level, dataset 1 includes three tables, while dataset 2 two tables.
5.1. Schema Conflicts
Schema conflicts result from using entities, relations, and/or attributes of data (i.e., the main components that can be used to model data according to the Entity Relationship model in different ways). Schema conflicts are classified into naming and structural conflicts.
Naming conflicts result from using various names for semantically similar components of a database schema [14]. There are two types of naming conflicts [14,15,27,28,29,30]:
- Homonym conflicts. This type of conflict results from using similar names to define semantically different components. In our example, a homonym conflict results from the “weight” attribute of “Product” entity that means total weight in dataset 1 and net weight in dataset 2.
- Synonyms conflicts. This type of conflict results from using different names to define semantically similar components. For example, “quantity” attribute of the “Sales” entity in dataset 1 and “volume” attribute of the corresponding entity in dataset 2 are different names used for the same concept. Using multiple languages can also result in synonym conflicts. For example, week (in English) and woche (in German) refer to the same concept using different language [31].
Structural conflicts result from modelling semantically similar components in a different way [15]. The two types of structural conflicts include [14,27,28,32,33,34]:
- Schematic discrepancies. Re-organizing the logical structure of some attributes and their values to create a different structure in another database schema results in schematic discrepancies [13,28]. For example, “date” is an entity in dataset 1 while in dataset 2 an attribute of the “Sale” entity. A special case of this conflict is when the value of an entity’s attribute in one database model is modelled as an attribute in another database model [28]. For example, one of the values of the attribute “weight” of the “Product” entity in dataset 1 is “heavy” that corresponds to an attribute of the second dataset’s “Product” entity.
5.2. Data Conflicts
Data conflicts result from incompatible or inconsistent data. Data conflicts are classified into data scaling, data precision, data representation, and data value conflicts.
Data scaling conflicts result from populating semantically similar attributes with values described by different units of measure [14,27,28,34,35]. For instance, the “amount” attribute of dataset 1 is populated with values in euros while in dataset 2 with values in dollars.
Data precision conflicts result from populating semantically similar attributes with values that have different precisions [14,27,28,33]. For example, the “weight” attribute of the “Product” entity in dataset 1 includes values such as “heavy”, “medium”, and “light” while in dataset 2 the “weight” of the “Product” entity is measured in kilograms (e.g., 40). Moreover, precision conflicts may also result from using different levels of accuracy. For example, the “weight” attribute may be measured with accuracy of milligrams in one database and, alternatively, with grams in another database.
Data representation conflicts result from populating semantically similar attributes with values that have the same unit of measure and precision but different formats resulting in data representation conflicts [13,27,28,33,34]. For example, the values of attribute “vat” of the “Sales” entity in dataset 1 are expressed as a percentage (e.g., 23%) while in dataset 2 as a decimal (e.g., 0.23). Different formats are also commonly used when populating date attributes, e.g., “dd/mm/yy” versus “mm/dd/yyyy”.
6. Interoperability Conflicts of Linked Open Statistical Data
In this Section we define schema interoperability conflicts in LOSD (Figure 5). The conflicts are classified into “Naming conflicts” (Section 6.1), “Schema isomorphism” (Section 6.2), and “Schematic discrepancies” (Section 6.3). For each conflict, we present its definition and the related modelling practices adopted by the six investigated data portals.
In the rest of this Section, we use some standard abbreviations for common linked data namespaces. These are presented in Table 2.
6.1. Naming Conflicts
One of the main principles of linked data is to model the components of data cubes (e.g., the measure properties, dimension properties, unit properties, code lists etc.) as RDF properties, i.e., using URIs [37]. The W3C Working Group suggests re-using or extending standardized vocabularies whenever possible to facilitate inclusion and expansion of the Web of data, otherwise create new vocabularies [38]. In this context, naming conflicts in LOSD result either from re-using values from different vocabularies and/or code lists, or from re-using values from the same vocabularies and/or code lists but in a different manner. For example, the URIs provided by the SDMX vocabulary (e.g., sdmx-dimension:sex) are commonly re-used for the dimension properties. In practice, however, data publishers may also select to define new URIs or create proprietary code lists when creating LOSD, resulting in naming conflicts. The two types of naming conflicts in LOSD are Homonym and Synonym conflicts.
6.1.1. Homonym Conflicts
Homonym conflicts result from naming semantically unrelated components of data cubes using the same URI. For example, a common modelling practice that results in homonym conflicts is to name semantically unrelated measures (e.g., unemployment, poverty, etc.) using the sdmx-measure:obsValue property [12].
Although homonym conflicts exist in the literature, the six data portals that were investigated in this study do not adopt modelling practices that result in homonym conflicts. This proves that in practice, this type of conflict is not critical.
6.1.2. Synonym Conflicts
Synonym conflicts result from naming semantically similar components of data cubes using different URIs. These components include:
- Measure properties. For example, in case of a dataset that measures unemployment, the alternatives for modelling the measure property could be either to re-use sdmx-measure:obsValue property or to define a proprietary measure properties (e.g., eg:unemployment).
- Attribute properties. For example, the unit of measure can be represented by the sdmx-attribute:unitMeasure property or, alternatively, by a proprietary property (e.g., eg:unitMeasure).
- Dimension properties. For example, SDMX dimension properties (e.g., sdmx:refArea) are commonly re-used for common dimensions’ properties (e.g., temporal, geospatial, gender, and age). An alternative could be to define a new dimension property (e.g., eg:geo) instead.
- Code lists. For example, for the unit of the measure property, alternative practices include either to re-use the QUDT vocabulary or to re-use resources of the DBpedia vocabulary.
- Hierarchical relation properties and levels of hierarchies. For example, hierarchical relations can be expressed using the dcterms:isPartOf and dcterms:hasPart properties or, alternatively, using new URIs.
The following paragraphs facilitate the understanding of LOSD synonym conflicts by elaborating the definition using the different practices adopted by data portals.
C1.1: Naming the Measure Property
The measures of data cubes are commonly modelled as RDF properties (i.e., using URIs). All data portals investigated in this paper define and use a proprietary measure property. As a result, synonym conflicts are created hampering the interoperability of datasets. A practice to address this conflict is to define each proprietary property as sub-property of sdmx-measure:obsValue. This practice is also suggested by the QB vocabulary specification because it facilitates readability and processing of the RDF datasets. However, this practice is also considered to be a redundancy because it does not provide additional semantic value to the measure [12].
Table 3 presents details about the practices used by data portals regarding the name of the measure property.
Table 4 summarizes the practices used for the names of the measure properties that result in synonym conflicts.
C1.2: Naming the Unit of Measure Property
The unit of the measure defines the quantity or increment used to count or describe the measure of a data cube. The unit of the measure property is commonly represented using URIs. DCLG, VLO, and the Scottish data portals re-use the sdmx-attribute:unitMeasure property for the unit of measure, a practice also suggested by the QB vocabulary. In addition, e-Stat defines and uses a proprietary attribute property (i.e., cd-attribute:unitMeasure), which is, however, linked with the sdmx-attribute:unitMeasure using the dcterms:relation property. The rest of the data portals do not use a unit of measure property. Table 5 presents the practices used by data portals.
Finally, Table 6 presents the three distinct practices regarding the names used for the unit of measure property. Using different URIs to express semantically similar unit properties result in synonym conflicts, although e-Stat’s practice could partially solve address this interoperability conflict. In addition, the fact that some data portals do not use units of measure may result in schema isomorphism conflicts as semantically similar data cubes will have different number of dimensions.
C1.3: Naming the Common Dimension Properties
The geospatial, temporal, gender, and age dimensions are the most common dimensions used to describe statistical data. Dimension properties in data cubes are commonly named with URIs and are defined in the structure of the data cube (i.e., qb:DataStructureDefinition). A challenge, hence, is to decide on the URIs that will be used for the common dimensions.
Regarding the geospatial dimension, most of the data portals re-use the sdmx-dimension:refArea property. Only VLO and ISTAT define and use proprietary properties (e.g., milieu:referentiegebied). VLO’s property is rdfs:subPropertyOf of the sdmx-dimension:refArea.
Regarding the temporal dimension, the Scottish data portal and DCLG re-use the sdmx-dimension:refPeriod while VLO, e-Stat, and ISTAT define proprietary properties (i.e., milieu:tijdsperiode, cd-dimension:timePeriod, and cen:haAnno respectively). VLO’s property is rdfs:subPropertyOf sdmx-dimension:timePeriod, while e-Stat’s property is related to sdmx-dimension:refPeriod as well as to cen:haAnno using the dcterms:relation property. Finally, Irish CSO does not use a temporal dimension because all observations refer to year 2011.
Regarding the gender dimension, most data portals (i.e., the Scottish data portal, ISTAT, and Irish CSO) define and use proprietary properties. e-Stat also defines and uses a proprietary property (i.e., cd-dimension:sex), which is related to sdmx-dimension:sex and cen:haSesso properties using the dcterms:relation property. DCLG re-uses the sdmx-dimension:sex property. VLO does not use a gender dimension.
As with the gender dimension, most data portals (i.e., the Scottish data portal, ISTAT, and Irish CSO) define and use proprietary properties for the age dimension. In particular, ISTAT defines various age properties for different age groups. For example, cen:haClasseEta15Anni property represents an age classification consisting of two categories: lower/higher 15 years, while cen:haClassiEta16Categorie represents 16 age-group categories. This practice allows using code lists that include only values that are used in the data cube. e-Stat also defines and uses a proprietary age property (i.e., cd-dimension:age), which is, however, related to the sdmx-dimension:age using the dcterms:relation property. DCLG re-uses the sdmx-dimension:age property. VLO does not use an age dimension.
All the approaches used by data portals for the geospatial, temporal, gender, and age dimensions are presented in Table 7.
Using different URIs for semantically similar dimensions results in synonym schema conflicts. Table 8 summarizes the four distinct practices used by data portals to represent the geospatial, temporal, gender, and age dimension properties.
Finally, the fact that some of the data portals do not use all the common dimensions also causes schema isomorphism conflicts.
C1.4: Naming Hierarchical Structures
Statistical data often include hierarchical structures (e.g., geographical divisions). Hierarchical structures include generalization/specialization relations (e.g., Greece is part of Europe) and hierarchical levels (e.g., country, region, city). The QB vocabulary suggests using skos:narrower property (or define a sub-property of it) to define relationships in hierarchical code lists. However, it also suggests using qb:parentChildProperty in some cases (e.g., when publishers wish to be able to re-use existing code lists).
Nevertheless, some data portals (i.e., DCLG and the Scottish data portals) define and use proprietary properties (e.g., spatial:within, spatial:parent, and spatial:contains) to indicate relations in hierarchical structures. For example, DCLG defines that West Midlands (i.e., an English region) is spatial:within England. This practice, however, that does not use a standard vocabulary makes the interpretation of the data difficult. Moreover, e-Stat uses dcterms:isPartOf and dcterms:hasPart properties. For example, Toyota-Shi (a Japanese city) dcterms:isPartOf Aichi-ken (a Japanese prefecture). ISTAT, VLO, and Irish CSO do not define hierarchical relations.
To define the hierarchical levels, some data portals (e.g., ISTAT, DCLG, and the Scottish data portals) use rdf:type property. For example, DCLG defines that West Midlands is rdf:type http://opendatacommunities.org/def/ontology/admingeo/Region while a specific country (e.g., England) is rdf:type http://opendatacommunities.org/def/ontology/admingeo/Country. e-Stat defines a new property (i.e., sacs:administrativeClass) to define hierarchical levels. For example, Toyota-Shi sacs:administrativeClass sacs:City, while Aichi-ken sacs:administrativeClass sacs:Prefecture. Irish CSO and VLO do not define hierarchical levels.
Table 9 presents the practices of data portals regarding hierarchical relations and structures.
Using different URIs for semantically similar hierarchical relations and hierarchical levels result in synonym conflicts. In addition, the lack of URIs in some data portals for the hierarchical relations and hierarchical levels result in schema isomorphism results. Table 10 presents the distinct practices for defining hierarchical relations.
The distinct practices for defining hierarchical levels are presented in Table 11.
C1.5: Populating the Unit of Measure
The values of the units of measure are usually URIs extracted either from code lists (e.g., skos:ConceptScheme) or from vocabularies (e.g., the QUDT units Vocabulary (http://qudt.org/)). The QB vocabulary specification recommends re-using common code lists and vocabularies for the values of the unit of the measure. For example, DCLG uses (i) QUDT (e.g., qudt:Percent), (ii) DBpedia resources for currency units (e.g., http://dbpedia.org/resource/Pound_sterling), and also (iii) defines a new code list (i.e., http://opendatacommunities.org/def/concept-scheme/measure-units) with additional units such as http://opendatacommunities.org/def/concept/measure-units/pounds and http://opendatacommunities.org/def/concept/measure-units/pounds-per-hour. At the same time, the Scottish data portal, e-Stat, and VLO define their own code lists (http://statistics.gov.scot/def/concept-scheme/measure-units, cd-attribute:UnitMeasureConceptScheme, and https://id.milieuinfo.be/vocab/imjv/conceptscheme/eenheden#id respectively) with measurement units such as http://statistics.gov.scot/def/concept/measure-units/percentage, cd-attribute:code/unitMeasure-year, and https://id.milieuinfo.be/vocab/imjv/concept/eenheid/Meter#id respectively. In VLO, some unit values are also related to QUDT using rdfs:SeeAlso. For example, https://id.milieuinfo.be/vocab/imjv/concept/eenheid/Meter#id rdfs:SeeAlso qudt:Meter. ISTAT and Irish CSO do not define units of measure.
Table 12 presents the practices used by data portals.
Finally, Table 13 presents the four distinct practices of data portals. Using different URIs to express semantically similar units result in synonym conflicts.
C1.6: Populating the Temporal Dimension
Temporal dimensions may refer to time periods (e.g., ’2019’) or points of time (e.g., ’01-05-2019’). The values that are used to populate the temporal dimension can be drawn from a code list or a vocabulary or, alternatively, they can be encoded as data values (e.g., an xsd:dateTime). The QB vocabulary, for example, suggests re-using the reference.data.gov.uk vocabulary and declare this within the data structure definition of the data cube.
DCLG re-uses values from the reference.data.gov.uk vocabulary (e.g., http://reference.data.gov.uk/id/year/2015) while the Scottish data portal defines and uses a proprietary code list for each data set (e.g., http://statistics.gov.scot/def/code-list/house-sales-prices/refPeriod) that re-uses values from the reference.data.gov.uk vocabulary. Proprietary code lists allow defining additional values related to the ones included in existing code lists. On the contrary, ISTAT, e-Stat, and VLO use literal values for the temporal dimension (e.g., “2010”^^xsd:gYear-eStat, “2011”-ISTAT, or 2010-VLO). Finally, Irish CSO does not define a temporal dimension. These different practices, however, may result in synonym conflicts when different values are used for the same temporal value. Table 14 presents the practices used by data portals.
Table 15 presents the distinct practices of the data portals for populating the temporal dimension.
C1.7: Populating the Gender Dimension
As with the other dimensions, the gender dimension is also commonly populated using URIs from code lists. The QB vocabulary recommends re-using directly the sdmx-dimension:sex property for the temporal dimension in order to be able to re-use the default code list for it that includes sdmx-code:sex-F (female), sdmx-code:sex-M (male), sdmx-code:sex-U (undefined), sdmx-code:sex-N (not applicable), and sdmx-code:sex-T (total).
Nevertheless, the Scottish data portal, the Irish CSO, and e-Stat define proprietary code lists (http://statistics.gov.scot/def/concept-scheme/gender, http://data.cso.ie/census-2011/classification/gender, and cd-code:SexConceptScheme respectively) for the gender dimension. The first one with five values: male, female, all, unknown, and not-specified (e.g., http://statistics.gov.scot/def/concept/gender/not-specified), the second one with three values: male, female and both (e.g., http://data.cso.ie/census-2011/classification/gender/both), and the third one with three values: female, male, and all (e.g., cd-code:sex-all). The latest practice is usually preferred when there is a need for additional values that are not provided by the SDMX vocabulary. However, e-Stat’s values are related to sdmx:sex values using skos:closeMatch. Finally, DCLG and ISTAT use the SDMX code list to populate gender dimensions, while VLO does not use a gender dimension. Table 16 presents the practices used by data portals.
Table 17 presents the distinct practices of data portals for populating the gender dimension. Using different URIs for semantically similar gender values results in synonym conflicts.
6.2. Schema Isomorphism
Structural conflicts are related to modelling the QB components in the structure of the data cubes. The two types of structural conflicts in LOSD include Schema isomorphism and Schematic discrepancies conflicts.
Schema isomorphism conflicts result from defining a different number of components in semantically similar data cubes. The components may include:
- Measure parameters. For example, a data portal may define just the measure of the data cube, while an alternative could be to define both the measure and the measure type (e.g., qb:measureType).
- Measure properties. For example, defining a single or multiple measures per data cube.
- Unit of measure parameters. For example, a data cube may define only the unit of the measure while another data cube may additionally define the unit multiplier, which is used to indicate the magnitude in the units of measurements (e.g., hundreds, thousands, tens of thousands etc.).
- Units of measures. For example, in case of multiple units of measure, an option is to publish a data cubes for a single unit of measure and another option to publish one data cube with all units of measure.
- Hierarchical levels. For example, all hierarchical levels could be defined in one data cube, but another option is to define one data cube per hierarchical level.
Finally, structural conflicts may result from not including a component in a data cube. For example, LOSD often describe census data of a specific year, e.g., ISTAT provides Italian census data only for 2011. In such case, alternative practices could be either to include the temporal dimension as usually, or to consider including the temporal dimension a redundancy and omit it.
C2.1: Modelling the Measure and Its Parameters
A measure of a data cube is a complex concept that can be described using multiple properties. According to the QB vocabulary, a measure is defined as qb:MeasureProperty. In case of multiple measures per data cube, the “measure dimension” approach of the QB vocabulary suggests declaring the measure dimension (i.e., qb:measureType) within the data structure definition. The value of the qb:measureType will denote which particular measure is being conveyed in each observation. On the contrary, the “multi-measure observations” approach of the QB vocabulary recommends attaching multiple measure values to each observation and, hence, the qb:measureType is not necessary.
Data portals adopt different practices regarding the measure and its parameters (Table 18). The Scottish data portal, e-Stat, and DCLG, for example, define both measure and measure type. Measure type is defined using the qb:measureType property. VLO also defines both measure and measure type, although it does not define multiple measures per data cube. However, in VLO, the type of the measure (which is actually the type of the pollutant) is defined using a proprietary property i.e., milieu:substantie. Finally, Irish CSO and ISTAT define only the measure of the data cubes. Irish CSO does not define multiple measures in observation, while ISTAT follows the “multi-measure observations” approach.
Table 19 presents the distinct practices the data portals. The practices may result in schema isomorphism conflicts as two conceptually similar data cubes may have different number of components.
C2.2: Selecting the Number of Measures
Sometimes statistical data describe multiple measures that are closely related (e.g., sensor measurements). The QB vocabulary encourages defining multiple measures of similar or different nature in data cubes. Data portals, however, follow different practices in their data cubes (Table 20). In particular, the Scottish data portal, DCLG, ISTAT, and e-Stat define one or more measures per data cube, while Irish CSO and VLO define only one measure per data cube.
Table 21 presents the distinct practices of data portals for modelling multiple measures. The different practices result in schema isomorphism conflicts.
C2.3: Modelling the Unit of Measure and Its Parameters
The unit of the measure may be simple (e.g., count, currency) or derived (e.g., various types of ratios). Additional parameters such as multipliers, percentages, and others can be also described along with the unit of the measure. In particular, a unit can be described with one or more of the following parameters: (i) the unit, which is the quantity or increment by which something is counted or described (e.g., euros), (ii) the unit type, which is the kind of the unit (e.g., currency), and (iii) the unit multiplier, which is used to indicate the magnitude in the units of measurements (e.g., hundreds, thousands, tens of thousands etc.). The unit type enables grouping and associating similar units, while the unit multiplier facilitates the comprehension of data sets.
All data portals that use units of measure define only the unit of the measure except for e-Stat (Table 22). e-Stat defines the unit of the measure and the unit multiplier using the estat:unitMult property. ISTAT and Irish CSO do not use unit of measures.
The distinct practices are presented in Table 23. The practices may result in schema isomorphism conflicts.
C2.4: Selecting Number of Units Per Measure
In some cases, a measure may comprise more than one unit. For example, temperature can be measured either in Celsius or in Fahrenheit. In this case, publishers can choose to include all units in the same data cube, or define one data cube or each unit. DCLG and the Scottish data portal provide data cubes with more than one unit per measure (e.g., scottish:people and scottish:percentage-of-people-employed). The rest of the data portals define only one unit per measure, except for ISTAT and Irish CSO that do not use unit of measure. Table 24 presents the practices followed by data portals.
The distinct practices followed by the data portals are presented in Table 25.
C2.5: Modelling Hierarchical Levels
Data cubes usually include hierarchical dimensions (e.g., geographical divisions). Most data portals (i.e., the Scottish portal, DCLG, VLO and ISTAT) provide measurements for all levels of the hierarchical dimension in the same data cube (Table 26). On the contrary, the Irish CSO and e-Stat define separate data cubes for each hierarchical level. For example, the Irish CSO defines 11 data cubes that measure unemployment (one for each of the 11 geographical levels). In the same way, e-Stat, for example, provides two data cubes to measure welfare and social security; one for the city level (dataset http://data.e-stat.go.jp/lod/dataset/g00200502/d00200502jm) and one for the prefecture level (http://data.e-stat.go.jp/lod/dataset/g00200502/d00200502jp).
Distinct practices are presented in Table 27.
6.3. Schematic Discrepancies
Schematic discrepancies result from using different logical constructs to represent the same set of data cube components. In particular, schematic discrepancies result while:
- Modelling multiple measures. For example, a data portal may define multiple qb:MeasureProperty (i.e., one for each measure) in the qb:DataStructureDefinition, an instance of a single measure component in each observation, and an extra qb:measureType dimension property that expresses the measure used in the observation. Another data portal may define multiple qb:MeasureProperty in the qb:DataStructureDefinition and an instance of each defined measure component in each observation.
- Defining the unit of the measure. For example, a practice could be to define the unit of measure at the qb:Observation level, or, alternatively, at the qb:MeasureProperty level.
- Defining single value dimensions (i.e., dimensions with a common value). For example, the single value dimension could be defined at the qb:Dataset level, or, alternatively, at the qb:Slice level.
- Defining aggregated values (i.e., values describing aggregated statistics). For example, a hierarchy can be defined by the aggregated value on the top level of the hierarchy, or, alternatively, a unique, generic, “total” URI (e.g., sdmx:total) could be used for all kind of aggregated values.
- Defining the values of the temporal dimension. For example, the values of the temporal dimension could be (optionally) followed by its data type, i.e., “2011”^^xsd:date.
- Associating dimensions with potential values. For example, a practice could be to define the association using the qb:codeList property, or, alternatively, define the rdfs:range of the qb:DimensionProperty as a skos:Concept.
C3.1: Modelling Multiple Measures
As presented in C2.2, it is a common practice to define more than one measures in a data cube. Data portals use different practices to model multiple measures in the data cubes (Table 28). For example, the Scottish data portal, e-Stat, and DCLG adopt the “Measure dimension” practice of the QB vocabulary and define (i) multiple qb:MeasureProperty components in the qb:DataStructureDefinition of the data cube (one for each measure), (ii) an instance of a single measure component in each observation, and (iii) an extra qb:measureType dimension that denotes the measure used in the observation. On the contrary, ISTAT adopts the “Multi-measure observation” practice of the QB vocabulary and defines (i) multiple qb:MeasureProperty components in the qb:DataStructureDefinition of the data cube and (ii) an instance of each defined measure component in each observation. VLO and Irish CSO define only one measure per data cube, hence they are not related to this conflict.
Table 29 presents the distinct practices used by the data portals to model multiple measures in data cubes that result in schematic discrepancies conflicts.
C3.2: Defining the Unit of Measure in the Structure of the Cube
According to the specification of the QB vocabulary, the unit of the measure can be defined at three levels of a data cube’s structure i.e., the qb:DataSet level, the qb:MeasureProperty level, and the qb:Observation level. Each approach has its own advantages and disadvantages. For example, defining the unit measure at the qb:DataSet or qb:MeasureProperty level facilitates the identification of the unit of all observations directly from the data cube structure but, in case of multiple units per data cube, it is impossible to identify the unit of each observation. In addition, when the unit is defined at the qb:Observation level, one must iterate through all observations to identify all units used in the data cube.
All data portals that use units of measure define it at the qb:Observation level (Table 30).
The only practice for defining the unit of measure is presented in Table 31.
C3.3: Defining Dimensions with a Single Value in the Structure of the Data Cube
Sometimes, (e.g., in census data) all observations may have the same value in a dimension. For example, when the census data refer only to one year, the temporal dimension will have only one value. For these data cubes, the specification of the QB vocabulary allows the definition of a single value at the qb:Dataset level, at the qb:Slice level, or at the qb:Observation level.
Among the data portals we studied, only ISTAT and Irish CSO have published census data. ISTAT, that publishes the Italian 2011 census, follows the qb:Observation level approach and defines in each observation the same value for the temporal dimension (i.e., 2011) because all observations refer to this year. Although this approach makes it easy to identify the time reference of each observation, it loads data cubes with triples with the same information. At the same time, Irish CSO that publishes the Irish 2011 census, does not define a temporal dimension at all. All practices are presented in Table 32.
Table 33 presents the distinct practices for defining dimensions with a single value in the structure of the data cube.
The above practices result in schematic discrepancies conflicts.
C3.4: Modelling Aggregated Values
Aggregated values are single values calculated by performing mathematical operations (such as counting or summing) on a group of other values. Aggregated values are often used to populate the dimensions of data cubes. For example, the gender dimension’s values may include sdmx-code:sex-T (total) among others. It is important to semantically distinguish aggregated values from the rest of the values used in the dimension to prevent potential errors such as including the aggregated values in new mathematical calculations on top of the observations of the dataset.
All data portals use specific URIs to express aggregated values of each dimension. For example, ISTAT re-uses sdmx-code:sex-T for the gender dimension and defines http://datiopen.istat.it/odi/ontologia/censimento/StatoCivile5CatTotale to express the total sum of all marital statuses. In addition, VLO defines https://id.milieuinfo.be/vocab/imjv/concept/substantie/totaal_stof#id for all substances.
The distinct practices, hence, used for aggregated values is presented in Table 34.
C3.5: Modelling the Values of the Temporal Dimension
As already described in C1.6, values for the temporal dimension may be extracted from code list or, alternatively, a data value can be used instead. Different practices may also cause schematic discrepancies conflicts. For example, ISTAT and e-Stat define the value of the temporal dimension along with its data type, i.e., “2011”^^xsd:date or “2014”^^xsd:gYear), VLO only the value of the temporal dimension (e.g., 2011) while all the other portals use URIs from code list e.g., http://reference.data.gov.uk/id/year/2016. Irish CSO does not use a temporal dimension. All practices are presented in Table 35.
The distinct practices, hence, used for the values of the temporal dimension are presented in Table 36.
The above practices may result in schematic discrepancies conflicts.
C3.6: Associating Dimensions to Code Lists
According to the QB vocabulary, the modelling of the possible values of a dimension is described using the rdfs:range property of the dimension in the usual RDF manner. For example, the values of a temporal dimension might be represented using, e.g., xsd:time or as URIs. URIs can also be grouped into code lists (i.e., skos:ConceptScheme, skos:Collection, orqb:HierarchicalCodeList) or into reference datasets (e.g., http://reference.data.gov.uk to facilitate their re-use. In the case of code lists, it is useful to easily identify the overall code list a value comes from.
Linked data portals use various practices for associating the dimensions of the data cubes with their potential values. ISTAT, for example, uses the qb:codeList property to associate a qb:DimensionProperty with a skos:ConceptScheme that indicates the list of skos:Concept that may be used as values of the dimension. e-Stat and DCLG uses the same approach, but also defines the rdfs:range of the qb:DimensionProperty as a sub-class of skos:Concept. VLO and Irish CSO use a different approach and define the rdfs:range of the qb:DimensionProperty as a skos:Concept. Finally, the Scottish government follows a hybrid approach; it adopts e-Stat’s and DCLG’s practice for some dimensions and, at the same time, defines the rdfs:range of other dimensions as a sub-class of skos:Concept. Table 37 presents the approaches followed by the data portals.
The different practices can be, hence, summarized in Table 38.
7. Status of LOSD Interoperability Conflicts
In this Section we identify and present the status of the 19 interoperability conflicts in LOSD. We consider two statuses of interoperability conflicts, namely (i) Solved and (ii) Open, and label conflicts accordingly. A conflict is labelled as Solved when all data portals adopt the same modelling practice and as Open when they result from different modelling practices of data portals. We also evaluate the resolvability of conflicts against the related opinion of LOSD experts expressed in a recently published study [12]. In particular, we consider that a conflict is resolvable when, although it results from different practices of data portals, LOSD experts have already proposed following a specific practice that resolves it. Table 39 presents the conflicts along with their status and resolvable labels. The rest of this Section discusses the status and resolvability of interoperability conflicts.
As already stated in Section 6.1.1, the modelling practices followed by the data portals do not result in homonym conflicts, hence homonym conflicts are considered to be solved. On the contrary, all synonym conflicts (C1.1–C1.7) are still open, mainly because data portals define their proprietary properties and values. According to LOSD experts, some of these conflicts can be resolved while others are currently irresolvable. Regarding the measure property (C1.1), although LOSD experts suggest defining proprietary properties, they also consider that this approach does not fully address all challenges. We, hence, consider this conflict as irresolvable. In addition, LOSD experts suggest using sdmx-attribute:unitMeasure for the unit of measure property (C1.2) to be able to assign values that are not part of a code list. If, however, annotation with additional properties (e.g., label, code list) is required, they suggest defining a proprietary property that is sub-property of sdmx-attribute:unitMeasure. Both suggestions facilitate interoperability, and, hence, this conflict is labelled as resolvable. For the geospatial, age, and temporal dimension properties (C1.3a, C1.3c, C1.3d), LOSD experts suggest defining a proprietary qb:DimensionProperty as rdfs:subPropertyOf the corresponding SDMX dimension (e.g., sdmx-dimension:refArea for the geospatial dimension). For the gender dimension (C1.3b), however, LOSD experts suggest creating a proprietary property along with a code list when more values (e.g., hermaphroditism) are needed apart from those included in the code list linked to existing SDMX property (i.e., sdmx-dimension:sex). C1.3b, hence, cannot be resolved with existing practices.
For the URIs of the hierarchical relations (C1.4), LOSD experts suggest using SKOS to model hierarchical relations in simple hierarchies and XKOS when the hierarchical levels are fully separated, and depth is a meaningful concept. When, publishers need additional relations than the ones offered by SKOS and XKOS, the QB vocabulary’s properties (e.g., administeredBy in contrast to within) are suggested. C1.4 is, hence, considered to be resolvable. For the values of the unit of measure (C1.5), LOSD experts suggest re-using QUDT, dbpedia, or other code list when QUDT does not address data needs. In addition, LOSD experts suggest different practices for populating the values of temporal properties describing time periods and points of time (C1.6). In particular, in case of a period of time, they suggest defining rdfs:range interval:Interval and, hence, re-use the values from http://reference.data.gov.uk if it is sufficient, otherwise create a new code list. In case of a specific point of time, they suggest defining rdfs:range xsd:dateTime. As a result, we currently consider C1.6 as irresolvable. Finally, LOSD experts suggest re-using the SDMX vocabulary for the values of the gender dimension (C1.7). However, as already mentioned, these values may not be sufficient, hence, they suggest creating a new code list for the gender dimension. As a result, we also consider C1.7 currently irresolvable.
Structural conflicts (C2.1–2.5 and C3.1–3.6) result from different practices of modelling semantically similar components and, hence, hamper interoperability. Starting with schema isomorphism conflicts, some data portals model only one or both of the measure property and measure type. LOSD experts do not have a suggestion for modelling the measure type in addition to the measure property, hence, this conflict is considered irresolvable. In addition, some data portals create data cubes with a single measure, while others with multiple measures (C2.2). LOSD experts, suggest defining multiple measures in data cubes only when the measures are closely related to a single observational event. However, it is not always clear whether and how independent are the measures and, sometimes, this depends on how someone will use the data. As a result, there is not a clear suggestion on which practice to use for modelling multiple measures and, hence, C2.2 is currently irresolvable. In addition, although data portals use different practices for modelling the unit of measure and its parameters (C2.3), LOSD experts do not have a suggestion and, hence, C2.3 is still irresolvable. Data portals also create data cubes with one or more units per measure (C2.4). LOSD experts, however, suggest defining a single data cube with multiple units to include all related units of the same measure in the same cube. C2.4 is, hence, resolvable. Finally, data portals create data cubes with one or more hierarchical levels (C2.5). No related practice, however, has been suggested by LOSD experts.
In schematic discrepancies, data portals also use various practices to model multiple measures in a data cube (C3.1). LOSD experts believe that the approach to be followed should be decided by the data cube publisher. As a result, C3.1 is currently irresolvable. Regarding C3.2, data portals follow the same practice. In addition, regarding dimensions with a single value (C3.3), LOSD experts suggest always defining single value dimensions in all observations to facilitate adding more observations with different values in the same dataset. All data portals define a proprietary property for aggregated values (C3.4). LOSD experts, however, suggest defining aggregated values on top of hierarchies. Different practices are also used for modelling the values of the temporal dimension (C3.5). As already described in the previous paragraphs (C1.6), LOSD experts suggest different practices for time periods and points of time that could be followed to solve this conflict. As a result, we consider C3.5 resolvable. Finally, data portals adopt various practices for associating dimensions to their code lists (C3.6). LOSD experts suggest that if the code list is modelled as skos:ConceptScheme, qb:HierarchicalCodeList, or skos:Collection, then it should be associated with the qb:DimensionProperty using the qb:codeList property. In addition, the object that is related to the rdfs:range property should be set to skos:Concept. C3.6 is, hence, considered solvable.
8. Discussion
Interoperability among data cubes is crucial to unleash the full potential of LOSD. For example, it will enable performing combined analytics and visualizations on data published by different governments and offices for national statistics. Currently, although official open government data portals provide their statistical data as LOSD using standard vocabularies such as the QB vocabulary and SKOS, they adopt different practices thus hampering data interoperability.
This paper proposes an Interoperability Framework with definitions of LOSD interoperability conflicts. To this end, we combined a top-down approach (that translated interoperability conflicts of traditional databases and data warehouses to LOSD) with a bottom-up approach (that studied modelling practices of official open government data portals) and defined the two types of LOSD interoperability conflicts, namely naming and structural conflicts along with their sub-types. The sub-types of naming conflicts are homonyms and synonyms, and of structural conflicts isomorphism and schematic discrepancies. We resulted in 19 conflicts classified in the above types. Most of them (11) are structural conflicts and the rest of them (eight) naming. Two of the naming conflicts can also be classified as structural. From the structural conflicts, five are schema isomorphisms and six schema discrepancies.
We studied the conflicts to understand their current state, i.e., which of them have been already addressed and which are still open. Only two of the conflicts are considered to be solved, meaning that all data portals use the same modelling practice. The rest of them are still open. For 11 of the open conflicts, however, LOSD experts have suggested practices that could be used to resolve them. The rest of them need to be further investigated on how to resolve them.
This study focused on facilitating the creation of interoperable data cubes. However, enhancing interoperability is not the only challenge that should be considered when creating LOSD. Additional challenges include, for example, to facilitate easy access of the data cubes, to ensure high performance when accessing the data cubes, or to facilitate the interpretation of data cubes. In this context, some practices may facilitate interoperability, but at the same time, have a negative influence, for example, on the performance of data cubes. For instance, using a common practice for defining single values at the qb:Obervation level may facilitate interoperability, but also increases the number of triples and, hence, influence performance. In addition, some practices that facilitate interoperability, may need to be enhanced to also address other types of challenges. For example, regarding the modelling of aggregated values (C3.4), data portals define proprietary properties. However, it is very important to differentiate these values from other values to avoid inaccurate interpretation of data (e.g., from duplicate the values) [12]. Another example regards the conflict related to the definition of the unit of measure. Our study showed that all data portals define the unit of the measure at the qb:Observation level and, hence, we considered this conflict as Solved. However, it is also suggested to additionally define the unit of measure at the “qb:DataSet” level to facilitate the retrieval of the available units in a cube [12]. Finally, in some cases, there is no practice that addresses all types of challenges. As a result, a publisher may have to select between addressing a type of challenge in favor of another, e.g., facilitate interoperability but sacrifice performance.
The next step could, hence, be first to identify and define all types of challenges (e.g., performance, accessibility etc.) that should be considered when creating LOSD and, second, to define an overall evaluation framework that could be used to evaluate modelling practices of LOSD based on all types of challenges.
Author Contributions
Conceptualization, E.K., A.K. and K.T.; methodology, E.K. and A.K.; writing–original draft preparation, E.K. and A.K.; writing–review and editing, E.K., A.K. and K.T.; supervision, K.T.
Funding
This research is co-financed by Greece and the European Union (European Social Fund—ESF) through the Operational Program “Human Resources Development, Education and Lifelong Learning 2014–2020” in the context of the project “Integrating open statistical data using semantic technologies” (MIS 5007306).
Conflicts of Interest
The authors declare no conflict of interest.
Abbreviations
The following abbreviations are used in this manuscript:
| CSO | Central Statistics Office |
| DCLG | Department for Communities and Local Government |
| ISTAT | Italian National Institute of Statistics |
| LOSD | Linked Open Statistical Data |
| QB | Data Cube Vocabulary |
| RDF | Resource Description Framework |
| QUDT | Quantity, Unit, Dimension and Type |
| UK | United Kingdom |
| URI | Uniform Resource Identifier |
References
- Kalampokis, E.; Tambouris, E.; Tarabanis, K. A classification scheme for open government data: towards linking decentralised data. Int. J. Web Eng. Technol. 2011, 6, 266–285. [Google Scholar] [CrossRef]
- Abelló, A.; Darmont, J.; Etcheverry, L.; Golfarelli, M.; Mazón, J.N.; Naumann, F.; Pedersen, T.; Rizzi, S.B.; Trujillo, J.; Vassiliadis, P.; et al. Fusion Cubes: Towards Self-Service Business Intelligence. Int. J. Data Warehous. Min. 2013, 9, 66–88. [Google Scholar] [CrossRef]
- Perez, J.; Berlanga, R.; Aramburu, M.; Pedersen, T. Integrating Data Warehouses with Web Data: A Survey. IEEE Trans. Knowl. Data Eng. 2008, 20, 940–955. [Google Scholar] [CrossRef] [Green Version]
- Tseng, F.S.; Chen, C.W. Integrating Heterogeneous Data Warehouses Using XML Technologies. J. Inf. Sci. 2005, 31, 209–229. [Google Scholar] [CrossRef]
- Pedersen, T.; Pedersen, D.; Riis, K. On-demand multidimensional data integration: Toward a semantic foundation for cloud intelligence. J. Supercomput. 2013, 65, 217–257. [Google Scholar] [CrossRef]
- Torlone, R. Two approaches to the integration of heterogeneous data warehouses. Distrib. Parallel Databases 2008, 23, 69–97. [Google Scholar] [CrossRef]
- Kalampokis, E.; Tambouris, E.; Tarabanis, K. Linked Open Cube Analytics Systems: Potential and Challenges. IEEE Intell. Syst. 2016, 31, 89–92. [Google Scholar] [CrossRef]
- Kalampokis, E.; Tambouris, E.; Tarabanis, K. Linked Open Government Data Analytics. In Electronic Government; Wimmer, M., Janssen, M., Scholl, H., Eds.; Lecture Notes in Computer Science; Springer: Berlin/Heidelberg, Germany, 2013; pp. 99–110. [Google Scholar] [CrossRef]
- Cyganiak, R.; Reynolds, D. The RDF Data Cube Vocabulary: W3C Recommendation. 2014. Available online: https://www.w3.org/TR/vocab-data-cube/ (accessed on 25 July 2019).
- Miles, A.; Bechhofer, S. SKOS Simple Knowledge Organization System Reference: W3C Recommendation. 2009. Available online: https://www.w3.org/TR/skos-reference/ (accessed on 25 July 2019).
- Cyganiak, R.; Gillman, D.; Grim, R.T.A.M.; Jaques, Y.; Thomas, W. XKOS An SKOS Extension for Representing Statistical Classifications. 2017. Available online: http://rdf-vocabulary.ddialliance.org/xkos (accessed on 26 July 2019).
- Kalampokis, E.; Zeginis, D.; Tarabanis, K. On modeling linked open statistical data. J. Web Semant. 2019, 55, 56–68. [Google Scholar] [CrossRef]
- Ram, S.; Park, J. Semantic Conflict Resolution Ontology (SCROL): An ontology for detecting and resolving data and schema-level semantic conflicts. IEEE Trans. Knowl. Data Eng. 2004, 16, 189–202. [Google Scholar] [CrossRef]
- Reddy, M.; Prasad, B.E.; Reddy, P.; Gupta, A. A methodology for integration of heterogeneous databases. IEEE Trans. Knowl. Data Eng. 1994, 6, 920–933. [Google Scholar] [CrossRef]
- Batini, C.; Lenzerini, M.; Navathe, S.B. A comparative analysis of methodologies for database schema integration. ACM Comput. Surv. (CSUR) 1986, 18, 323–364. [Google Scholar] [CrossRef]
- Kalampokis, E.; Karamanou, A.; Tarabanis, K. Towards Interoperable Open Statistical Data. In Proceedings of the 18th Annual International IFIP Electronic Government Conference (EGOV2019), San Benedetto Del Tronto, Italy, 2–4 September 2019. [Google Scholar]
- Inmon, W.H. Building the Data Warehouse; John Wiley & Sons: Hoboken, NJ, USA, 2005. [Google Scholar]
- Berger, S.; Schrefl, M. From federated databases to a federated data warehouse system. In Proceedings of the 41st Annual Hawaii International Conference on System Sciences, Waikoloa, HI, USA, 7–10 Januray 2008. [Google Scholar]
- Datta, A.; Thomas, H. The cube data model: A conceptual model and algebra for on-line analytical processing in data warehouses. Decis. Support Syst. 1999, 27, 289–301. [Google Scholar] [CrossRef]
- Cabibbo, L.; Torlone, R. A logical approach to multidimensional databases. In Advances in Database Technology–EDBT’98; Springer: Berlin/Heidelberg, Germany, 1998; pp. 183–197. [Google Scholar]
- Hausenblas, M. Exploiting Linked Data to Build Web Applications. IEEE Internet Comput. 2009, 13, 68–73. [Google Scholar] [CrossRef] [Green Version]
- The UK Government. Publishing Statistical Data 2016. Available online: https://github.com/UKGovLD/publishing-statistical-data (accessed on 26 July 2019).
- Asano, Y.; Takeyoshi, Y.; Matsuda, J.; Nishimura, S. Publication of Statistical Linked Open Data in Japan. In Proceedings of the 4th International Workshop on Semantic Statistics Co-Located with 15th International Semantic Web Conference (ISWC 2016), CEUR Workshop Proceedings, Kobe, Japan, 18 October 2016. [Google Scholar]
- Capadisli, S.; Auer, S.; Ngonga Ngomo, A.C. Linked SDMX Data. Semant. Web 2015, 6, 105–112. [Google Scholar] [CrossRef] [Green Version]
- Petrou, I.; Papastefanatos, G.; Dalamagas, T. Publishing census as linked open data: A case study. In Proceedings of the 2nd International Workshop on Open Data, Paris, France, 3 June 2013; p. 4. [Google Scholar]
- Meroño-Peñuela, A.; Ashkpour, A.; Rietveld, L.; Hoekstra, R. Linked humanities data: The next frontier? A case-study in historical census data. In Proceedings of the 2nd International Workshop on Linked Science 2012, Boston, MA, USA, 12 November 2012; Volume 951. [Google Scholar]
- Kim, W.; Seo, J. Classifying Schematic and Data Heterogeneity in Multidatabase Systems. Computer 1991, 24, 12–18. [Google Scholar] [CrossRef]
- Sheth, A.P.; Kashyap, V. So Far (Schematically) yet So Near (Semantically). In Proceedings of the IFIP WG2: Conference on Semantics of Interoperable Database Systems, Lorne, Victoria, Australia, 16–20 November 1992; pp. 283–312. [Google Scholar]
- Channah, N.; Aris, O. A Classification of Semantic Conflicts in Heterogeneous Database Systems. J. Org. Comput. 1995, 5, 167–193. [Google Scholar]
- Doan, A.; Halevy, A.Y. Semantic integration research in the database community: A brief survey. AI Mag. 2005, 26, 83–94. [Google Scholar]
- Bruckner, R.M.; Ling, T.W.; Mangisengi, O. A framework for a multidimensional OLAP model using topic maps. In Proceedings of the Second International Conference on Web Information Systems Engineering, Kyoto, Japan, 3–6 December 2001; Volume 2, pp. 109–118. [Google Scholar]
- Spaccapietra, S.; Parent, C.; Dupont, Y. Model independent assertions for integration of heterogeneous schemas. VLDB J. 1992, 1, 81–126. [Google Scholar] [CrossRef] [Green Version]
- Lee, C.; Chen, C.J.; Lu, H. An Aspect of Query Optimization in Multidatabase Systems. SIGMOD Rec. 1995, 24, 28–33. [Google Scholar] [CrossRef]
- Lee, K.H.; Kim, M.H.; Lee, K.C.; Kim, B.S.; Lee, M.Y. Conflict classification and resolution in heterogeneous information integration based on XML schema. In Proceedings of the 2002 IEEE Region 10 Conference on Computers, Communications, Control and Power Engineering. TENCOM ’02, Beijing, China, 28–31 October 2002; Volume 1, pp. 93–96. [Google Scholar]
- Sboui, T.; Bedard, Y.; Brodeur, J.; Badard, T. A Conceptual Framework to Support Semantic Interoperability of Geospatial Datacubes. In Proceedings of the International Conference on Conceptual Modeling; Springer: Berlin/Heidelberg, Germnay, 2007; Volume 4802, pp. 378–387. [Google Scholar] [CrossRef]
- Torlone, R. Interoperability in Data Warehouses. In Encyclopedia of Database Systems; Springer: Berlin/Heidelberg, Germany, 2009; pp. 1560–1564. [Google Scholar]
- Bizer, C.; Heath, T.; Berners-Lee, T. Linked data-the story so far. In Semantic Services, Interoperability and Web Applications: Emerging Concepts; IGI Global: Pennsylvania, PA, USA, 2011; pp. 205–227. [Google Scholar]
- W3C. Best Practices for Publishing Linked Data. W3C Work Group Note 2014. Available online: https://www.w3.org/TR/ld-bp/ (accessed on 25 July 2019).
Figure 1.
The SPARQL query used to understand the graphs that include data sets in the data portals.
Figure 1.
The SPARQL query used to understand the graphs that include data sets in the data portals.

Figure 2.
The SPARQL query used for counting the distinct number of measure properties.

Figure 3.
Classification of traditional database and data warehouse conflicts.

Figure 4.
Example of two database schema along with their data.

Figure 5.
Interoperability conflicts in LOSD.


Table 1.
Characteristics of official data portals.
| Scottish | DCLG | ISTAT | Irish CSO | VLO | e-Stat | |
|---|---|---|---|---|---|---|
| Data | Neighborhood Statistics | Finance, well-being etc. | Italian Census 2011 | Irish Census 2011 | Gas emissions in Flanders | >500 kinds of governmental statistics |
| Curator | Scottish Government | DCLG | ISTAT | Irish Central Statistics Office | Flemish Government | Japanese Statistics Center |
| Cubes | 238 | 167 | 8 | 682 | 9 | 78 |
| Measures | 33 | 156 | 8 | 19 | 3 | 6 |
| Dimensions | 198 | 205 | 21 | 50 | 7 | 36 |
| Observations | 91,859,710 | 3,523,352 | 60,269,697 | 3,609,306 | 1,002,738 | 110,206,733 |
| GeoValues | 18,302 | 32,584 | 426,725 | 4806 | 5173 | 941,506 |
| TimeValues | 286 | 96 | 1 | - | 9 | 260 |
Table 2.
Abbreviations for common namespaces used in the paper.
Table 3.
Modelling practices of data portals for the name of the measure property.
| Portal | Modelling Practice |
|---|---|
| Scottish | Defines and uses a proprietary property (e.g., scot:count) that is rdfs:subPropertyOf sdmx-measure:obsValue |
| DCLG | Defines and uses a proprietary property (e.g., http://opendatacommunities.org/def/housing-market/measure-type/changeYearOnYear) that is rdfs:subPropertyOf sdmx-measure:obsValue |
| ISTAT | Defines and uses a proprietary property (e.g., cen:haPopolazioneResidente) that is rdfs:subPropertyOf sdmx-measure:obsValue |
| Irish CSO | Defines and uses a proprietary property (e.g., cso:persons) that is rdfs:subPropertyOf sdmx-measure:obsValue |
| VLO | Defines and uses a proprietary measure property (e.g., milieu:hoeveelheid) |
| e-Stat | Defines and uses a proprietary property (e.g., estat-measure:population) that is rdfs:subPropertyOf sdmx-measure:obsValue |
Table 4.
Distinct modelling practices used for naming the measure property.
| Distinct Modelling Practice |
|---|
| P1.1.1: Define and use a proprietary property (e.g., test:unemployment) |
Table 5.
Modelling practices of data portals for naming the unit property.
| Portal | Modelling Practice |
|---|---|
| Scottish | Re-uses sdmx-attribute:unitMeasure property |
| DCLG | Re-uses sdmx-attribute:unitMeasure property |
| ISTAT | Does not use unit of measure |
| Irish CSO | Does not use unit of measure |
| VLO | Re-uses sdmx-attribute:unitMeasure property |
| e-Stat | Defines and uses a proprietary property (e.g., cd-attribute:unitMeasure) that is linked with the sdmx-attribute:unitMeasure using the dcterms:relation property |
Table 6.
Distinct modelling practices for naming the unit of measure property.
| Distinct Modelling Practice |
|---|
| P1.2.1: Re-use sdmx-attribute:unitMeasure property |
| P1.2.2: Define and use a proprietary attribute that is also linked with the sdmx-attribute:unitMeasure using the dcterms:relation property |
| P1.2.3: Do not use unit of measure |
Table 7.
Modelling practices used by data portals for the URI of the geospatial, temporal, sex and age dimensions.
Table 7.
Modelling practices used by data portals for the URI of the geospatial, temporal, sex and age dimensions.
| Portal | Geospatial | Temporal | Gender | Age |
|---|---|---|---|---|
| Scottish | Re-uses sdmx-dimension:refArea | Re-uses sdmx-dimension: refPeriod | Defines scot-dim:gender | Defines a proprietary property |
| DCLG | Re-uses sdmx-dimension:refArea | Re-uses sdmx-dimension: refPeriod | Re-uses sdmx-dimension:sex | Re-uses sdmx-dimension:age |
| ISTAT | Defines cen: entitaTerritoriale | Defines cen:haAnno | Defines cen:haSesso | Defines, e.g., cen:haClasseEta 15Anni |
| Irish CSO | Re-uses sdmx-dimension:refArea | - | Defines cso:gender | Defines cso:age-group |
| VLO | Defines milieu:referentiegebied, sub-property of sdmx-dimension:refArea | Defines milieu:tijdsperiode, sub-property of sdmx-dimension: timePeriod | - | - |
| e-Stat | Re-uses sdmx-dimension:refArea | Defines cd-dimension: timePeriod, which is related to sdmx-dimension: refPeriod and cen:haAnno using dcterms:relation | Defines cd-dimension:sex, which is related to sdmx:sex and cen:haSesso using dcterms:relation | Defines cd-dimension:age, which is related to sdmx-dimension:age using dcterms:relation |
Table 8.
Distinct modelling practices for naming the geospatial, temporal, sex and age dimensions.
| Distinct Modelling Practice |
|---|
| P1.3.1: Re-use the dimension property defined by SDMX |
| P1.3.2: Define and use a proprietary property that is sub-property of the corresponding SDMX dimension property |
| P1.3.3: Define a proprietary dimension property that is related using dcterms:relation to the corresponding the SDMX dimension property |
| P1.3.4: Define a proprietary dimension property |
| P1.3.5: Do not use a geospatial/temporal/gender/age dimension |
Table 9.
Modelling practices used by data portals for hierarchical structures.
| Portal | Hierarchical Relations | Hierarchical Levels |
|---|---|---|
| Scottish | Defines spatial:within, spatial:contains | Uses rdf:type |
| DCLG | Defines spatial:within, spatial:contains | Uses rdf:type |
| ISTAT | - | Uses rdf:type |
| Irish CSO | - | - |
| VLO | - | - |
| e-Stat | Uses dcterms:isPartOf, dcterms:hasPart | Defines sacs:administrativeClass |
Table 10.
Distinct modelling practices used by data portals for hierarchical relations.
| Distinct Modelling Practice |
|---|
| P1.4.1: Use dcterms:isPartOf and dcterms:hasPart |
| P1.4.2: Define and use proprietary properties |
| P1.4.3: Do not use hierarchical properties |
Table 11.
Distinct modelling practices used by data portals for hierarchical levels.
| Distinct Modelling Practice |
|---|
| P1.4.4: Use rdf:type |
| P1.4.5: Define a proprietary property |
| P1.4.6: Do not use hierarchical levels |
Table 12.
Modelling practices of data portals regarding the values (code list) of the unit of measure.
Table 12.
Modelling practices of data portals regarding the values (code list) of the unit of measure.
| Portal | Modelling Practice |
|---|---|
| Scottish | Defines and uses values from proprietary code lists |
| DCLG | Re-uses values from QUDT, DBpedia, defines and uses proprietary code lists |
| ISTAT | - |
| Irish CSO | - |
| VLO | Defines and uses values from proprietary code lists, linked with QUDT |
| e-Stat | Defines and uses values from proprietary code lists |
Table 13.
Distinct modelling practices of data portals regarding the values (code list) of the unit of measure.
Table 13.
Distinct modelling practices of data portals regarding the values (code list) of the unit of measure.
| Distinct Modelling Practice |
|---|
| P1.5.1: Re-uses values from QUDT vocabulary |
| P1.5.2: Re-uses values from DBpedia vocabulary |
| P1.5.3: Defines and uses values from proprietary code lists |
| P1.5.4: Defines and uses values from proprietary code lists with concepts linked to QUDT |
Table 14.
Modelling practices of data portals for populating the temporal dimension.
| Portal | Modelling Practice |
|---|---|
| Scottish | Defines and uses proprietary code lists with values from reference.data.gov.uk |
| DCLG | Re-uses values from the reference.data.gov.uk vocabulary |
| ISTAT | Re-uses literals |
| Irish CSO | N/A |
| VLO | Uses literals |
| e-Stat | Uses literals |
Table 15.
Distinct modelling practices of data portals for populating the temporal dimension.
| Distinct Modelling Practice |
|---|
| P1.6.1: Re-use URIs from reference.data.gov.uk |
| P1.6.2: Define and use a proprietary code list that uses values from reference.data.gov.uk |
| P1.6.3: Use literals |
Table 16.
Modelling practices of data portals for populating the gender dimension.
| Portal | Modelling Practice |
|---|---|
| Scottish | Defines and uses a proprietary code list |
| DCLG | Re-uses values from SDMX |
| ISTAT | Re-uses values from SDMX |
| Irish CSO | Defines a proprietary code list |
| VLO | - |
| e-Stat | Defines a proprietary code list with values related to SDMX values using skos:closeMatch |
Table 17.
Distinct modelling practices of data portals for populating the gender dimension.
| Distinct Modelling Practice |
|---|
| P1.7.1: Re-use values from SDMX code list |
| P1.7.2: Define and use a proprietary code list with values related to sdmx:sex values using skos:closeMatch |
| P1.7.3: Define a proprietary code list |
Table 18.
Modelling practices of data portals for the measure and its parameters.
| Portal | Modelling Practice |
|---|---|
| Scottish | Defines and uses both measure and measure type |
| DCLG | Defines and uses both measure and measure type |
| ISTAT | Defines only the measure |
| Irish CSO | Defines and uses only the measure |
| VLO | Defines and uses both measure and measure type |
| e-Stat | Defines and uses both measure and measure type |
Table 19.
Distinct modelling practices of data portals for the measure and its parameters.
| Distinct Modelling Practice |
|---|
| P2.1.1: Define and use only the measure |
| P2.1.2: Define and use both measure and measure type (qb:measureType) |
| P2.1.3: Define and use both measure and measure type (new property) |
Table 20.
Modelling practices of data portals for multiple measures.
| Portal | Modelling Practice |
|---|---|
| Scottish | One or more measures per data cube |
| DCLG | One or more measures per data cube |
| ISTAT | One or more measures per data cube |
| Irish CSO | One measure per data cube |
| VLO | One measure per data cube |
| e-Stat | One or more measures per data cube |
Table 21.
Distinct modelling practices of data portals for the number of measures.
| Distinct Modelling Practice |
|---|
| P2.2.1: Define only one measure per data cube |
| P2.2.2: Define one or more measures per data cube |
Table 22.
Publishing modelling practices of data portals for the unit of the measure.
| Portal | Modelling Practice |
|---|---|
| Scottish | Defines only the unit |
| DCLG | Defines only the unit |
| ISTAT | N/A |
| Irish CSO | N/A |
| VLO | Defines only the unit |
| e-Stat | Defines the unit and the unit multiplier (estat:unitMult property) |
Table 23.
Distinct modelling practices of data portals regarding the number of measures.
| Distinct Modelling Practice |
|---|
| P2.3.1: Define only the unit |
| P2.3.2: Define the unit and the unit multiplier (where applicable) |
Table 24.
Modelling practices of data portals for selecting number of units per measure.
| Portal | Modelling Practice |
|---|---|
| Scottish | More than one unit per measure |
| DCLG | More than one unit per measure |
| ISTAT | - |
| Irish CSO | - |
| VLO | One unit per measure |
| e-Stat | One unit per measure |
Table 25.
Distinct practices of data portals for selecting number of units per measure.
| Distinct Publishing Practice |
|---|
| P2.4.1: Publish several data cubes with a single unit per measure |
| P2.4.2: Publish one data cube with multiple units per measure |
Table 26.
Modelling practices of data portals for hierarchical levels.
| Portal | Modelling Practice |
|---|---|
| Scottish | Define one data cube for all hierarchical levels |
| DCLG | Define one data cube for all hierarchical levels |
| ISTAT | Define one data cube for all hierarchical levels |
| Irish CSO | Define one data cube per hierarchical level |
| VLO | Define one data cube for all hierarchical levels |
| e-Stat | Define one data cube per hierarchical level |
Table 27.
Distinct modelling practices of data portals for hierarchical levels.
| Distinct Modelling Practice |
|---|
| P2.5.1: Define several data cubes with a single hierarchical level |
| P2.5.2: Define one cube with multiple hierarchical levels |
Table 28.
Modelling practices of data portals for multiple measures in data cubes.
| Portal | Modelling Practice |
|---|---|
| Scottish | Use “Measure dimension” modelling practice |
| DCLG | Use “Measure dimension” modelling practice |
| ISTAT | Use “Multi-measure observation” modelling practice |
| Irish CSO | N/A |
| VLO | N/A |
| e-Stat | Use “Measure dimension” modelling practice |
Table 29.
Distinct modelling practices of data portals for multiple measures in data cubes.
| Distinct Modelling Practice |
|---|
| P3.1.1: “Multi-measure observation” modelling practice |
| P3.1.2: “Measure dimension” modelling practice |
Table 30.
Modelling practices of data portals regarding the structural definition of the unit of measure.
Table 30.
Modelling practices of data portals regarding the structural definition of the unit of measure.
| Portal | Modelling Practice |
|---|---|
| Scottish | qb:Observation level |
| DCLG | qb:Observation level |
| ISTAT | N/A |
| Irish CSO | N/A |
| VLO | qb:Observation level |
| e-Stat | qb:Observation level |
Table 31.
Single practice of data portals regarding the structural definition of the unit of measure.
Table 31.
Single practice of data portals regarding the structural definition of the unit of measure.
| Distinct Publishing Practice |
|---|
| P3.2.1: Define the unit of measure at the qb:Observation level |
Table 32.
Modelling practices of data portals for defining dimensions with a single value in the structure of the data cube.
Table 32.
Modelling practices of data portals for defining dimensions with a single value in the structure of the data cube.
| Portal | Modelling Practice |
|---|---|
| Scottish | N/A |
| DCLG | N/A |
| ISTAT | qb:Observation level |
| Irish CSO | Does not define a temporal dimension |
| VLO | N/A |
| e-Stat | N/A |
Table 33.
Distinct modelling practices of data portals for defining dimensions with a single value in the structure of the data cube.
Table 33.
Distinct modelling practices of data portals for defining dimensions with a single value in the structure of the data cube.
| Distinct Modelling Practice |
|---|
| P3.3.1: Define the dimension at the qb:Observation level |
| P3.3.2: Do not define a temporal dimension |
Table 34.
Single modelling practice of data portals regarding aggregated values.
| Distinct Modelling Practice |
|---|
| P3.4.1: Define a new URI for the aggregated value |
Table 35.
Modelling practices of data portals regarding the values of the temporal dimension.
| Portal | Modelling Practice |
|---|---|
| Scottish | Uses URIs from code lists |
| DCLG | Uses URIs code lists |
| ISTAT | Specifies both value and data type |
| Irish CSO | N/A |
| VLO | Specifies only value |
| e-Stat | Specifies both value and data type |
Table 36.
Distinct modelling practices of data portals regarding the values of the temporal dimension.
Table 36.
Distinct modelling practices of data portals regarding the values of the temporal dimension.
| Distinct Modelling Practice |
|---|
| P3.5.1: Use URIs |
| P3.5.2: Use values and datatypes |
| P3.5.3: Use only values |
Table 37.
Modelling practices of data portals for associating dimensions to code lists.
| Portal | Modelling Practice |
|---|---|
| Scottish | (1) Uses qb:codeList to associate a qb:DimensionProperty with a skos:ConceptScheme. (2) Defines the rdfs:range as a sub-class of skos:Concept |
| DCLG | Uses the qb:codeList property to associate a qb:DimensionProperty with a skos:ConceptScheme and defines the rdfs:range of the qb:DimensionProperty as a sub-class of skos:Concept |
| ISTAT | Uses qb:codeList to associate a qb:DimensionProperty with a skos:ConceptScheme |
| Irish CSO | Defines the rdfs:range of the qb:DimensionProperty as a skos:Concept |
| VLO | Defines the rdfs:range of the qb:DimensionProperty as a skos:Concept |
| e-Stat | Uses the qb:codeList property to associate a qb:DimensionProperty with a skos:ConceptScheme and defines the rdfs:range of the qb:DimensionProperty as a sub-class of skos:Concept |
Table 38.
Distinct modelling practices of data portals for associating the dimensions to code lists.
Table 38.
Distinct modelling practices of data portals for associating the dimensions to code lists.
| Distinct Modelling Practice |
|---|
| P3.6.1: Use the qb:codeList property |
| P3.6.2: Use the qb:codeList property & define the rdfs:range of the qb:DimensionProperty as a sub-class of skos:Concept |
| P3.6.3: Define the rdfs:range of the qb:DimensionProperty as a skos:Concept |
| P3.6.4: Use two approaches. (1) Associate the code list using the qb:codeList property. (2) Define the rdfs:range as a sub-class of skos:Concept |
Table 39.
Conflicts and their current state.
| Conflict Name or Type | Status | Resolvable |
|---|---|---|
| Homonym conflicts | Solved | - |
| C1.1 Naming the measure property | Open | No |
| C1.2 Naming the unit of measure property | Open | Yes |
| C1.3a Naming the geospatial dimension properties | Open | Yes |
| C1.3b Naming the gender dimension properties | Open | No |
| C1.3c Naming the age dimension properties | Open | Yes |
| C1.3d Naming the temporal dimension properties | Open | Yes |
| C1.4 Naming hierarchical relations | Open | Yes |
| C1.5 Populating the unit of measure | Open | Yes |
| C1.6 Populating the temporal dimension | Open | No |
| C1.7 Populating the gender dimension | Open | No |
| C2.1 Modelling the measure and its parameters | Open | No |
| C2.2 Selecting the number of measures | Open | No |
| C2.3 Modelling the unit of measure and its parameters | Open | No |
| C2.4 Selecting the number of units per measure | Open | Yes |
| C2.5 Modelling hierarchical levels | Open | No |
| C3.1 Modelling multiple measures | Open | No |
| C3.2 Defining the unit of measure in the structure of the cube | Solved | - |
| C3.3 Defining dimensions with a single value in the structure of the data cube | Open | Yes |
| C3.4 Modelling aggregated values | Open | Yes |
| C3.5 Modelling the values of the temporal dimension | Open | Yes |
| C3.6 Associating dimensions to code lists | Open | Yes |
© 2019 by the authors. Licensee MDPI, Basel, Switzerland. This article is an open access article distributed under the terms and conditions of the Creative Commons Attribution (CC BY) license (http://creativecommons.org/licenses/by/4.0/).
Share and Cite
MDPI and ACS Style
Kalampokis, E.; Karamanou, A.; Tarabanis, K. Interoperability Conflicts in Linked Open Statistical Data. Information 2019, 10, 249. https://0-doi-org.brum.beds.ac.uk/10.3390/info10080249
AMA Style
Kalampokis E, Karamanou A, Tarabanis K. Interoperability Conflicts in Linked Open Statistical Data. Information. 2019; 10(8):249. https://0-doi-org.brum.beds.ac.uk/10.3390/info10080249
Chicago/Turabian StyleKalampokis, Evangelos, Areti Karamanou, and Konstantinos Tarabanis. 2019. "Interoperability Conflicts in Linked Open Statistical Data" Information 10, no. 8: 249. https://0-doi-org.brum.beds.ac.uk/10.3390/info10080249
Note that from the first issue of 2016, this journal uses article numbers instead of page numbers. See further details here.