K-Means Clustering-Based Electrical Equipment Identification for Smart Building Application


1
School of Information and Electrical Engineering, Shandong Jianzhu University, Jinan 250101, China
2
Shandong Provincial Key Laboratory of Intelligent Buildings Technology, Jinan 250101, China
*
Authors to whom correspondence should be addressed.
Information 2020, 11(1), 27; https://0-doi-org.brum.beds.ac.uk/10.3390/info11010027
Submission received: 2 December 2019
/
Revised: 26 December 2019
/
Accepted: 28 December 2019
/
Published: 1 January 2020
(This article belongs to the Section Information Applications)
Abstract
:With the development and popular application of Building Internet of Things (BIoT) systems, numerous types of equipment are connected, and a large volume of equipment data is collected. For convenient equipment management, the equipment should be identified and labeled. Traditionally, this process is performed manually, which not only is time consuming but also causes unavoidable omissions. In this paper, we propose a k-means clustering-based electrical equipment identification toward smart building application that can automatically identify the unknown equipment connected to BIoT systems. First, load characteristics are analyzed and electrical features for equipment identification are extracted from the collected data. Second, k-means clustering is used twice to construct the identification model. Preliminary clustering adopts traditional k-means algorithm to the total harmonic current distortion data and separates equipment data into two to three clusters on the basis of their electrical characteristics. Later clustering uses an improved k-means algorithm, which weighs Euclidean distance and uses the elbow method to determine the number of clusters and analyze the results of preliminary clustering. Then, the equipment identification model is constructed by selecting the cluster centroid vector and distance threshold. Finally, identification results are obtained online on the basis of the model outputs by using the newly collected data. Successful applications to BIoT system verify the validity of the proposed identification method.

1. Introduction
With the increasing integration of industrialization and informatization, Internet of Things (IoT) technology has become an important means of interconnection between the human society and physical systems [1]. In several application scenarios of Building Internet of Things (BIoT), generally, the electrical parameter acquisition terminal and the equipment under test have no data interaction [2]. Therefore, the type information of the equipment under test cannot be directly obtained from the platform side and should be manually labeled [3]. With the increasing demand for the remote monitoring and refined management of building electrical equipment, automatically identifying the types of equipment connected to the platform is important [4]. Data-driven equipment identification does not just considerably save labor but also timely adapts to the rapid change of equipment states [5]; it lays the foundation for equipment intellectualization [6].
Many experts and scholars studied the identification of electrical equipment mainly by acquiring the relevant rules and mode information of user equipment [7,8]. Data-driven algorithms, such as Markov chain [9], decision tree [10], probabilistic neural network [11], deep learning [12], support vector machine [13], greedy kernel principal components analysis [14] and hidden Markov model [15], were applied to construct equipment identification models by mining the potential characteristics of electrical equipment parameter data [16,17]. An equipment identification model that combines k-means clustering and kNN classification techniques is constructed to identify the low-voltage DC electrical load [18]. A k-means Bayes algorithm is used to analyze big data sets for identifying the types of equipment failures [19]. Uncorrelated spectral components of active power consumption signal are used to identify residential appliances [20], wherein Karhunen-Loeve expansion is used to breakdown the active power signal into subspace components to construct appliance signatures. Ghosh et al. [21] proposed an improved nonintrusive load monitoring technique for identifying different loads.
However, most of the current models are based on the analysis of specific electrical equipment [22,23]. They have strong pertinence and weak robustness, cannot be flexibly applied to certain electrical equipment, and cannot accurately identify data with unclear features. The equipment identification method for analyzing historical data has poor timeliness. Although the method can achieve equipment identification, it is extremely slow when the equipment states change rapidly.
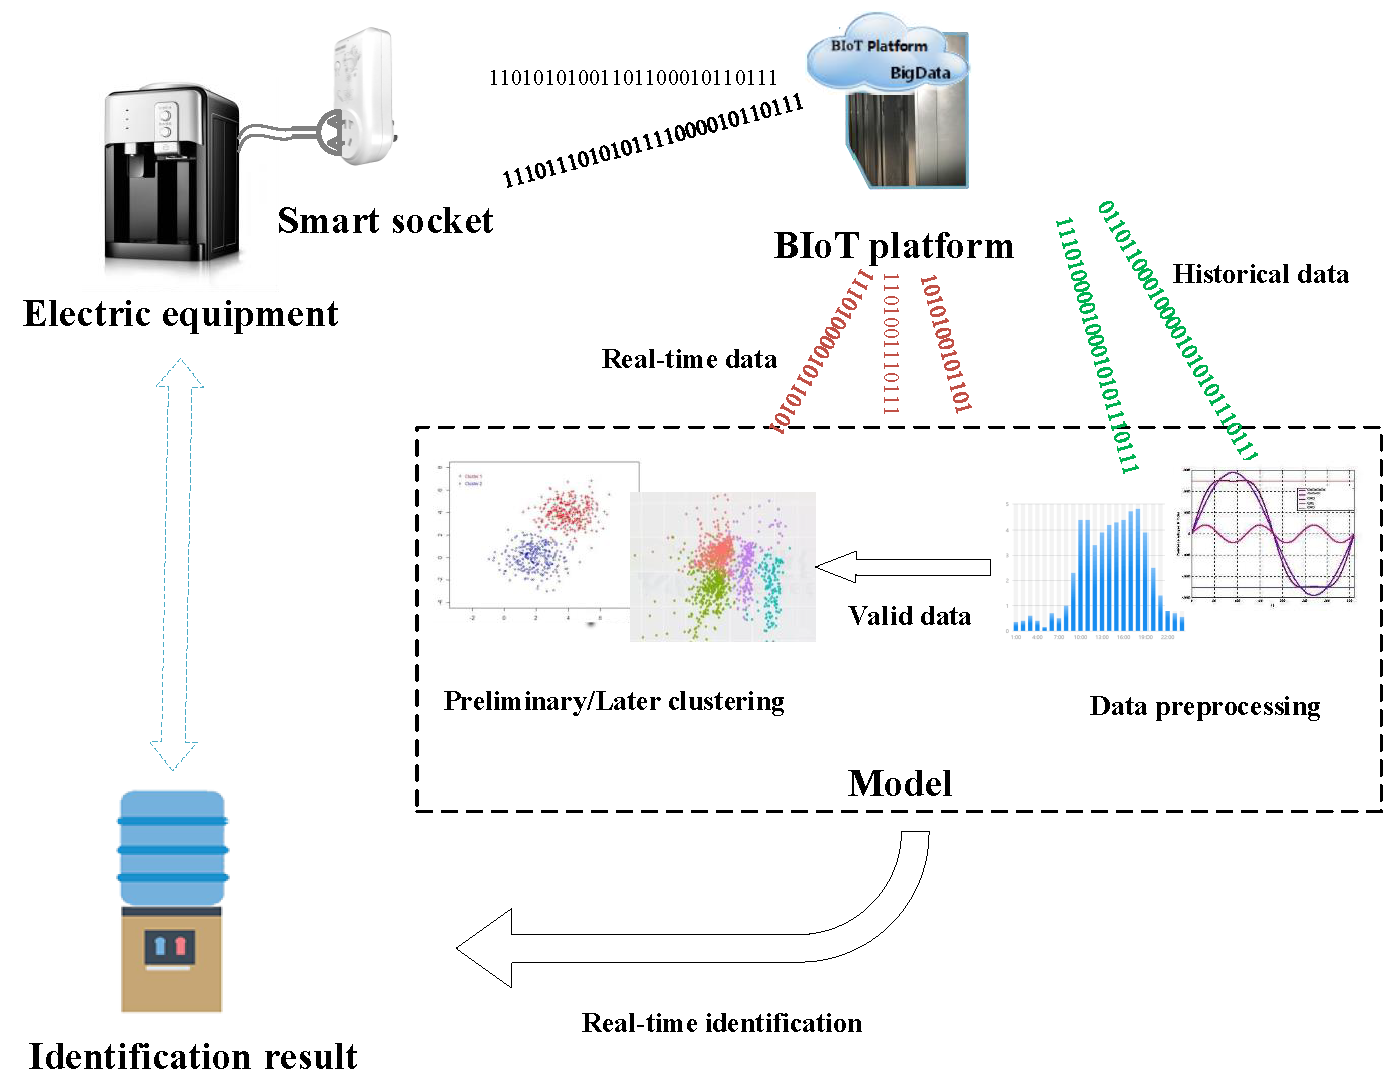
To solve the abovementioned problems, a novel method for identifying the electrical equipment in BIoT environment is proposed in this paper. First, the real-time and historical data of the equipment are collected using smart sockets, and electrical parameters for equipment identification are extracted through the analysis of load characteristics. Second, k-means clustering algorithm is used twice to construct the identification model. Preliminary clustering adopts the traditional k-means algorithm to total harmonic current distortion () data and separates equipment data into two to three clusters on the basis of their electrical characteristics. Later clustering uses an improved k-means algorithm, which weighs Euclidean distance and uses the elbow method to determine the number of clusters and analyze the results of preliminary clustering. Then, the equipment identification model is constructed by selecting the cluster centroid vector and distance threshold. Finally, identification results are obtained online on the basis of the model outputs by using the newly collected data. The model is applied to BIoT platform to establish a library-type equipment. Equipment identification can be used to create user portraits and is important for accurate billing, anomaly detection, and demand response programs.
Our main contribution is an equipment identification with improved k-means clustering algorithm that: (1) integrates two clusters in a cascaded way to analyze and use different characteristics of electrical equipment and improves the performance of equipment identification; (2) decomposes the identification procedure to two stages which effectively reduces the amount of calculation and implements online identification with real-time data collecting by the IoT; and (3) demonstrates statistically significant superiority in both standard deviation and performance measures for clustering tasks in comparison with traditional K-means clustering.
The remainder of this paper is organized as follows: Section 2 analyzes the BIoT platform and electrical equipment characteristics. Section 3 describes the identification method, including data preprocessing, feature extraction, construction of equipment identification model, and real-time equipment identification. Section 4 presents and discusses the identification results. Finally, Section 5 draws the conclusions.
2. Analysis of BIoT Platform and Electrical Equipment
2.1. BIoT Platform and Data Collection
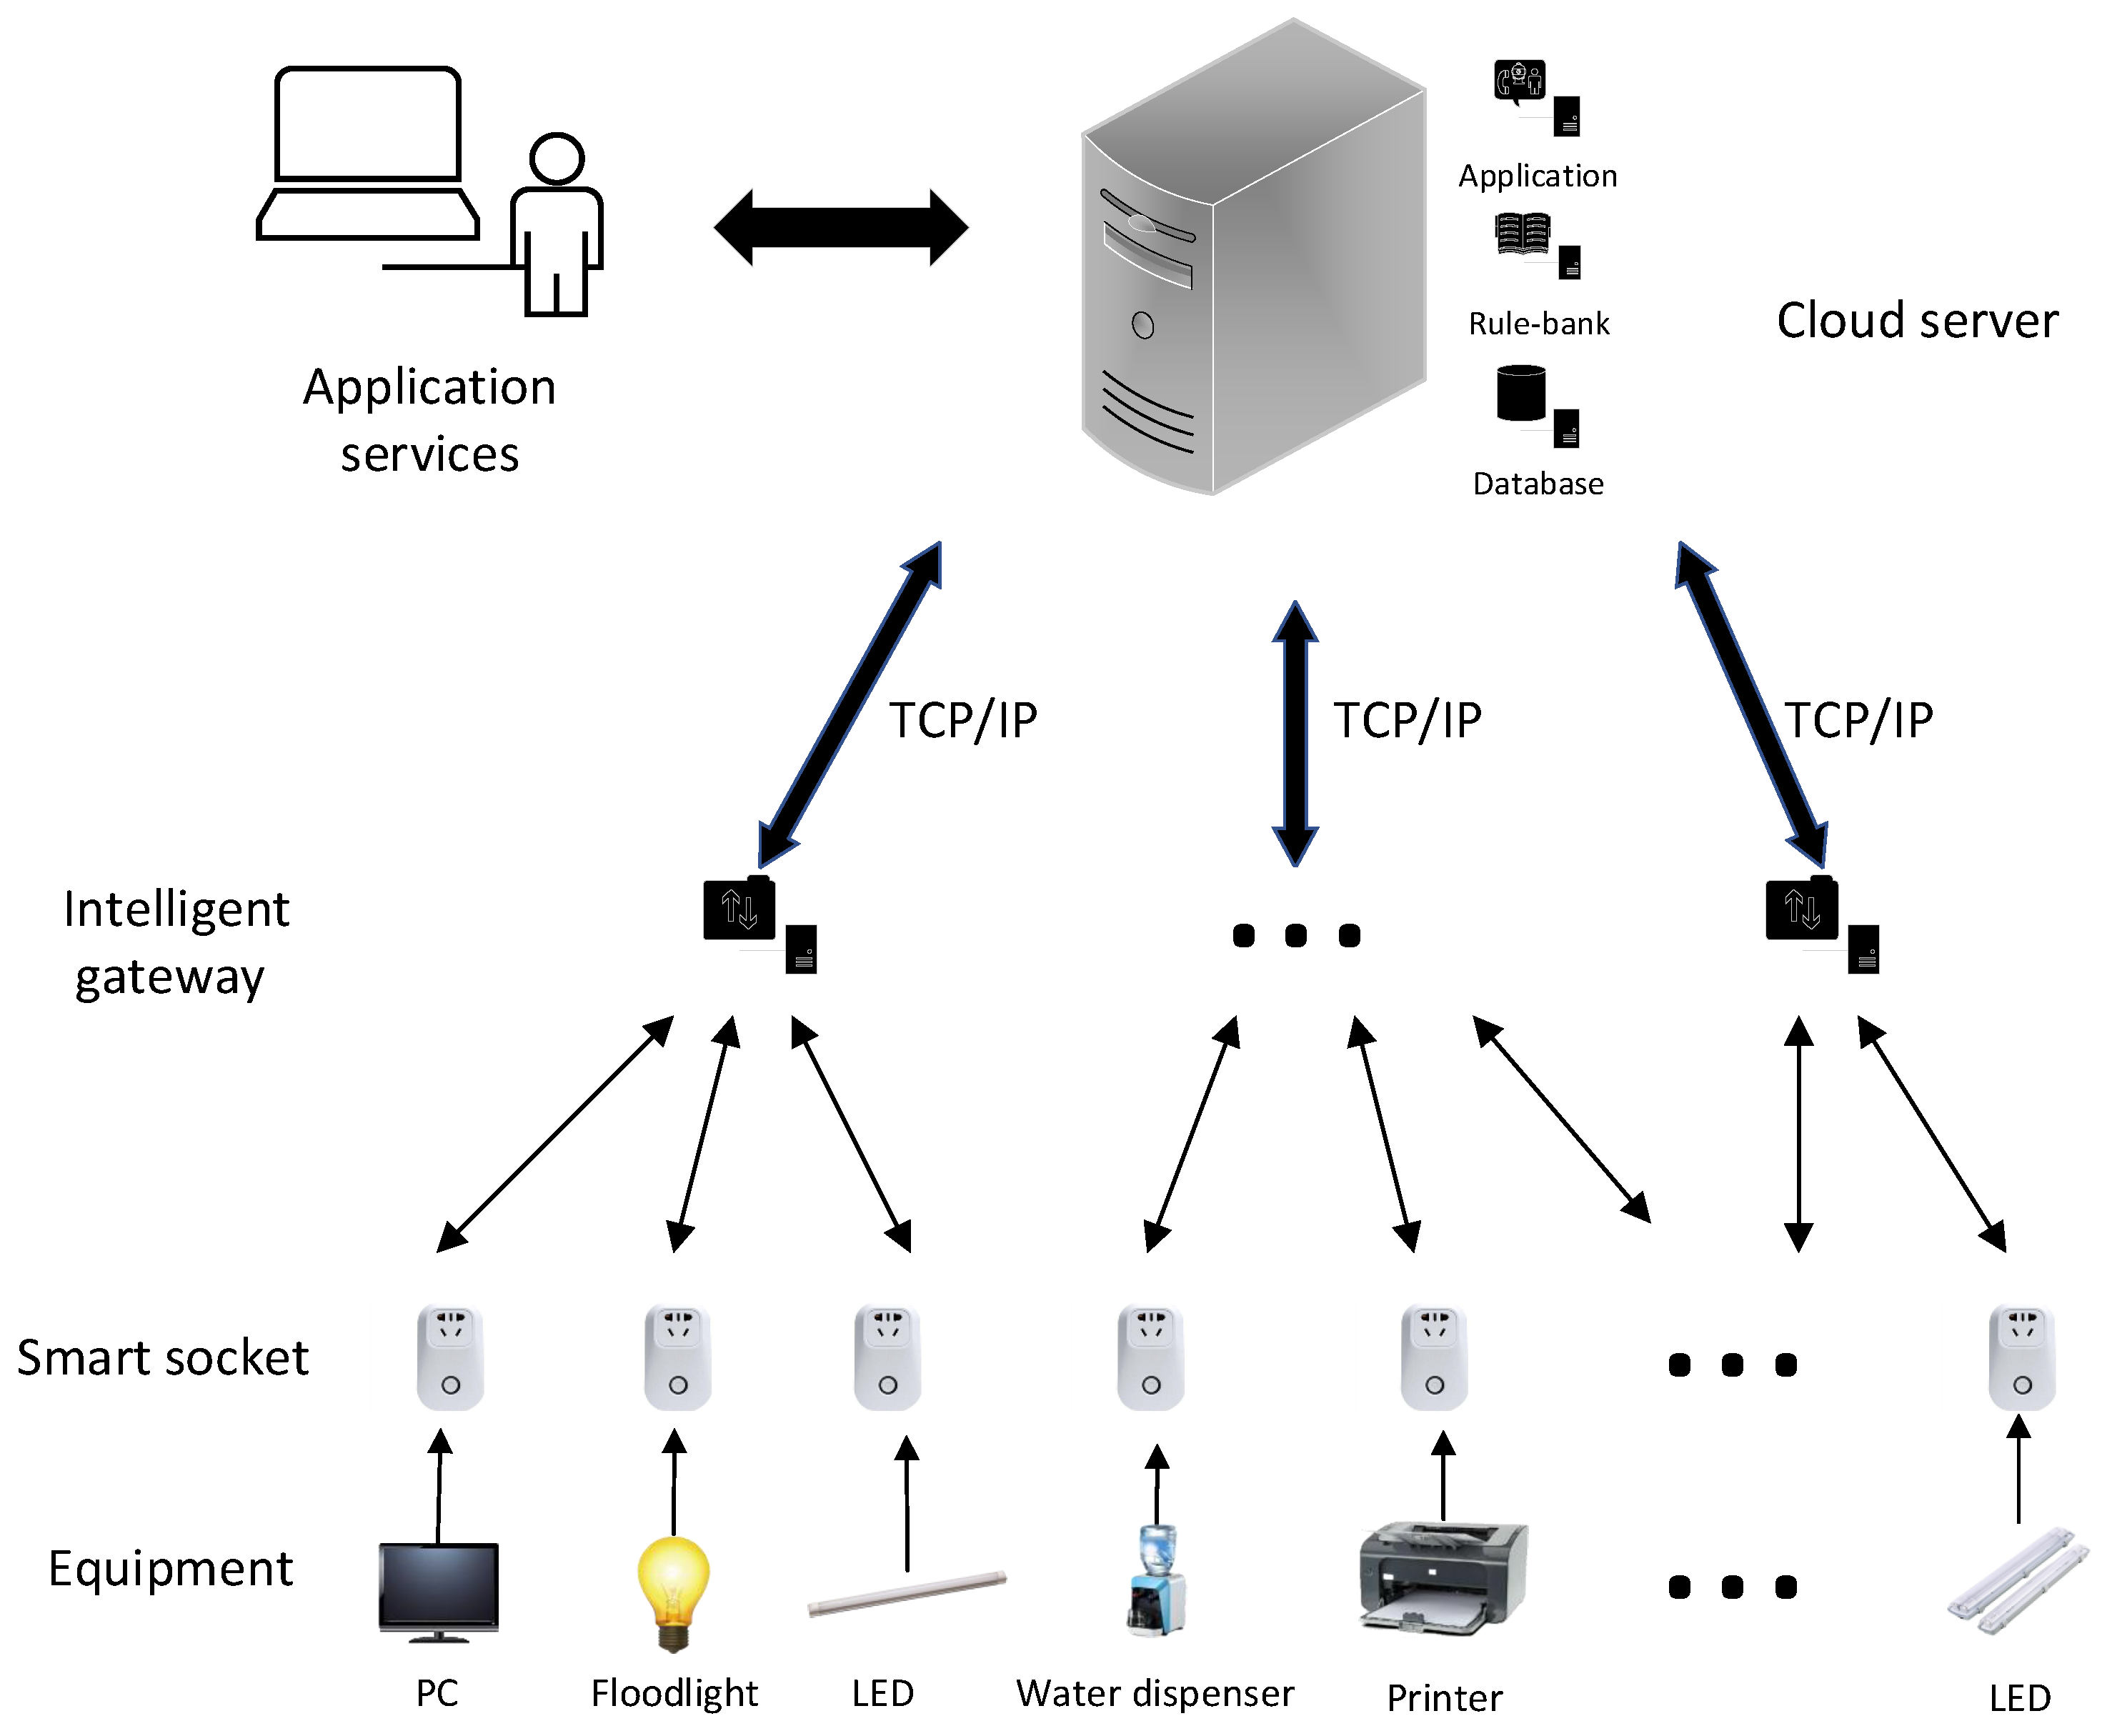
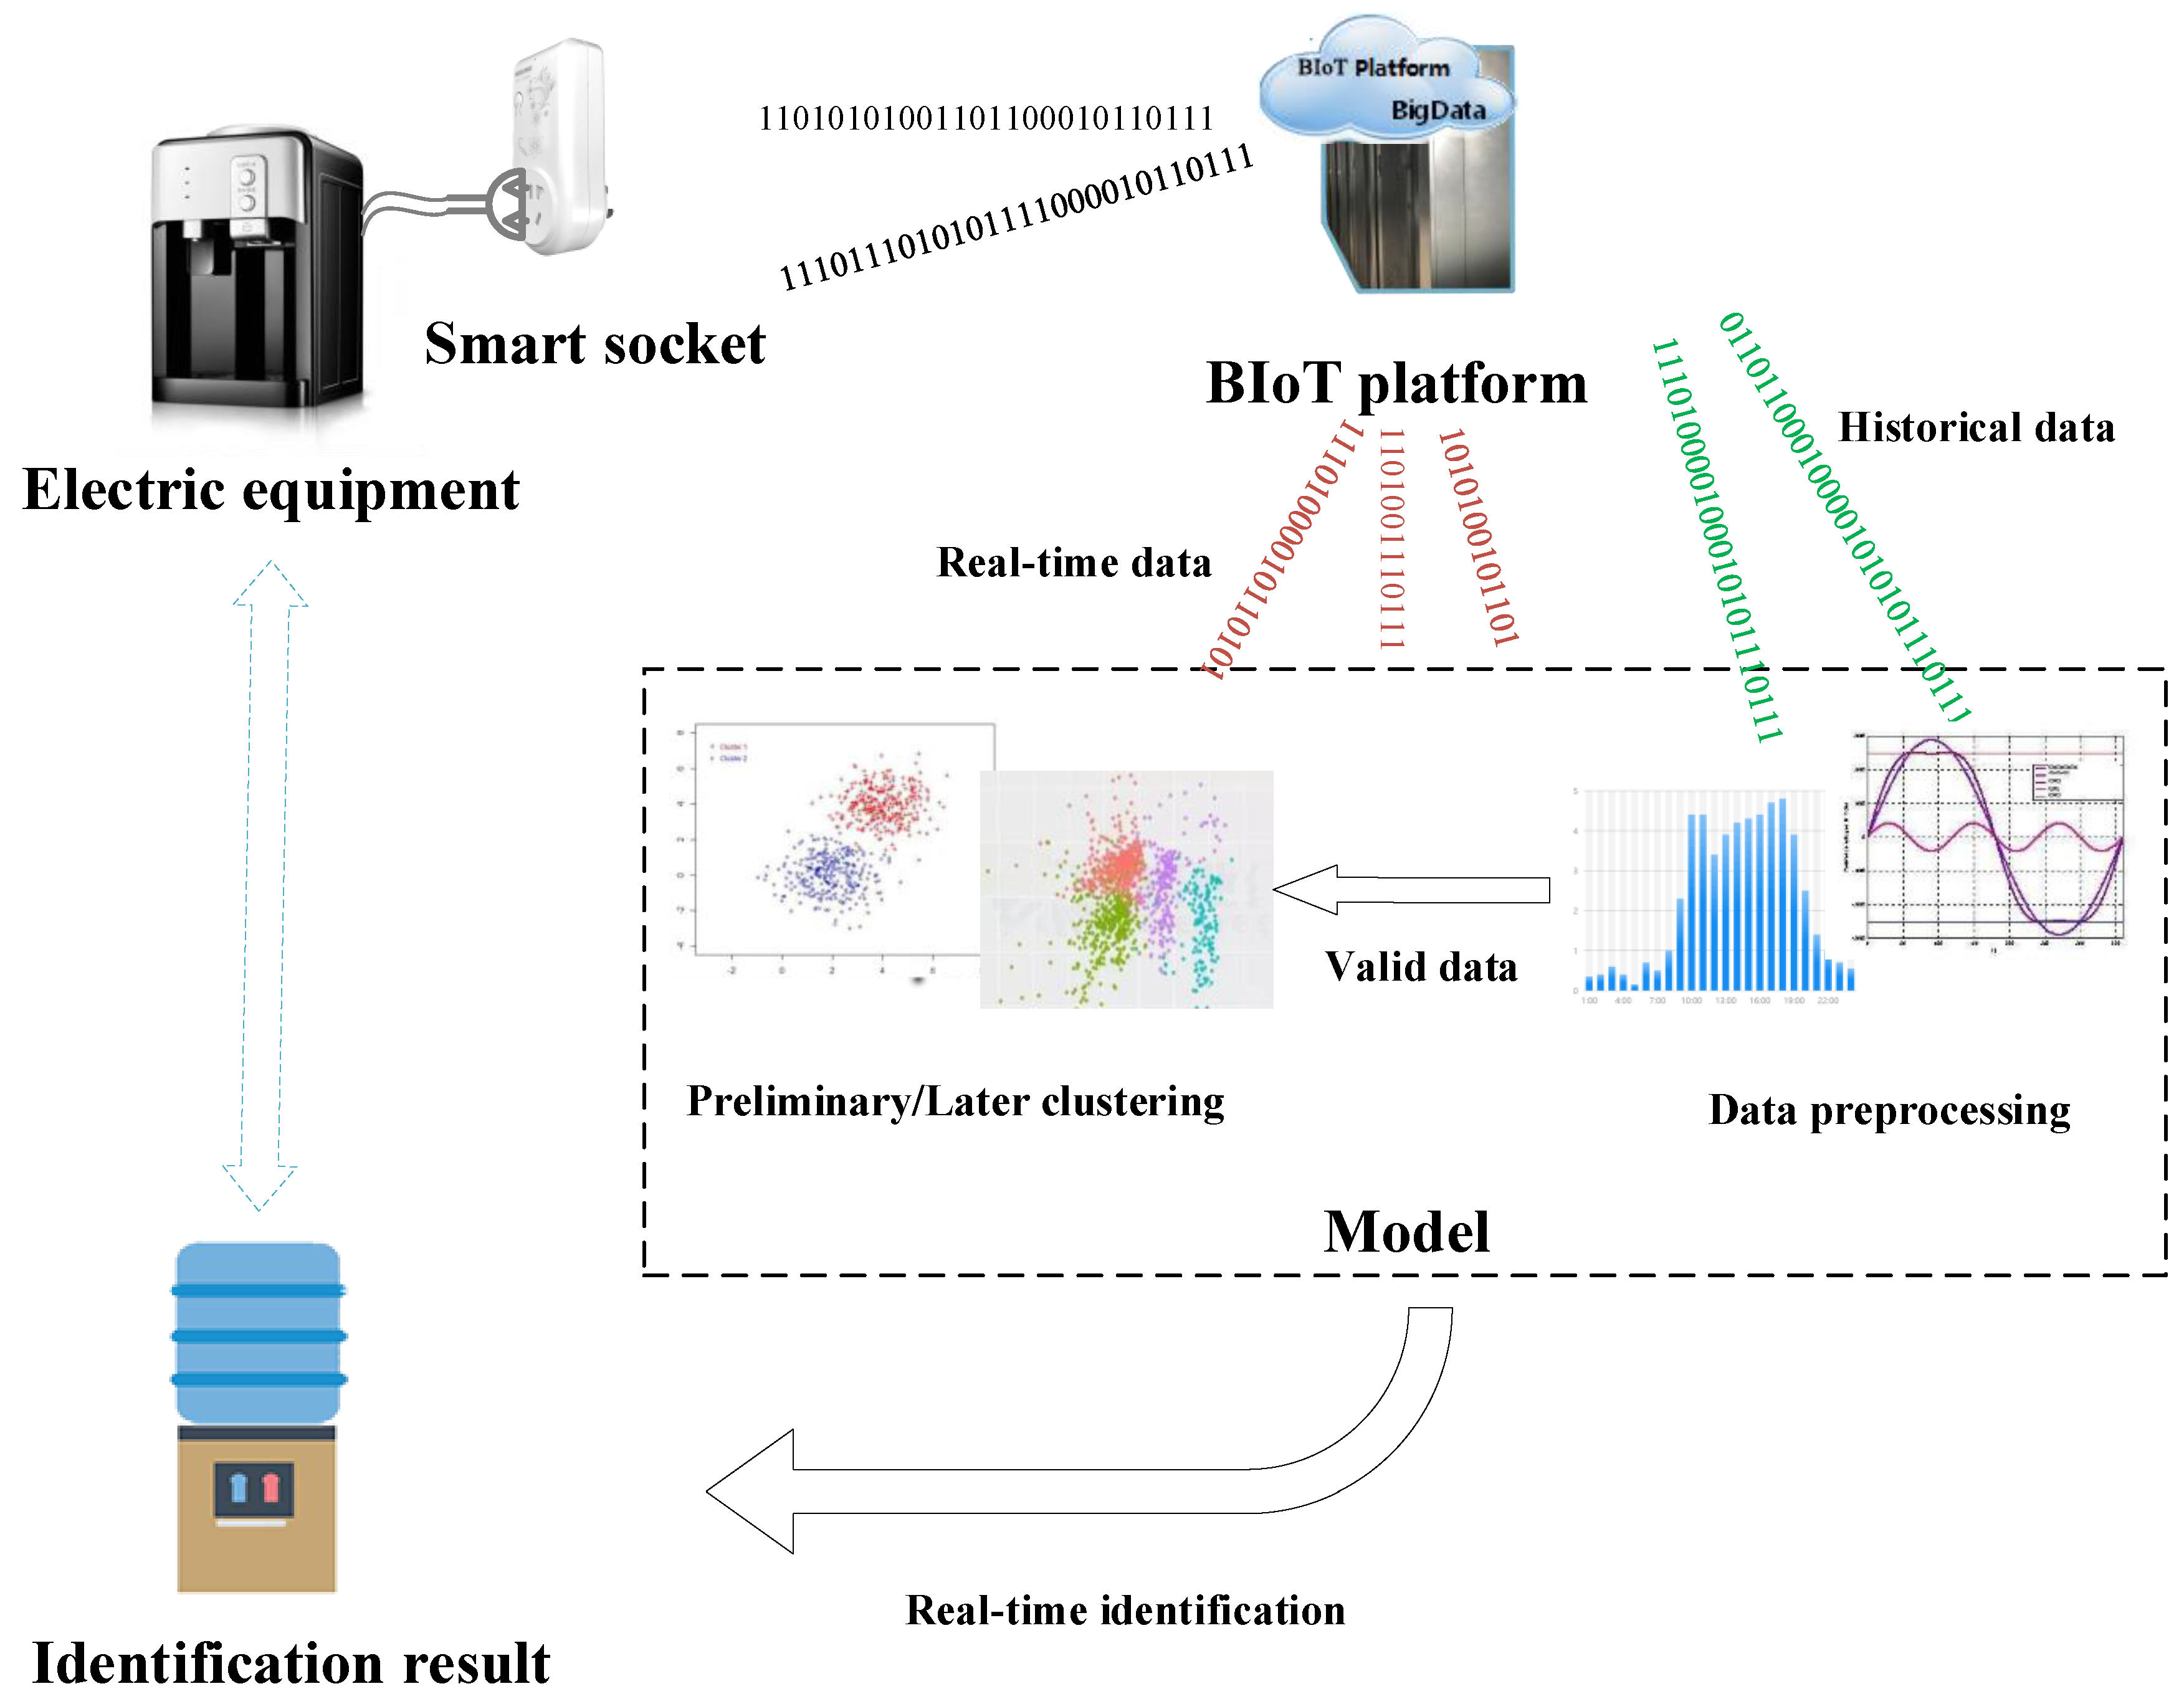
The BIoT platform includes application services, cloud server, intelligent gateways, smart sockets, and equipment. Figure 1 shows the structure of the BIoT system. The smart socket consists of parameter acquisition and data transmission modules. The parameter acquisition module can collect various electrical parameters of the electrical equipment, such as current, voltage, and power. The collected data are uploaded to the intelligent gateway through the data transmission module. The intelligent gateway aggregates data into the unified BIoT platform through a network protocol, such as TCP/IP [24]. The data required for data mining algorithms, such as equipment identification, can be accessed from the BIoT platform.
2.2. Analysis of Equipment Characteristics
Considering the unique internal structure mechanism [10], electrical equipment has specific operating parameters and load characteristics. The electrical parameters of the equipment include the harmonics, current RMS, periodic current, power, and energy consumption, which vary in different operation stages.
2.2.1. Analysis of Load Characteristics
With the rapid development of power electronics technology, various rectifiers, frequency converters, and electrical equipment with nonlinear characteristics are emerging, which cause high harmonics in grid current [25,26]. Nonlinear components exist in household and office equipment, such as TV sets, energy-saving lamps, washing machines, and medical instruments. The survey of harmonics shows [8,9,10] that common electrical equipment mainly produces odd harmonics of no more than 13 orders [27,28], and a small number of electrical appliances produce harmonics of more than 20 orders, but the content of harmonics is extremely small. The harmonics of 1–32 orders can almost reflect the complete harmonics of equipment. Depending on the component, the equipment can be divided into different types on the basis of the electrical load characteristics, which are key parameters for equipment identification. Table 1 presents the load characteristics of equipment.
As shown in Table 1, the load characteristics of the equipment include resistive (R), capacitive (C), and inductive (L) loads. The R load operates through resistive components, and its power varies greatly. However, the harmonics of R load are almost absent, and current waveform is close to sinusoidal wave. The C load has AC/DC converter module; thus, it produces large waveform distortion and even relatively high harmonics, but the power is not extremely large. The L load has the characteristic of load current lagging behind load voltage with a phase difference, and certain equipment will consume reactive power when consuming active power, which will cause large harmonics.
2.2.2. Analysis of Power and Working Characteristics
Users generally use the equipment in a certain time pattern. For example, several household electrical appliances will show the approximate frequency of use when the user returns home from work. The power of the equipment generally fluctuates in a small range around the rated power in a particular working state. However, the power will change significantly when the working state changes. The information shown in Table 2 can be obtained by analyzing the working states of specific electrical equipment.
2.3. Feature Extraction
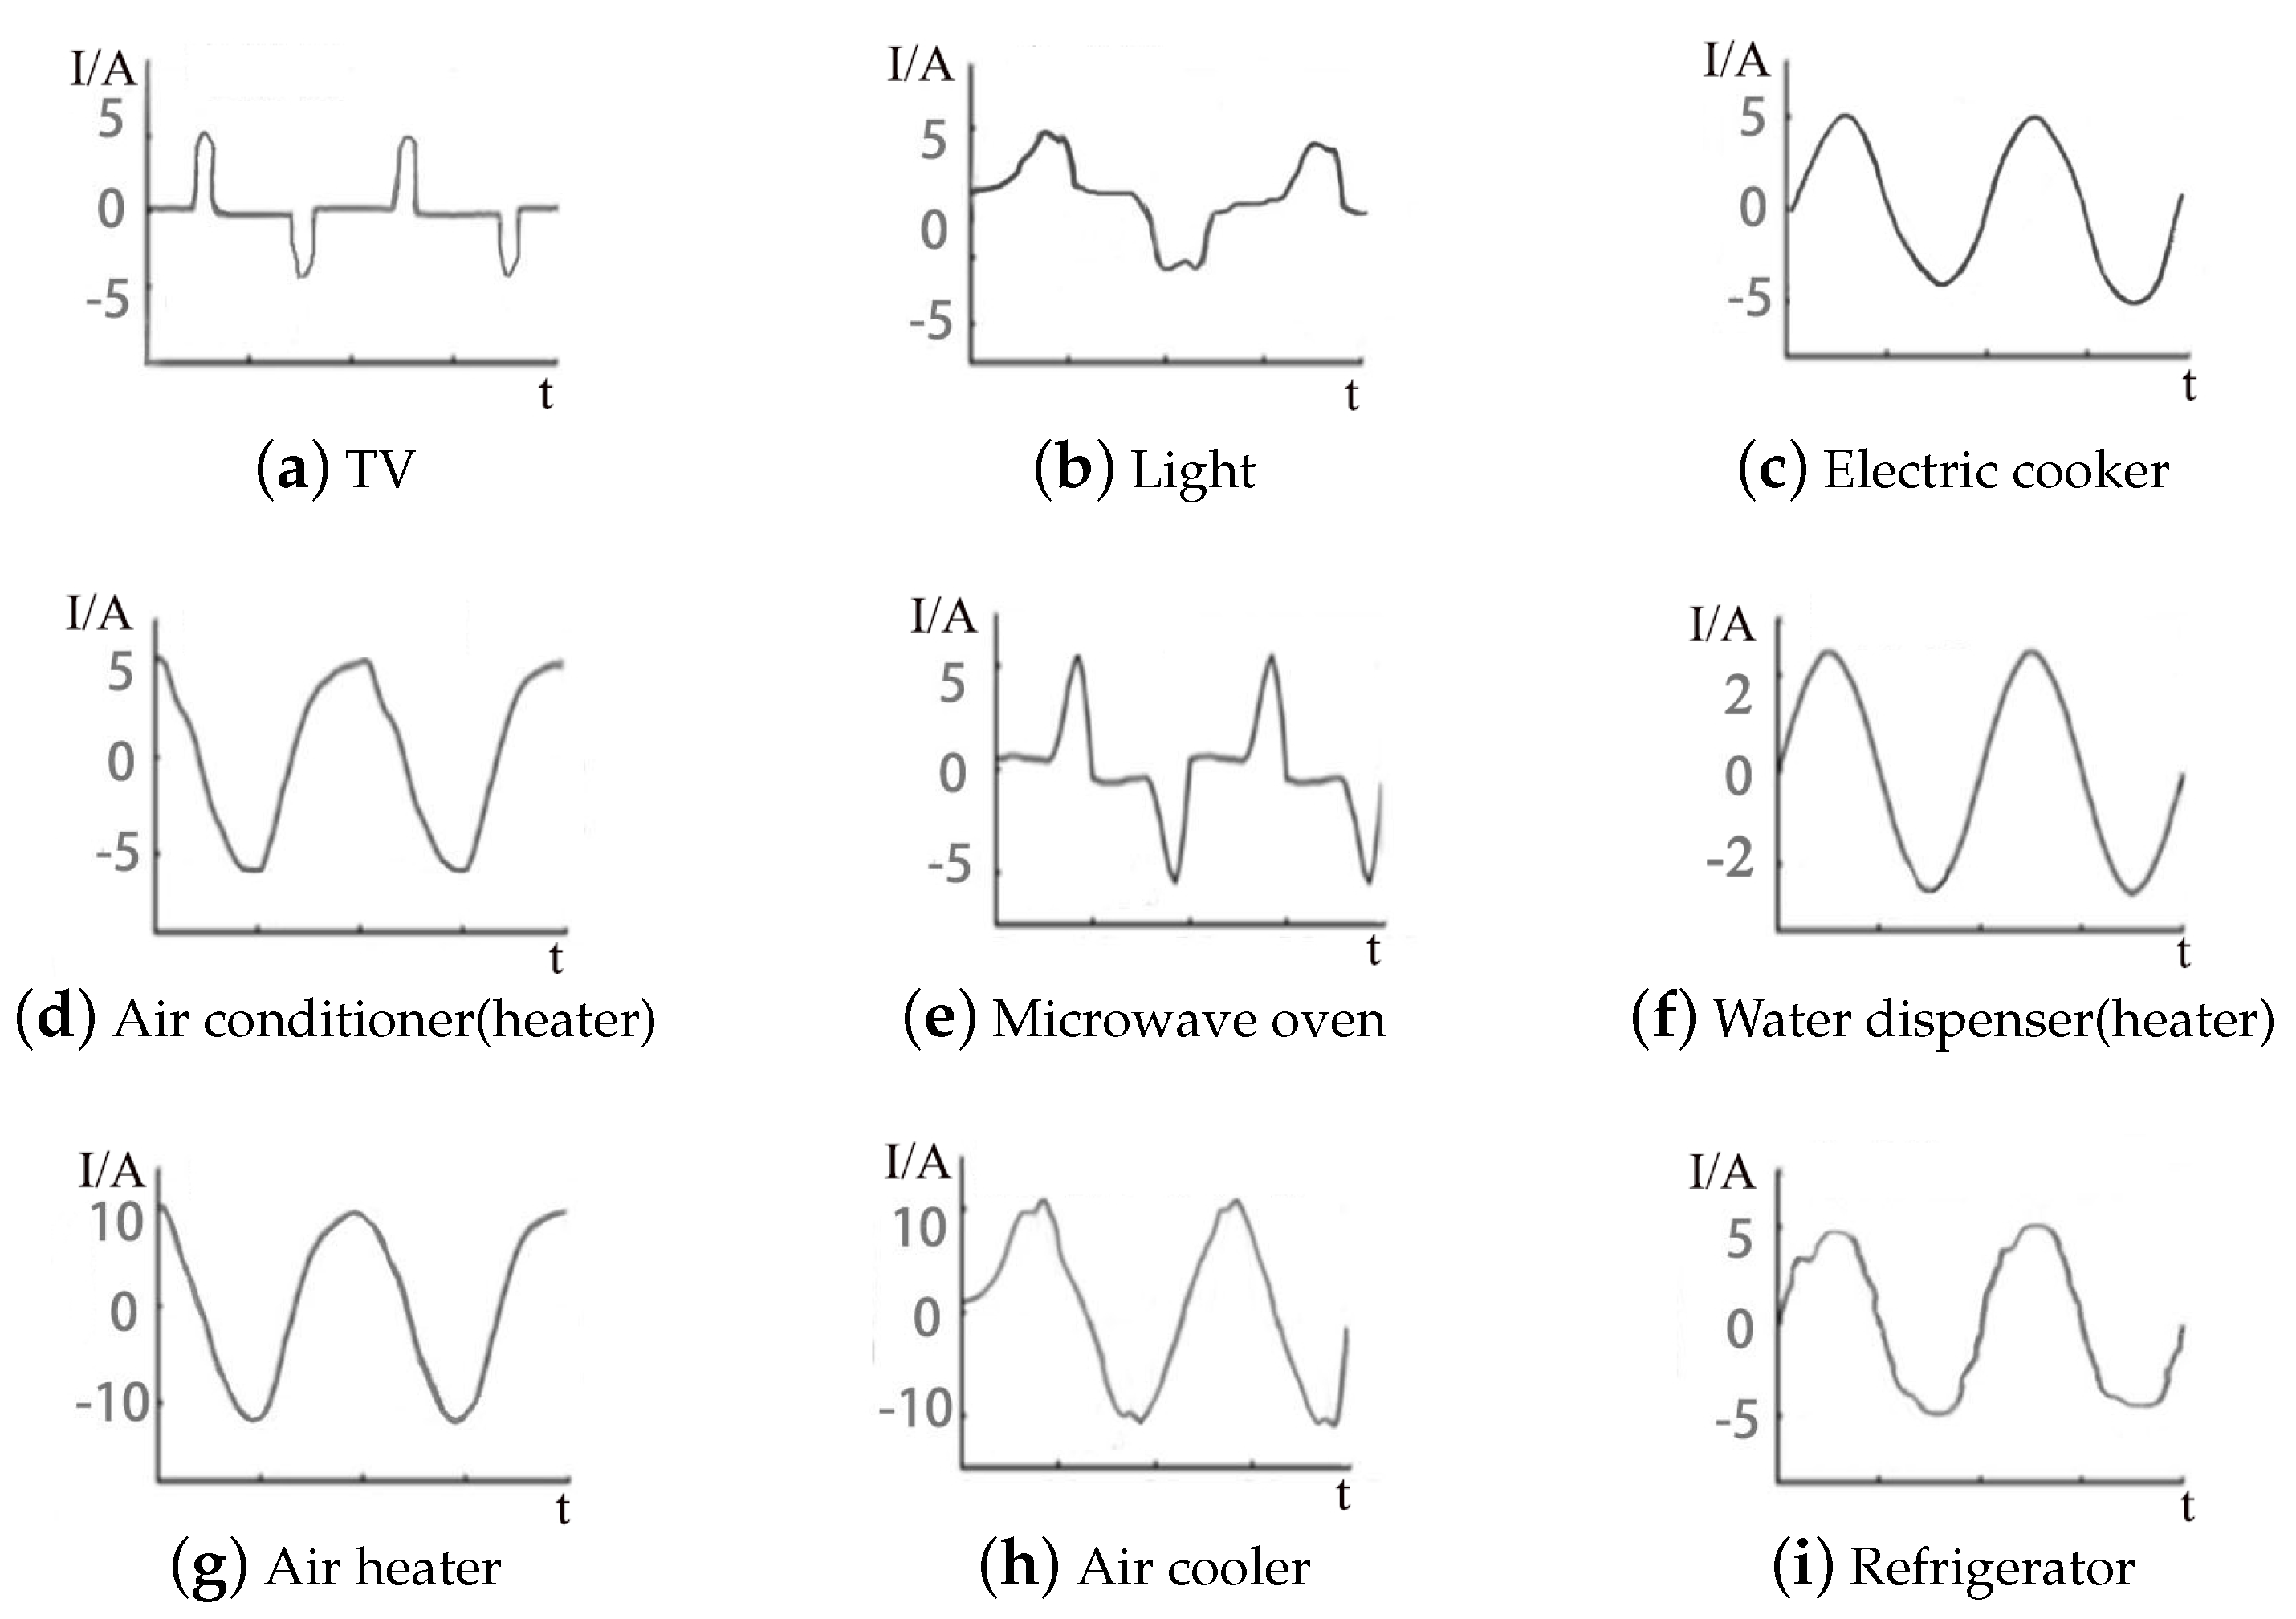
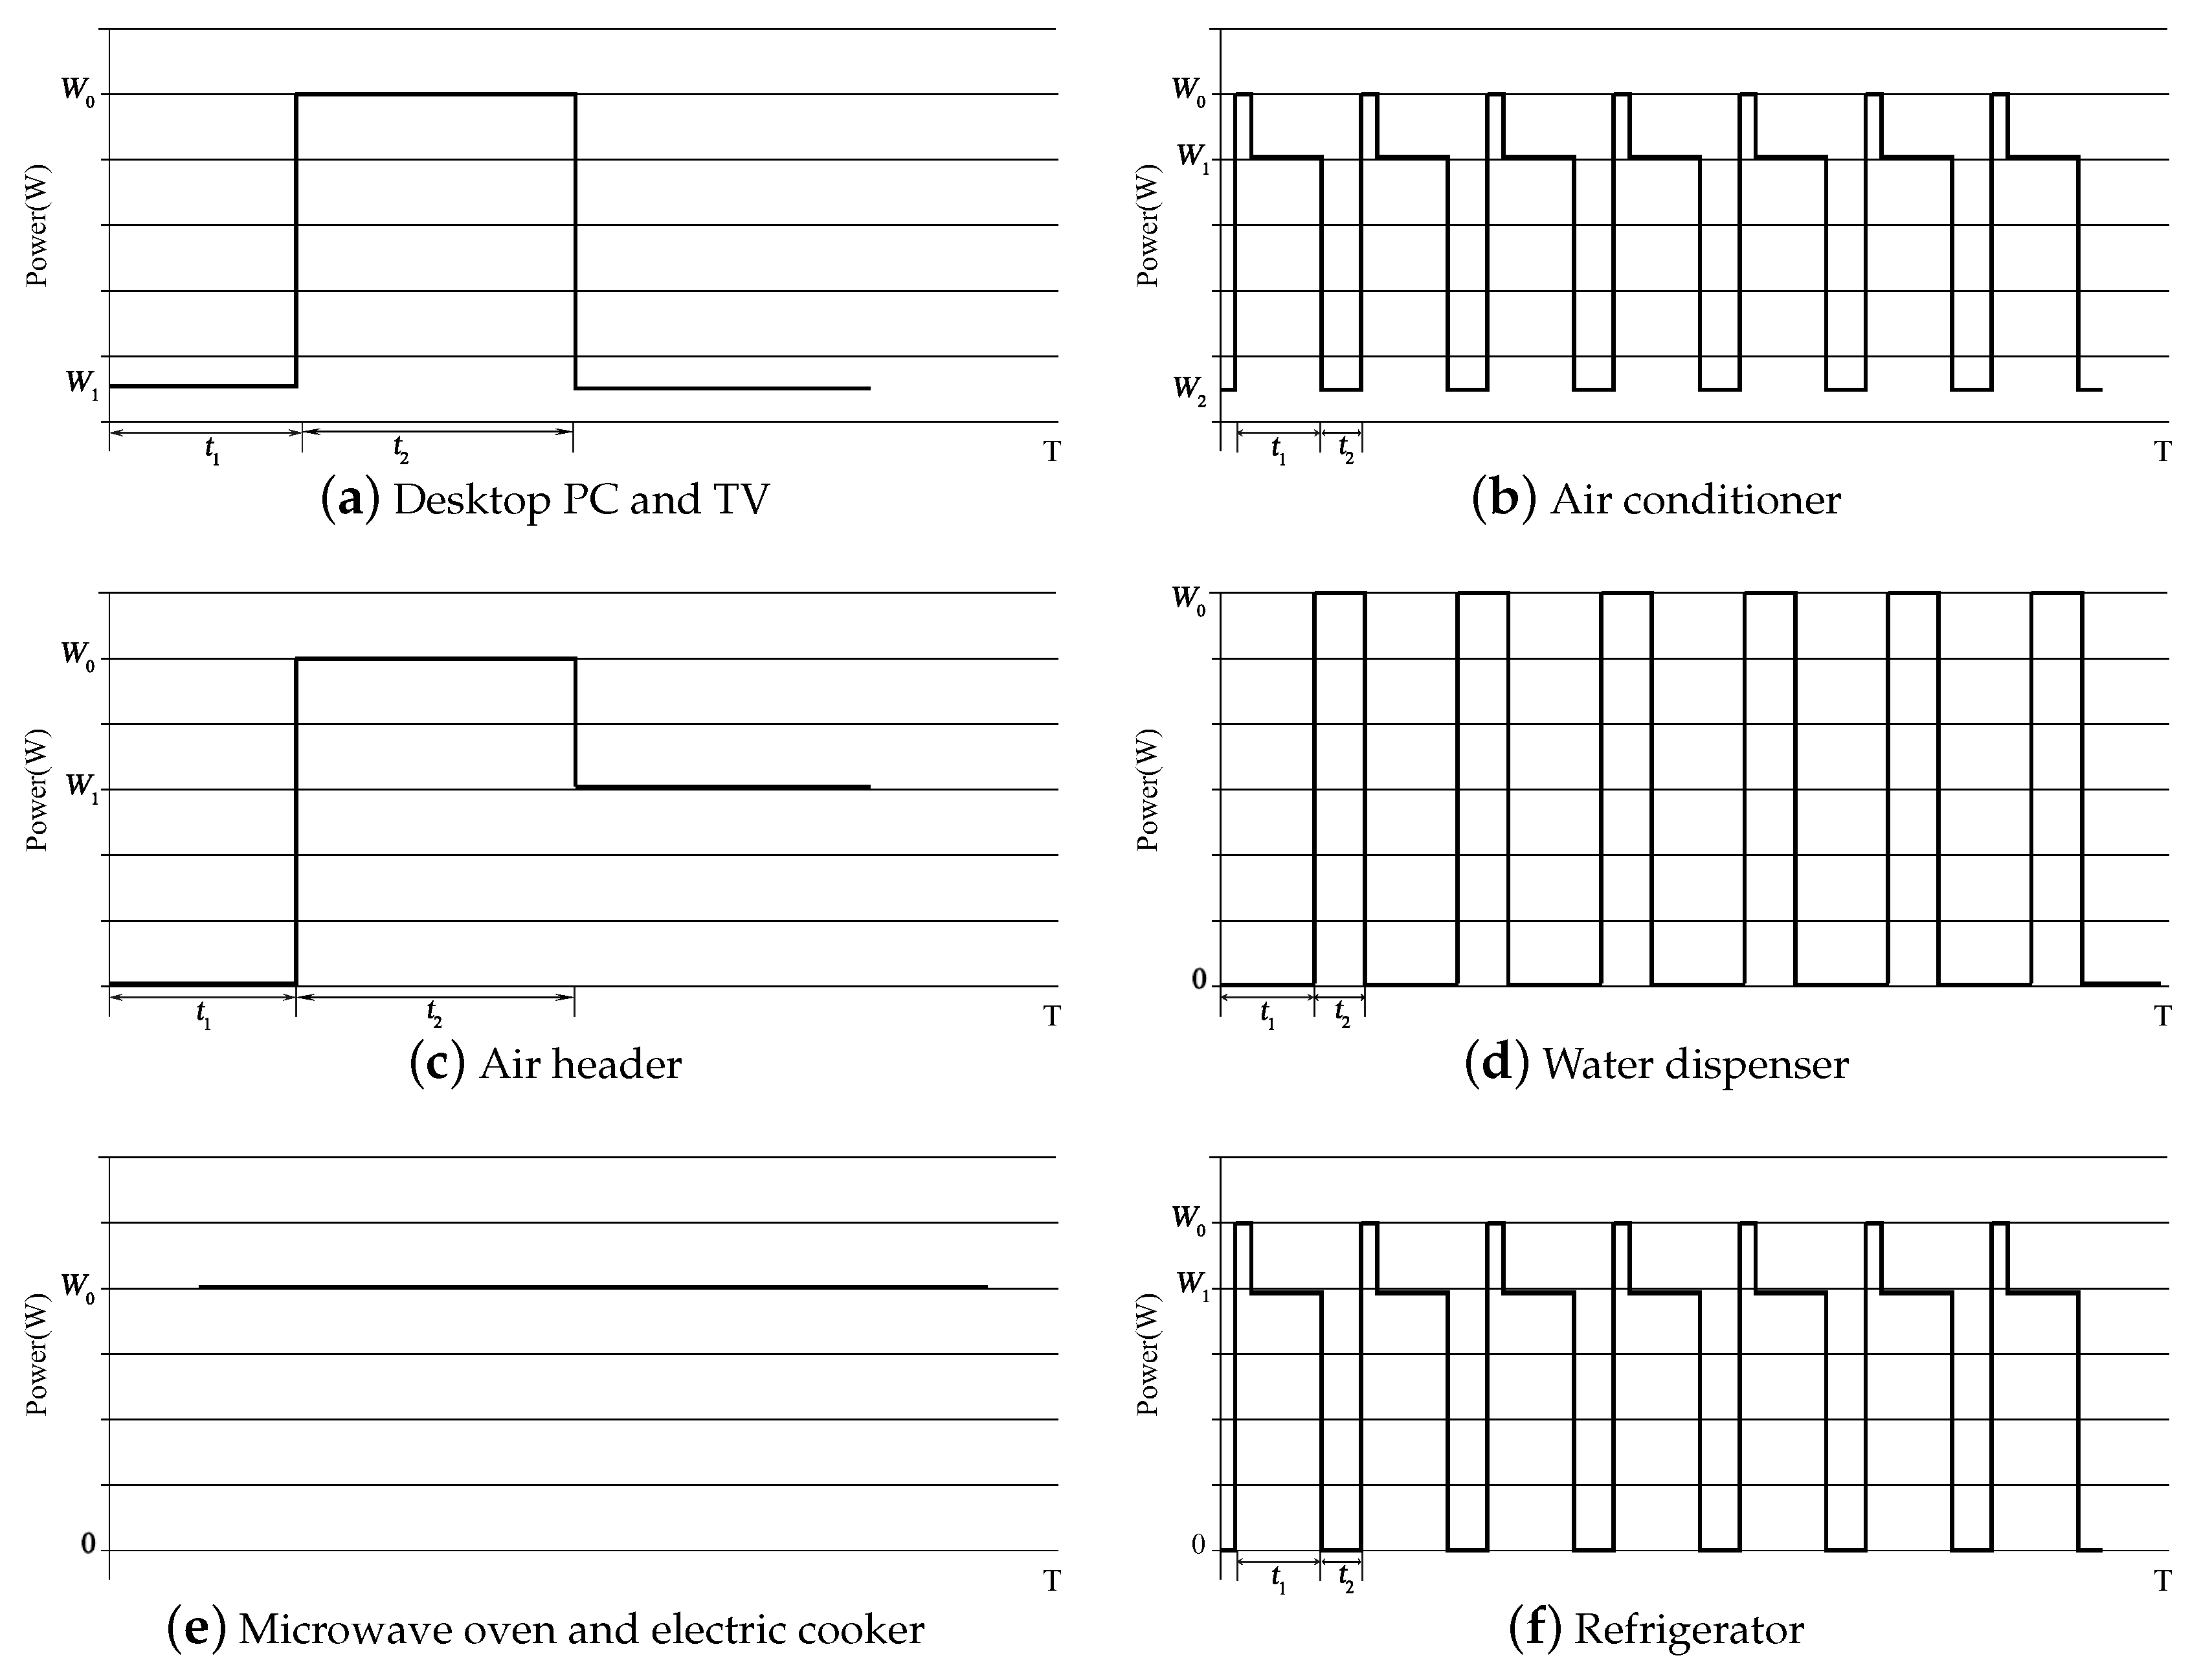
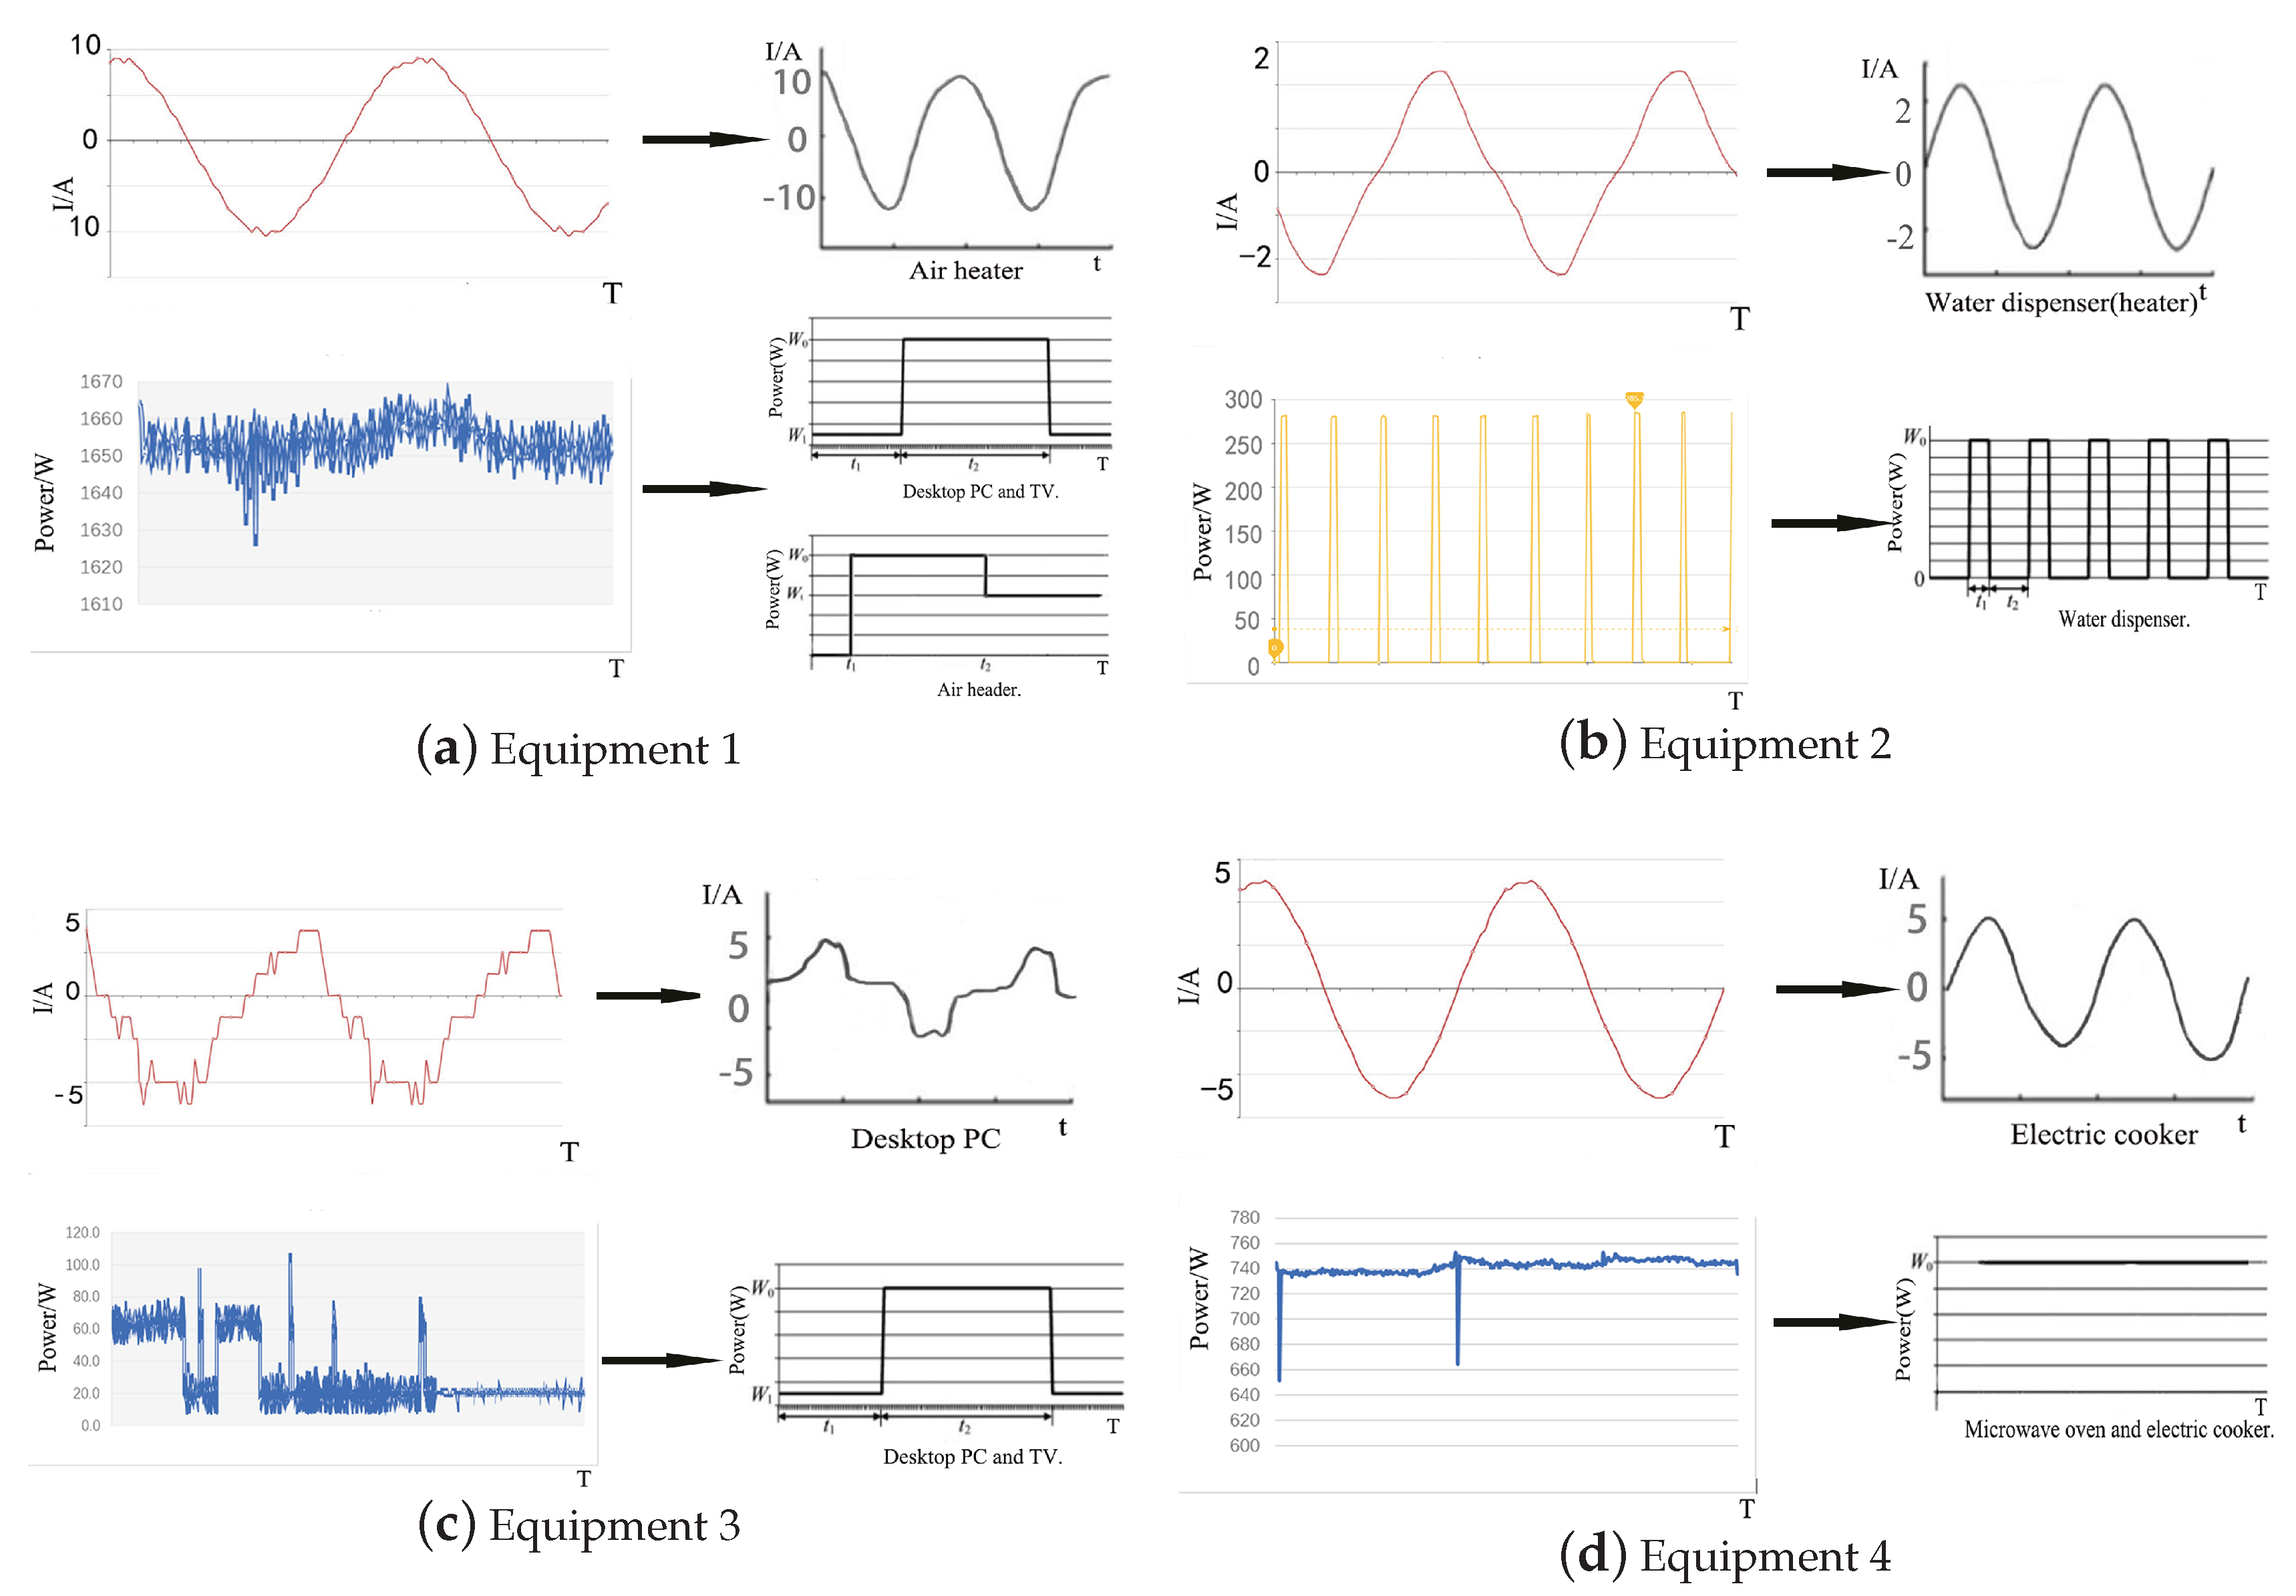
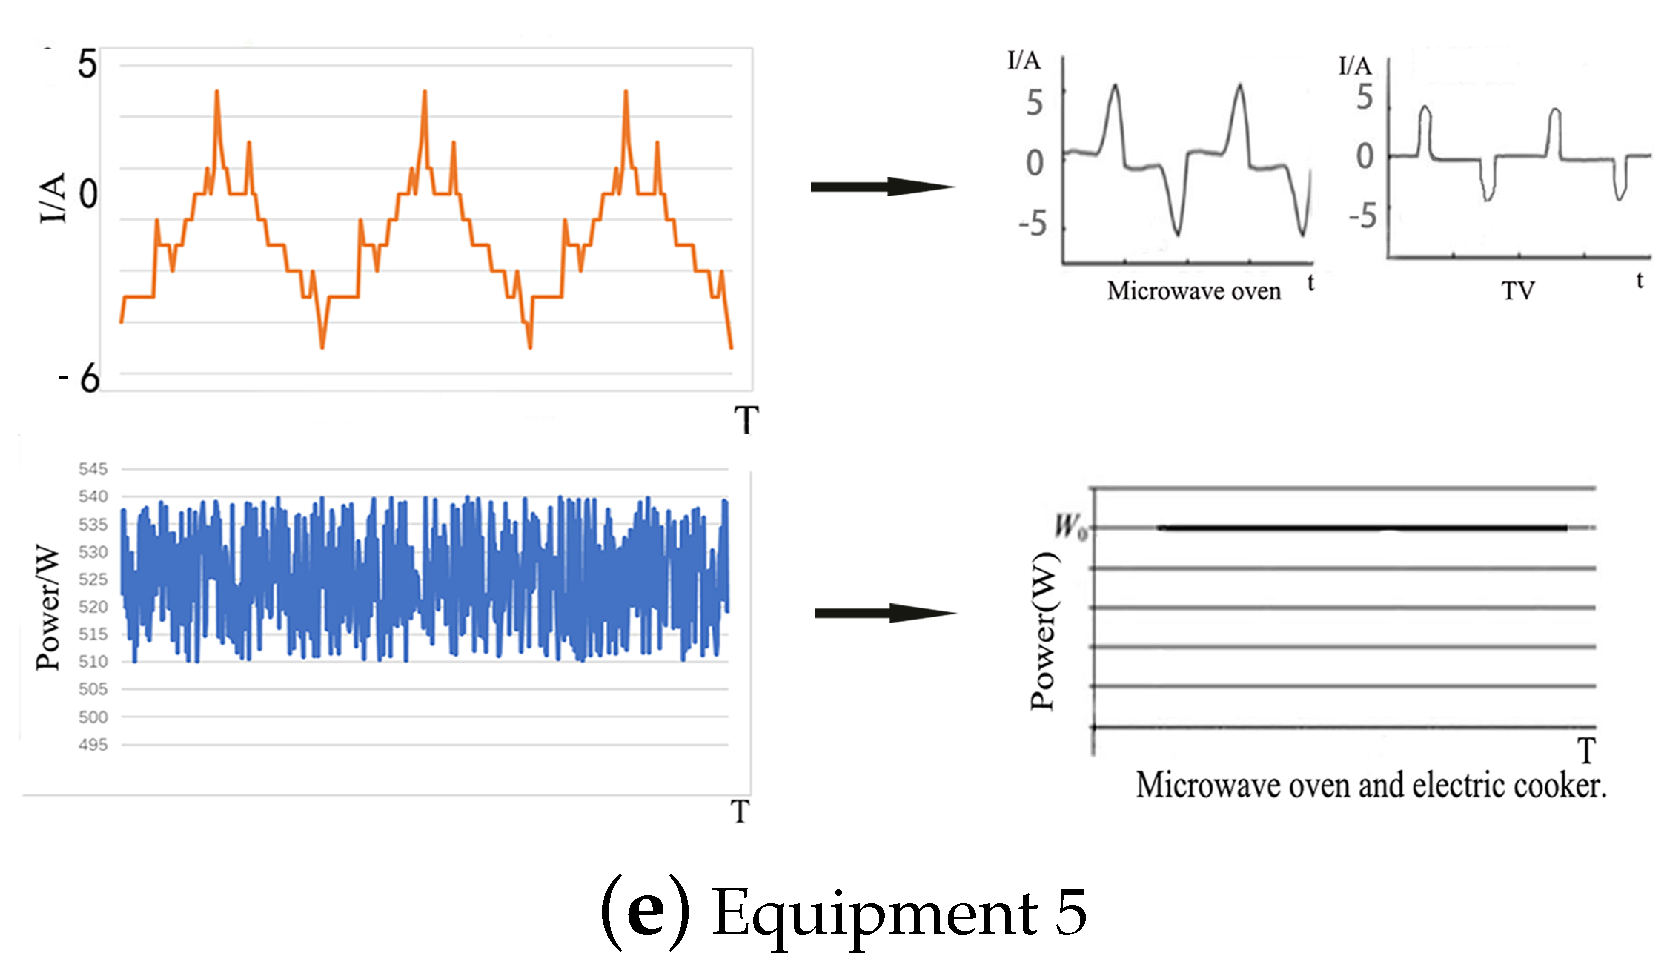
Electrical equipment of the same type has similar internal structure, operation rules, load characteristics, and powers. These characteristics cause the current waveforms to have similar shape, and the power changes of different states present similar regularity. Hence, the current waveform and power of electrical equipment are selected as the reference standard for equipment confirmation. Figure 2 and Figure 3 show the working current waveforms and power models of typical electrical equipment, respectively.
An oscilloscope is used to measure the current waveforms of equipment with a similar type under a normal operation in a certain state. The current waveforms over two periods are abstracted, as shown in Figure 2. Figure 3 displays the power models, which are obtained from the equipment living in full cycle. Different types of equipment, such as desktop PC and TV, show similar power variations. These types of equipment present two states, namely, a fixed and nearly zero power when on standby and a high power when in use.
Harmonic characteristics can be converted from current signal in time domain to spectrum signal in frequency domain via fast Fourier transform [29]. The more abundant the harmonic content, the greater the . Therefore, the load characteristics of the electrical equipment can be roughly judged by the . Generally, the total harmonic distortion rates of R, C, and L loads have the following relationship: > > .
3. Proposed Method
The proposed method for electrical equipment identification can be divided into four stages, as shown in Figure 4. At the first stage, the historical data of electrical equipment, which include harmonics and power, are collected by the smart socket and transmitted to the BIoT platform. The second stage preprocesses data to obtain the valid data needed by the clustering algorithm. The third stage analyzes the processed data by using clustering algorithm twice and constructs the model. Finally, identification result is obtained online on the basis of the model outputs by using the newly collected real-time data at the fourth stage. The details are presented as follows:
3.1. Data Preprocessing
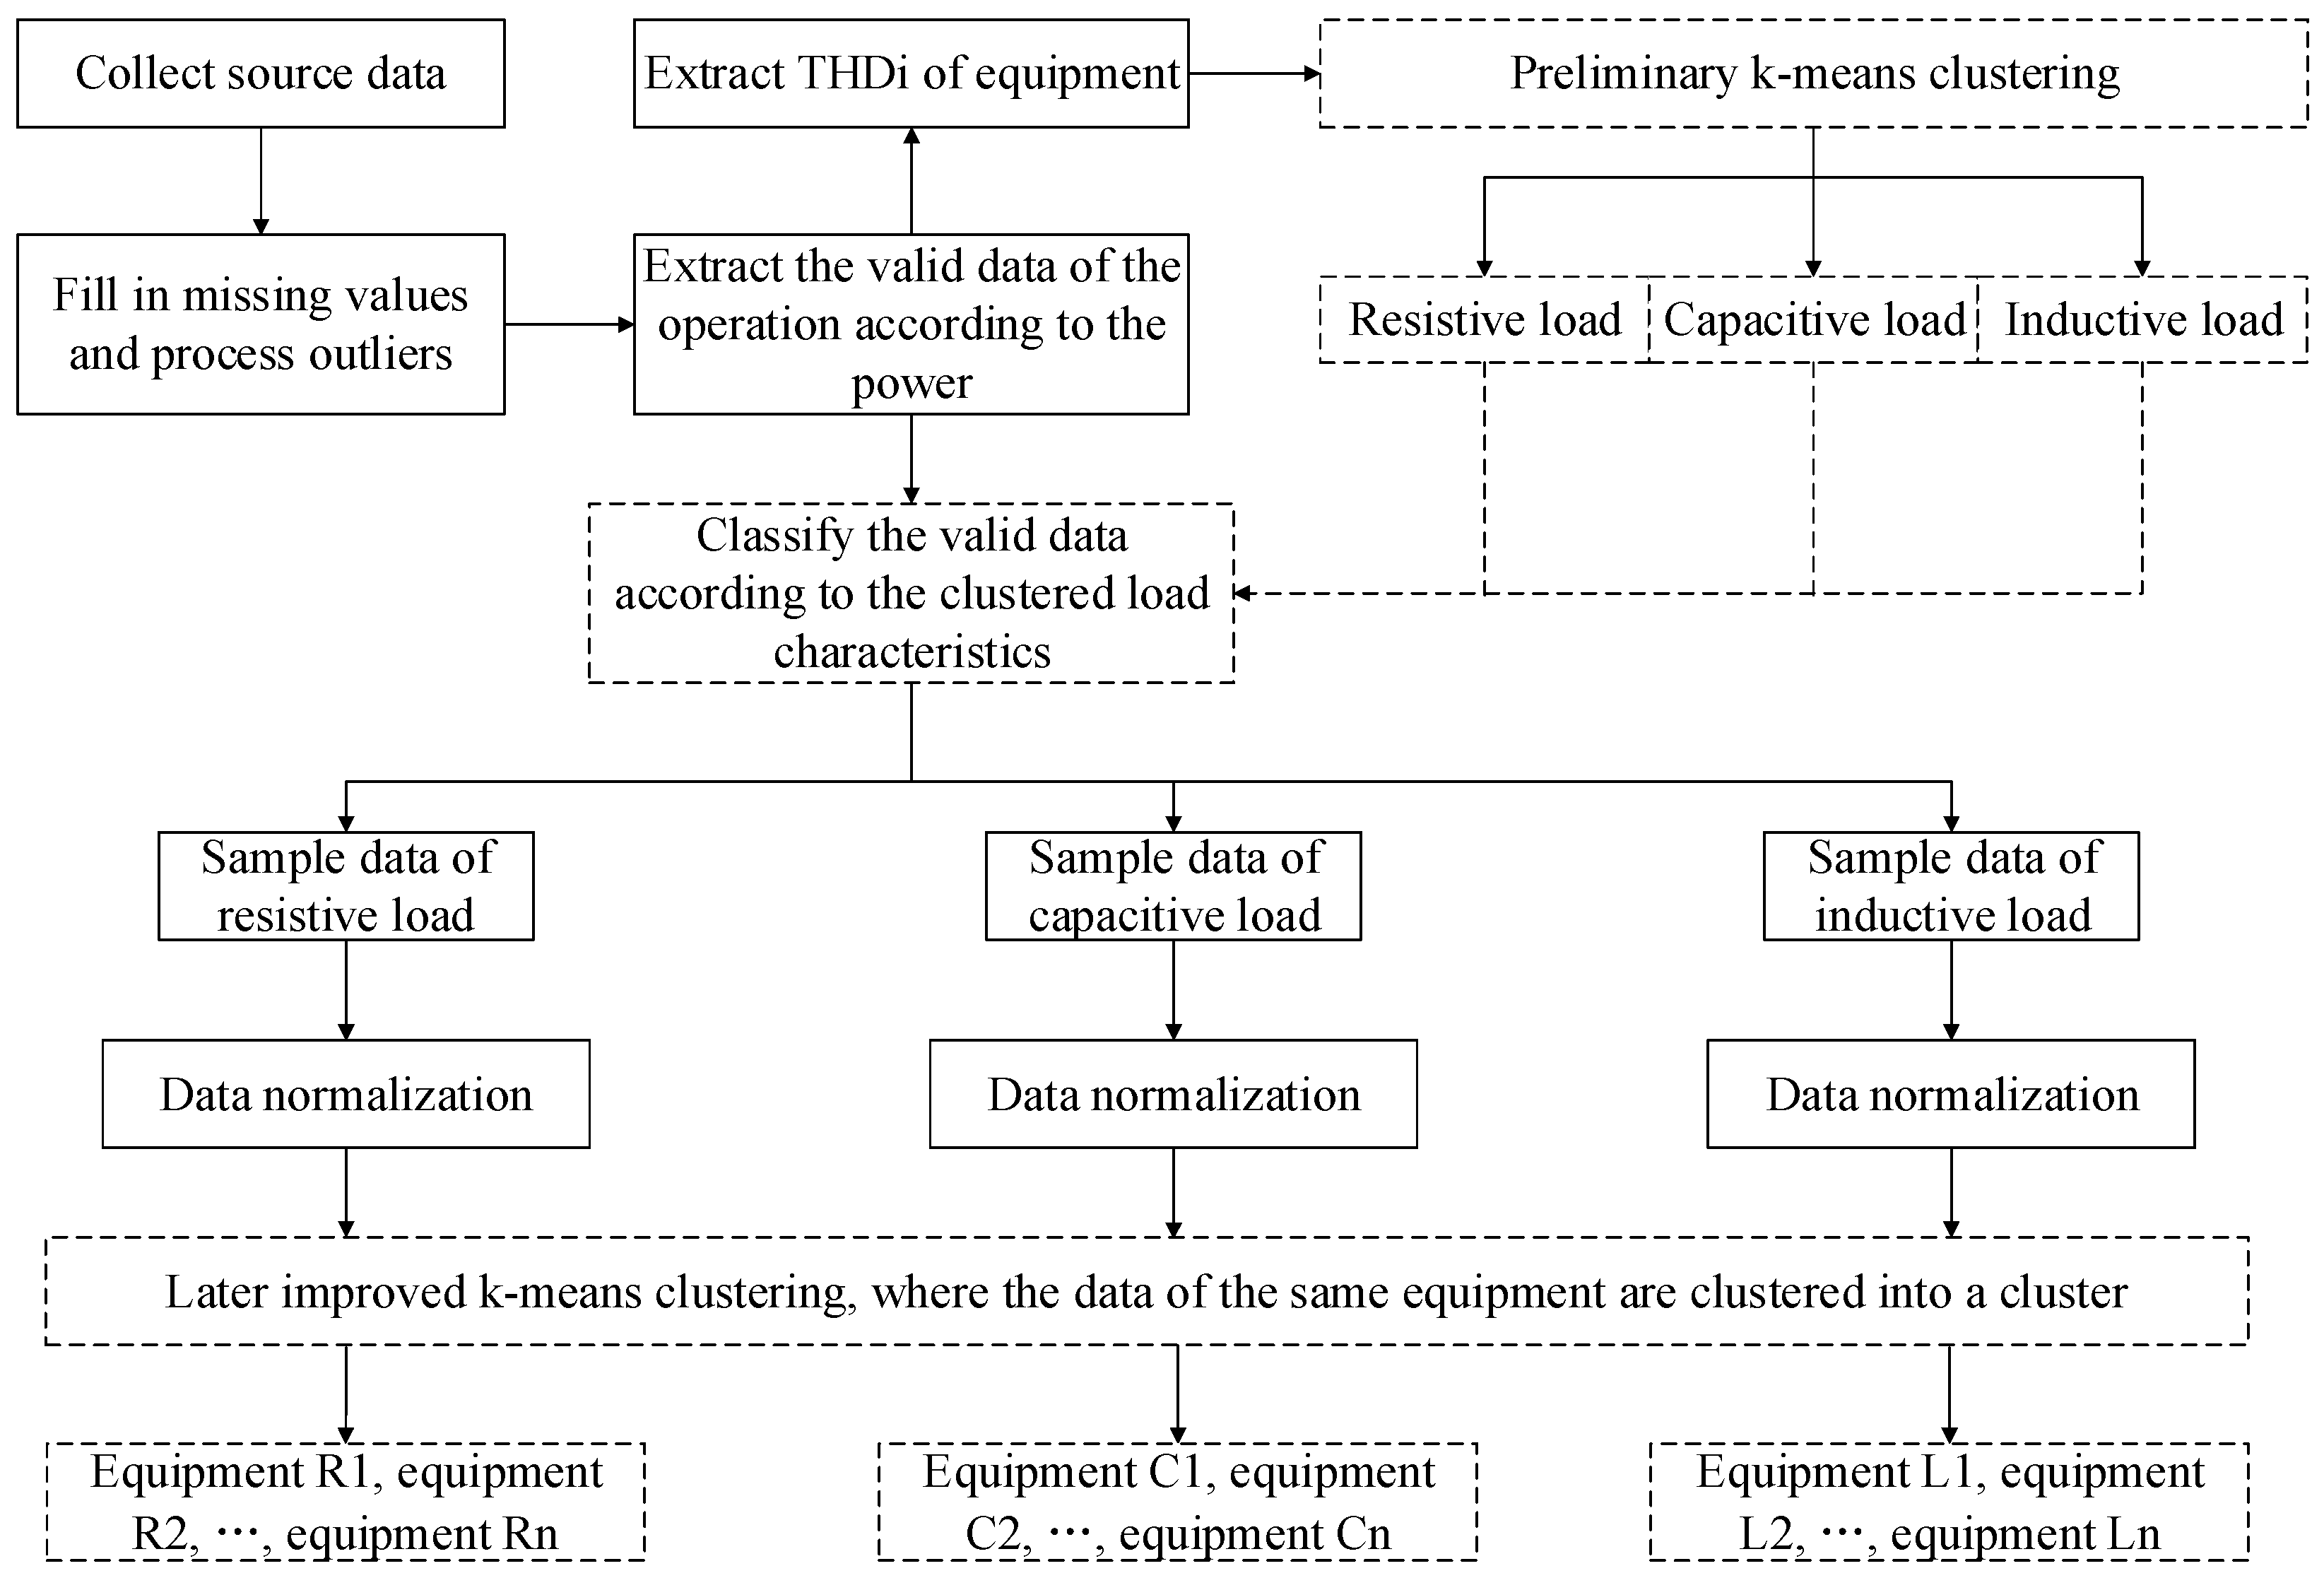
To ensure the correctness, consistency, integrity, and minimum value of the data, we fill the missing value and process outliers of the valid data [30]. Figure 5 illustrates the data preprocessing flow chart. The data preprocessing of preliminary k-means clustering and later improved k-means clustering includes two sections. First, is extracted for preliminary k-means clustering and separates equipment data into two to three clusters on the basis of their electrical characteristics. Second, the subsets of the preliminary clustering results are normalized and used to later improved k-means clustering.
3.1.1. Extraction
The of a signal is a measurement of the harmonic distortion present and defined as the ratio of the sum of the powers of all harmonic components to the power of the fundamental frequency [31], which is expressed as follows:
The of current is extracted as a feature. The sample data are 32D. After extracting the feature, the sample data become 1D.
3.1.2. Data Normalization
For a dataset with M records, a M×32 matrix N can be constructed as follows:
To make the harmonics of different load characteristics comparable, we conduct the normalization process that transforms the element of the matrix N to the range of (0,1] [32], as shown in Equations (3)–(5), where is a positive real number close to 0 and avoids the occurrence of data with 0.
The normalized matrix is expressed as follows:
Normalization is performed on the later clustering basis instead of the entire method.
3.2. Construction of Equipment Identification Model
In k-means clustering, cluster centroids are initialized randomly. Data samples are assigned to the closest cluster, which is determined by the distances between the corresponding centroid and sample data. The centroid of each cluster is updated by calculating the mean value of all sample data within the respective cluster. Then, the process of partitioning data samples into the corresponding clusters is repeated on the basis of the updated cluster centroids until the specified termination criteria are met.
The identification model constructed by this method includes two cascaded clustering processes:
- (1)
- Preliminary clustering: Preliminary clustering uses the data of the equipment harmonic index and divides the equipment valid data on the basis of the clustering results. The electrical characteristics of equipment cannot be fully reflected from the harmonics. The divided sample data are clustered by later k-means, and an improved similarity measurement method is proposed.
- (2)
- Later clustering: The sample data of equipment with the same type are divided by improved k-means clustering. By comparing the source data with the current waveforms and power models of the above mentioned common electrical equipment, the equipment type labels at the centroid are marked, and the clustering results are evaluated to complete the establishment of the equipment identification model.
3.2.1. Preliminary Clustering
The harmonic indices of the equipment are extracted after selecting valid data from source data. K-means clustering can accurately cluster these source data because of their small dimension and evident characteristics. On the basis of the load characteristics of the equipment, the number of clustering categories K is set to no more than 3, and the centroid can be obtained. On the basis of the centroid, the valid data are divided into K subsets, namely, .
3.2.2. Later Clustering
K-means clustering algorithm selects the centroid. This algorithm adjusts the centroid location on the basis of the similarity measure distance (Euclidean distance) between the centroid and sample data and iteratively selects the centroid. The obtained clustering centroid is the standard value of an equipment type [33].On the basis of the centroid, subset is divided into K′ cluster, namely, .
● Improvement of similarity measurement method
Euclidean distance is the most commonly used similarity measurement method [34] in k-means algorithm. However, the method only calculates the absolute distance among sample data [35]. To enhance the accuracy of this model, we introduce a weight parameter by finding the maximum and minimum power from the sample data that fall in each cluster obtained from the preliminary clustering process and centroid that is obtained from the last iteration. can be described as follows:
where is the power of cluster sample data and is the power of the sample data of subset that is obtained from the preliminary clustering process.
Similarity measurement can be written as follows:
where is the harmonic of 32D sample data, which is from the subset that is obtained from preliminary clustering.
● Determination of value via elbow method
In contrast to the 1D sample data set of the preliminary clustering, which are obvious differences in load characteristics, the sample data of the later clustering has more dimensions and the data features are more complex. Therefore, the value of needs to be determined before later clustering.
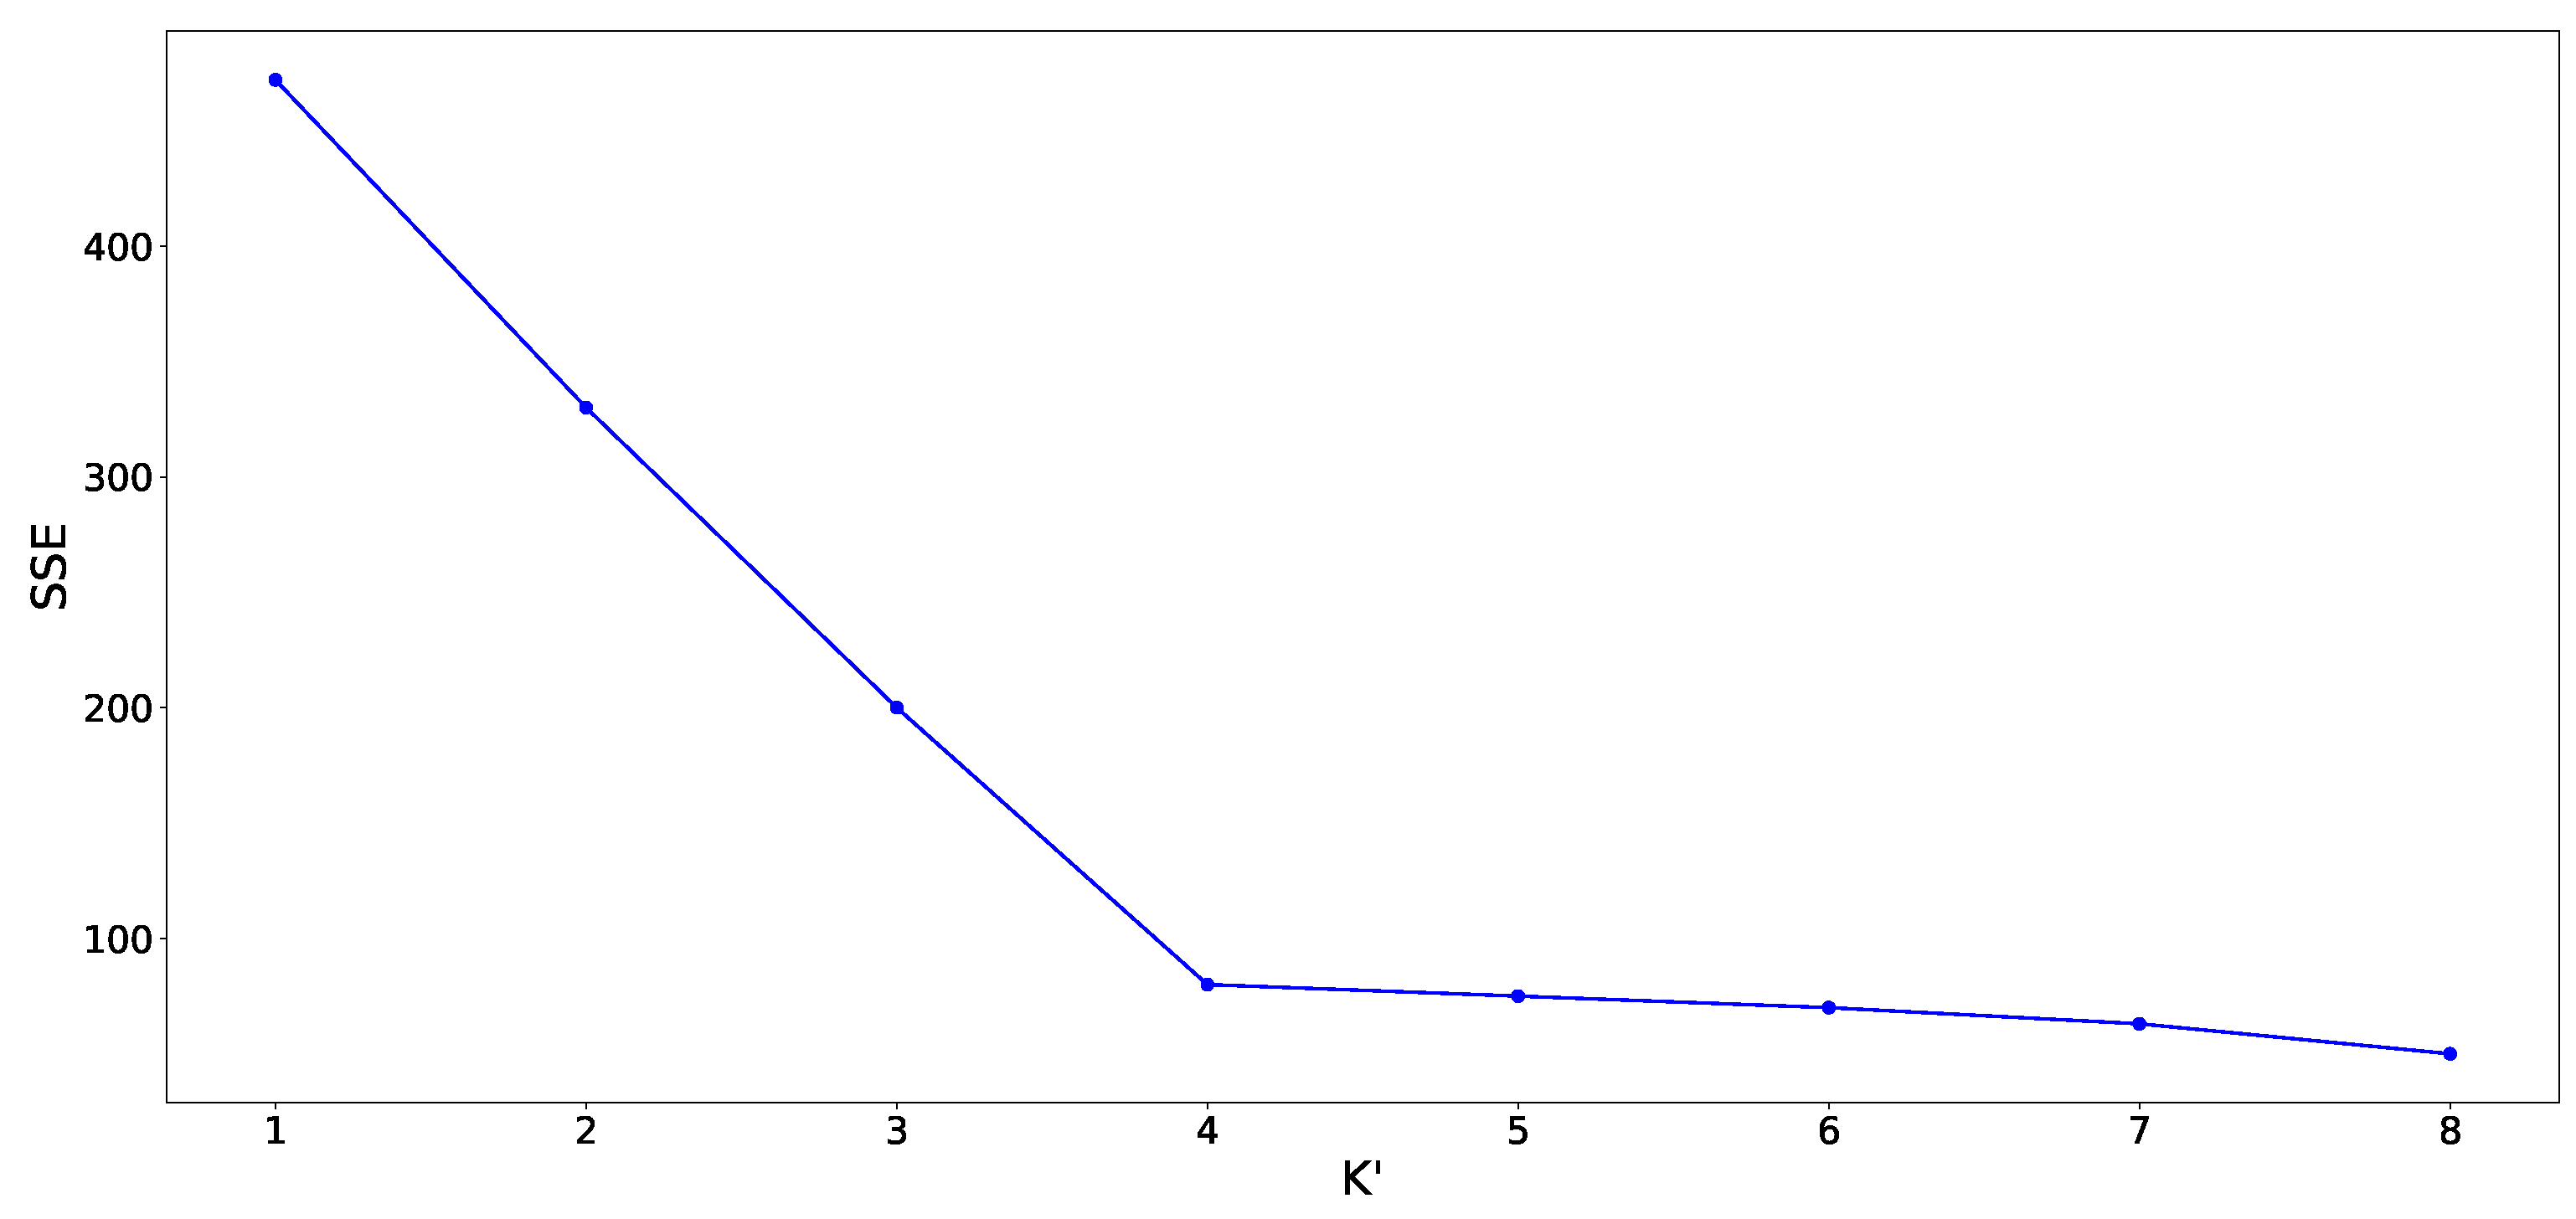
The core indicator sum of the squared errors (SSEs) of the elbow method can be expressed as follows:
where O is the sample point in and is the centroid of (mean of all samples in ).
We observe the change of SSE as the value increases. With the increase in clustering number , the sample partition is increasingly precise, and the SSE gradually decreases [36]. The value is selected when the relative change of SSE reaches the maximum.
● Label and threshold determination for final clusters
Using the improved similarity measurement method (weighted Euclidean distance) and elbow method for the k-means clustering to cluster the sample data, final clusters are obtained and the optimal centroid are selected. Combined with final clusters, the historical source data collected in BIoT platform with timestamp are used to plot the curves. These data are compared to the characteristic curves of the library-type equipment, which is extracted in Section 2.3, and the clustering centroids are labeled as the real equipment.
Then, the variance of the sample data for subset is calculated. On the basis of the Gauss theorem that the error (approximately) obeys the principle of normal distribution, 3 principle of normal distribution can cover more than 99% of the data. Considering that the distance is not negative, the distance threshold is selected, as follows:
3.3. Real-Time Equipment Identification
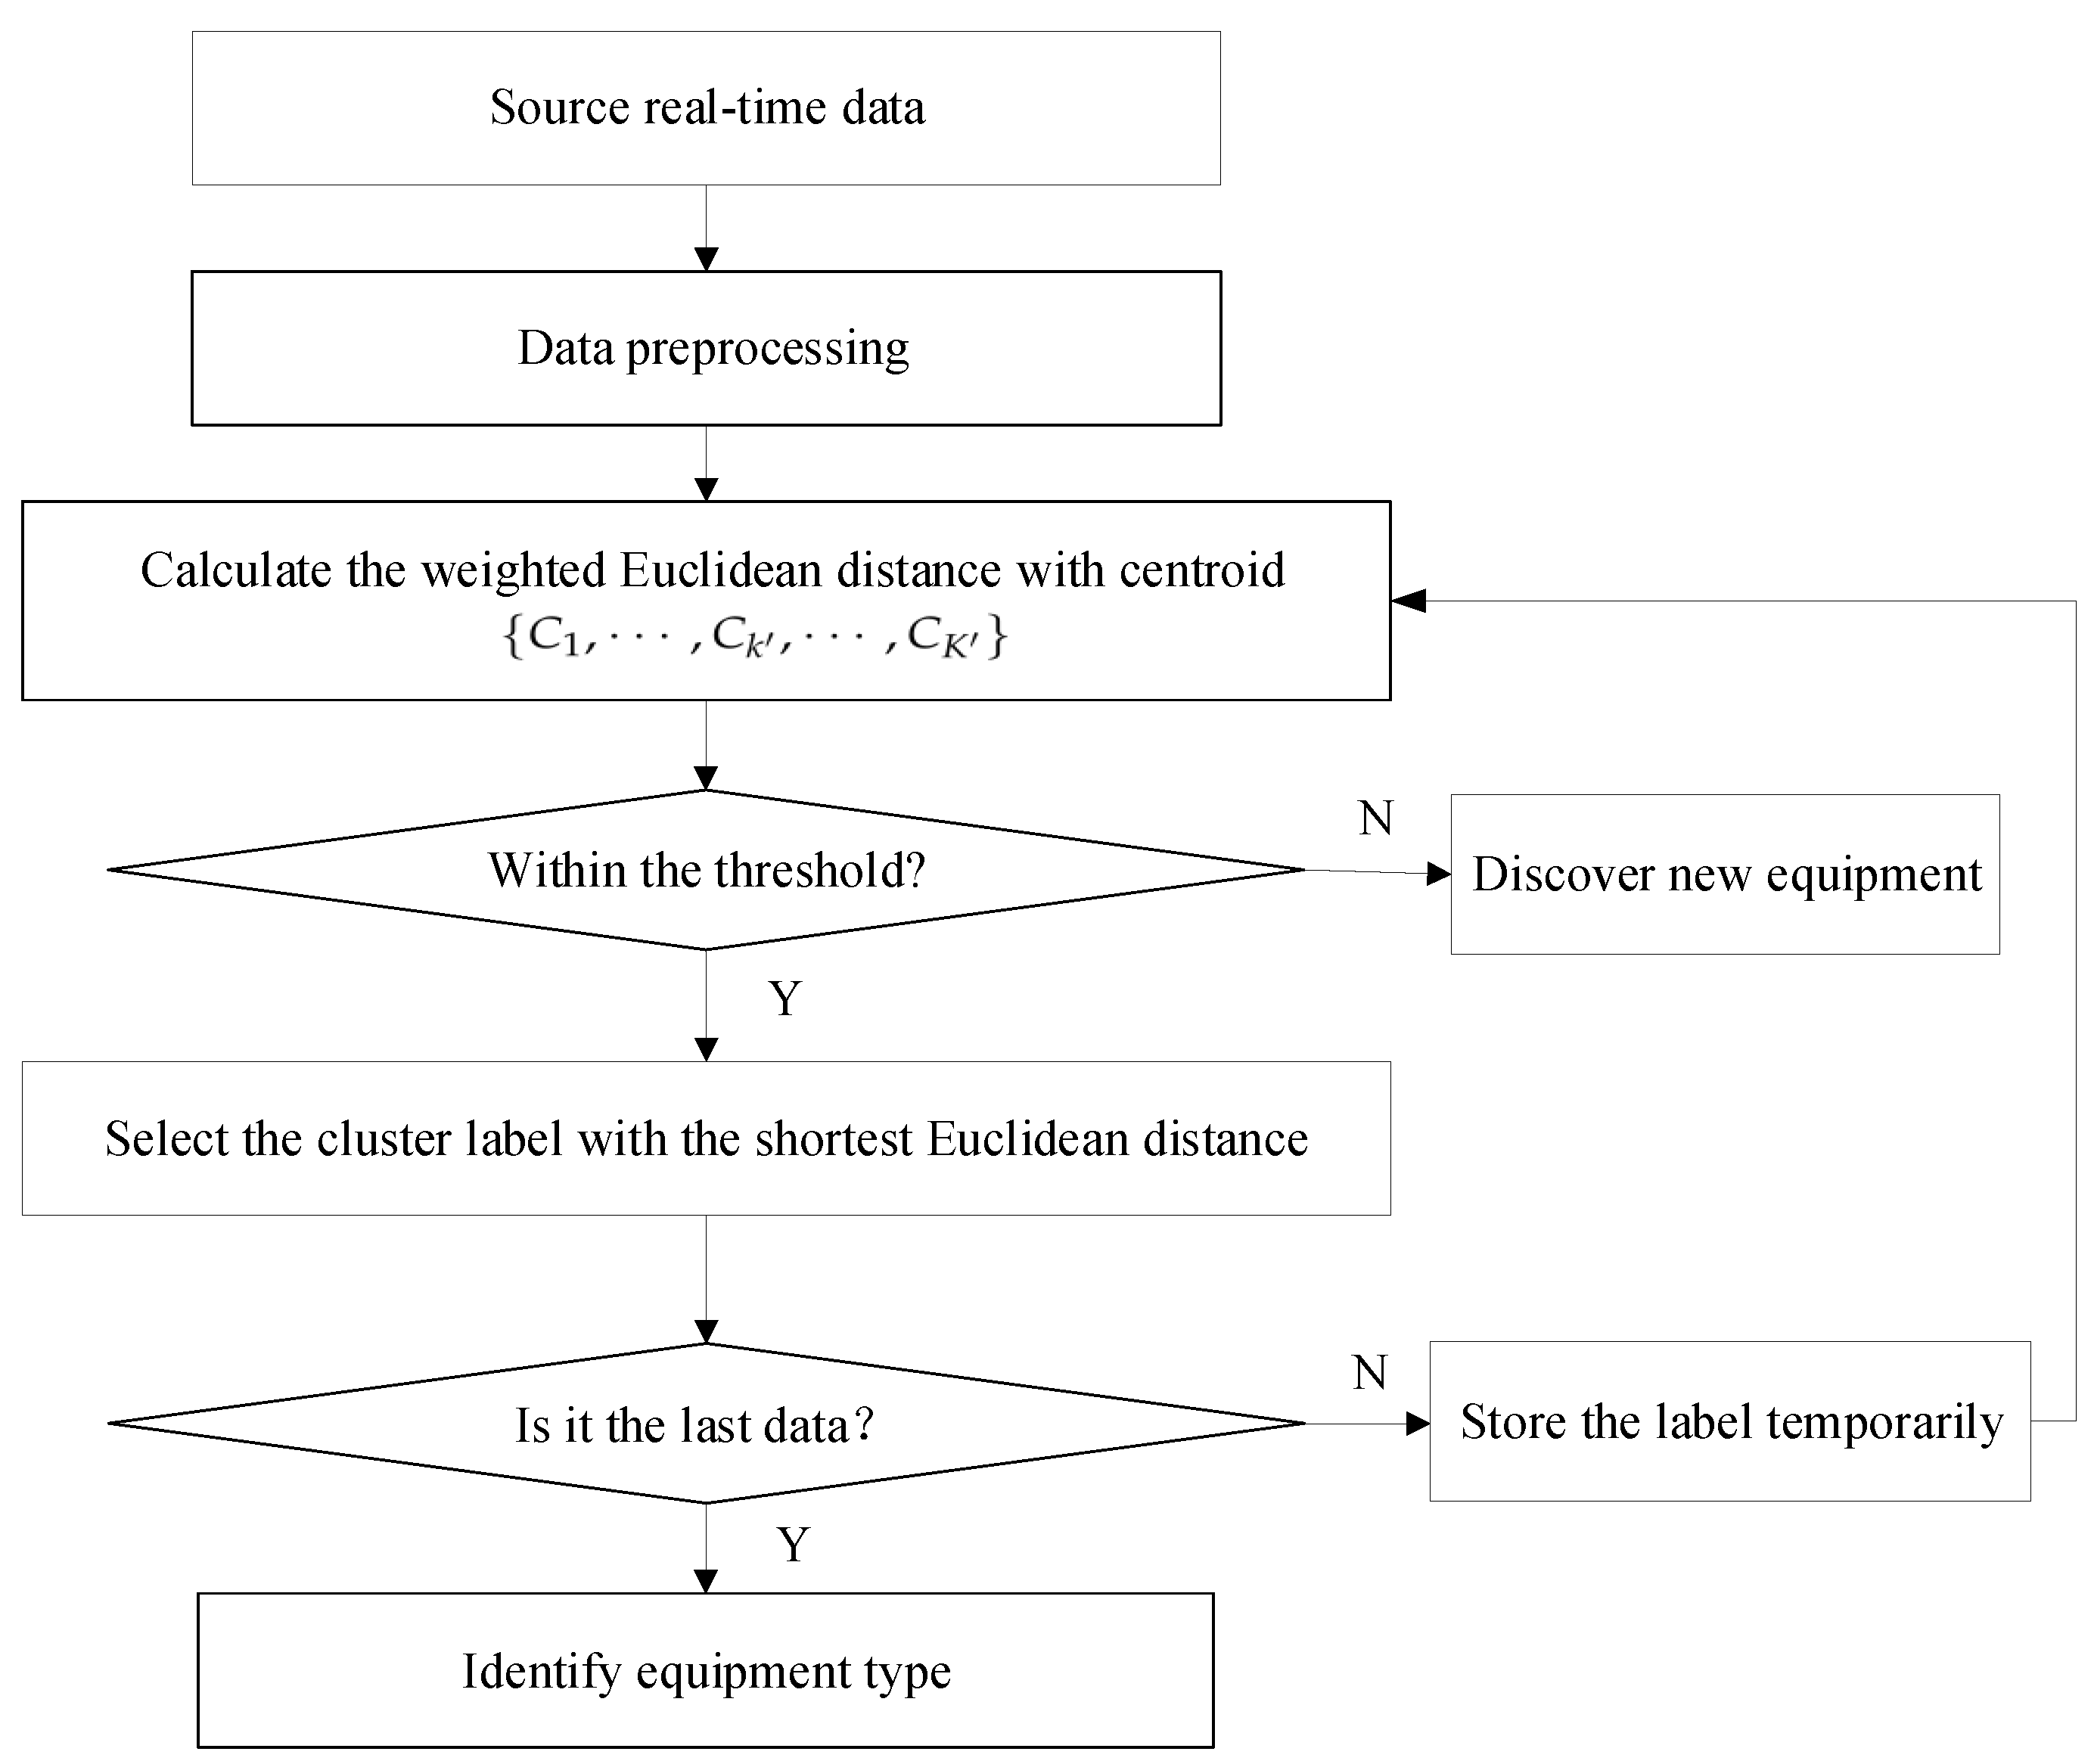
The real-time equipment identification mainly includes preprocessing data, calculating the weighted Euclidean distance with centroid, comparing to threshold, selecting the cluster label, and identifying the equipment type. Figure 6 exhibits the flow chart of the real-time identification.
The BIoT platform collects source real-time data when the equipment is running. First, the real-time data are preprocessed, as mentioned in Section 3.1, and is extracted to predict the nearest cluster of the preliminary clustering. Then, weighted Euclidean distance between preprocessed data and each centroid of the later clustering is calculated, and the cluster label is selected as the label of the specific record when the distance is the smallest one within the threshold. The process of calculating weighted Euclidean distance and labeling is executed once every record. Hence, all the real-time data collected are repeatedly used to identify the equipment. The principle of minority obeying majority [37] is adopted to determine the equipment type, and the real-time identification is completed. If no qualified value is found in the distance threshold comparison, then a new equipment may be detected, and the equipment identification model should be updated.
4. Case Studies
4.1. Description of Dataset
The dataset was generated from the BIoT platform deployed in the Laboratory Building of Shandong Jianzhu University. We selected the data of the five types of equipment (i.e., water dispenser, desktop computer, air heater, electric cooker, and microwave) in a room. Considering the operation characteristics of the experimental equipment, we set the acquisition frequency of the smart socket to once a minute, so as to avoid losing valid data and to save storage space. In addition to, when a change in the state of the equipment is detected (the difference between the rms currents of two adjacent collection is greater than 0.1 A), the changed equipment parameters will also be reported. The data are collected from 1 January 2019 to 27 January 2019, and the total number of records is 10,533. The collected electrical parameters include cycle current waves, power, and 1–32 orders of harmonic values. Several invalid sample data in the dataset because the sample data are uploaded roughly at minute intervals regardless of whether the equipment is working or in a standby state. On the basis of the powers and timestamps, 8357 data are selected as the valid sample data. Table 3 presents the quantity of data from experimental equipment, and Table 4 lists the valid sample data.
4.2. Model Training
The is calculated on the basis of the harmonics of the valid data, as follows:
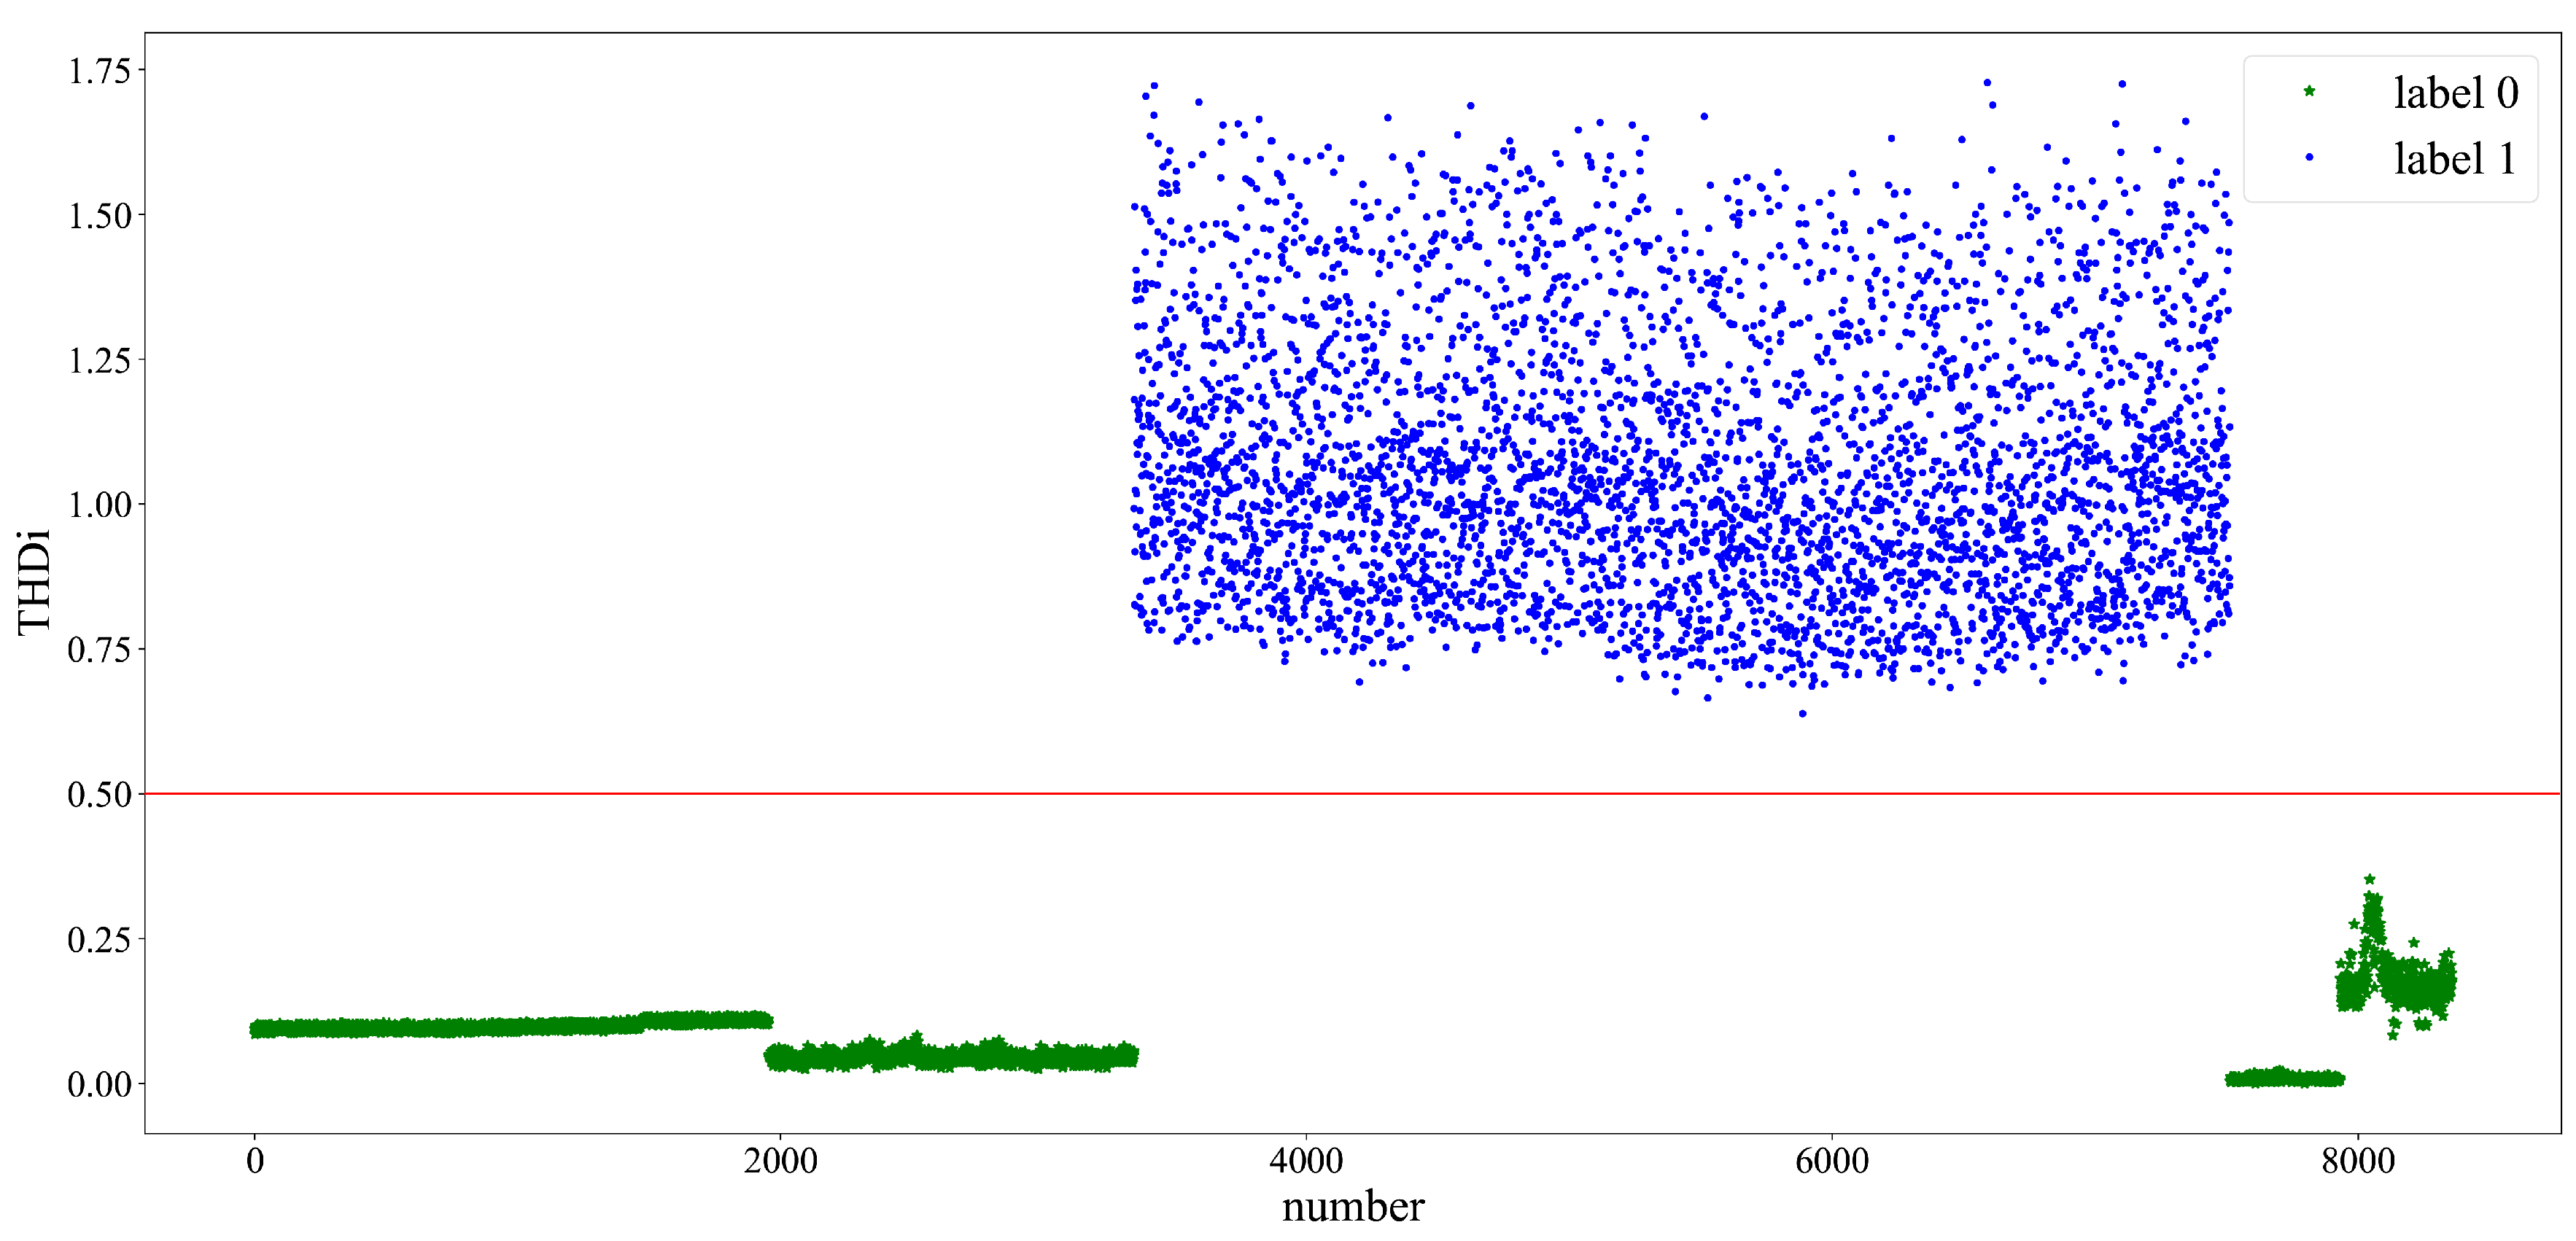
In view of the type and quantity of the actual data in this experiment, the number of cluster K for preliminary clustering is set at 2. Then, the centroid value of the clusters is and the number of the clusters data is . Figure 7 presents the scatter plot of clustering results.
Figure 7 shows that the data are divided into two clusters by k-means clustering. The dividing point of the data is 0.5, and the x-coordinate is the number shown in Table 4. The green points are labeled as 0, and the blue points are labeled as 1. The cluster centroids differ considerably, and the scatter plots show remarkable results. The cluster with label 0 contains the data of equipment 1, 2, 4, and 5; the cluster with label 1 only contains equipment 3.
Valid data sets are divided on the basis of the results of preliminary clustering, as follows:
The normalization of each sample data construct matrix is shown as follows:
When clustering the sample data of , the effects of different values on SSE are shown as follows:
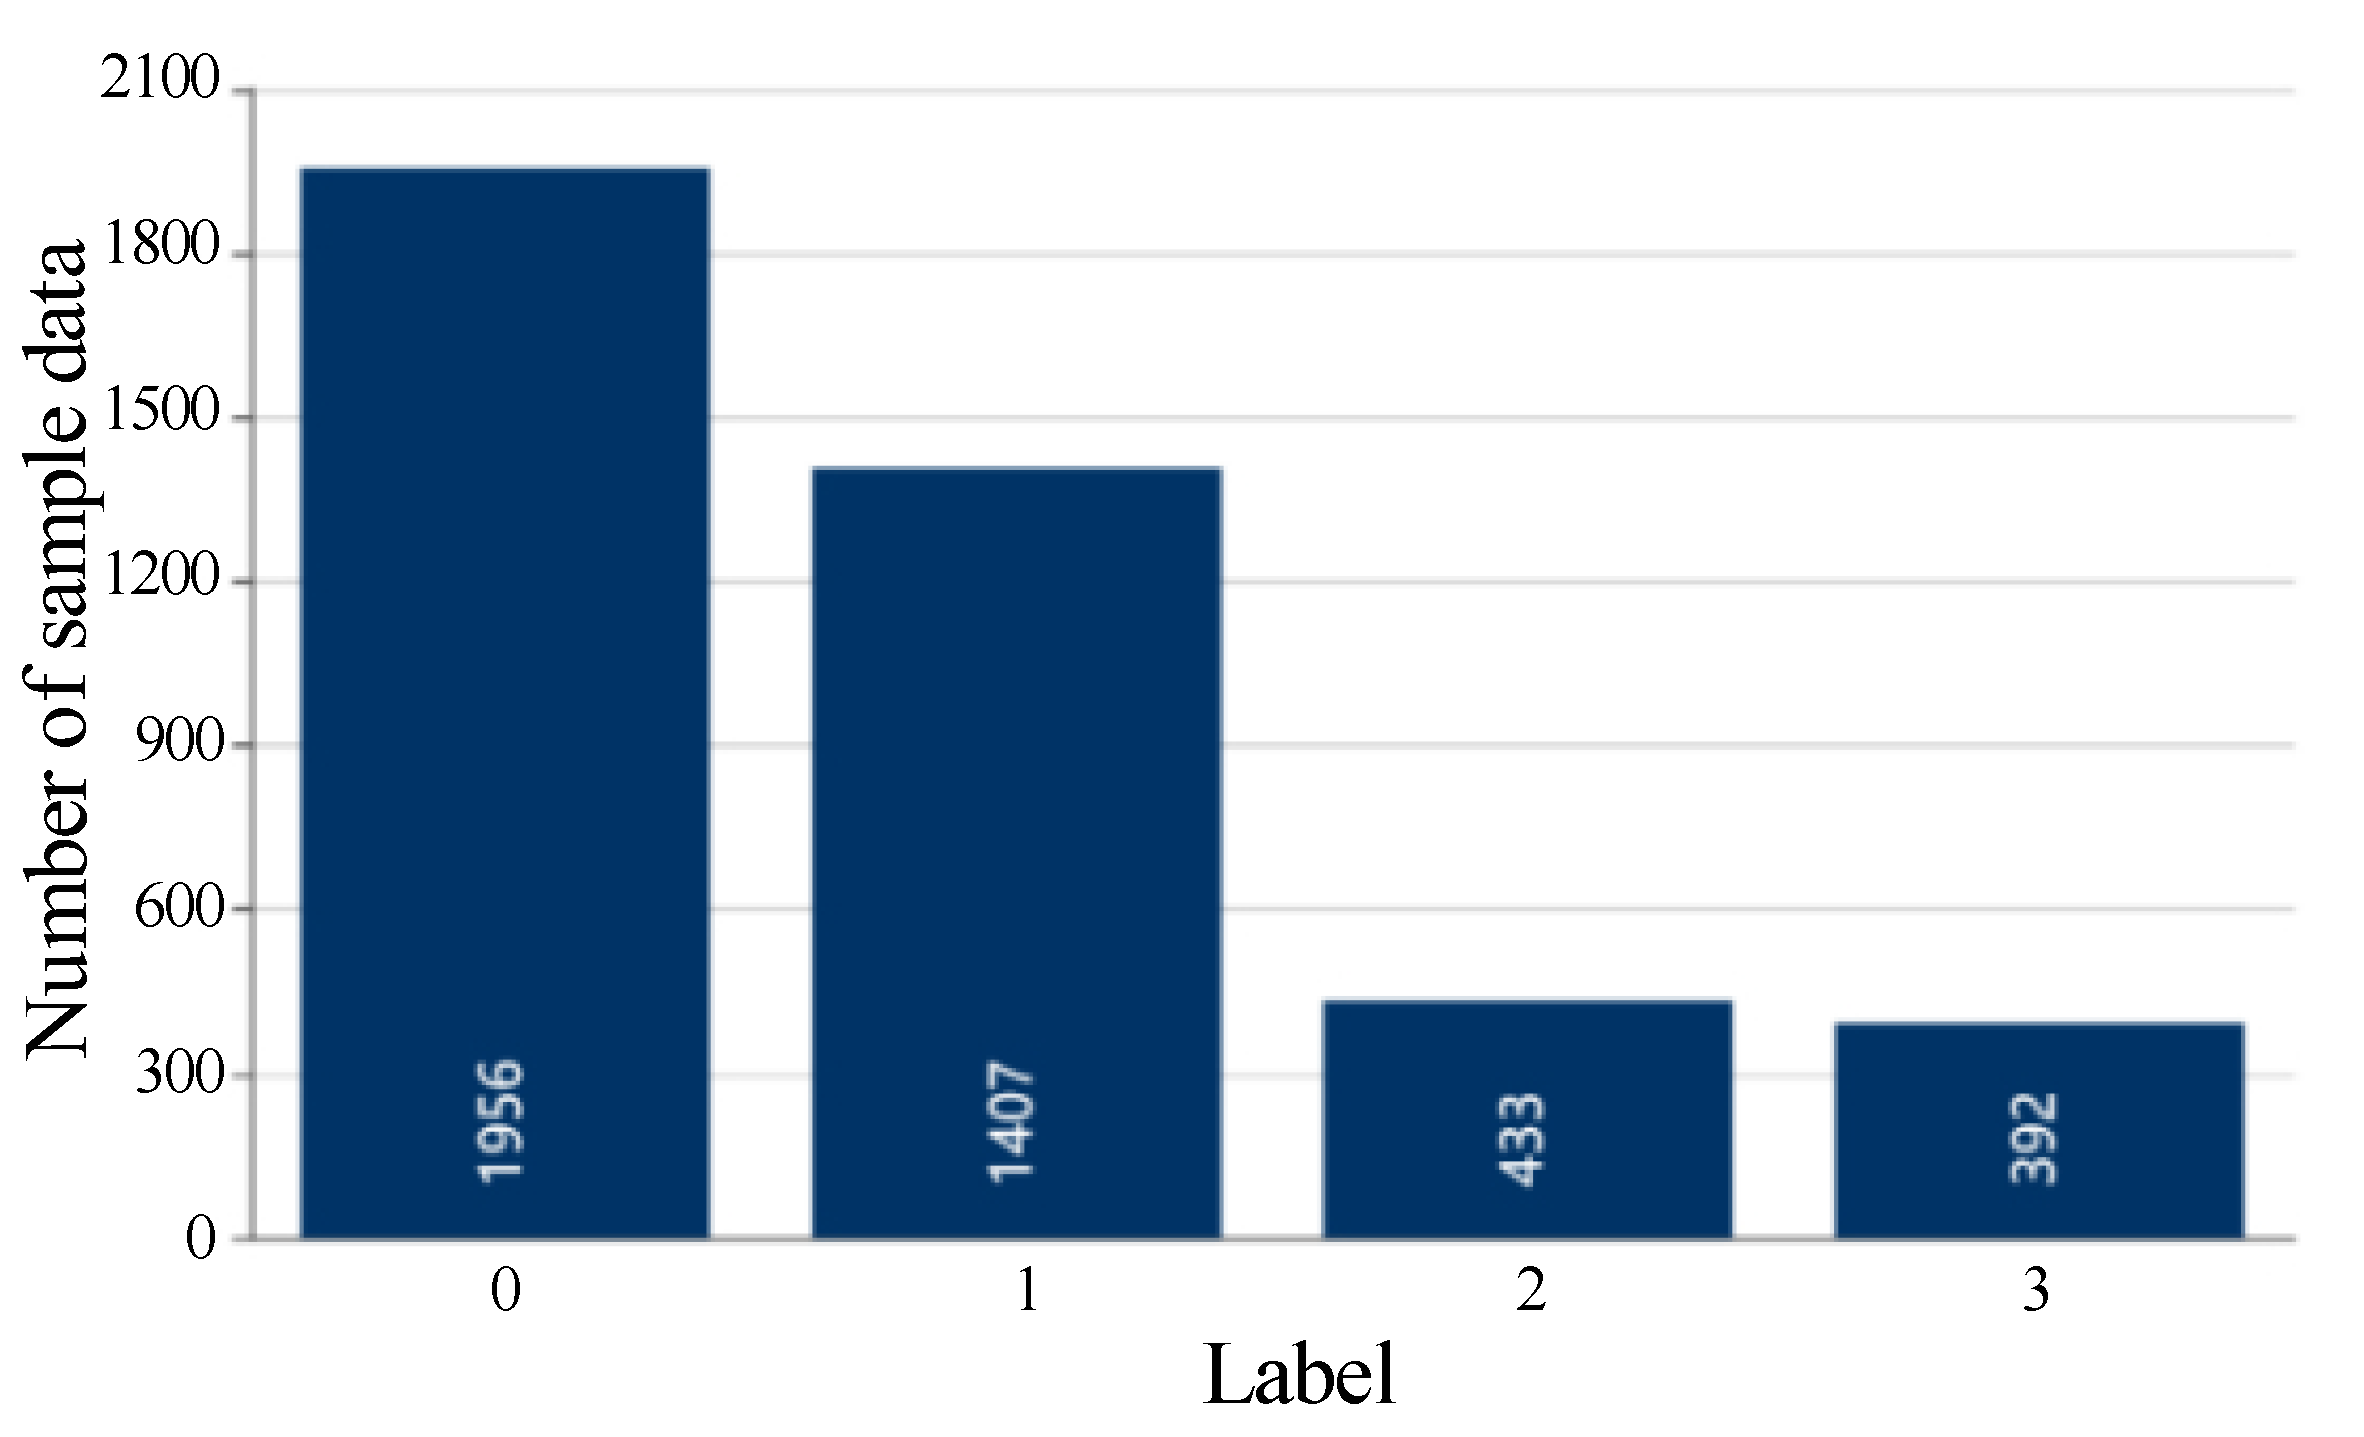
Figure 8 shows that the value corresponding to elbow is 4 (the curvature is the highest), and the optimal number of clusters for later clustering is set to 4. The value is selected for later improved k-means clustering. Data set is processed in the same way, and the value is 1. Therefore, only the sample data in are clustered for later clustering. In order to avoid the local optimization problem, we adopt the method of randomly selecting the clustering centroid during multiple clustering processes, and the maximum number of clustering processes is set to 100. Figure 9 exhibits the distribution of sample data in each cluster.
The results of the improved clustering can be obtained from this model, as shown in Table 5.
Table 6 presents the centroid vector of each cluster. The second column “Cluster centroid vector” is the centroid vector of the cluster which consists of 32D data.
Table 7 displays the clustering results of sample data by traditional k-means clustering.
For the sample set of the same clustered shown in clustering results, it may contain data from two different type of equipment which is an error clustering result. In Table 5 and Table 7, the second column represents the quantity of data for the corresponding cluster which contains the sample data sets of the collected data from equipment 1 to equipment 5. The number of the clustered sample data that belongs to each equipment type is shown in the “Equipment type (Number)” column. For example, in the second row of Table 5, “2 (1398), 5 (9)” means in the sample data with label 1, 1398 sample data belongs to equipment 2 and 9 sample data belongs to equipment 2. To evaluate the clustering results, accuracy is calculated by dividing the correct number of clustering data by the total number of data, as follows:
T is the correct number of clustering data and is the total number of sample data.
In the data comparison of Table 5 and Table 7, the accuracy of the improved clustering method is higher than that of the traditional one for the same dataset, which the threshold has a more accurate value and the clusters of the same type sample data of equipment has a more correct set. By extracting the square root and weighting the average variance of each cluster, the mean standard deviation of the improved cluster is calculated as 0.0917 and the mean standard deviation of the traditional cluster is calculated as 0.2366. From the mean standard deviation, the improved clustering effect is better than the traditional.
4.3. Identification Results
In comparison with the current waveform and power curve of typical electrical equipment, the results show high similarity. We compare several aspects, such as the peak current in the operation cycle, the shape of the current waveform, and the shape of the power in the operation for a long time. For example, as shown in Figure 10a, the current waveform shape is similar to the waveform of the air heater, water dispenser, and electric cooker, and the final choice is the air heater because of the maximum value. The power curve of (a) shows a fluctuation value of approximately 1650, and its middle right part is slightly higher than 1650. In the power models of typical electrical equipment, the power models of desktop PC, TV, and air header conform to the characteristics. The current waveform and power curve of air heater are similar to equipment 1. Therefore, equipment 1 is identified as air heater. Table 7 shows the identification results.
The data from the water dispenser connected to the platform at 8:03 a.m. on 22 March 2019, and 23 real-time data were collected at 8:03–8:22 a.m. for equipment identification. Table 8 presents the quantity of 23 source real-time data, which include the harmonics and power collected by the BIoT system.
is extracted from source real-time data; it is close to and clusters to data set . Prediction data are obtained by 32D harmonics data preprocessing of source real-time data. The average weighted Euclidean distance is calculated between the full predicted data and the centroids of the equipment identification model after data preprocessing, which is weighed by the power of real-time data. The results shown in Table 9 can be obtained by calculating the average weighted Euclidean distance.
As shown in Table 10, the minimum distance is the centroid corresponding to label 1, and the distance is within the distance threshold of label 1 (). Therefore, this equipment can be identified as water dispenser in the range of the allowable error.
5. Conclusions
A k-means clustering-based method for electrical equipment identification toward smart building applications was proposed. First, we built a BIoT platform to collect electrical parameters of certain typical equipment. Second, k-means clustering was used twice to establish the equipment identification model. Third, the identification result was obtained online on the basis of the model outputs by using the real-time collected data. Finally, a case study showed that this method can effectively identify the typical equipment in building application with high accuracy. This method is suitable for the real-time identification of typical electrical equipment with different harmonic characteristics. The constructed model can be continuously refined in an incremental manner to enable real-time identification of several types of equipment.
Limited by the electrical parameter acquisition and calculation capabilities of the measurement terminal, we only use a few types of characteristic parameters, such as and harmonics, for equipment identification. Many other electrical parameters, such as V-I trajectory and high-frequency EMI, can be used to identify equipment. Future work will focus on the comprehensive use of other feature types to improve the accuracy of equipment identification and extend the range of equipment types that can be identified.
Author Contributions
Conceptualization, G.Z. and X.D.; funding acquisition, G.Z.; methodology, Y.L. and X.D.; project administration, G.Z.; writing–original draft, Y.L.; writing–review and editing, X.D. and Y.L. All authors have read and agreed to the published version of the manuscript.
Funding
This work was financially supported by the National Natural Science Foundation of China (Grant Nos. 61573225 and 619032226) and the Key Research and Development Program of Shandong Province (Grant No. 2019GGX101072).
Conflicts of Interest
The authors declare no conflict of interest.
References
- Deng, X.; Peng, J.; Peng, X.; Mi, C. An intelligent outlier detection method with one class support tucker machine and genetic algorithm towards big sensor data in internet of things. IEEE Trans. Ind. Electron. 2018, 66, 4672–4683. [Google Scholar] [CrossRef]
- Villari, M.; Celesti, A.; Fazio, M.; Puliafito, A. A secure self-identification mechanism for enabling iot devices to join cloud computing. In Internet of Things. IoT Infrastructures; Springer: Cham, Switzerland, 2015; pp. 306–311. [Google Scholar]
- Zhiying, F.; Wenhu, T.; Qinghua, W. Users’consumption behavior clustering method considering longitudinal randomness of load. Electr. Power Autom. Equip. 2018, 38, 39–44. [Google Scholar]
- Bauerle, F.; Miller, G.; Nassar, N.; Nassar, T.; Penney, I. Context sensitive smart device command recognition and negotiation. In Internet of Things. User-Centric IoT; Springer: Cham, Switzerland, 2015; Volume 150, pp. 314–330. [Google Scholar]
- Jia, M.; Komeily, A.; Wang, Y.; Srinivasan, R.S. Adopting internet of things for the development of smart buildings: A review of enabling technologies and applications. Autom. Constr. 2019, 101, 111–126. [Google Scholar] [CrossRef]
- Tu, Y.; Zhang, Z.; Li, Y.; Wang, C.; Xiao, Y. Research on the internet of things device recognition based on rf-fingerprinting. IEEE Access 2019, 7, 37426–37431. [Google Scholar] [CrossRef]
- Rashid, K.M.; Louis, J. Times-series data augmentation and deep learning for construction equipment activity recognition. Adv. Eng. Inform. 2019, 42, 100944. [Google Scholar] [CrossRef]
- Huang, Y.; Zhan, J.; Luo, C.; Wang, L.; Wang, N.; Zheng, D.; Fan, F.; Ren, R. An electricity consumption model for synthesizing scalable electricity load curves. Energy 2019, 169, 674–683. [Google Scholar] [CrossRef]
- Arif, A.; Wang, Z.; Wang, J.; Mather, B.; Bashualdo, H.; Zhao, D. Load modeling—A review. IEEE Trans. Smart Grid 2018, 9, 5986–5999. [Google Scholar] [CrossRef]
- Rashid, H.; Singh, P.; Stankovic, V.; Stankovic, L. Can non-intrusive load monitoring be used for identifying an appliance’s anomalous behaviour? Appl. Energy 2019, 238, 796–805. [Google Scholar] [CrossRef] [Green Version]
- Mohd Rosdi, N.A.; Nordin, F.H.; Ramasamy, A.K. Identification of electrical appliances using non-intrusive magnetic field and probabilistic neural network (PNN). In Proceedings of the 2014 IEEE International Conference on Power and Energy (PECon), Kuching, Malaysia, 1–3 December 2014; pp. 47–52. [Google Scholar]
- Hou, R.; Pan, M.; Zhao, Y.; Yang, Y. Image anomaly detection for iot equipment based on deep learning. J. Vis. Commun. Image Represent. 2019, 64, 102599. [Google Scholar] [CrossRef]
- Chicco, G.; Ilie, I.-S. Support vector clustering of electrical load pattern data. Power Syst. IEEE Trans. 2009, 24, 1619–1628. [Google Scholar] [CrossRef]
- Chen, G.; Chen, J.; Zi, Y.; Pan, J.; Han, W. An unsupervised feature extraction method for nonlinear deterioration process of complex equipment under multi dimensional no-label signals. Sens. Actuators A Phys. 2018, 269, 464–473. [Google Scholar] [CrossRef]
- Liu, J.; Zhang, L.; Chen, X.; Niu, J. Facial landmark automatic identification from three dimensional (3D) data by using hidden markov model (HMM). Int. J. Ind. Ergon. 2017, 57, 10–22. [Google Scholar] [CrossRef]
- Mets, K.; Depuydt, F.; Develder, C. Two-stage load pattern clustering using fast wavelet transformation. IEEE Trans. Smart Grid 2016, 7, 2250–2259. [Google Scholar] [CrossRef]
- Ran, L.; Li, F.; Smith, N.D. Multi-resolution load profile clustering for smart metering data. IEEE Trans. Power Syst. 2016, 31, 4473–4482. [Google Scholar]
- Quek, Y.; Woo, W.; Logenthiran, T. DC equipment identification using k-means clustering and KNN classification techniques. In Proceedings of the IEEE Region 10 Annual International Conference (TENCON), Singapore, 22–25 November 2016; pp. 777–780. [Google Scholar]
- Chen, G.; Liu, Y.; Ge, Z. K-means bayes algorithm for imbalanced fault classification and big data application. J. Process Control 2019, 81, 54–64. [Google Scholar] [CrossRef]
- Dinesh, C.; Nettasinghe, B.W.; Godaliyadda, R.I.; Ekanayake, M.P.B.; Ekanayakem, J.; Wijayakulasooriya, J.V. Residential appliance identification based on spectral information of low frequency smart meter measurements. IEEE Trans. Smart Grid. 2016, 7, 2781–2792. [Google Scholar] [CrossRef]
- Ghosh, S.; Chatterjee, A.; Chatterjee, D. Improved non-intrusive identification technique of electrical appliances for a smart residential system. IET Gener. Transm. Distrib. 2019, 13, 695–702. [Google Scholar] [CrossRef]
- Jagtap, H.P.; Bewoor, A.K. Development of an algorithm for identification and confirmation of fault in thermal power plant equipment using condition monitoring technique. Procedia Eng. 2017, 181, 690–697. [Google Scholar] [CrossRef]
- Yuan, Y.; Peng, L. Wireless Device Identification Based on Improved Convolutional Neural Network Model. In Proceedings of the 2018 IEEE 18th International Conference on Communication Technology (ICCT), Chongqing, China, 8–11 October 2018; pp. 683–687. [Google Scholar]
- Peng, W.; Li, C.; Zhang, G.; Yi, J. Interval type-2 fuzzy logic based transmission power allocation strategy for lifetime maximization of wsns. Eng. Appl. Artif. Intell. 2020, 87, 103269. [Google Scholar] [CrossRef]
- Wang, Y.; Luo, D.; Xiao, X.; Li, Y.; Xu, F. Review and development tendency of research on 2∼150 khz supraharmonics. Power Syst. Technol. 2018, 42, 353–365. [Google Scholar]
- Zhou, M.; You, X.; Wang, C.; Li, Q. Harmonic analysis of selected harmonic elimination pulse width modulation. Trans. China Electrotech. Soc. 2013, 28, 11–20. [Google Scholar]
- Yazdani-Asrami, M.; Gholamian, S.A.; Mirimani, S.M.; Adabi, J. Experimental investigation for power loss measurement of superconducting coils under harmonic supply current. Measurement 2019, 132, 324–329. [Google Scholar] [CrossRef]
- Liu, Q.; Kamoto, K.M.; Liu, X.; Sun, M.; Linge, N. Low-complexity non-intrusive load monitoring using unsupervised learning and generalized appliance models. IEEE Trans. Consum. Electron. 2019, 65, 28–37. [Google Scholar] [CrossRef]
- Lin, S.; Zhao, L.; Liu, Q.; Li, D.; Fu, Y. A nonintrusive load identification method based on quadratic 0-1 programming. Power Syst. Prot. Control 2016, 44, 85–91. [Google Scholar]
- Yang, L.; Ban, X.; Chen, Z.; Guo, H. A new data preprocessing technique based on feature extraction and clustering for complex discrete temperature data. Procedia Comput. Sci. 2018, 129, 78–80. [Google Scholar] [CrossRef]
- Meng, F.; Xu, X.; Gao, L.; Man, Z.; Cai, X. Dual passive harmonic reduction at dc link of the double-star uncontrolled rectifier. IEEE Trans. Ind. Electron. 2019, 66, 3303–3309. [Google Scholar] [CrossRef]
- Jain, S.; Shukla, S.; Wadhvani, R. Dynamic selection of normalization techniques using data complexity measures. Expert Syst. Appl. 2018, 106, 252–262. [Google Scholar] [CrossRef]
- Qi, J.; Yu, Y.; Wang, L.; Liu, J.; Wang, Y. An effective and efficient hierarchical k-means clustering algorithm. Int. J. Distrib. Sens. Netw. 2017, 13. [Google Scholar] [CrossRef] [Green Version]
- Li, B.; Fan, Z.-T.; Zhang, X.-L. Robust dimensionality reduction via feature space to feature space distance metric learning. Neural Netw. 2019, 112, 1–14. [Google Scholar] [CrossRef]
- Bu, F.; Chen, J.; Zhang, Q.; Tian, S.; Ding, J.; Zhu, B. A controllable refined recognition method of electrical load pattern based on bilayer iterative clustering analysis. Dianwang Jishu/Power Syst. Technol. 2018, 42, 903–910. [Google Scholar]
- Kwedlo, W. A clustering method combining differential evolution with the k-means algorithm. Pattern Recognit. Lett. 2011, 32, 1613–1621. [Google Scholar] [CrossRef]
- Liu, Z.; Xiao, S.L.; Chen, J. Household load identification method based on feature similarity. J. Chongqing Univ. Technol. Nat. Sci. 2018, 187, 174–180. [Google Scholar]
Figure 1.
Structure of the BIoT system.

Figure 2.
Working current waveforms of typical electrical equipment.

Figure 3.
Power models of typical electrical equipment.

Figure 4.
Equipment identification flow chart.

Figure 5.
Data preprocessing flow chart.

Figure 6.
Real-time identification flow chart.

Figure 7.
Scatter plot of based on clustering results.

Figure 8.
Effects of different K’ values on SSE size.

Figure 9.
Distribution of sample data in each cluster at = 4.

Figure 10.
Similarity contrast between the current or power curves and extracted curves.


Table 1.
Load characteristics of equipment.
| Load Characteristics | Harmonics | Power | Example |
|---|---|---|---|
| Resistive load | Absent | Generally larger | Water dispenser |
| Capacitive load | Larger | Not too large | Desktop computer |
| Inductive load | Large | Irregular | Air conditioner |
Table 2.
Analysis of working electrical equipment.
| Operation Status | Characteristics | Example | Work Time | |
|---|---|---|---|---|
| Self-varying multiple-state switching operation | Specific time use | It can automatically switch between multiple states in normal operation, and each state has a fixed step size and constant power. | Electric cooker | 11:00–13:00 and 17:00–19:00 |
| Uncertain time use | Each state will have an uncertain step size due to human intervention, but the power is constant. | Air conditioner and water dispenser | - - - - | |
| Long-term use | The normal operation will automatically switch the operation state, and the power and time period of each state are fixed. | Refrigerator | Whole day | |
| Man- controlled multiple-state switching operation | Specific time use | When the state changes, the power changes accordingly and is constant in a specific state. | 1. Range hood and 2. water heater | 1. 11:00–13:00 and 17:00–19:00 2. 19:00–8:00 (next day) |
| Uncertain time use | Man Controls the transition between multiple states during normal operation. | Notebook and desktop PC | - - - - | |
| Stateless switching operation | Specific time use | Only one each of the running state and fixed power are present in normal operation. | 1. LED and 2. microwave oven | 1. 18:00–23:00 2. 11:00–13:00 and 17:00–19:00 |
| Uncertain time use | Generally, only one each of operating state and fixed power are present. | TV and air heater | - - - - | |
Table 3.
Statistical of experimental equipment data.
| Equipment Name | Equipment 1 | Equipment 2 | Equipment 3 | Equipment 4 | Equipment 5 |
|---|---|---|---|---|---|
| Quantity of source data | 1955 | 3070 | 4555 | 419 | 533 |
| Quantity of valid data | 1955 | 1389 | 4169 | 419 | 425 |
Table 4.
Valid sample data.
| No. | FHG | SHG | THG | ... | Power(W) | Time |
|---|---|---|---|---|---|---|
| 1 | 5.41 | 0.03 | 0.43 | ... | 1665.1 | 2019/1/1 8:18:16 |
| 2 | 5.38 | 0.00 | 0.38 | ... | 1663.4 | 2019/1/1 8:19:44 |
| 3 | 5.36 | 0.00 | 0.39 | ... | 1667.5 | 2019/1/1 8:20:12 |
| 4 | 5.35 | 0.00 | 0.41 | ... | 1661.5 | 2019/1/1 8:21:07 |
| ⋮ | ⋮ | ⋮ | ⋮ | ⋮ | ⋮ | ⋮ |
| 8356 | 2.5 | 0.00 | 0.33 | ... | 540.3 | 2019/1/26 11:18:50 |
| 8357 | 2.54 | 0.00 | 0.35 | ... | 539.8 | 2019/1/26 11:19:45 |
| FHG is the fundamental wave. | ||||||
| SHG is the 2-order harmonics. | ||||||
| THG is the 3-order harmonics. | ||||||
| ... is the 4-order to 32-order harmonics. | ||||||
Table 5.
Results of improved cluster.
| Cluster Label | Quantity | Threshold | Centroid Power | Equipment Type (Number) | Accuracy | |
|---|---|---|---|---|---|---|
| 0 | 1956 | 0.0092 | 0.0276 | 1653.89 | 1 (1956) | 99.45% |
| 1 | 1407 | 0.0114 | 0.0341 | 293.61 | 2 (1398), 5 (9) | |
| 2 | 433 | 0.0041 | 0.0124 | 735.62 | 4 (419), 5 (14) | |
| 3 | 392 | 0.0022 | 0.0067 | 521.04 | 5 (392) |
Table 6.
The cluster centroid vector of the clustering result.
| Cluster Label | Cluster Centroid Vector | |||
|---|---|---|---|---|
| 0 | 0.9845 | 0.0851 | 0.0016 | ... |
| 1 | 0.0314 | 0.0005 | 0.0254 | ... |
| 2 | 0.1681 | 0.0003 | 0.0025 | ... |
| 3 | 0.0008 | 0.0003 | 0.0003 | ... |
Table 7.
Information of traditional cluster results.
| Cluster Label | Quantity | Threshold | Equipment Type (Number) | Accuracy | |
|---|---|---|---|---|---|
| 0 | 1962 | 0.0582 | 0.1745 | 1 (1956), 5 (6) | 96.54% |
| 1 | 1432 | 0.0484 | 0.1453 | 2 (1398), 5 (34) | |
| 2 | 505 | 0.0671 | 0.2014 | 4 (419), 5 (86) | |
| 3 | 289 | 0.0613 | 0.1838 | 5 (289) |
Table 8.
Comparative analysis of identification results.
| Equipment Sample Set | Equipment Type |
|---|---|
| Equipment 1 | Air heater |
| Equipment 2 | Water dispenser |
| Equipment 3 | Desktop computer |
| Equipment 4 | Electric cooker |
| Equipment 5 | Microwave oven |
Table 9.
Source real-time data.
| No. | FHG | SHG | THG | ... | Power (W) |
|---|---|---|---|---|---|
| 1 | 0.92 | 0.01 | 0.02 | ... | 294.2 |
| 2 | 0.91 | 0.01 | 0.00 | ... | 290.0 |
| 3 | 0.93 | 0.00 | 0.00 | ... | 292.1 |
| 4 | 0.89 | 0.00 | 0.41 | ... | 293.3 |
| ⋮ | ⋮ | ⋮ | ⋮ | ⋮ | ⋮ |
| 22 | 0.87 | 0.00 | 0.00 | ... | 293.5 |
| 23 | 0.96 | 0.00 | 0.00 | ... | 291.9 |
Table 10.
Average weighted Euclidean distance.
| Label | 0 | 1 | 2 | 3 |
|---|---|---|---|---|
| Distance | 0.8141 | 0.0089 | 0.1468 | 0.0561 |
© 2020 by the authors. Licensee MDPI, Basel, Switzerland. This article is an open access article distributed under the terms and conditions of the Creative Commons Attribution (CC BY) license (http://creativecommons.org/licenses/by/4.0/).
Share and Cite
MDPI and ACS Style
Zhang, G.; Li, Y.; Deng, X. K-Means Clustering-Based Electrical Equipment Identification for Smart Building Application. Information 2020, 11, 27. https://0-doi-org.brum.beds.ac.uk/10.3390/info11010027
AMA Style
Zhang G, Li Y, Deng X. K-Means Clustering-Based Electrical Equipment Identification for Smart Building Application. Information. 2020; 11(1):27. https://0-doi-org.brum.beds.ac.uk/10.3390/info11010027
Chicago/Turabian StyleZhang, Guiqing, Yong Li, and Xiaoping Deng. 2020. "K-Means Clustering-Based Electrical Equipment Identification for Smart Building Application" Information 11, no. 1: 27. https://0-doi-org.brum.beds.ac.uk/10.3390/info11010027
Note that from the first issue of 2016, this journal uses article numbers instead of page numbers. See further details here.