Article

Does Information on Automated Driving Functions and the Way of Presenting It before Activation Influence Users’ Behavior and Perception of the System?

1
Institute of Ergonomics, Technical University of Munich, 80333 München, Germany
2
AUDI AG, 85057 Ingolstadt, Germany
*
Author to whom correspondence should be addressed.
Submission received: 15 December 2019 / Revised: 11 January 2020 / Accepted: 16 January 2020 / Published: 18 January 2020
(This article belongs to the Special Issue Automotive User Interfaces and Interactions in Automated Driving)

Abstract

:
Information on automated driving functions when automation is not activated but is available have not been investigated thus far. As the possibility of conducting non-driving related activities (NDRAs) is one of the most important aspects when it comes to perceived usefulness of automated cars and many NDRAs are time-dependent, users should know the period for which automation is available, even when not activated. This article presents a study (N = 33) investigating the effects of displaying the availability duration before—versus after—activation of the automation on users’ activation behavior and on how the system is rated. Furthermore, the way of addressing users regarding the availability on a more personal level to establish “sympathy” with the system was examined with regard to acceptance, usability, and workload. Results show that displaying the availability duration before activating the automation reduces the frequency of activations when no NDRA is executable within the automated drive. Moreover, acceptance and usability were higher and workload was reduced as a result of this information being provided. No effects were found with regard to how the user was addressed.

1. Introduction

This study focuses on Society of Automotive Engineers (SAE) Level 3 automations [1], which are always be available for the user—rather only when specific conditions are met. Those conditions have to be determined in the process of development. When they are not met, the automation cannot be activated or—if already activated—control is handed over to the user. Furthermore, when unexpected events occur on the road, an activated automation cannot handle the situation and it comes to a request to intervene (RtI). Research mostly focuses on this rather critical kind of transition [2]. Less research is conducted regarding planned take-overs. As unexpected critical events should not occur on a regular basis, most of the RtIs that users experience are predictable [3], and therefore it is possible to inform users about how long the current automation mode will be available [3,4]. This helps users planning the remaining automated drive. As SAE Level 3 automations allow users to conduct non-driving related activities (NDRAs) instead of monitoring the system [1], people might adapt their behavior according to the time left. In a short automation period, users might prefer to conduct a short NDRA or choose to begin one that can be easily interrupted.
It is shown that drivers over-rely on their automated driving functions [5] and often overestimate these systems in their functional capabilities [6]. Users of future SAE Level 3 automations will most likely not be well-versed in their interactions with automated driving functions due to a lack of training and consequently a lack of deep understanding of how these systems work and what limitations they have [7]. The obviousness of system limitations and thus of RtIs is not always be given [8], and therefore it can be anticipated that the reasons for the non-availability of automation while driving manually are also not always obvious. Users tend to expect automated driving functions to be available all the time—at least within a predefined context such as highways [9]—and therefore might suppose they can conduct NDRAs as long as they plan to be within this driving context. Consequently, they might plan to conduct a specific NDRA of an anticipated duration and activate the automation only for this purpose. What happens if the availability duration is not as long as expected and this specific task cannot be conducted? Based on these considerations, it is postulated that displaying the expected availability period before activating the automated driving function might help the user to decide whether an activation is purposeful or not and hence prevent frustration that may result from unfulfilled expectations [10].
Furthermore, a Design Thinking Workshop (DTW) was conducted to generate conceptual ideas on how to prevent negative emotions emerging from the use of automated driving functions, which are often not as available as users might expect. The DTW results indicate that addressing the user in a way that allows them to build “empathy” with the system and with its limitations might have a positive effect not on system understanding but on “sympathy” towards the system, which might enhance subjective ratings such as acceptance and usability.

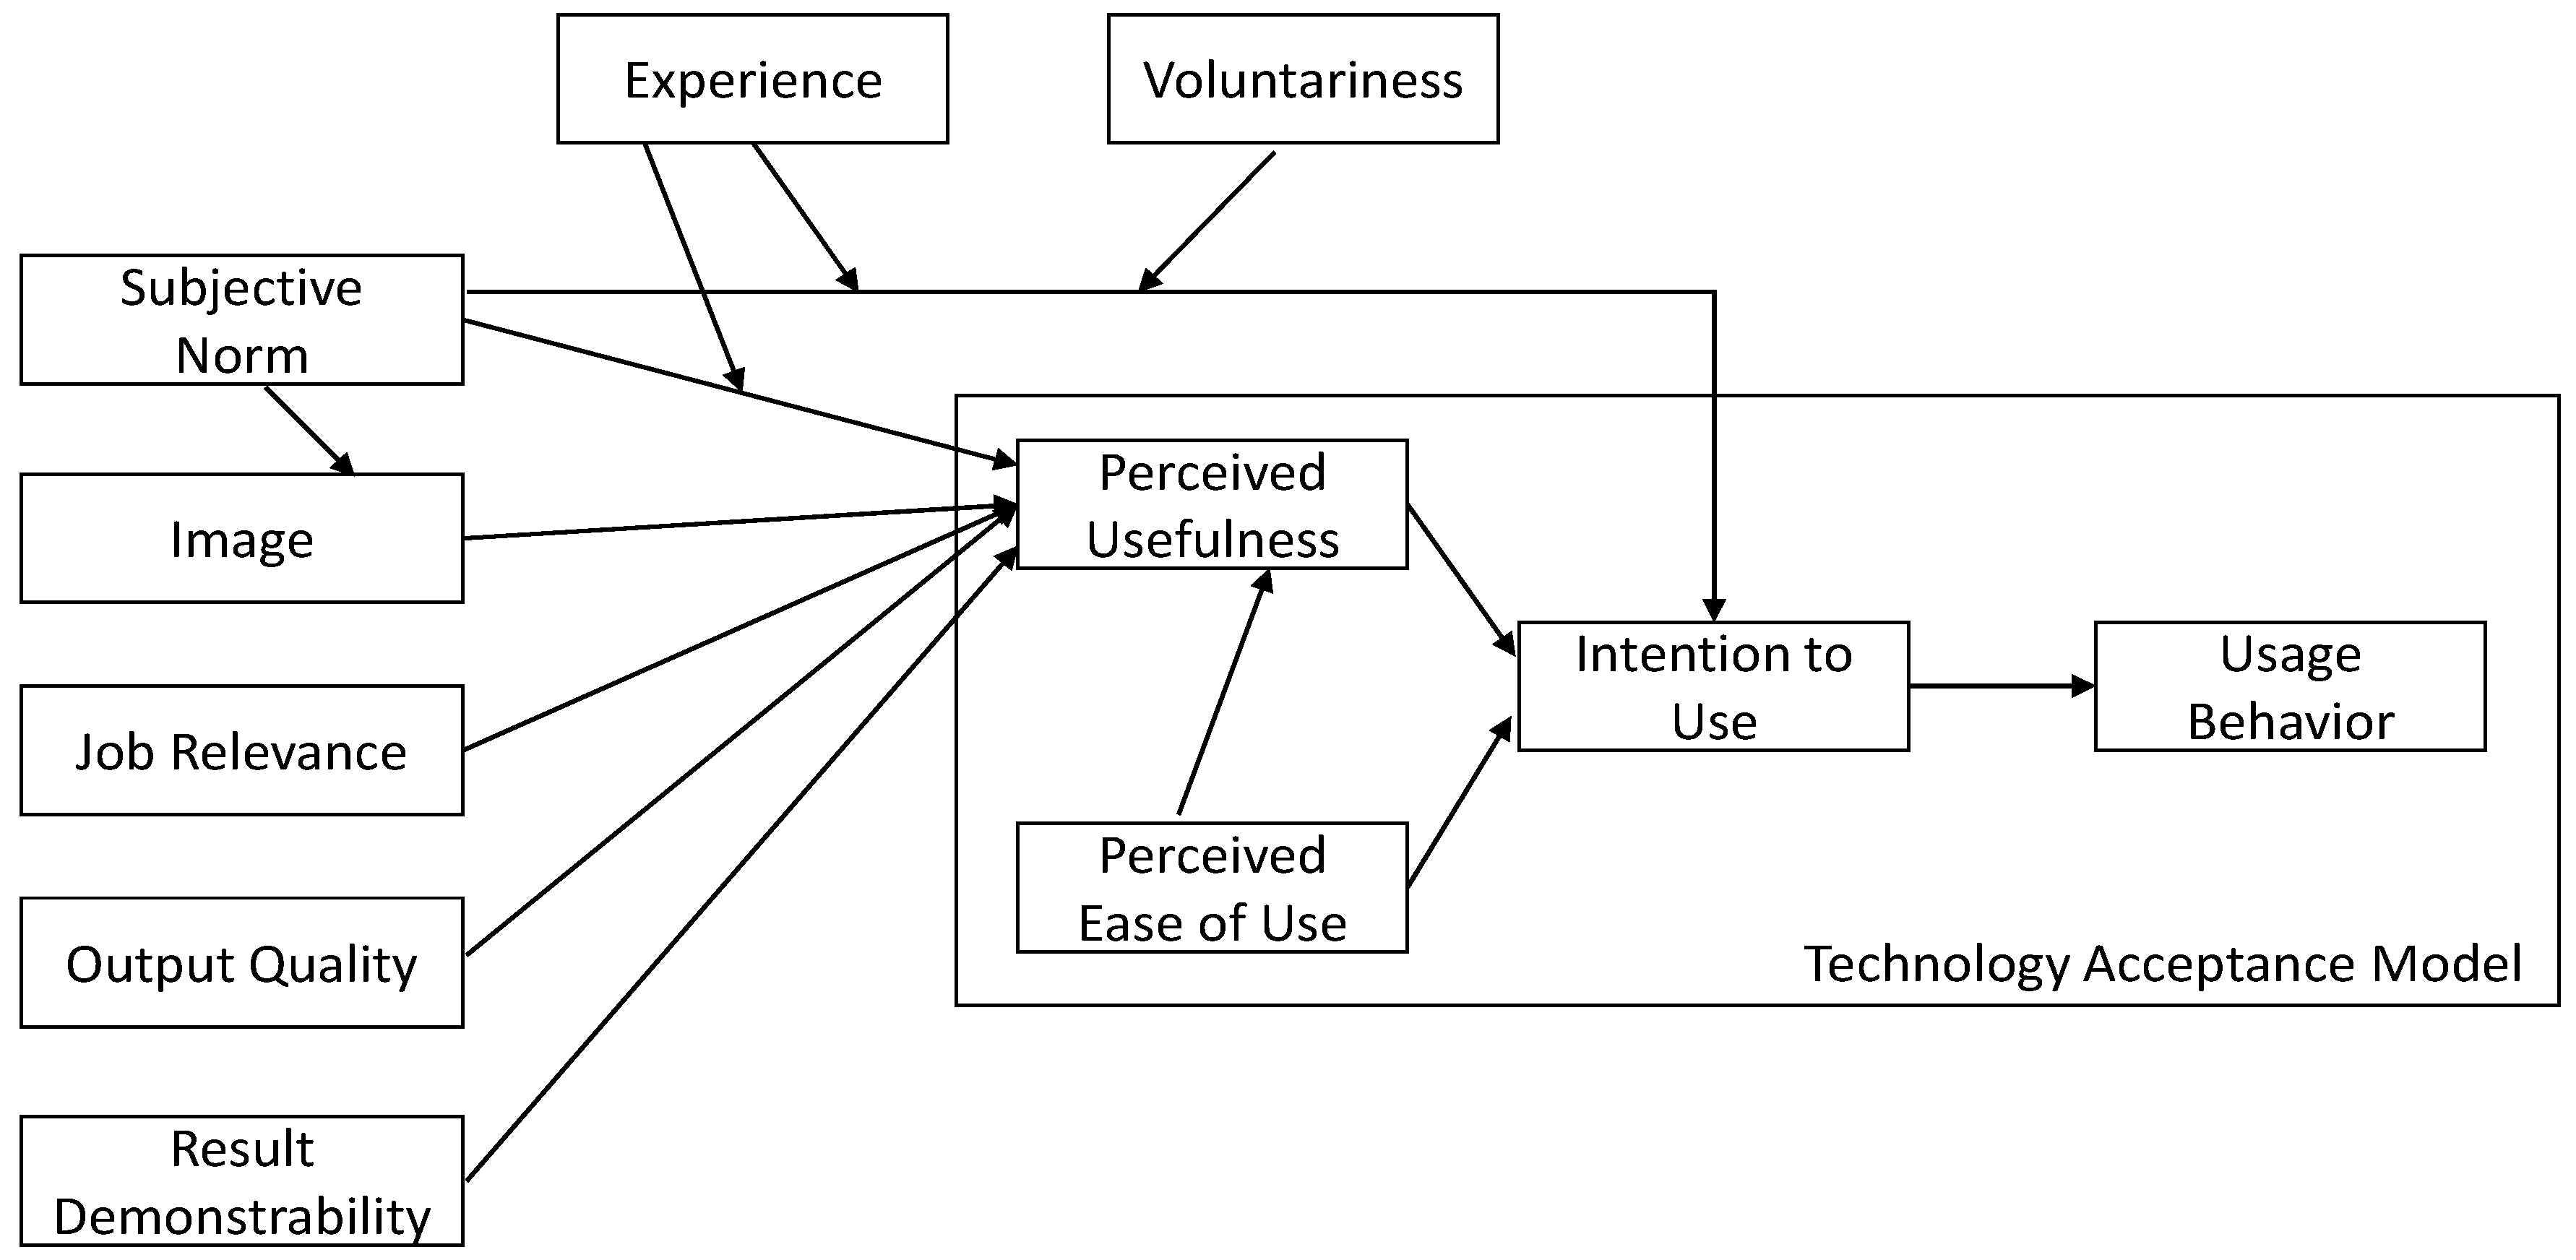
1.1. Theoretical Background

It is anticipated that automated driving functions have the potential to decrease accidents on public roads and thus increase traffic safety. Moreover, congestion and fuel emission are reduced [11]. These benefits are reflected in people’s expectations towards automated cars [12,13]. In particular, the expected increase in safety on public roads is topic of hotly debated discussions. Firstly, it can be argued that human drivers are not always the cause of accidents but, in many cases, the last factor preventing them [14]. Secondly, with increasing automation levels, human-factor issues can arise, for example, fatigue, drowsiness [15,16], and decreased mode awareness [17], which could impair users’ ability to control the vehicle after a period of automated driving. With regard to the benefits people will directly experience by using SAE Level 3 automations, the possibility of conducting NDRAs is one of the most important ones [13]. Research on NDRAs shows that most activities conducted today during manual driving will also be conducted during periods of automatic driving [18]. Furthermore, people will most likely engage in additional activities such as reading, watching videos/movies, texting, browsing, playing games, working, or just looking out of the window [18,19,20]. It can be assumed that some of these NDRAs are not bound to a specific duration, and therefore users might simply conduct them for as long as possible. For other activities, such as watching videos/movies or working, users might need a minimum amount of time and therefore a minimum length of automation availability. As automated cars will most likely drive more passively than most human drivers do—which could be a reason not to activate the automation when in a hurry [9]—activation might depend on the possibility to engage in and complete a specific activity. There are thus far no insights on how users would behave if an automation was available but the availability duration would not be long enough for conducting a specific desired NDRA.
Many studies have investigated the transition from automated to manual driving [2], but to the best of our knowledge, only a few have looked into the activation of automated driving functions [21,22]. Moreover, information needs have been gathered for several driving modes. Beggiato et al. [23] found the information drivers desire when driving manually in comparison to when using SAE Level 2 and SAE Level 3 automations. However, information needs relating directly to the activation, i.e., information regarding the automated driving function when it is available but not activated, have been mostly neglected. For this driving state, Danner et al. [9] found in an exploratory study that users would like to know the time or the distance automation may be available for should they decide to activate that function.
It is not only with regard to NDRAs that the availability duration might be helpful for drivers. People overestimate the abilities of existing and future automated driving functions [6] and expect infinite availability within a scope they can understand as laypersons—for example, when driving on a highway [9], which could be a result of car manufacturers’ marketing strategies [24]. As infinite availability durations are not realistic, at least for the first SAE Level 3 automations coming onto the market [9], people might be disappointed or frustrated due to their high expectations. Therefore, the way of presenting automation related information could be one way to enhance drivers’ acceptance of systems that are imperfect in their mind.

1.2. Related Work

Only a few studies have been conducted with regard to the activation of automated driving functions. Ning, Wang, and Qian [21] carried out an experimental study to investigate which kind of activation interaction would ensure the highest usability and found out that six of a total 21 possible interaction types can be recommended for the activation of the automation. Those six types are: pressing a button on the right/left part of the steering wheel, pressing a button on the center console, pulling a paddle on the right behind the steering wheel, pulling the right and the left paddle behind the steering wheel together once, and keeping the right and the left paddle behind the steering wheel together pulled for one second. No data were collected regarding the mental workload induced by the activation or on differences between the interaction types concerning the gaze behavior, which might be important measures, especially with regard to trying to ensure safe activation.
Moreover, Forster et al. [22] conducted a study to investigate how to improve the interaction between the driver and the automation system regarding different types of transitions classified as upward and downward transitions. Upward transitions comprised the activations of SAE Level 2 and 3 automations and were further differentiated according to the automation levels when the interaction was initiated. Downward transition was classified as the deactivation of a SAE Level 3 automated driving function degrading the system to SAE Level 2. Forster and colleagues compared a control group to two experimental groups receiving different kinds of instructions on how the automation was to be used and on the limitations of the system. The control group received basic information about the automation, while test persons in the first experimental condition learned about the system by reading an owner’s manual. The second experimental group was trained by working through an interactive tutorial. The information provided to the two experimental groups did not differ. Regarding the activation, the owner’s manual and the interactive tutorial improved system-understanding and interaction performance in comparison with the control group. Interaction performance was measured using expert ratings gleaned from interaction observations and was operationalized in the form of interaction accuracy, i.e., if mistakes were made whilst activating the automation. As mental models formed here by giving information prior to the interaction change over time, and non-experienced limitations can get erased from the same after a while [25], drivers might need more support in order to have the correct mental model for every situation. Furthermore, it is not certain that an activation is desirable every time that automation is available. Whether an activation is advantageous for the user might depend on what he/she wishes to achieve through activation [9].
Hecht et al. [19] conducted a study to investigate which kind of NDRA test persons wish to engage in by observing them in a driving simulator while driving an SAE Level 3 automation. It was found that NDRAs differed in terms of the time participants needed to conduct them. Test persons spent more time without interrupting on using the personal laptop and watching videos than on reading. This indicates that users might need different availability durations for different tasks. Therefore, users should be supported in planning their desired activities. Holländer and Pfleging [3] found that presenting the remaining time until automation ends with an abstract bar improves usability ratings significantly. The study participants suggested displaying the remaining time using a combination of that abstract bar and a countdown. Richardson et al. [26], on the other hand, investigated whether time or distance until automation ends improves takeover quality and the subjective ratings for the system. Results showed no effect regarding the takeover quality. Nonetheless, indicating a time frame until automation ends improved acceptance (tested by usefulness and scale of satisfaction) and lowered workload. Wandtner et al. [4] showed that, by depicting the time until automations ends, test persons engaged in fewer critical tasks before RtIs. Yet, some tasks that were not feasible before the RtI were begun. This could have been due to the intrinsic motivation resulting from the NDRA in which test persons could collect points and then earn money.

1.3. Availability Duration Displayed before Activation

As described above, displaying the time until automation ends can improve the subjective ratings for the system. In this study, we investigated whether there is an advantage to providing this information before the activation of the automation. In a prior study, participants experienced manual and automated rides; in some, they were able to complete an NDRA, and in others, they were not. In a qualitative interview, test persons stated they would like a display indicating the availability duration prior to activation [9]. The potential benefits of this information are investigated in this work.
One important construct influencing the usage of a technical system is acceptance. According to the definition of Adell et al. [27], acceptance expresses the willingness to use a technology when it is available. Davis [28] created a technology acceptance model (TAM), depicted in the rectangle in Figure 1, in which he postulates that acceptance can be subdivided into two dimensions, perceived usefulness (PU) and perceived ease of use (PEoU). As it can be seen, PU and PEoU are linked to the intention to use a system, which in turn is linked to usage behavior. Thus, pursuant to the TAM, the degree to which a user finds a system useful influences the actual usage mediated through his/her intentions. Davis and Venkatesh [29] expanded the model and added more factors influencing acceptance and especially the dimension PU. Job relevance and output quality are seen as quantitative and qualitative measures associated with the degree to which the usage helps a user to fulfill his/her tasks.
As people today already have expectations of future automated driving functionalities and their capabilities [6], and these expectations will most probably not be met in reality [9], it might be important to adjust users’ mental models regarding automated vehicles (AV). A mental model is the representation of a process or a system in a person’s mind. Thus, the implicit knowledge and assumptions one might have about a system are found in the mental model [30] and consequently also the assumptions about functionalities and limitations of AVs. Incorrect mental models can lead to critical situations before and after a transition [31]; consequently, the anticipated safety benefits can only come into effect if users have the right mental models. Furthermore, it is not necessary to have a complete and fully correct idea of the AV’s functionalities, since incomplete but correct simplifications of the system and of its dependencies can lead to correct interactions [32]. People’s expectations towards AVs are formed today by media and advertisements and might lead to excessive presumptions [6] and therefore unfulfilled expectations when first using such a system. If users expect infinite availability within a predefined driving context and are not aware of possible RtIs within this specific context, a takeover-request might be surprising and disappointing. This kind of unfulfilled expectation can lead to frustration [10]. This emotion might then lead to desperation and resignation when it comes to the subsequent use of the system [33]. Acceptance, especially PU, might be influenced by the potential fulfilment of expectations since a system that is less capable than thought might be considered less useful.
As well as acceptance when initially using a system, continuance can play an important role regarding the success of an Information System (IS). Continuance, which here means the constant use of a system, is associated with PEoU and PU. Therefore, it is an important indicator of user satisfaction [34]. The possibility of conducting NDRAs is considered an important factor influencing PU and thus acceptance towards the automated driving function [35]. Therefore, it can be argued that, even if the initial usage of a system satisfies the user, its continued use also depends on following interactions. If users, for example, activate an automated driving function and learn about its availability, this experience shapes the mental model as it is subject to constant verification [36] and therefore prone to change [25]. However, the availability can change from one journey to the next, depending on weather, traffic density, or potential construction works en route. Therefore, it might be helpful for the user to know the estimated availability duration of the automation before its activation, especially when the automation only is activated with the intention of conducting a specific NDRA. This information might prevent frustration when initially using a system and—with regard to continuance—could influence users’ mental models concerning the availability in real time. Moreover, it might prevent a reliance on obsolete mental models generated from past system interactions.

1.4. The Way of Presenting the Information

Unfulfilled expectations can lead to frustration, and therefore influencing the expectations might be a way to ensure positive human–machine interactions. Since emotions arise not only from expectations but also from the way a system interacts [33], a DTW was conducted to generate ideas on how the automation should interact when providing the above-mentioned information. In the DTW emerged an idea of displaying information in a way users build “empathy” or “sympathy” towards the system was chosen to be tested within this study.
Empathy can be defined in this context as the ability to identify with or—in case the interaction partner is not human—understand another’s situation [37]. An important factor allowing users to build empathy is to ensure the interaction is like a social dialogue, including greetings and farewells. This kind of empathic approach in the interaction between a human and a computer can significantly increase user’s satisfaction [38]. Bickmore and Picard let 101 users interact with a computer program consisting of an agent who played the role of a fitness advisor. They divided the participants in two subgroups; one interacted with an agent who was rather empathic and showed social skills while the other group interacted with an agent who was task oriented. Findings suggest that users are more willing to use a system continuously if there is a social agent standing for the system, even after frequent usages [39]. Hone showed in three studies with a total of 42 participants that, by giving agents the ability to use strategies derived from interaction between humans, users’ frustration can be reduced. One of the studies investigated how an embodied empathic agent reduces users’ frustration in comparison to an empathic text agent. Results showed that both approaches had effects, but the embodied agent was superior in reducing frustration [40]. However, a voice agent can also produce these kinds of effects, and it is not clear whether the visualization of an agent—hence the embodiment—or the voice has a greater impact [41].
Reeves and Nass [42] found that it is not necessary to create an agent to make people treat computers like humans. They showed that people rate a computer-based training session as less severe on the computer on which the training was carried out than on another computer. This is seen analogously to the phenomenon that people would rather not tell people directly what they think about them and are more honest with their opinions when speaking to a third person [42].
As this study’s aim is not to investigate how an agent for an automated driving function should be designed generally but how people react in sympathetic terms to what is, in their perception, an “imperfect” automation, the focus is on the interaction displaying the availability duration, since the length of this period might be one important factor. Furthermore, we focus on the interaction when preparing the user to take over control of the vehicle again. Findings from literature are used to adapt the information display such that people might be more “forgiving” when interacting with the system without changing the concepts such that the potential effects can no longer be traced back to the causal manipulation.

1.5. Research Questions and Hypotheses

The first research question refers to the display of the availability duration before activating the automated driving function. It is anticipated that this information would improve the subjective ratings for the system. Subjective ratings took into account acceptance, usability, and workload induced by usage. Additionally, potential differences emerging from different lengths of availability periods were taken into account. Furthermore, it was assumed that information on availability duration before activation allowed the participants to foresee whether an NDRA could be conducted without interruption or not. Therefore, it was hypothesized that participants adapt their behavior according to the displayed availability duration and therefore activate the automation more purposefully. As ratings and purposefulness could also depend on the frequency of transitions of control, two subgroups were formed to test the hypothesis. One group was called positive condition, and the other was called negative condition. In the positive condition, more NDRAs could be conducted than in the negative; in this way, it was possible to control the effects for the frequency of feasible NDRAs.
Moreover, the way of providing the information might play a role in the perception of the human–computer interaction. Specifically, making the automation less available than users think—thus giving them the feeling of interacting with a social being when they are actually interacting with the automated driving function—might improve subjective ratings compared to when information is presented in an impersonal manner. Based upon literature and these considerations, the hypotheses were:
Hypothesis 1a (H1a).
Displaying the availability duration before activation improves the acceptance of the system.
Hypothesis 1b (H1b).
The manner in which information on the automation is displayed can improve the acceptance of the system, especially when the automation is less available.
Hypothesis 2a (H2a).
Displaying the availability duration before activation improves the usability of the system.
Hypothesis 2b (H2b).
The manner in which information on the automation is displayed can improve the usability of the system, especially when the automation is less available.
Hypothesis 3a (H3a).
Displaying the availability duration before activation influences participants’ workload.
Hypothesis 3b (H3b).
The manner in which information on the automation is displayed can improve the workload of the system, especially when the automation is less available.
Hypothesis 4 (H4).
Displaying the availability duration before activation influences the purposefulness of the participants’ activation behavior.

2. Materials and Methods

2.1. Preliminary Study: Design Thinking Workshop

To gather ideas of how negative emotions emerging from unfulfilled expectations could be avoided, a DTW was conducted. The principle of DTW is to build up an understanding of users and their needs. Thus, the main question in a DTW is not how to design the most attractive system but how to design a system that meets the users’ needs and desires [43]. Therefore, a small group of developers gather for several DTW sessions, which go through the various steps of the DTW process: defining the design challenge, understanding this challenge, defining the viewpoint, creating ideas, developing a prototype, and validating and then integrating the prototype [44]. In this study, the DTW went through the first five phases. In this workshop, the challenge was defined as: “How can we help the user accept an automation system that is not available as often as he/she expects?” To understand this challenge, nine interviews with laypersons were conducted. These interviews were intended to help generate ideas on how laypersons might need the communication with an automation to be designed such that humans experience positive emotions as a result of this interaction. After the interviews, the interview protocols generated by each workshop participant were synthetized to create a “persona”, whose viewpoint was then taken into the following DTW process. Afterwards, ideas were created via several iterations of brainstorming. Many different ideas were gathered of differing levels of feasibility. As for this study, only one idea could be taken into account; the different ideas were clustered, and then the cluster with the most votes was chosen for further examination. The most prominent cluster was summarized as displaying information in a way users build “empathy” or “sympathy” towards the system. A literature review was then conducted to investigate how to make such an interaction possible.

2.2. Study Design and Procedure

To test the hypotheses, a driving simulator study with a mixed-model design was conducted. Thus, two independent variables were manipulated, a within factor and a between factor. The manipulation of the information display regarding the automated driving function served as the within variable, while the availability of the automation served as the between variable. Three different information display concepts were tested. A baseline concept (BL) was compared to two different advanced concepts [time before activation (TB) and time before activation plus personal approach (TBP)], differing in their manner of providing information regarding automation. For testing the between factor, the participants were divided into two subgroups—a positive and a negative condition—differing in the availability durations of single availability periods. The experimental design is illustrated in Figure 2.
Participants were welcomed and informed about the study and the procedure. After risks such as nausea and the option of withdrawing from the study without needing to cite reasons were outlined, written consent was obtained. Participants filled out a demographic questionnaire, which also asked for details of their experience with driver-assistance and automation systems. They then drove in the driving simulator for about 10 min to get used to the simulation environment. Test persons learned how to use the automated driving function, i.e., activating it and taking back control. Furthermore, they learned how to interact with the tablet computer in the middle console representing the Central Information Display (CID). They were taught how to activate and deactivate videos, which represented the NDRAs during this study. Participants experienced several RtIs to reduce surprise effects that might emerge from this system interaction, as reactions to RtIs were not subject of this investigation. Subsequently, the participants conducted the test drives experiencing the three concepts and were interrupted by filling out questionnaires on the system. The order of the test drives and thus the concepts was randomized to avoid learning effects influencing the results of the study. Each test drive took about 15 min and, independent of the condition participants were assigned to, they experienced six availability durations in every test drive. In the positive condition, four of those availability durations were long enough to finish a video, while in the negative condition, only two availability periods were long enough to complete an NDRA. The videos were categorized as long and short videos. Long videos took about 90 s, while short videos took about 50 s. The activation of the videos was carried out by double tapping. The videos were structured on the screen according to the category they were assigned to (short vs. long). Hence, short videos were fixed on the left side of the screen and long videos on the right side of the screen. A sign above the tablet showed which side indicated which video category. The availability durations were defined to be either long enough for a short or a long video or not long enough for either. In the positive condition, the availability durations consisted of two periods long enough for a long video and two long enough for a short video. In the negative condition, one availability was long enough for a long video and one was long enough for a short video. Test persons were instructed to watch as many videos as possible while driving automatically without being interrupted. They were not instructed to only activate when the availability duration was long enough to watch a video, and no instructions were given on activating every time automation was available. Hence, it was their own decision whether to activate or not. To ensure participants adhered to the planned study design and did not pause and continue videos, they were told that an intentional interruption of a video—or starting one when it was clear that it could not be finished—was considered to be contrary to the rules. To avoid learning effects concerning the order of the availability periods and their lengths, the order was randomized. Figure 3 shows the procedure and an exemplary test drive with its availability durations.
After the test drives and the last questionnaires, a short, qualitative, semi-structured interview was conducted.

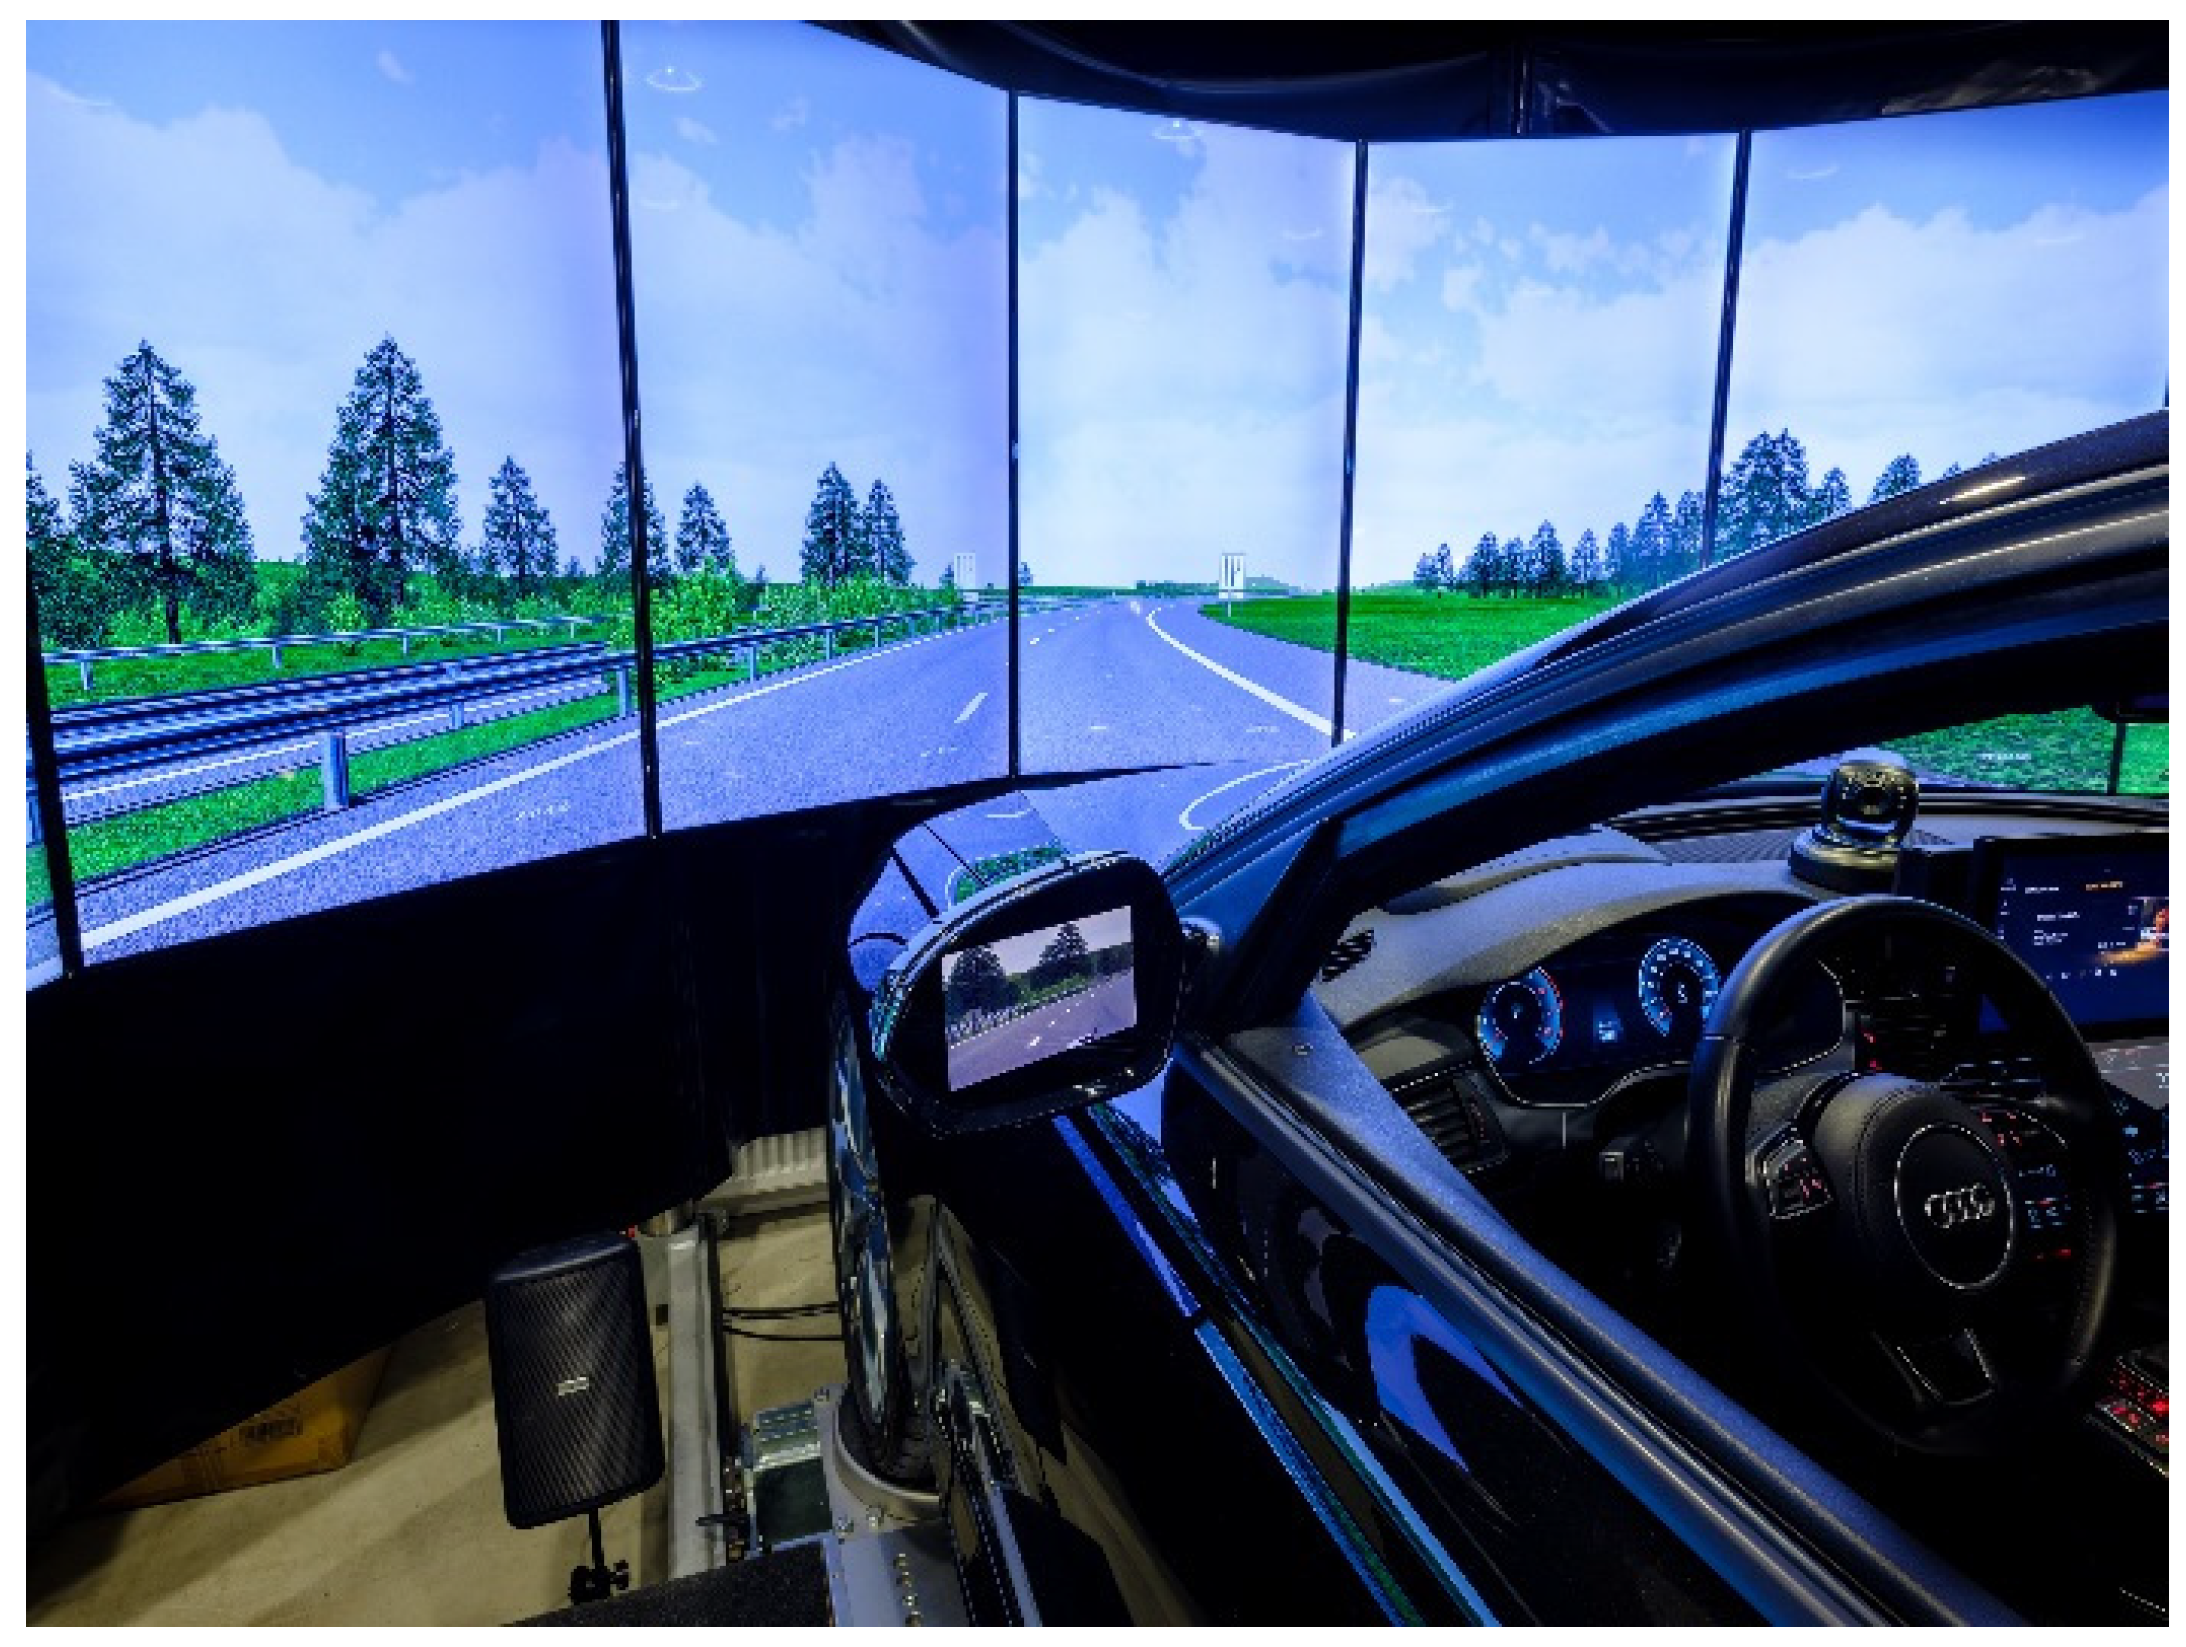
2.3. Driving Simulator and Simulated Routes

The study was conducted in a fixed-based driving simulator (see Figure 4) at AUDI AG. The routes were implemented using the Software Virtual Test Drive. One highway route was used for all test drives with differing orders of the availability periods. No obvious external reasons for non-availability were implemented.

2.4. Human–Machine Interface

The Human–Machine Interface (HMI) differed between the test drives. Three HMIs were implemented. They comprised the usual displays known from production vehicles, including velocity and RPM. When automation became available in the baseline concept (BL), a pop-up window appeared for six seconds saying “Autopilot available” accompanied by a sound and a permanent icon presenting availability. For the second concept (TB), the HMI was the same as described for BL but was enhanced by showing a time bar and a countdown in addition to the permanent icon. Moreover, the pop-up text was changed to: “Autopilot available for x minutes and y seconds”. For BL and TB, the RtI was the same. Twenty seconds before a system limit was reached, another sound was played, and the participants were requested to take over the vehicle control displaying this text: “Please take over now”. A countdown was presented so that the participants would know that take-over was not immediately necessary to prevent stress emerging due to overly critical take-over situations. For the third concept (TBP), the information was the same as in TB, but the manner in which it was communicated differed. The pop-up text changed to “Hey! I can drive you now for x minutes and y seconds” and the RtI text was changed to “Please take control again. Hope you had a nice ride with me, see you soon!” During the automated drive, the HMI was the same for all concepts, showing surrounding vehicles, velocity, RPM, and the time bar with the countdown representing the remaining availability duration. Table 1 shows the differences between the concepts. Differences between TB and TBP were not marked and existed only in the wording. Further differences that might have induced anthropomorphism—such as the embodiment of an agent or some speech output—were considered inappropriate for this study, since it would not have been possible to retrace a possible effect back to its predictor. Even if embodied agents might have a greater effect, research has shown that users’ frustration can also be reduced only by text [40].

2.5. Dependent Variables

For testing the acceptance towards the system, Van der Laan’s acceptance scale with semantic differential was used [45] in which participants rate nine items on a five-point rating scale (e.g., pleasant—unpleasant), and the scale goes from −2 to 2. The acceptance scale consists of two dimensions, usefulness and satisfaction.
Usability was tested using the System Usability Scale [46] consisting of ten items rated on a 5-point Likert-scale (e.g., “I think I would like to use this system frequently”).
To measure subjective workload, the revised version of the NASA-TLX [47] was used, the NASA-RTLX. This questionnaire consists of six items rated on scale with 21 response options from 0 to 20. The questionnaire consists of the dimensions mental demand, physical demand, temporal demand, overall performance, effort, and frustration.
To operationalize the activation behavior, activations when an NDRA was possible to be finished within the availability period were defined as purposeful. Furthermore, the decision to not activate when no NDRA was feasible within the availability period was also defined as purposeful. Therefore, for every availability period, participants had to make a decision whether purposeful or not. The purposefulness of activation behavior was thus computed as follows to generate a percentage:
Q u a n t i t y   o f   P u r p o s e f u l   D e c i s i o n s Q u a n t i t y   o f   A v a i l a b i l i t y   P e r i o d s 100

2.6. Participants

The sample consisted of N = 33 participants with a mean age of M = 45.03 years (SD = 14.50). In total, 14 women and 19 men took part. Test persons stated that they drove a mean distance of M = 17,891 (SD = 18,371) kilometers per year. The positive condition consisted of 16 participants, while 17 participants were assigned to the negative condition. Participants were regular people—not associated with AUDI or the university—recruited using a mailing distribution list to which everybody who is of full age and interested in participating in studies can enroll. Participants received 70€ for their participation. In this way, it could be ensured not only students or car manufacturer employees would participate.

2.7. Statistical Analysis

The statistical analysis was conducted using JASP. To test the hypotheses, various statistical analyses were conducted, depending on whether the data met the conditions for parametric testing or not. In the following, the analysis of each hypothesis is presented along with the assumption tests. All dependent variables are considered suitable for parametric testing, since Likert scales are deemed to be interval-scaled, whereas single-item responses are considered to be of ordinal character [48]. If the assumption for an ANOVA of normal distribution was violated, the analysis was conducted and interpreted, since ANOVA is considered robust against this violation [49]. As the effects of the different concepts are multiple-tested for subjective ratings (acceptance, usability, and workload), the α-level is adjusted using the Bonferroni method. When initially testing against an alpha-level of α = 0.05, the adjusted value is α* = 0.017 for the main effects in the omnibus tests concerning the subjective ratings.

2.8. Ethical Approval

The Ethics Board of the Technical University Munich provided ethical approval for this study. The corresponding ethical approval code is 447/19 S.

3. Results

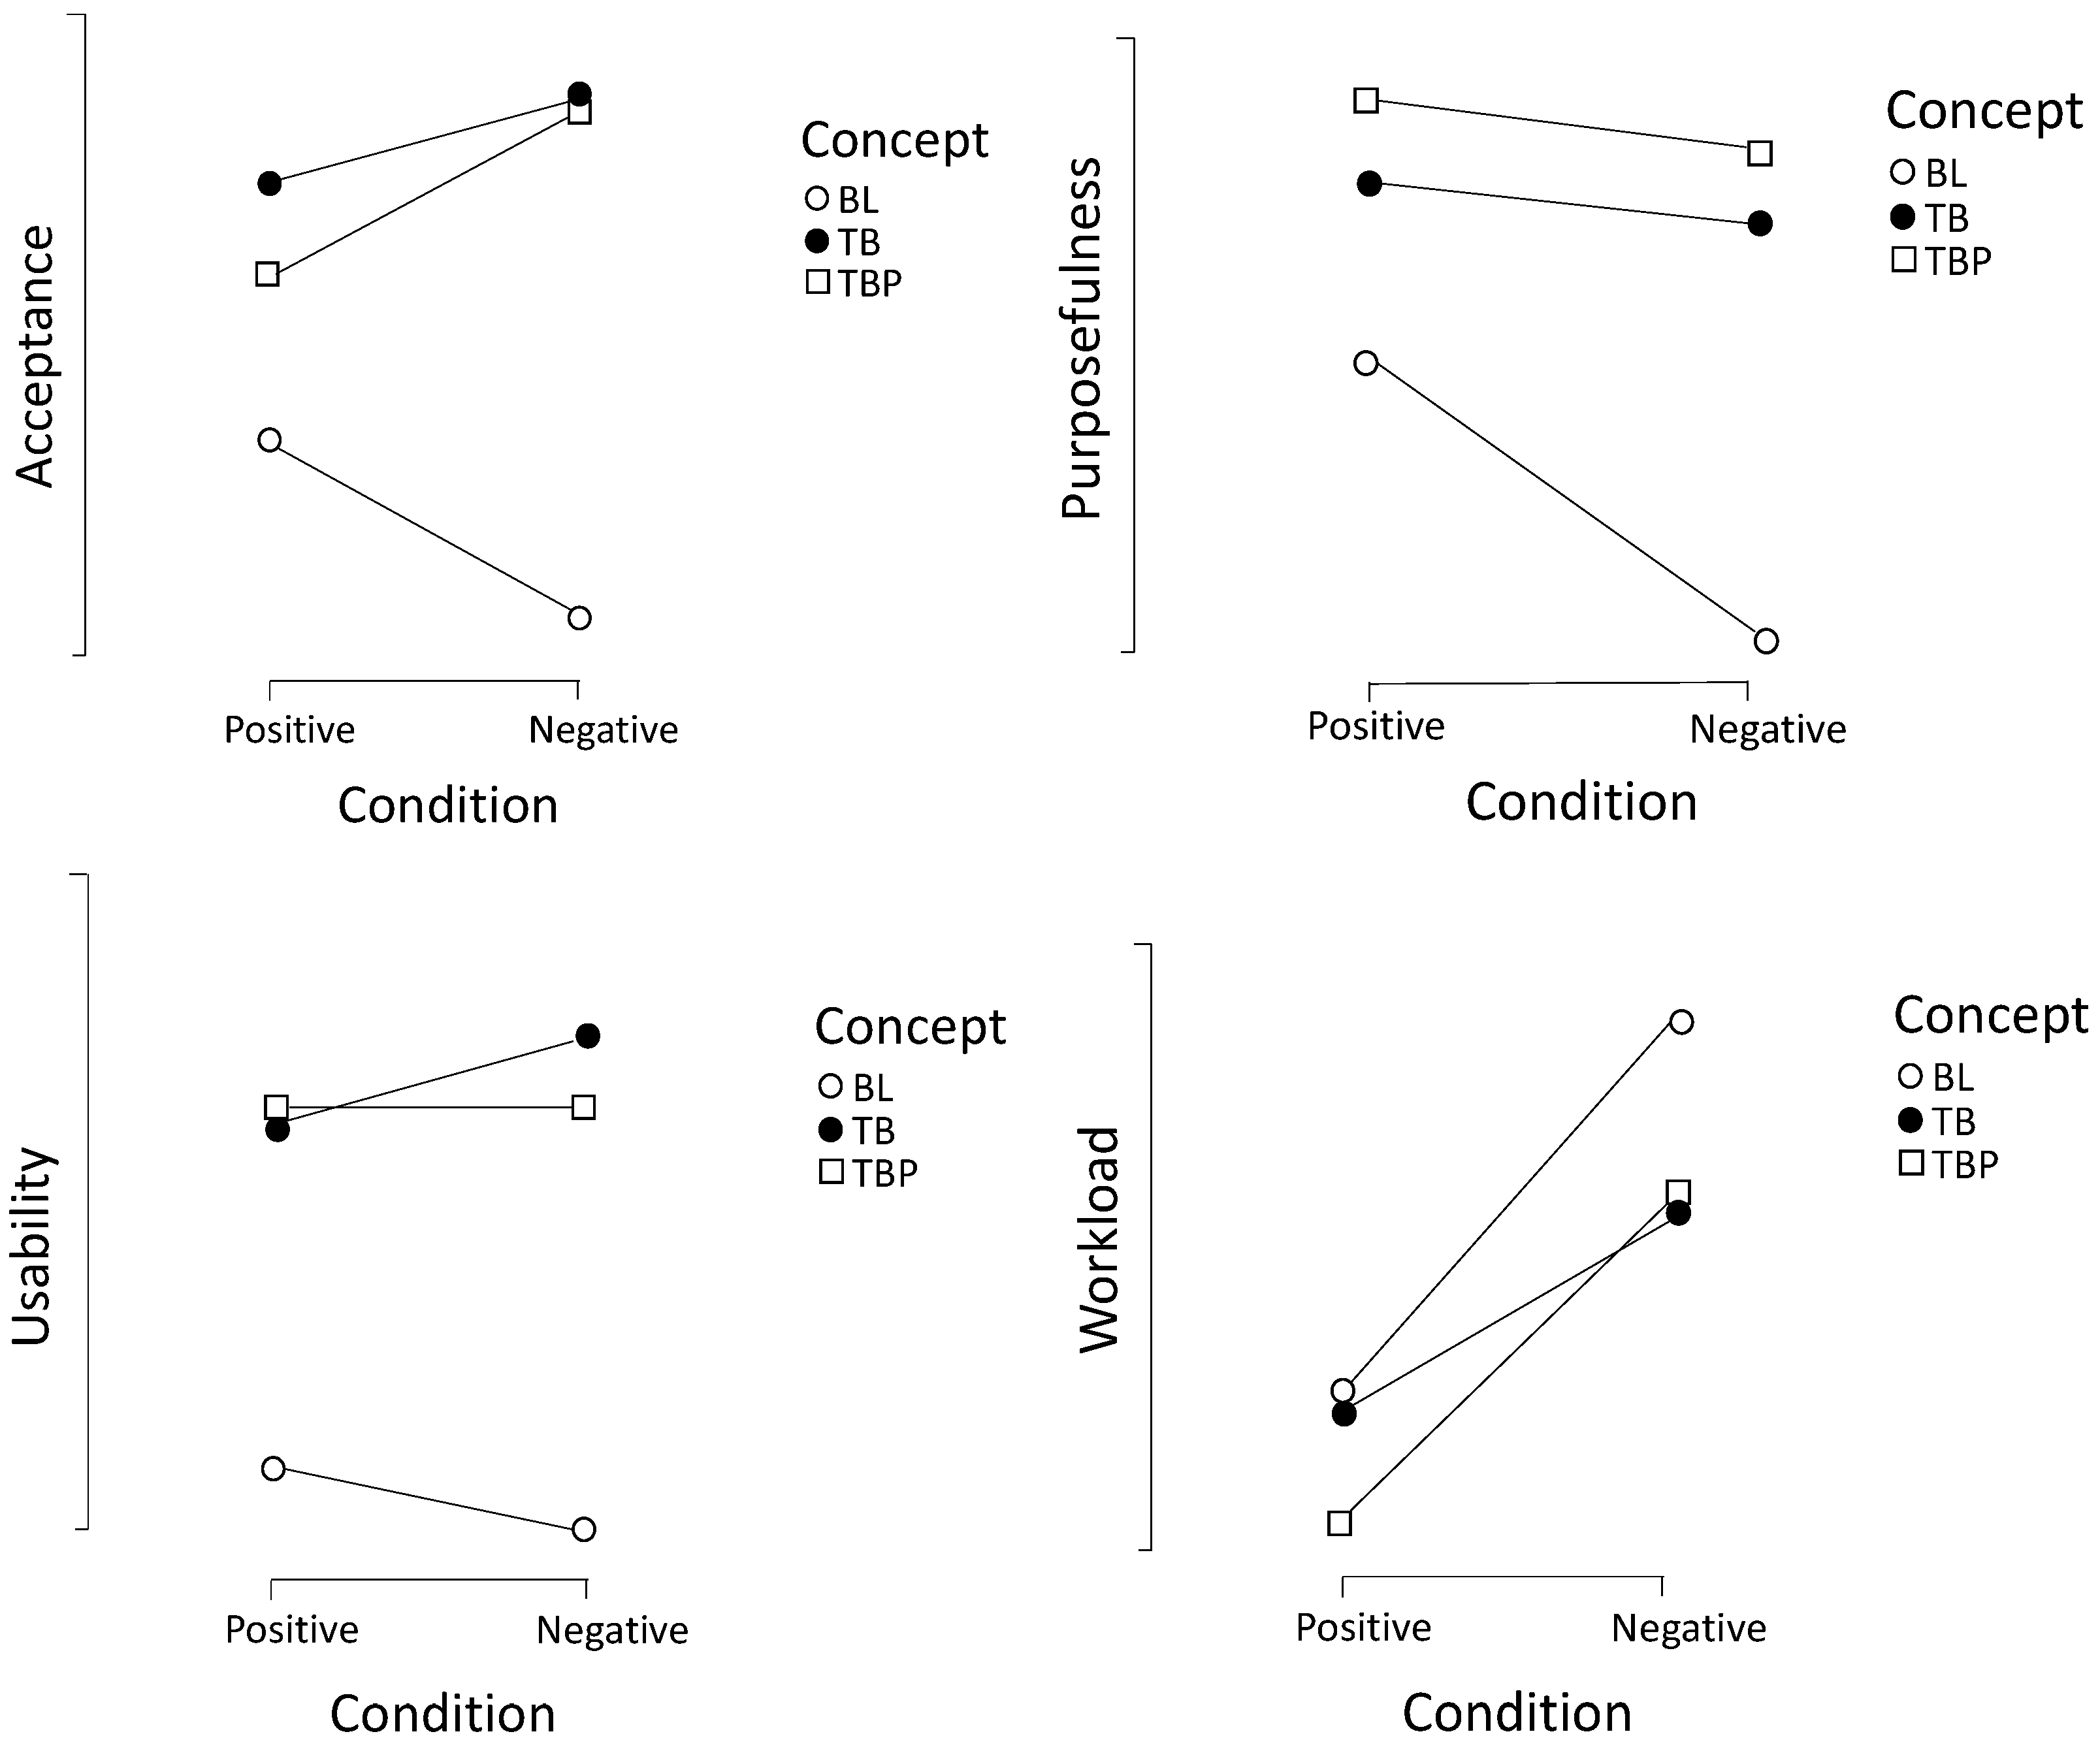
3.1. H1—Effects on Acceptance

To analyze the potential effects of displaying the availability duration before activation on acceptance and whether this is influenced by the condition (positive vs. negative), a 3 × 2 mixed ANOVA was conducted. The sphericity assumption was violated [Mauchly-W(2) = 0.367, p < 0.001] and thus a Greenhouse–Geisser correction was used for the analysis. Homogeneity was given for all three measures of acceptance. The ANOVA showed a significant main effect of the HMI concept with a strong effect [Greenhouse–Geisser F(1.23, 37.91) = 9.41, p < 0.001, partial η2 = 0.24] but no effect for the condition [F(1, 31) = 0.03, p = 0.86]. Post hoc comparisons showed significant differences for BL vs. TB [t(32) = 3.61, pbonf = 0.003] and for BL vs. TBP [t(32) = 2.79, pbonf = 0.027]. Both advanced concepts were rated higher than the baseline but there was no significant difference for TB vs. TBP [t(32) = 1.12, pbonf = 0.815]. There was no significant interaction between concept and condition [Greenhouse–Geisser F(1.23, 37.91) = 1.69, p = 0.20]. See Table 2 and Figure 5 for further details.
This result indicates that displaying the availability duration before activation has an effect on the acceptance of the system independent of the condition. No effects were found regarding the manner of presenting the information.

3.2. H2—Effects on Usability

To test the effects on usability, a 3 × 2 ANOVA was once again calculated. Sphericity was not given [Mauchly-W(2) = 0.495, p < 0.001], therefore a Greenhouse–Geisser correction was used. The assumption of homogeneity was fulfilled for all times of measures. The ANOVA was significant regarding the main effect of the concepts [Greenhouse–Geisser F(1.33, 41.19) = 15.06, p < 0.001, partial η2 = 0.33], showing a strong effect. No effect was found for the condition [F(1, 31) = 0.002, p = 0.96]. Moreover, there was no interaction effect between the concepts and the conditions [Greenhouse–Geisser F(1.33, 41.19) = 0.403, p = 0.58]. Post hoc comparisons revealed significant effects for BL vs. TB [t(32) = 4.21, pbonf < 0.001] and BL vs. TBP [t(32) = 4.07, pbonf < 0.001] but no effect for TB vs. TBP [t(32) = 0.61, pbonf = 1.00].
Consequently, it is shown that usability is improved by displaying the availability duration before activation (see Table 2 and Figure 5 for further details), but that the difference in the wording has no effect.

3.3. H3—Effects on Workload

The assumption of sphericity for the 3 × 2 ANOVA was not violated [Mauchly-W(2) = 0.990, p = 0.86], hence no correction was used. Homogeneity was also given for all workload measures. The main effect for the concept was significant on the corrected alpha level of α* = 0.017 [F(2, 62) = 4.52, p = 0.015, partial η2 = 0.13] but not the main effect for condition [F(1, 31) = 4.62, p = 0.039]. The interaction effect was also not significant [F(2, 62) = 0.96, p = 0.39]. Post hoc comparison showed no significant effects for BL vs. TB [t(32) = 2.12, pbonf = 0.125]. The comparison between BL and TBP was significant [t(32) = 2.84, pbonf = 0.024]. There was no effect for TB vs. TBP [t(32) = 0.82, pbonf = 1.00]. See descriptive statistics and further details in Table 2 and Figure 5.
These analyses show that giving information regarding how long the automation will be available before it is activated has a positive impact on users’ perceived workload independent of the condition. This effect is only significant for TBP, therefore definitive implications cannot be made. Presenting the information in a more personal way has no effect compared to simply presenting it.

3.4. H4—Effects on Purposefulness of Activation Behavior

Purposefulness of the activation behavior was operationalized as the quantity of purposeful decisions (activating when NDRA is feasible/not activating when NDRA is not feasible) divided by the quantity of all decisions. As homogeneity regarding purposefulness was not given for BL and TB, no ANOVA was computed. Hence, a Friedman test for dependent measures was conducted. This analysis showed a significant effect [Chi-Square(2) = 41.85, p < 0.001]. Post hoc comparisons showed a significant difference for BL vs. TB [t(32) = 6.69, pbonf < 0.001] and for BL vs. TBP [t(32) = 8.58, pbonf < 0.001]. No difference was found for TB vs. TBP [t(32) = 1.87, pbonf = 0.21]. As shown in Figure 5, an ordinal interaction might have been present. To compare if BL was not different from TB and TBP in the positive condition but in the negative condition, four Wilcoxon tests were calculated. To avoid alpha error accumulation, the alpha level was adjusted using the Bonferroni method. Consequently, the adjusted alpha-level was α* = 0.0125. The single comparisons are shown in Table 3. No significant interaction was found, as differences between the concepts were significantly independent of the condition. In the negative condition, the mean differences were noticeably larger on descriptive level, indicating that participants adapted their activation behavior according to the availability duration and the possibility of conducting NDRAs. When activating on every possible occasion, the purposeful value would have been 66.66% in the positive condition and 33.33% in the negative condition.

3.5. Qualitative Interview

Only nine of the 33 (27%) participants stated recognition of the difference between TB and TBP, though two of those who did not see the difference thought TBP was designed “nicer”. This leads to the conclusion that most participants did not read the availability and RtI text properly but only perceived the information they considered relevant as availability duration and the general request to intervene. Five of those participants who recognized the difference stated they liked the more personal way of being addressed, while the other four stated they want only the information without further personalization since the information comes from a machine and not from a human.
TB and TBP were the most preferred concepts, since most of the participants saw no difference. BL was the least favorable one. Most of the participants stated that the display of the availability duration before activation was very important and that they liked the combination of the countdown and the time bar. Only one of these displays would not have been sufficient.

4. Discussion

4.1. Displaying the Availability Duration before Activation

As shown above, providing information on the availability duration given before activating the automation has positive effects on the subjective ratings for the system. Acceptance and usability increased, while there was a tendency of decreasing perceived workload. There were no significant interactions with the factor condition, which leads to the conclusion that—independent of the availability periods future users might face—the display of the availability duration before activation improves their attitude towards the system. Moreover, no effects for the conditions positive vs. negative were found, which could be explained by the effect that the subjective ratings of TB and TBP showed the tendency to increase from positive to negative condition, while the subjective ratings of BL rather decreased from positive to negative condition. As is shown in Figure 5, workload was descriptively higher in the negative condition. This might have come from the unnatural study design. As outlined above, the single test drives took about 15 min, and each contained six availability periods. Therefore, when experiencing four periods that were too short for an NDRA, i.e., they had a duration less than 50 s, workload might have increased through the frequent transitions of control. Nonetheless, even if this transition frequency is not realistic, displaying the availability duration before activation and consequently the adaptation of activation behavior can reduce this influence. In realistic conditions with longer availability periods, workload differences might not be this large or may be non-existent. Regarding the other subjective measures, the differences seem to be also existent in the positive condition (see Table 2), indicating that, even if future users will be able to conduct an NDRA within an availability period, displaying the duration before activation has positive effects. This might be due to the increased transparency perceived when further information is provided, since transparency is seen to be an important factor when it comes to interaction with automated systems [25]. Transparency is associated with trust in automation [50], which is furthermore correlated with acceptance [8,51], which was enhanced by further information in this study. According to the TAM, acceptance is linked to actual usage [28] as well as its subdimensions usefulness and satisfaction being linked to continuance and therefore frequent usage [34].
As results regarding the purposefulness of the activation behavior show, participants adapted their activation behavior depending on whether an NDRA was feasible within an availability period or not; in other words, if they knew an NDRA was feasible within the automated drive, they activated the automation, and if an NDRA was not feasible, participants tended to continue the manual drive. This effect might have been enhanced by the fact that they were not allowed to pause the videos and continue them in a later availability period. The aim of this research was to investigate whether this information helps users to plan their NDRAs according to the different lengths of automated drives. Therefore, the case where users might not want to do anything (just let their minds wander) was not taken into account for this work. It is certain that future users might wish to interrupt their NDRAs and continue with them later on, but there will be cases when users merely wish to activate the automation in order to conduct an NDRA [9], and interruptions might not be possible or accepted on some occasions. This kind of situation was simulated using this strict study design so as to provide an initial insight into these specific use cases.
Consequently, by presenting information about the availability period, the activation rate of the automated driving function might decrease, especially when users know that the coming availability period and hence the activation would not satisfy their needs. This behavior adaptation might avoid user frustration, since their expectations and mental models of the automation’s capabilities would be adapted in real time during the ride for each availability period. This adaptation might improve the usefulness of the system and therefore increase activation frequency in the longer term. Thus, due to the constant transparency provided by giving further information, the effects on acceptance found in this study might be stable over time.
Future research should investigate whether these effects can be replicated in more natural study designs, where participants can conduct NDRAs they actually enjoy and with more realistic availability periods. Furthermore, longitudinal studies investigating whether the information before activating improves subjective ratings of the system in the long term and therefore ensuring continuance of use should be conducted.
One aspect car developers will face when it comes to displaying information about availability durations will be the question of how to compute the time left and how reliable this information will be. If the displayed time is not correct, this might lead to reversed effects on acceptance. This issue should be considered in future research.

4.2. The Manner of Providing Information

The manner of providing information showed no effect on subjective rating in this study and did not improve perceived workload. This might be explained by the fact that many participants stated they did not recognize the difference between TB and TBP. Maybe the participants were focused on their task of activating and watching videos and then taking back control, such that they did not concentrate on the wording but on the time available. For those participants who did recognize the difference, it was not clear if this way of presenting information is desirable, as this seems to depend on personal preference. Another reason for the absence of effects might be that the concepts only differed slightly. Maybe people would have rated the personal way of providing information better if the automation had been represented by a human-like visualized agent, or if it had been accompanied by speech output. We, however, decided only to manipulate the wording. Otherwise, it would have not been possible to conclude whether the potential effect was induced by the personal way of presenting the information or by any visualization or speech output. Further research should investigate how to manipulate the manner of presenting information to make the difference more noticeable and if this might have positive effects. We do not conclude that the way of presenting information on automation is irrelevant, since other studies have shown that inducing anthropomorphism can have great effects in both positive and negative directions [38,39,40,52].
Moreover, some of the participants considered the personal approach to be better, while others stated not to like this way of information presentation. Hence, individual preferences could play a substantial role regarding the effects of the manner of providing information.

4.3. Further Limitations

A general limitation of this work is the rather unnatural study design. We attempted to investigate the effect of presenting information on the availability duration before activation and how this might have influenced the subjective rating of the system and the activation behavior. Therefore, we focused on the use case when users might only activate automation to conduct a specific use case. Consequently, the results found in this work cannot be generalized for situations when users do not wish to conduct a specific task.
Furthermore, due to the short availability periods needed to test the effect we focused on, results are hard to generalize. Thus, the results should be validated with longer and more realistic periods. Another limitation comes from the setting. As the study took place in a driving simulator, people might not have acted as they would have in real traffic or when not under investigation. Additionally, the NDRAs were dictated, and therefore participants did not experience how it felt to be forced to interrupt a task one might really wish to complete.
The definition of the “purposefulness” of activation behavior was based on our own considerations. When an NDRA was feasible within an availability period, activation was considered to be purposeful. If no NDRA was feasible, activation was not considered to be purposeful, as the period of automated driving was neither long enough to conduct a task nor to relax. This measure is considered adequate for this study and for all use cases where users wish to conduct a specific task without interruption. Nonetheless, purposefulness serves as a kind of performance measure that cannot be generalized for all situations in real traffic and therefore should be investigated and validated in future research.

5. Conclusions

This work shows that presenting information on the availability period of automated driving functions before the automation is activated can improve the subjective ratings for the system. By displaying this information, usability and acceptance increased, which could have resulted from enhanced transparency and hence greater fit of users’ mental models and actual system capabilities. Workload tended to be decreased, which could be explained by the fact that users did not need to activate the automation when the availability duration was too short for a NDRA and consequently experienced less transitions. The purposefulness of activation behavior increased by displaying the availability duration before activation, as users were able to know if an activation would help them conduct an NDRA or not. Coming from a human-centered approach, questions about users’ reasons for activation should be asked in addition to how an automated driving function could help them to achieve their aims. Displaying information on automation before activation is a first step in this direction.
The manner of presenting information on automation had no effect in this study; however, we suggest future research be carried out in order to look deeper into this topic, as literature shows that especially anthropomorphism can have positive effects on human–machine interaction.

Author Contributions

Conceptualization, S.D., M.P. and K.B.; methodology, S.D.; formal analysis, S.D.; investigation, S.D.; data curation, S.D.; writing—original draft preparation, S.D.; writing—review and editing, S.D., M.P. and K.B.; visualization, S.D.; supervision, S.D., M.P. and K.B. All authors have read and agreed to the published version of the manuscript.

Funding

This research was funded by AUDI AG.

Conflicts of Interest

The authors declare no conflict of interest.

References

  1. SAE Internation. J3016: Taxonomy and Definitions for Terms Related to Driving Automation Systems for On-Road Motor Vehicles. 2018. Available online: https://www.sae.org/standards/content/j3016_201806/ (accessed on 17 January 2020).
  2. Lu, Z.; Happee, R.; Cabrall, C.D.D.; Kyriakidis, M.; de Winter, J.C.F. Human factors of transitions in automated driving: A general framework and literature survey. Trans. Res. Part F Traffic Psychol. Behav. 2016, 43, 183–198. [Google Scholar] [CrossRef] [Green Version]
  3. Holländer, K.; Pfleging, B. Preparing Drivers for Planned Control Transitions in Automated Cars. In 17th International Conference on Mobile and Ubiquitous Multimedia—MUM 2018, Proceedings of the 17th International Conference, Cairo, Egypt, 25–28 November 2018; Abdennadher, S., Alt, F., Eds.; ACM Press: New York, NY, USA, 2018; pp. 83–92. [Google Scholar]
  4. Wandtner, B.; Schömig, N.; Schmidt, G. Secondary task engagement and disengagement in the context of highly automated driving. Trans. Res. Part F Traffic Psychol. Behav. 2018, 58, 253–263. [Google Scholar] [CrossRef]
  5. Naujoks, F.; Kiesel, A.; Neukum, A. Cooperative warning systems: The impact of false and unnecessary alarms on drivers’ compliance. Accid. Anal. Prev. 2016, 97, 162–175. [Google Scholar] [CrossRef] [PubMed]
  6. Stewart, J. Drivers Wildly Overestimate What “Semiautonomous” Cars Can Do. Available online: https://bit.ly/2Ot6xFs (accessed on 17 January 2020).
  7. Walker, G.H.; Stanton, N.A.; Salmon, P. Trust in vehicle technology. IJVD 2016, 70, 157–182. [Google Scholar] [CrossRef]
  8. Körber, M.; Prasch, L.; Bengler, K. Why Do I Have to Drive Now? Post Hoc Explanations of Takeover Requests. Hum. Factors 2018, 60, 305–323. [Google Scholar] [CrossRef] [PubMed] [Green Version]
  9. Danner, S.; Pfromm, M.; Limbacher, R.; Bengler, K. Information Needs Regarding the Purposeful Activation of Automated Driving Functions: Under Review. In Proceedings of the Human Factors and Ergonomics Society Europe Chapter 2019 Annual Conference, Nantes, France, 2–4 October 2019. [Google Scholar]
  10. Ochs, M.; Pelachaud, C.; Sadek, D. An Empathic Virtual Dialog Agent to Improve Human-Machine Interaction. In Proceedings of the 7th International Joint Conference on Autonomous Agents and Multiagent Systems—Volume 1, Estoril, Portugal, 12–16 May 2008. [Google Scholar]
  11. Anderson, J.; Kalra, N.; Stanley, K.; Sorensen, P.; Samaras, C.; Oluwatola, O. Autonomous Vehicle Technology: A Guide for Policymakers; RAND Corporation: Santa Monica, CA, USA, 2016. [Google Scholar]
  12. Ellis, B.; Douglas, N.; Frost, T. Willingness to pay for driverless cars. In Australasian Transport Research Forum; Elsevier: Melbourne, Australia, 2016. [Google Scholar]
  13. Howard, D.; Dai, D. Public Perceptions of Self-Driving Cars: The Case of Berkeley, California. In Proceedings of the 93rd Annual Meeting of the Transportation Research Board, Washington, DC, USA, 12–16 January 2014; pp. 1–16. [Google Scholar]
  14. Bengler, K.; Winner, H.; Wachenfeld, W. No Human—No Cry? Automatisierungstechnik 2017, 65. [Google Scholar] [CrossRef]
  15. Weinbeer, V.; Baur, C.; Radlmayr, J.; Bill, J.; Muhr, T.; Bengler, K. Highly Automated Driving: How to Get the Driver Drowsy and How Does Drowsiness Influence Various Take-Over Aspects? In Proceedings of the 8. Tagung Fahrerassistenz, Munich, Germany, 22–23 November 2017. [Google Scholar]
  16. Körber, M.; Cingel, A.; Zimmermann, M.; Bengler, K. Vigilance Decrement and Passive Fatigue Caused by Monotony in Automated Driving. Procedia Manuf. 2015, 3, 2403–2409. [Google Scholar] [CrossRef] [Green Version]
  17. Feldhütter, A.; Segler, C.; Bengler, K. Does Shifting Between Conditionally and Partially Automated Driving Lead to a Loss of Mode Awareness? In Advances in Human Aspects of Transportation; Stanton, N.A., Ed.; Springer International Publishing: Cham, Switzerland, 2018; pp. 730–741. [Google Scholar]
  18. Pfleging, B.; Rang, M.; Broy, N. Investigating User Needs for Non-Driving-Related Activities During Automated Driving. In 15th International Conference on Mobile and Ubiquitous Multimedia—MUM ’16, Proceedings of the 15th International Conference, Rovaniemi, Finland, 12–15 December 2016; Häkkila, J., Ojala, T., Eds.; ACM Press: New York, NY, USA, 2016; pp. 91–99. [Google Scholar]
  19. Hecht, T.; Feldhütter, A.; Draeger, K.; Bengler, K. What Do You Do? An Analysis of Non-driving Related Activities During a 60 Minutes Conditionally Automated Highway Drive. In Human Interaction and Emerging Technologies; Ahram, T., Taiar, R., Colson, S., Choplin, A., Eds.; Springer International Publishing: Cham, Switzerland, 2020; pp. 28–34. [Google Scholar]
  20. Schoettle, B.; Sivak, M. A Survey of Public Opinion About Autonomous and Self-Driving Vehicles in the US, the UK and Australia. Trans. Res. Inst. 2014. [Google Scholar] [CrossRef] [Green Version]
  21. Ning, W.; Wang, X.; Qian, Y. Transition to Automated: The Interaction of Activating the In-vehicle Automated Driving System. In Design, User Experience, and Usability. Application Domains; Marcus, A., Wang, W., Eds.; Springer International Publishing: Cham, Switzerland, 2019; pp. 101–113. [Google Scholar]
  22. Forster, Y.; Hergeth, S.; Naujoks, F.; Krems, J.; Keinath, A. User Education in Automated Driving: Owner’s Manual and Interactive Tutorial Support Mental Model Formation and Human-Automation Interaction. Information 2019, 10, 143. [Google Scholar] [CrossRef] [Green Version]
  23. Beggiato, M.; Hartwich, F.; Schleinitz, K.; Krems, J.; Othersen, I.; Petermann-Stock, I. What Would Drivers Like to Know During Automated Driving? Information Needs at Different Levels of Automation. In Proceedings of the 7. Tagung Fahrerassistenz, Munich, Germany, 25–26 November 2015. [Google Scholar]
  24. Casner, S.M.; Hutchins, E.L. What Do We Tell the Drivers? Toward Minimum Driver Training Standards for Partially Automated Cars. J. Cogn. Eng. Decis. Mak. 2019, 13, 55–66. [Google Scholar] [CrossRef] [Green Version]
  25. Beggiato, M.; Krems, J.F. The evolution of mental model, trust and acceptance of adaptive cruise control in relation to initial information. Trans. Res. Part F Traffic Psychol. Behav. 2013, 18, 47–57. [Google Scholar] [CrossRef]
  26. Richardson, N.T.; Flohr, L.; Michel, B. Takeover Requests in Highly Automated Truck Driving: How Do the Amount and Type of Additional Information Influence the Driver—Automation Interaction? MTI 2018, 2, 68. [Google Scholar] [CrossRef] [Green Version]
  27. Adell, E. Driver Experience and Acceptance of Driver Support Systems. A Case of Speed Adaptation; Lund University: Lund, Sweden, 2009. [Google Scholar]
  28. Davis, F.D. Perceived Usefulness, Perceived Ease of Use, and User Acceptance of Information Technology. MIS Q. 1989, 13, 319–340. [Google Scholar] [CrossRef] [Green Version]
  29. Venkatesh, V.; Davis, F.D. A Theoretical Extension of the Technology Acceptance Model: Four Longitudinal Field Studies. Manag. Sci. 2000, 46, 186–204. [Google Scholar] [CrossRef] [Green Version]
  30. Bach, N. Mentale Modelle als Basis von Implementierungsstrategien; Deutscher Universitätsverlag: Wiesbaden, Germany, 2000. [Google Scholar]
  31. Borojeni, S.S.; Flemisch, F.; Baltzer, M.; Boll, S. Automotive UI for Controllability and Safe Transitions of Control. In 10th International Conference on Automotive User Interfaces and Interactive Vehicular Applications—AutomotiveUI ’18, Proceedings of the 10th International Conference, Toronto, ON, Canada, 23–25 September 2018; Unknown, Ed.; ACM Press: New York, NY, USA, 2018; pp. 23–29. [Google Scholar]
  32. Moser, K.S. Mentale Modelle und ihre Bedeutung: Kongintionspsychologische Grundlagen des (Miss-)Verstehens. Schriften Symb. 2003, 13, 181–205. [Google Scholar]
  33. Brave, S.; Nass, C. Emotion in Human–Computer Interaction. In Human-Computer Interaction Fundamentals; Sears, A., Jacko, J., Eds.; CRC Press: Boca Raton, FL, USA, 2009; pp. 53–68. [Google Scholar]
  34. Bhattacherjee, A. Understanding Information Systems Continuance: An Expectation-Confirmation Model. MIS Q. 2001, 25, 351–370. [Google Scholar] [CrossRef]
  35. Naujoks, F.; Forster, Y.; Wiedemann, K.; Neukum, A. Improving Usefulness of Automated Driving by Lowering Primary Task Interference through HMI Design. J. Adv. Trans. 2017, 2017, 1–12. [Google Scholar] [CrossRef] [Green Version]
  36. Stanton, N.A.; Young, M.S. A proposed psychological model of driving automation. Theor. Issues Ergon. Sci. 2000, 1, 315–331. [Google Scholar] [CrossRef] [Green Version]
  37. Rosis, F.D.; Cavalluzzi, A.; Mazzotta, I.; Novielli, N. Can Embodied Conversational Agents Induce Empathy in Users? Available online: https://www.academia.edu/794054/Can_Embodied_Conversational_Agents_Induce_Empathy_In_Users (accessed on 17 January 2020).
  38. Higashinaka, R.; Dohsaka, K.; Isozaki, H. Effects of Self-Disclosure and Empathy in Human-Computer Dialogue. In Proceedings of the 2008 IEEE Spoken Language Technology Workshop, Goa, India, 15–19 December 2008; pp. 109–112. [Google Scholar]
  39. Bickmore, T.W.; Picard, R.W. Establishing and maintaining long-term human-computer relationships. ACM Trans. Comput. Hum. Interact. 2005, 12, 293–327. [Google Scholar] [CrossRef]
  40. Hone, K. Empathic agents to reduce user frustration: The effects of varying agent characteristics. Interact. Comput. 2006, 18, 227–245. [Google Scholar] [CrossRef]
  41. Häuslschmid, R.; von Bülow, M.; Pfleging, B.; Butz, A. Supporting Trust in Autonomous Driving. In 22nd International Conference on Intelligent User Interfaces—IUI ’17, Proceedings of the 22nd International Conference, Limassol, Cyprus, 13–16 March 2017; Papadopoulos, G.A., Kuflik, T., Chen, F., Duarte, C., Fu, W.-T., Eds.; ACM Press: New York, NY, USA, 2017; pp. 319–329. [Google Scholar]
  42. Reeves, B.; Nass, C.I. The Media Equation. How People Treat Computers, Televisions, and New Media Like Real People and Places, 2nd ed.; CSLI Publisher: Stanford, CA, USA, 1997. [Google Scholar]
  43. Brown, T. Design Thinking. Haward Bus. Rev. 2008, 86, 84. [Google Scholar]
  44. Schallmo, D.R.A. Design Thinking Erfolgreich Anwenden. So Entwickeln Sie in 7 Phasen Kundenorientierte Produkte und Dienstleistungen; Springer Fachmedien Wiesbaden: Wiesbaden, Germany, 2017. [Google Scholar]
  45. Van der Laan, J.D.; Heino, A.; de Waard, D. A simple procedure for the assessment of acceptance of advanced transport telematics. Trans. Res. Part C Emerg. Technol. 1997, 5, 1–10. [Google Scholar] [CrossRef]
  46. Brooke, J. SUS-A quick and dirty usability scale. Usability Eval. Ind. 1996, 189, 4–7. [Google Scholar]
  47. Hart, S.G.; Staveland, L.E. Development of NASA-TLX (Task Load Index): Results of Empirical and Theoretical Research. In Human Mental Workload; Elsevier: Amsterdam, The Netherlands, 1988; pp. 139–183. [Google Scholar]
  48. Carifio, J.; Perla, R. Resolving the 50-year debate around using and misusing Likert scales. Med. Educ. 2008, 42, 1150–1152. [Google Scholar] [CrossRef]
  49. Blanca, M.J.; Alarcón, R.; Arnau, J.; Bono, R.; Bendayan, R. Non-normal data: Is ANOVA still a valid option? Psicothema 2017, 29, 552–557. [Google Scholar] [CrossRef]
  50. Butakov, V.; Ioannou, P. Driving Autopilot with Personalization Feature for Improved Safety and Comfort. In Proceedings of the 2015 IEEE 18th International Conference on Intelligent Transportation Systems—(ITSC 2015), Gran Canaria, Spain, 15–18 September 2015; pp. 387–393. [Google Scholar]
  51. Ghazizadeh, M.; Lee, J.D.; Boyle, L.N. Extending the Technology Acceptance Model to assess automation. Cogn. Tech. Work 2012, 14, 39–49. [Google Scholar] [CrossRef]
  52. Braun, M.; Schubert, J.; Pfleging, B.; Alt, F. Improving Driver Emotions with Affective Strategies. MTI 2019, 3, 21. [Google Scholar] [CrossRef] [Green Version]
Figure 1. Expanded technology acceptance model (TAM) based on Venkatesh and Davis [28].
Information 11 00054 g001
Figure 2. Study design with within and between factors.
Information 11 00054 g002
Figure 3. Procedure of the study with an exemplary test drive. Periods without available automation are grey; periods with available automation are blue.
Information 11 00054 g003
Figure 4. Static driving simulator used for this study.
Information 11 00054 g004
Figure 5. Interaction diagrams for acceptance, usability, workload, and purposefulness of activation behavior.
Information 11 00054 g005
Table 1. Different information displayed in the Human–Machine Interface (HMI) concepts.
Baseline ConceptTime before Activation ConceptTime before Activation Plus Personal Approach Concept
Automation availablePop-up + icon displaying availabilityPop-up + icon displaying availability + time bar and countdown displaying availability durationPop-up with different wording + icon displaying availability + time bar and countdown displaying availability duration
Request to intervene (RtI)Request to intervene + countdownRequest to intervene + countdownRequest to intervene with different wording + countdown
Table 2. Means and standard deviations M(SD) for acceptance, usability, workload, and purposefulness of activation behavior.
BLTBTBP
AcceptancePositive Condition0.69 (0.94)0.57 (1.04)1.05 (0.50)1.11 (0.46)0.92 (0.52)1.04 (0.46)
Negative Condition0.45 (1.14)1.17 (0.43)1.15 (0.39)
UsabilityPositive Condition67.66 (22.37)66.59 (21.00)78.75 (11.97)80.23 (11.72)79.38 (15.69)79.32 (14.57)
Negative Condition65.59 (20.26)81.62 (11.66)79.26 (13.91)
WorkloadPositive Condition5.56 (3.51)6.97 (4.16)5.18 (2.67)5.91 (3.23)4.31 (3.10)5.69 (3.47)
Negative Condition8.09 (4.44)6.64 (3.44)6.89 (3.46)
Purposefulness of activation behaviorPositive Condition58.34% (12.17)44.44% (17.01)76.04% (19.21)74.24% (21.69)84.38% (14.23)81.82% (20.98)
Negative Condition31.37% (8.08)72.55% (24.25)79.41% (26.04)
BL: baseline concept; TB: time before activation; TPB: time before activation plus personal approach.
Table 3. p-Values for Wilcoxon tests for purposefulness of activation behavior.
Mean Differencep
BL—PositiveTB—Positive17.700.009 1
TBP—Positive26.040.001 1
BL—NegativeTB—Negative41.180.001 1
TBP—Negative48,040.000 1
1 Test significant on adjusted alpha-level α* = 0.0125.

