Graph Convolutional Neural Network for a Pharmacy Cross-Selling Recommender System
by
 , ,
, ,
Franz Hell
1,*,† ,
,
Yasser Taha
1,† ,
,
Gereon Hinz
1,*,
Sabine Heibei
2,
Harald Müller
2 and
Alois Knoll
3 1
STTech GmbH, 80939 Munich, Germany
2
Pharmatechnik, 82319 Starnberg, Germany
3
Munich School of Robotics and Machine Intelligence, Technical University of Munich, 80333 Munich, Germany
*
Authors to whom correspondence should be addressed.
†
These authors contributed equally to this work.
Information 2020, 11(11), 525; https://doi.org/10.3390/info11110525
Submission received: 29 September 2020
/
Revised: 29 October 2020
/
Accepted: 8 November 2020
/
Published: 11 November 2020
(This article belongs to the Special Issue Information Retrieval and Social Media Mining)
Abstract
:Recent advancements in deep neural networks for graph-structured data have led to state-of-the-art performance in recommender system benchmarks. Adapting these methods to pharmacy product cross-selling recommendation tasks with a million products and hundreds of millions of sales remains a challenge, due to the intricate medical and legal properties of pharmaceutical data. To tackle this challenge, we developed a graph convolutional network (GCN) algorithm called PharmaSage, which uses graph convolutions to generate embeddings for pharmacy products, which are then used in a downstream recommendation task. In the underlying graph, we incorporate both cross-sales information from the sales transaction within the graph structure, as well as product information as node features. Via modifications to the sampling involved in the network optimization process, we address a common phenomenon in recommender systems, the so-called popularity bias: popular products are frequently recommended, while less popular items are often neglected and recommended seldomly or not at all. We deployed PharmaSage using real-world sales data and trained it on 700,000 articles represented as nodes in a graph with edges between nodes representing approximately 100 million sales transactions. By exploiting the pharmaceutical product properties, such as their indications, ingredients, and adverse effects, and combining these with large sales histories, we achieved better results than with a purely statistics based approach. To our knowledge, this is the first application of deep graph embeddings for pharmacy product cross-selling recommendation at this scale to date.
1. Introduction
Deep learning algorithms play an increasingly important role in recommender systems. In recent years, new deep learning architectures known as graph convolutional networks (GCNs) that can learn from graph-structured data [1,2,3,4] were introduced and applied to recommendation applications. The basic principle behind GCNs is to use neural networks to learn how to iteratively aggregate and transform feature information from a local graph neighborhood to obtain a final representation of a given node, called the “embedding”. This way, GCNs can incorporate both feature information, as well as the graph structure. These methods can be leveraged to distill useful low-dimensional embeddings of input data such as images, text, molecules, or individual users [5,6,7,8]. These low-dimensional embeddings then can be used in downstream tasks such as recommendation applications, where they can complement or even replace traditional recommendation algorithms, such as collaborative filtering. GCN based methods have set a new standard on countless recommender system benchmarks [1] and are now being used in real-world production environments such as Pinterest.
1.1. Present Work
The current state of cross-selling in pharmacies relies heavily on expert knowledge, which is typically provided by salespeople interacting directly with customers. The feedback loop for improving the knowledge about possible cross-sales is therefore very localized, with a very poor distribution of experience gained. Our recommender system has the goal of substantially improving the collection and distribution of general knowledge about possible cross-sales to pharmacy businesses, while taking into account the restrictions explained below. The task of our system is to recommend pharmaceutical products that are good cross-sales for a given pharmaceutical product. A good recommendation for a given query for example is an over-the-counter drug that is used for complementary therapy that the query product is intended for or helps with additional symptoms that the query product indications are associated with or a product that helps alleviate possible adverse effects of the query product. As sales of medical products are highly regulated in all countries, prescription medications can only be sold if prescribed by a physician, and hence are not legitimate cross-selling items.
The prescription pain killer medicine diclofenac is associated with the possible adverse reaction of increases in gastric acid, when taken for a long period of time. Pantoprazole, a proton-pump-inhibitor, can help alleviate this adverse effect by prohibiting excess production of stomach acid. Other good recommendations for diclofenac are additional gels for the treatment of blunt injuries such as contusions or sports injuries for which diclofenac is often prescribed, which mitigate swelling and additionally help in local pain therapy.
The setting for our recommendation system and experimental evaluation is the European Union, where the GDPR forbids, among other things, the processing of medical data for pure sales purposes if these data can be linked to specific persons, even if they are pseudonymized, as such information could allow for an individual data subject to be singled out and linked across different datasets. Traditional recommendation methods like collaborative filtering or content based approaches all require a user history (either user ratings or user-article interaction histories with information about the articles) for computing recommendations. A pharmacy cross-selling recommender system however is restricted from using the purchase history information. All our input data are therefore completely anonymized, and the only historical information that can be exploited is the co-occurrence of articles in sales transactions. The second data source we use is the description of indications, active ingredients, and adverse effects for each article.
This paper describes the main challenges when applying the idea of a recommender system based on graph convolutional networks to pharmaceutical product cross-selling recommendations, given the above-mentioned restrictions. The first challenge is to devise a recommendation system based on product feature information and sales data that solely represents which products have been sold together with no information about customer product relations. To address this challenge, we construct a graph representation of pharmacy sales and product data and employ a graph neural network to learn product embeddings, which can be used for a downstream recommendation task. We describe how we chose to encode this information into a graph structure by representing pharmaceutical products as nodes, their features as node features, and cross-sales-statistics as node-node edges.
We also describe the optimization goal of the graph neural network training process with respect to these data. We chose to use a semi-supervised training scheme by utilizing the triplet loss to optimize the network parameters. The definition of positive and negative samples is a key decision when using triplet loss in optimization. Here, we describe how we selected positive and negative samples based on cross-selling and feature information present in the graph.
A major problem when using sales statistics is the distribution of the sales data, which often shows that popular articles have a high probability of being sold, while the so-called long tail or distant tail [9] contains articles that have a low overall sales probability. This popularity bias also influences “cross-selling statistics”, meaning that products that are sold often also dominate cross-selling statistics, even when they are not particularly related to the product with which they are sold. Here, we describe how we counteract this bias with a re-ranking approach based on probability theory and how we additionally use feature information in a hybrid sampling approach.
Finally, we describe how we evaluate the results of the algorithm by expert review of a selected segment of the generated cross-selling recommendations. In particular, we compare the results to purely statistics based cross-selling recommendations computed from the input dataset.
1.2. Related Work
1.2.1. Pharmaceutical Product Cross-Sales Recommendations
A study by Rutter et al. [10] interviewed sixteen pharmacists and found that pharmacists relied mostly on personal judgment augmented by patient feedback to make product recommendations. Another study examining the factors affecting pharmacists’ recommendations of complementary medicines [11] also reported that recommendations are made based on personal experience and education and concluded that in order to encourage the informed use of complementary medicines in pharmacies, there is a need for the development of accessible, quality resources. A study investigating the community pharmacists’ recommendations for alternative natural products for stress in Melbourne reported that out of 94 pharmacies, twenty-five provided the customer with an inappropriate product and concluded that there is a need to develop guidelines for pharmacists to make evidence based decisions in recommending complementary and alternative medications [12]. A study investigating a recommender system for newly marketed pharmaceutical drugs developed an adverse drug reactions label prediction component, which emits, for a given prescription, a set of drugs that should be avoided as they will induce adverse drug reactions if taken together with the prescription [13]. Zhang et al. [14] proposed a cloud-assisted drug recommendation system for online pharmacies to recommend users the top-N related medicines according to the symptoms. In their system, they first clustered the drugs into several groups according to the functional description information and designed a basic personalized drug recommendation based on user collaborative filtering. In the collaborative filtering based part of their pipeline, the authors leveraged drug user ratings. In our approach, we do not have access to historical user data or user ratings, as explained above. We can base our modeling solely on raw sales data and product features. Therefore, we designed a unique approach to solve the pharmaceutical product-product recommendation task based on node embeddings generated by a graph neural network that can leverage sales data, as well as product features without the need for customer histories or user ratings.
1.2.2. Graph Convolutional Neural Networks and Recommender Systems
Conceptually, our approach is related to previous node embedding algorithms and contemporary advancements in the application of convolutional neural networks to graph-structured data. The core idea behind node embedding methods is to create useful low-dimensional vector representations of high-dimensional information about a node in the graph, including the node’s (local) graph neighborhood. The use of low-dimensional vector embeddings as feature inputs for a wide variety of machine learning tasks such as classification, prediction, clustering, and recommendation tasks has been proven to be valuable [4,15,16]. The original work of [17], which introduced a variant of graph convolutions that were based on spectral graph theory, was followed by several authors, proposing improvements and extensions [1,2,3,4,7,15,18,19,20,21]. Early approaches to generating node embeddings, such as the GCN introduced by [2], were transductive and limited in their generalization to unseen nodes and in their scalability since those methods required operating on the Laplacian of the entire graph [22]. Later approaches operated in an inductive fashion [23]. In contrast to transductive embedding methods that are based on matrix factorization, newer approaches leverage node features and the spatial structure of each node’s local neighborhood, as well as the distribution of node features in the neighborhood [24]. Building on this, further improvements and new algorithmic features have recently been explored that ensure performance, scalability, and improved sampling [22,25,26]. These advancements led to new improved performance on benchmarks such as node classification, link prediction, or web-scale recommendation tasks, as well as the application of those methods to areas such as drug design [1,3,7,8,18].
1.2.3. Popularity Bias
One obstacle to the effectiveness of recommender systems is the problem of popularity bias [27]. Collaborative filtering based recommenders typically emphasize popular articles (e.g., those with more sales, views, or ratings) over articles from the long tail [28] that may only be popular among a small group of customers or consumers. Although popular articles can be a good recommendation, they are also likely to be well known and are sometimes even bad recommendations, especially in the face of pharmaceutical cross-selling recommendations. Furthermore, delivering only popular articles will not enhance the discovery of newly introduced articles and will ignore good recommendations that are contained in the long tail. The idea of the long tail of article popularity and its impact on recommendation quality has been explored by some researchers [21,29,30,31,32]. In those works, the authors tried to improve the performance of the recommender system in terms of accuracy and precision, while others focused on reducing popularity bias by means of regularization [33] or re-ranking [9]. Substantial research has also been published on recommendation diversity, where the goal is to prevent recommending too many similar articles [30,31,32].
2. Methodology
2.1. Data Representation in a Graph
In order to harness the power of graph convolutional neural networks to learn product embeddings, we transform the pharmacy sales data and product information into a graph. We represent each unique pharmacy product as a node, which also contains the descriptive information of the corresponding product encoded into a multi-hot vector, which has about 15,000 entries, representing the medical indications, active ingredients, and adverse reactions of the products. The data were extracted from the main German commercial pharmaceutical database used in pharmaceutical and other software solutions for pharmacies, physicians, hospitals, and other health providers, which was provided by Pharmatechnik. Undirected weighted edges between two nodes then represent how often cross-selling occurred for each pair of products, where a “cross-selling” is defined as two products sold in the same transaction. The set of approximately 100 million transactions with information about which products were sold together was provided by Pharmatechnik, leveraging sales transactions that are documented via their pharmacy management system IXOS, which is currently being used in more than 5000 pharmacies. Before further processing, we limit the transactions on which we base our cross-selling numbers to those with two or three sold articles, which is roughly 25% of the complete set. We hypothesize that the fewer items are in one transaction, the more specifically related the sold products are to each other. These transactions together include about 700,000 different products, but also include many similar products that vary only slightly (or not at all from each) other. For example, there are multiple offerings of Aspirin 100 products from different manufacturers. For training, validation, and testing, we then randomly chose 60% of these preselected transactions to construct a training graph and 20% each to construct validation and test graphs. These graphs act as the input to the model training and validation stage. However, the final model that is used for inference is then trained on all the included sales transactions. In model training, we use the top ranked cross-selling articles (those with the highest edge weights with a given query) as candidates for the aggregation and optimization part of the modeling process. See the details below. Popular articles unfortunately dominate this pool of candidates. To counterbalance this so-called popularity bias, we introduce a probability theory based approach that aims at updating the edge weights of all edges in the graphs.
Probability Based Re-Ranking
In the probability based re-ranking approach (PBR), we aim to discern the residual cross-sales from the expected cross-sales. This is achieved by subtracting the expected cross-sales of one product relative to another from their actual raw cross-sales. The residual cross-sales is now the new edge weight for the directed edge between both products.
Given products A and B, we aim to compute the conditional expected cross-sales of B given A, assuming both are independent. We approximate the conditional expected cross-sales of B given A, to be:
The joint probability of A and B is conditioned on , the subset of nodes in the one hop neighborhood of A. Conditioning on quantifies how often B is sold with A relative to how often the neighbors of A are sold with A. Under the assumption of the independence of A and B, in (1) can be reformulated as:
where we compute , , and as:
is the factor representing the combination where x and y are sold together, and its value is the actual cross-selling amount between nodes x and y. To compute the conditional expected cross-sales, we first compute the cross-selling probability of A, , as the total cross-sales amount of A divided by , which is the total amount of cross-sales in the one hop neighborhood of A; that is, the total number of cross-sales of the neighbors of A, which includes all cross-sales of A’s neighbors with A. The cross-selling probability of B conditioned on the neighborhood of A, , is computed in a similar manner, by dividing the total cross-sales of B by the same factor, . We then compute the conditional expected cross-sales (1) of B given A by multiplying the conditioned expected cross-selling probability of the two products and , their joint probability in the case of independence (3), with . To compute the residual cross-selling amount of B with respect to A, the conditional expected cross-selling is deducted from the actual cross-selling of A and B (4). This difference is the new edge weight between B and A.
is the final residual cross-selling amount of B with A, and is the cross-selling amount of nodes B and A from the input data. If is positive, we assume that B is sold with A more often than expected; if is negative, we assume that B is sold less often with A than expected. Note that is computed differently from , as and are both conditioned on the one hop neighborhood of A. In the new graph, all nodes that were connected via undirected edges beforehand, therefore, now share two directed edges, expressing the residual cross-selling amount of both nodes relative to each other.
2.2. Model Architecture
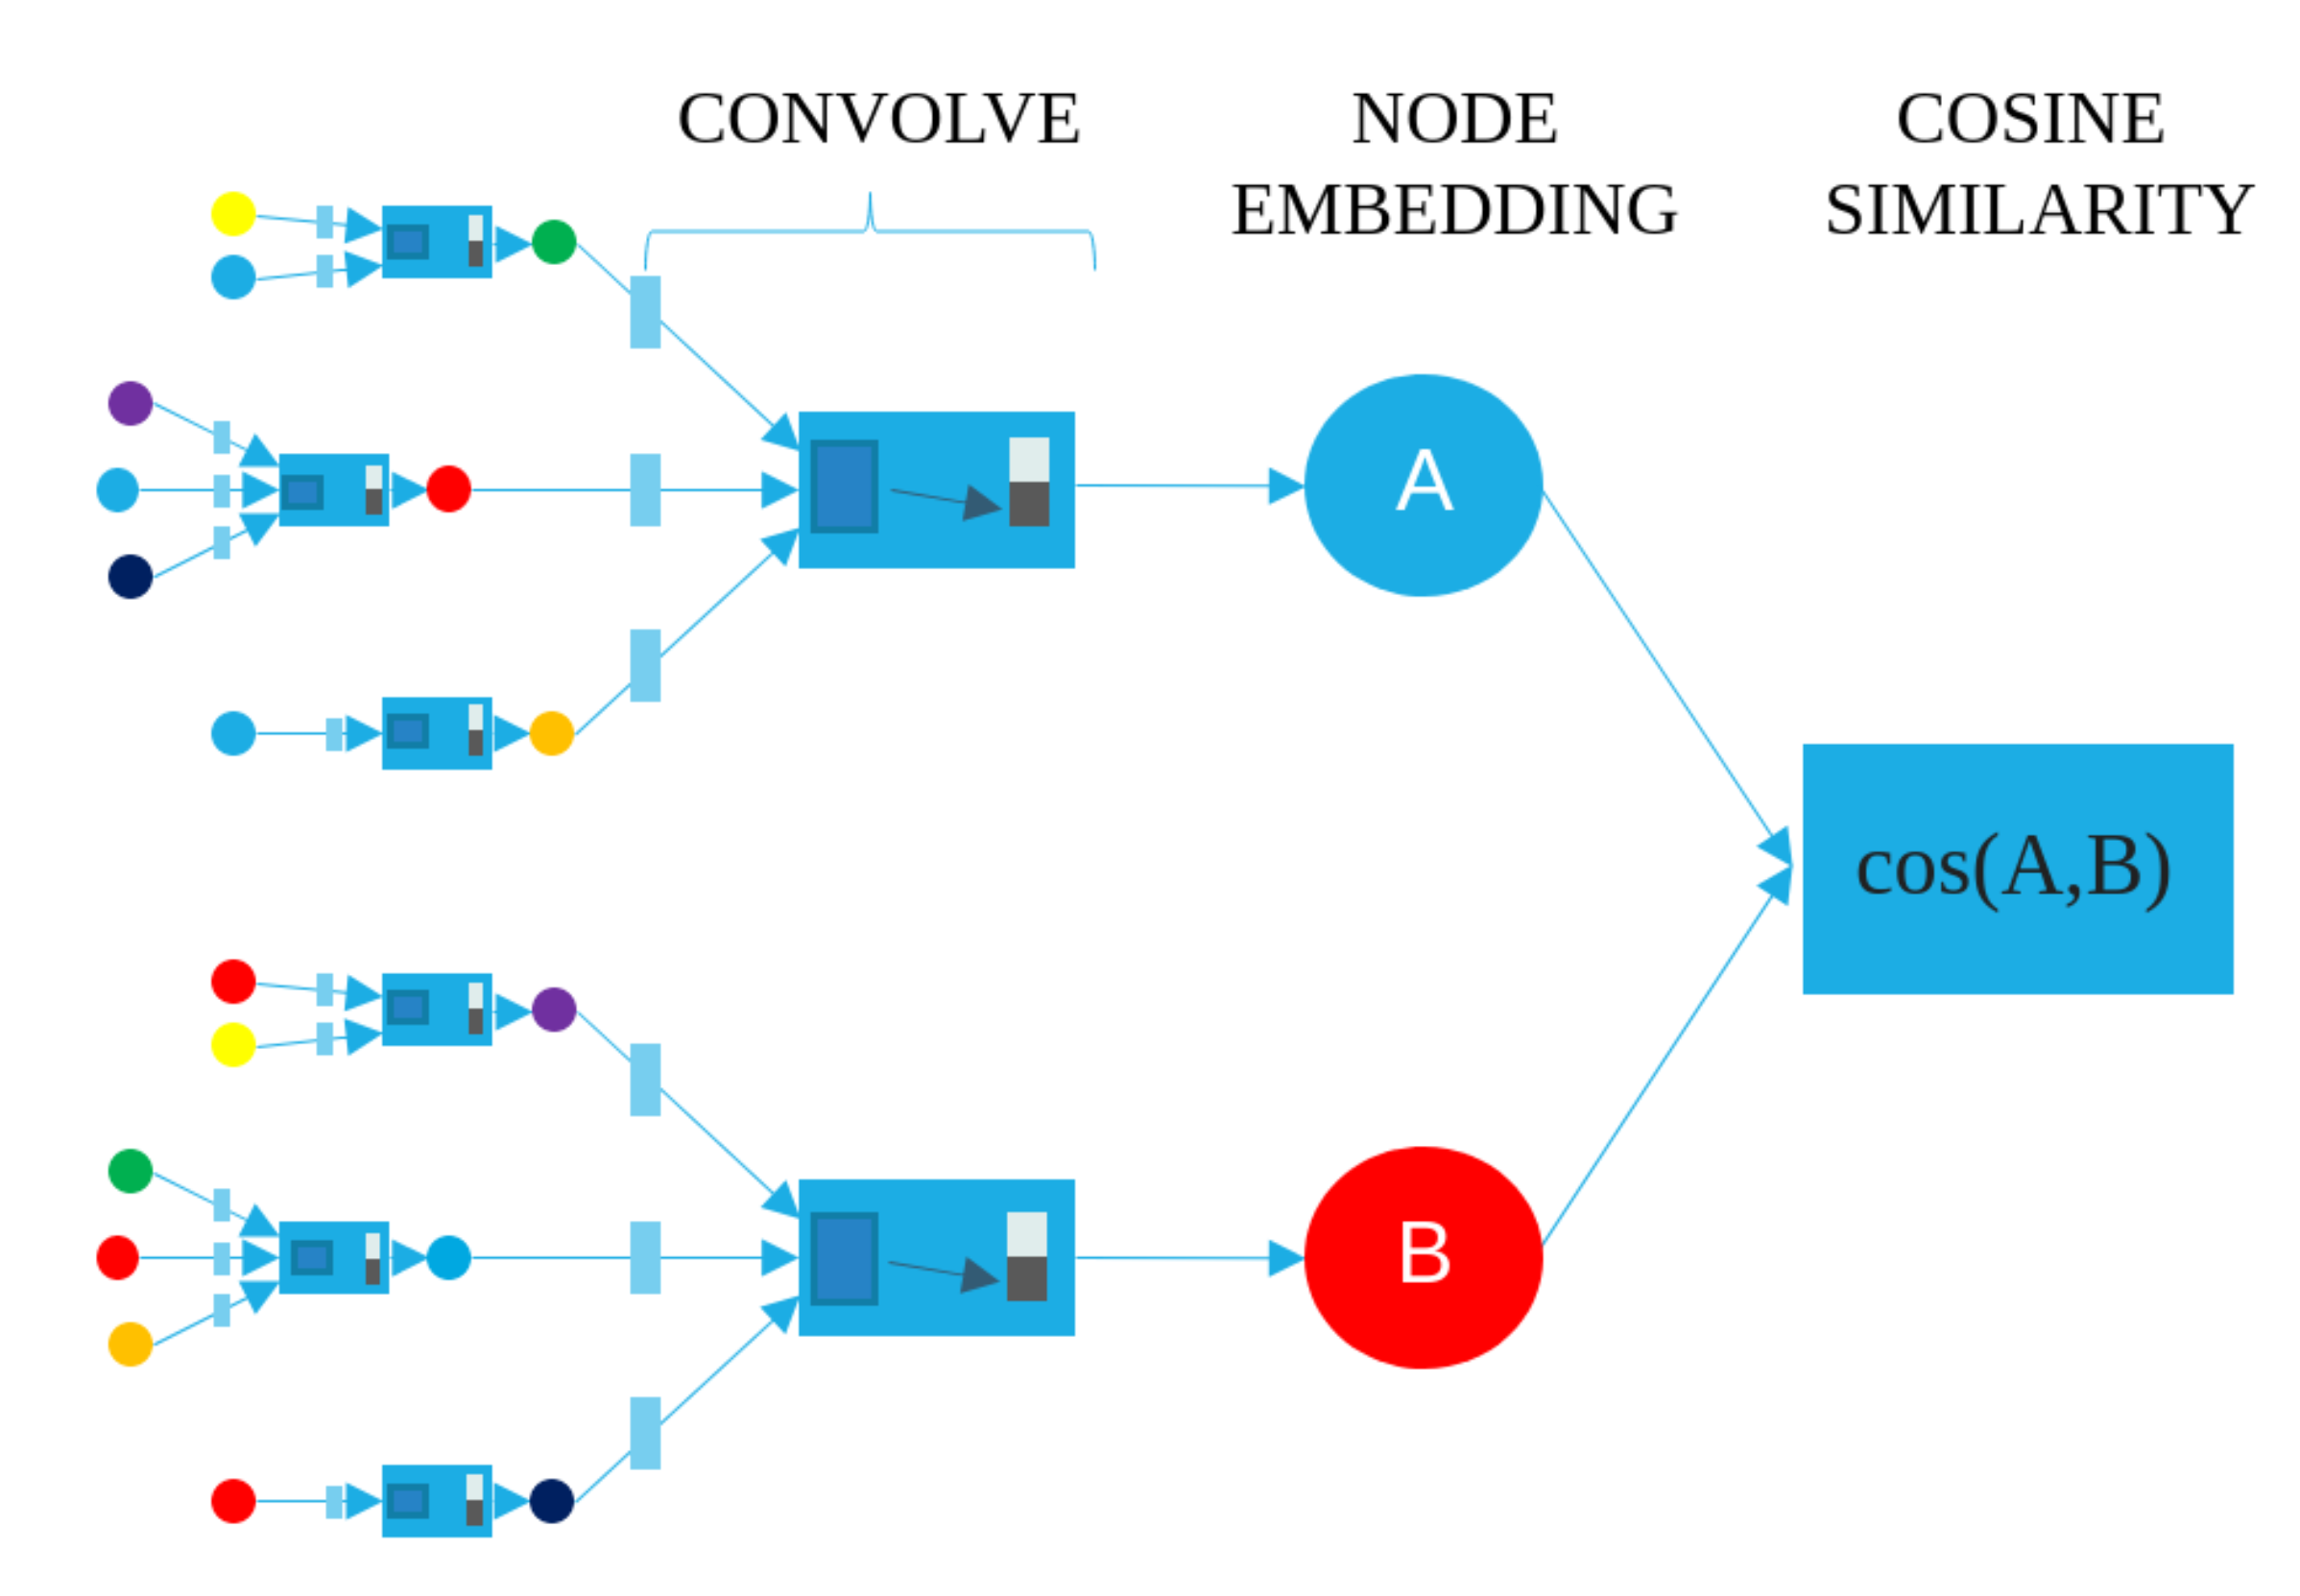
We employ a graph convolutional neural network model (Figure 1) that uses localized convolutions on aggregated neighborhood vectors to produce embeddings of products represented by graph nodes, akin to the one introduced in [24]. The basic idea is that we transform the representations of the neighbors of a given node through a dense neural network and then apply an aggregator/pooling function (a weighted sum, shown as dark blue boxes in Figure 1, the “CONVOLVE” module) on the resulting set of vectors. This aggregation step provides a vector representation of a node’s local neighborhood. We then concatenate this aggregated neighborhood vector (dark grey box) with the nodes’ current representation (light grey box) and transform the concatenated vector through another dense neural network layer. The output of the algorithm is a representation of a node, called the node embedding, that incorporates information about itself and its local graph neighborhood. Details about the algorithm can be found in [22] (Algorithm 1); the only change we made is that we aggregate the neighborhood-node information only across the “top neighbors” of a given node. The top neighbor nodes of a given query node are those with the highest edge weight among all connected nodes, representing the products that are sold more often with the query than expected. We then compute the recommendations by using these final node embeddings, as described in Section 2.4.
2.3. Model Training
For the optimization of the network parameters, we utilize the triplet loss, shown in Equation (6), which is a distance based loss function that operates on the final embedding of three input nodes: the anchor A, the positive P, which is typically from the same class as the anchor or related by some other measure, and the negative N, which is typically from a different class than the anchor.
We use the embeddings of pharmacy products represented by nodes in the graph as inputs for the triplet loss. Each node can be an anchor node A, and each has positively related nodes P and negatively related nodes N. A given pair A, P is to be related by some measure, i.e., are often bought together or are similar in feature encoding. The pair A, N is thought to be related by some other measure, i.e., are never bought together or are bought together less than expected. The goal of the training phase is to optimize the parameters of PharmaSage so that the cosine similarity of the anchor-positive pair is higher relative to the cosine similarity of the anchor-negative pair by a margin of 0.5.
2.3.1. Positive Sampling
We chose positives for a given anchor node A by randomly sampling nodes among the top neighbors of that anchor node with equal probability in each training iteration. The top ranked cross-sellers are those neighbors with the highest edge weight with the anchor, representing those products that have been sold more often with the anchor than expected. Together, they make up the positive sampling pool. To complement the edge-weight based positive sampling approach, we additionally utilize nodes that share encoding features with the anchor as possible positive samples. In this hybrid approach to positive sampling, we chose 50% of the positive samples based on the feature similarity of the anchor node relative to all other nodes and the other 50% based on edge weights representing re-ranked cross-sales. We only include products in the additional feature based positive sampling pool for a given anchor, if that product/node shares any feature with the anchor.
2.3.2. Negative Sampling
We chose negative samples among nodes not connected to the anchor node, which are never sold together with the anchor. We additionally utilized nodes with negative edge weights with the anchor as possible negative samples, as their expected cross-selling amount with the anchor is higher than the actual cross-selling. Generally, we applied semi-hard negative mining among the pool of possible negatives, as introduced in FaceNet [34], which has been widely used ever since [35,36].
2.4. Recommendation
The final embeddings that are computed by our model after training are then used to calculate recommendation scores between all products. We obtained a recommendation score bounded within the interval [0, 1] with the utilization of the cosine similarity of two vectors, sim(A, B), commonly used in information retrieval and data mining techniques [37,38]. Given the similarity scores between one query product and all other products (except prescription medications, which can only be sold if prescribed by a physician, and hence are not legitimate cross-selling recommendations), the products with the highest similarity to the query are chosen as recommendations for the query article. A diagram illustrating the high-level architecture of how recommendations are computed between articles A and B is shown in Figure 1.
2.5. System Setup, Runtime, and Validation
For our software, we used the Python framework, the networkx library for creating the graph, and the PyTorch framework for the implementation of the GCN. The network is trained on a system with an Intel Core i7 8750H, an Nvidia GeForce GTX1070 GPU, and 32GB RAM. The training takes approximately 48 h and is terminated once the triplet loss, which starts at the margin of 0.5, has reached a threshold of 0.05 for the training graph. The validation loss is at 0.092 and the test loss at 0.095 at this point. We found that, empirically, the quality of the results does not improve much beyond this point. We stopped the training of the model used for inference at the same threshold.
3. Experiments
3.1. Popularity Bias in Sales Data
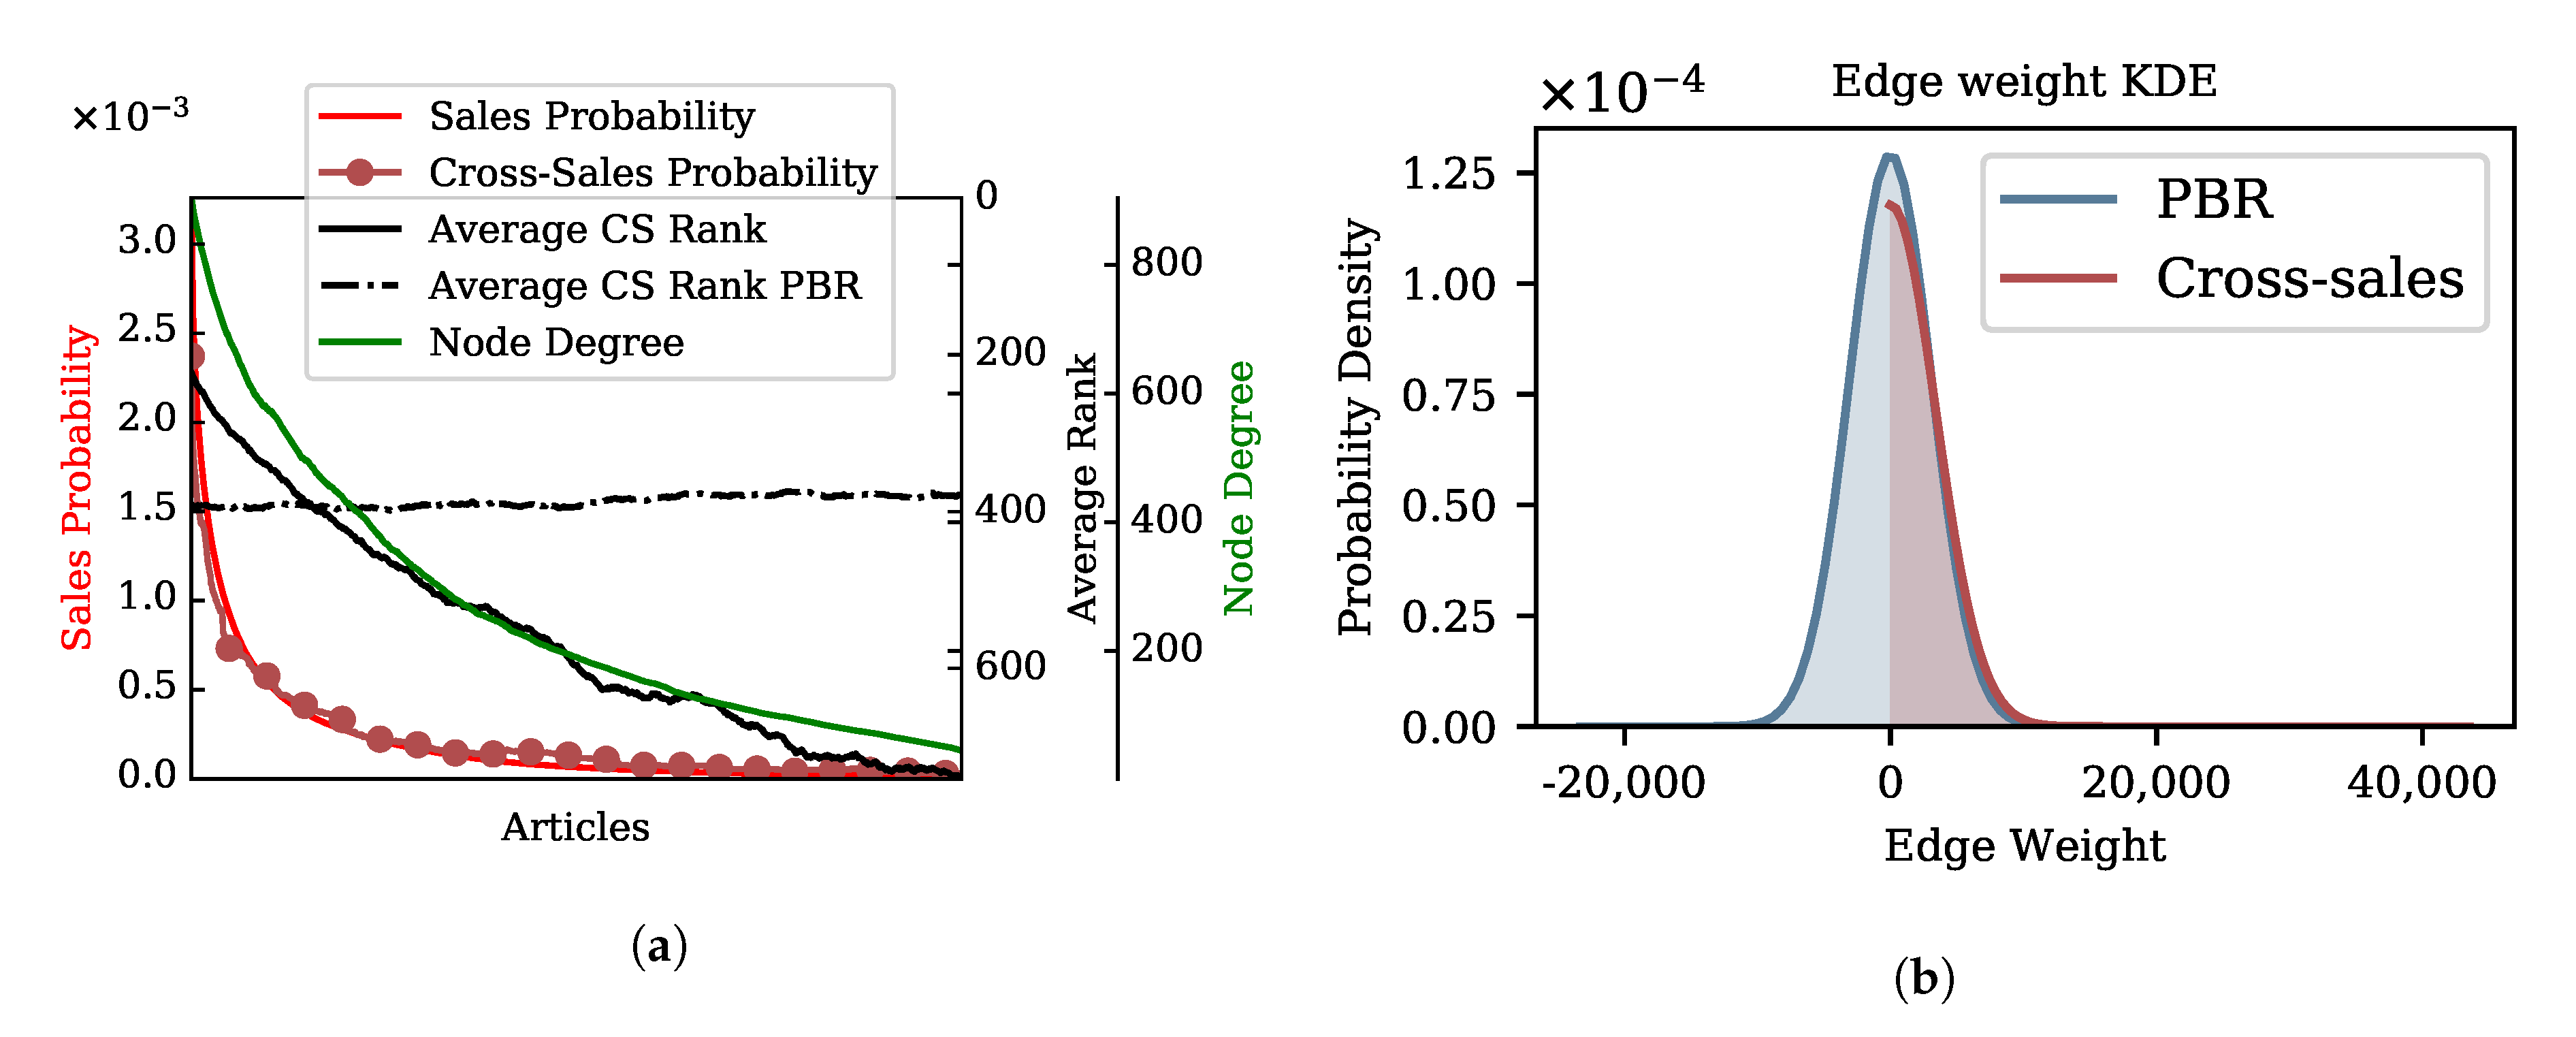
Popularity bias is a phenomenon that is visible in many data sources, including retail and online sales data. Our analysis of pharmacy sales data shows the same bias, as 2% of all products are sold equally often as the remaining 98%. It is clear in Figure 2a that those products that have a high overall sales probability also are ranked among the top neighbors on average, while unpopular articles have a proportionally lower cross-selling rank. This indicates that top-sellers are products that are also top cross-sellers.
3.1.1. The Effect of Re-Ranking on Cross-Selling Statistics
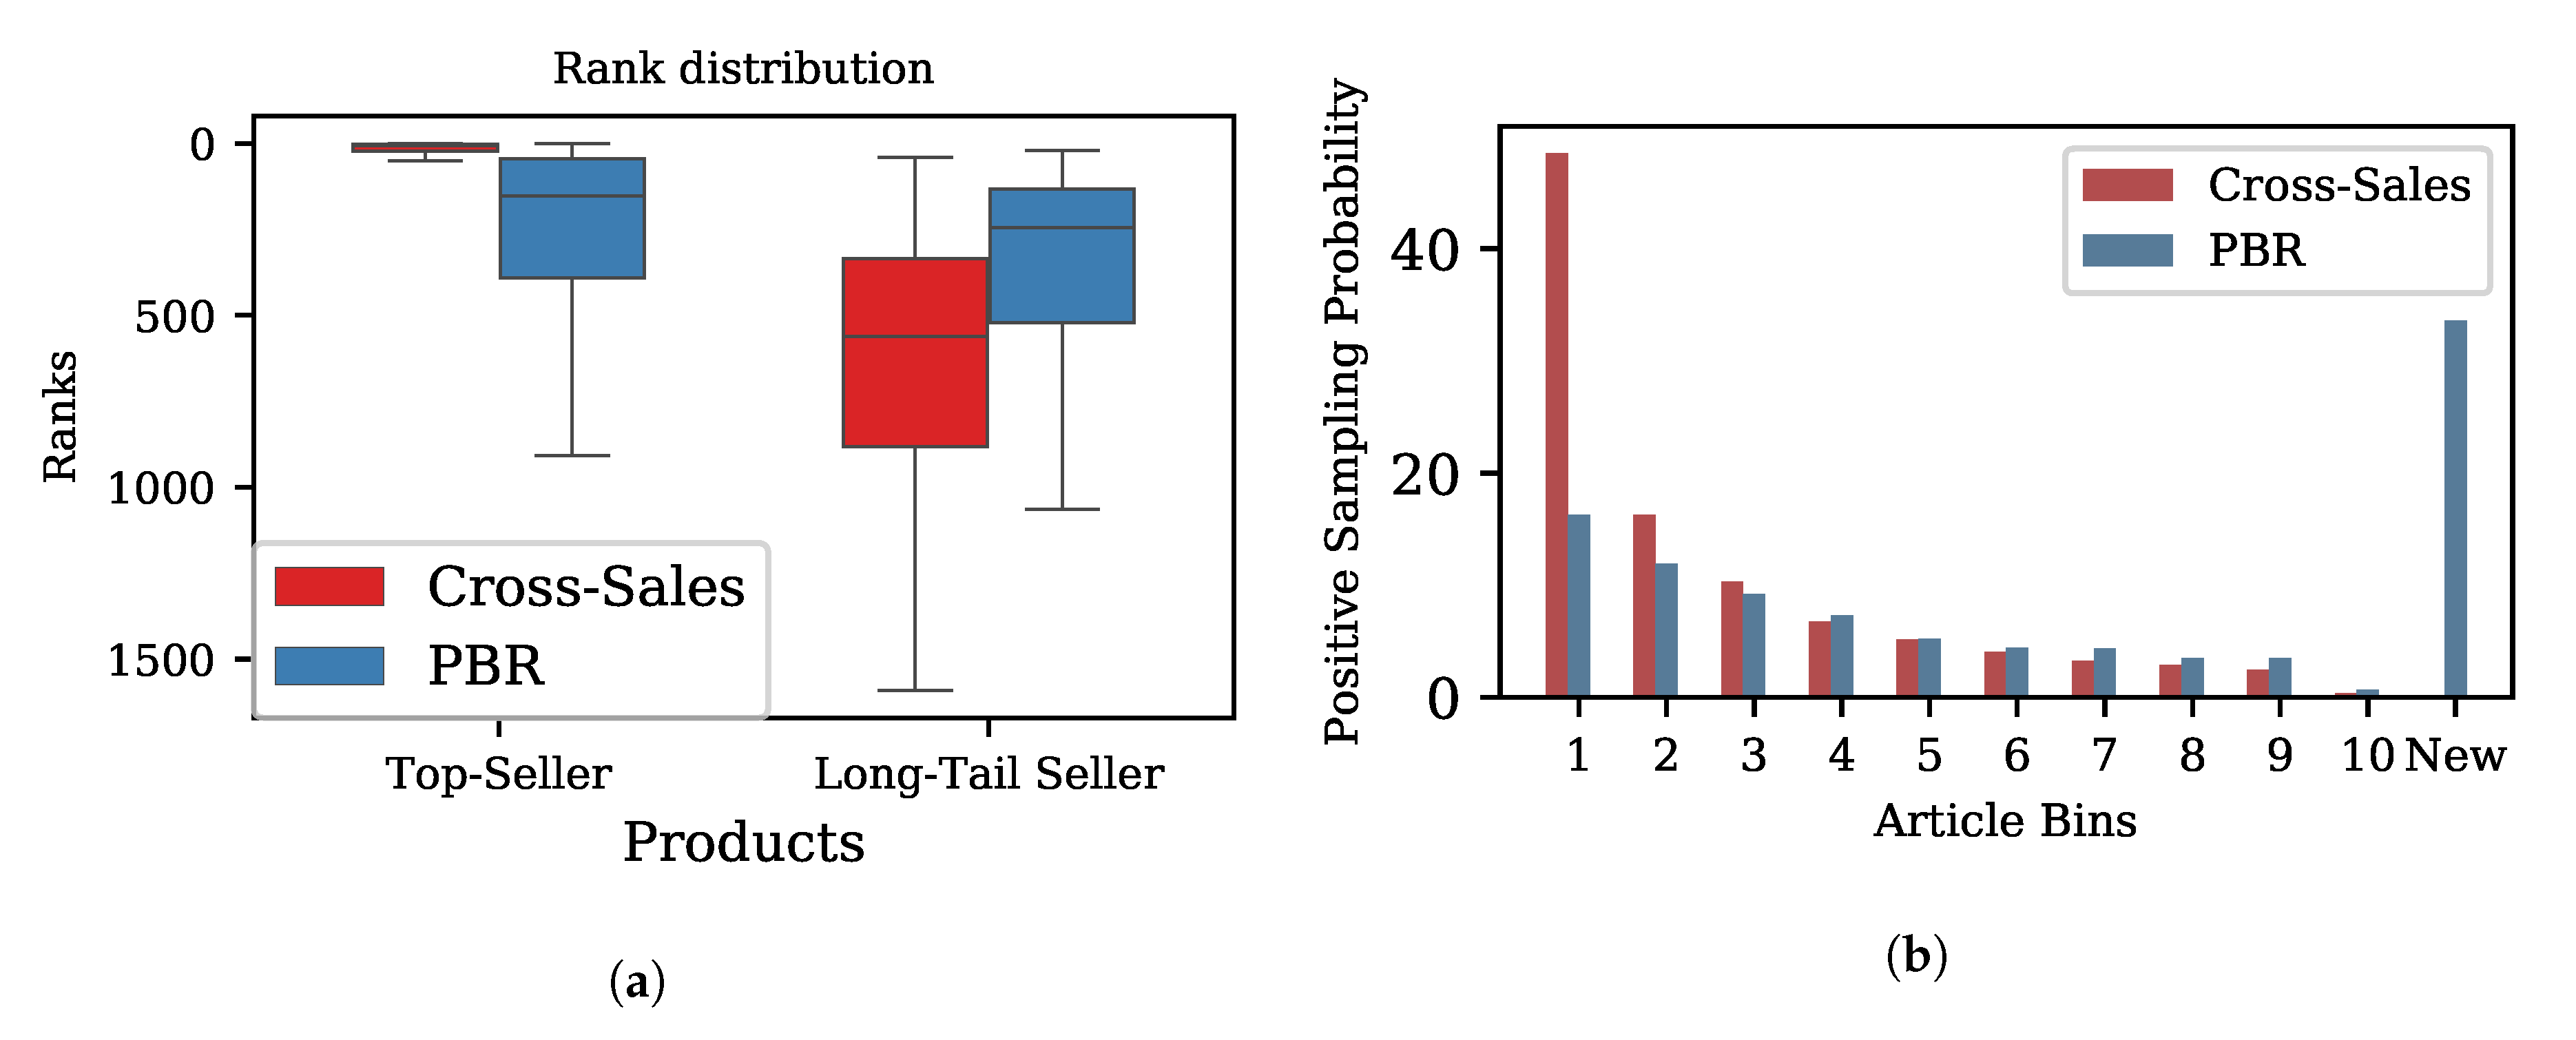
Re-ranking affects the ranking of cross-sellers. As shown in Figure 2a, the average cross-sales rank for all products was influenced by re-ranking. The analysis of the graph based on actual cross-sales shows that the average rank of products decreases proportionally to the overall sales probability of that product. In contrast, the overall rank of a product has no correlation to its overall sales probability in the PBR approach. The average rank of top sellers drops substantially based on the PBR, which is a result of two factors. First, top cross-sellers are being sold often with many other products, as reflected by the number of neighbors’ curve (node degree). Second, it is likely that they are only partly cross-sold more often than average. The same seems to be true for all other products and is reflected in the edge weight probability density after re-ranking (Figure 2b). After applying the PBR approach, the average weight across all nodes drops to 0 with a standard deviation of 308, indicating that half of the pairs are sold less often together than expected, while the other half represents genuine cross-sales. To further examine the effect of re-ranking on the distribution of ranks, Figure 3a shows two articles before and after re-ranking. Based on the actual cross-sales statistics, the median rank of the example top-seller is 7, but drops to 152 based on the PBR, respectively. The interquartile range based on the penalty re-ranking approach is 17.5 times larger than the PBR approach, which reflects a more dispersed ranking scheme. In contrast, the median rank of an example from the long tail is 562 and rises to 245 based on the PBR, with its interquartile range decreasing slightly.
3.1.2. The Effect of Re-Ranking on Positive Sampling
In order to assess the impact of the PBR on positive sampling involved in the network optimization, we evaluate how the positive sampling pool that is made up of the top neighbors of each node changes with the different approaches. The probability of being chosen among positive samples, as depicted in Figure 3b, shows that those products that dominate the positive sampling pool based on the raw cross-sales are used as positive samples significantly less often in the PBR approach. Sampling based on actual cross-sales statistics puts more emphasis on popular products, while the PBR puts less emphasis on those products, but adds more diversity to the sampling pool. Relative to the raw cross-selling statistics, the PBR introduces more diversity, with 36.6% additional products in the sampling pool.
3.2. Recommendation Quality
In order to evaluate the performance of our algorithm, we collected expert feedback on product-product recommendations for a set of 25 query products. For each recommendation generated by PharmaSage, the feedback given can have one of three values; 0 (no pharmaceutical relation to the query product), 1 (a pharmaceutical relation exists, and the product is a good recommendation for the query), or 2 (a pharmaceutical relation exists, and the product is a very good recommendation for the query). The mean across scores for the top 15 recommendations for 25 products is then used as a performance quantifier.
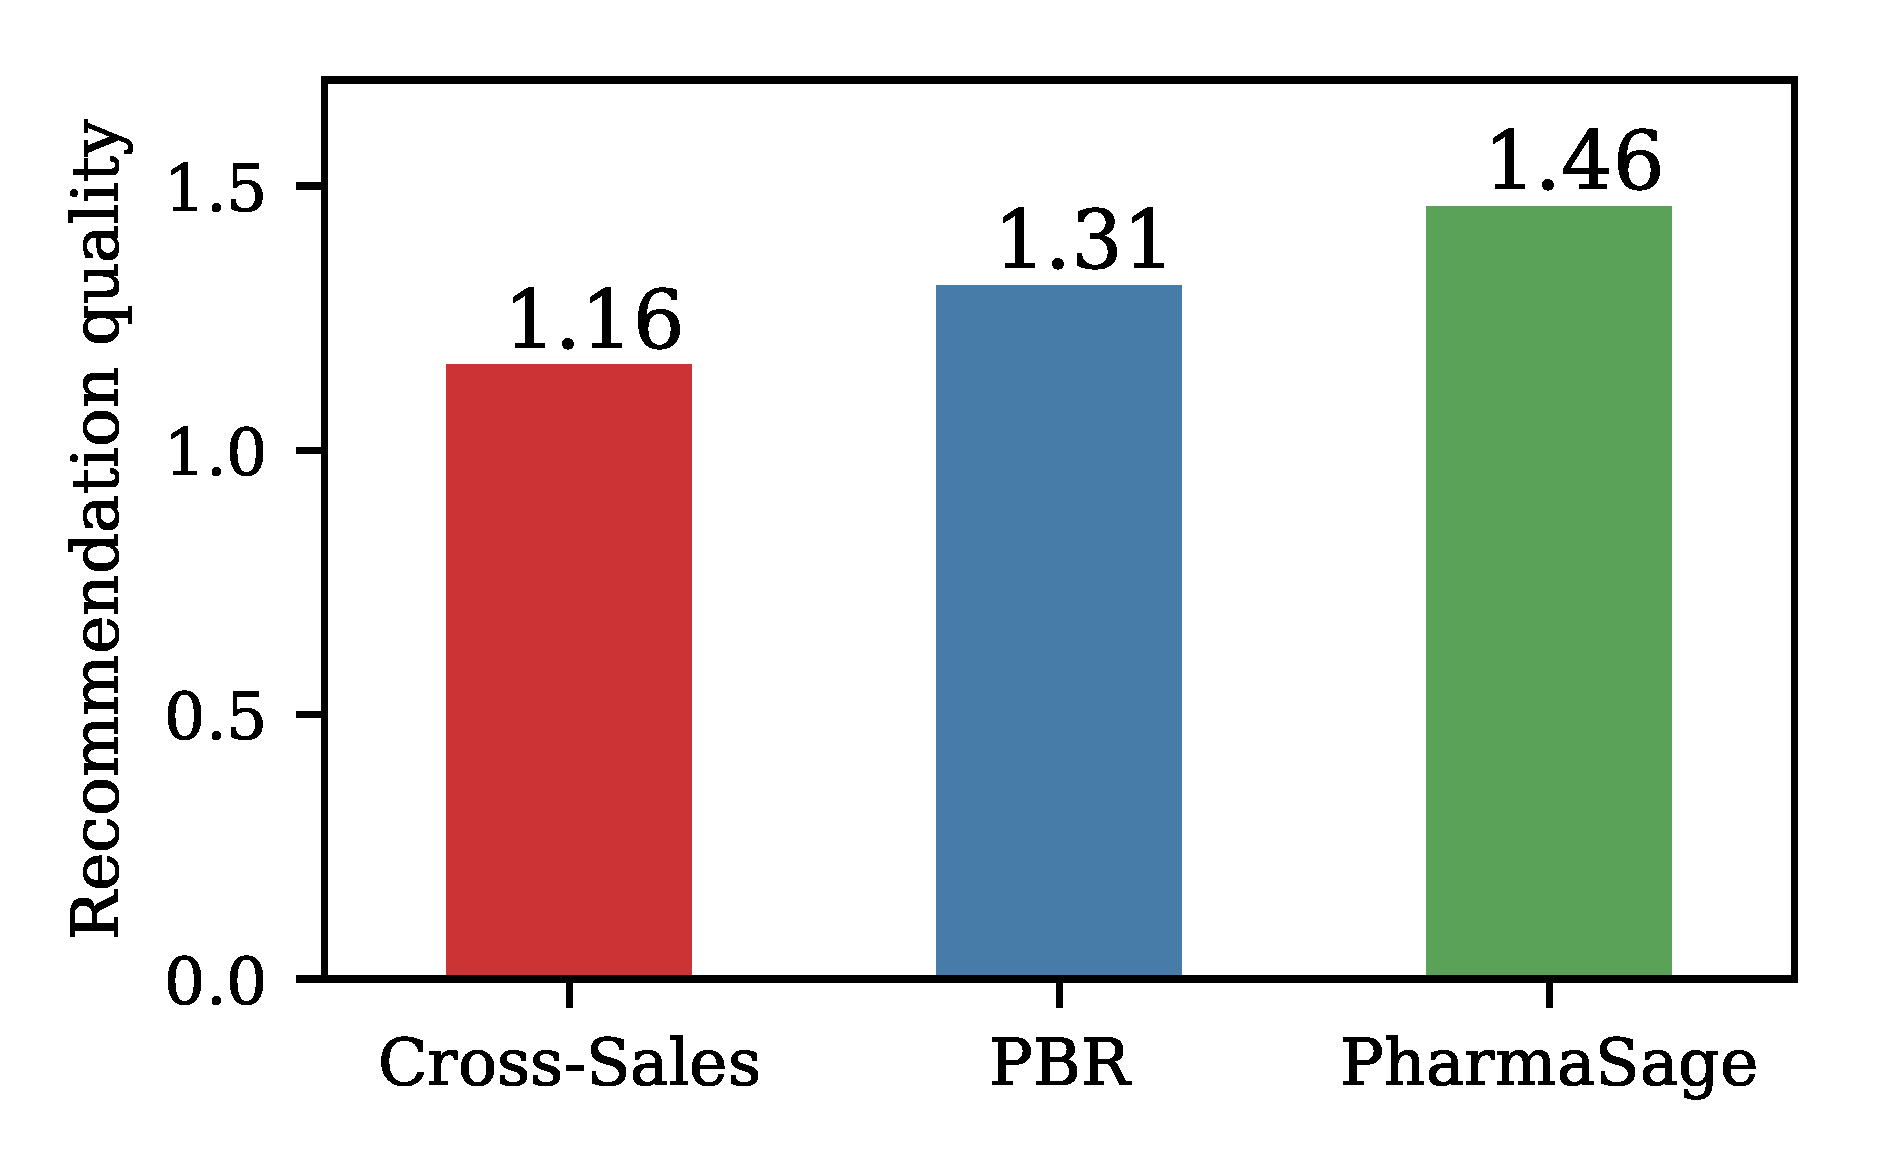
First, we compute recommendations based on the cross-selling data encoded in the graph, which can be thought of as a conventional recommendation approach akin to collaborative filtering. Products that are most often sold with the query product are chosen as recommendations. Second, we compute the recommendations based on the PBR graph. This result offers insight into what can be achieved without any additional learning. We then use the PBR graph to train the PharmaSage model. As can be seen in Figure 4, the quality of the evaluated recommendations is comparatively lower for simple cross-sales statistics based recommendations, and the quality increases in the PBR approach. The PharmaSage model that is then trained on the PBR approach introduces yet another increase in recommendation quality. Compared to approaches based solely on sales data, this model is able to learn from cross-sale information encoded in the graph edges, as well as leverage feature information encoded as node features.
In Table 1, example recommendations computed by PharmaSage, their recommendation rank, and expert feedback are shown for prednisolone, a corticosteroid. Prednisolone is used to treat a wide range of health problems including allergies, skin diseases, infections, and certain autoimmune disorders. It helps by reducing inflammation and suppressing the immune system. PharmaSage recommends additional over-the-counter medications for allergies like hay fever (rank 1, 5, Table 1) for which Prednisolone is often prescribed and stomach acid blockers to reduce the adverse effect of the active ingredient in the query article (rank 2, 4, Table 1). Calcium and vitamin D3 can both help improve bone health, which can be affected by continuous therapy with corticosteroids (rank 6, 9, Table 1). The nonsteroidal anti-inflammatory drug helps with pain and induces additional anti-inflammatory effects (rank 8, Table 1). Furthermore, an antipruritic and anti-inflammatory gel (rank 10, Table 1) is recommended, which counters symptoms associated with the main indications of prednisolone, and a nasal spray is also for additional therapy, which frees up a clogged nose, reduces the swelling of the mucous membranes, and can help treat allergic reactions of the respiratory tract (rank 3, Table 1). ASS100 (rank 7, Table 1), an anticoagulant, should not be recommended without additional medical advice; hence, the expert feedback mark is 0.
4. Conclusions
We introduced PharmaSage, a graph convolutional network for pharmacy product cross-sale recommendations. PharmaSage is the first application of graph convolutional neural networks to pharmaceutical product-product recommendation, exploiting sales statistics and pharmaceutical product features like indications, ingredients, and adverse effects. In addition, we introduced a method based on probability theory that addresses the common popularity bias problem. We showed how popularity bias is present in the pharmacies’ sales and cross-selling dataset and how it can be successfully addressed in order to increase both recommendation quality and diversity. We developed PharmaSage based on real-world pharmaceutical data and comprehensively evaluated the quality of the learned embeddings for a pharmacy product cross-sales recommendation task, demonstrating a substantial improvement in recommendation quality compared to traditional approaches that are based solely on cross-sales statistics. Our work demonstrates the positive impact that methods based on graph convolutional networks can have in pharmacy cross-selling recommender systems, and we believe that PharmaSage can be further extended to tackle other graph representation learning problems in the retail and online sales industry. A future point of interest will be to further evaluate the quality of recommendations given by PharmaSage by evaluating A/B tests against traditional recommendations given by pharmacists and how both impact cross-sales and evaluating customer feedback.
Author Contributions
Methodology, software, and validation: F.H., Y.T., G.H., and H.M.; data curation: S.H.; review, editing, and supervision: F.H., G.H., H.M., S.H. and A.K.; All authors read and agreed to the published version of the manuscript.
Funding
This research received no external funding.
Conflicts of Interest
The authors declare no conflict of interest.
References
- Hamilton, W.L.; Ying, R.; Leskovec, J. Representation learning on graphs: Methods and applications. arXiv 2017, arXiv:1709.05584. [Google Scholar]
- Kipf, T.N.; Welling, M. Semi-supervised classification with graph convolutional networks. arXiv 2016, arXiv:1609.02907. [Google Scholar]
- Monti, F.; Bronstein, M.; Bresson, X. Geometric matrix completion with recurrent multi-graph neural networks. In Proceedings of the Neural Information Processing Systems, Long Beach, CA, USA, 4–9 December 2017; pp. 3697–3707. [Google Scholar]
- van den Berg, R.; Kipf, T.N.; Welling, M. Graph convolutional matrix completion. In Proceedings of the KDD’18 Deep Learning Day, London, UK, 19–23 August 2018. [Google Scholar]
- Covington, P.; Adams, J.; Sargin, E. Deep neural networks for youtube recommendations. In Proceedings of the 10th ACM Conference on Recommender Systems, Boston, MA, USA, 15–19 September 2016; pp. 191–198. [Google Scholar]
- Van den Oord, A.; Dieleman, S.; Schrauwen, B. Deep content based music recommendation. In Proceedings of the Neural Information Processing Systems, Lake Tahoe, NV, USA, 5–10 December 2013; pp. 2643–2651. [Google Scholar]
- Zitnik, M.; Agrawal, M.; Leskovec, J. Modeling polypharmacy side effects with graph convolutional networks. Bioinformatics 2018, 34, i457–i466. [Google Scholar] [CrossRef] [PubMed] [Green Version]
- Kearnes, S.; McCloskey, K.; Berndl, M.; Pande, V.; Riley, P. Molecular graph convolutions: Moving beyond fingerprints. J. Comput. Aided Mol. Des. 2016, 30, 595–608. [Google Scholar] [CrossRef] [PubMed] [Green Version]
- Himan Abdollahpouri, R.B.; Bamshad, M. Managing popularity bias in recommender systems with personalized re-ranking. In Proceedings of the Thirty-Second International Flairs Conference, Sarasota, FL, USA, 19–22 May 2019. [Google Scholar]
- Paul Rutter, E.W. Does evidence drive pharmacist over-the-counter product recommendations? J. Eval. Clin. Pract. 2013, 20, 1365–2753. [Google Scholar]
- Sarah, E.C.; Hans, W. Factors affecting pharmacists’ recommendation of complementary medicines—A qualitative pilot study of Australian pharmacists. BMC Complement. Altern. Med. 2012, 12, 183. [Google Scholar]
- Clayton, K.; Luxford, Y.; Colaci, J.; Hasan, M.; Miltiadou, R.; Novikova, D.; Vlahopoulos, D.; Stupans, I. Community pharmacists’ recommendations for natural products for stress in Melbourne, Australia: A simulated patient study. Pharm Pract. 2020, 18, 1660. [Google Scholar] [CrossRef] [Green Version]
- Bhat, S.; Aishwarya, K. Item based Hybrid Recommender System for newly marketed pharmaceutical drugs. In Proceedings of the International Conference on Advances in Computing, Communications and Informatics, Kerala, India, 29–31 August 2013; pp. 2107–2111. [Google Scholar]
- Zhang, Y.; Zhang, D.; Hassan, M.M.; Alamri, A.; Peng, L. CADRE: Cloud-Assisted Drug Recommendation Service for Online Pharmacies. Mob. Netw. Appl. 2014, 20, 348–355. [Google Scholar] [CrossRef]
- Dai, H.; Dai, B.; Song, L. Discriminative embeddings of latent variable models for structured data. In Proceedings of the International Conference on Machine Learning, New York, NY, USA, 19–24 June 2016; pp. 2702–2711. [Google Scholar]
- Xu, K.; Hu, W.; Leskovec, J.; Jegelka, S. How powerful are graph neural networks? In Proceedings of the International Conference on Learning Representations, New Orleans, LA, USA, 6–9 May 2019. [Google Scholar]
- Bruna, J.; Zaremba, W.; Szlam, A.; LeCun, Y. Spectral networks and locally connected networks on graphs. In Proceedings of the International Conference on Learning Representations, Banff, AB, Canada, 14–16 April 2014. [Google Scholar]
- Bronstein, M.M.; Bruna, J.; LeCun, Y.; Szlam, A.; Vandergheynst, P.T. Geometric deep learning: Going beyond euclidean data. IEEE Signal Process. Mag. 2017, 34, 18–42. [Google Scholar] [CrossRef] [Green Version]
- Defferrard, M.; Bresson, X.; Vandergheynst, P. Convolutional neural networks on graphs with fast localized spectral filtering. In Proceedings of the Neural Information Processing Systems, Barcelona, Spain, 5–10 December 2016; pp. 3844–3852. [Google Scholar]
- Duvenaud, D.K.; Maclaurin, D.; Iparraguirre, J.; Bombarell, R.; Hirzel, T.; Aspuru-Guzik, A.; Adams, R.P. Convolutional networks on graphs for learning molecular fingerprints. In Proceedings of the Neural Information Processing Systems, Montreal, QC, Canada, 7–12 December 2015; pp. 2224–2232. [Google Scholar]
- You, J.; Ying, R.; Ren, X.; Hamilton, W.L.; Leskovec, J. Graphrnn: Generating realistic graphs with deep auto-regressive models. In Proceedings of the 35th International Conference on Machine Learning, Stockholm, Sweden, 10–15 July 2018. [Google Scholar]
- Ying, R.; He, R.; Chen, K.; Eksombatchai, P.; Hamilton, W.L.; Leskovec, J. Graph convolutional neural networks for web-scale recommender systems. In Proceedings of the 24th ACM SIGKDD International Conference on Knowledge Discovery & Data Mining, London, UK, 19–23 August 2018; pp. 974–983. [Google Scholar]
- Perozzi, B.; Al-Rfou, R.; Skiena, S. Deepwalk: Online learning of social representations. In Proceedings of the 20th ACM SIGKDD International Conference on Knowledge Discovery and Data Mining, New York, NY, USA, 24–27 August 2014; pp. 701–710. [Google Scholar]
- Hamilton, W.; Ying, Z.; Leskovec, J. Inductive representation learning on large graphs. In Proceedings of the Neural Information Processing Systems, Long Beach, CA, USA, 4–9 December 2017; pp. 1024–1034. [Google Scholar]
- Veličković, P.; Cucurull, G.; Casanova, A.; Romero, A.; Lio, P.; Bengio, Y. Graph attention networks. In Proceedings of the International Conference on Learning Representations, Vancouver, BC, Canada, 30 April–3 May 2018. [Google Scholar]
- Seongjun, Y.; Minbyu, J.; Raehyun, K.; Jaewoo, K.; Hyunwoo, J.K. Graph Transformer Networks. In Proceedings of the 33rd Conference on Neural Information Processing Systems, Vancouver, BC, Canada, 8–14 December 2019. [Google Scholar]
- Bellogín, A.; Castells, P.; Cantador, I. Statistical biases in Information Retrieval metrics for recommender systems. Inf. Retr. J. 2017, 20, 606–634. [Google Scholar] [CrossRef] [Green Version]
- Park, Y.-J.; Tuzhilin, A. The long tail of recommender systems and how to leverage it. In Proceedings of the 2008 ACM Conference on Recommender Systems, Lausanne, Switzerland, 23–25 October 2008; pp. 11–18. [Google Scholar]
- Brynjolfsson, E.; Hu, Y.J.; Smith, M.D. From niches to riches: Anatomy of the long tail. IEEE Signal Process. Mag. 2006, 47, 67–71. [Google Scholar]
- Zhou, T.; Kuscsik, Z.; Liu, J.-G.; Medo, M.; Wakeling, J.R.; Zhang, Y.-C. Solving the apparent diversity-accuracy dilemma of recommender systems. Proc. Natl. Acad. Sci. USA 2010, 104, 511–4515. [Google Scholar] [CrossRef] [PubMed] [Green Version]
- Castells, P.; Vargas, S.; Wang, J. Rank and Relevance in Novelty and Diversity Metrics for Recommender Systems. In Proceedings of the ACM Conference on Recommender Systems, Chicago, IL, USA, 23–27 October 2011. [Google Scholar]
- Zhang, M.; Hurley, N. Avoiding monotony: Improving the diversity of recommendation lists. In Proceedings of the 2008 ACM Conference on Recommender Systems, Lausanne, Switzerland, 23–25 October 2008; pp. 123–130. [Google Scholar]
- Abdollahpouri, H.; Burke, R.; Mobasher, B. Controlling popularity bias in learning-to-rank recommendation. In Proceedings of the Eleventh ACM Conference on Recommender Systems, Como, Italy, 27–31 August 2017; pp. 42–46. [Google Scholar]
- Schroff, F.; Kalenichenko, D.; Philbin, J. Facenet: A unified embedding for face recognition and clustering. In Proceedings of the IEEE Conference on Computer Vision and Pattern Recognition, Boston, MA, USA, 7–12 June 2015; pp. 815–823. [Google Scholar]
- Oh Song, H.; Xiang, Y.; Jegelka, S.; Savarese, S. Deep metric learning via lifted structured feature embedding. In Proceedings of the IEEE Conference on Computer Vision and Pattern Recognition, Las Vegas, NV, USA, 27–30 June 2016; pp. 4004–4012. [Google Scholar]
- Parkhi, O.M.; Vedaldi, A.; Zisserman, A. Deep face recognition. In Proceedings of the British Machine Vision Conference (BMVC), Swansea, UK, 7–10 September 2015; pp. 41.1–41.12. [Google Scholar]
- Singhal, A. Modern information retrieval: A brief overview. IEEE Data Eng. Bull. 2017, 24, 35–43. [Google Scholar]
- Tan, P.-N.; Steinbach, M.; Kumar, V. Data mining cluster analysis: Basic concepts and algorithms. In Introduction to Data Mining; University of Minnesota: Minneapolis, MN, USA, 2013; pp. 487–533. [Google Scholar]
Figure 1.
The graph convolutional neural network uses localized convolutions on aggregated neighborhood vectors to learn product embeddings. Here, we show the two layer graph neural network that computes the final embeddings of nodes A and B using the previous layer representation of nodes A and B, respectively, and that of their respective neighborhoods. Different colors denote different nodes. The recommendation score between two products A, B is then computed via the utilization of the cosine similarity between the two final embedding vectors of nodes A and B.

Figure 2.
Popularity bias and re-ranking. (a) Depiction of overall sales probability and cross-sales (CS) probability (y1-axis) and the node degree (number of neighbors) (y3-axis) for all products. The average cross-sales rank (y2-axis) is shown for initial cross-sales statistics (solid black line) and the probability based re-ranking (PBR) approach (black dotted line). Note that the average rank is proportional to the popularity of the respective product in the initial cross-sales statistics, but this relation disappears in the PBR approach. (b) The probability density of edge weights (kernel density estimation (KDE)) shows the distribution of edge weights in the initial cross-sales based graph, as well as in the PBR based graph.

Figure 3.
(a) Cross-selling rank distribution for a top-selling product and a product from the long tail based on raw cross-sales and the PBR. (b) Average probability for products (grouped into 10 quantiles) to be among the top cross-selling articles that are being used for positive sampling in the triplet loss for both approaches. “New” denotes products that are not included in positive sampling in the approach based on raw cross-sales, but are relevant in the PBR approach, and shows their average positive sampling probability. These products show up in addition among top ranked cross-selling products when the PBR is applied. The PBR introduces around 75% more products with an average sampling probability 36.6%. Quantile selection of products for the first 10 product bins for both approaches is based on raw cross-selling statistics (red).

Figure 4.
Average recommendation quality among the top 15 recommended articles for 25 evaluated products. Recommendations are computed based on the graph incorporating raw cross-selling statistics and the graph, where the edge weights have been recomputed using the probability approach (PBR). PharmaSage is optimized based on the PBR approach as the input.


Table 1.
Example recommendations for prednisolone, a corticosteroid.
| Rank | Recommended Product | Expert Feedback |
|---|---|---|
| 1 | CETIRIZIN AL DIREKT | 2 |
| 2 | PANTOPRAZOL ABZ | 2 |
| 3 | OTRIVEN 0.1 | 2 |
| 4 | OMEPRADEX 20MG | 2 |
| 5 | LORANO AKUT | 2 |
| 6 | DEKRISTOL 400 IE | 2 |
| 7 | ASS AL 100 TAH | 0 |
| 8 | IBUPROFEN OPT 400MG | 2 |
| 9 | CALCIUM D3 RATIO | 2 |
| 10 | FENISTIL | 2 |
Publisher’s Note: MDPI stays neutral with regard to jurisdictional claims in published maps and institutional affiliations. |
© 2020 by the authors. Licensee MDPI, Basel, Switzerland. This article is an open access article distributed under the terms and conditions of the Creative Commons Attribution (CC BY) license (http://creativecommons.org/licenses/by/4.0/).
Share and Cite
MDPI and ACS Style
Hell, F.; Taha, Y.; Hinz, G.; Heibei, S.; Müller, H.; Knoll, A. Graph Convolutional Neural Network for a Pharmacy Cross-Selling Recommender System. Information 2020, 11, 525. https://0-doi-org.brum.beds.ac.uk/10.3390/info11110525
AMA Style
Hell F, Taha Y, Hinz G, Heibei S, Müller H, Knoll A. Graph Convolutional Neural Network for a Pharmacy Cross-Selling Recommender System. Information. 2020; 11(11):525. https://0-doi-org.brum.beds.ac.uk/10.3390/info11110525
Chicago/Turabian StyleHell, Franz, Yasser Taha, Gereon Hinz, Sabine Heibei, Harald Müller, and Alois Knoll. 2020. "Graph Convolutional Neural Network for a Pharmacy Cross-Selling Recommender System" Information 11, no. 11: 525. https://0-doi-org.brum.beds.ac.uk/10.3390/info11110525
Note that from the first issue of 2016, this journal uses article numbers instead of page numbers. See further details here.