Context-Aware Wireless Sensor Networks for Smart Building Energy Management System


1
ENSA, Ibn-Tofail University, Kenitra 14000, Morocco
2
School of Science and Engineering, Al Akhawayn University in Ifrane, Ifrane 53000, Morocco
3
Engineering Technology Department, University of Houston, Houston, TX 77204, USA
*
Author to whom correspondence should be addressed.
Information 2020, 11(11), 530; https://0-doi-org.brum.beds.ac.uk/10.3390/info11110530
Submission received: 6 September 2020
/
Revised: 18 October 2020
/
Accepted: 19 October 2020
/
Published: 15 November 2020
(This article belongs to the Special Issue Data Processing in the Internet of Things)
Abstract
:Energy Management Systems (EMS) are indispensable for Smart Energy-Efficient Buildings (SEEB). This paper proposes a Wireless Sensor Network (WSN)-based EMS deployed and tested in a real-world smart building on a university campus. The at-scale implementation enabled the deployment of a WSN mesh topology to evaluate performance in terms of routing capabilities, data collection, and throughput. The proposed EMS uses the Context-Based Reasoning (CBR) Model to represent different types of buildings and offices. We implemented a new energy-efficient policy for electrical heaters control based on a Finite State Machine (FSM) leveraging on context-related events. This demonstrated significant effectiveness in minimizing the processing load, especially when adopting multithreading in data acquisition and control. To optimize sensors’ battery lifetime, we deployed a new Energy Aware Context Recognition Algorithm (EACRA) that dynamically configures sensors to send data under specific conditions and at particular times to avoid redundant data transmissions. EACRA increases the sensors’ battery lifetime by optimizing the number of samples, used modules, and transmissions. Our proposed EMS design can be used as a model to retrofit other kinds of buildings, such as residential and industrial, and thus converting them to SEEBs.
1. Introduction
The use of traditional energy resources such as natural gas, petroleum, and coal results in a huge amount of greenhouse gas emission (GHE) such as carbon dioxide—CO2 [1]. GHE contributes considerably to the global warming phenomenon, which has lately started to tangibly harm the environment and impact every living creature on earth. Across the different fields of science, researchers worldwide are making great efforts to minimize the usage of these traditional energy sources. These efforts involve various research topics related to energy generation, energy transmission, smart distribution, energy consumption, and energy storage. To minimize energy consumption, computer scientists are developing intelligent systems for energy management in Smart Grids (SG) [2]. In particular, there is a need to promote renewable energy and optimize energy consumption at endpoints [3].
In SGs, and contrast to regular electrical grids, electricity and data flows are bidirectional. Thus, electricity/energy production and distribution are strongly-coupled, involving advanced control aspects [4]. As data and electricity can flow from the utility to the customer and from the customer to the utility, we have to keep track in real-time of who is producing what? Moreover, who is consuming what? [5] SGs leverages various technologies for operation and control such as smart meters/sensors and actuators, smart appliances, renewable energy resources, energy storage, control theory, big data processing, big data analytics. While an SG can cover a whole city, the Micro-Grid (MG) [6] is a “small SG” that groups multiple distributed generation points at the level of a neighborhood, e.g., university campus, village, and private residential or industrial areas. Still, an MG connects to the main grid via the Utility Interconnection Switch. Moreover, a typical feature of MGs is the ability to operate in islanded mode when the locally generated power is enough to power all loads in the MG. In such a situation, there is no need to get the power from the utility grid. Consequently, and to promote the island mode operation, an MG ought to effectively integrate various sources of distributed generation (DG), especially Renewable Energy Sources (RES), to supply needed emergency power when switching between islanded and connected modes. Most important, control and protection are becoming significant challenges.
In the SG paradigm, an MG is a key element in the distributed generation of electricity. This MG needs that interoperability capability to communicate with the SG. Among the main challenges for implementing Smart MG is the integration of intermittent generation sources (renewable energies). This distributed generation also contains storage devices, loads, and Smart Buildings [7]. Buildings under the same entity in an MG participate in energy management either by optimizing their consumption and/or cooperating in the distributed generation using rooftop solar panels as an example. By adding a system that handles these two functionalities, energy consumption optimization, and energy production, we can start talking about a Smart Building that can host an energy management system.
Technological advancement in the last decade has enabled objects around us to adopt a dynamic aspect, that is, sending data and taking actions based on the received commands from users. This is thanks to the processing of the intelligence layer that can be added to every object in the Internet of Things (IoT).
The Smart MG relies on information and communication technologies (ICTs) [8] to enable real-time, two-way communication between utility and consumers, thus allowing more dynamic interaction on energy flow. These ICTs elements, including sensing devices, monitoring technologies, and digital communications infrastructure, are needed to ensure adequate information exchange between the Smart MG, the consumers, and the Smart Buildings. This interaction is achieved through the Smart Information sub-system which includes the AMI (Advanced Metering Infrastructure) [9]. AMI uses smart meters to gather billing data, track grid status, monitor and control appliances. This system can be classified into smart metering and smart monitoring and measurement system. In which, WSN (Wireless Sensor Networks) provides a communication platform for remote monitoring and system control [9].
Worldwide, buildings consume about 40% of global energy [10]. Therefore, energy-efficient buildings are becoming a must to optimize energy consumption. There are three ways to retrofit a traditional building and make it a Smart Energy-Efficient Building (SEEB): use highly efficient insulation material, energy-efficient appliances, and energy management system (EMS) [11]. EMSs control appliances and integrate renewable energy sources based on an energy policy that is mandated by the energy department of the MG. ICT is used to execute the energy policy rules and automate the control process in SEEB [12]. The benefits of controlling smart building’s loads and Generation Units (GU) are not only reducing energy consumption but also redirecting the energy flow to where it is needed.
The outcomes of this project are as follows: First, an intelligent framework that monitors and control loads (heaters) of the building is presented. Second, a database to archive user behavior and environmental data is developed. Third, a software tool to control Heating Ventilation Air Conditioning (HVAC) appliances is implemented [13].
2. Problem Statement
Al Akhawayn University campus in Ifrane (AUI) has more than 40 buildings with different functionalities (e.g., educational, residential, and administrative buildings). AUI is located in a cold area where heating is required during the cold seasons, namely fall and winter. The campus is equipped with more than 2130 electrical heaters, with an average consumption of 1750 Wh each. Hence, heaters consume an important amount of energy during the cold seasons, which results in a high electricity bill. However, these heaters are kept on high-temperature settings even if space is not being utilized, wasting a lot of energy. There is a need to manage the heating system at the university in a smart way to eliminate waste and save more energy. In order to improve energy efficiency and lower the electricity bill, we propose the development of a smart EMS system to control these electrical headers using ICT, hence the development of an energy-efficient control framework that can reduce energy consumption in buildings using ICT. This system can be used to retrofit other similar buildings around the world.
3. Research Methodology
According to the Berkeley Laboratory of Energy Efficiency [14], Energy efficiency is defined as maintaining the business continuity of our daily tasks with the minimum energy consumption. An EMS is a computer-aided tool that provides energy efficiency capabilities through monitoring and controlling energy generation, distribution, and consumption. Any action being taken by an EMS should be based on a predefined energy policy. To develop the EMS, we investigated the existing energy consumption of a given building, energy policy, and optimization techniques used by the energy department.
3.1. Existing Energy Consumption in an Educational Building in the University during the Fall Semester
During the research, we adopted the quantitative approach, and we collected data on the energy consumption of a given building in the university. As an example, Table 1 presents the university’s electricity consumption during the fall semester of 2017.
The consumption illustrated in Table 1 results in a high electricity bill. Hence, to lower the electricity bill, the university opted for the development of an energy policy as well as an EMS to control the heaters. For this reason, the CASANET EMS project aimed to develop an energy-efficient control method to reduce energy consumption in buildings by using ICT. This project’s outcomes are as follows: First, an intelligent framework that will monitor and control loads of the building is developed. Second, a database to archive user behavior and environmental data designed. Third, a software tool to control HVAC appliances is implemented.
3.2. Existing Energy Policy and Control Approach
The existing energy policy of heaters control, before this project, was based on the identification of the context from a high-level perspective rather than identifying the context of each room. Therefore, the energy policy consisted of controlling the building as a whole based on some general knowledge, such as the season of the year and outdoor temperature. As a result, we adopted WSN and ICT components in order to identify the context of each room all the time. Such an approach helped us collate data pertaining to temperature, humidity, motion, etc. Hence, the energy policy was further enhanced as more data became available for the EMS.
To achieve the required results, we also investigated existing EMS technologies in order to understand the workflow between its different components. We also investigated the different control approaches which are adopted in the Smart Energy Efficient Building (SEEB). These control approaches were leveraging WSN for data acquisition, context recognition, and appliance control. After surveying the state of the art modeling approaches for the university campus, we adopted the Context-Based Reasoning Model (CBR) [15] through which we could successfully model the different buildings and rooms of the university campus. Then we drafted a “sample” energy policy dedicated to heaters control. Afterward, we developed custom sensors and actuators based on temperature modules, motion modules, Arduino programming boards, and XBee radio frequency modules. These sensors sample building rooms and forward data to the server via an intermediate gateway device that connects the WSN to the control server. Moreover, this WSN also forwards the control decision back from the control server to the actuators.
4. Proposed EMS for SEEB
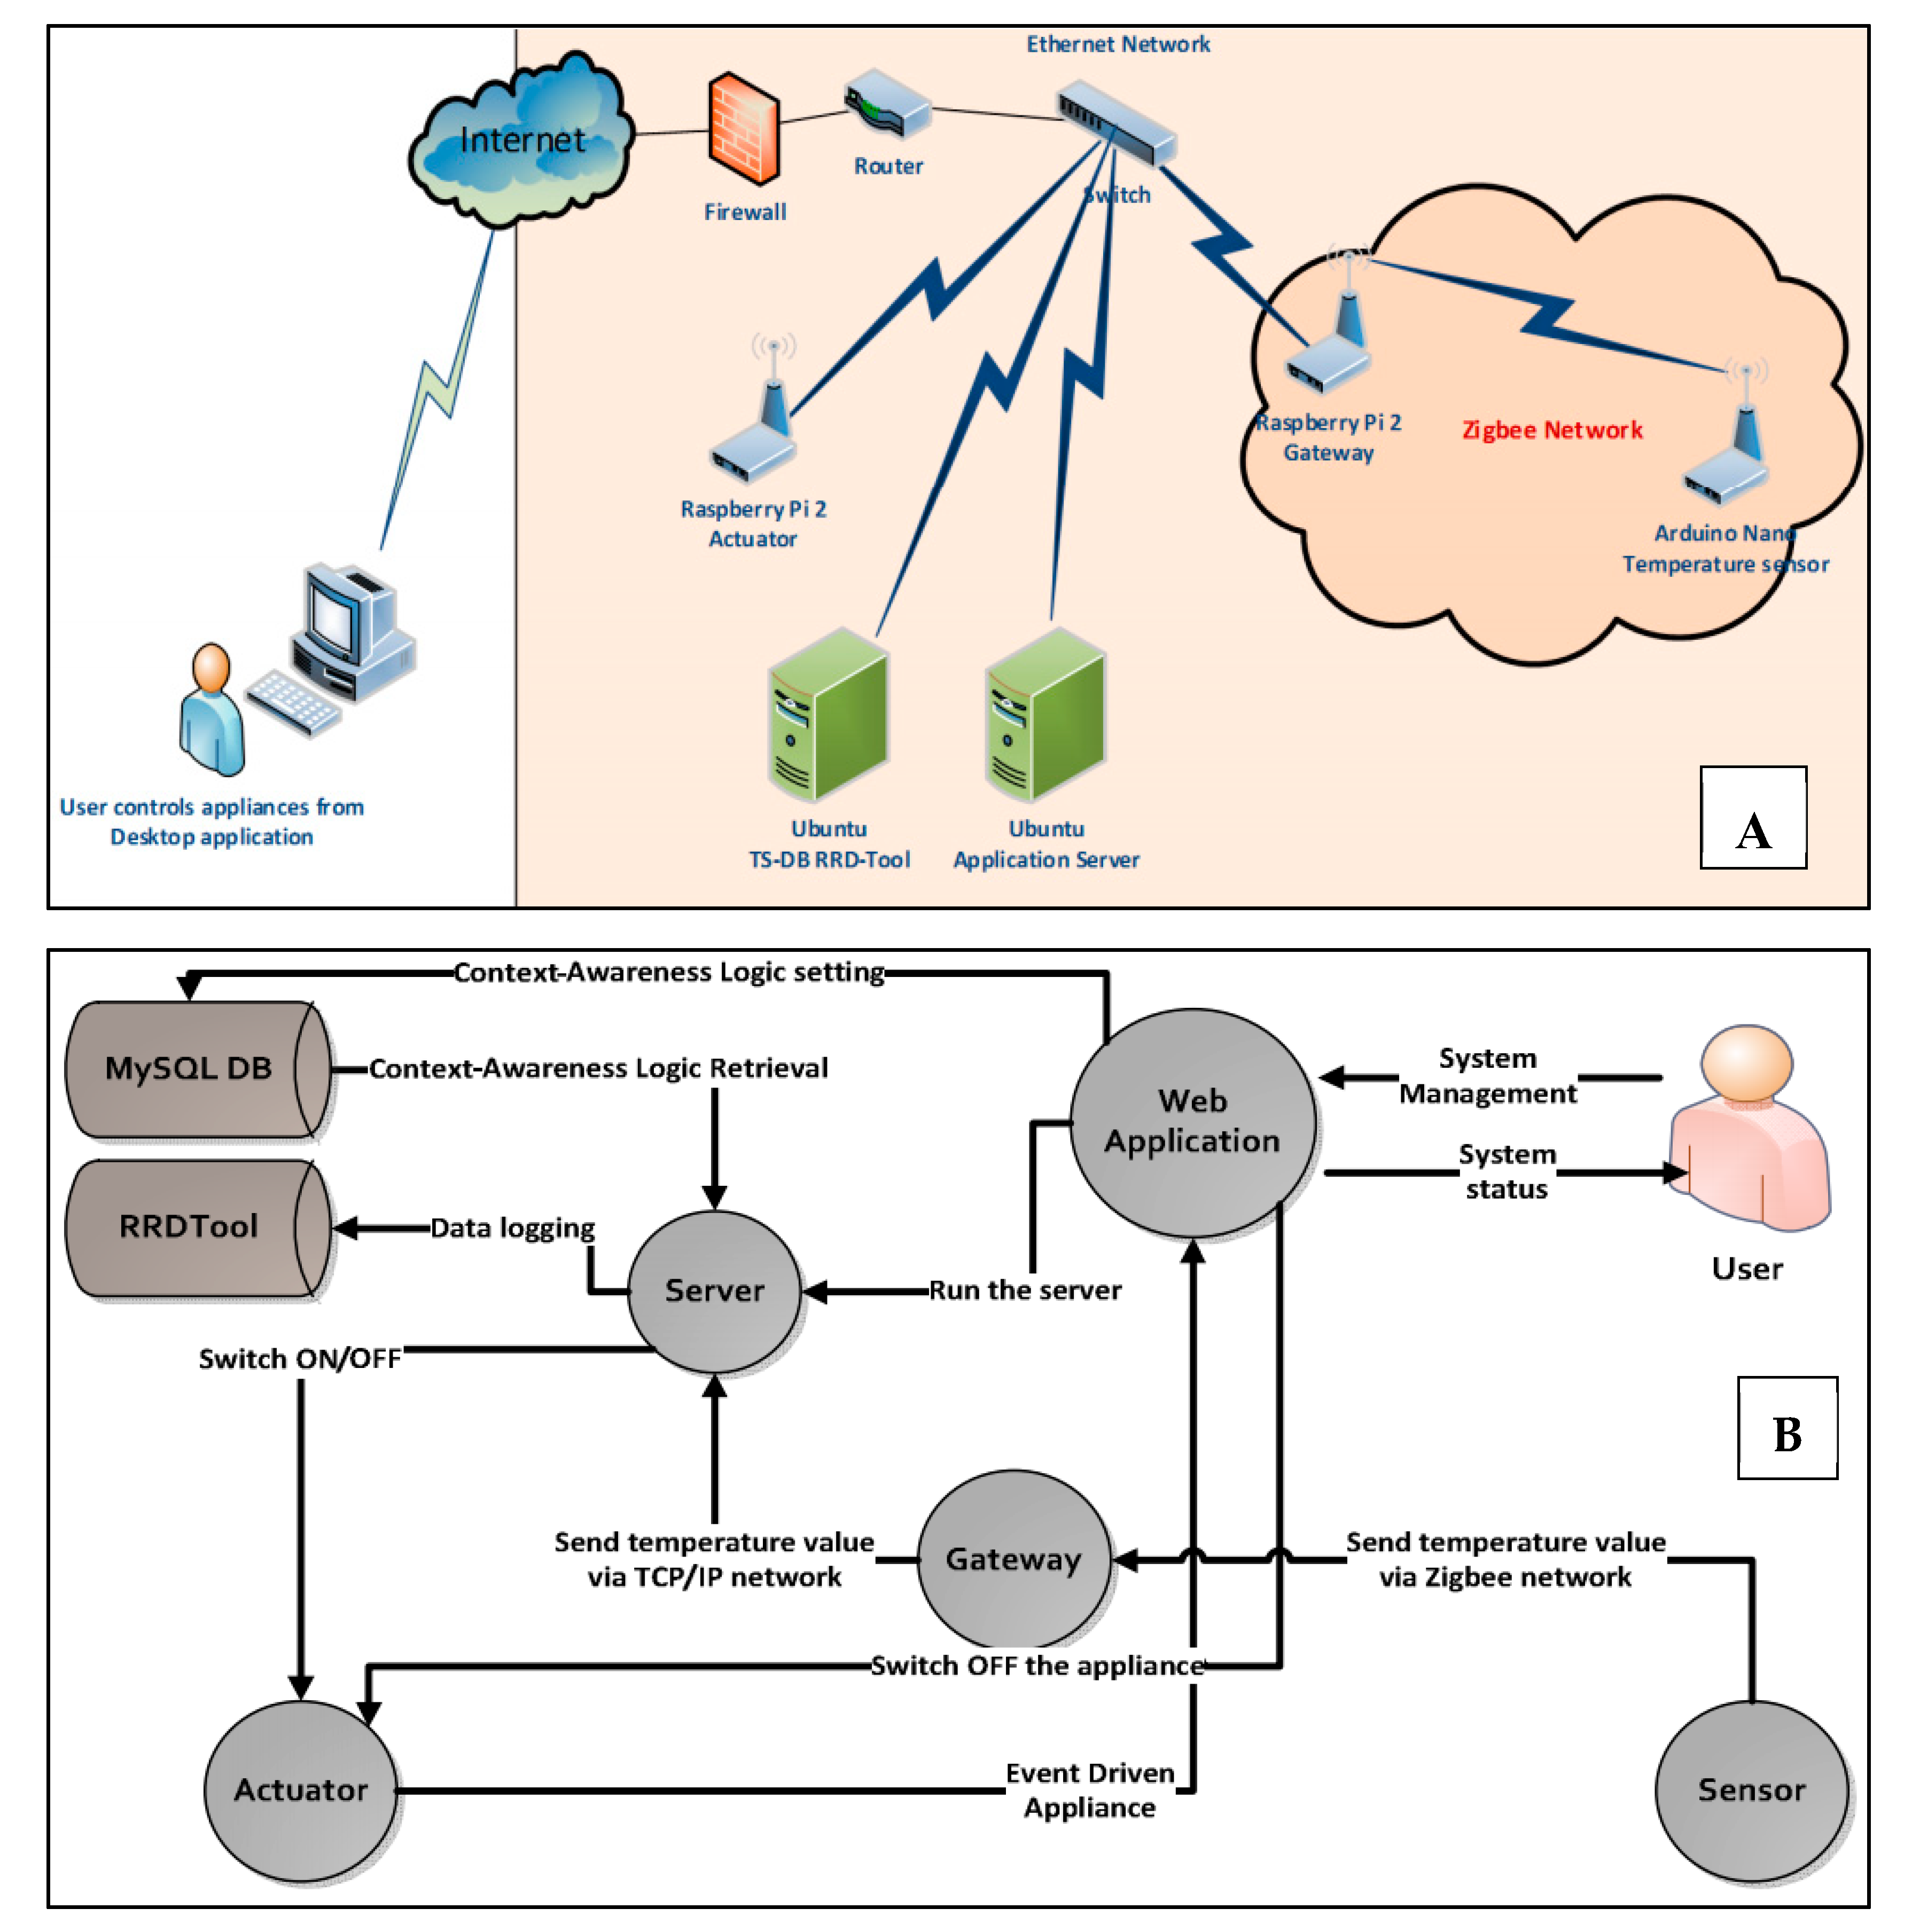
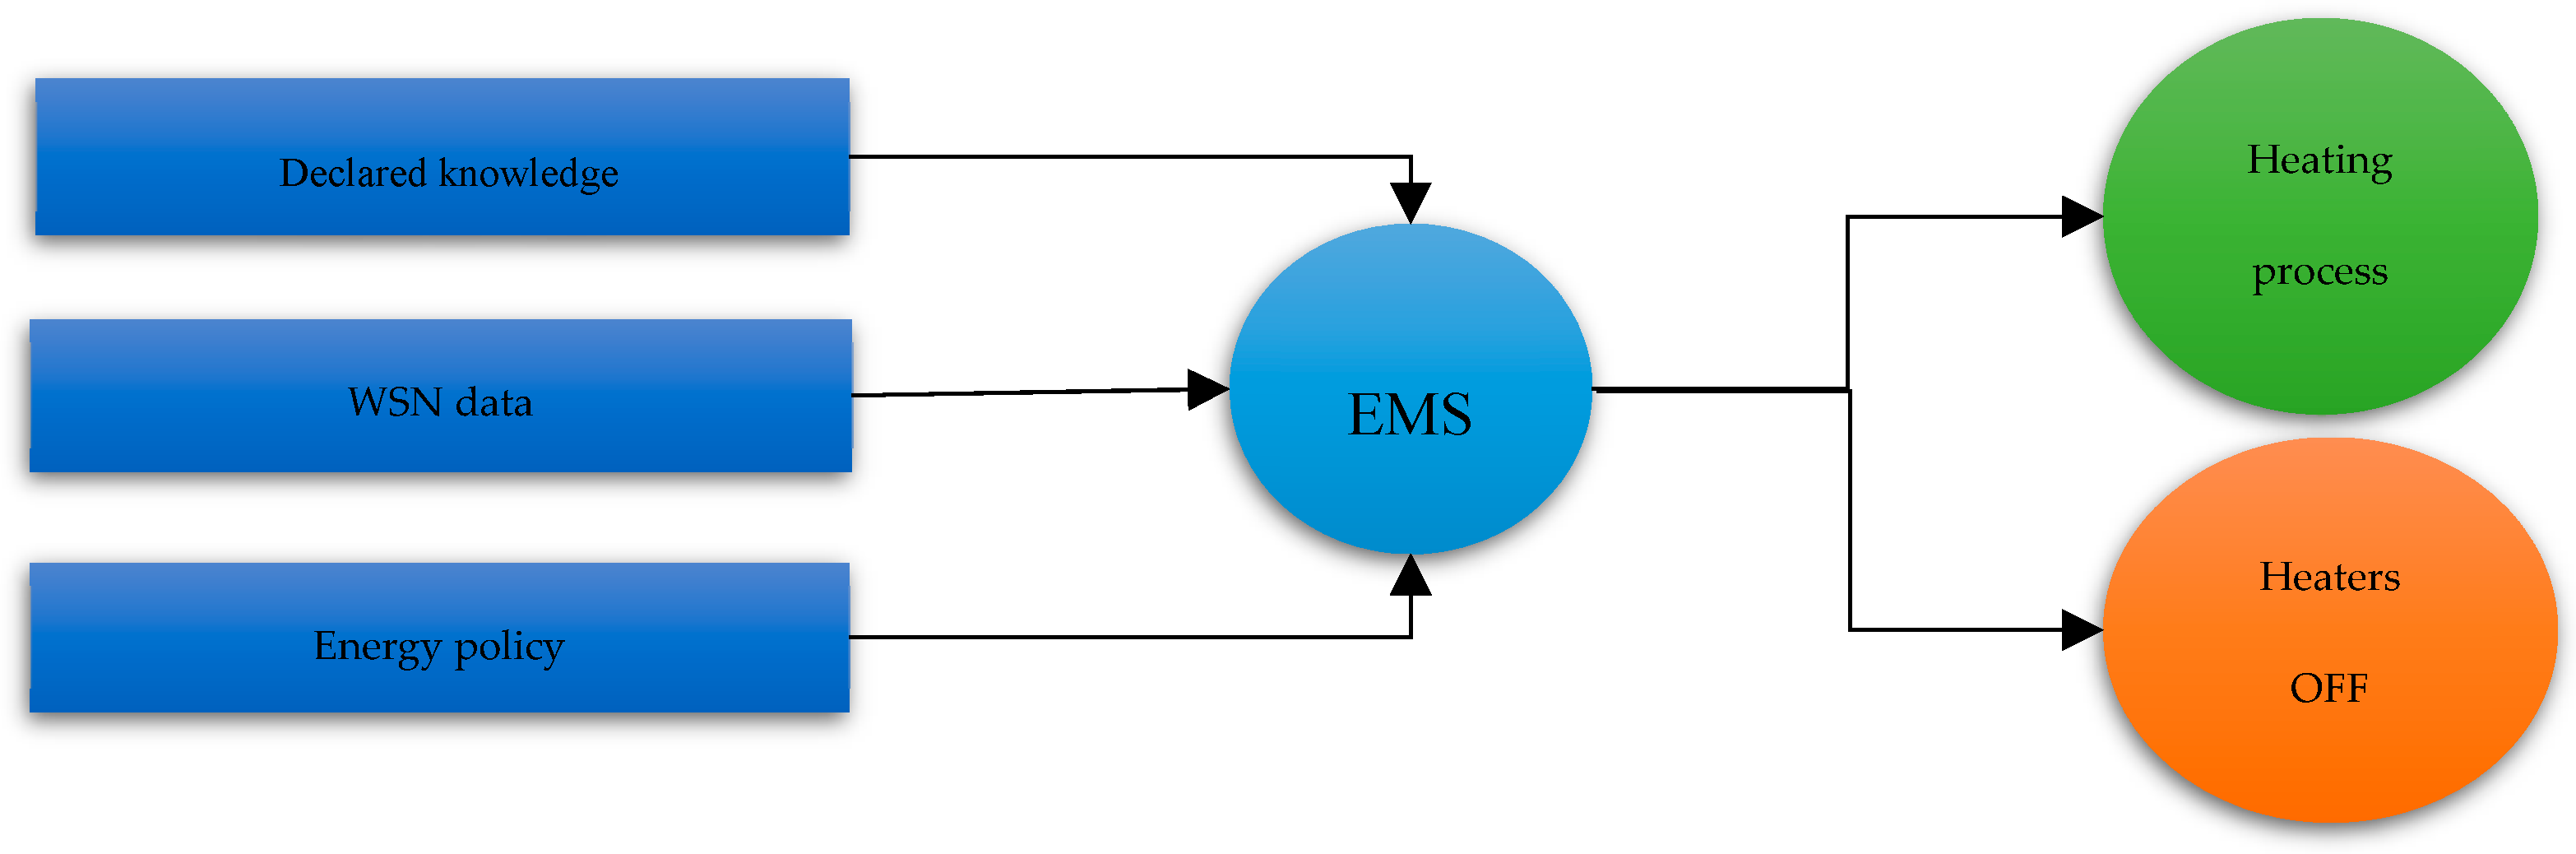
The proposed EMS that controls the heaters and implements the efficient energy policy via ICT has three components (Figure 1). First, sensor and actuator modules which are used for environmental sampling and appliance control. Second, a Wireless Sensor Network (WSN) that transmits data and control commands. Third, the software or application which monitors and controls the building appliances, loads, and generators.
4.1. Plan-Do-Check-Act (PDCA) Development Cycle of Energy Management System
According to ISO50001 standard [16], the design, implementation, and testing of the EMS should be based on the concept of a continuous improvement following the PDCA model where the acronym PDCA stands for Plan, Do, check, and Act. PDCA is a development lifecycle that contains continuous development processes using computer-aided tools, such as hardware and software components for data acquisition, networking, analysis, and control. Table 2 illustrates the different steps we took in each PDCA phase during the EMS development.
After defining the different steps and the required ICT components at each phase, we designed a WSN for data acquisition to gather data related to occupant behavior and energy consumption in the building. The next subsection emphasizes more on the development of the data acquisition system in the SEEB.
4.2. Data Acquisition Design and Development Using IoT and WSN
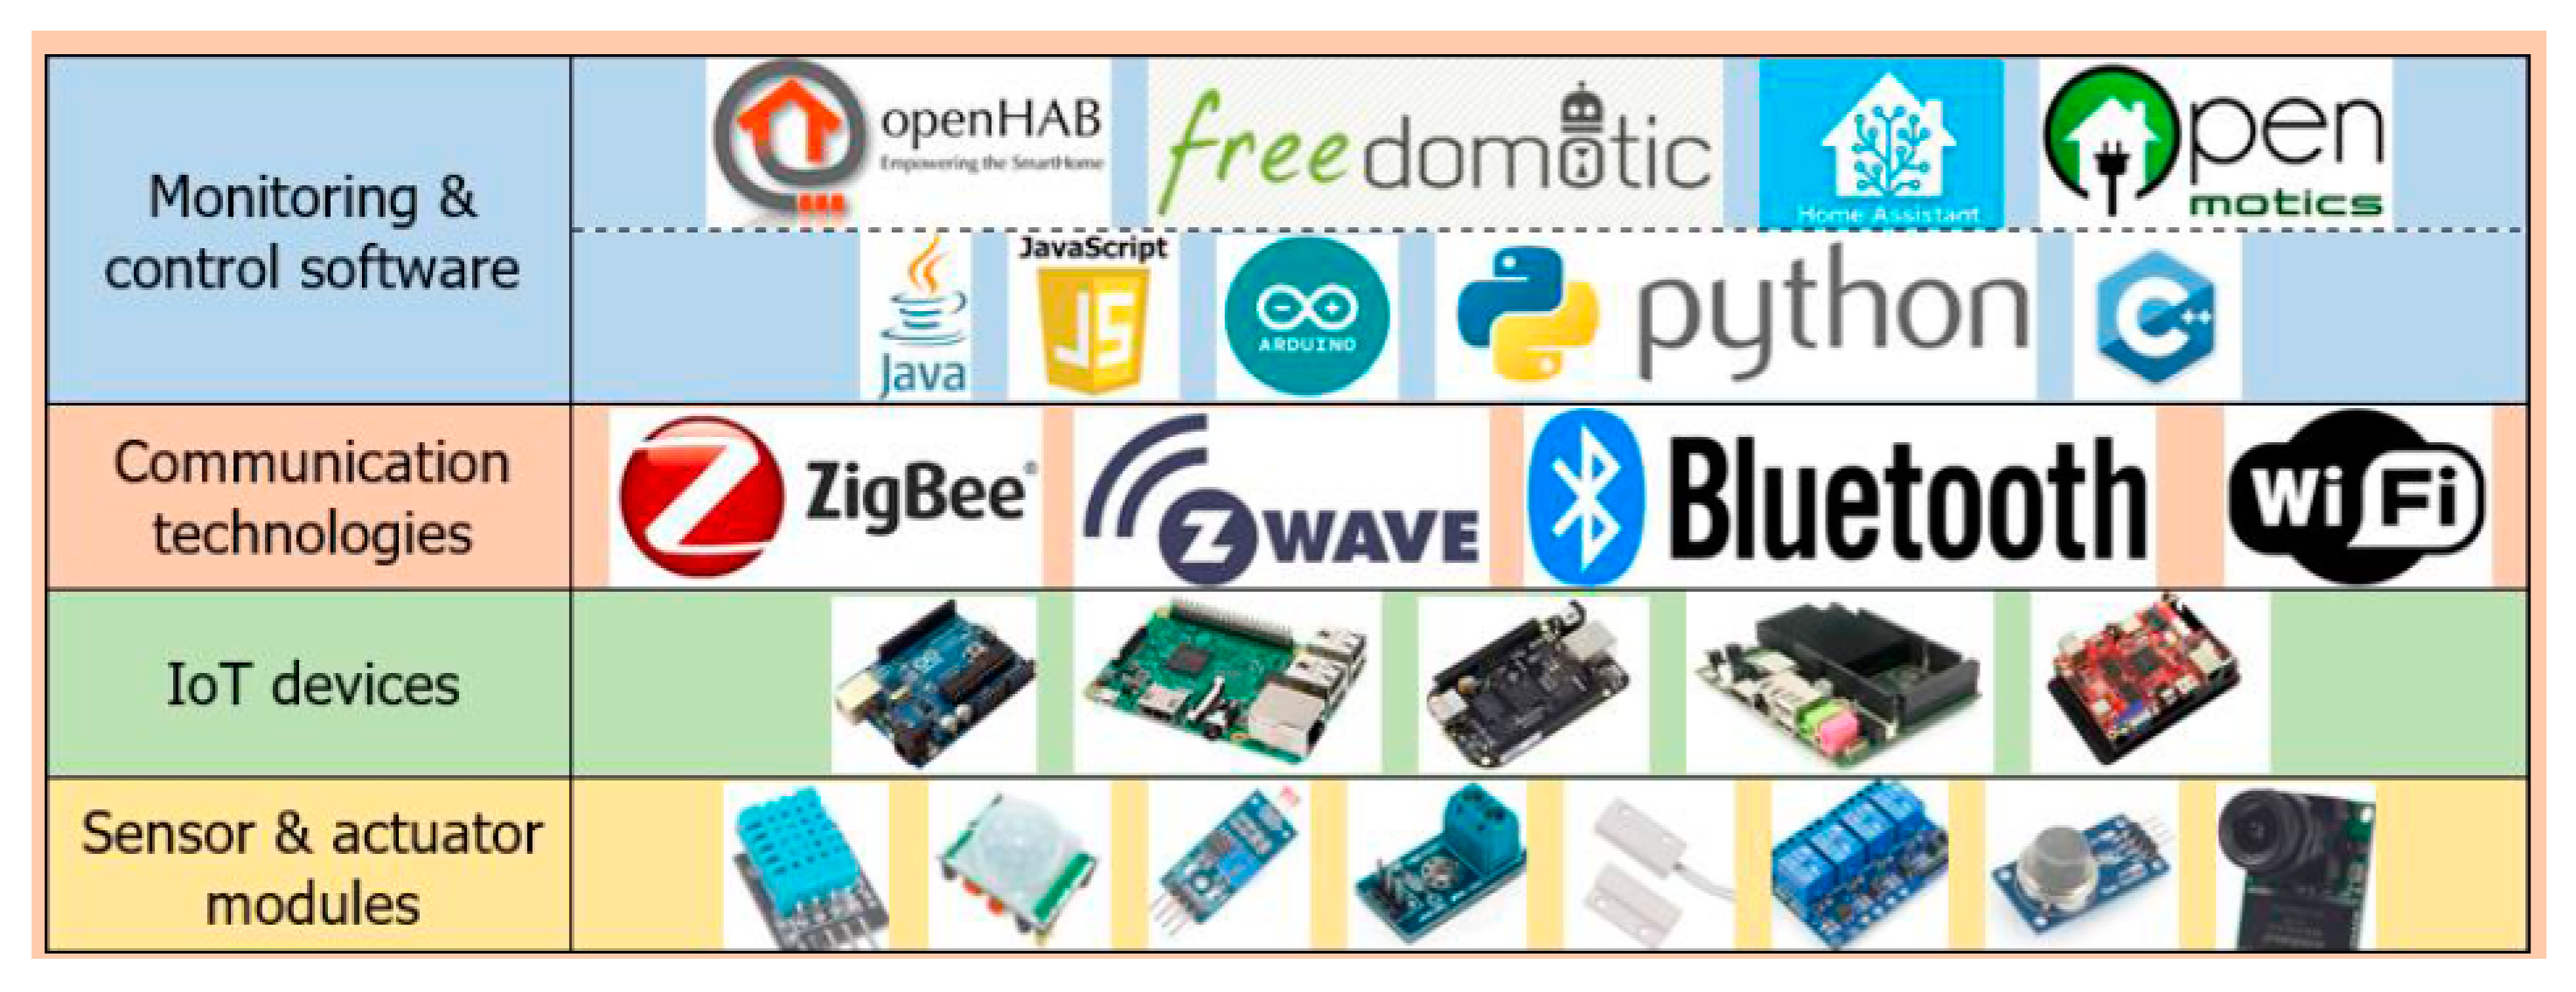
In SEEB, EMS requires data gathering in the “Plan Phase” and appliance control in the “Do Phase”. To this end, the EMS relies on two primary layers to interact with the building for data gathering and control. First, the physical layer interacts with the building’s appliances, doors, windows, and environmental conditions. This layer is composed of WSN and IoT, such as sensors and actuators (Figure 2). On the one hand, sensors monitor physical phenomena, for example, temperature, humidity, light, motion, human occupancy, CO2 concentration, and power consumption. On the other hand, actuators control the building’s appliances by executing commands mandated by the EMS software, such as switching the heaters ON and OFF.
The second component is the software layer, which is the decision-making part of the EMS. In this layer, the software makes decisions based on two parameters: the received data from sensors and the energy policy applied. The communication between both layers is ensured via a network that can be a mixture of various technologies such as WiFi, Zigbee, Z-wave, Ethernet, Bluetooth, and Infrared.
4.3. WSN Nodes Components
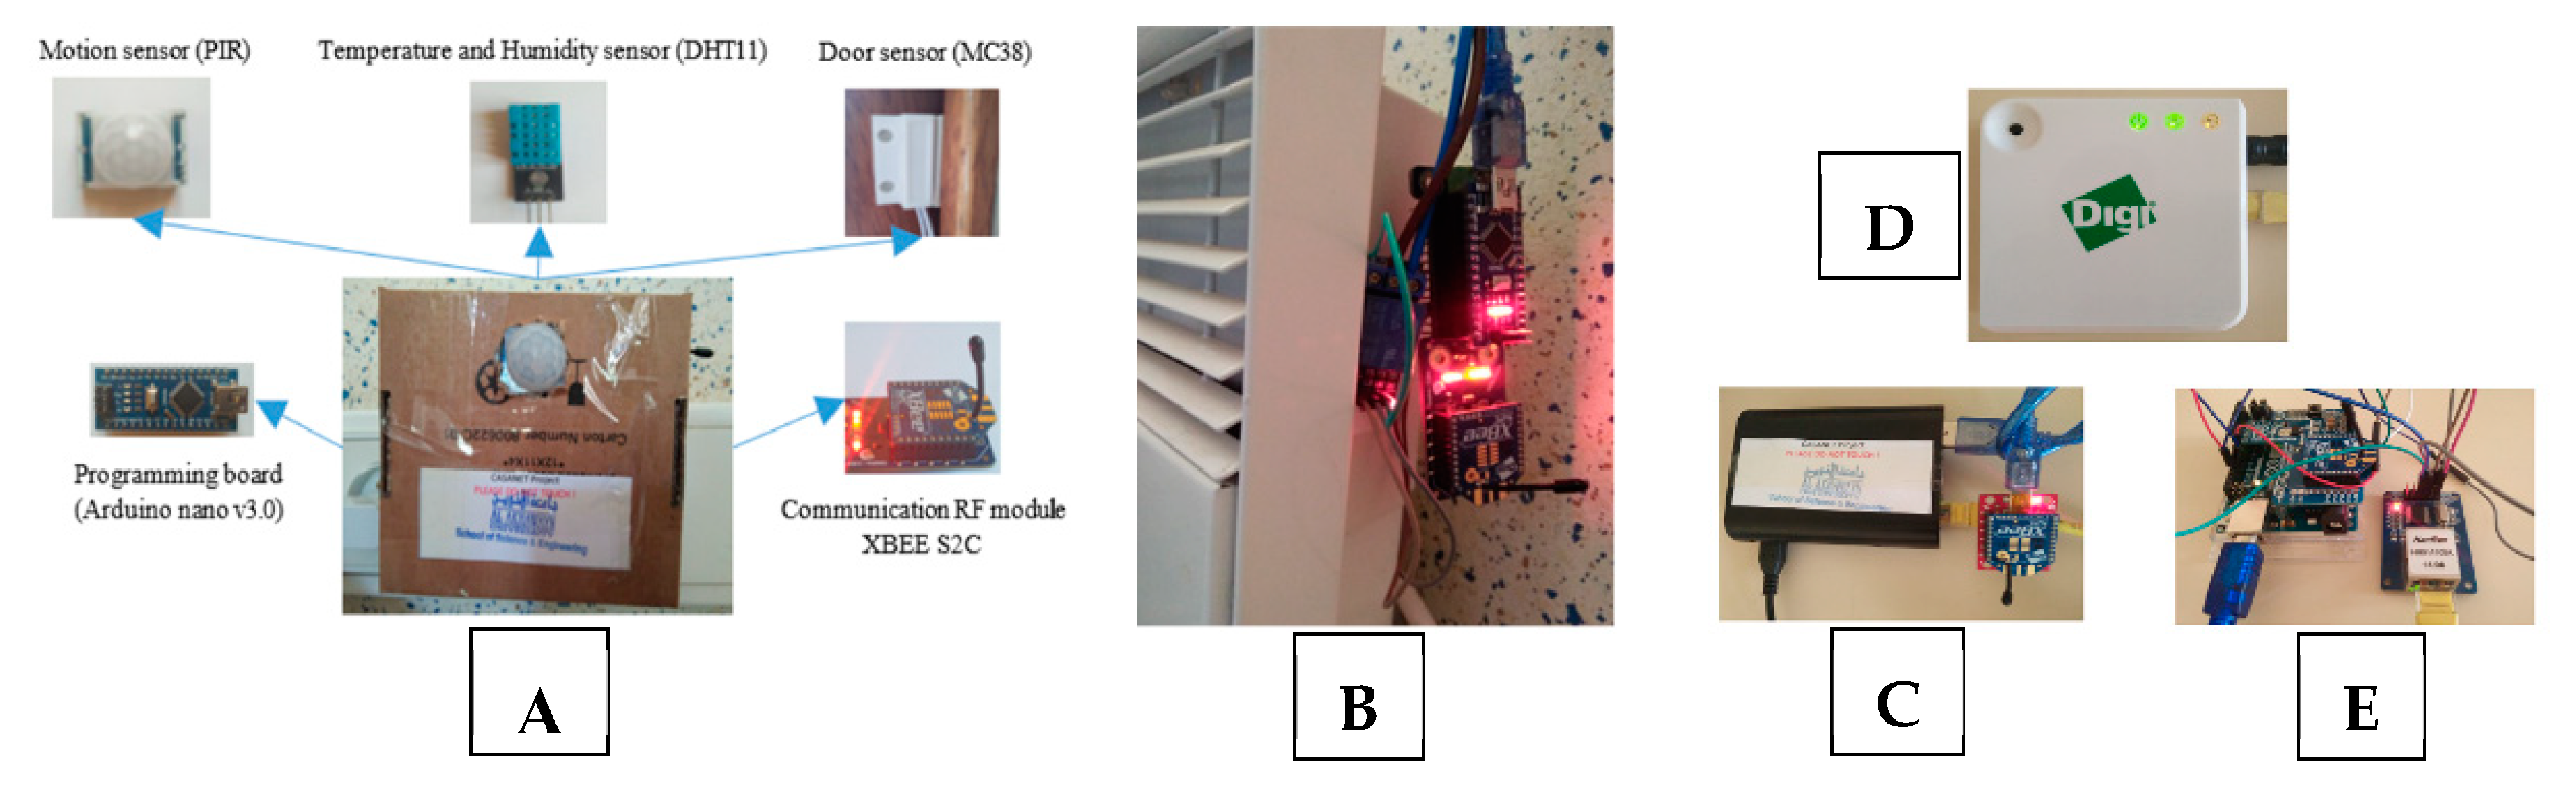
The journey of the WSN designed started with surveying WSN design and deployment methodologies. As a result, we concluded that the WSN design at higher abstraction levels facilitates analysis steps and resolves problems before deployment. The primary motivation for applying high-level-based approaches is that new applications can be created with less effort than in traditional approaches [17]. Hence, we went for the component modeling technique as it supports modeling the system because component-based modeling offers great abstraction by providing interface-based interaction between elements. We examine for each approach its modeling language, scopes, and elements. Additionally, after extensive investigation and analysis of WSN technologies dedicated to smart building, we opted for open source IoT platforms to implement the WSN data acquisition. As illustrated in the next (Figure 3A), the sensor node is composed of a passive infrared (PIR) module for motion detection, DHT11 module for temperature and humidity measurement, and an MC38 module for window/door status detection (open or closed). These modules are attached to the Arduino Nano v3.0 programming board, which is the IoT platform that handles processing tasks and runs the sensor’s code. The sensor communicates data via an XBee Series 2 S2C radio frequency module.
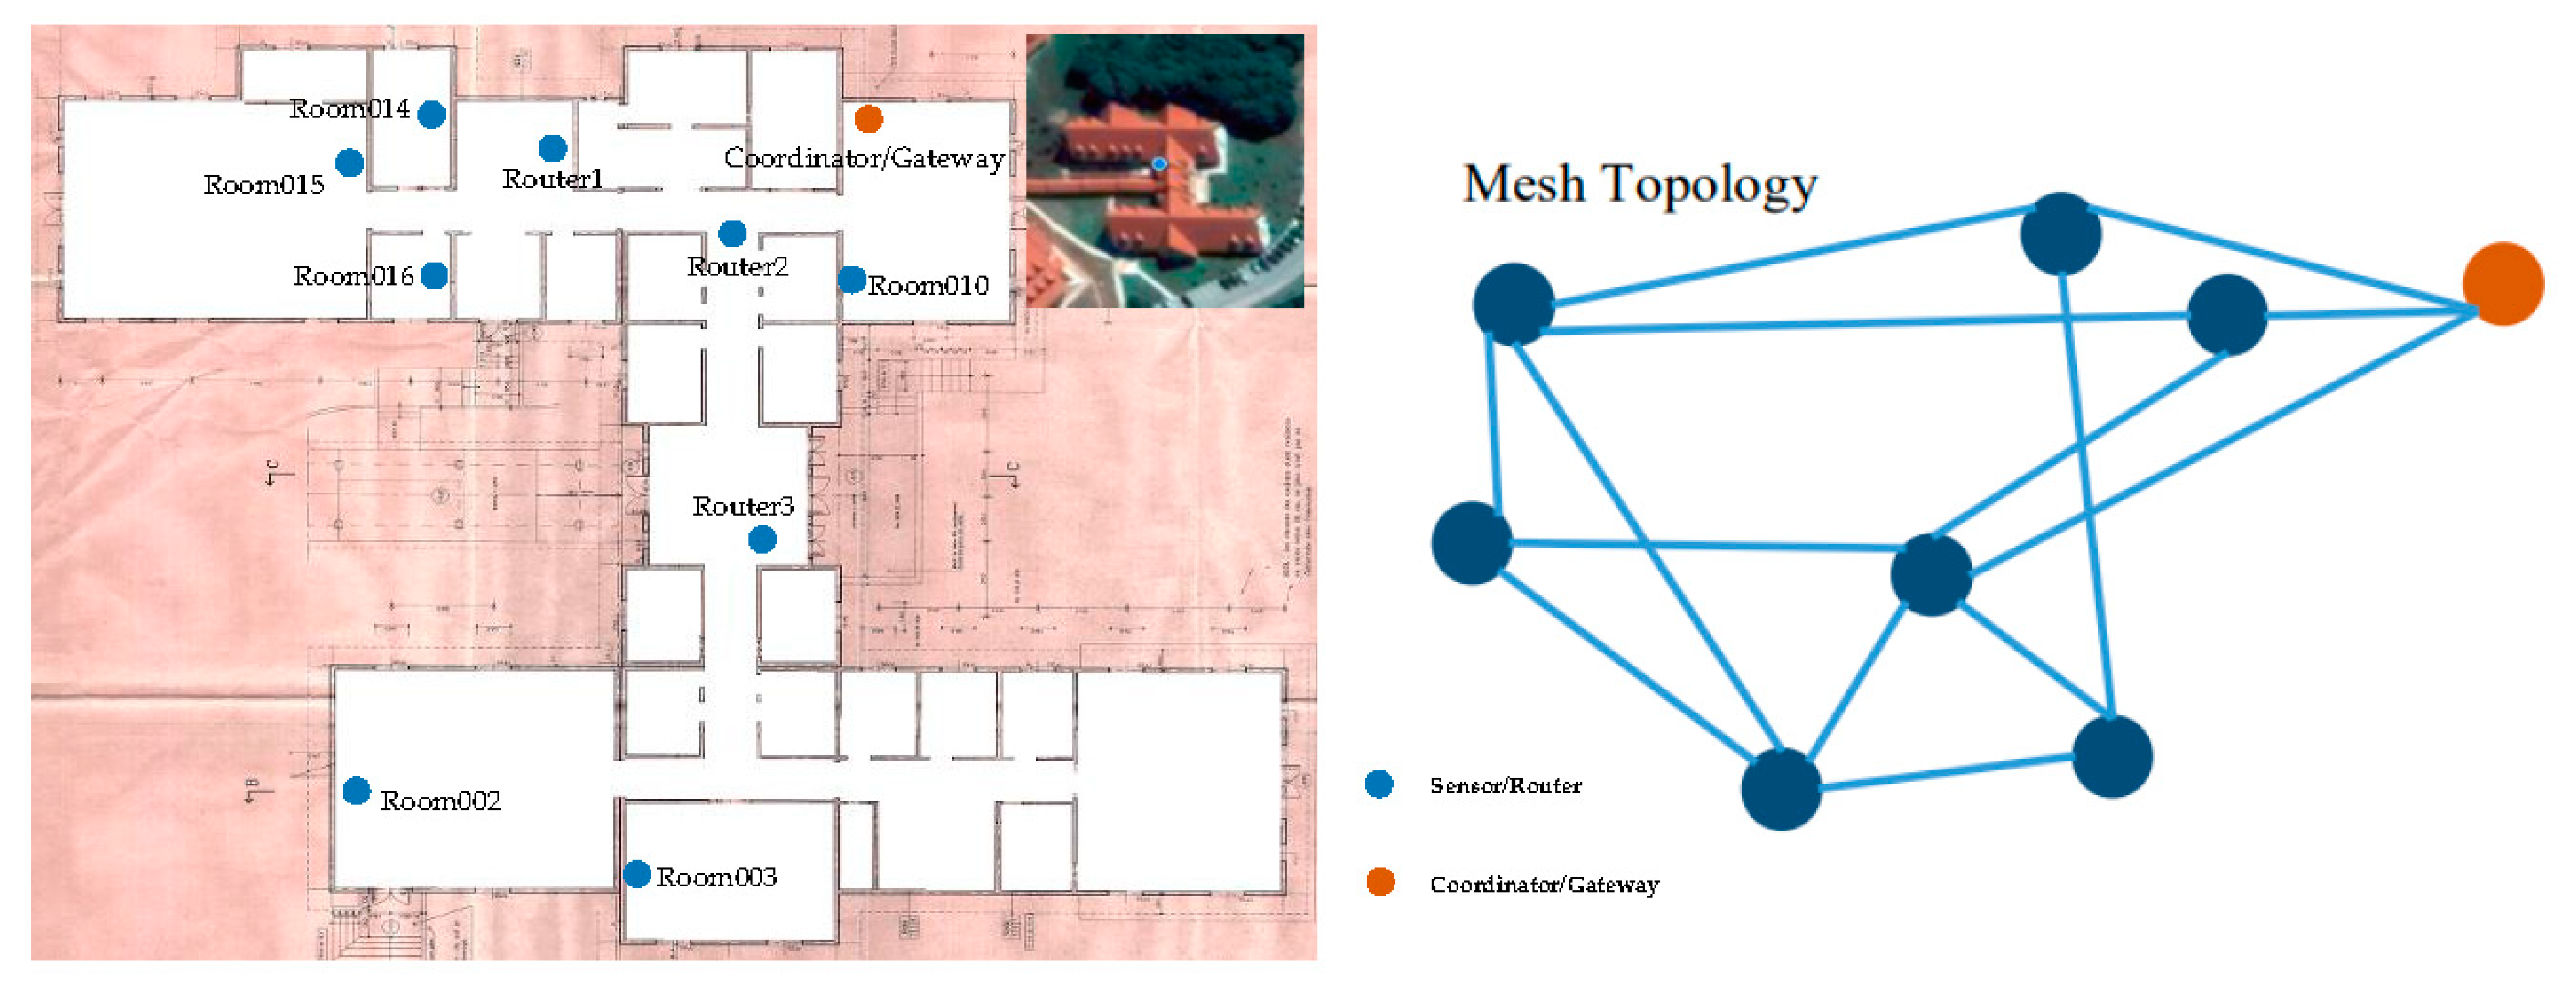
The WSN was deployed on the ground floor of one building. Figure 4 shows the network topological architecture; the WSN is implemented as a mesh topology where sensor nodes route data towards the gateway device (Figure 3C). This gateway links the WSN and the TCP/IP network to which the application server is connected. The command coming from the application server is forwarded to the appropriate actuator (Figure 3B) via the gateway. In this scenario, we used nine sensor nodes indoors with a voltage supply of 5 V. The wireless sensor nodes are XBee Series 2 S2C with a wire antenna. All nodes can be both sensors and routers using AODV routing protocol [18], and they belong to the same Personal Area Network (PAN) named BD07.
The nodes forward sampled data to the ZigBee gateway, which forwards it to the application server. The performance evaluation of the network includes delay, distance measurement, packet loss, and throughput. We tested the network in low, medium, and high data rates. We created a full mesh network out of 10 nodes (nine nodes + one gateway). Six sensor/router nodes are located inside rooms, offices, and laboratories. Three routers were installed in the hall to route data to the gateway. All the ten nodes are configured as routers. These XBee nodes run the DigiMesh firmware that is based on ZigBee and AODV routing protocol. The EMS is designed to use sensors for data acquisition and equipment control; these sensors will eventually be deployed and managed by building operators. Therefore, they need to be energy efficient to reduce the cost in terms of battery replacement and operator time in managing them. Additionally, they need to be reliable and handle data communication with the expected QoS. Therefore, there needs to be an evaluation of the following parameters: energy consumption, network QoS, reliability, latency, and throughput. We should note that the sensor’s limited resources constraint impacts security requirements such as encryption and key generation. Another constraint is that sensors should be accessible for remote configuration and maintenance.
4.4. Node Power Consumption Measurement
The power consumption includes power consumed during computation (i.e., data acquisition) and communication. We measured both of them separately to assess the impact of each. In the WSN data acquisition, we used different sensor node configurations with specific sensor modules, as presented in Table 3.
For each configuration in Table 3, we measured the energy consumed during the sampling process without including the consumption of network setup and data transmission.
In order to measure and optimize the energy consumption in a better way, we considered two different processes in the sensor node: The sampling process, where the node gathers data, and the transmission process, where the node sends the data.
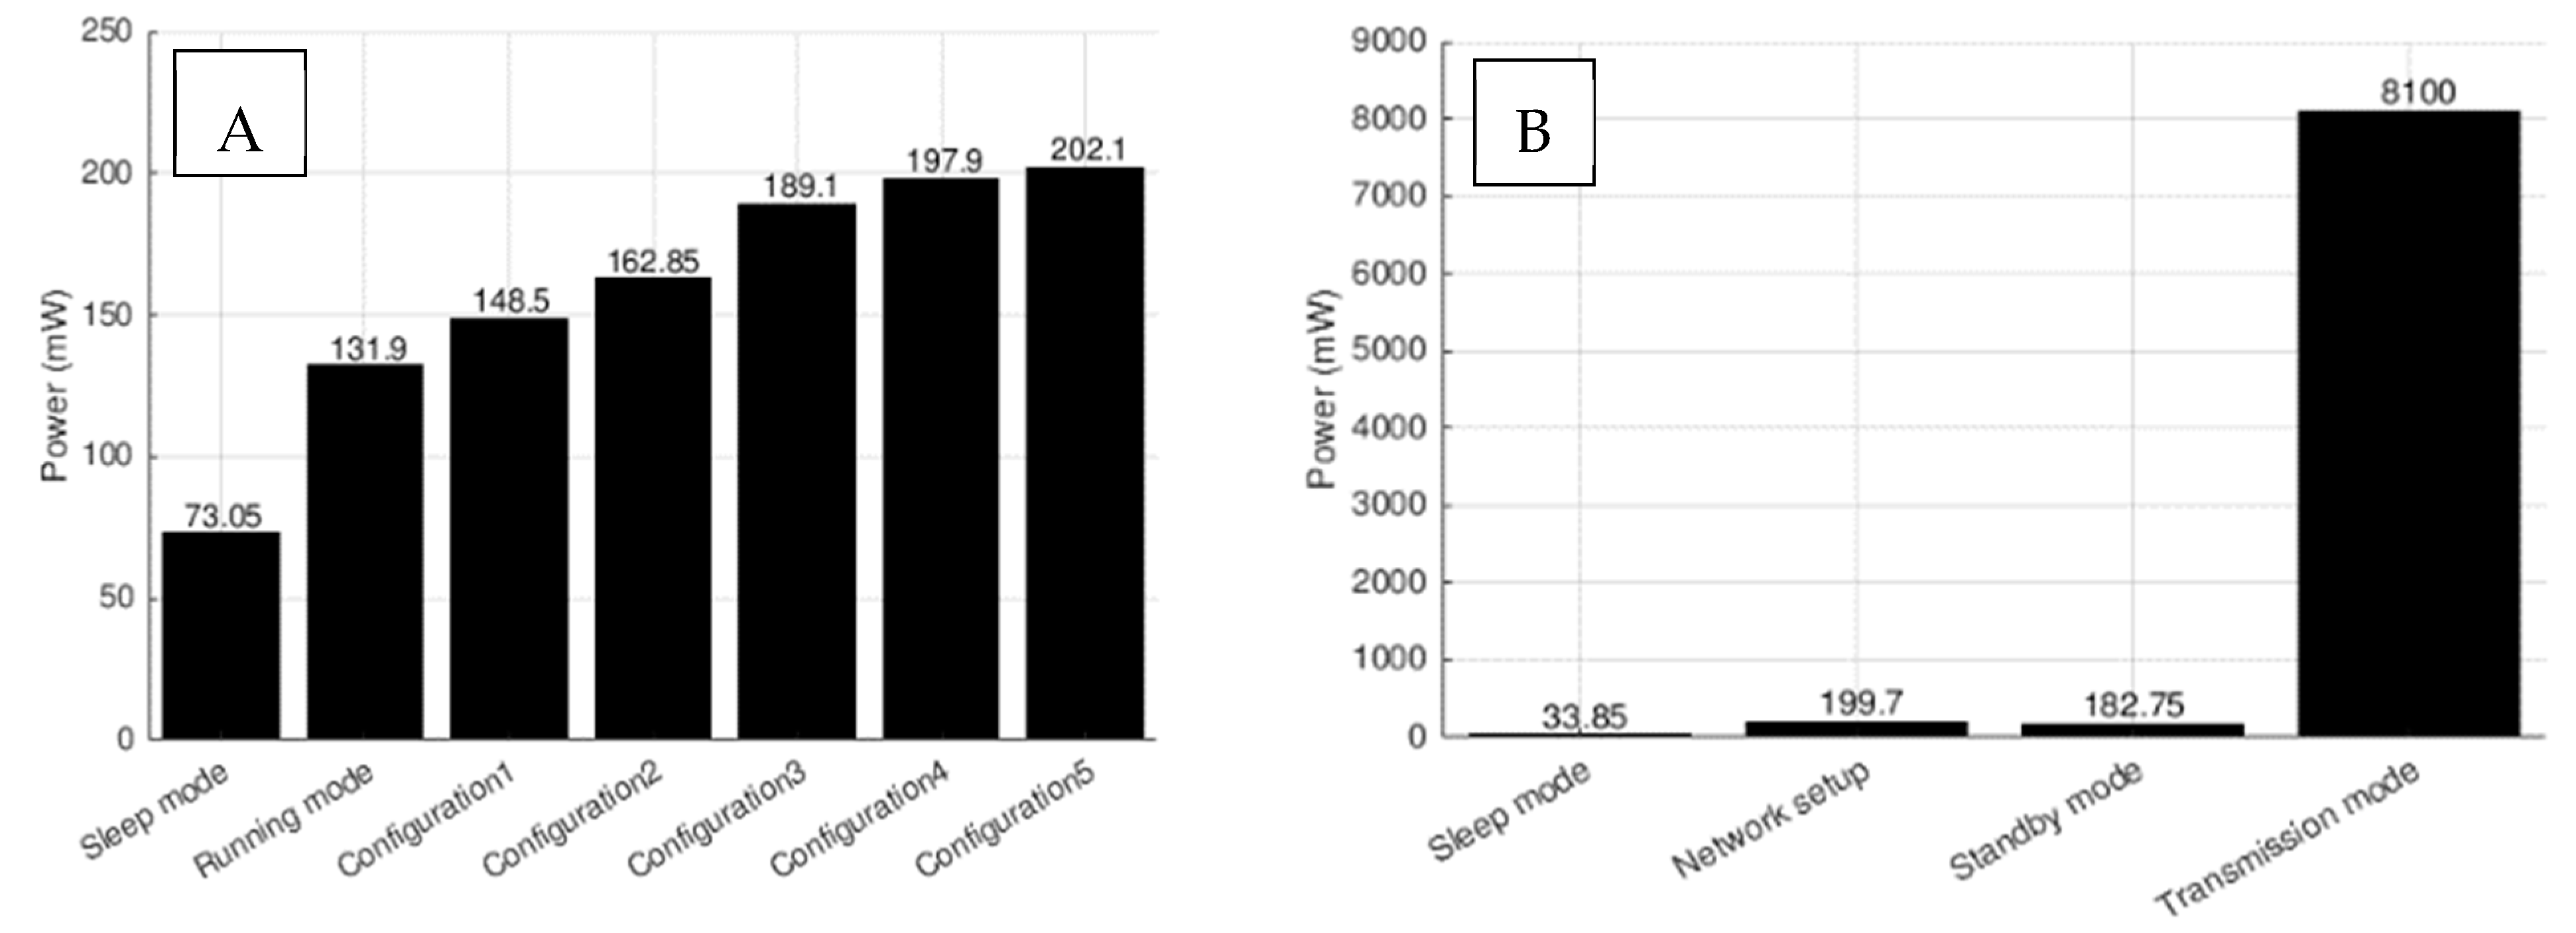
Figure 5A presents the energy consumed of the different configurations during the sampling process. These configurations offer different combinations of sensor modules (Table 3), which does not include the radio frequency (RF) module. On the other hand, Figure 5B presents the XBee RF power consumption during sleep mode, networking setup, standby mode, and transmission mode. In a typical scenario where node samples and sends data, the total energy consumed should be the sum of the energy consumed of a given configuration (Figure 5A) and the energy consumed in the transmission mode (Figure 5B). At this stage, we measured the WSN node energy consumption using periodic sampling without scheduling the WSN sensor node tasks using the EACRA algorithm that we will present later in this paper.
4.5. WSN Network Packet Delivery Evaluation
In WSN testing, we used three different gateway hardware under two different network topologies. The goal of the test is to evaluate the gateway that has better performance for given network topology and load. In this phase, we tested three different gateways: first, XBee Gateway (Figure 3D), second, Raspberry Pi-based gateway (Figure 3C), third, Arduino Uno-based gateway (Figure 3E). These gateways have different CPUs, RAM capacity, operating systems, and communication resources. These resources and their configuration have an impact on the performance of the gateway. The following Table 4 illustrates the hardware configuration of these different gateways.
We measured the packet arrival rate under different packet time interval. This test took 60 rounds. Each round lasts for 1 min. In the first round, we started with a packet time interval of 1 s, while in the last round, the packet time interval was 60 s. The test was also in two different network topologies: Full mesh topology and cluster tree mesh topology using 20 bytes packets.
4.5.1. Throughput Evaluation
We measured the throughput from each sensor node to the gateway for one minute using the XCT-U software in two different topologies: Full mesh topology and a cluster tree topology. Each sensor node sends packets of 20 bytes and waits for the ACK back from the receiving node. The data packet contains three pieces of information (temperature, motion, and humidity). Table 5 presents the results in Kbps, which are close to the values reported on the datasheet. As the distance from the sensors increases, the throughput decreases.
4.5.2. Gateway Test
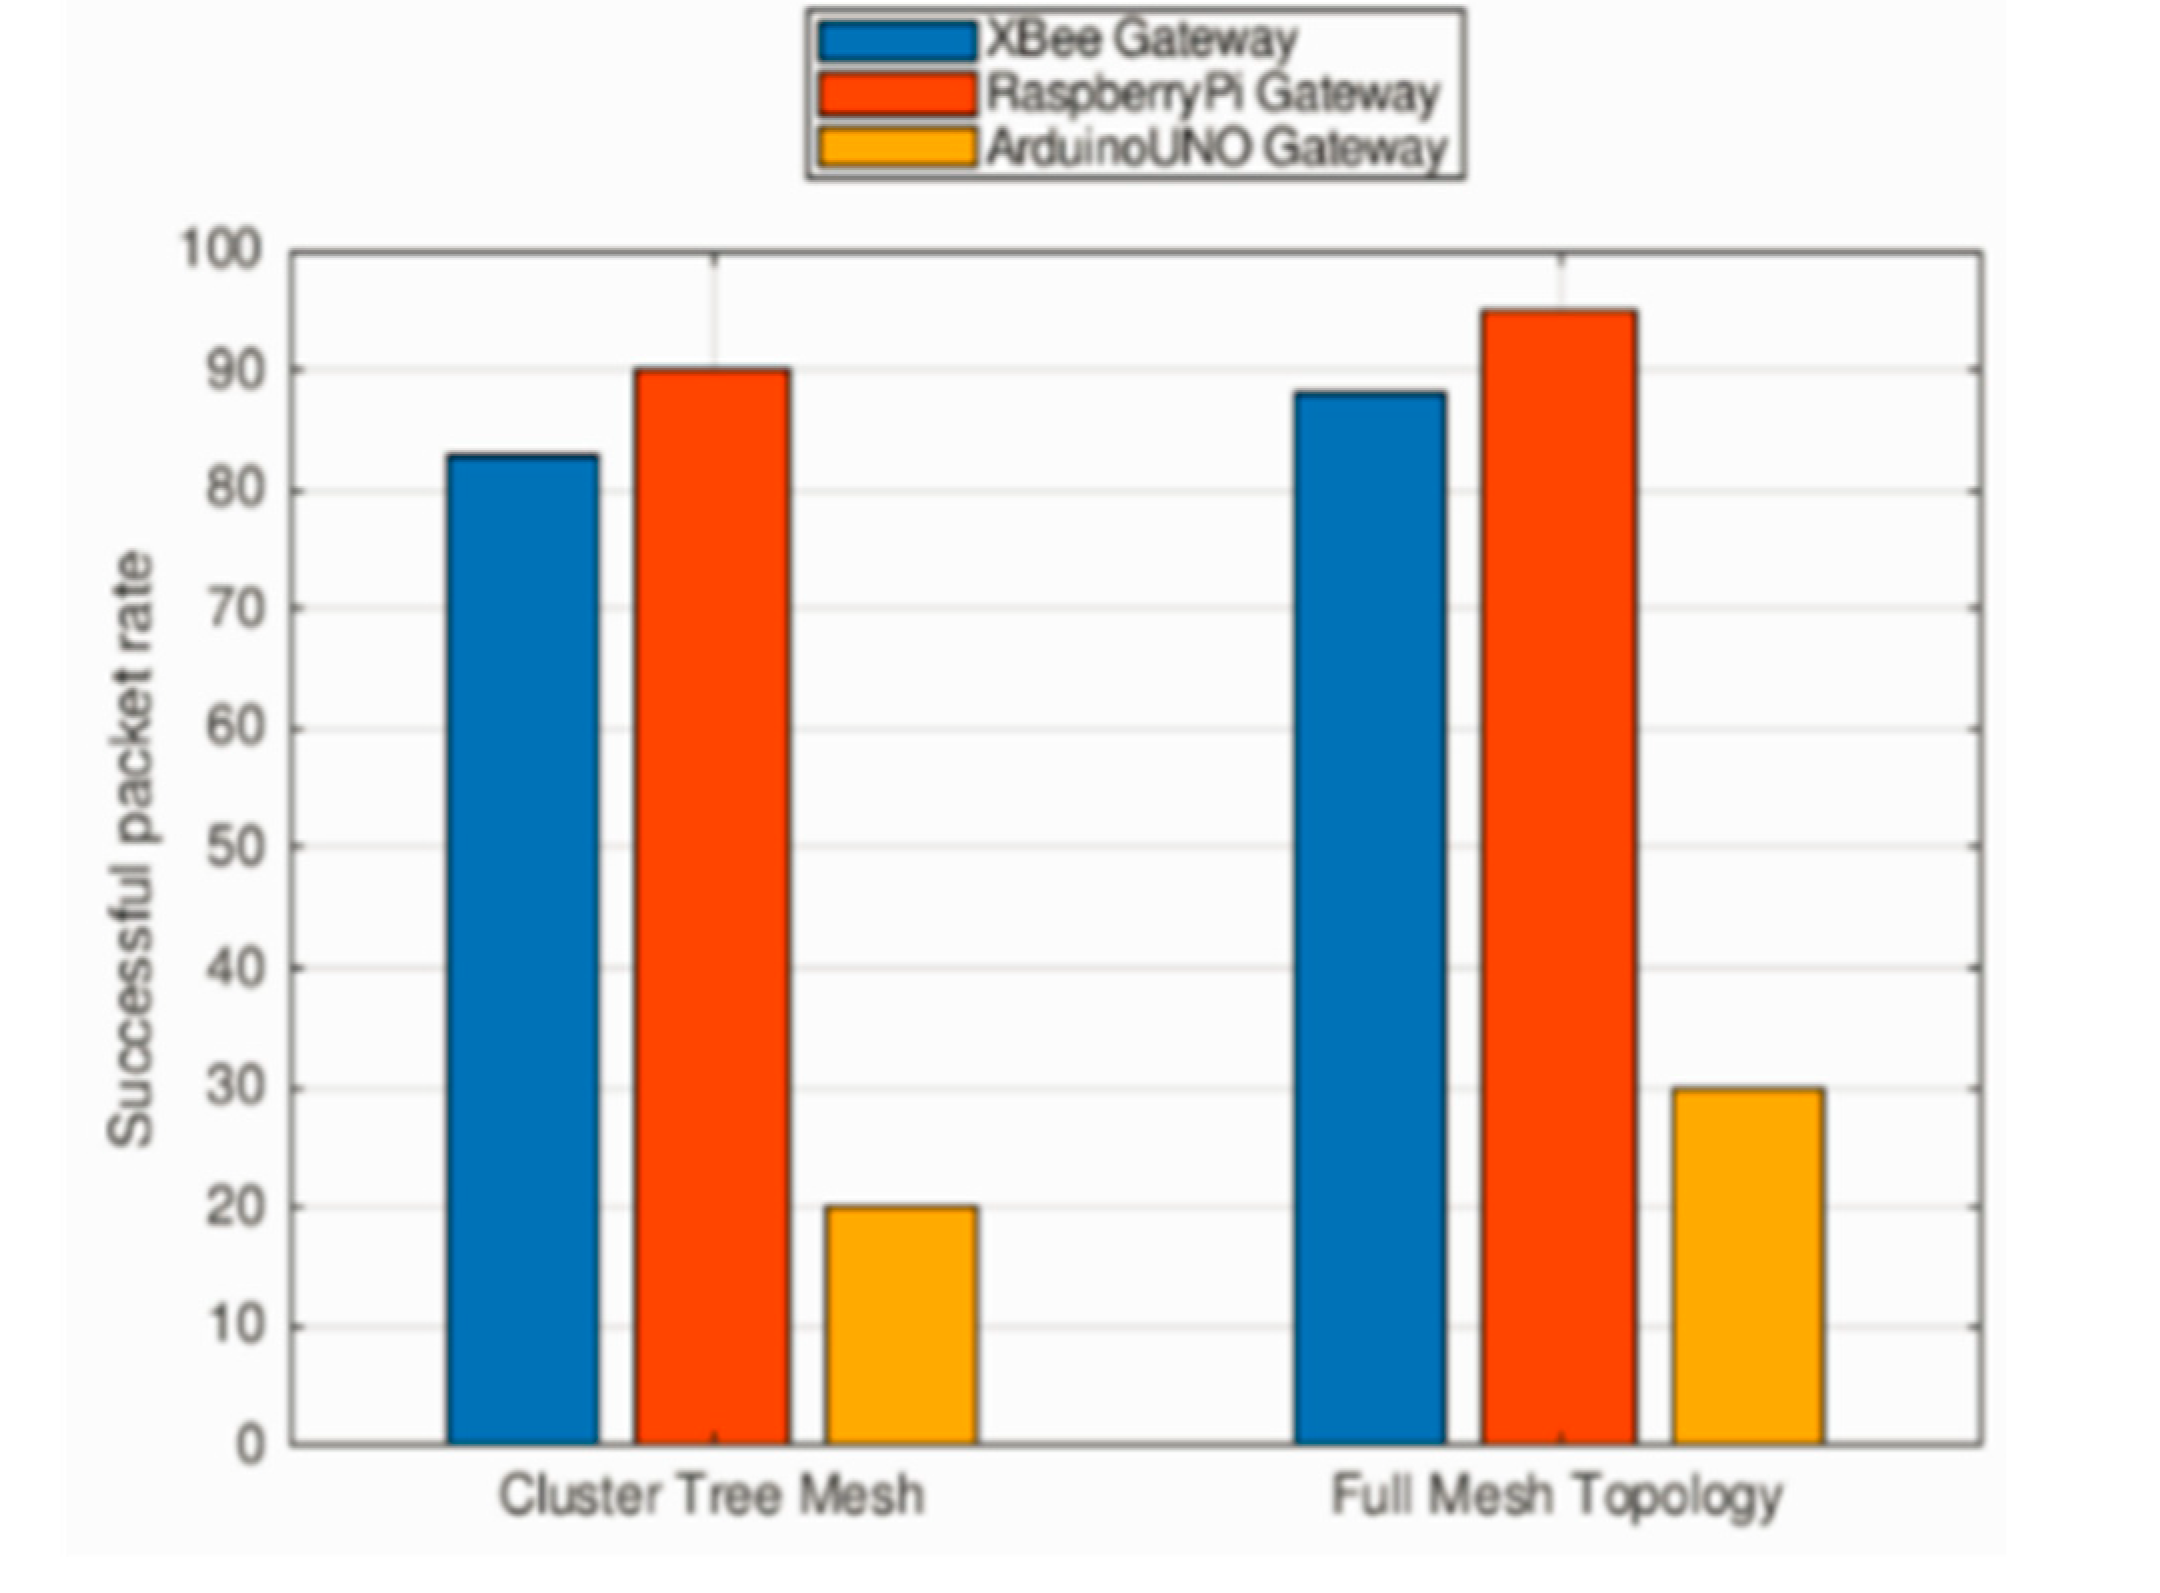
As presented in Figure 6, the Raspberry Pi gateway performs the best in both full mesh and cluster tree topologies. It reaches a 100% successful packet arrival rate at around 5 s in inter-packet interval time for full-mesh. The packet loss starts at 6 s inter-packet interval time in the cluster tree because there are fewer alternative routes, and the network is congested at the gateway. Arduino Uno gateway does not perform well in short inter-packet interval time (less than 9 s). It achieves 20% and 30% successful packet delivery rate in cluster tree and full-mesh topologies. The packet delivery rate increases as the inter-packet interval time increase, reaching 100% between 10 and 15 s. The original XBee gateways performed well in both network topologies with performance little lower but comparable to RaspberryPI.
4.5.3. Signal Power Test and Distance Measurement
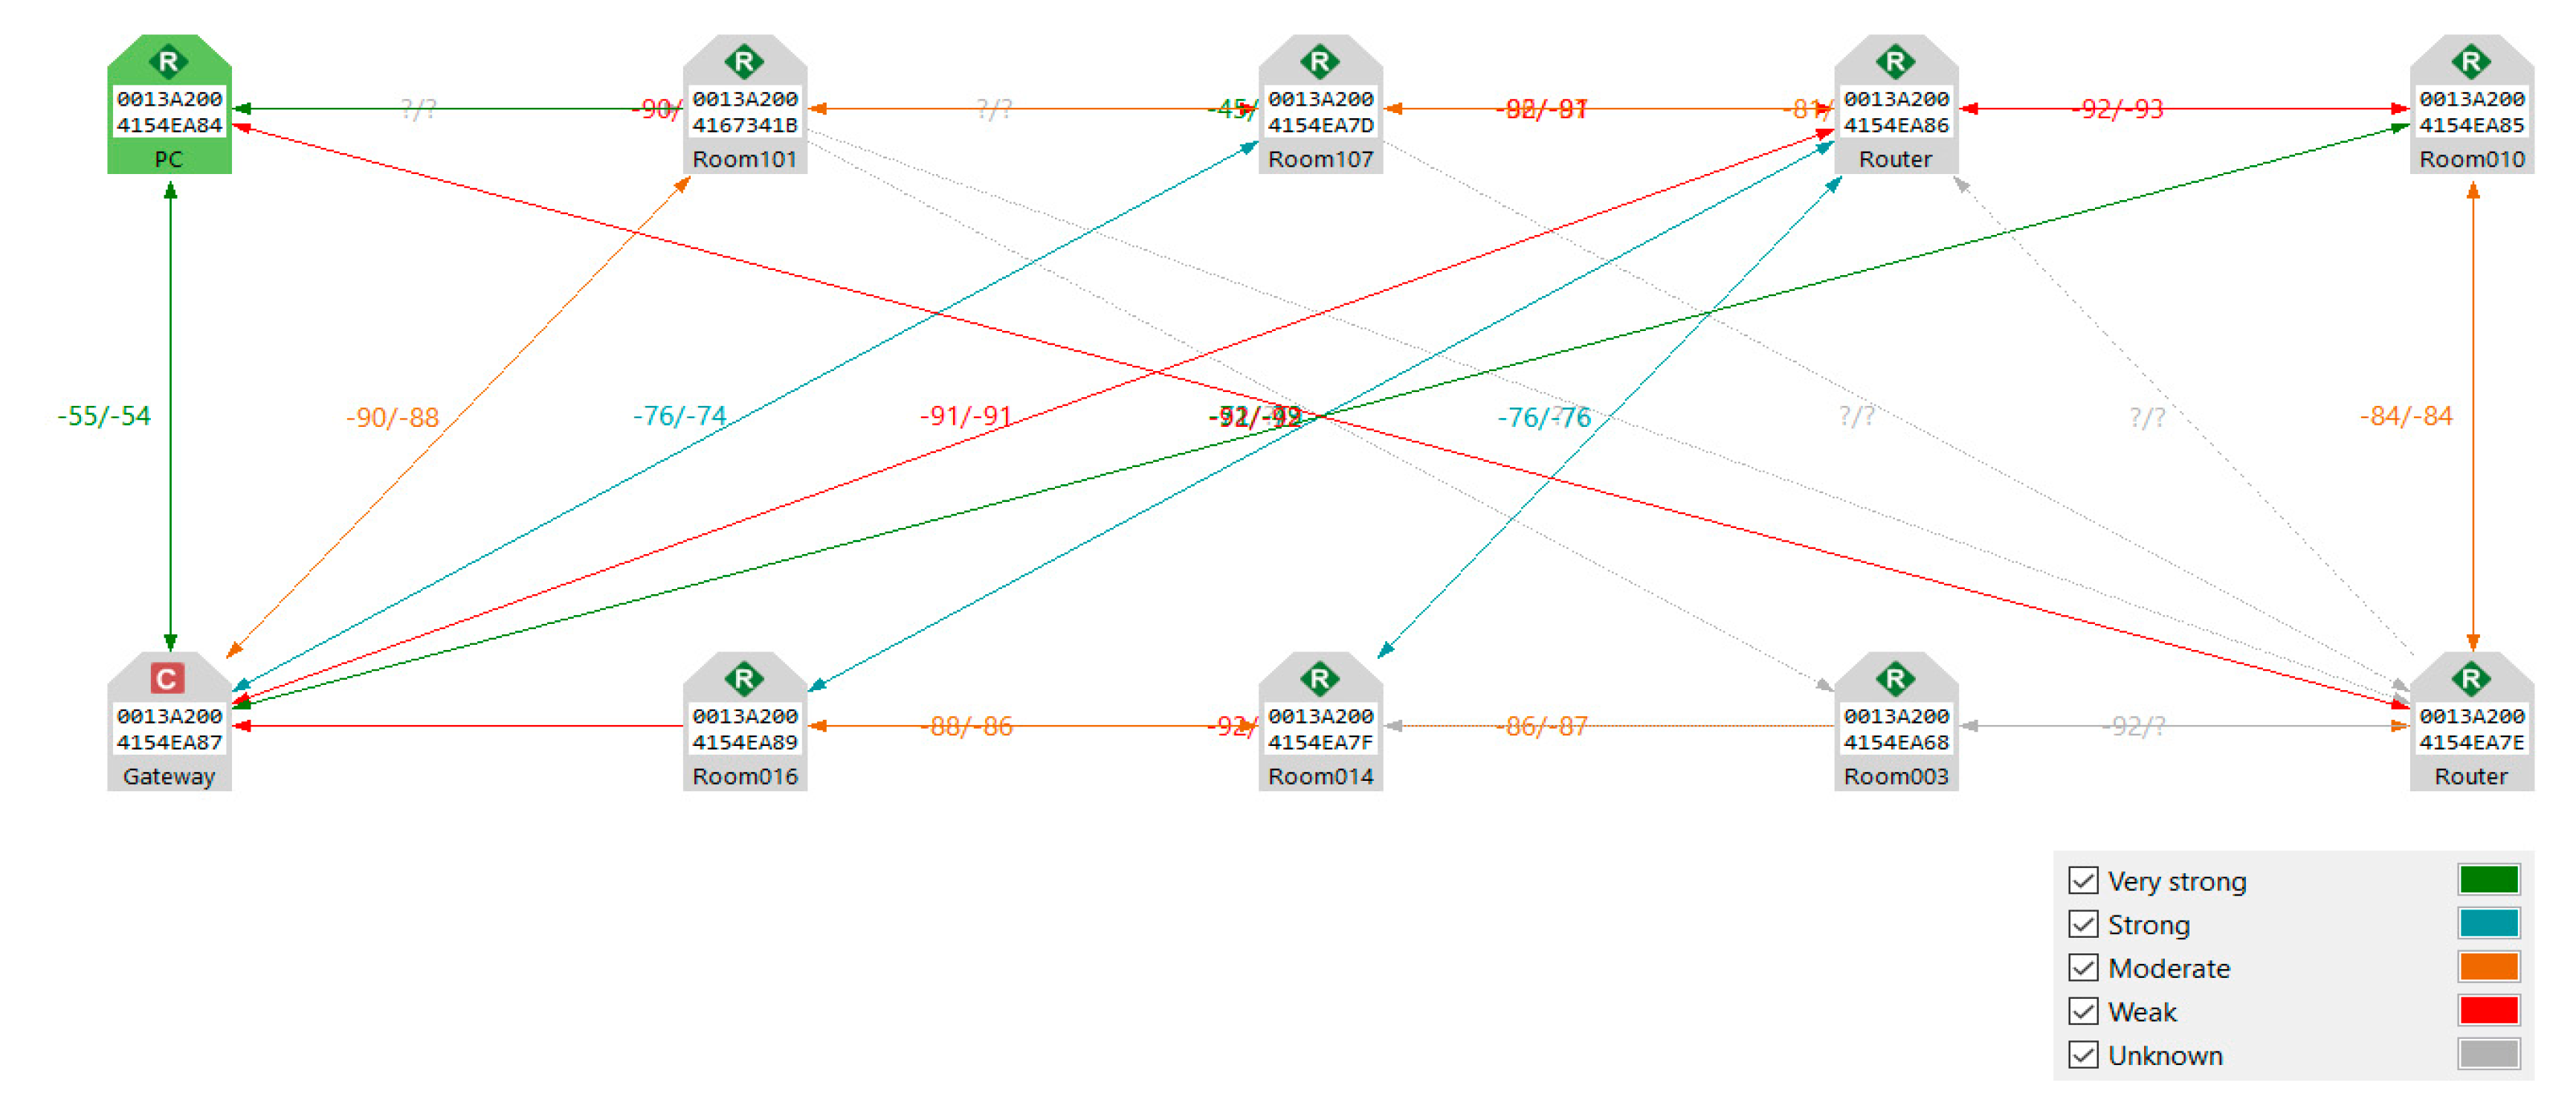
In this step, we first measured the RSSI (Remote Signal Strength Indicator) (Figure 7 and Figure 8) and then compared it to the actual distance between each pair of the ten nodes in the WSN network. The distance obtained based on the RSSI value does not match the real distance due to the indoor environment’s multipath characteristics. However, these values helped to estimate the distance to distribute nodes in a way that maintains the network’s connectivity. Table 6 shows the result of the RSSI measurement.
The values obtained in Table 6 shows that the RSSI goes down as the distance between the pair of nodes becomes higher. Among the different localization techniques, we have range-based methods such that Angle Of Arrival (AOA), Time Of Arrival (TOA), Time Difference Of Arrival (TDOA), and Remote Signal Strength Indicator (RSSI).
In RSSI, the signal propagation can be used to calculate the distance between a transmitter and a receiver using Equation (1). In an indoor environment, signals are subject to attenuation and multipath. This attenuation creates a power loss during the transmission. The distance using RSSI value is complicated because of the attenuation, which is not a linear function in an indoor environment. For this reason, the parameter n in Equation (1) varies from 1 to 6 depending on the environmental conditions. For this reason, the RSSI model takes into consideration the fade margin. As a result, Equation (1) [19] can be leveraged in order to calculate the distance.
Dk = 10(Ak-RSSIk/10*nk)
We repeated the RSSI measurements several times for accurate data, where k is the number of repetitions to get a realistic distance based on different RSSI measured values. RSSI is the value measured by the receiving node. D is the distance between the two nodes, while n is the environmental conditions. A is the absolute value of RSSI for a distance of 1 m. The manufacturer of the node provides this absolute value.
ni = (A + RSSI)/−(10*log(D))
A given RSSI value does not mean a specific distance because indoor conditions differ from one building to another. Hence, we will use distance measurement equations with specific parameters of the building. For this reason, we measured the actual distance and the RSSI value between each pair of nodes; then, we calculated the variable n, which was the environmental condition. This variable n was used during the node positioning inside the building. For more accurate data, we considered three different communication scenarios. First, both nodes are at the same room. Second, the nodes are in different rooms. Third, both nodes are in the hall. Fourth, one node is in a room while the other one is in the hall. To compute n, we used Equation (2) [19].
Table 7 illustrates the results of calculating the n value and the RSSI value, and the actual distance.
When we measure the distance between two nodes A and B, a specific was used (Table 7). For example, to measure the distance between Router3 and sensor node in Room003 (look at Figure 4), the value of was used. The next Table 8 presents the result of applying Equations (1) and (2) on data in Table 6. This table also shows the actual distance versus the distance measured using Equation (1).
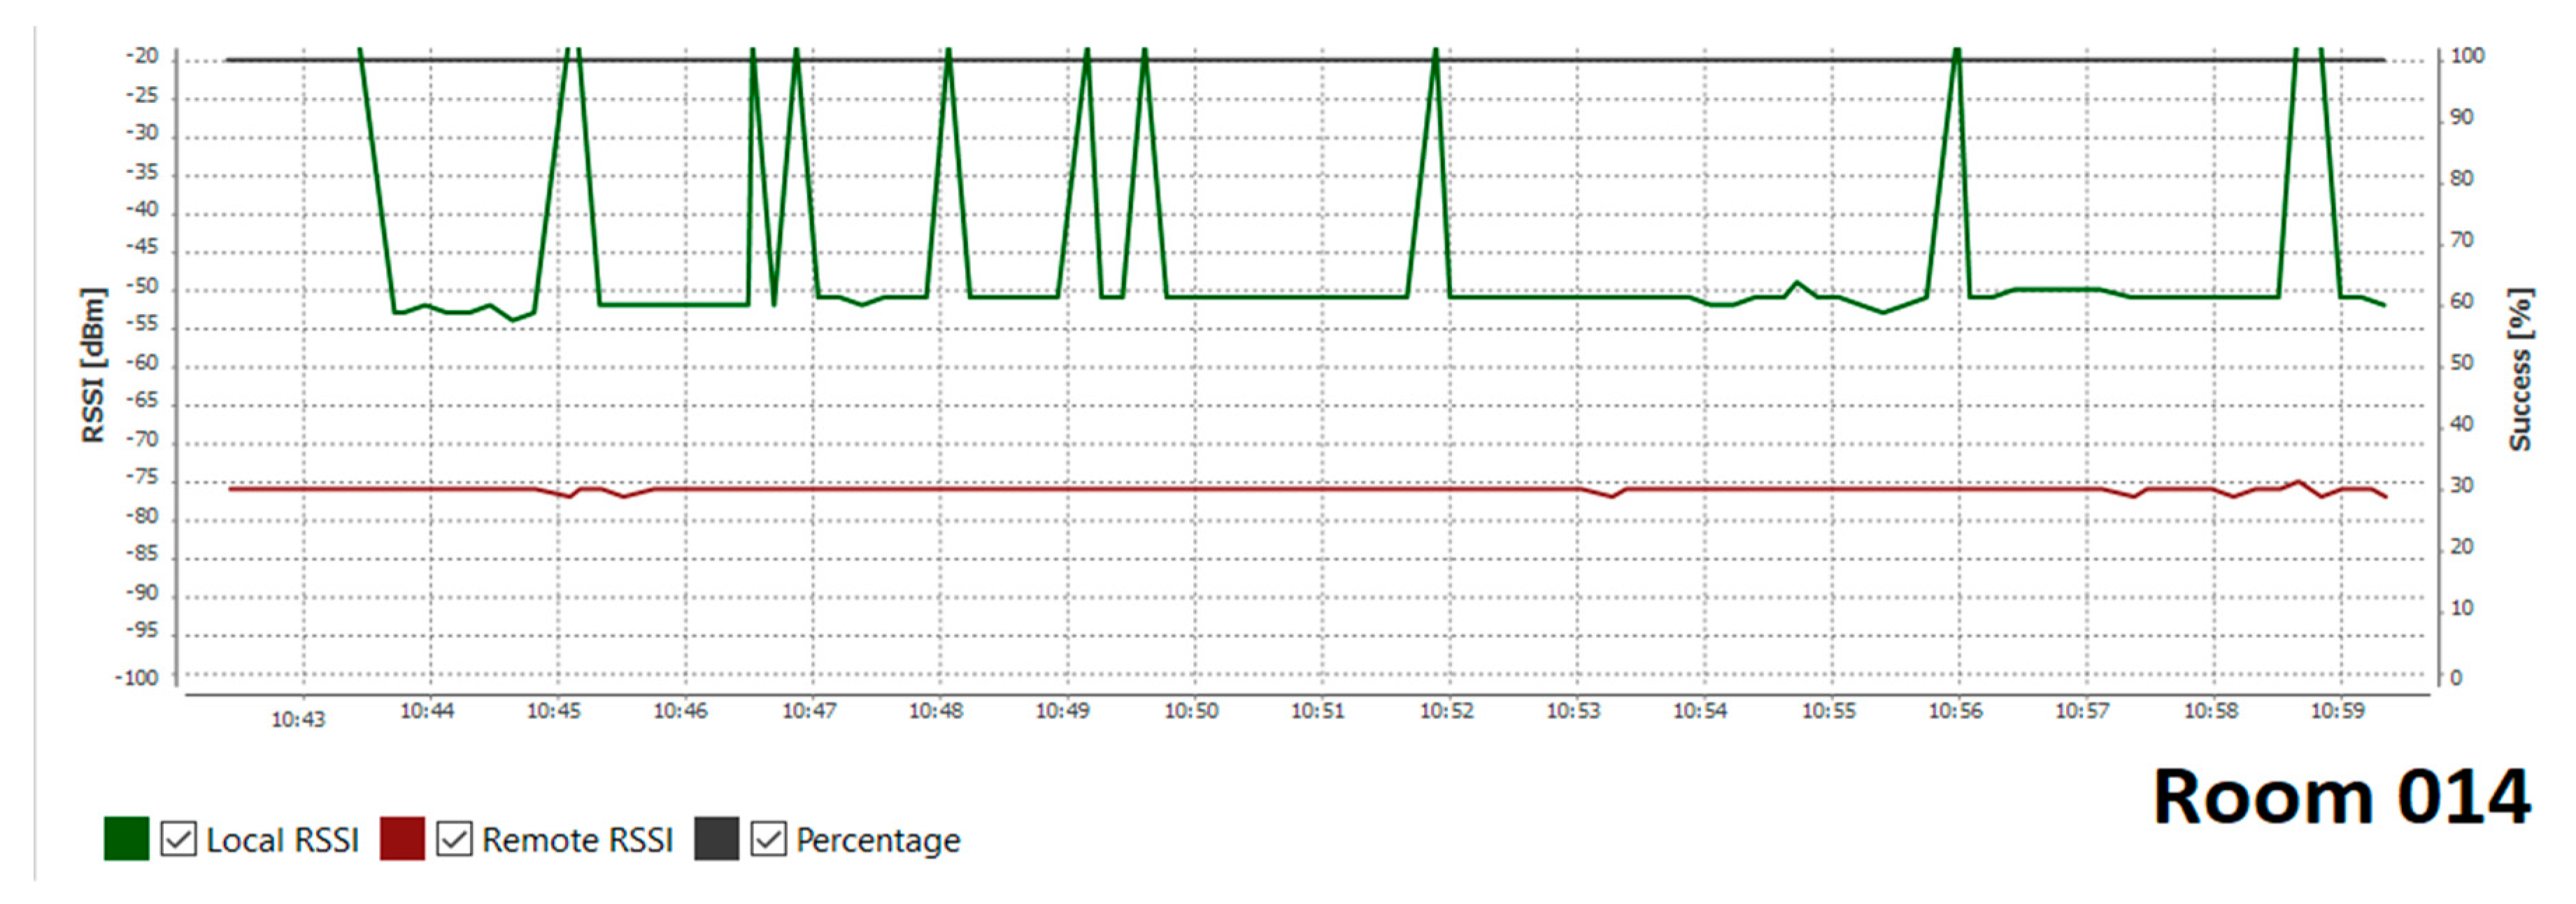
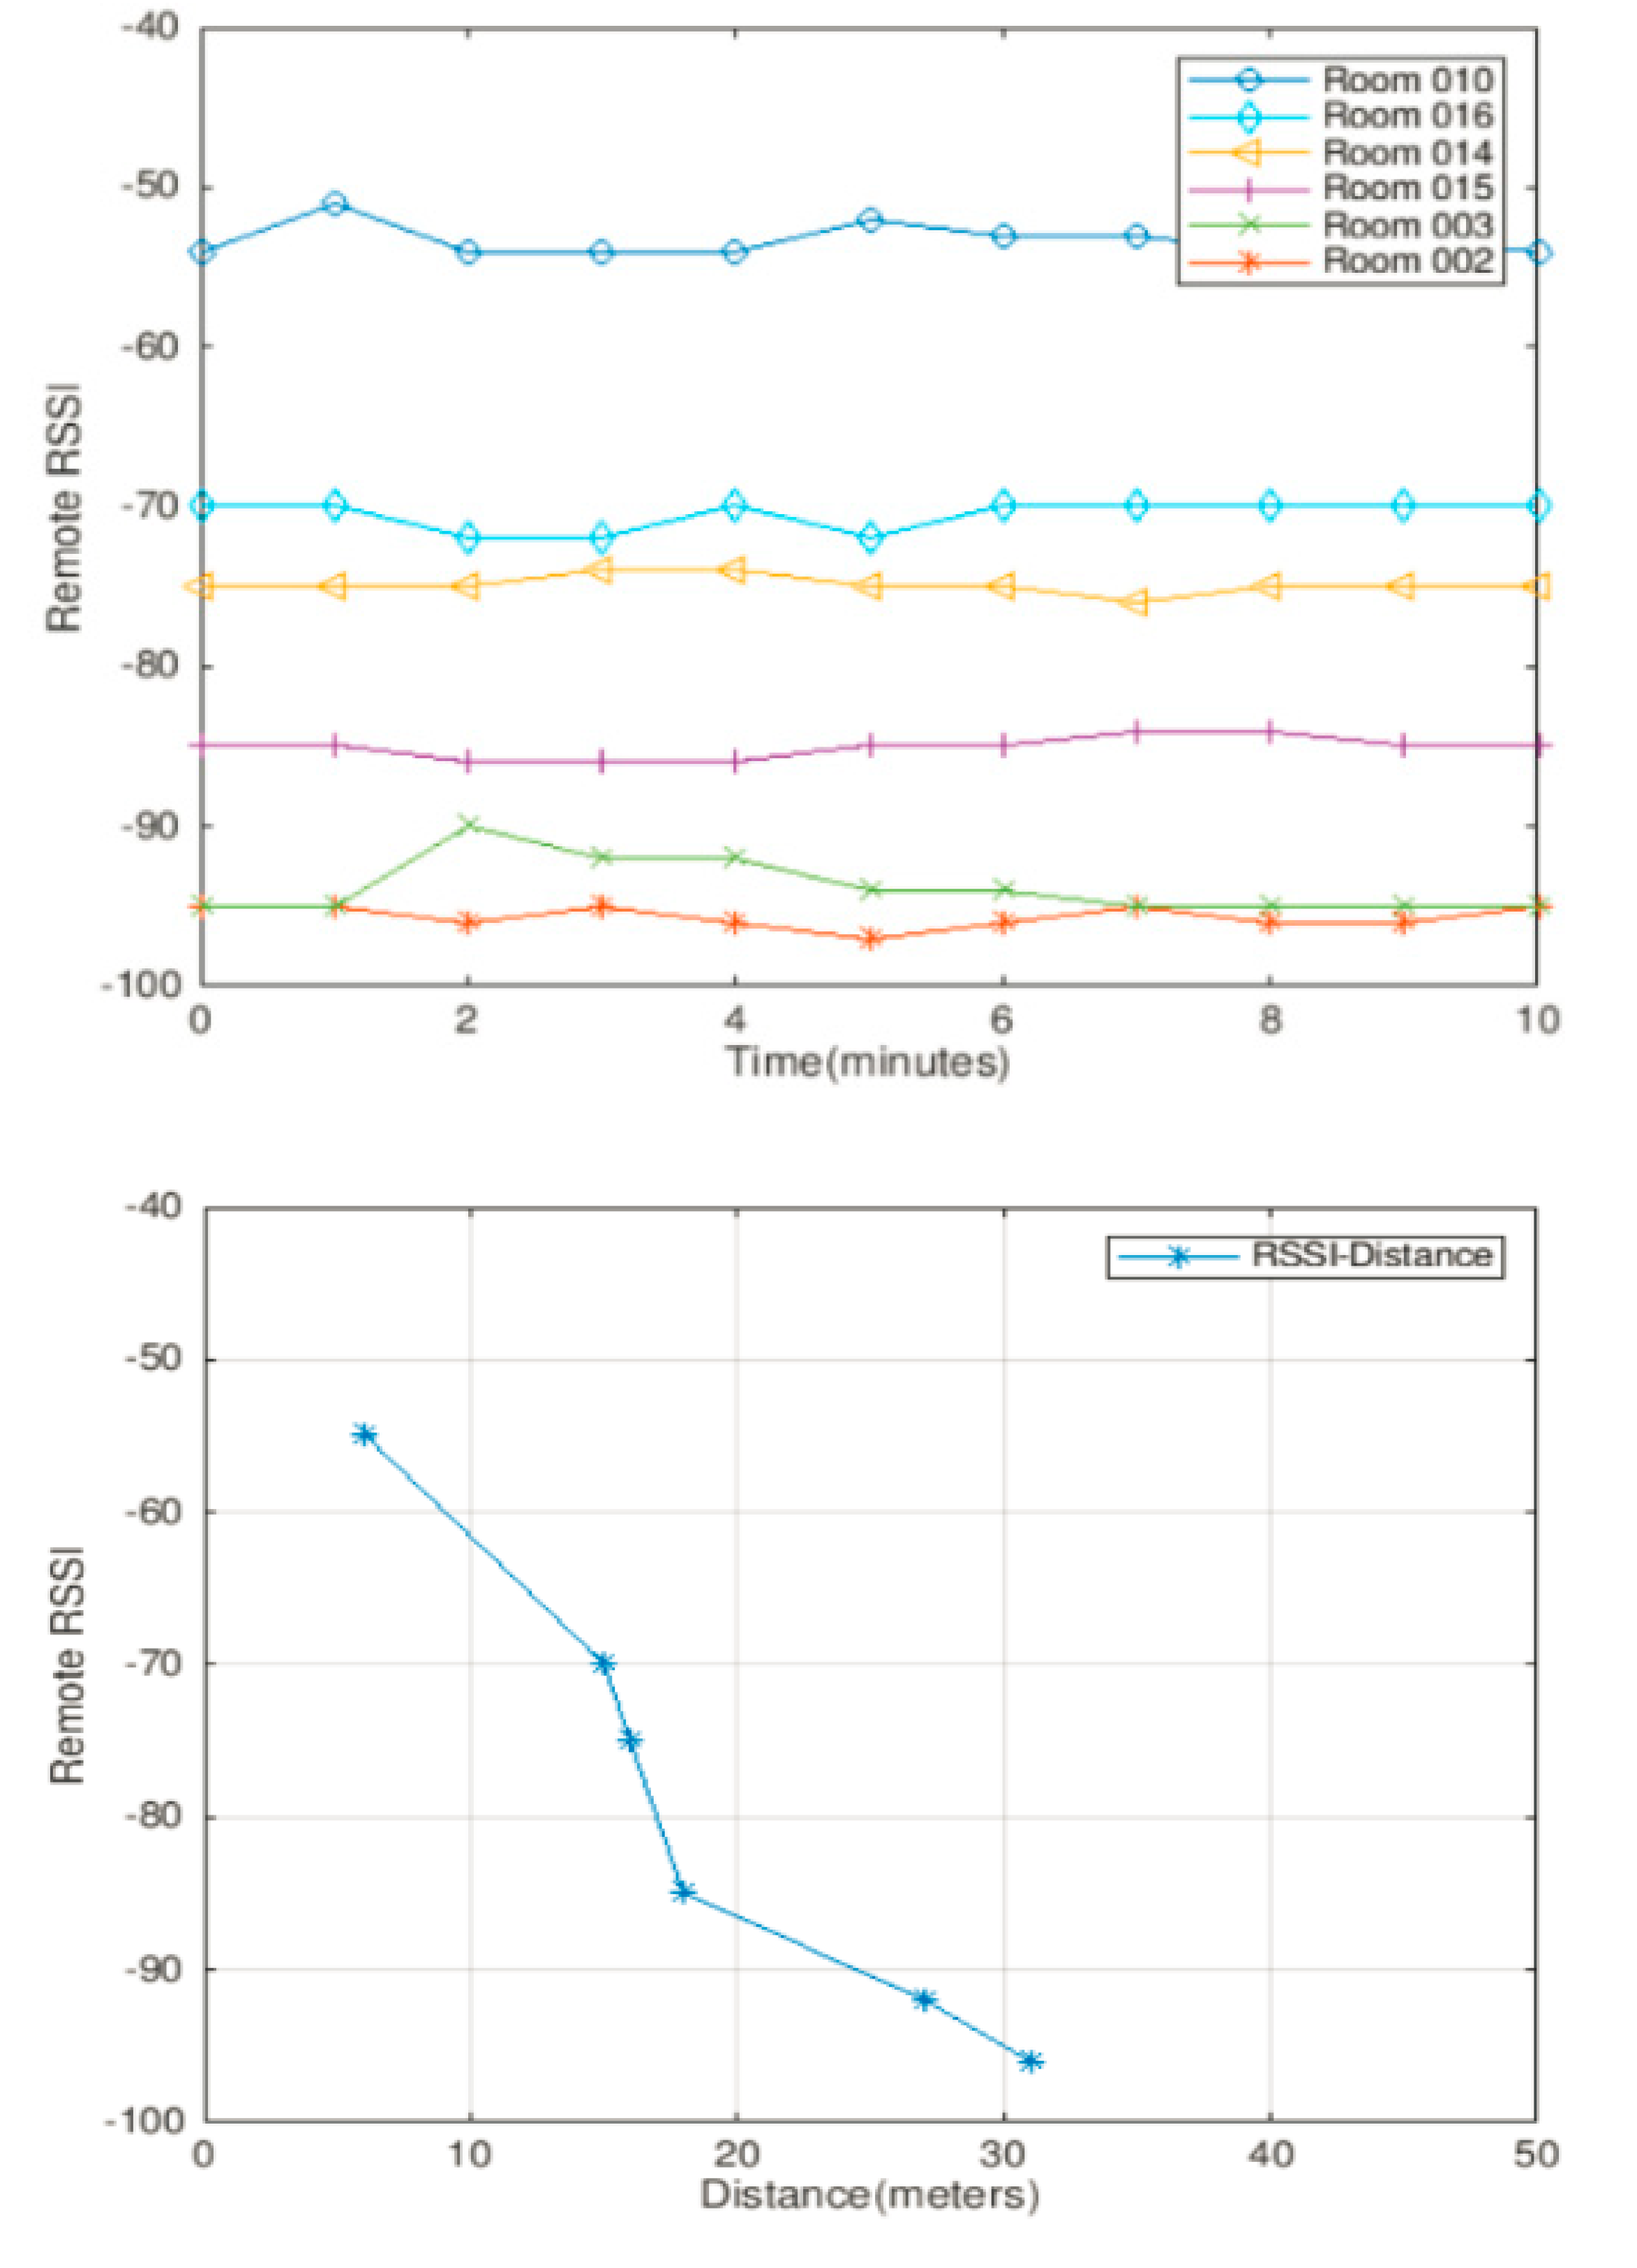
The actual distance does not match the distance calculated based on the RSSI value. However, these measurements will help us during the positioning of nodes for good connectivity between WSN nodes in large-scale implementation. The next step was to measure the RSSI value from each sensor node to the gateway. Figure 9 shows the RSSI value in dBm of each sensor node for 10 min. It shows that the RSSI value decreases as the distance between the sensor node and the gateway increases. The experiments showed that the signal between two XBee S2C nodes is still detected when the distance is 60 m, almost 63 m, which is the value declared in the XBee manufacturer’s datasheet. However, to send real data (temperature, humidity, and motion), the distance should be between 9 to 45 m depending on the intermediate space conditions between the sender and the receiver. The next Figure 9 presents the distance measurement compared to RSSI value.
The RSSI goes down as the distance between the node and the gateway increases. The received signal strength is converted to RSSI, which is the ratio of the received power Pr to the reference power Pref by the following Equation (3) [19]:
RSSI = 10*log(Pr/Pref)
The parameters Gt and Gr are the gain of the transmitter and gain of the receiver. λ is the wavelength, and d is the distance between transmitter and receiver.
The sensor network design and their performance evaluation presented in this section play a key role in the effective deployment of a sensor network that is energy efficient and operating effectively to provide data about the building’s context. This information is then processed by the context-aware energy management system implemented at the building level. First, we will discuss the methodology we followed to model the context in buildings and then the implementation strategy using Finite State Machine, then present the real building implementation evaluation.
4.6. Context Recognition Using the Context-Based Reasoning Model
In SEEB, the execution of energy policy rules depends on context recognition. The context is the knowledge about the undergoing situation/scenario of a given location at a specific moment of the building (Figure 10). In this case, we used the Context-Based Reasoning (CBR) model to model the university campus’s buildings for better context recognition.
The context recognition is based on the declared knowledge about the building using two types of parameters. One type of parameter is dynamic parameters generated by the WSN data acquisition, namely temperature, motion, humidity, and occupancy. The other parameters are static parameters that describe the building type, room type, season, current day, and part of the day. These parameters are fetched from the database of the EMS. The context identification results are input parameters to the appropriate control decision, which is implemented using Finite State Machines (FSM) [20] that basically enables or disables the heater. The control algorithm and its structure are guided by the energy policy set by the building manager.
When designing services for a building, the HVAC system, for example, we need to identify the set of contexts, transition rules, dependencies, and the relationship between contexts. We can also describe contexts as adjustable filters that generate different types of knowledge. This concept of context can provide a model to decompose a complex system into interconnected “scenarios”, where knowledge that can be inferred using static and dynamic parameters is of the following types:
- Action knowledge: This knowledge represents the operational intelligence for a specific situation. It can be coded with logic rules or learned using machine learning, evolutionary algorithms, etc. In our case, the system needs to switch the heaters of the building ON or OFF.
- Transitional knowledge: It states when a transition to another context is needed. This transition can be expressed as “IF-Then” transition rules or any other type of triggering mechanism.
- Declarative knowledge: This knowledge describes some aspects of the context to include some of the pre-acquired experience for the context—for example, the number of inhabitants, room size, or room usage schedule.
The Context-Based Reasoning Model partitions knowledge into a multi-level hierarchy representing a vertical relationship between groups in a set G = {G1, …, Gn}, where a given group Gi ∈ G contains a set of mutually exclusive contexts Ci = {, …, }. An active context in Gi is active within the context of its parents; which makes it inherently functional, transitional, and declarative knowledge from the hierarchy above Gi−1.
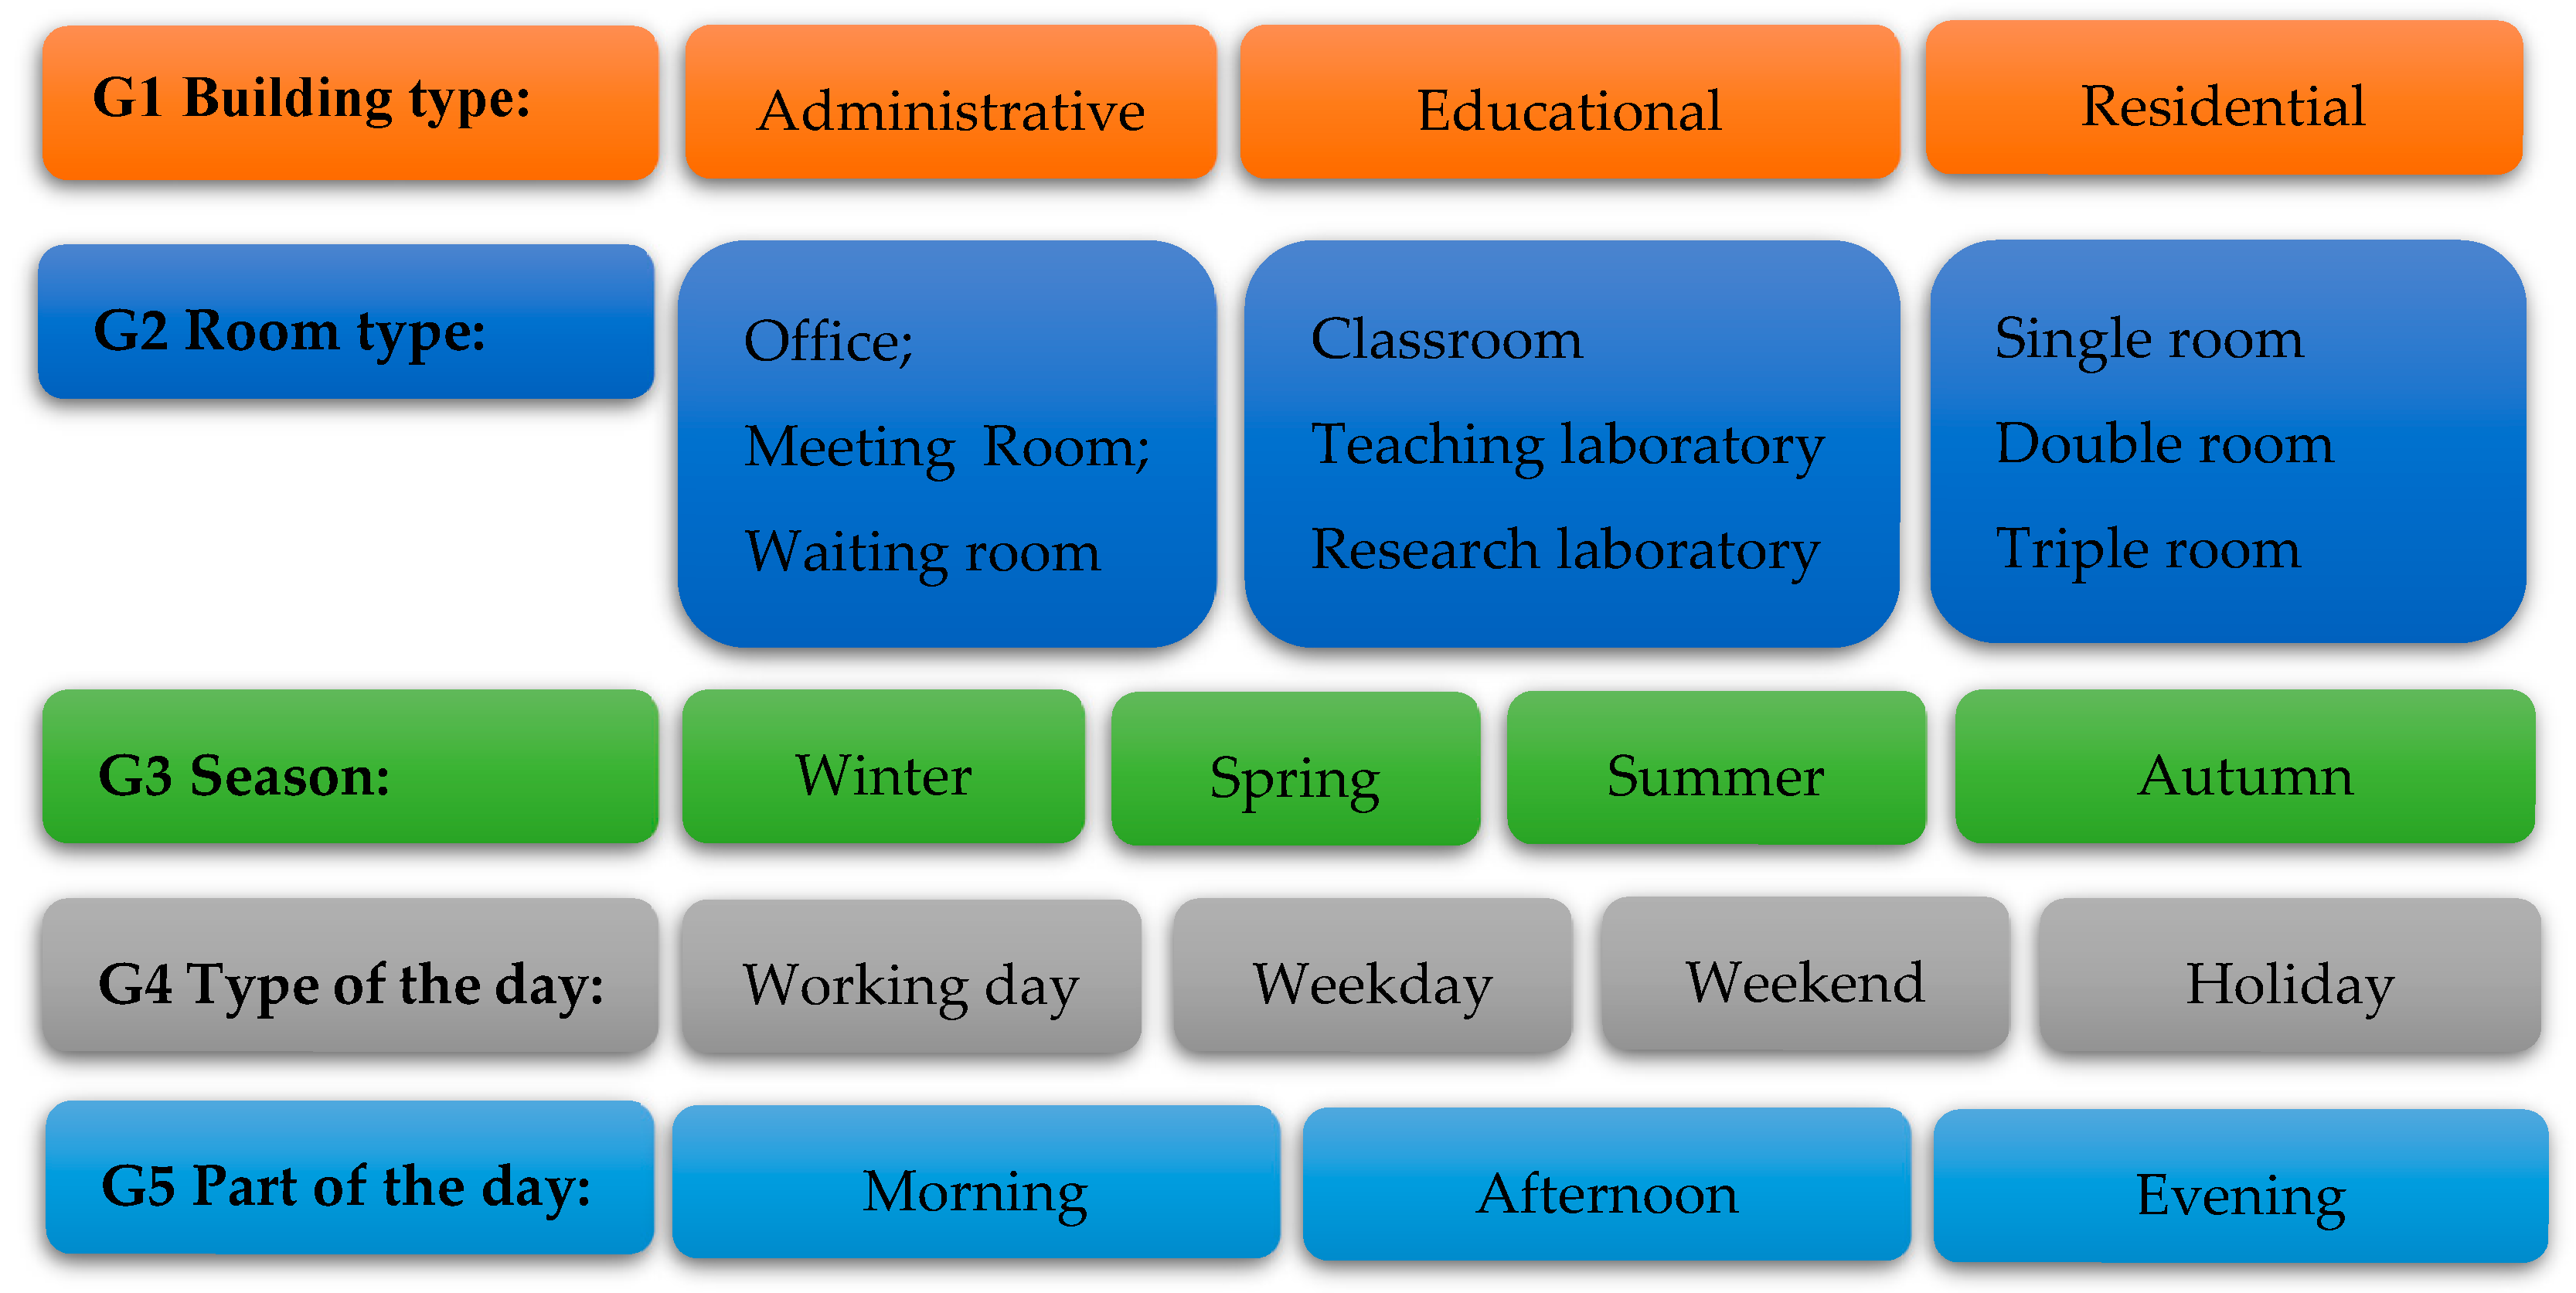
Based on the CBR model, we developed a set of groups. Each group contains one type of entity, for example, building types, room types, seasons, etc. This information represents the static type of knowledge needed to infer the context. This static knowledge can be drawn by selecting an element from each group following the order from G1 to G5 (Figure 11).
The values obtained from both the database and the WSN data acquisition deem as input parameters to the controller to decide whether to enable the heating process.
First, the declared knowledge, which can be drawn by selecting an element from each group, is obtained. Hence, the number of contexts varies based on building types, room type, etc. For instance, in the administrative building, there are three active contexts (depending on the room type) at each moment among the 144 possible ones in all-time (1 × 3 × 4 × 4 × 3 = 144). In the educational building, there are four possible contexts (depending on the room type) at each moment among the 192 possible scenarios in all-time (1 × 4 × 4 × 4 × 3 = 192). In the residential building, there are four possible contexts (depending on the room type) at each moment among the 192 possible ones in all-time (1 × 4 × 4 × 4 × 3 = 192).
Second, the EMS builds knowledge about air quality, temperature, lighting, door/window status, and occupancy based on data sent by different sensor modules. The next table presents the various sensor modules that could be used to build the knowledge. Each sensor node presents specific data, which deem as the building block of the knowledge (Table 9).
4.7. Appliance Control Using Finite State Machine (FSM)
In this deployment, we tested the ON/OFF control method which was implemented using FSM (Figure 12) [20]. In this implementation, FSMs control heaters where the context change drives transitions between states. Such implementation effectively minimized the processing load, especially when adopting multithreading in data acquisition and control.
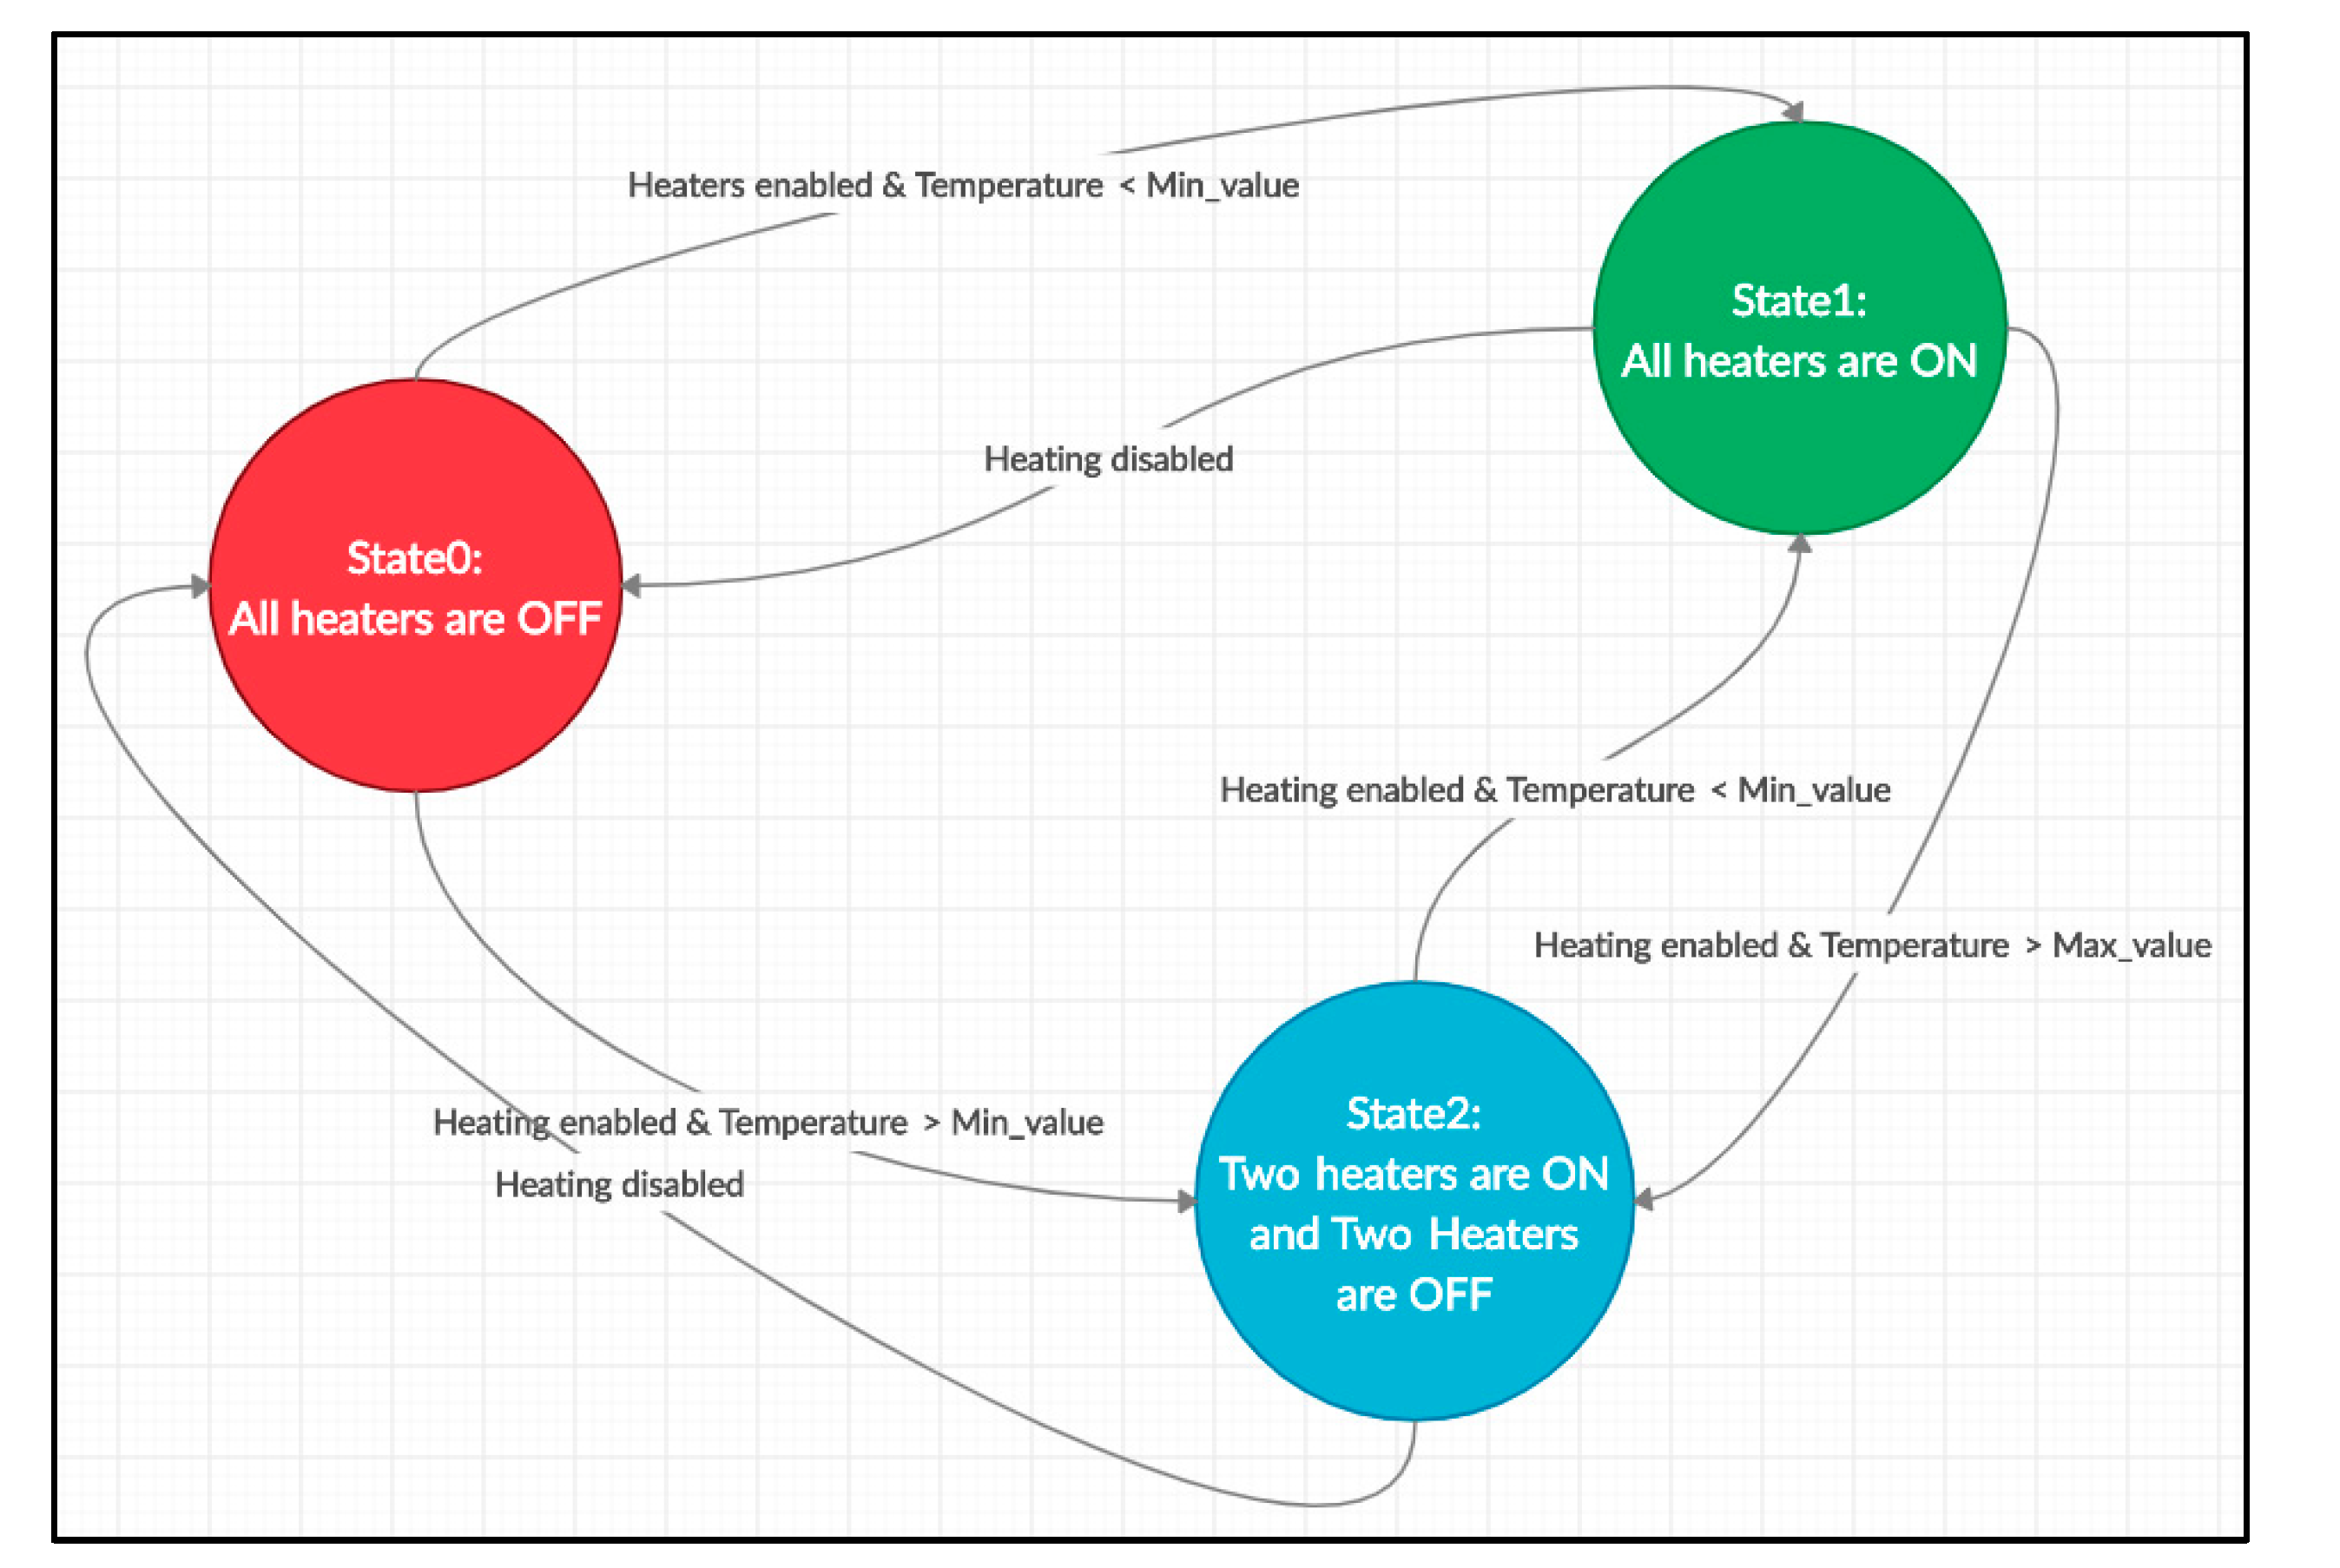
The proposed EMS, which adopts the classical control method (ON/OFF), was based on a set of predefined rules in the draft energy policy document. To apply these rules, the EMS represents each rule by a state in the FSM that is generated automatically by the system. For example, when the EMS is about to apply a control upon the heater(s) in a given room, it checks current conditions (season, building type, room type, day/night), then it constructs an FSM and links it to the heaters of that room. A given room’s conditions include temperature, humidity, occupancy, and the door and window situation (open or closed). These conditions were transmitted to the server running the application via a WSN. The database server contains declared knowledge. For instance, the building type, source of energy (biomass/electricity), room type (bedroom, classroom, laboratory, office, meeting room, auditorium, number of heaters, number of windows). The room volume is an essential piece of information alongside the outside temperature that helps the heating system calculate the needed time to heat the room. The database also contains scheduled events, schedule of classes, etc. EMS considers the previous input parameters and the energy policy rules to control the heater(s). This control is implemented as an FSM. Figure 12 illustrates the state diagram of the FSM that controls a laboratory room called Linux Laboratory. This FSM has three different states. In State0, all the heaters are OFF. This state runs when the heating process is disabled, for example, during the holidays.
A transition occurs from State0 to State1 when heating is enabled, for instance, during the working days. This transition is conditioned by having the temperature value less than min_value. When State1 is running, all the heaters are ON. The transition from State0 to State2 will occur when heating is enabled, and the temperature value is more than max_value. In State2, only two heaters are ON, while the other two heaters are OFF. Moving from State1 to State2 is the fluctuation process, which is possible only if heating is enabled. When the temperature value is above min_value and less than max_value, State2 runs. At the same time, State1 runs only if the temperature value goes below the min value. Finally, as long as conditions do not change, the current status remains the one running.
4.8. The Impact of Using EACRA on the WSN Topology and Data Packets Routing Process
Sensors are battery constraint devices, and it is essential to optimize their energy consumption to minimize maintenance dispatch frequency to change the batteries. Therefore, we developed an Energy-Aware Context Recognition Algorithm (EACRA) (Figure 13) that dynamically configures sensors to send specific data under specific conditions and at a particular time, thus avoiding redundant data transmissions. In designing this algorithm, we took advantage of the CBR model’s declared knowledge about the different buildings and rooms. Hence, this algorithm will have the sensor node send data only when the context changes. The EACRA algorithm decreased the sensor’s energy consumption as the number of samples, used modules, and transmissions were minimized [21]. The deployed algorithm takes advantage of the wireless mesh network topology’s benefits [22,23] to deliver better results.
Energy consumption in the deployed WSN nodes can be optimized at the following three components: XBee RF, Arduino Nano programming board, and the attached modules. The XBee RF can consume less energy in the transmission mode if it sends a minimum number of packets with less data payload. The EACRA algorithm identifies the building type and the room’s type of usage-based on room ID. Then, it generates the sensor schedule and configuration that will be valid during a period of time (lease). This configuration is then sent to the sensor node. The lease schedule is updated twice a day; the first schedule is attributed in the morning at 6 a.m., and the second schedule is updated at 7:00 p.m.
As EACRA schedules sensors based on the declared knowledge of the building, the WSN graph changes frequently. Hence, in some scenarios, some sensor nodes ended up isolated with no link to the rest of the network as the neighbor sensors were put to sleep by EACRA. Therefore, we investigated the different ways which can accommodate this problem.
As a result, we enhanced the EACRA to maintain the network connectivity by turning on some sensor nodes that were put to sleep by the EACRA. The selection of which nodes to wake up is based on different criteria to maintain network connectivity with fewer nodes being ON.
This study investigated two network topologies: The full mesh network and the cluster tree mesh topology. There were no isolated nodes in the cluster tree mesh as the router nodes were always ON while only the sensor nodes were put to sleep. The problem of isolated nodes raised in the full mesh network; hence, EACRA was enhanced to have an initial view on the topology, connected nodes, graphs, trees, and routing tables of each node. As a result, when EACRA finishes scheduling sensor nodes, it checks the topology looking for potentially isolated nodes and then turns on the nodes that can provide total WSN connectivity.
4.9. The EMS’s Web Application
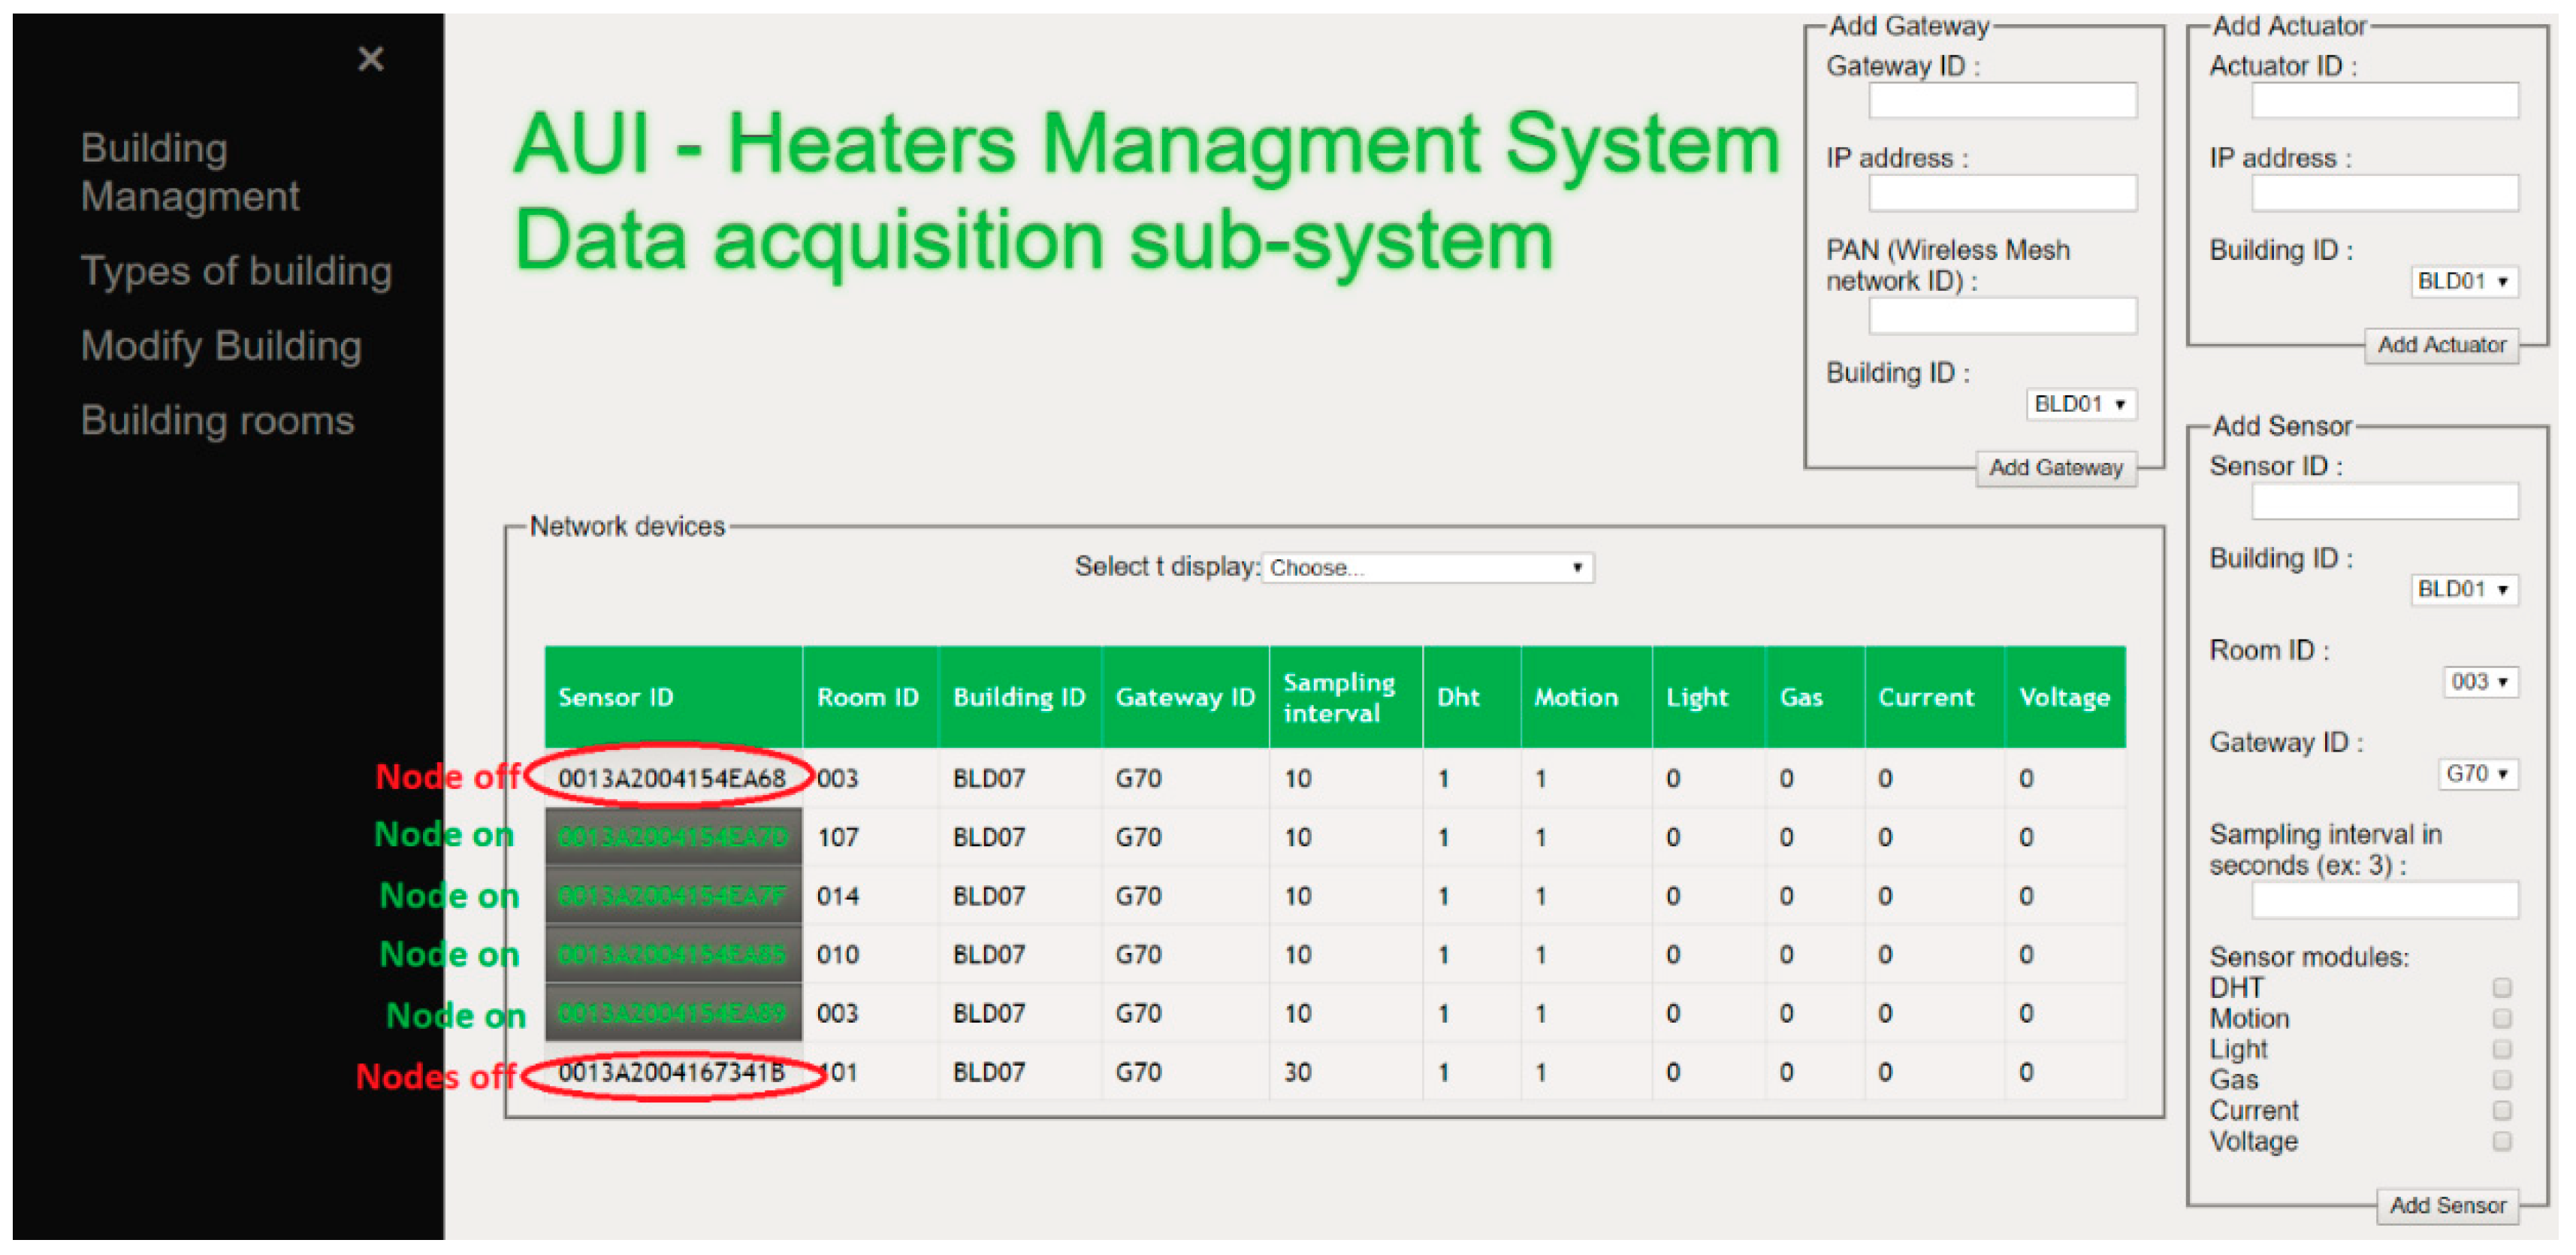
The frontend of the EMS was a web application through which the admin could manage the whole EMS, including WSN and Buildings. The admin could declare WSN nodes, gateway devices, and electrical heaters. In addition, through this web application, the admin declares knowledge about the building types, rooms, etc. The web application also allows the admin to visualize active Sensor nodes and heaters status to keep track of the EMS status through notifications. In developing this web application, we leveraged multithreading and event-driven programming to allow for the aforementioned capabilities and good performance of the solution (see Appendix A).
5. Conclusions
This paper presented the rudiments of deploying a real-world Energy Management System for buildings on Al Akhawayn University campus. The deployed EMS is capable of controlling buildings’ appliances and integrating renewable energy sources. Besides leveraging on the Internet of Things (IoT), Wireless Sensor Network (WSN), Control, and energy storage batteries, the EMS proposes a novel context recognition algorithm (EACRA) that accounts for context-awareness. We designed, implemented, and tested our EMS using the Plan-Do-Check-Act (PDCA) development methodology and proved its efficiency.
Most importantly, to alleviate the stringent data acquisition bottleneck, we delineated a blueprint for developing custom sensors and actuators and advocated appropriate WSN topology. This can be quickly adopted (and adapted) to other similar deployments by the research community.
Furthermore, we discussed the impact of using the EACRA on the WSN network topology and the routing process. Hence, we enhanced the EACRA to maintain the network connectivity and avoid isolated nodes that cannot deliver data to the next hop in the network.
As future work, we plan to scale up our deployment to cover other buildings on the university campus and further tweak our deployment towards optimal performance. To do so, we are planning to extend the capacity of renewable energy integration into the campus and acquire additional storage capacity.
Author Contributions
Conceptualization, M.R.A. and D.B.; Methodology, M.R.A. and D.B.; Software, N.N.; Validation, M.R.A., D.B. and N.K.; Formal Analysis, M.R.A. and D.B.; Investigation, N.N., M.R.A. and D.B.; Resources, M.R.A. and D.B.; Data Curation, N.N.; Writing—Original Draft Preparation, N.N.; Writing—Review and Editing, M.R.A., D.B. and N.K.; Visualization, M.R.A., D.B. and N.K.; Supervision, M.R.A., D.B. and N.K.; Project Administration, M.R.A.; Funding Acquisition, M.R.A. All authors have read and agreed to the published version of the manuscript.
Funding
This research was funded by by CASANET (Context-Aware Sensor-Actuator Networks for Energy-Efficient Buildings) project, funded by “le Ministere de l’Enseignement Superieur, de la Recherche Scientifique et de la Formation des Cadres (MESRSFC)” and “le Centre National pour la Recherche Scientifique et Technique (CNRST)” in Morocco, as well as, the US-NAS/USAID under the PEER Cycle5 project grant number #5-398 entitled “Towards Smart MG: Renewable Energy Integration into Smart Buildings.”
Conflicts of Interest
The authors declare no conflict of interest.
Appendix A. (Application Screenshots)
Figure A1.
WSN nodes displayed on the web application.

Figure A2.
List of buildings in the EMS.

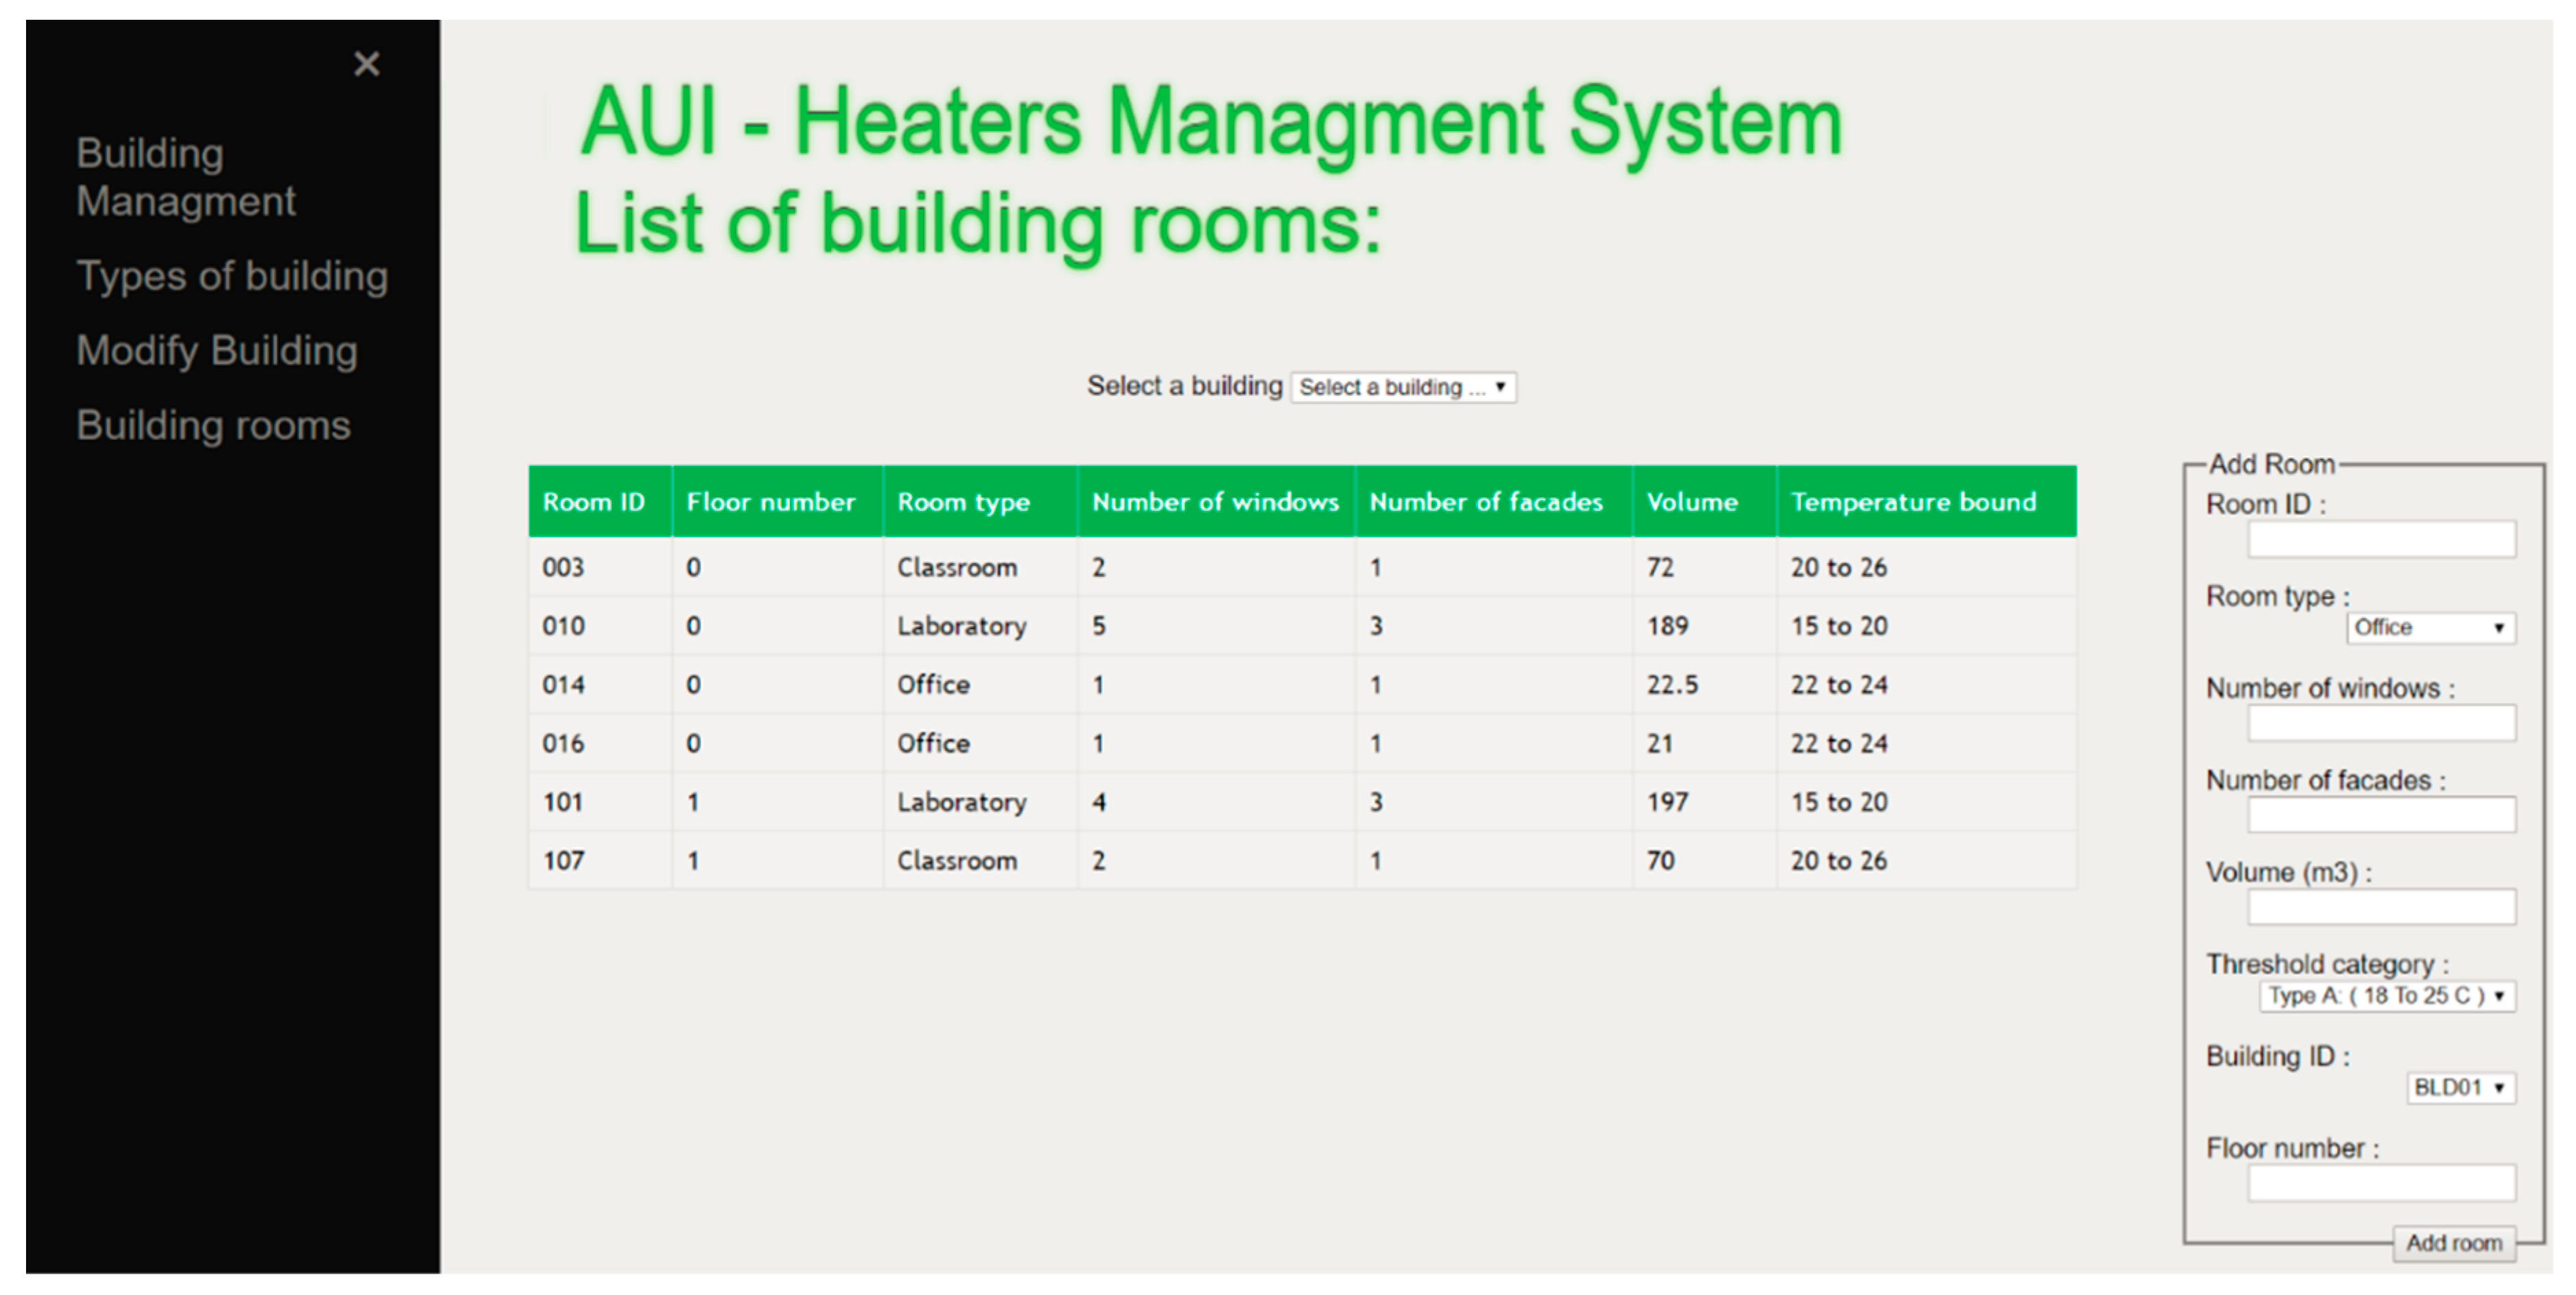
Figure A3.
Rooms of building 7 where the EMS was implemented.

Figure A4.
The application getting an update about the status of the heater.

References
- Olivier, J.G.; Schure, K.M.; Peters, J.A.H.W. Trends in global CO2 and total greenhouse gas emissions. PBL Neth. Environ. Assess. Agency 2017, 5. [Google Scholar]
- Fang, X.; Misra, S.; Xue, G.; Yang, D. Smart Grid—The New and Improved Power Grid: A Survey. IEEE Commun. Surv. Tutor. 2011, 14, 944–980. [Google Scholar] [CrossRef]
- Hossain, M.S.; Madlool, N.A.; Rahim, N.A.; Selvaraj, J.; Pandey, A.K.; Khan, A.F. Role of smart grid in renewable energy: An overview. Renew. Sustain. Energy Rev. 2016, 60, 1168–1184. [Google Scholar] [CrossRef]
- Farhangi, H. The path of the smart grid. IEEE Power Energy Mag. 2009, 8, 18–28. [Google Scholar] [CrossRef]
- Werner, S.; Lunden, J. Smart Load Tracking and Reporting for Real-Time Metering in Electric Power Grids. IEEE Trans. Smart Grid 2015, 7, 1723–1731. [Google Scholar] [CrossRef]
- Lasseter, R.H.; Piagi, P. MG: A conceptual solution. In Proceedings of the 2004 IEEE 35th Annual Power Electronics Specialists Conference (IEEE Cat. No. 04CH37551), Aachen, Germany, 20–25 June 2004. [Google Scholar]
- Hanif, S.; Massier, T.; Gooi, H.B.; Hamacher, T.; Reindl, T. Cost Optimal Integration of Flexible Buildings in Congested Distribution Grids. IEEE Trans. Power Syst. 2016, 32, 2254–2266. [Google Scholar] [CrossRef]
- Abid, M.R.; Lghoul, R.; Benhaddou, D. ICT for renewable energy integration into smart buildings: IoT and big data approach. In Proceedings of the IEEE AFRICON 2017, Cape Town, South Africa, 18–20 September 2017. [Google Scholar]
- Greer, C.; Wollman, D.A.; Prochaska, D.E.; Boynton, P.A.; Mazer, J.A.; Nguyen, C.T.; Fitzpatrick, G.J.; Nelson, T.L.; Koepke, G.H.; Allen, R.H., Jr.; et al. Nist Framework and Roadmap for Smart Grid Interoperability Standards, Release 3.0; No. Special Publication (NIST SP)-1108r3); NIST: Gaithersburg, MD, USA, 2014.
- Yang, L.; Yan, H.; Lam, J.C. Thermal comfort and building energy consumption implications—A review. Appl. Energy 2014, 115, 164–173. [Google Scholar] [CrossRef]
- Han, D.-M.; Lim, J.-H. Smart home energy management system using IEEE 802.15.4 and zigbee. IEEE Trans. Consum. Electron. 2010, 56, 1403–1410. [Google Scholar] [CrossRef]
- Sciuto, D.; Nacci, A.A. On How to Design Smart Energy-Efficient Buildings. In Proceedings of the 2014 12th IEEE International Conference on Embedded and Ubiquitous Computing, Milan, Italy, 26–28 August 2014; pp. 205–208. [Google Scholar]
- Vakiloroaya, V.; Samali, B.; Fakhar, A.; Pishghadam, K. A review of different strategies for HVAC energy saving. Energy Convers. Manag. 2014, 77, 738–754. [Google Scholar] [CrossRef]
- Berkeley Laboratory and Energy Efficiency. What is Energy Efficiency? Available online: http://eetd.lbl.gov/ee/ee-1.html (accessed on 17 July 2016).
- Stensrud, B.S.; Barrett, G.C.; Trinh, V.C.; Gonzalez, A.J. Context-Based Reasoning: A Revised Specification. In Proceedings of the FLAIRS Conference 2004, Miami Beach, FL, USA, 12–14 May 2004. [Google Scholar]
- ISO 50001—Energy Management. Available online: https://www.iso.org/iso-50001-energy-management.html (accessed on 2 September 2020).
- Robey, D.; Welke, R.; Turk, D. Traditional, iterative, and component-based development: A social analysis of software development paradigms. Inf. Technol. Manag. 2001, 2, 53–70. [Google Scholar] [CrossRef]
- Perkins, C.; Belding-Royer, E.; Das, S. RFC3561: Ad Hoc On-Demand Distance Vector (AODV) Routing; Internet Society: Reston, VA, USA, 2003. [Google Scholar]
- Shang, F.; Su, W.; Wang, Q.; Gao, H.; Fu, Q. A Location Estimation Algorithm Based on RSSI Vector Similarity Degree. Int. J. Distrib. Sens. Networks 2014, 10, 371350. [Google Scholar] [CrossRef] [Green Version]
- Bellala, G.; Marwah, M.; Shah, A.; Arlitt, M.; Bash, C. A finite state machine-based characterization of building entities for monitoring and control. In Proceedings of the Fourth ACM Workshop on Embedded Sensing Systems for Energy-Efficiency in Buildings, Toronto, ON, Canada, 6 November 2012; pp. 153–160. [Google Scholar]
- Naji, N.; Abid, M.R.; Krami, N.; Benhaddou, D. An Energy-Aware Wireless Sensor Network for Data Acquisition in Smart Energy Efficient Building. In Proceedings of the 2019 IEEE 5th World Forum on Internet of Things (WF-IoT), Limerick, Ireland, 15–18 April 2019. [Google Scholar]
- Naji, N.; Abid, M.R.; Krami, N.; Ben Haddou, D. CASANET Energy Management System: A Wireless Sensors based solution for Heaters Control. In Proceedings of the 2nd International Conference on Smart Digital Environment, Rabat, Morocco, 18–20 October 2018. [Google Scholar]
- Abid, M.R. Link Quality Characterization in IEEE 802.11s Wireless Mesh Networks. Ph.D. Thesis, Auburn University, Auburn, AL, USA, 2010. [Google Scholar]
Figure 1.
General architecture (A) and communication process (B) of the proposed Energy Management Systems (EMS).
Figure 1.
General architecture (A) and communication process (B) of the proposed Energy Management Systems (EMS).

Figure 2.
Information and Communication Technology (ICT) components for data acquisition in Smart Energy-Efficient Buildings (SEEB).
Figure 2.
Information and Communication Technology (ICT) components for data acquisition in Smart Energy-Efficient Buildings (SEEB).

Figure 3.
Components of the Wireless Sensor Network (WSN) nodes in the data acquisition (A) Arduino nano and its components, (B) the installed actuator with the electric heater, (C–E) gateway devices.
Figure 3.
Components of the Wireless Sensor Network (WSN) nodes in the data acquisition (A) Arduino nano and its components, (B) the installed actuator with the electric heater, (C–E) gateway devices.

Figure 4.
WSN architecture deployment at the university campus building.

Figure 5.
(A) Energy consumption of different sensor nodes configurations, (B) Energy consumption of XBee RF module under different operating modes.
Figure 5.
(A) Energy consumption of different sensor nodes configurations, (B) Energy consumption of XBee RF module under different operating modes.

Figure 6.
Packet arrival rate using the different gateways under full mesh topology and cluster tree mesh topology.
Figure 6.
Packet arrival rate using the different gateways under full mesh topology and cluster tree mesh topology.

Figure 7.
Link quality between WSN nodes.

Figure 8.
Local and remote Remote Signal Strength Indicator (RSSI) of WSN nodes.

Figure 9.
RSSI value between sensor nodes and gateway.

Figure 10.
Knowledge types used in enabling and disabling the heating process.

Figure 11.
Groups in the Context-Based Reasoning (CBR) model.

Figure 12.
Finite State Machine (FSM) State diagram that controls Linux Laboratory heater.

Figure 13.
Energy Aware Context Recognition Algorithm (EACRA) Client algorithm.


Table 1.
Electricity consumption of the university during the fall semester of 2017.
| Month and Year | Energy Consumption (MAD) |
|---|---|
| September 2017 | 477,693.00 |
| October 2017 | 620,662.00 |
| November 2017 | 925,342.00 |
| December 2017 | 1,248,436.00 |
Table 2.
The steps in each phase of the Plan-Do-Check-Act (PDCA) development cycle.
| Plan | Do | Check | Act |
|---|---|---|---|
In this first step, we went through:
| As a result of the previous plan step, we started the implementation:
| Here we check the previous implementations periodically in order to update and maintain the EMS:
| In the Act phase:
|
Table 3.
Different WSN node configuration used in the experiments.
| Arduino Nano | Humidity Temperature Module | Sound Module | Ambient Light Module | PIR Module | Door/Window Module | |
|---|---|---|---|---|---|---|
| Configuration 1 | ✓ | ✓ | ||||
| Configuration 2 | ✓ | ✓ | ✓ | |||
| Configuration 3 | ✓ | ✓ | ✓ | ✓ | ||
| Configuration 4 | ✓ | ✓ | ✓ | ✓ | ✓ | |
| Configuration 5 | ✓ | ✓ | ✓ | ✓ | ✓ | ✓ |
Table 4.
Gateways hardware configuration.
| Gateway Device | CPU | RAM | Operating System | Ethernet | Wi-Fi | XBee |
|---|---|---|---|---|---|---|
| XBee | Freescale i.MX28 | 68 Mb | Embedded Linux | ✓ | ✓ | ✓ |
| Raspberry-Pi | ARM | 2 Gb | Raspbian | ✓ | ✓ | ✓ |
| Arduino | AVR | 2 Kb | On-chip Boot | ✓ | ✓ | ✓ |
Table 5.
Throughput test of sensor nodes in different topologies.
| Node Location | Full Mesh Topology | Cluster Tree Topology |
|---|---|---|
| Room010 | 7.42 kbps | 8.39 kbps |
| Room014 | 6.53 kbps | 7.67 kbps |
| Room016 | 6.85 kbps | 7.9 kbps |
| Room015 | 4.38 kbps | 5.38 kbps |
| Room003 | 3.21 kbps | 4.35 kbps |
| Room002 | 2.33 kbps | 3.51 kbps |
Table 6.
RSSI measurements between each pair of WSN nodes.
| Room 002 | Room 003 | Room 010 | Room 014 | Room 015 | Room 016 | Router 1 | Router 2 | Router 3 | Gateway | |
|---|---|---|---|---|---|---|---|---|---|---|
| Room 002 | −71 | −90 | −92 | −92 | −89 | −88 | −83 | −75 | −93 | |
| −71 | −90 | −92 | −92 | −89 | −88 | −83 | −75 | −93 | ||
| Room 003 | −92 | −93 | −94 | −91 | −86 | −81 | −73 | −92 | ||
| −92 | −93 | −94 | −91 | −86 | −81 | −73 | −92 | |||
| Room 010 | −78 | −83 | −81 | −75 | −59 | −67 | −55 | |||
| −78 | −83 | −81 | −75 | −64 | −67 | −55 | ||||
| Room 014 | −69 | −71 | −66 | −73 | −85 | −75 | ||||
| −69 | −71 | −66 | −73 | −85 | −75 | |||||
| Room 015 | −72 | −76 | −75 | −88 | −85 | |||||
| −72 | −76 | −75 | −88 | −85 | ||||||
| Room 016 | −69 | −72 | −82 | −73 | ||||||
| −69 | −72 | −82 | −73 | |||||||
| Router 1 | −53 | −57 | −70 | |||||||
| −53 | −57 | −70 | ||||||||
| Router 2 | Remote RSSI | −55 | −60 | |||||||
| Local RSSI | −55 | −60 | ||||||||
| Router 3 | −76 | |||||||||
| −76 | ||||||||||
Table 7.
The value of n in different scenarios.
| Nodes Location | RSSI | A | Real Distance | Value of ni |
|---|---|---|---|---|
| Inside a room (n1) | −55 | 40 dbm | 5 m | 2.17 |
| In the hall (n2) | −50 | 40 dbm | 5 m | 1.44 |
| From room to another room (n3) | −63 | 40 dbm | 5 m | 3.33 |
| From room to the hall (n4) | −60 | 40 dbm | 5 m | 2.80 |
Table 8.
Distance based on RSSI versus actual distance in meters.
| Room 002 | Room 003 | Room 010 | Room 014 | Room 015 | Room 016 | Router 1 | Router 2 | Router 3 | Gateway | |
|---|---|---|---|---|---|---|---|---|---|---|
| Room 002 | 8.50 | 31.73 | 36.43 | 36.43 | 29.61 | 27.63 | 19.30 | 17.87 | 39.04 | |
| 3.20 | 28.85 | 27.9 | 30.63 | 23.10 | 35.63 | 29.13 | 12.76 | 30.99 | ||
| Room 003 | 36.43 | 39.04 | 41.84 | 34.00 | 24.06 | 15.08 | 15.08 | 36.43 | ||
| 27.60 | 28.08 | 31.14 | 26.08 | 33.09 | 25.30 | 12.33 | 29.15 | |||
| Room 010 | 13.84 | 19.55 | 17.03 | 11.24 | 4.77 | 9.21 | 4.09 | |||
| 13.28 | 18.11 | 13.28 | 10.60 | 7.50 | 16.53 | 5.02 | ||||
| Room 014 | 7.42 | 8.50 | 6.03 | 15.08 | 22.45 | 11.24 | ||||
| 3.60 | 4.08 | 3.30 | 17.20 | 20.91 | 12.30 | |||||
| Room 015 | 9.14 | 12.05 | 17.78 | 27.63 | 22.45 | |||||
| 6.00 | 6.90 | 21.06 | 22.59 | 17.60 | ||||||
| Room 016 | 7.04 | 13.89 | 18.24 | 9.70 | ||||||
| 4.36 | 15.47 | 17.00 | 12.30 | |||||||
| Router 1 | 7.99 | 15.15 | 7.95 | |||||||
| 8.74 | 15.84 | 9.00 | ||||||||
| Router 2 | Distance based on RSSI (m) | 11.00 | 5.17 | |||||||
| Real distance (m) | 9.60 | 6.00 | ||||||||
| Router 3 | 19.30 | |||||||||
| 19.43 | ||||||||||
Table 9.
Knowledge based on different sensor modules.
| Knowledge | Data | Data Type | Sensor Module | Sampling Time Interval |
|---|---|---|---|---|
| Occupancy | Motion | Digital | PIR | Low |
| Pressure | Analog | MPX4115A | High | |
| Sound | Analog | 2PCS | High | |
| Gas | Analog | MQ-4 | Medium | |
| Camera | Analog | OV2640 | High | |
| Air quality | Temperature | Digital | DHT11 | High |
| Humidity | Digital | DHT22 | High | |
| Appliance status | Light | Digital | MSE004LSM | High |
| Relay | Digital | SRD-05VDC-SL-C 5V | High | |
| Power consumption | Analog | YHDC 30A | High |
Publisher’s Note: MDPI stays neutral with regard to jurisdictional claims in published maps and institutional affiliations. |
© 2020 by the authors. Licensee MDPI, Basel, Switzerland. This article is an open access article distributed under the terms and conditions of the Creative Commons Attribution (CC BY) license (http://creativecommons.org/licenses/by/4.0/).
Share and Cite
MDPI and ACS Style
Naji, N.; Abid, M.R.; Benhaddou, D.; Krami, N. Context-Aware Wireless Sensor Networks for Smart Building Energy Management System. Information 2020, 11, 530. https://0-doi-org.brum.beds.ac.uk/10.3390/info11110530
AMA Style
Naji N, Abid MR, Benhaddou D, Krami N. Context-Aware Wireless Sensor Networks for Smart Building Energy Management System. Information. 2020; 11(11):530. https://0-doi-org.brum.beds.ac.uk/10.3390/info11110530
Chicago/Turabian StyleNaji, Najem, Mohamed Riduan Abid, Driss Benhaddou, and Nissrine Krami. 2020. "Context-Aware Wireless Sensor Networks for Smart Building Energy Management System" Information 11, no. 11: 530. https://0-doi-org.brum.beds.ac.uk/10.3390/info11110530
Note that from the first issue of 2016, this journal uses article numbers instead of page numbers. See further details here.