Connecting Semantic Situation Descriptions with Data Quality Evaluations—Towards a Framework of Automatic Thematic Map Evaluation


i3mainz—Institute for Spatial Information & Surveying Technology, Mainz University of Applied Sciences, 55128 Mainz, Germany
Information 2020, 11(11), 532; https://0-doi-org.brum.beds.ac.uk/10.3390/info11110532
Submission received: 9 October 2020
/
Revised: 29 October 2020
/
Accepted: 31 October 2020
/
Published: 15 November 2020
(This article belongs to the Section Information Processes)
Abstract
:A continuing question in the geospatial community is the evaluation of fitness for use of map data for a variety of use cases. While data quality metrics and dimensions have been discussed broadly in the geospatial community and have been modelled in semantic web vocabularies, an ontological connection between use cases and data quality expressions allowing reasoning approaches to determine the fitness for use of semantic web map data has not yet been approached. This publication introduces such an ontological model to represent and link situations with geospatial data quality metrics to evaluate thematic map contents. The ontology model constitutes the data storage element of a framework for use case based data quality assurance, which creates suggestions for data quality evaluations which are verified and improved upon by end-users. So-created requirement profiles are associated and shared to semantic web concepts and therefore contribute to a pool of linked data describing situation-based data quality assessments, which may be used by a variety of applications. The framework is tested using two test scenarios which are evaluated and discussed in a wider context.
1. Introduction
Data quality of maps has been defined using many data quality metrics judging various parameters of the geometry and its attributes, often but not exclusively comparing geometries to a comparison data set, the gold standard. While it is, in general, a useful endeavour to be able to measure data quality parameters, it is usually up to the users to define which data quality parameters are actually required for their particular use case, how to combine them and how to aggregate the metrics’ results to achieve a data quality result for a particular purpose in a certain area. This fact provides the need for users to define requirement profiles, descriptions of data quality parameters which need to be fulfilled in order for a map to be suitable for a given task. Such requirement profiles have been defined in Reference [1] generally and applied on thematic maps in Reference [2]. This paper builds upon Reference [2] a generalized ontological model which acts as the missing link between data quality metrics and application cases. This model is used in a prototypical application which is able to a certain degree to judge which data quality metrics are appropriate and how they need to be prioritized to get an accurate result for particular use cases. This contributes a major improvement compared to the current state-of-the-art in which for every use case data quality requirements need to be modelled beforehand. The research is organized as follows—Section 2 defines data quality in the GIS [3] domain, data quality metrics, and its vocabularies as well as thematic maps and introduces related work on relating use cases to data quality descriptions. Section 3 introduces the necessary components of the ontological model, basic assumptions, and the workflow of the data quality assurance system with knowledge of use cases and the suitability of data quality metrics. Section 4 describes the setup and components of the automated data quality evaluation system and how the components interact with user input. Section 5 applies the new system on two use cases and shows its results. Section 6 discusses the impact of the newly defined situation-aware vocabulary and the data quality evaluation system, its limitations and applications before concluding the work in Section 7.
2. State of the Art
This section summarizes the foundations of data quality, in particular for GIS data (cf. Section 2.2), defines data quality metrics (cf. Section 2.3), their categorizations, options to model them and the concept of thematic maps which are one of the major targets of map data to be evaluated.
2.1. Related Work on Data Quality
The notion of data quality has been researched extensively in a wide variety of disciplines and usage contexts. A first use case for companies was to evaluate the quality of data in their databases using general data quality metrics [4,5]. User-, consumer- and product-centric views of data quality were defined by References [6,7,8] They analyzed data by defining an added value to data consumers or by the enhancement of the user experience or product-enhancements gained by good quality data vs. bad quality data.
In addition, the impact of poor data quality data on a companies business has been analyzed by Reference [9]. References [10,11,12,13] provide comprehensive overviews of data quality metrics at their time of writing and best practices for various knowledge domains. Finally, some research such as Reference [14] dealt with the selection of appropriate data quality assessments for certain application cases, that is, discussing and comparing data quality evaluation approaches. In the following the domain of geospatial data quality is examined as the most appropriate knowledge domain for the thematic maps discussed in this paper.
2.2. Definitions of Data Quality for Geospatial Data
Data Quality has been defined by various means in the past. One of its definitions which is widely accepted in the geospatial community is that data is of good quality if their fitness for use [15] for a specific application case is met. This fitness for use can be evaluated using a set of data quality measurements, which is often broken down into the following data quality dimensions [16]:
These data quality dimensions are giving an idea of which aspects of geospatial data can be quality-assured. In addition, other aspects surrounding the dataset can be evaluated:
As discussed before, the question which data quality metrics and dimensions are useful to evaluate which kinds of data is up to the user to define. The same dataset may, depending on the aspect of its evaluation, be evaluated as suitable for one task and not suitable for a different task.
For example: A dataset of fire stations in which the fire station geometries are given as points may be suitable for the task of navigating to the fire stations, but may not be useful to calculate the area of the fire station building. Similarly, a thematic map about rescue capacities of fire stations is perfectly fine with a non-accurate representation of the fire station, as long as sufficient information about the capacity (e.g., how many fire brigade cars are available) is given.
2.3. Data Quality Metrics
A data quality metric [25] can be defined as a function which evaluates a data set D to a result R which indicates a data quality aspect and corresponds to a data quality dimension, that is, a semantic category of data quality metrics. Data Quality metrics can be categorized as intrinsic and extrinsic data quality metrics. Intrinsic metrics may be measured on one geometry at one point of time, extrinsic data quality metrics need a comparison gold standard to compare against. Intrinsic metrics have been especially popular when evaluating volunteered geographic information such as OpenStreetMap [26,27,28]. However, one needs to keep in mind that gold standard data for OpenStreetMap outdate very quickly, as it is the nature of volunteered geographic information to change quickly depending on the mapping community. Trustfulness can be measured by analyzing user contribution activity [29] or by adding provenance information [30,31,32], whereas one general assumption is that users with more experience produce higher quality results and official state authorities produce higher quality results than crowdsourcing. This assumption is argued about, and depending on the mapping community can be false.
2.4. Grounding Data Quality
According to Reference [33], data quality metrics can be grounded to assess their impact on a particular data quality dimension. This leads to a categorization of intrinsic and extrinsic data quality metrics according to the nature of the data input, for example, sensor data, the same data set, an extrinsic data set which is perceived of higher data quality or rule-based data quality metrics without an additional data source. Reference [34] further refined this grounding approach by defining a linked data vocabulary to describe the grounding of data quality metrics. The concept of grounding and its vocabulary is used as a part of the ontological model in this work.
2.5. Thematic Maps
Reference [35] defines a thematic map [36] as “a map that focuses on a specific theme or subject area”. In that regard, thematic maps highlight spatial patterns which may be used for comparison purposes or statistics and provide specific information about certain aspects of particular locations. This definition contrasts with the definition of general reference maps [37] in which a variety of phenomena, for example, political maps, points of interest or geological features might be highlighted all at once. Using the OpenStreetMap database [38], it is possible to create general reference maps like the default maplayer Mapnik [39] visible on the main page of OpenStreetMap in which many points of interest and features are highlighted. Examples of thematic maps using OpenStreetMap content can be found in various subcommunities of OSM like OpenSeaMap [40] or OpenRailwayMap (https://www.openrailwaymap.org) (cf. Figure 1).
Naturally, thematic maps are more sensitive to the provision or lack of certain data attributes, as in contrast to general reference maps, they have a particular focus which needs to be conveyed accurately to the respective user of the map. This publication’s goal is to evaluate thematic maps and the contexts in which thematic maps are used.
2.6. Ontologies for Modelling (Situation-Specific) Geospatial Data
Geospatial data can and is usually modelled using the GeoSPARQL ontology [41], which defines a geospatial feature class (geo:Feature). When geospatial data is integrated, this class is extended with a semantic class encoding the thematic meaning of the geo:SpatialObject in question. For example, it may represent the data of a school while the geometry is modelled using a separate class/individual. While geospatial data can be modelled using ontologies, there is to the best knowledge of the author no framework modeling the potential usages of geospatial data according to the data classified using ontological classes. Separately from modelling geospatial ontologies, some communities began modelling activities which also depend on a situational assessment [42]. As thematic map data is always linked to use cases, that is, activities, this foundational work constitutes an important part of defining what can be done using a thematic map. Similar work has been done in the domain of ontology-driven situation awareness [43,44]. The goal here is to model a situation using a formalized vocabulary to assess objects and events of the situation, as well as documenting rules which could lead to certain outcomes called goals. Situations always involve an aspect of time, that is, for a rescue mission, which is important to be modelled, but not relevant for a thematic map evaluation unless the thematic map is subject to change with a high frequency. The following aspects of this related work are interesting for evaluating thematic maps: The description of actions and situations to associate them with thematic map data and modelling the prerequisites of said actions in terms of data quality.
2.7. Ontologies for Modelling Data Quality
One of the most common ontologies for mapping data quality is the daQ ontology [45]. This ontology defines data quality dimensions, data quality metrics and data quality measurements. The measurements are usually related to the geospatial feature on which the measurement has been performed, including a history of how and when the measurement was performed. The measurement could be complemented by a provenance history of the data set itself provided, for example, by the PROV-O provenance ontology [46]. The provenance history is usually used to evaluate trustfulness parameters, that is, did an authority of trust provide the data and to evaluate the process by which data has been created, that is, was it a process of high or low accuracy. Recently, Reference [47] specified data quality. more precisely for the geospatial domain, by providing an approach of two ontologies, a general ontology for describing quality and domain-specific ontologies used to describe more use case related aspects of data quality. This approach is related to Reference [1]’s idea of creating requirement profiles (now in an ontological form) and the goal is similar: A more structured assessment of data quality.
2.8. Related Work on Map Data Quality Assessment
A considerable amount of work has been done on evaluating map data for specific predefined use cases. Reference [48] evaluated OpenStreetMap data for pedestrian navigation. Reference [49] discovered the idea of using a fitness for use based data quality approach to distinguish between datasets of varying quality. Reference [50] explored the assessment of fitness for use with a risk-based approach. Reference [51] explored the possibility to help users defining fitness for use parameters for certain application cases. While research has been done on defining fitness for use for specific application cases and on methods to help and define fitness for use, fitness for use has never been defined in a use case-centric approach.
3. Modelling
In this section, a new ontological model to represent situations and actions which coincide with thematic map data is introduced. Section 3.1 explains the vocabulary for modeling a situation and its dependencies, Section 3.2 shows how to relate data quality metrics to situational descriptions to create a framework connecting appropriate data quality measurements with actual use cases. Data Quality metrics need to be calculated though and often require additional data sources to do so. Therefore, the algorithms needed for data quality metrics need to be accessible using a URI, that is, as a web service calculating the required data quality metric result. Section 4, therefore introduces the system architecture needed for the evaluation system described in this section.
3.1. Ontological Model for Situations
In this section, an ontological model for situations in the context of thematic maps is proposed. A situation can be distinguished into two different parts.
Thematic Map Data Part: The first part is the map data on which a situational assessment is conducted. A thematic map contains points of interests for a use case, which can be described as a set of semantic classes. Out of those points/areas of interest, relevant attributes can be identified easily. They are the ones constituting to the creation of the highlighted items in the thematic map layer. Therefore, these attributes, as well as the point of interest itself (the geometry), can be verified in a general way and in a thematic-specific way.
For example: A map highlighting the accessibility of schools highlights schools and commonly one attribute (the accessibility) on the thematic map. It will utilize this attribute to possibly colour schools in a different fashion, as shown exemplarily in Figure 2. A general verification of this school data should take into account the number of schools which has an accessibility attribute attached and the quality of the attributes constituting the thematic element, that is, how detailed the description of accessibility is given.
Application Data Part: The second part is the application part which describes the concrete usage case of the map data. For school accessibility, this might be a routing algorithm routing the user to the nearest wheelchair-accessible school. The application part usually involves at least another thematic dataset (in this case the dataset of roads) which is needed for routing. Under the assumption that data concerning the second part is also available as a thematic map, the problem reduces itself to evaluating yet another thematic map and to combine the results. To generalize the second part is a major challenge as even with targeted thematic map data. Still, a variety of map usage cases are possible. In the opinion of the author, the thematic nature of the map provides the means to detect common use cases already and connect them to common requirements, which will be shown later in this publication.
3.1.1. Related Thematic Map Exploration: Situations
For each individual of a class in an ontology, we can expect a certain amount of properties to be commonly associated with them. Those properties might be related using an rdfs:domain statement [52], but may also just be commonly used with the individuals of the respective owl:Class [53]. To be an eligible property to constitute a thematic map, the following criteria need to be fulfilled:
- More than one unique object needs to be linked by the property
- The property needs to be frequently used with the individuals of this class, which is to be determined by a relative threshold
- If the objects described by the property constitute a string value or an owl:Class, the individual string value or class name occurrence needs to be greater than 1
In this fashion, only properties which are of importance (frequently used) and allow for a sufficiently good clustering to justify a thematic map are selected as eligible candidates for thematic map creation. This eligibility can be checked using the SPARQL [54] query in Listing 1.
As can be seen in Figure 3 this already allows for a thematic map creation tool (https://i3mainz.github.io/MapQualityAssessment/rpgeneration.html) to be build.
Listing 1. Frequently used properties query using the example of Wikidata: Frequently used properties associated to instances (wdt:P31) of the class school (wd:Q3914) with annotated geometries (wdt:P625) which are present with schools located in (wdt:P17) Germany (wd:Q183) are queried. Results are subsequently filtered according to the 3 criterias introduced previously.
SELECT (COUNT(distinct ?con) AS ?countcon)
(COUNT(?rel) AS ?countrel)
(COUNT(distinct ?val) AS ?countval) ?rel ?relLabel WHERE {
?con wdt:P31 wd:Q3914 .
?con wdt:P625 ?coord .
?con wdt:P17 wd:Q183 .
?con ?rel ?val .
SERVICE wikibase:label {bd:serviceParam wikibase:language “en” . } }
GROUP BY ?rel ?relLabel
ORDER BY ?relLabel
In Wikidata [55], it is also possible to query subjects related to a property using the relationship (wdt:P1629), that is, to classify the property in question. This gives us a set of knowledge domains which are linked to the respective topic, all of which are potential candidates for further situational assessment. The set of eligible thematic maps connected to an individual defined by an (owl:Class) is called the set of situations and can be modeled in a semantic model. An example of this statement is shown using the Wikidata school class. Among others, thematic map attributes of wheelchair accessibility (P2846) linking to the Accessibility knowledge domain, the geographical domain through the country (P17) and located in the administrative territorial entity (P131) and the heritage domain described by the heritage designation (P1435) property is assessed.
3.1.2. Modeling Activities and Situations
As previously described, the map data describing a situation can be reduced to a set of thematic maps which describe the aspects of the situation. Those relationships can be modelled in an ontology as described in Table 1 and Table 2.
Having defined situations, end users can address and relate to the situations in the ontological model.
3.1.3. Activities
Activities are tasks which are executed using the given map data in given situations and involve points of interest which have been defined by the set of thematic maps. Activities further involve interdependencies between general data quality metrics and data quality metrics which rely on the thematic map data but are only valid in the context of the activity. In this section, the vocabulary to associate activities to Thematic Maps and situations is defined, while the creation of the activity content is shown at a later stage in the paper. To model activities, the vocabularies in Table 3 are used to define an activity class which is related to the other aforementioned concepts of a situation and a thematic map.
Having defined activities, end users can have better means to relate to situations.
3.2. Relating Data Quality Metrics to Situations
As stated in Section 3.1, a situation concerning thematic maps consists of the map data part and an application part which may consist of a set of other thematic maps and a set of combinatorial metrics. It was previously established that each thematic map relies on at least, but usually, one attribute which showcases its usefulness. In this section, to-be-evaluated relations are defined in Section 3.2.1, it is shown how the value ranges for those relations can be defined in Section 3.2.2 and how eligible metrics for the current use case (Section 3.3) may be filtered out, which are then to be prioritized (Section 3.6) and combined (Section 3.7) to serve the to be evaluated use case.
3.2.1. Defining Relations to Be Evaluated
Following Reference [1]’s definition of requirement profiles, data quality metrics and their tolerance ranges (constraints) need to be defined and prioritized in order to create an accurate assessment of the situation or thematic map in question. Reference [1] hereby distinguishes data quality metric results which if of bad quality make an object on a map unusable, the “dealbreaker” attributes and other relevant attributes which constitute to an aggregated data quality score. A dealbreaker attribute is an attribute for which the non-fulfilment of its requirements results in the lowest possible data quality score, that is, they depict the mandatory requirements which have to be fulfilled under all conditions. For a thematic map, the dealbreaker attribute is defined as the property or properties defining the thematic content of the map and is identified using the process defined in Section 3.1.1. Next, a set of relations which describe the thematic map further or helps with its quality assessment needs to be determined. In theory, every eligible relation of a certain threshold of existence can be evaluated in addition to the geometry. In practice, relations which contribute indirectly to the thematic map and the geometry itself should be prioritized. Related relations can be queried using a semantic similarity metric [56], for example, a common superclass with a distance threshold. The geometry can always be analyzed using data quality metrics introduced in Section 2.2, as at least the positional accuracy of the respective thematic content should be interesting to a certain degree (the point of interest should not be very off). The SPARQL query in Listing 2 shows how related properties can be queried in Wikidata.
Listing 2. SPARQL query to determine related properties in Wikidaa. PROPERTYURI indicates the property for which related properties should be found.
SELECT ?prop ?val ?valLabel ?super ?superLabel
WHERE  {
?prop wikibase:directClaim <PROPERTYURI> .
?prop wdt:P1629 ?val .
?val wdt:P31* ?super .
SERVICE wikibase:label bd:serviceParam wikibase:language
 “[AUTOLANGUAGE],en”. }
}
In that fashion, the first question to be answered by a requirement profile is solved: What to evaluate.
3.2.2. Defining Eligible Ranges
The question which values (objects) of a relation should be evaluated as profitable for the current use case is information that can hardly be inferred without context information and may need to be eventually defined or refined by the end-user. What can be inferred, however, is the range of values that has been defined per relation. These values can be used as a suggestion for the end-user who defines the thematic map evaluation. In a first step, they can also be used to create an evaluation based on this suggestion. Furthermore, for a variety of data quality metrics, a default preferable interpretation tendency can be given as well.
For example: It can be assumed that the quality of a geometry is considered better when it is more precise. For use cases not relying on a higher precision, this metric may be irrelevant and/or the geometries’ precision could be scaled down for the purposes of the use case. Still, in a majority of cases, it can be assumed that a higher precision is likely to be wanted by the end-user. For attributes, a basic assumption for eligible value ranges can be achieved twofold:
- For Data Properties:
- Analysis of assigned values and clustering of the achieved results.Assumption: The majority of assigned values should be well-formed and represent a tendency to a positive or neutral assignment. This assumption may not be true in every knowledge base, but may be a fair assumption in crowdsourced data.
- If annotated as is the case for example with many Wikidata properties (e.g., P2048-height), the minimum and maximum cardinalities can be used as first indications of a valid range
- For Object Properties:
- If a domain is defined, check if the assigned individual fits the domain
- If no domain is defined check the graph distance of the assigned concept to the original concept (e.g., the hospital)
Using these heuristics, the second function of a requirement profile can be approximated: How to evaluate relations. Note that at this point, it is not yet clear which values constitute good values for the respective use case. This will be defined in a later step.
3.3. Data Quality Metric Eligibility
To find out if a data quality metric is eligible to be used with a certain thematic map, data quality metrics need to be categorized in terms of the data they require to operate. An eligible data quality metric can then be defined as follows:
Eligible Data Quality Metric: A data quality metric is an eligible data quality metric if the dataset is of such a structure that the data quality metric could be executed on it.
This publication distinguishes:
- Geometry Data Quality Metrics: Data quality metrics (intrinsic/extrinsic) operating on one or more geometries with or without a reference data set comparison.Requirements: A geometry or raster data set
- Attribute Data Quality Metrics: Data quality metrics (intrinsic/extrinsic) dealing with attribute completeness or the existence of data attributesRequirements: A feature set
- Thematic Data Quality metrics: Data quality metrics dealing with the values of thematic attributes.Requirements: Thematic Mapping and attributes
- Metadata Quality metrics: Operating on one or more metadata of geometriesRequirements: Metadata annotations
- Vicinity Data Quality metrics: Operating on a neighbourhood of geometries. Only relevant if the thematic data relies on a neighbourhood descriptionRequirements: Geometry neighbourhood
Data quality metrics can be modelled using semantic web vocabularies like Reference [57] to make those distinctions clear and to link suitable data source descriptions. This part solves yet another question related to a requirement profile: Which data quality metrics could potentially be used to evaluate the map or situation in question.
3.4. Data Quality Metric Feasibility
Eligible data quality metrics need to be filtered by feasibility criteria in order to determine if they are applicable to the current use case. The publication defines a feasible data quality metric as follows:
Feasible Data Quality Metric: A data quality metric is a feasible metric if all requirements for the calculation of the data quality metric have been met.
A good data quality metric representation, therefore, describes dependencies following Reference [33] and a data quality service provider should check if those dependencies are met in the use case situation at hand. For example: Extrinsic data quality metrics need an appropriate gold standard dataset in order to evaluate the metric. If an appropriate gold standard dataset is not given for the current area at a data quality service, the metric is eligible, but not feasible to be executed in the current use case. It, therefore, has to be filtered out unless an appropriate data source has been provided. Nevertheless, the metric may be added to a requirement profile as the circumstances of the availability of an extrinsic gold standard dataset might change in the future. The feasibility check should be conducted when the requirement profile is calculated as the situation concerning available data sources and other circumstances might change momentarily.
3.5. Data Quality Metric Relevance
If a data quality metric is eligible and feasible, it does not mean that the metric is needed or is relevant to evaluate the thematic map. This relevance needs to be determined to define relevant data quality metrics:
Relevant Data Quality Metric: A data quality metric is a relevant data quality metric if it either contributes to the thematic map representation or is linked to a property relevant to the thematic map representation.
For example: A metric testing the HausdorffDistance [58] of a school building against a reference data set is eligible (and possibly feasible) to be executed on the school accessibility map but does not help to verify the thematic aspect of accessibility. Therefore, relevant metrics need to be defined, which are actually useful to evaluate the thematic maps’ quality. To achieve this definition, eligible metrics need to be filtered to receive a set of eligible and relevant data quality metrics for thematic map evaluation. To achieve this filtering, metrics are defined in the ontological model with relations to concepts which are commonly associated with those metrics. Besides, each defined and saved requirement profile will serve as a new data source/application case of a metric in a context which can be evaluated. This allows querying the knowledge base for a list of relevant, that is, previously used data quality metrics.
3.6. Data Quality Metric Priority
Once a set of eligible and relevant metrics has been defined, the metrics need to be prioritized according to the thematic map representation. A suggestion for a prioritization can be given by the system and can be confirmed by the end-user. The following approach retrieves a prioritization of data quality metrics for a given use case from 1–5, with 1 being the highest priority.
- Priority 1: Every metric which negative result renders the map completely unusable in a certain area: Missing or erroneous Dealbreaker attributes and Geometry Validity attributes which might expose an invalid or non-renderable geometry
- Priority 2: Metrics which are directly or indirectly related to the dealbreaker attribute of the thematic map and/or evaluate related relations: The reasoning here is that these values potentially contribute more to the thematic map’s quality than other relations
- Priority 3: Trustfulness Metrics: Metrics which may expose the quality of the whole data set by analyzing metadata about its creation
- Priority 4: General geospatial data quality metrics analyzing the quality of the geometry apart from geometry validity
- Priority 5: All other metrics which are eligible, feasible and relevant for the application
Given a priority description, thematic map or situational map data quality can be evaluated according to different criteria. If the application requires time constraints, only a partial evaluation of thematic map data can be approached, as the priority of data quality metrics is defined. Furthermore, priorities provide the basis for priority-based data quality aggregation methods, as data quality results are usually calculated by geometry, but visualized across an area of interest.
3.7. Combining Eligibility and Relevance: Constructing a Requirement Profile
As a result of the previous steps, we achieve a mapping of a set of semantic classes (the maps topic or the usecases topics) to a set of data quality metrics which may or may not be grounded to one or many reference data sets for comparison and have been tested for eligibility and feasibility. This information is sufficient to create a requirement profile which can be used to perform an initial evaluation of a thematic map and in a broader context of a situation (a set of thematic maps).
The so-created requirement profile (cf. Listing 3) is modelled as RDF [59] using the following statements and entered into a triple store as a first evaluation criterium:
Listing 3. Requirement Profile representation as RDF using the given vocabulary.
ex:HospitalAccessibility rdf:type owl:NamedIndividual ,
semgis:ThematicMap ;
semgis:hasRequirementProfile ex:HospitalAccessibilityRequirements .
ex:HospitalAccessibilityRequirements rdf:type owl:NamedIndividual ,
semgis:RequirementProfile ;
semgis:hasDealbreakerAttribute <http://www.wikidata.org/prop/direct/P2846> .
semgis:hasEligibleMetric dq:GeometryValidity .
semgis:hasEligibleMetric dq:AttributeAvailability .
....
Given this semantic model, data quality assessment tasks can be conducted in two ways:
- The requirement profile can be downloaded and assessed using data quality web services which results determine the quality assurance of the map
- The requirement profile can be evaluated using reasoning rules in a knowledge base. An external process (e.g., the Data Quality Service) enters data quality results for this analysis.
Either way, the user can, at this point, also intervene in finetuning the data quality parameters to their particular use case and save this new profile in the triple store. Figure 4 shows an example of an automatically generated data quality profile for the case of wheelchair accessibility.
3.8. Requirement Profile Similarity
Section 3.7 showed that requirement profiles once suggested by the system and possibly refined by a user can be entered into a knowledge base. It has also been stated that these defined requirement profiles can be reused as suggestions for users with the same requirements, for example, the same situations to evaluate. However, often a requirement profile evaluating a similar situation can be better suited than an automated generated requirement profile. A similar requirement profile might also provide more relevant data quality parameters for evaluation. It is, therefore, advisable to create a method to find similar requirement profiles as possible suggestions. The similarity of requirement profiles is defined as follows:
Similar Requirement Profile: A requirement profile is similar to another requirement profile if the concepts of the situations which are to be evaluated have a close similarity score and the data quality metrics used in the requirement profile are similar as defined by the metrics grounding, dimension and classification.
This definition requires two elements and is depicted in Algorithm 1
- Semantic Similarity [60] of the class/situation to evaluate according to a threshold (percentage score)
- Matching data quality metrics (awarded 1 point per matching metric) and similar data quality metrics according to a given threshold (awarded 0.5 points per metric) divided weighed by the metrics priority in the requirement profile and divided by the total number of data quality metrics being used.
One common way to define semantic similarity is to analyze the class structure of the given concept and/or metric. The longer the path of for example, rdfs:subClassOf relations which need to be traversed to reach the other concept, the less similar the semantic meanings of the respective concepts are. If no connections between concepts in the graph are known, the concepts are deemed not similar.
| Algorithm 1: Semantic Similarity algorithm: The algorithm consists of the calculation of a semantic similarity using a given metric (semanticSimilarity) which is used to relate single metrics and the class which describes the requirement profile. The aggregated percentage score is used as the similarity score by the system. |
 |
The result of this algorithm is a percentage score depicting the similarity of two requirement profiles. The user might depending on his/her preference decide an acceptance parameter. This parameter might allow to consider similar requirement profiles of a similarity score of for example, greater than 75%, thus sufficiently filtering out non-relevant requirement profiles.
3.9. Ontology Model Overview
Finally, the complete ontology model is presented in Figure 5 consisting of the vocabulary described previously attached with some additional vocabularies for provenance and dataset descriptions. Figure 6 shows an example modelled using the proposed vocabularies. Geospatial objects are connected as part of at least one thematic map description related to a situational description or an activity. Evaluations of requirement profiles describe metric results of metrics associated with the requirement profile as described using the process in the previous subsections. Finally, requirement profiles may be compared using a similarity metric to determine requirement profiles which relate to similar thematic concepts and/or rely on similar data quality metrics for evaluation. Requirements of data quality metrics, that is, grounding requirements, are appended in the metrics graph.
4. Towards Constructing an Automated Data Quality Evaluation System
In this section, an automated data quality evaluation system based on the previous ontology model and algorithms is described.
4.1. System Workflow
Using the methods described in Section 3, an automated framework for situation-dependent data quality evaluation can be designed. The system works by executing the following steps:
- Thematic Map Exploration: The system analyzes the knowledge base of geospatial objects for eligible thematic map candidates. It generates a list of thematic map candidates for the end-user
- Data Quality Evaluation Generation: The system generates a list of eligible data quality metrics for each thematic map and performs a data quality analysis of general data quality metrics (cf. Section 2.2)
- Preferential Range assignment: The system tries to determine the preferred ranges for eligible properties without a use case context. This first assessment is likely to produce a general applicability result and not a use case-specific result and is marked as automatically generated in the knowledge base
- Manual Usecase Definition: The user defines data sources needed for the use case at hand which may itself be defined using a Semantic concept, if applicable
- Requirement Profile Suggestion: A set of requirement profiles is suggested to the end-user either by finding appropriate requirement profiles in a semantic database or by generating a suggestion as shown in Section 3.7. Suggested requirement profiles are related according to their similarity scores, as suggested in Section 3.8.
- Initial data quality assessment: An initial data quality assessment based on the generated or loaded requirement profile is conducted. An aggregated quality map layer is created.
- Manual improvements by the user: The user improves parameters of the generated requirement profile until the exact parameters are met. The requirement profile is saved accordingly to be reused by other users.
Using the aforementioned system workflow, the exploration of thematic maps from concepts and initial suggestions for requirement profiles can be achieved. If requirement profiles have already been previously assigned to thematic maps and/or situations, the requirement profile similarity score will relate those previously assigned components.
4.2. System Components
The system consists of the following components:
- Data Quality Service: A web service application providing data quality metric calculation services with the option to store and to use user-defined reference data sets and/or online resources (e.g., OpenStreetMap, Here Map) for extrinsic data quality metrics.
- Data Quality Triple Store: A triple store consisting of semantic descriptions of data quality metrics and links to other knowledge bases, including use case specific information.Requirement Profiles are stored in this triple store.
- Geospatial Data Repository: A triple store or set of web services providing access to geospatial data as a basis for thematic map creation. If geospatial data is not provided in RDF, it can be converted to an ontology model such as described in Reference [61] using appropriate methods on-the-fly [62,63]
- Linked Open Data Cloud: Further ontologies and linked data applications which give context to the requirement profile generation service
- Requirement Profile Generation Service: A web application using the Data Quality Triple Store and Linked Open Data Cloud to generate requirement profiles
- Similarity Evaluation Service: A web service suggesting similar requirement profiles for users based on the similarity score calculation. This web service should be co-located with the Requirement Profile generation service.
- Data Quality Evaluation Service: A web application loading a saved requirement profile from the Data Quality Triple store and using the Geospatial Data Repository triggers the execution of metrics in the Data Quality Service. Finally, this service stores the metric results in the Data Quality Triple Store, a third-party triple store or just returns the result as JSON [64]
- WebFrontend: A web frontend which allows to:
- Detect Thematic Maps
- Trigger requirement profile generation
- Trigger the Data Quality Evaluation service
- Visualizes the result as a layer for data quality
Having defined the components of the automated data quality assurance system, Figure 7 shows the outline of the proposed system. A triple store is used to store integrated geospatial semantic web data that is to be evaluated and is linked to another triple store containing descriptions and URIs to web services calculating data quality metrics. Using reasoning rules, data quality metrics which are needed for the thematic map data can be chosen and executed as defined in Section 3. Section 4.3 shows how the repository of data quality metrics is configured, exposing possible categories of metrics which might be used to calculate data quality.
4.3. A Repository for Data Quality Metrics
Until now, data quality metrics of geospatial data have been discussed to a great extent in several scientific publications. Depending on the nature of the data quality metrics, these require special inputs to deliver an accurate result. This definition always includes a geospatial feature on which the metric is calculated, , as well as metric-dependent further inputs such as a gold standard comparison set for extrinsic metrics or a time point at which the metric is calculated. The output of a metric varies depending on the metric being calculated but can usually be derived to a double value. In this publication, metric types and their inputs are defined as follows:
- Intrinsic Metric , for example, Geometry Validity of a geometry.
- Intrinsic History Metric whereas a list of timepoints is given which is used to calculate the intrinsic metric upon. The tolerance value lists the timely tolerance in the history, for example,
- Extrinsic Metric whereas timepoint indicates the time revision of the extrinsic dataset to compare against, , a resource locator of the extrinsic dataset and tolerance a tolerance considering the timepoint, that is, the maximum amount of time between extrinsic dataset creation and theThe parameter might be omitted if an appropriate dataset can be inferred by other means
- Metadata Metric whereas the metadata of the given dataset is compared to the gold standard dataset
Reference [34] introduced the idea of modelling data quality metric functions as REST web services in order to make them accessible and to assign them a unique identifier. This allows for data quality metrics to be integrated into a semantic web environment.
Data Quality metrics can therefore first be implemented, then tested and when thoroughly tested semantically described to be exposed as an accessible web service. Figure 8 shows an example of such a data quality service which allows for the implementation, testing, semantic description and publication of data quality metric services.
In this publication, this definition of a repository of data quality metric functions is extended by a semantic model describing the suitability of the services in more detail:
- Extrinsic data source suitability description: An ontological description of the suitability of an extrinsic data source to be used for certain situations
- Data Quality metric preferable tendency: Indicates which outcome of the data quality metric value is usually preferable
Metrics can therefore be described using their suitability for certain situations on the side of the client requesting a data quality assessment for the situation they request the assessment to be about and on the data quality service side by providing a description for which situations a data quality metric is suitable and feasible.
5. Experimental Setup
In this section, the experimental setup to test the usefulness of the proposed data quality framework is described on two use cases. The first use case including schools (cf. Section 5.2) shows how single thematic maps may be evaluated. The second use case involving hosptials (cf. Section 5.3) shows how to evaluate a situation.
5.1. Input Data
The input data of the experiment consists of use cases of two thematic maps: Schools and Hospitals. The data constituting the thematic maps are given by a GeoJSON [65] file each. Each GeoJSON file is furthermore enriched with additional context information of Wikidata, which is also used to identify possible thematic maps and to assess information for thematic map creation. The enrichment process which is described in Reference [2] follows a predefined mapping of GeoJSON columns to URIs. It is assumed that no requirement profiles of similar use cases are present in the knowledge base, so that requirement profiles need to be created on the fly using the given data. The requirement profiles are then saved in the knowledge base for further consideration.
5.2. Thematic Map Creation and Basic Evaluation
The first dataset contains schools and should be used as a basis to create thematic maps and to generate requirement profiles (i.e., evaluate the thematic map part mentioned in Section 3.1). The dataset can provide data for the map School_Rescue shown in Figure 9, which asks the question of whether schools expose the number of students for rescue purposes. The same dataset can, however, be used to display a historical map of schools by inception: School_Culture (cf. Figure 10) Both of these representations constitute their own thematic map, which can be automatically generated using the approach in Section 3.1.1 and evaluated using a simple minimum requirement profile shown in Table 4.
5.3. Evaluating a Situation
In the second use case to be examined, a situation should be considered. The use case includes a map of hospital capacities as its thematic map part, which is in a first iteration evaluated as in the examples given previously (cf. Figure 11). The input data format is shown in Table 5.
To model a situation, an application part is added to the thematic map. This application part models the situation of rescuing people from evacuation points and delivering people to the nearest hospital with capacity.
5.4. Requirement Profile Generation
The application part consists of danger zones in which injured people have gathered at rescue points, in need to be rescued and subsequently routed to the nearest available hospital with capacity. For the sake of simplicity, this use case assumes that the road network given is updated with correct information about impassable roads which might interfere in the routing process. If this information is not given, further thematic maps providing this data need to be considered. Given these simplifying assumptions, the use case may be broken down into the following set of thematic maps:
- Thematic Map : Hospital Capacity
- Thematic Map : Road Network (updated for disaster circumstances)
- Thematic Map : Evacuation Points
Relevant properties for the thematic maps can be defined as follows:
- : Hospital Capacity (e.g., number of beds)
- : Road Network (the geometries itself)
- : Evacuation Points (classification)
In the first step, the algorithm derives the following basic requirement profiles shown in Table 6, Table 7 and Table 8.
The road network hereby does not depend on a thematic property or in other words, the geometry itself is the thematic property. In this special case, the road network’s geometry may act as the dealbreaker attribute. Geometry metrics other than Geometry Validity are in this case upgraded to priority 2, as the geometry is the main thematic attribute. The generated requirement profile is shown in Table 7:
Finally, thematic map exposes a situation representing rescue points which may be evaluated by capacity, elevation and the operator attribute (i.e., could be represented as three thematic maps). In the case of a disaster, the rescue operator needs to know if it is his task to rescue the particular rescue point, how many people are to be expected and if this particular rescue point can be used. In the case of a flood, the elevation needs to be high enough for the rescue point to be not flooded. Table 8 shows the generated requirement profile:
5.4.1. Related Attributes
The algorithm found the following related attributes:
- Hospital: Amount of doctors
- Road Network: None
- Evacuation Point: None
The number of doctors was found as a related attribute by the algorithm, whereas the other elements of the situation did not show any significant thematically related attributes.
5.4.2. Eligible/Feasible/Relevant Data Quality Metrics
The repository of data quality metrics for this particular example is narrowed down to the following set of data quality metrics defined in Listing 4:
Listing 4. Example data quality metrics: Data quality metrics which have been defined in the repository of data quality metrics.
Completeness, Freshness, Positional Accuracy, Attribute Existence,
Geometry Validity, HausdorffDistance
Out of the given data quality metrics, the algorithm determined the data quality metrics shown in in Listing 5 to be eligible and feasible:
Listing 5. Feasible example data quality metrics which were found for the data quality assessment.
Attribute Existence, Completeness, Freshness, Positional Accuracy,
Geometry Validity
The HausdorffDistance metric (a metric for shape similarity) [66] is not feasible in this example, as no reference data has been provided. Having established feasible and eligible data quality metrics, their relevancy has been determined as shown in Listing 6:
Listing 6. Relevant example data quality metrics: Existence of attributes, validity of geometries and the positional accuracy of the geometry are deemed as relevant metrics.
Attribute Existence, Geometry Validity, Positional Accuracy
Finally, all components are to create a joint requirement profile according to the prioritization algorithm introduced previously.
5.4.3. Final Joint Requirement Profile for Situation
Now, the algorithm merges the three created requirement profiles to the requirement profile shown in Table 9.
This merged requirement profile constitutes the basis for the map evaluation, which can be done subsequently, highlighting the areas which are suitable for planning the task at hand. This requirement profile is saved in the semantic database for further use until the end-user has possibly optimized it.
5.5. Interpretation
The experiments showed the feasibility of the approach using three different cases. The case of the school inception and the school rescue map showed that a thematic map dependent on only one thematic attribute can be verified rather easily using a minimal automatically generated requirement profile. Both generated requirement profiles would give an evaluation of the map, which could indicate its usefulness even though the requirement profiles could, in both cases, be optimized. In the inception case, the requirement profile could be extended by an attribute describing the state in which the school has been founded. In the rescue case, the requirement profile could consider the related attribute of the number of teachers which could be used to estimate the number of students in case this attribute is not available.
Finally, for the use case of a situational assessment, many thematic maps, one consisting of a single thematic attribute, one with many thematic attributes and one with the geometry being the thematic map attribute were combined to model the situation of a rescue mission for injured people. Based on these requirements, an initial requirement profile which would evaluate the case could be built. The requirement profile was sufficient but not very precise to get an accurate evaluation of the rescue mission situation. In particular, the requirement profile was missing metrics on logical consistency concerning the road network to avoid navigational errors as well as a more precise definition of acceptable attribute values. However, the results could be used for the particular use case and would need to be adjusted only slightly for better results—as was suggested in the description of the algorithm.
5.6. Reasoning of Suitable Data Quality Metrics
As requirement profiles for the different situations and thematic maps are saved in the triple store anyway, one might ask the question if the evaluation of map eligibility can be done in the triple store using reasoning rules. This is indeed possible and could be achieved by converting requirement profile constraints to SWRL [67] rules, as outlined in Reference [1]. This is a good way for geospatial data which is already present as linked data, as can be classified by requirement profiles already entered in the triple store. For the aforementioned use case, an example SWRL ruleset can be generated as shown in Listing 7:
Listing 7. SWRL Ruleset extracted from joined requirement profile whereas RescueMission is a situation depending on the availability of students information (other parts have been excluded due to brevity). The ruleset assigns the Feasible class to the given instance of the rescue mission when the requirements of the requirement profile are fulfilled. The set of Feasible rescue missions may the be queried using the SPARQL query shown in Listing 8.
RescueMission(?mission) & hasPart(?mission,?thematicmap) &
hasRequirementProfile(?thematicmap,?reqprof)  &
has DQEvaluation(?reqprof,?measurement)
& IsAvailableStudents(?measurement) &
Validity(?vmeasurement) & hasValue(?vmeasurement,?vmeasurementvalue) &
smallerThan(?vmeasurementvalue, true8sd:boolean) -> Feasible(?mission)
Using SWRL, the triple store can via reasoning prepare data quality evaluations which, if the geospatial data is integrated can be queried using the SPARQL query in Listing 8:
Listing 8. SPARQL data quality query for a hospital class type. The query asks for hospitals which fulfil the generated requirement profile hospital accessibility and its geometry. The query may be filtered for areas using an appropriate GeoSPARQL Filter statement, for example, geof:sfIntersects to narrow down the data quality evaluation to hospitals in a certain area.
SELECT  ?item ?geom WHERE {
         ?item rdf:type wd:Q16917 .
         ?item geo:hasGeometry/geo:asWKT ?geom .
         ?item dq:hasRequirementProfile ?reqprof .
         ?reqprof semgis:isAppliedOn wd:Q16917 .
         ?reqprof rdf:type semgis:HospitalAccessibilityRequirements .
         ?reqprof semgis:hasDQEvaluation ?evaluation .
         ?evaluation rdf:type semgis:Feasible .
}
The system can in this fashion be fully automized for commonly reoccurring data quality evaluation tasks such as updating the same datasets year by year.
6. Discussion
The framework can determine accurate data quality parameters and give suggestions in which ranges these data quality parameters are to be filled. In addition, an initial data quality evaluation approach can be generated by the framework and/or suggestions to create such an approach can be given. User-corrected data quality evaluation approaches are saved as linked data, giving other users evaluating the same problem the possibility to first query for a similar use case and the automated data quality evaluation system to choose a preferred requirement profile suitable for the situation-specific need.
Given such a system and a potential repository of semantic data quality profiles, end users are given the following new possibilities:
- Improve their own quality assurance processes by evaluating how other people evaluated the same kind of data
- Quickly estimate which map in which area is suitable for a use case by reusing requirement profiles for the same or similar situations
- Get suggestions on how to evaluate thematic maps and use cases using the algorithm presented in this publication
The author sees applications of this system in the VGI [68] and linked data communities which provide a variety of thematic maps. Simple thematic maps highlighting a specific attribute such as the OpenRailwayMap (https://www.openrailwaymap.org) for maximum speeds (cf. Figure 1) or the number of students of a school can be provided with a quality assurance layer as demonstrated in the requirement profile generation tool (https://i3mainz.github.io/MapQualityAssessment/rpgeneration.html.) can be automatically verified according to the quality criteria pool. Already, these verified maps can be of great help for simple planning tasks, for example, “Can a routing algorithm plan the arrival time of a train accurately given the max speed information of a certain area?”. For more complex use cases, the possibility to create new use cases out of different thematic maps is an intuitive (WYSIWYG (What You See Is What You Get) [69]) way to model use cases and can therefore be accessed more easily. Naturally, when requirement profiles are modelled as linked data, reasoning approaches can also help to make decisions on whether a map should be used for certain purposes.
Limitations
This method finds its limitations in several scenarios. Firstly, the automated method of creating a rudimentary requirement profile is clearly only a first attempt and needs end-users to improve the description. Secondly, if predefined requirement profiles exist in semantic web representations, those may or may not be suitable enough for the current use case that is to be solved, that is, also requires end-users to check if the requirement profile is suitable for their use case. However, those two limitations also provide opportunities for the community of end-users to contribute to a growing repository of linked data requirement profiles (especially for the VGI community). Eventually, if enough requirement profiles have been created, the question of which suitable data quality metrics to apply could even be learned, for example, by a machine learning approach. Concerning the algorithm for thematic map detection, the algorithm might overlook suitable thematic map properties or properties which fall below the threshold which has been assigned by the algorithm. This does not constitute a major problem as users might find a more suitable threshold to apply. Finally, the method is not suitable to determine all interdependencies between parts of a situation. While the method can suggest important attributes of thematic maps and provide an initial evaluation, manual optimizations are required for attributes spanning more than one topic.
7. Conclusions and Future Work
In this publication, a new method of data quality evaluation, taking into consideration not only data quality metrics and measurements but also data quality metric grounding and situational descriptions of thematic maps has been presented. The approach is based on the idea of thematic map evaluation which has been extended to evaluate situational descriptions by describing them as a set of thematic maps. The creation of a joint ontology model with the central concept of a requirement profile allows the linkage of geometries, situational descriptions, data quality vocabularies, provenance information and thematic map definitions. In addition, the publication presents a heuristic algorithm which tries to detect suitable data quality metrics for a given thematic map. This algorithm, when applied to a variety of thematic maps allows for the creation of a joint requirement profile to evaluate situations.
This approach tried to tackle the problem of choosing appropriate data quality metrics which is usually not an easy task to define for end-users. When approaching end-users with the question which parts of a map need to be quality-assured to be useful for their purposes, the knowledge as to which parts of a map are actually important for the use case to be solved is usually not sufficient. Most end-users see the map as a tool but have insufficient experience to evaluate the quality of maps. Given the framework introduced in this publication, users can define specialized topics which are relevant to their task. According to the authors experience defining relevant elements (e.g., points of interest) and topics associated with a use case is a much easier task to be solved by end-users. The confirmation of the relevance of these elements is even more user friendly.
Finally, because of the semantic modelling of the approach, this contribution builds the foundation to share and to standardize data quality evaluation methods (i.e., requirement profiles) in the semantic web for access and/or reasoning purposes. Also, an algorithm for defining the similarity of requirement profiles has been presented which provides the possibility to match a similar requirement profile to a previously unknown situational description or thematic map. Potential application areas of this method can be seen in the volunteered geographic information (VGI) community, which provide a variety of thematic map data. However, the method may also apply to authorities planning, for example, rescue missions. For these authorities, for example, a fire brigade, time is of the essence when planning a rescue mission. If many maps are available to plan a rescue mission, there is usually no time to determine the best map for the current task at hand. Using the evaluation method proposed in this publication, an indicator can be given as to which map would be the best choice for the current use case.
Future work will involve investigating further complex quality evaluation procedures and to find out relationships between different quality assurance methods, that is, requirement profiles. If enough requirement profiles can be modelled, which requirement profiles share evaluation methods and attributes? Can a taxonomy of requirement profiles be created for certain application cases and could the results of quality assurance methods if they are executed, also be applied in other application cases? Answering the last question can be of particular interest for the VGI community: If thematic maps are build up by the VGI community, they might share aspects of their purpose which could be covered by more complex quality assurance aspects.
Lastly, the work could be extended by applying machine learning algorithms or reasoning approaches to the knowledge base with the goal to infer alternative evaluation methods for thematic maps and use cases. Possibly more simplified evaluation methods or more sophisticated evaluation methods could be created.
Funding
This research was funded by the German federal ministry for education and research (BMBF) grant number 03FH032IX4.
Conflicts of Interest
The author declares no conflict of interest.
References
- Homburg, T.; Boochs, F. Situation-Dependent Data Quality Analysis for Geospatial Data Using Semantic Technologies. In Business Information Systems Workshops; Abramowicz, W., Paschke, A., Eds.; Springer International Publishing: Cham, Switzerland, 2019; pp. 566–578. [Google Scholar] [CrossRef]
- Homburg, T.; Steppan, S.; Wuerriehausen, F. Semantic Data integration and quality assurance of thematic maps in the German geographic authority. In Proceedings of the 2nd Workshop on Quality of Open Data (QOD2019), Sevilla, Spain, 28 June 2019. [Google Scholar]
- Antenucci, J.C.; Brown, K.; Croswell, P.L.; Kevany, M.J.; Archer, H. Geographic Information Systems: A Guide to the Technology; Springer: New York, NY, USA, 1991. [Google Scholar]
- Pipino, L.L.; Lee, Y.W.; Wang, R.Y. Data quality assessment. Commun. ACM 2002, 45, 211–218. [Google Scholar] [CrossRef]
- Ballou, D.P.; Tayi, G.K. Enhancing data quality in data warehouse environments. Commun. ACM 1999, 42, 73–78. [Google Scholar] [CrossRef]
- Wang, R.Y.; Strong, D.M. Beyond accuracy: What data quality means to data consumers. J. Manag. Inf. Syst. 1996, 12, 5–33. [Google Scholar] [CrossRef]
- Strong, D.M.; Lee, Y.W.; Wang, R.Y. Data quality in context. Commun. ACM 1997, 40, 103–110. [Google Scholar] [CrossRef]
- Wang, R.Y. A product perspective on total data quality management. Commun. ACM 1998, 41, 58–65. [Google Scholar] [CrossRef]
- Redman, T.C. The impact of poor data quality on the typical enterprise. Commun. ACM 1998, 41, 79–82. [Google Scholar] [CrossRef]
- Wang, R.Y.; Storey, V.C.; Firth, C.P. A framework for analysis of data quality research. IEEE Trans. Knowl. Data Eng. 1995, 7, 623–640. [Google Scholar] [CrossRef] [Green Version]
- Redman, T.C. Data Quality: The Field Guide; Butterworth-Heinemann: Oxford, UK, 2001. [Google Scholar]
- Lee, Y.W.; Pipino, L.; Funk, J.D.; Wang, R.Y. Journey to Data Quality; MIT Press: Cambridge, MA, USA, 2006. [Google Scholar]
- Wang, R.Y.; Ziad, M.; Lee, Y.W. Data Quality; Springer Science & Business Media: Berlin/Heidelberg, Germany, 2006; Volume 23. [Google Scholar]
- Batini, C.; Cappiello, C.; Francalanci, C.; Maurino, A. Methodologies for data quality assessment and improvement. Acm Comput. Surv. CSUR 2009, 41, 1–52. [Google Scholar] [CrossRef] [Green Version]
- Pôças, I.; Gonçalves, J.; Marcos, B.; Alonso, J.; Castro, P.; Honrado, J.P. Evaluating the fitness for use of spatial data sets to promote quality in ecological assessment and monitoring. Int. J. Geogr. Inf. Sci. 2014, 28, 2356–2371. [Google Scholar] [CrossRef]
- Devillers, R.; Jeansoulin, R.; Goodchild, M.F. Fundamentals of Spatial Data Quality; ISTE: London, UK, 2006; ISBN 1905209568. [Google Scholar]
- Jackson, S.; Mullen, W.; Agouris, P.; Crooks, A.; Croitoru, A.; Stefanidis, A. Assessing completeness and spatial error of features in volunteered geographic information. ISPRS Int. J. Geo-Inf. 2013, 2, 507–530. [Google Scholar] [CrossRef]
- Drummond, J. Positional accuracy. Elem. Spat. Data Qual. 1995, 31–58. [Google Scholar]
- Stehman, S.V.; Wickham, J.; Smith, J.; Yang, L. Thematic accuracy of the 1992 National Land-Cover Data for the eastern United States: Statistical methodology and regional results. Remote Sens. Environ. 2003, 86, 500–516. [Google Scholar] [CrossRef]
- Chaudhuri, G.; Clarke, K.C. Temporal accuracy in urban growth forecasting: A study using the SLEUTH model. Trans. GIS 2014, 18, 302–320. [Google Scholar] [CrossRef]
- Salgé, F. Semantic accuracy. In Elements of Spatial Data Quality; Elsevier: Amsterdam, Netherlands, 1995; pp. 139–151. [Google Scholar]
- Gronroos, C. Service quality: The six criteria of good perceived service. Rev. Bus. 1988, 9, 10. [Google Scholar]
- Castelfranchi, C.; Falcone, R.; Pezzulo, G. Integrating trustfulness and decision using fuzzy cognitive maps. In Proceedings of the International Conference on Trust Management, Heraklion, Greece, 28–30 May 2003; pp. 195–210. [Google Scholar]
- Zaveri, A.; Rula, A.; Maurino, A.; Pietrobon, R.; Lehmann, J.; Auer, S. Quality assessment for linked data: A survey. Semant. Web 2016, 7, 63–93. [Google Scholar] [CrossRef]
- Heinrich, B.; Kaiser, M.; Klier, M. How to Measure Data Quality? A Metric-Based Approach; Twenty Eighth International Conference on Information Systems: Montreal, QC, Canada, 2007. [Google Scholar]
- Mooney, P.; Corcoran, P.; Winstanley, A.C. Towards quality metrics for OpenStreetMap. In Proceedings of the 18th SIGSPATIAL International Conference on Advances in Geographic Information Systems, San Jose, CA, USA, 2 November 2010; pp. 514–517. [Google Scholar]
- Barron, C.; Neis, P.; Zipf, A. Towards intrinsic quality analysis of OpenStreetMap datasets. In Proceedings of the International Workshop on Action and Interaction in Volunteered Geographic Information (ACTIVITY), Leuven, Belgium, 14–17 May 2013. [Google Scholar]
- Barron, C.; Neis, P.; Zipf, A. A comprehensive framework for intrinsic OpenStreetMap quality analysis. Trans. GIS 2014, 18, 877–895. [Google Scholar] [CrossRef]
- Neis, P.; Zipf, A. Analyzing the contributor activity of a volunteered geographic information project—The case of OpenStreetMap. ISPRS Int. J. Geo-Inf. 2012, 1, 146–165. [Google Scholar] [CrossRef]
- Lebo, T.; Sahoo, S.; McGuinness, D.; Belhajjame, K.; Cheney, J.; Corsar, D.; Garijo, D.; Soiland-Reyes, S.; Zednik, S.; Zhao, J. Prov-O: The Prov Ontology; W3C Recommendation; World Wide Web Consortium: Cambridge, MA, USA, 30 April 2013. [Google Scholar]
- Di, L.; Shao, Y.; Kang, L. Implementation of geospatial data provenance in a web service workflow environment with ISO 19115 and ISO 19115-2 lineage model. IEEE Trans. Geosci. Remote. Sens. 2013, 51, 5082–5089. [Google Scholar]
- Yue, P.; He, L. Geospatial data provenance in cyberinfrastructure. In Proceedings of the 2009 17th International Conference on Geoinformatics, Fairfax, VA, USA, 12–14 August 2009; pp. 1–4. [Google Scholar]
- Mocnik, F.B.; Mobasheri, A.; Griesbaum, L.; Eckle, M.; Jacobs, C.; Klonner, C. A grounding-based ontology of data quality measures. J. Spat. Inf. Sci. 2018, 2018, 1–25. [Google Scholar] [CrossRef]
- Mocnik, F.B. Linked Open Data Vocabularies for Semantically Annotated Repositories of Data Quality Measures (Short Paper). In Proceedings of the 10th International Conference on Geographic Information Science (GIScience 2018), Melbourne, Australia, 28 August 2018. [Google Scholar]
- Thrower, N.J. Maps and Civilization: Cartography in Culture and Society; University of Chicago Press: Chicago, IL, USA, 2008. [Google Scholar]
- Mauro, N.; Ardissono, L. Thematic Maps for Geographical Information Search. In Proceedings of the Adjunct Publication of the 25th Conference on User Modeling, Adaptation and Personalization, Bratislava, Slovakia, 9–12 July 2017; pp. 337–342. [Google Scholar]
- Rowell, J.; Ungar, S. Feeling our way: Tactile map user requirements-a survey. In Proceedings of the International Cartographic Conference, La Coruna, Spain, 9–16 July 2005. [Google Scholar]
- Ramm, F.; Topf, J.; Chilton, S. OpenStreetMap: Using and Enhancing the Free Map of the World; UIT Cambridge: Cambridge, UK, 2011. [Google Scholar]
- Pavlenko, A. Mapnik. Retrieved December 2019. 2012. Available online: https://github.com/mapnik/mapnik (accessed on 15 November 2020).
- Bärlocher, M. OpenSeaMap—Die freie seekarte. Hydrogr. Nachr. 2012, 91, 10–13. [Google Scholar]
- Battle, R.; Kolas, D. Enabling the geospatial semantic web with parliament and geosparql. Semant. Web 2012, 3, 355–370. [Google Scholar] [CrossRef]
- Meditskos, G.; Dasiopoulou, S.; Efstathiou, V.; Kompatsiaris, I. Ontology patterns for complex activity modelling. In Proceedings of the International Workshop on Rules and Rule Markup Languages for the semantic web, Seattle, WA, USA, 11–13 July 2013; pp. 144–157. [Google Scholar]
- Kokar, M.M.; Matheus, C.J.; Baclawski, K. Ontology-based situation awareness. Inf. Fusion 2009, 10, 83–98. [Google Scholar] [CrossRef]
- Matheus, C.J.; Kokar, M.M.; Baclawski, K. A core ontology for situation awareness. In Proceedings of the Sixth International Conference on Information Fusion, Cairns, Queensland, Australia, 8–11 July 2003; Volume 1, pp. 545–552. [Google Scholar]
- Debattista, J.; Lange, C.; Auer, S. DaQ, An Ontology for Dataset Quality Information; Linked Data On The Web Workshop: Seoul, Korea, 2014. [Google Scholar]
- Missier, P.; Belhajjame, K.; Cheney, J. The W3C PROV family of specifications for modelling provenance metadata. In Proceedings of the 16th International Conference on Extending Database Technology, Genoa, Italy, 18–22 March 2013; pp. 773–776. [Google Scholar]
- Yilmaz, C.; Comert, C.; Yildirim, D. SDQO and SfO, Ontologies for Spatial Data Quality Assessment. Int. Arch. Photogramm. Remote Sens. Spat. Inf. Sci. 2019, 42, 1275–1279. [Google Scholar] [CrossRef] [Green Version]
- Mondzech, J.; Sester, M. Quality analysis of OpenStreetMap data based on application needs. Cartogr. Int. J. Geogr. Inf. Geovisualization 2011, 46, 115–125. [Google Scholar] [CrossRef]
- Bruin, S.D.; Bregt, A.; Ven, M.V.d. Assessing fitness for use: The expected value of spatial data sets. Int. J. Geogr. Inf. Sci. 2001, 15, 457–471. [Google Scholar] [CrossRef]
- Agumya, A.; Hunter, G.J. A risk-based approach to assessing the ‘fitness for use’of spatial data. URISA J. 1999, 11, 33–44. [Google Scholar]
- Devillers, R.; Bédard, Y.; Jeansoulin, R.; Moulin, B. Towards spatial data quality information analysis tools for experts assessing the fitness for use of spatial data. Int. J. Geogr. Inf. Sci. 2007, 21, 261–282. [Google Scholar] [CrossRef]
- McBride, B. The resource description framework (RDF) and its vocabulary description language RDFS. In Handbook on Ontologies; Springer: Berlin/Heidelberg, Germany, 2004; pp. 51–65. [Google Scholar]
- Antoniou, G.; Van Harmelen, F. Web ontology language: Owl. In Handbook on Ontologies; Springer: Berlin/Heidelberg, Germany, 2004; pp. 67–92. [Google Scholar]
- Pérez, J.; Arenas, M.; Gutierrez, C. Semantics and Complexity of SPARQL. In Proceedings of the International semantic web Conference, Athens, GA, USA, 5–9 November 2006; pp. 30–43. [Google Scholar]
- Vrandečić, D.; Krötzsch, M. Wikidata: A free collaborative knowledge base. Commun. ACM 2014, 57, 78–85. [Google Scholar] [CrossRef]
- Meng, L.; Huang, R.; Gu, J. A review of semantic similarity measures in wordnet. Int. J. Hybrid Inf. Technol. 2013, 6, 1–12. [Google Scholar]
- World Wide Web Consortium. Data Catalog Vocabulary (DCAT). W3C Recommendation. 2014. Available online: https://www.w3.org/TR/vocab-dcat/ (accessed on 15 November 2020).
- Huttenlocher, D.P.; Klanderman, G.A.; Rucklidge, W.J. Comparing images using the Hausdorff distance. IEEE Trans. Pattern Anal. Mach. Intell. 1993, 15, 850–863. [Google Scholar] [CrossRef] [Green Version]
- Lassila, O.; Swick, R.R.; World Wide Web Consortium. Resource Description Framework (RDF) Model and Syntax Specification. W3C Recommendation. 1998. Available online: https://www.w3.org/TR/1998/WD-rdf-syntax-19980720/ (accessed on 15 November 2020).
- Ngan, L.D.; Hang, T.M.; Goh, A.E.S. Semantic similarity between concepts from different OWL ontologies. In Proceedings of the 2006 4th IEEE International Conference on Industrial Informatics, Singapore, 16–18 August 2006; pp. 618–623. [Google Scholar]
- Homburg, T.; Prudhomme, C.; Würriehausen, F.; Karmacharya, A.; Boochs, F.; Roxin, A.; Cruz, C. Interpreting heterogeneous geospatial data using semantic web technologies. In Proceedings of the International Conference on Computational Science and Its Applications, Beijing, China, 4–7 July 2016; pp. 240–255. [Google Scholar]
- Prudhomme, C.; Homburg, T.; Ponciano, J.J.; Boochs, F.; Roxin, A.; Cruz, C. Automatic Integration of Spatial Data into the semantic web. In Proceedings of the 13th International Conference on Web Information Systems and Technologies, Porto, Portugal, 25–27 April 2017; pp. 107–115. [Google Scholar]
- Prudhomme, C.; Homburg, T.; Ponciano, J.J.; Boochs, F.; Cruz, C.; Roxin, A.M. Interpretation and automatic integration of geospatial data into the semantic web. Computing 2020, 102, 365–391. [Google Scholar] [CrossRef]
- Bray, T. The Javascript Object Notation (Json) Data Interchange Format. RFC 8259; The Internet Engineering Task Force. 2017. Available online: https://tools.ietf.org/id/draft-ietf-jsonbis-rfc7159bis-04.html (accessed on 15 November 2020).
- Butler, H.; Daly, M.; Doyle, A.; Gillies, S.; Hagen, S.; Schaub, T. The Geojson Format. RFC 7946; The Internet Engineering Task Force. 2016. Available online: https://tools.ietf.org/html/rfc7946 (accessed on 15 November 2020).
- Takacs, B. Comparing face images using the modified Hausdorff distance. Pattern Recognit. 1998, 31, 1873–1881. [Google Scholar] [CrossRef]
- Horrocks, I.; Patel-Schneider, P.F.; Boley, H.; Tabet, S.; Grosof, B.; Dean, M. SWRL: A semantic web rule language combining OWL and RuleML. W3C Memb. Submiss. 2004, 21, 1–31. [Google Scholar]
- Sui, D.; Elwood, S.; Goodchild, M. Crowdsourcing Geographic Knowledge: Volunteered Geographic Information (VGI) in Theory and Practice; Springer Science & Business Media: Berlin/Heidelberg, Germany, 2012. [Google Scholar]
- Sahuguet, A.; Azavant, F. Wysiwyg Web Wrapper Factory (W4f); Working Paper, UPenn Engineering. 1999. Available online: https://www.semanticscholar.org/paper/WysiWyg-Web-Wrapper-Factory-(W4F)-Sahuguet-Azavant/fa6c421e483e012578642829524e5b2961e1c097 (accessed on 15 November 2020).
Figure 1.
Thematic Map: OpenRailwayMap showing maximum speeds of railway lines in Germany. Here, a thematic map layer of max speeds is overlaying the general background of OpenStreetMap. Clearly, the focus of this map is to show the maximum speeds of railway lines. Therefore other details of the map except for the existence and completeness of the railway network are less important.

Figure 2.
School Accessibility Map: A thematic map representing wheelchair access to school buildings in Potsdam, Germany. The wheelchair access may be provided, not provided, limited or there may be no data given. Only one attribute is needed to generate the thematic map as shown above.
Figure 2.
School Accessibility Map: A thematic map representing wheelchair access to school buildings in Potsdam, Germany. The wheelchair access may be provided, not provided, limited or there may be no data given. Only one attribute is needed to generate the thematic map as shown above.

Figure 3.
Requirement Profile Generation Tool: Highlights the result of the query in Listing 1 on the right and shows an example of “located in the administrative territorial entity” (P131) on the map. The attribute occurs frequently, has more than one unique attribute, but is not entirely unique, i.e., fulfils the given criteria for a thematic map property.

Figure 4.
Requirement Profile Suggestion: A requirement profile is suggested by the system for the usecase of School Wheelchair Accessibility according to the workflow described previously. The algorithm detected the dealbreaker property “wheelchair accessibility” and Geometry Validity as priority 1 requirements. The related property “toilets:wheelchair” has been found as a related requirement and is classified as priority 2. Finally, a metadata quality metric Freshness has been inferred with a range suggestion (priority 3) and the positional accuracy metric has been added as a general purpose geometry evaluation metric (priority 4). In this case no other metrics were deemed eligible and feasible by the system, thus no priority 5 metric is visible. The generated requirement profile is applied on the given map an gives aggregated data quality results for schools in the area of Mainz. The requirement profile may now be further refined by the end user.

Figure 5.
Complete ontology model: The ontology model contains the requirement profile as its connecting component between situations, geometries, provenance information, data quality metrics and the description of a thematic map. For each of the components, a standardized vocabulary is being used. For requirement profiles and the connection of situations to requirement profiles, the respective vocabulary is stated within this publication.

Figure 6.
Example individual implementing the complete ontology model: A school modeled as school_instance1 is connected to its geometry using the GeoSPARQL vocabulary. The school instance is related to the new Thematic Map vocabulary visa the isPartOf relation. The Thematic Map instance relates to a set of evaluations which are the results of data quality assessments. In addition, the thematic map relates to one or more requirement profiles which relate to a set of criteria, shown here with the condition of an accessibility constraint. Thematic map instances are classified and may related to a situational description.

Figure 7.
Architecture of the overall system: A data quality service provides semantically annotated data quality metric calculations which may be related to a situational description or thematic map. A geospatial data repository gets geospatial data from the linked open data cloud and combines these geometries with data quality metric calculation results provided as RDF. In the data quality triple store, requirement profiles and links to situational concepts in the linked open data cloud are stored in order to link situational descriptions to data quality metrics.

Figure 8.
Data Quality Service: The data quality service provides data quality metrics which can be tested in a web interface. The service exposes these metrics as a webservice and as semantic web descriptions which are stored in the Data Quality Triple Store. If new data quality metrics are implemented, those are automatically added to the Data Quality Triple store where they can be annotated and linked to requirement profiles. The service besides allowing to provide own reference data may take a triple store or other webservice as a comparison (gold standard) dataset.

Figure 9.
Thematic Map School_Rescue exposing the quality of a map highlighting the number of students from green = good to red = bad. Rescue operators may use this information to estimate rescue efforts in the case of a disaster. Areas with low school coverage should prompt the authorities not to plan the rescue using this map source.

Figure 10.
Thematic Map School_Culture exposing the date of the school’s inception, including a data quality layer exposing a good coverage with green and a bad coverage with red. Contrary to Figure 9, aside from the positional accuracy, only one attribute, the inception is of major interest in this thematic map. Further data lower priority quality metrics may be applied.

Figure 11.
Thematic Map Hospital_Capacity exposing the number of beds available in a clinic, including a data quality layer giving a quality estimation of the map. Rescue operators may use this information to plan rescue contingencies in case of a disaster such as a flood. The coverage of the relevant information according to the requirement profile looks usable in this particular case.


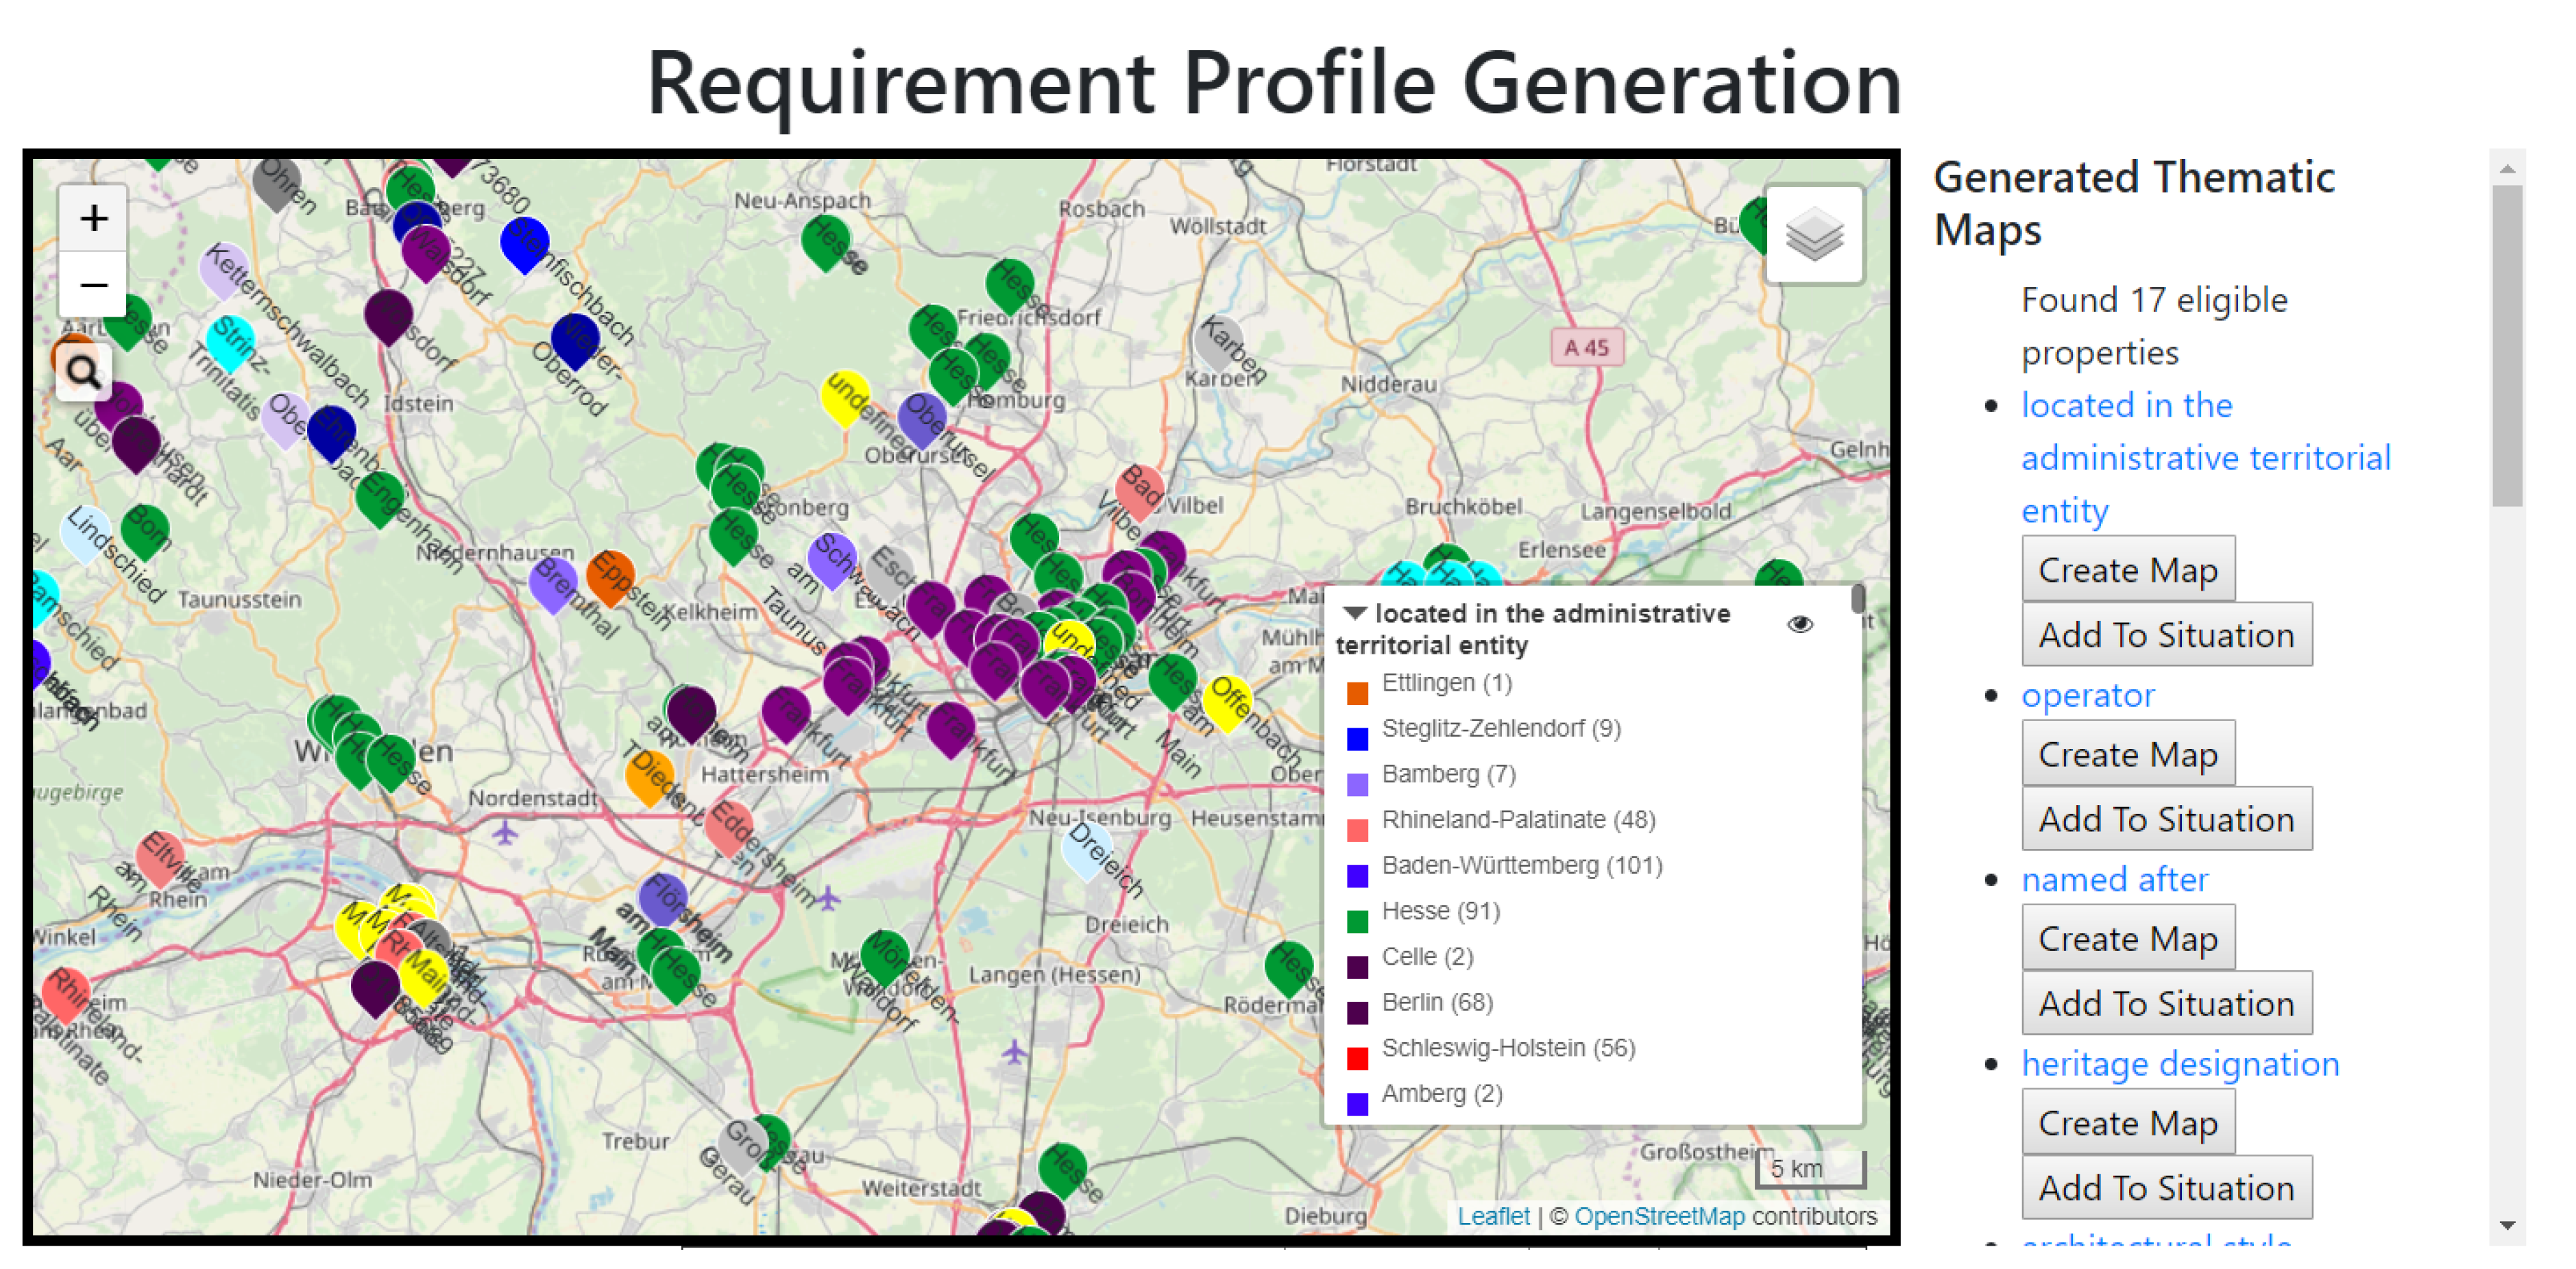
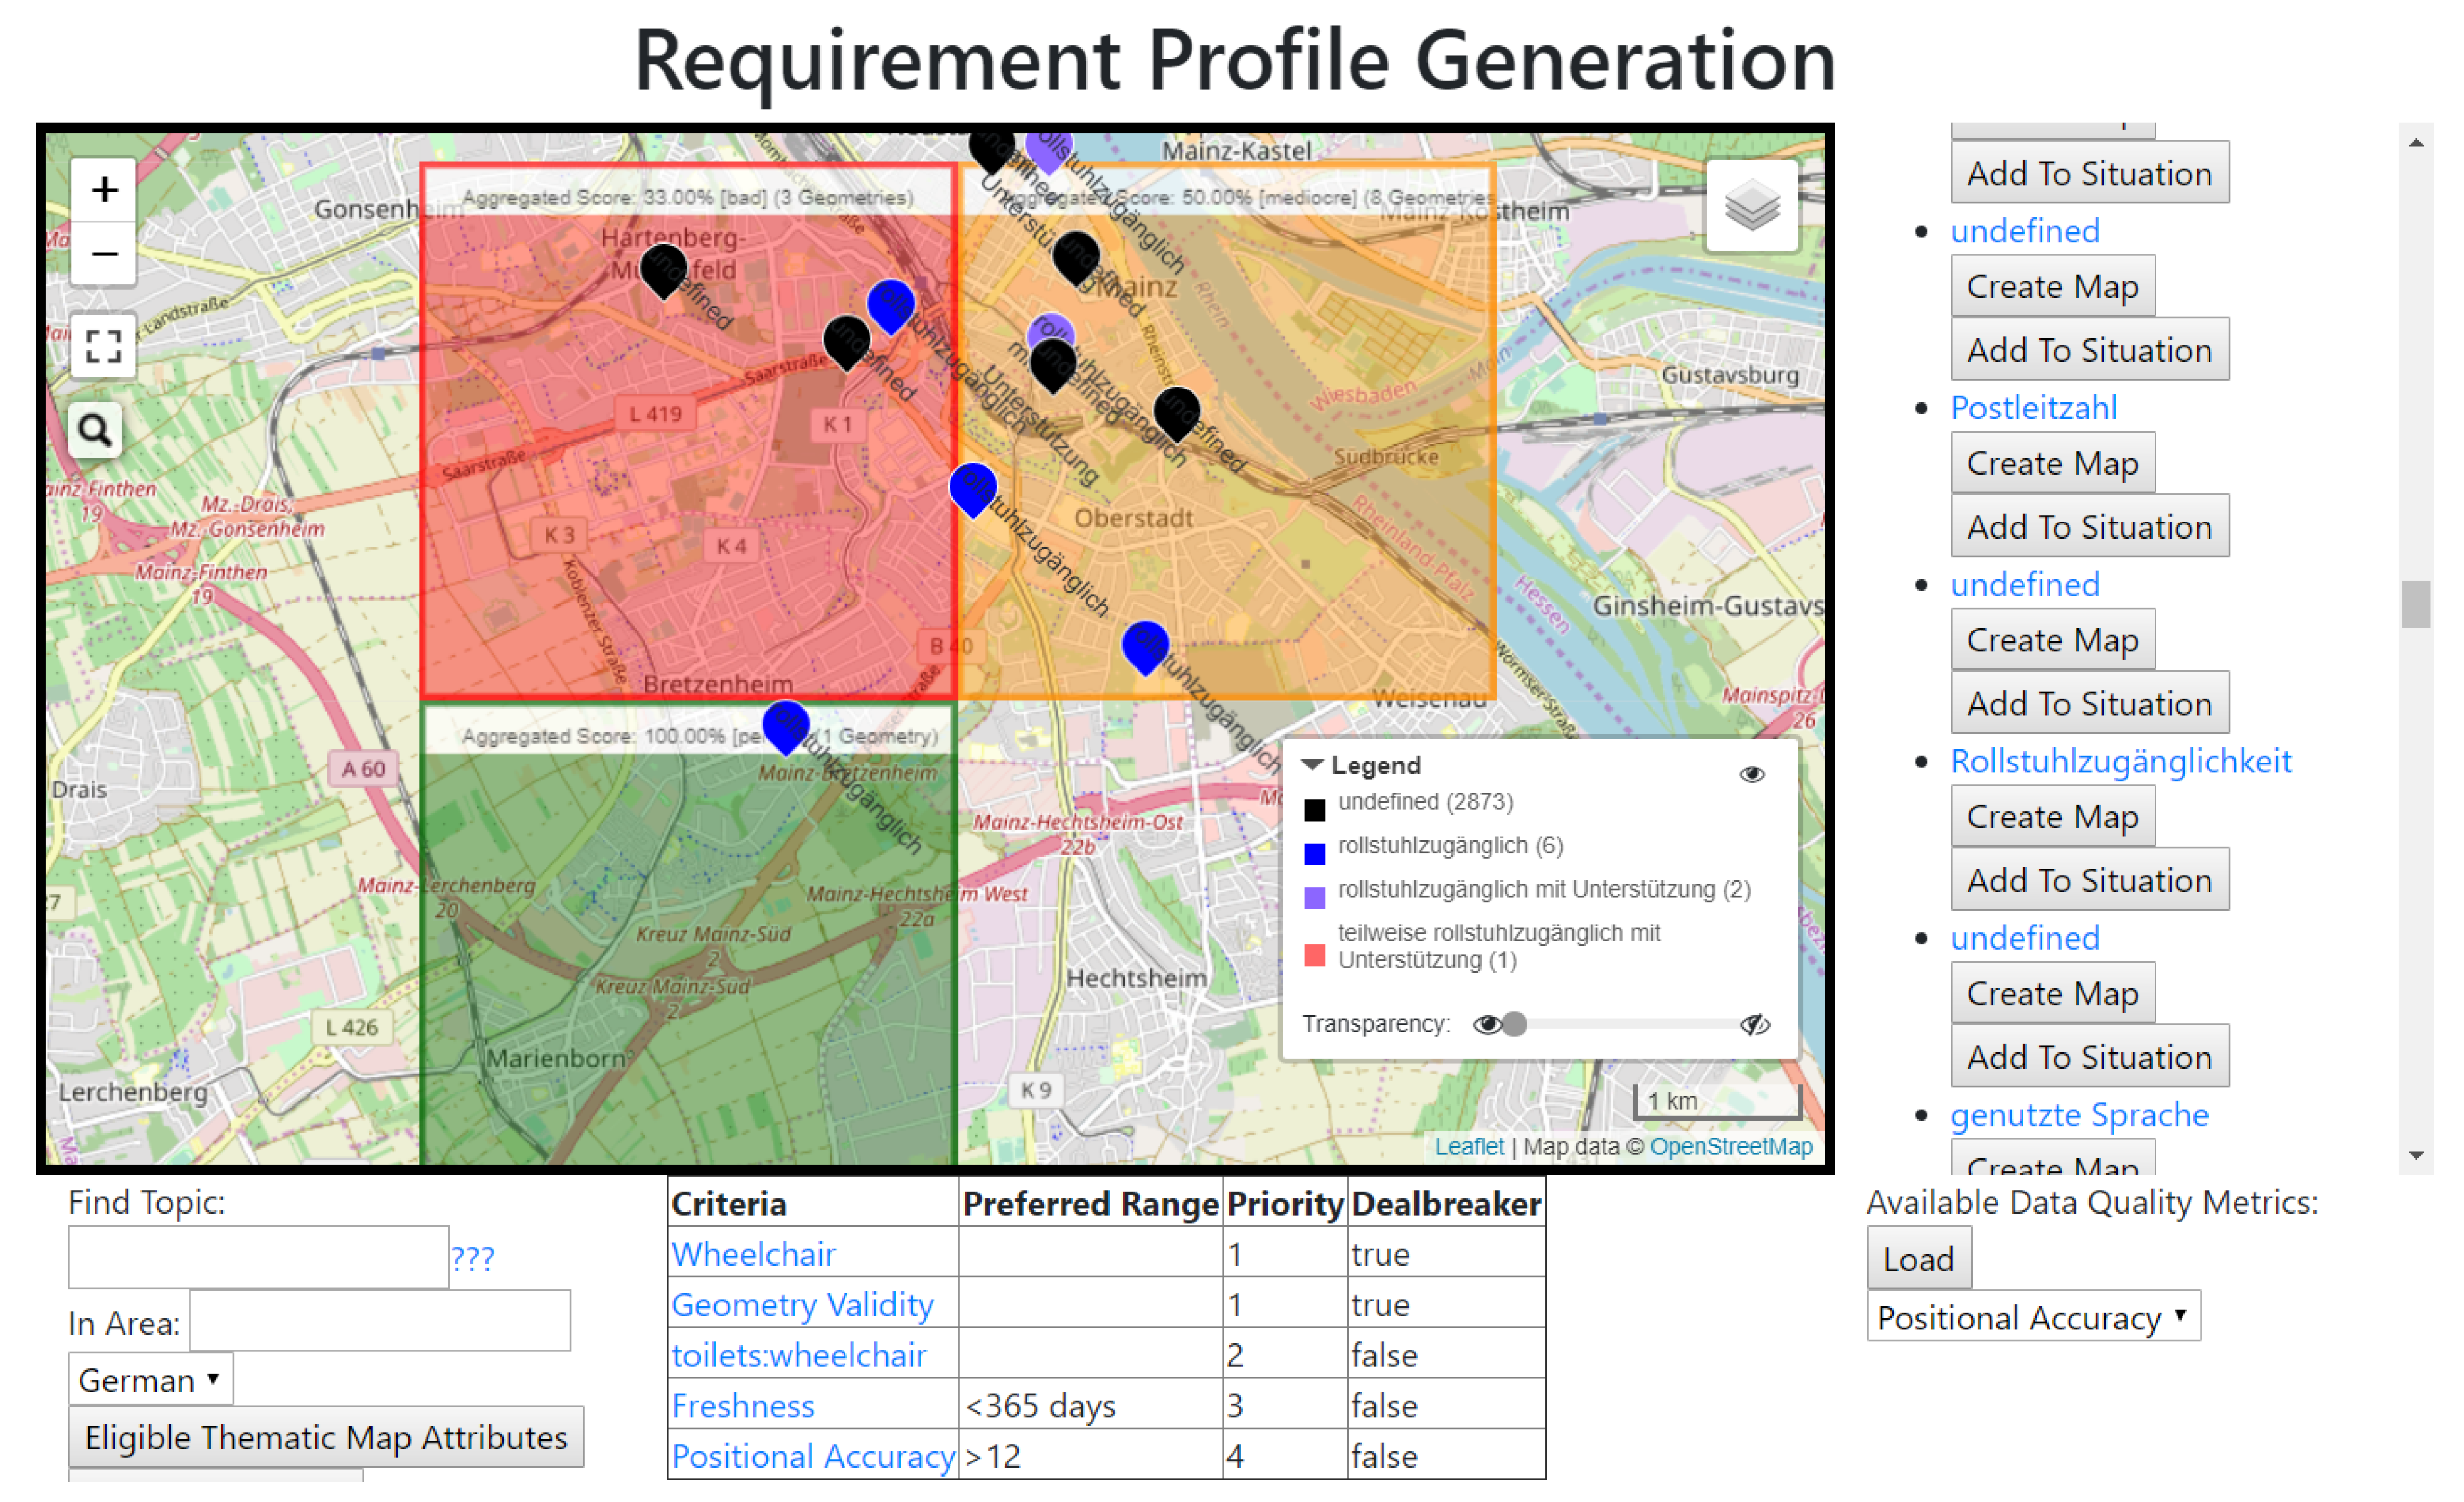
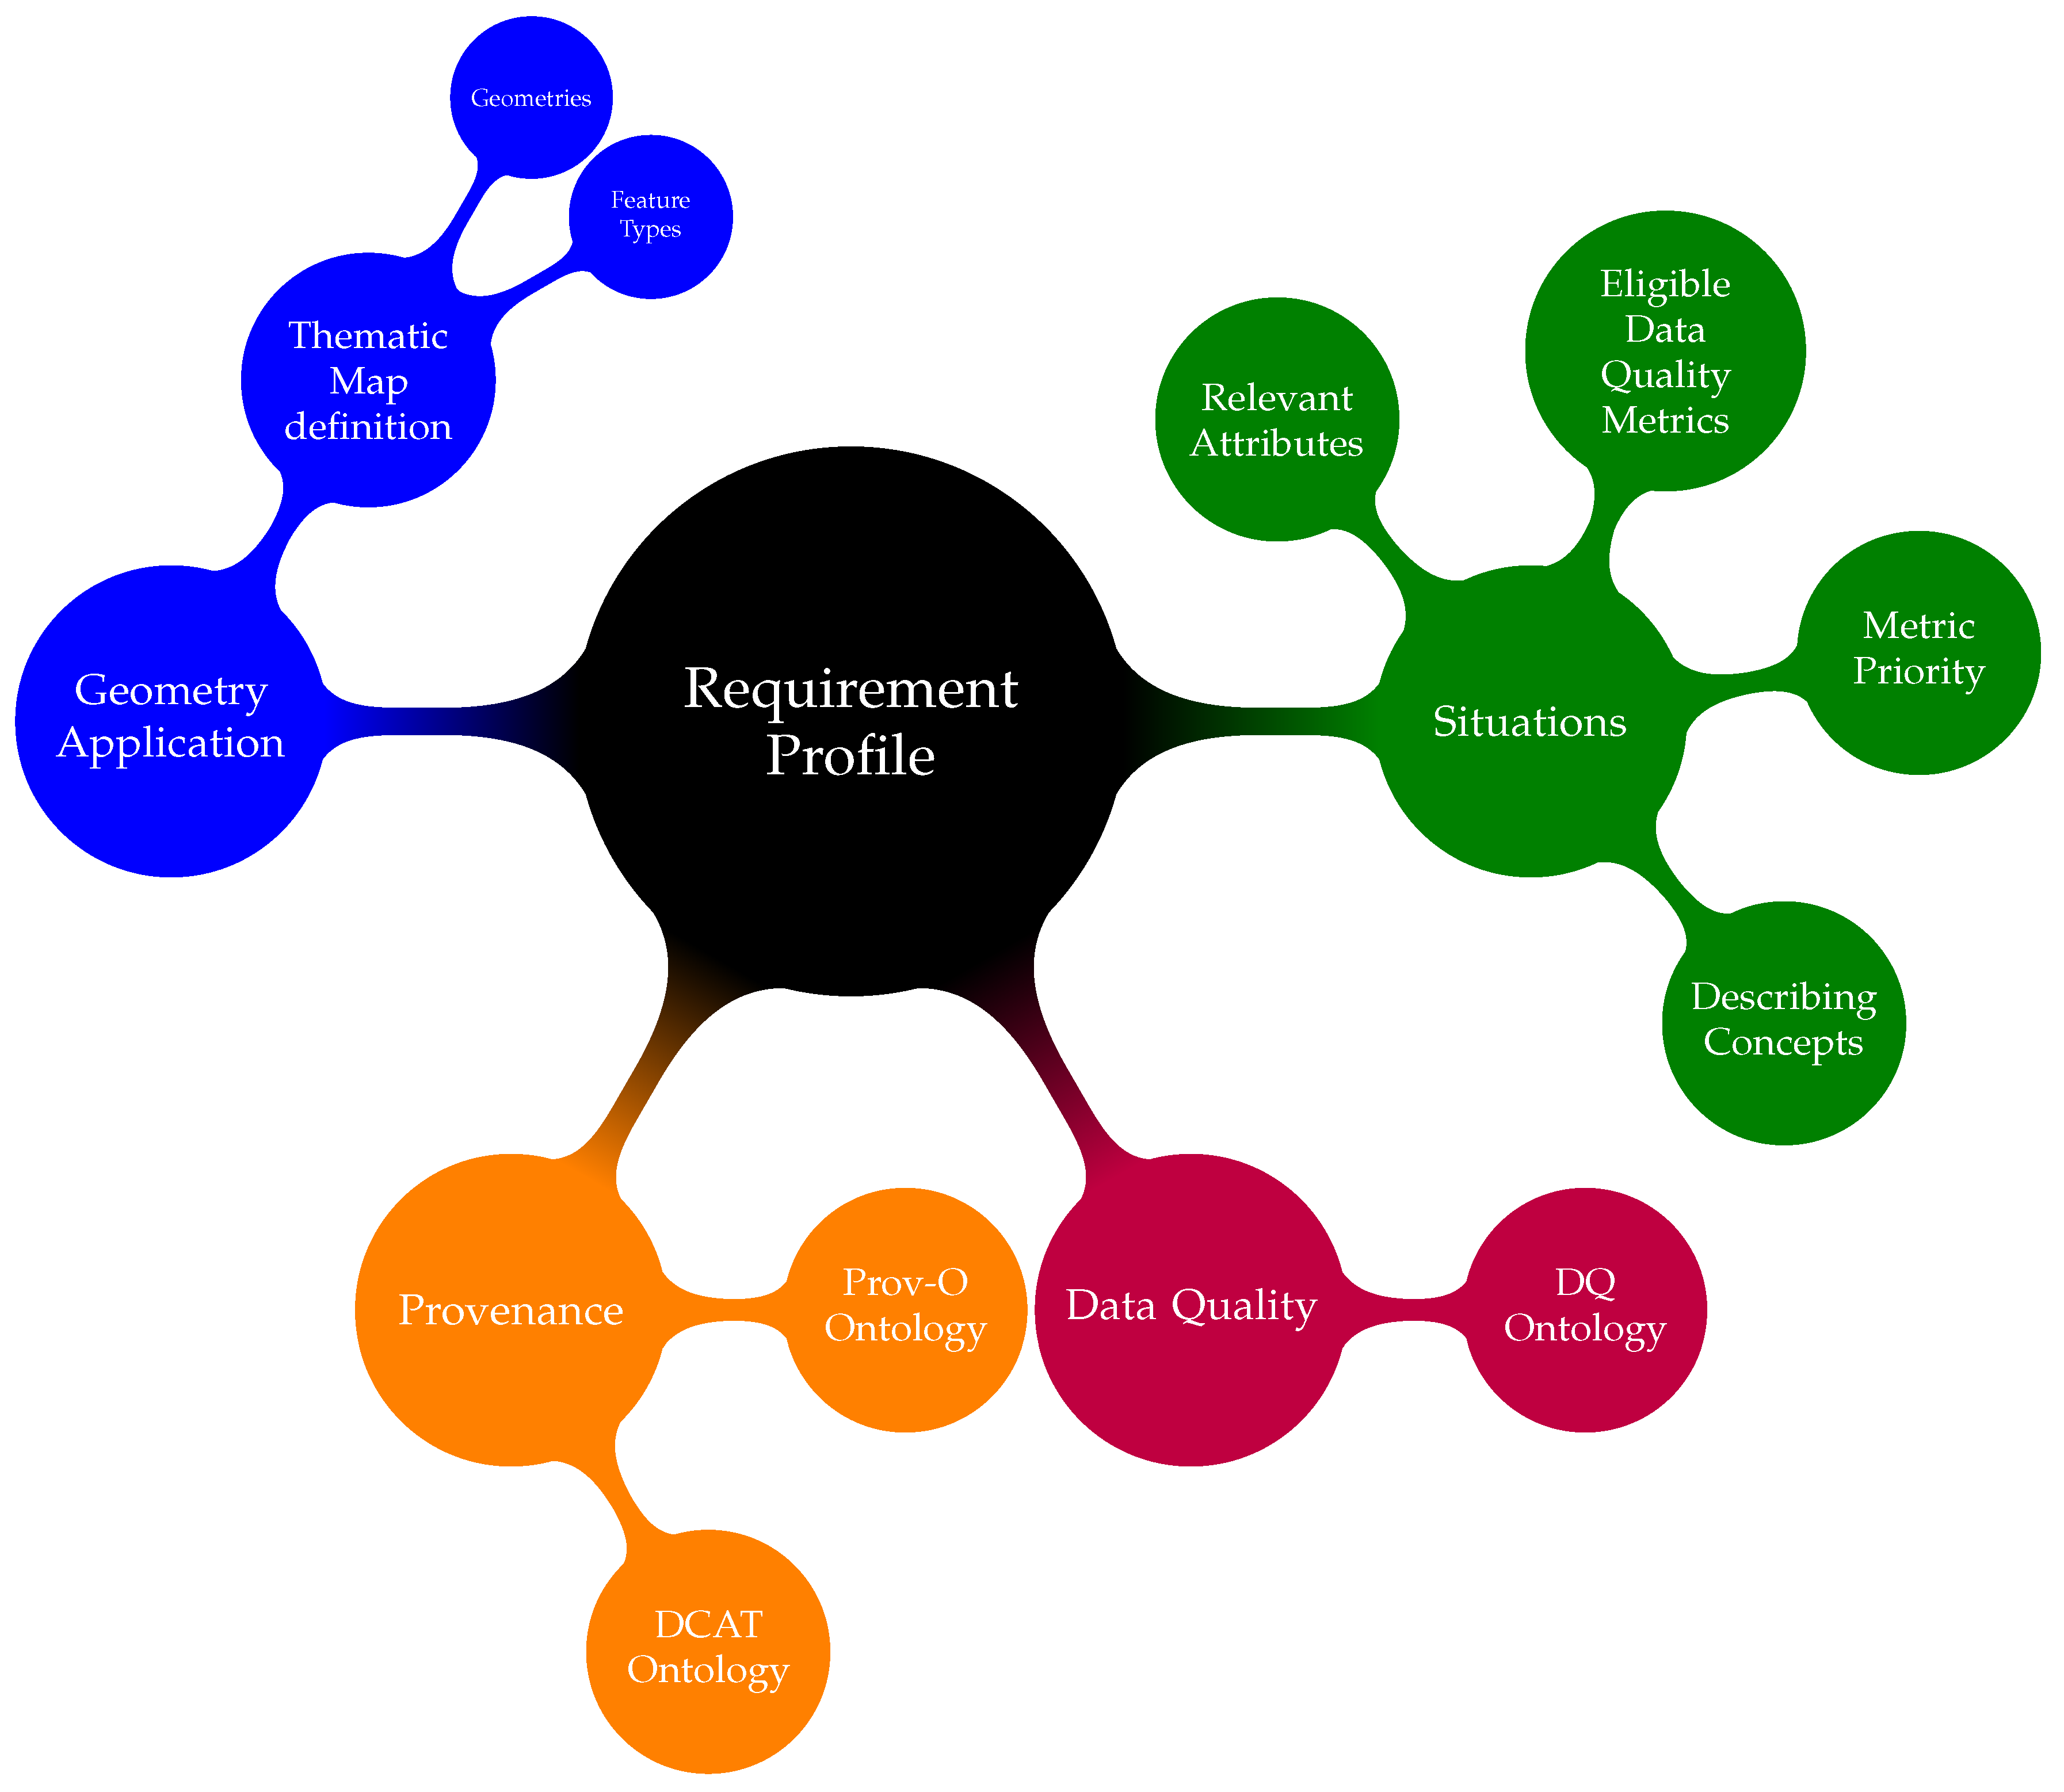
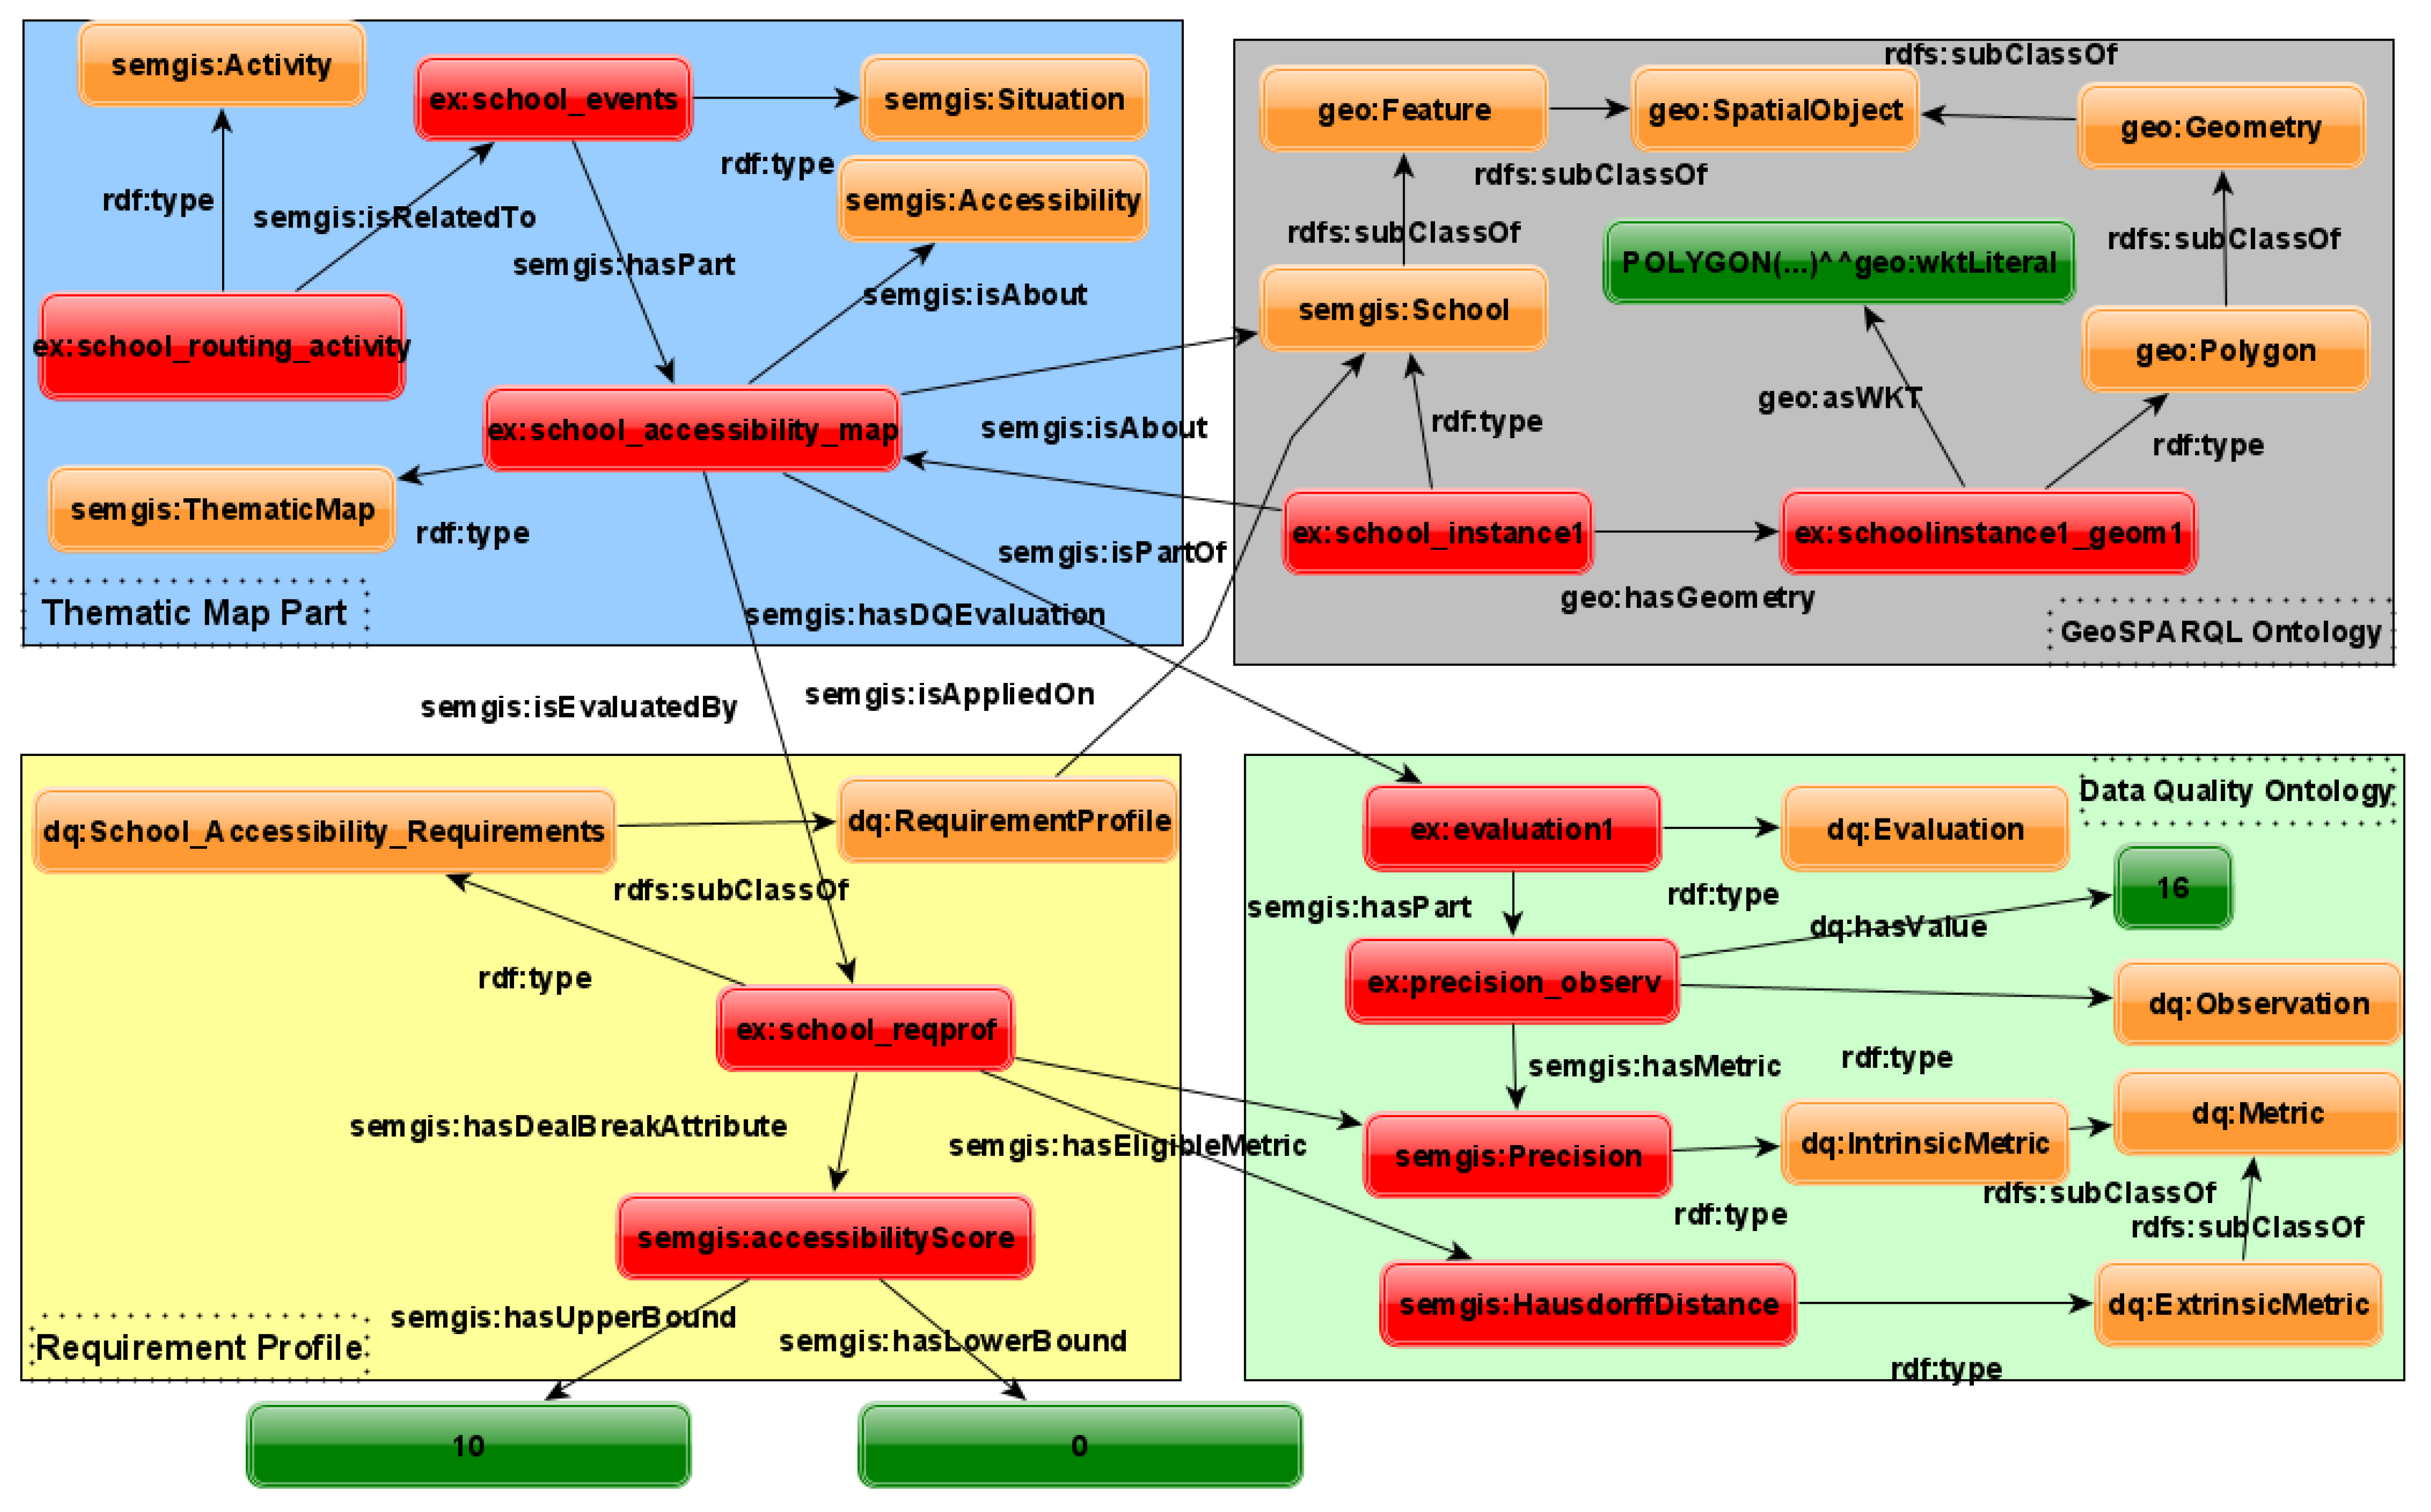
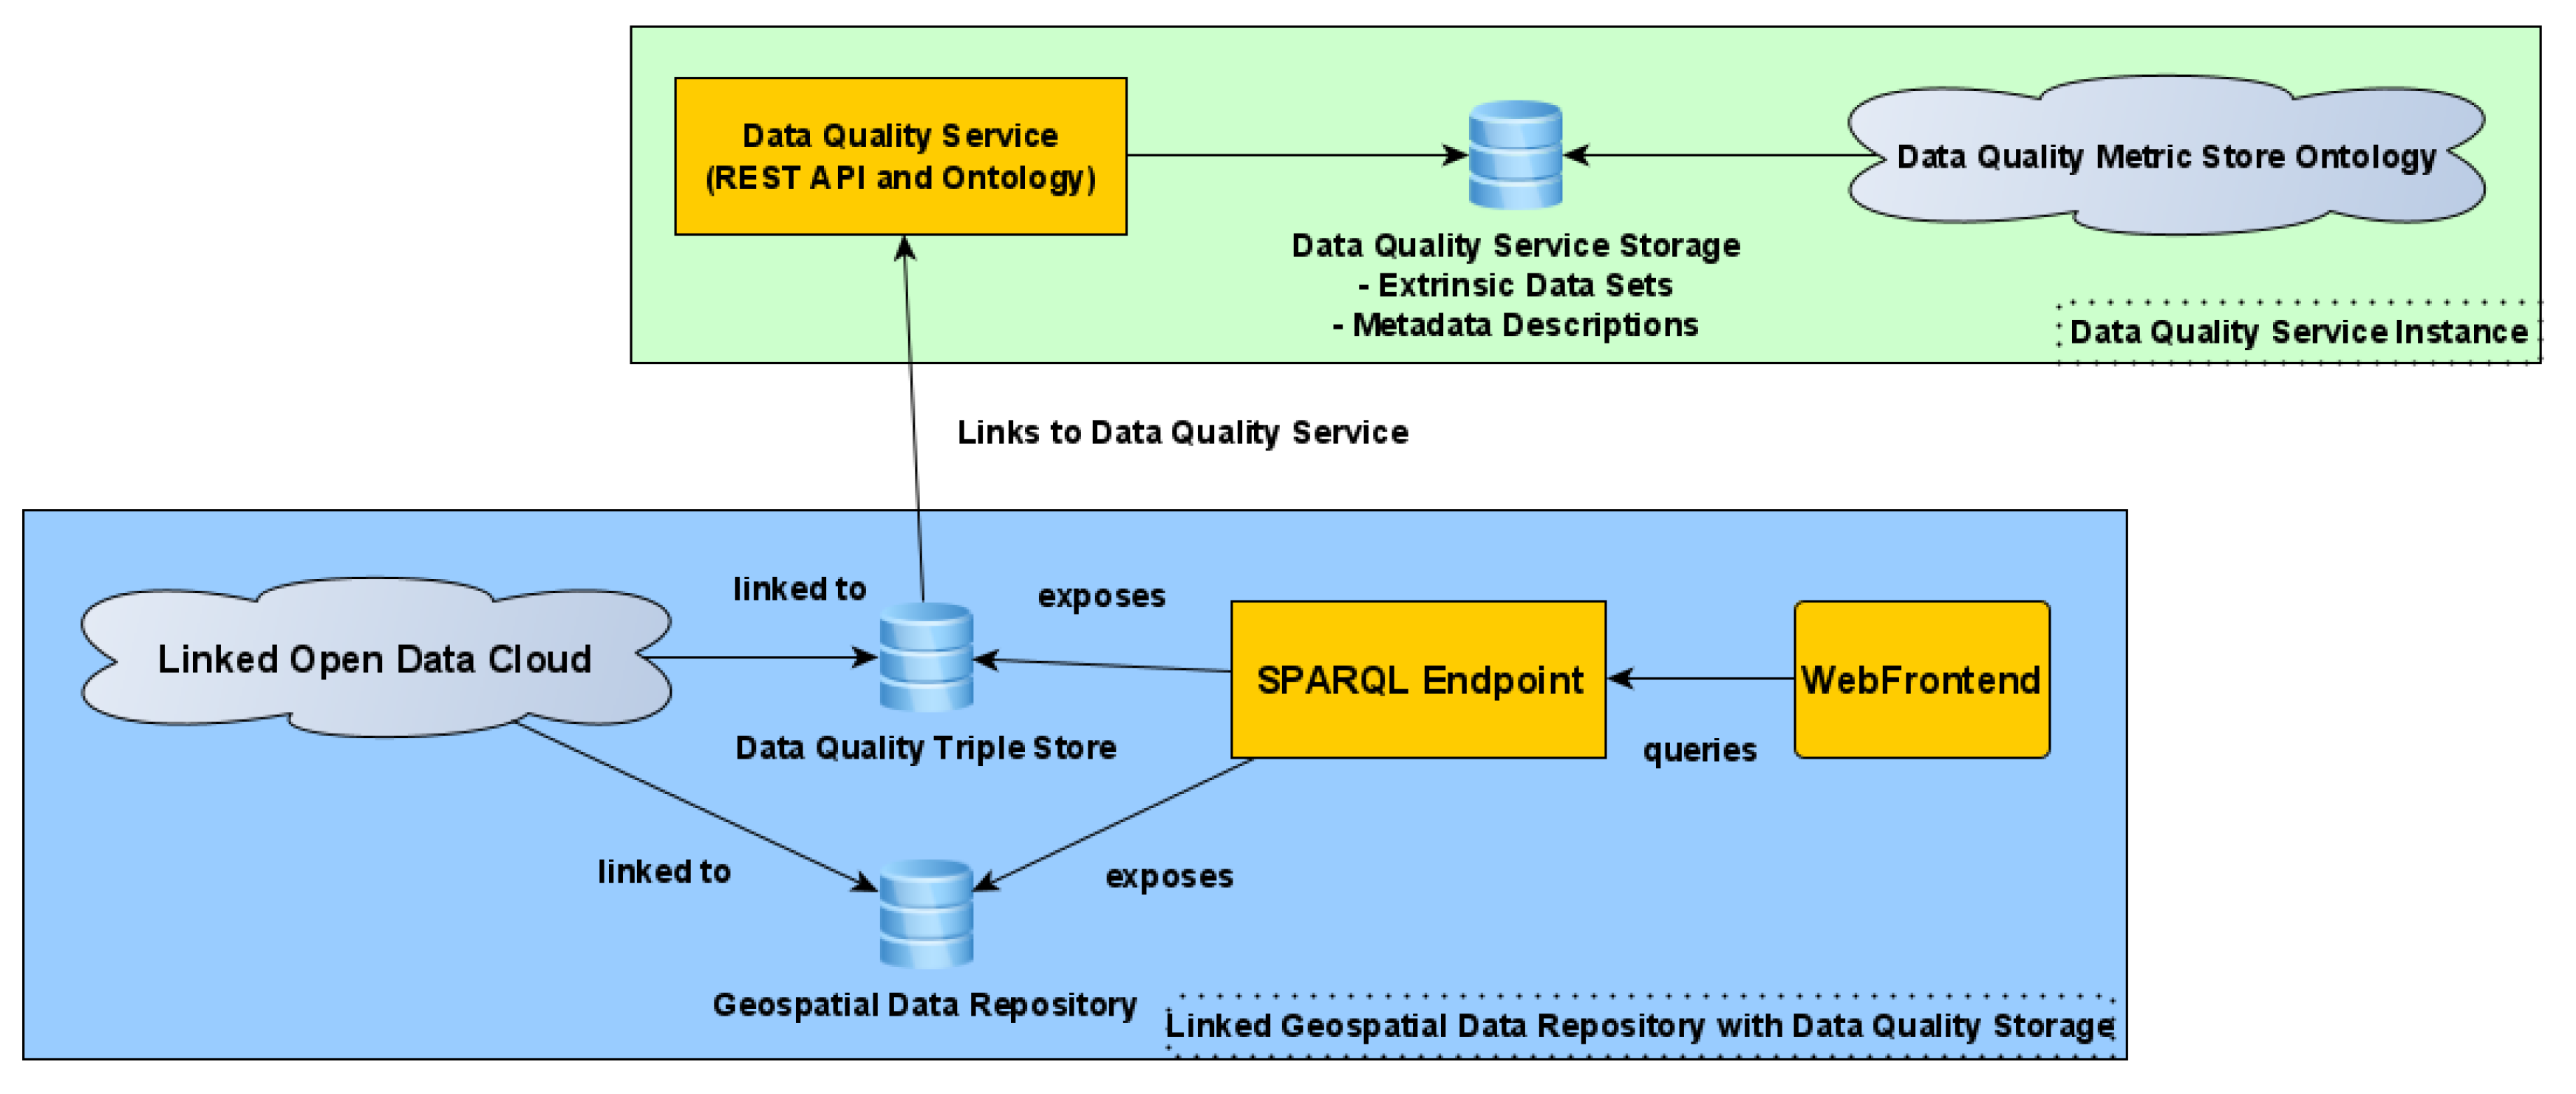
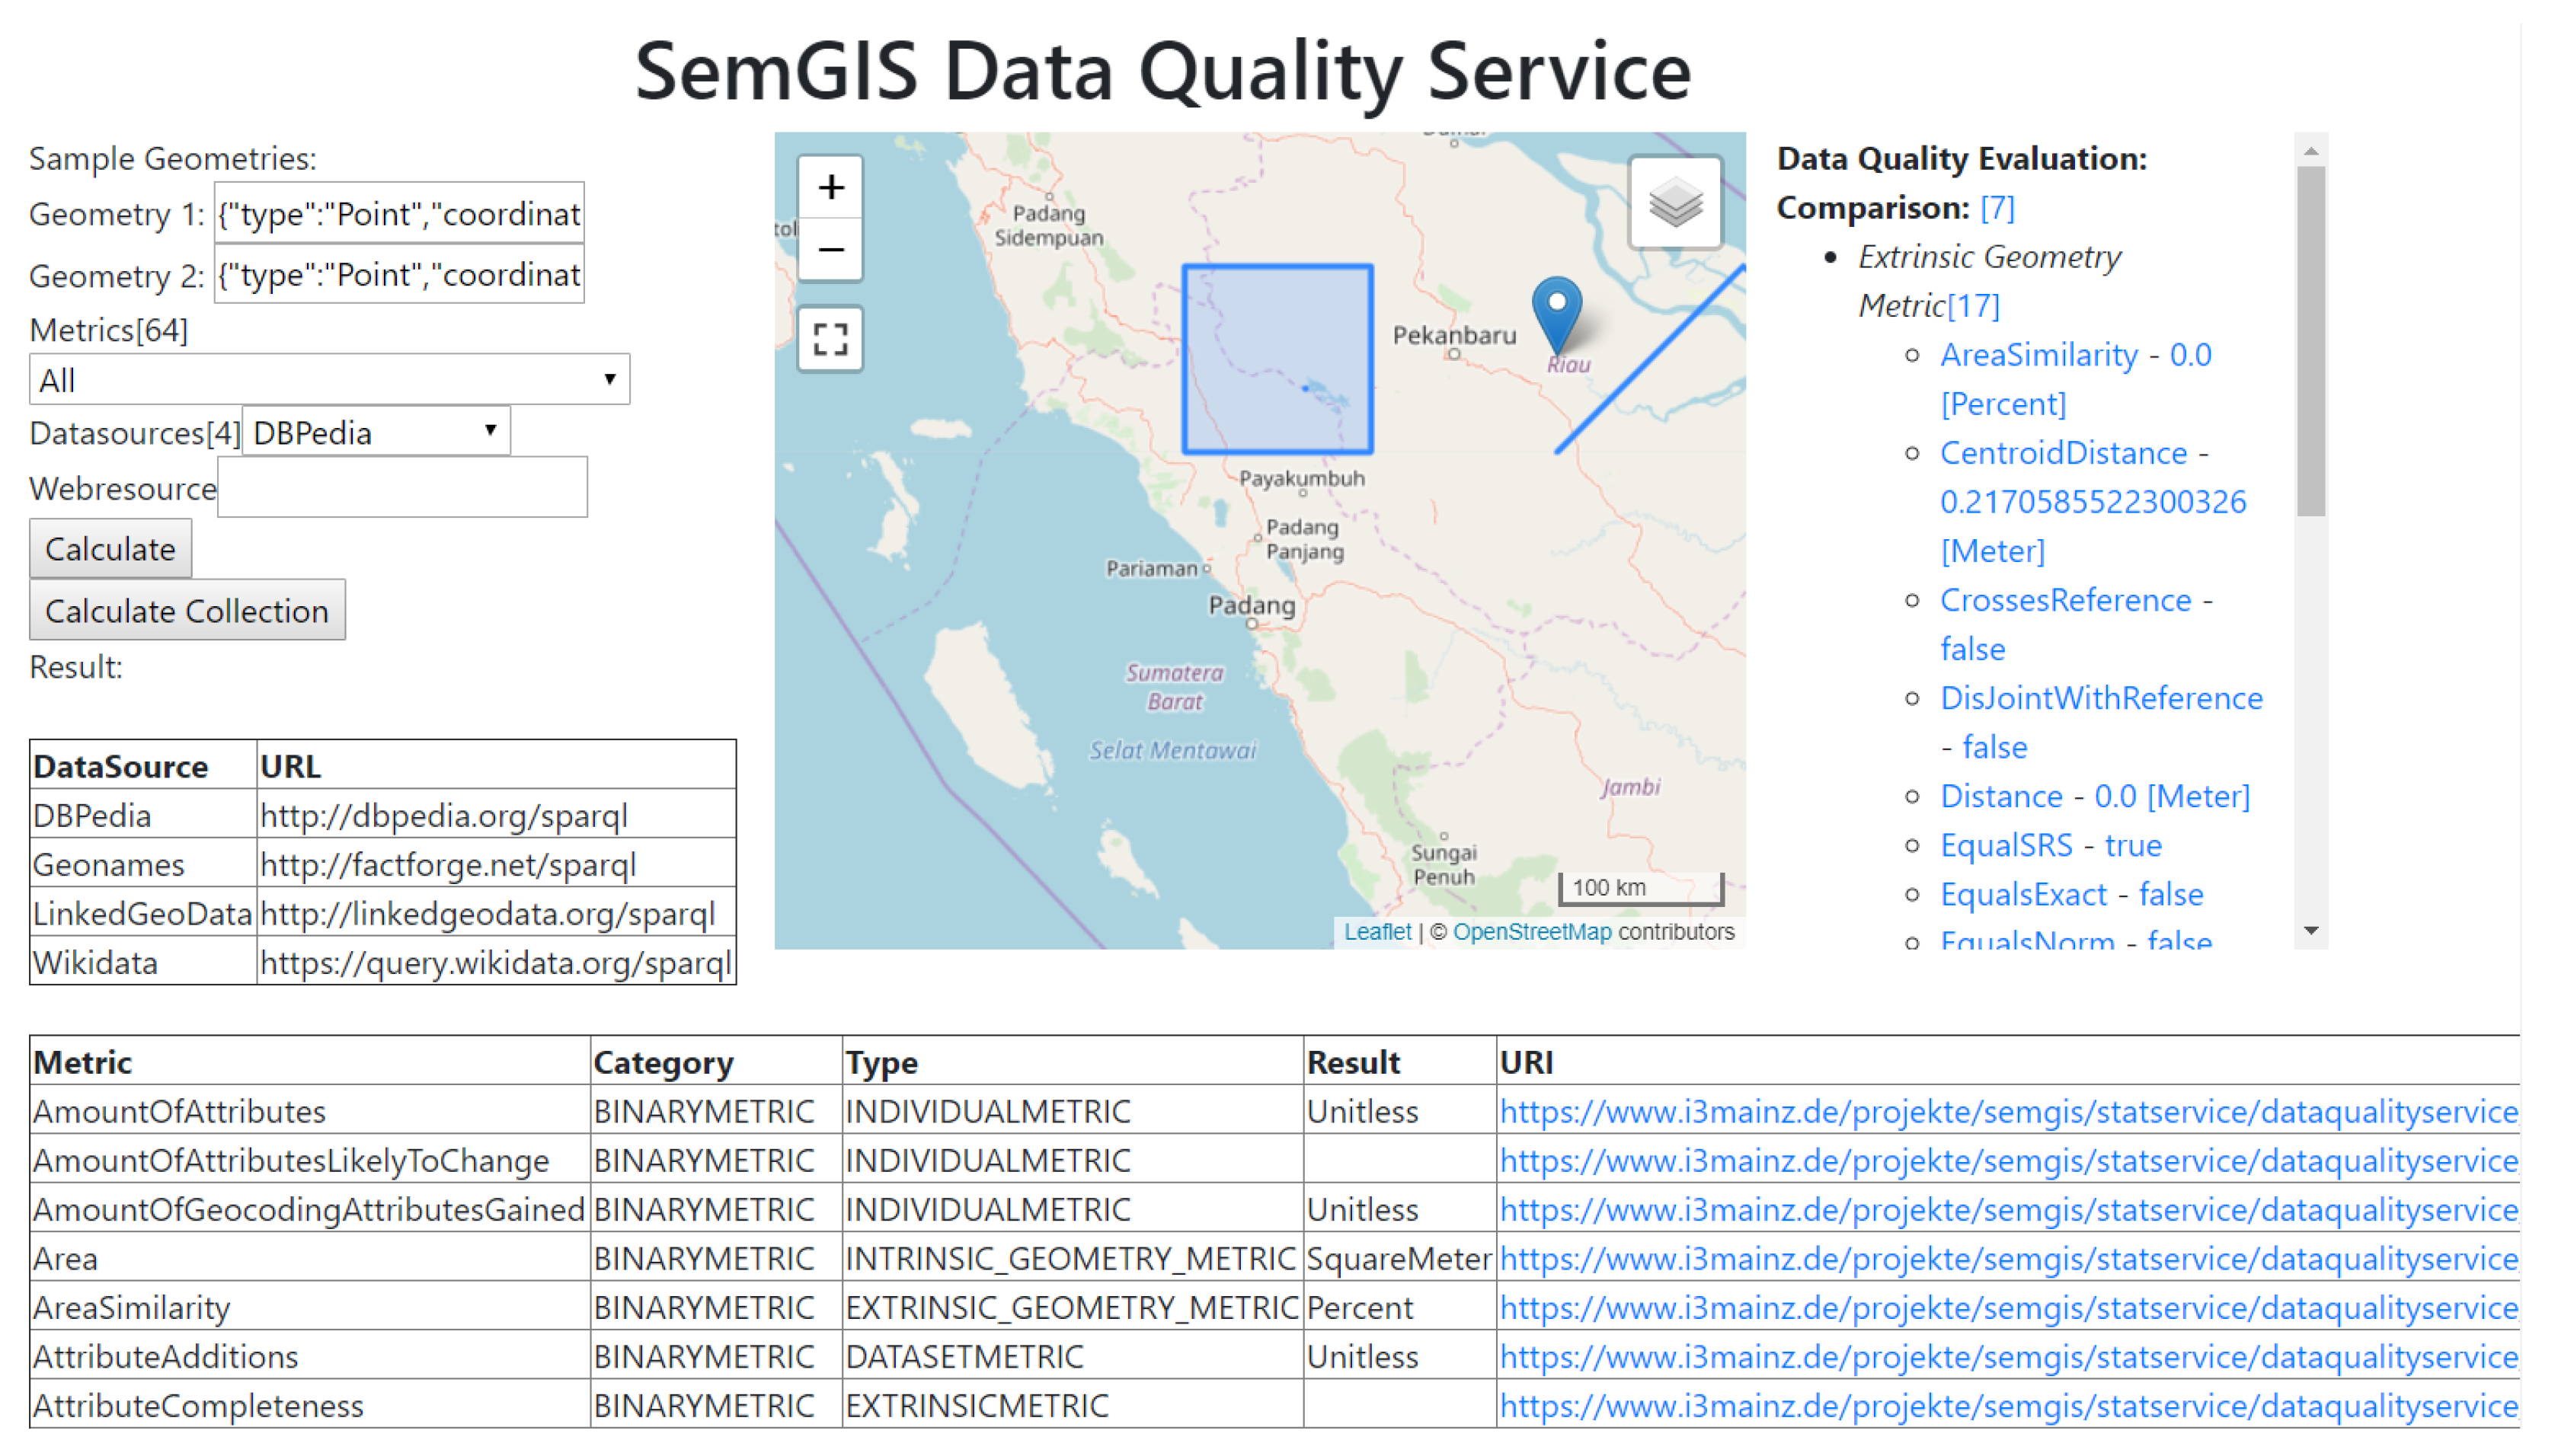
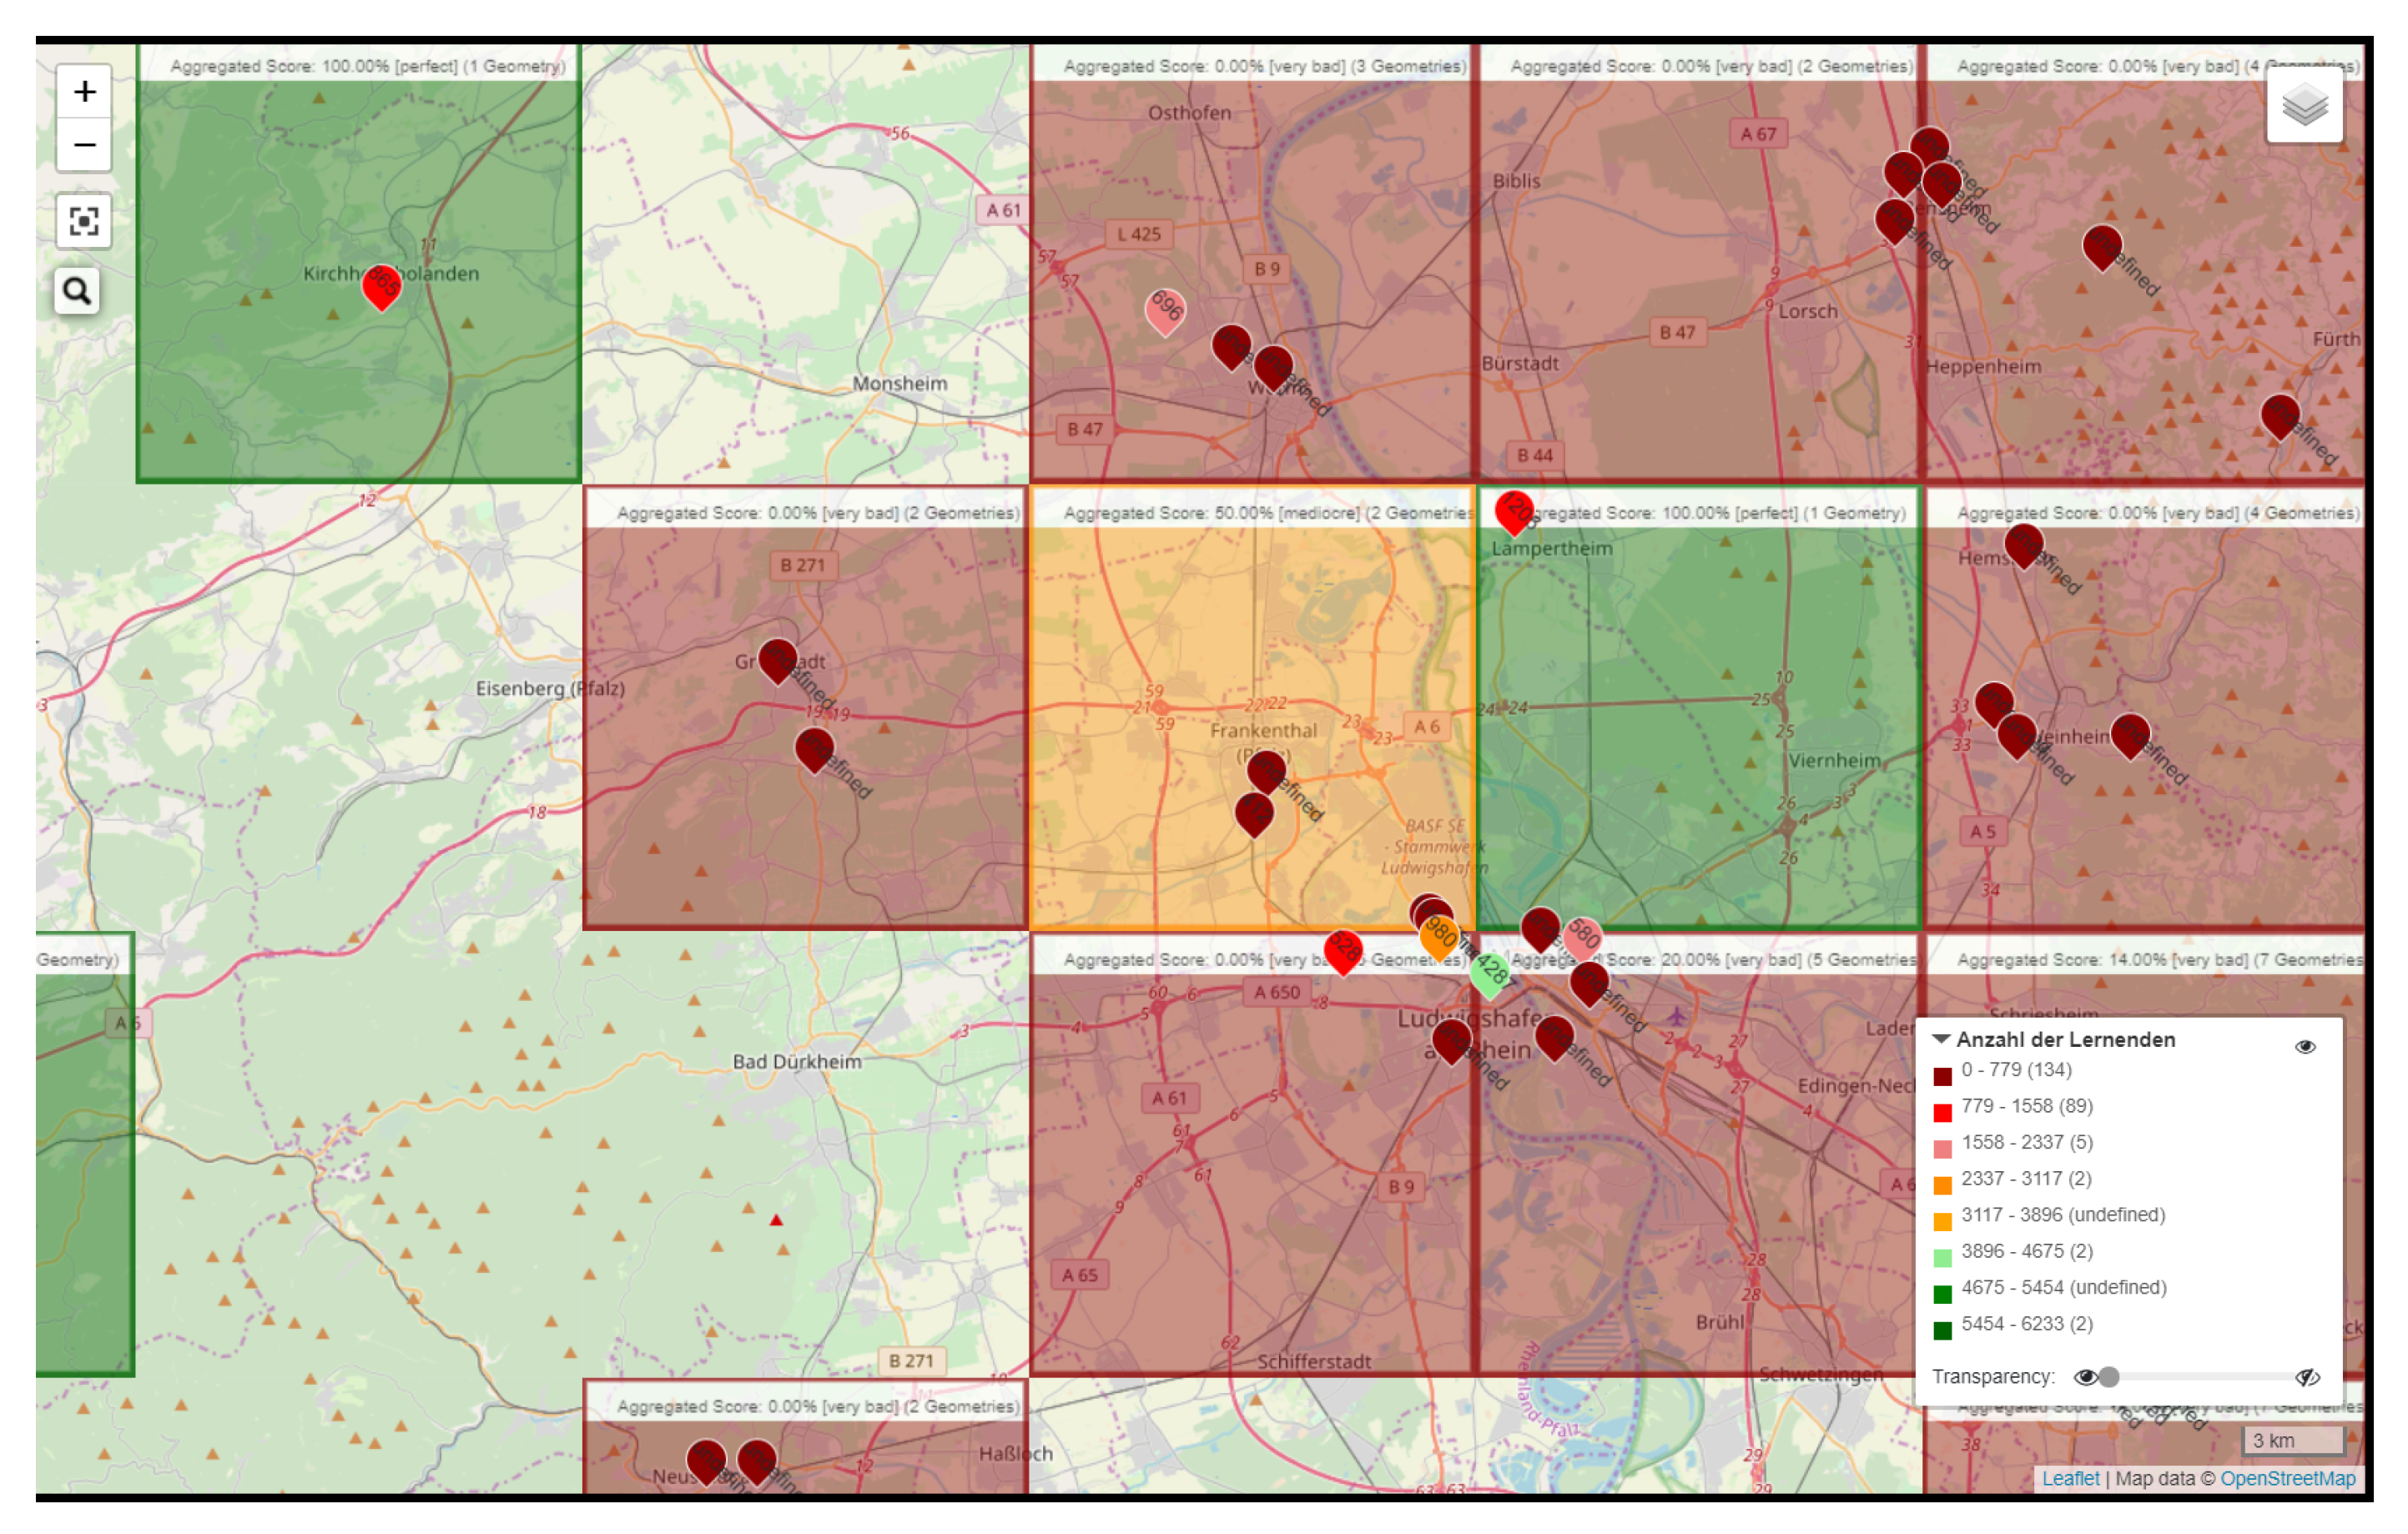
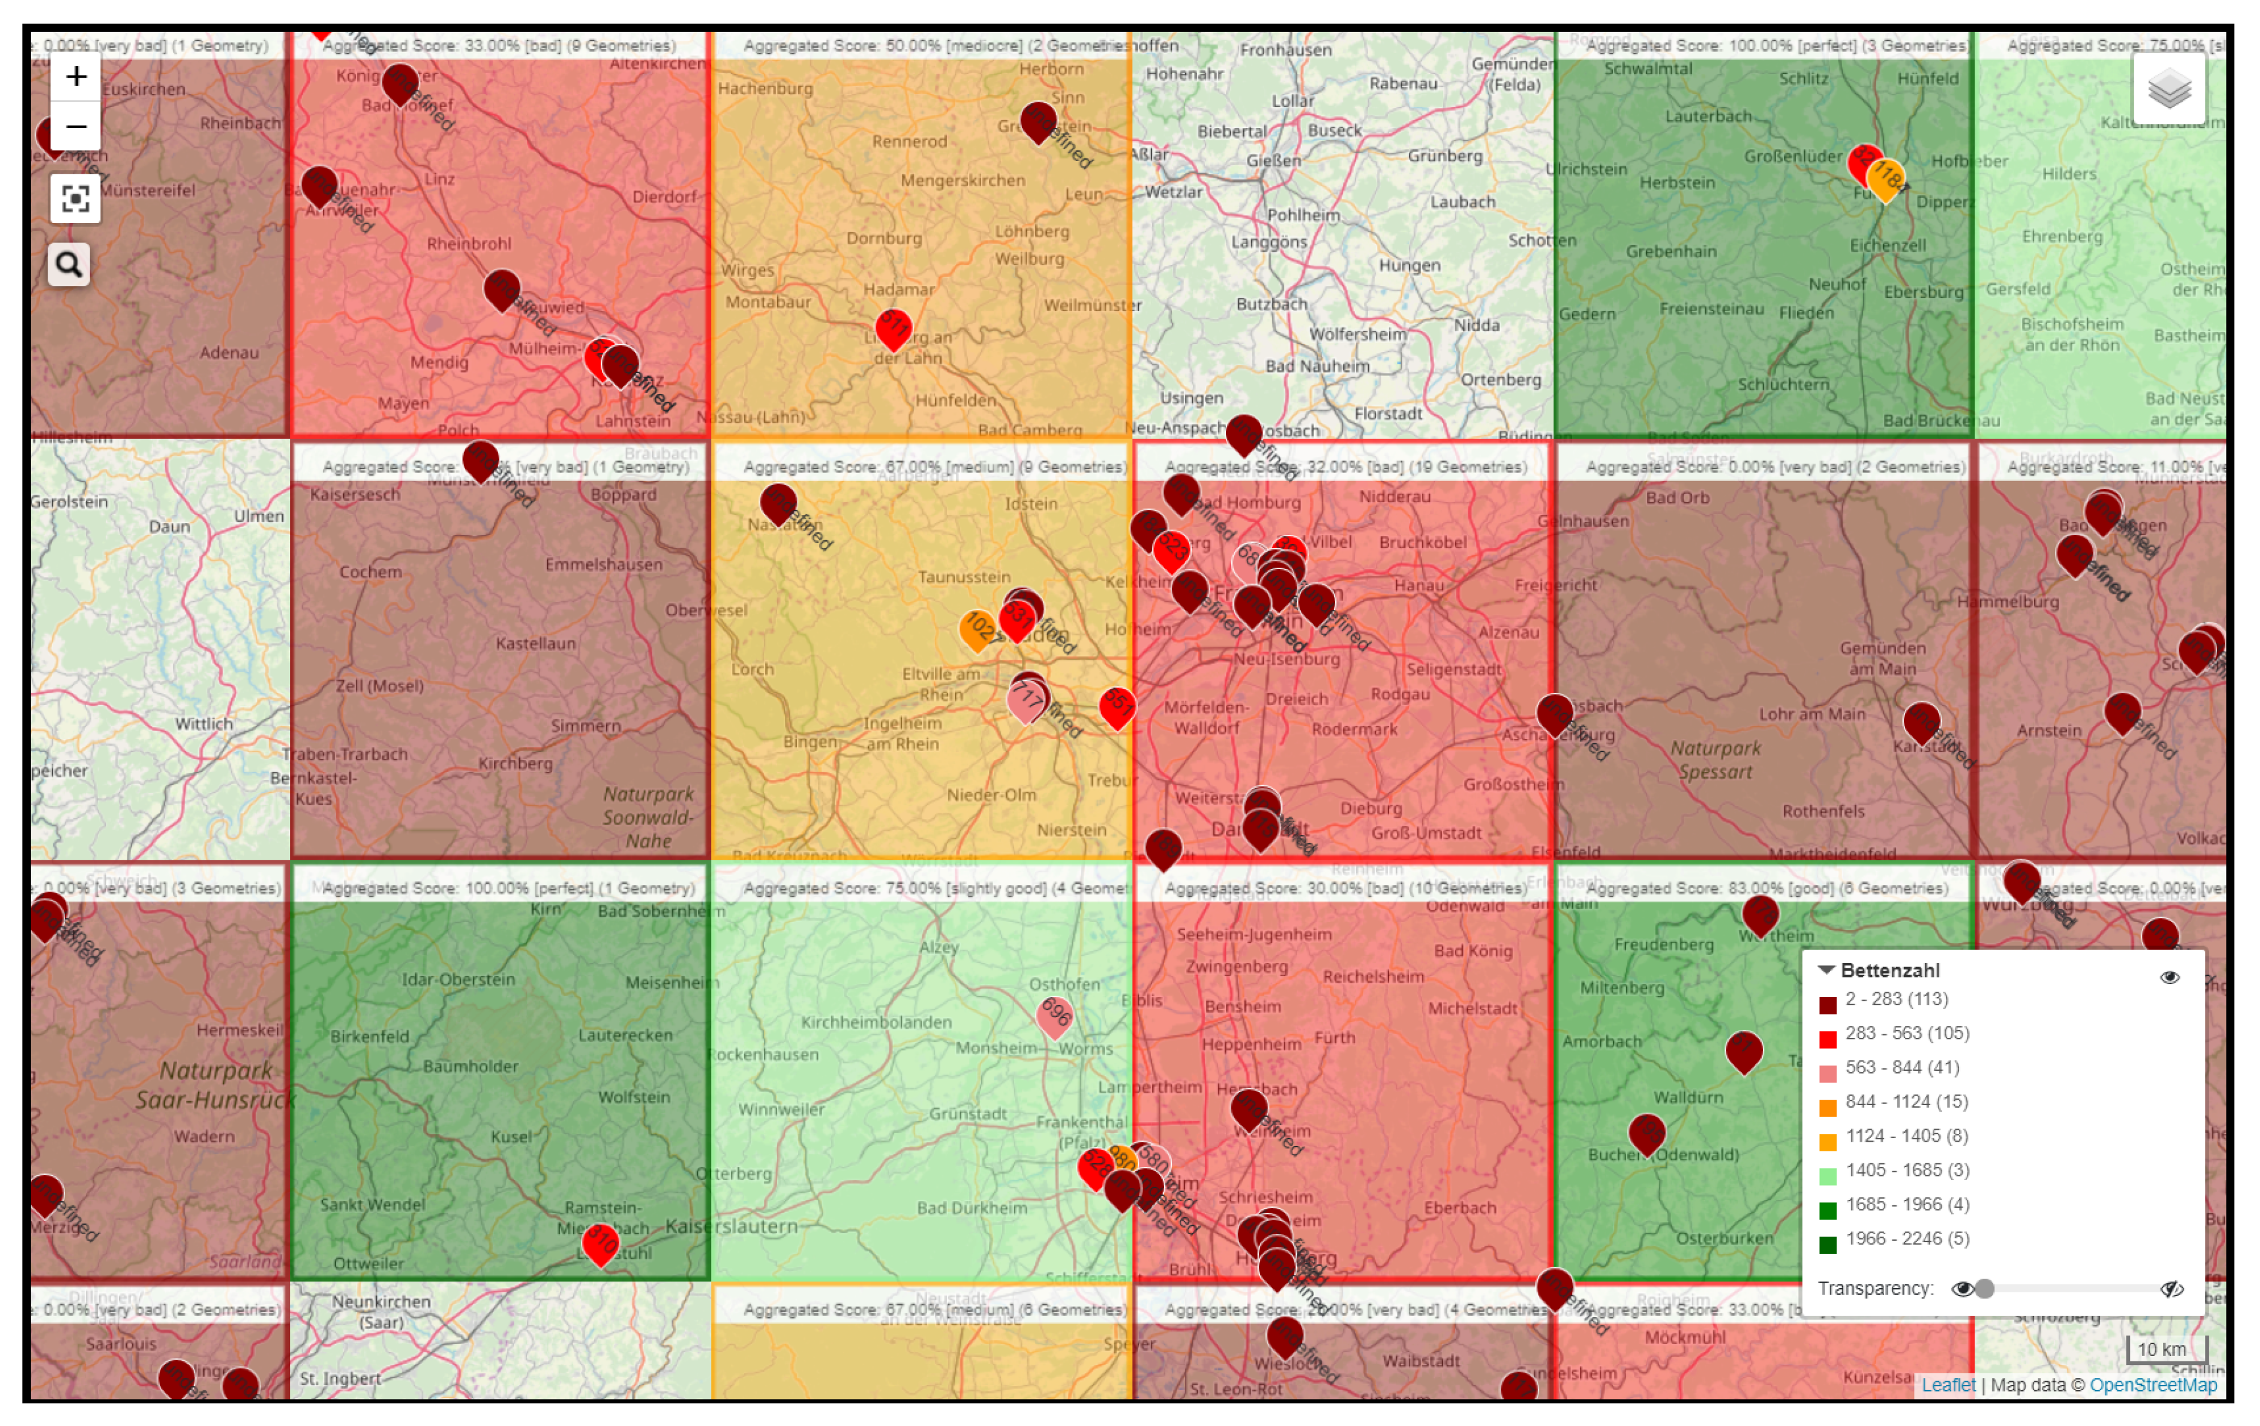
Table 1.
Vocabulary Definitions for situations: Classes defining a thematic map, a requirement profile and a situation along with daQ data quality vocabulary classes are introduced.
Table 1.
Vocabulary Definitions for situations: Classes defining a thematic map, a requirement profile and a situation along with daQ data quality vocabulary classes are introduced.
| Classes | Definition |
|---|---|
| semgis:Situation | Defines a situation |
| semgis:RequirementProfile | List of requirements |
| semgis:ThematicMap | ThematicMap definition |
| dq:Metric | Data Quality Metric |
| dq:Observation | Data Quality Measurement |
| dq:Dimension | Data Quality Dimension |
Table 2.
Vocabulary Definitions for situations: Properties associated to the respective classes as indicated in the table. The relevance of the respective properties will be discussed in the following sections.
Table 2.
Vocabulary Definitions for situations: Properties associated to the respective classes as indicated in the table. The relevance of the respective properties will be discussed in the following sections.
| Class | Associated Property | Definitions |
|---|---|---|
| semgis:RequirementProfile | semgis:hasDealBreakAttribute | Dealbreaker Attribute Definition |
| semgis:RequirementProfile | semgis:hasEligibleMetric | Defines an eligible metric |
| semgis:RequirementProfile | semgis:hasRelevantMetric | Defines a relevant metric |
| semgis:RequirementProfile | semgis:hasFeasibleMetric | Defines a feasible metric for a siuation |
| dq:Metric | semgis:hasRange | Defines a metrics eligible range to be considered good |
| dq:Metric | semgis:isCommonlyAssociatedWith | Defines concepts which commonly used this metric for evaluation |
| dq:Metric | semgis:hasPriority | Defines the priority of the metric for the particular requirement profile |
| semgis:ThematicMap | semgis:isAbout | Defines the topic of a Thematic Map as an owl:Class |
| semgis:ThematicMap | semgis:isPartOf | ThematicMap as part of a situation |
| semgis:ThematicMap | semgis:isEvaluatedBy | RequirementProfile |
| semgis:Situation | semgis:hasPart | Thematic Map |
Table 3.
Vocabulary Definitions for activities: Activities need to be related to situations and depend on certain datasets for evaluation purposes.
Table 3.
Vocabulary Definitions for activities: Activities need to be related to situations and depend on certain datasets for evaluation purposes.
| Properties | Definitions |
|---|---|
| semgis:isRelatedTo | Related Situation or Thematic Map |
| semgis:isEvaluatedBy | Eligible data quality metric |
| semgis:dependsOn | Required Datasets |
| semgis:hasSubject | Related owl Class describing the knowledge domain of the activity |
Table 4.
Minimum Requirement Profile: For the thematic map with the number of students only the geoposition and the attribute number of students is relevant. The thematic map can therefore be evaluated using this generic requirement profile.
Table 4.
Minimum Requirement Profile: For the thematic map with the number of students only the geoposition and the attribute number of students is relevant. The thematic map can therefore be evaluated using this generic requirement profile.
| Metric | Target | Priority | Range | Dealbreaker |
|---|---|---|---|---|
| Completeness | Number of Students | 1 | >0 | true |
| Geometry Validity | Geometry | 1 | true | true |
| Positional Accuracy | Geometry | 4 | >12 | false |
Table 5.
Input data hospitals: Sample input data for hospitals provided for this experiment. The dataset includes the hospital name, its bed capacity, address along with the geometry.
Table 5.
Input data hospitals: Sample input data for hospitals provided for this experiment. The dataset includes the hospital name, its bed capacity, address along with the geometry.
| The_geom | Name | Capacity | Address |
|---|---|---|---|
| POINT(..) | Catholic Clinic Mainz | 717 | An der Goldgrube 11, Mainz, Germany |
Table 6.
Hospital Capacity Requirement Profile: The dealbreaker attribute and geometry validity have been derived with priority 1, Geometry Validity gets priority 1 by definition and Positional Accuracy as a geometry metric receives priority 4.
Table 6.
Hospital Capacity Requirement Profile: The dealbreaker attribute and geometry validity have been derived with priority 1, Geometry Validity gets priority 1 by definition and Positional Accuracy as a geometry metric receives priority 4.
| Metric | Target | Priority | Range | Dealbreaker |
|---|---|---|---|---|
| Completeness | Number of Beds | 1 | N/A | true |
| Geometry Validity | Geometry | 1 | N/A | true |
| Positional Accuracy | Geometry | 4 | >12 | false |
Table 7.
Road Network Requirement Profile: A road network is well-defined if the road network geometries are valid, the positional accuracy of the road network is greater than 12 decimals and a HausdorffDistance so bigger than 0.8 to a reference dataset.
Table 7.
Road Network Requirement Profile: A road network is well-defined if the road network geometries are valid, the positional accuracy of the road network is greater than 12 decimals and a HausdorffDistance so bigger than 0.8 to a reference dataset.
| Metric | Target | Priority | Range | Dealbreaker |
|---|---|---|---|---|
| Geometry Validity | Geometry | 1 | true | true |
| Positional Accuracy | Geometry | 2 | >12 | false |
| HausdorffDistance | Geometry | 2 | >0.8 | false |
Table 8.
Rescue Point Requirement Profile: A rescue point’s quality is well-defined if the geometry is valid, the rescue point may be found with an accuracy of greater than 12 decimal places, its capacity is annotated and its elevation is given.
Table 8.
Rescue Point Requirement Profile: A rescue point’s quality is well-defined if the geometry is valid, the rescue point may be found with an accuracy of greater than 12 decimal places, its capacity is annotated and its elevation is given.
| Metric | Target | Priority | Range | Dealbreaker |
|---|---|---|---|---|
| Completeness | Elevation | 1 | >0 | true |
| Completeness | Capacity | 1 | >0 | true |
| Geometry Validity | Geometry | 1 | true | true |
| Positional Accuracy | Geometry | 4 | >12 | false |
Table 9.
Joint Requirement Profile: For the usecase of a rescue operation to hospitals, the mission can only be planned if the hospitals capacity is known, the rescue points are operative, geometries are valid and accurate, and the map is up to date.
Table 9.
Joint Requirement Profile: For the usecase of a rescue operation to hospitals, the mission can only be planned if the hospitals capacity is known, the rescue points are operative, geometries are valid and accurate, and the map is up to date.
| Metric | Dataset | Target | Priority | Range | Dealbreaker |
|---|---|---|---|---|---|
| Completeness | Hospital | Number of Beds | 1 | >300 | true |
| Completeness | Rescue Points | Elevation | 1 | >0 | true |
| Completeness | Rescue Points | Operator | 1 | >90% | true |
| Completeness | Rescue Points | Capacity | 1 | >0 | true |
| Geometry Validity | All | Geometry | 1 | true | true |
| Freshness | All | Geometry + Attributes | 3 | <365 days | false |
| Positional Accuracy | All | Geometry | 4 | >12 | false |
Publisher’s Note: MDPI stays neutral with regard to jurisdictional claims in published maps and institutional affiliations. |
© 2020 by the author. Licensee MDPI, Basel, Switzerland. This article is an open access article distributed under the terms and conditions of the Creative Commons Attribution (CC BY) license (http://creativecommons.org/licenses/by/4.0/).
Share and Cite
MDPI and ACS Style
Homburg, T. Connecting Semantic Situation Descriptions with Data Quality Evaluations—Towards a Framework of Automatic Thematic Map Evaluation. Information 2020, 11, 532. https://0-doi-org.brum.beds.ac.uk/10.3390/info11110532
AMA Style
Homburg T. Connecting Semantic Situation Descriptions with Data Quality Evaluations—Towards a Framework of Automatic Thematic Map Evaluation. Information. 2020; 11(11):532. https://0-doi-org.brum.beds.ac.uk/10.3390/info11110532
Chicago/Turabian StyleHomburg, Timo. 2020. "Connecting Semantic Situation Descriptions with Data Quality Evaluations—Towards a Framework of Automatic Thematic Map Evaluation" Information 11, no. 11: 532. https://0-doi-org.brum.beds.ac.uk/10.3390/info11110532
Note that from the first issue of 2016, this journal uses article numbers instead of page numbers. See further details here.