Humanities: The Outlier of Research Assessments


1
Department of Information Management, Hacettepe University, Ankara 06800, Turkey
2
Scholarly Communication Research Group, Adam Mickiewicz University in Poznań, 60-371 Poznań, Poland
*
Author to whom correspondence should be addressed.
Information 2020, 11(11), 540; https://0-doi-org.brum.beds.ac.uk/10.3390/info11110540
Submission received: 30 September 2020
/
Revised: 19 November 2020
/
Accepted: 20 November 2020
/
Published: 23 November 2020
(This article belongs to the Special Issue ICT Enhanced Social Sciences and Humanities)
Abstract
:Commercial bibliometric databases, and the quantitative indicators presented by them, are widely used for research assessment purposes, which is not fair for the humanities. The humanities are different from all other areas by nature in many aspects. This study aimed to show the extent of the difference in terms of five size-independent bibliometric indicators, based on citations and collaborations. We used categorical InCites data (1980–2020) to compare six main Organisation for Economic Co-operation and Development (OECD) subject areas, and the 45,987 sources of humanities, to make a comparison for subareas of the humanities. Results showed that the humanities are statistically different from all other areas, including social sciences, with high effect sizes in terms of the five indicators taken into consideration. Besides that, all the subareas of the humanities differ from each other. This main finding indicates that the humanities do not need new indicators for quantitative evaluation, but different approaches for assessment, such as bottom-up approaches.
1. Introduction
The implementation of citation indexes by the Institute for Scientific Information (the Science Citation Index (SCIE) in 1964, Social Sciences Citation Index (SSCI) in 1973, and Arts and Humanities Citation Index (AHCI) in 1978) [1] changed the method of research assessment, mainly for policymakers. They preferred to use numbers (e.g., publications and citations) to evaluate the performance of researchers due to their ease of use. Today, it is not possible for many scholars working in different institutions to be tenured or promoted without publishing papers in Web of Science (WoS) or Scopus-indexed journals. However, it is crucial to evaluate research and researchers accurately and fairly, which requires taking disciplinary divergences into account while developing evaluation criteria. Otherwise, it could result in misjudgments in tenures and incentives.
Research in the humanities, by nature, differs significantly from pure sciences in many aspects. A vast amount of studies in the literature reveals the characteristics of the field [2,3,4,5,6,7]. The topics covered are mostly local or regional, so the dynamics of international publishing are quite different. The use of native languages in research outputs is more common. It has been proven by the data that the percentage of English papers indexed in AHCI is 72%, while it is 93–94% for SSCI and SCIE. The publication types that are produced by scholars working in the humanities are different and not limited to journal articles. Books or book chapters and non-scholarly publications are more predominant for the field. The percentage of articles indexed in AHCI (1975–2020) is 30%, while it is 57% for SSCI and 69% for SCIE between 1900 and 2020. Of those publications indexed in AHCI, 44% are book reviews (22% for SSCI and 0.53% for SCIE). In addition to them, the qualitative research approach is adopted more in the humanities. Researchers in the humanities prefer to work alone, while co-authorship is a common practice in positive sciences. Moreover, papers in the humanities do not get citations as often as in the other fields.
Unfortunately, the traditional evaluation methods and approaches based solely on bibliometric indicators produced by commercial citation indexes, for which the main scholarly outputs are articles in international journals, cannot respond to this diversity. Therefore, the assessment of humanities research and researchers has always been a controversial issue. However, there have been no concrete attempts made concerning this issue until recent years. The Prague Manifesto (or Challenges of the evaluation of social science and humanities research) [8], the Leiden Manifesto [9] (despite it not directly mentioning humanities), the San Francisco Declaration on Research Assessment (DORA) [10], and the Helsinki Initiative on Multilingualism in Scholarly Communication [11] are all caused by the problems in assessment exercises, which can be regarded as milestones for research evaluation in the humanities in recent years. European Network for Research Evaluation in the Social Sciences and the Humanities (ENRESSH, https://enressh.eu/) and The European Alliance for the Social Sciences and the Humanities (EASSH, http://www.eassh.eu/) projects, the EVALHUM Initiative (https://www.evalhum.eu/index.html), and the Research Evaluation in the SSH Conference (RESSH) and International Conference on ICT enhanced Social Sciences and Humanities (ICTeSSH) are all focused on this issue.
Giménez Toledo [12] summarized the current practices of research assessment in the humanities as follows:
- Using all scholarly outputs and sources other than commercial databases;
- Adopting bottom-up approaches and more qualitative research assessment;
- Involving open access, open citations, and alternative metrics in research assessment;
- The responsible use of metrics;
- Assessing the societal impact of research.
However, most institutions still use specific commercial databases as a data source, with quantitative assessment based mainly on bibliometric indicators as evaluation criteria. The main aim of this study is to show the position of the humanities in commercial bibliometric databases and present the main differences between the humanities and other fields. The research questions addressed are as follows:
- How do the six Organisation for Economic Co-operation and Development (OECD) subject areas differ in terms of citation per paper? What is the status of the humanities in this sense? Are the subareas of humanities similar in terms of the number of citations per paper?
- What is the difference between the humanities and other areas in terms of the percentage of documents cited and highly cited papers? Do the subareas of humanities also differ by these two variables?
- Are the collaboration practices (industry and international collaborations) of the humanities similar to those of social sciences? What are the collaboration patterns of the subareas of humanities?
2. Materials and Methods
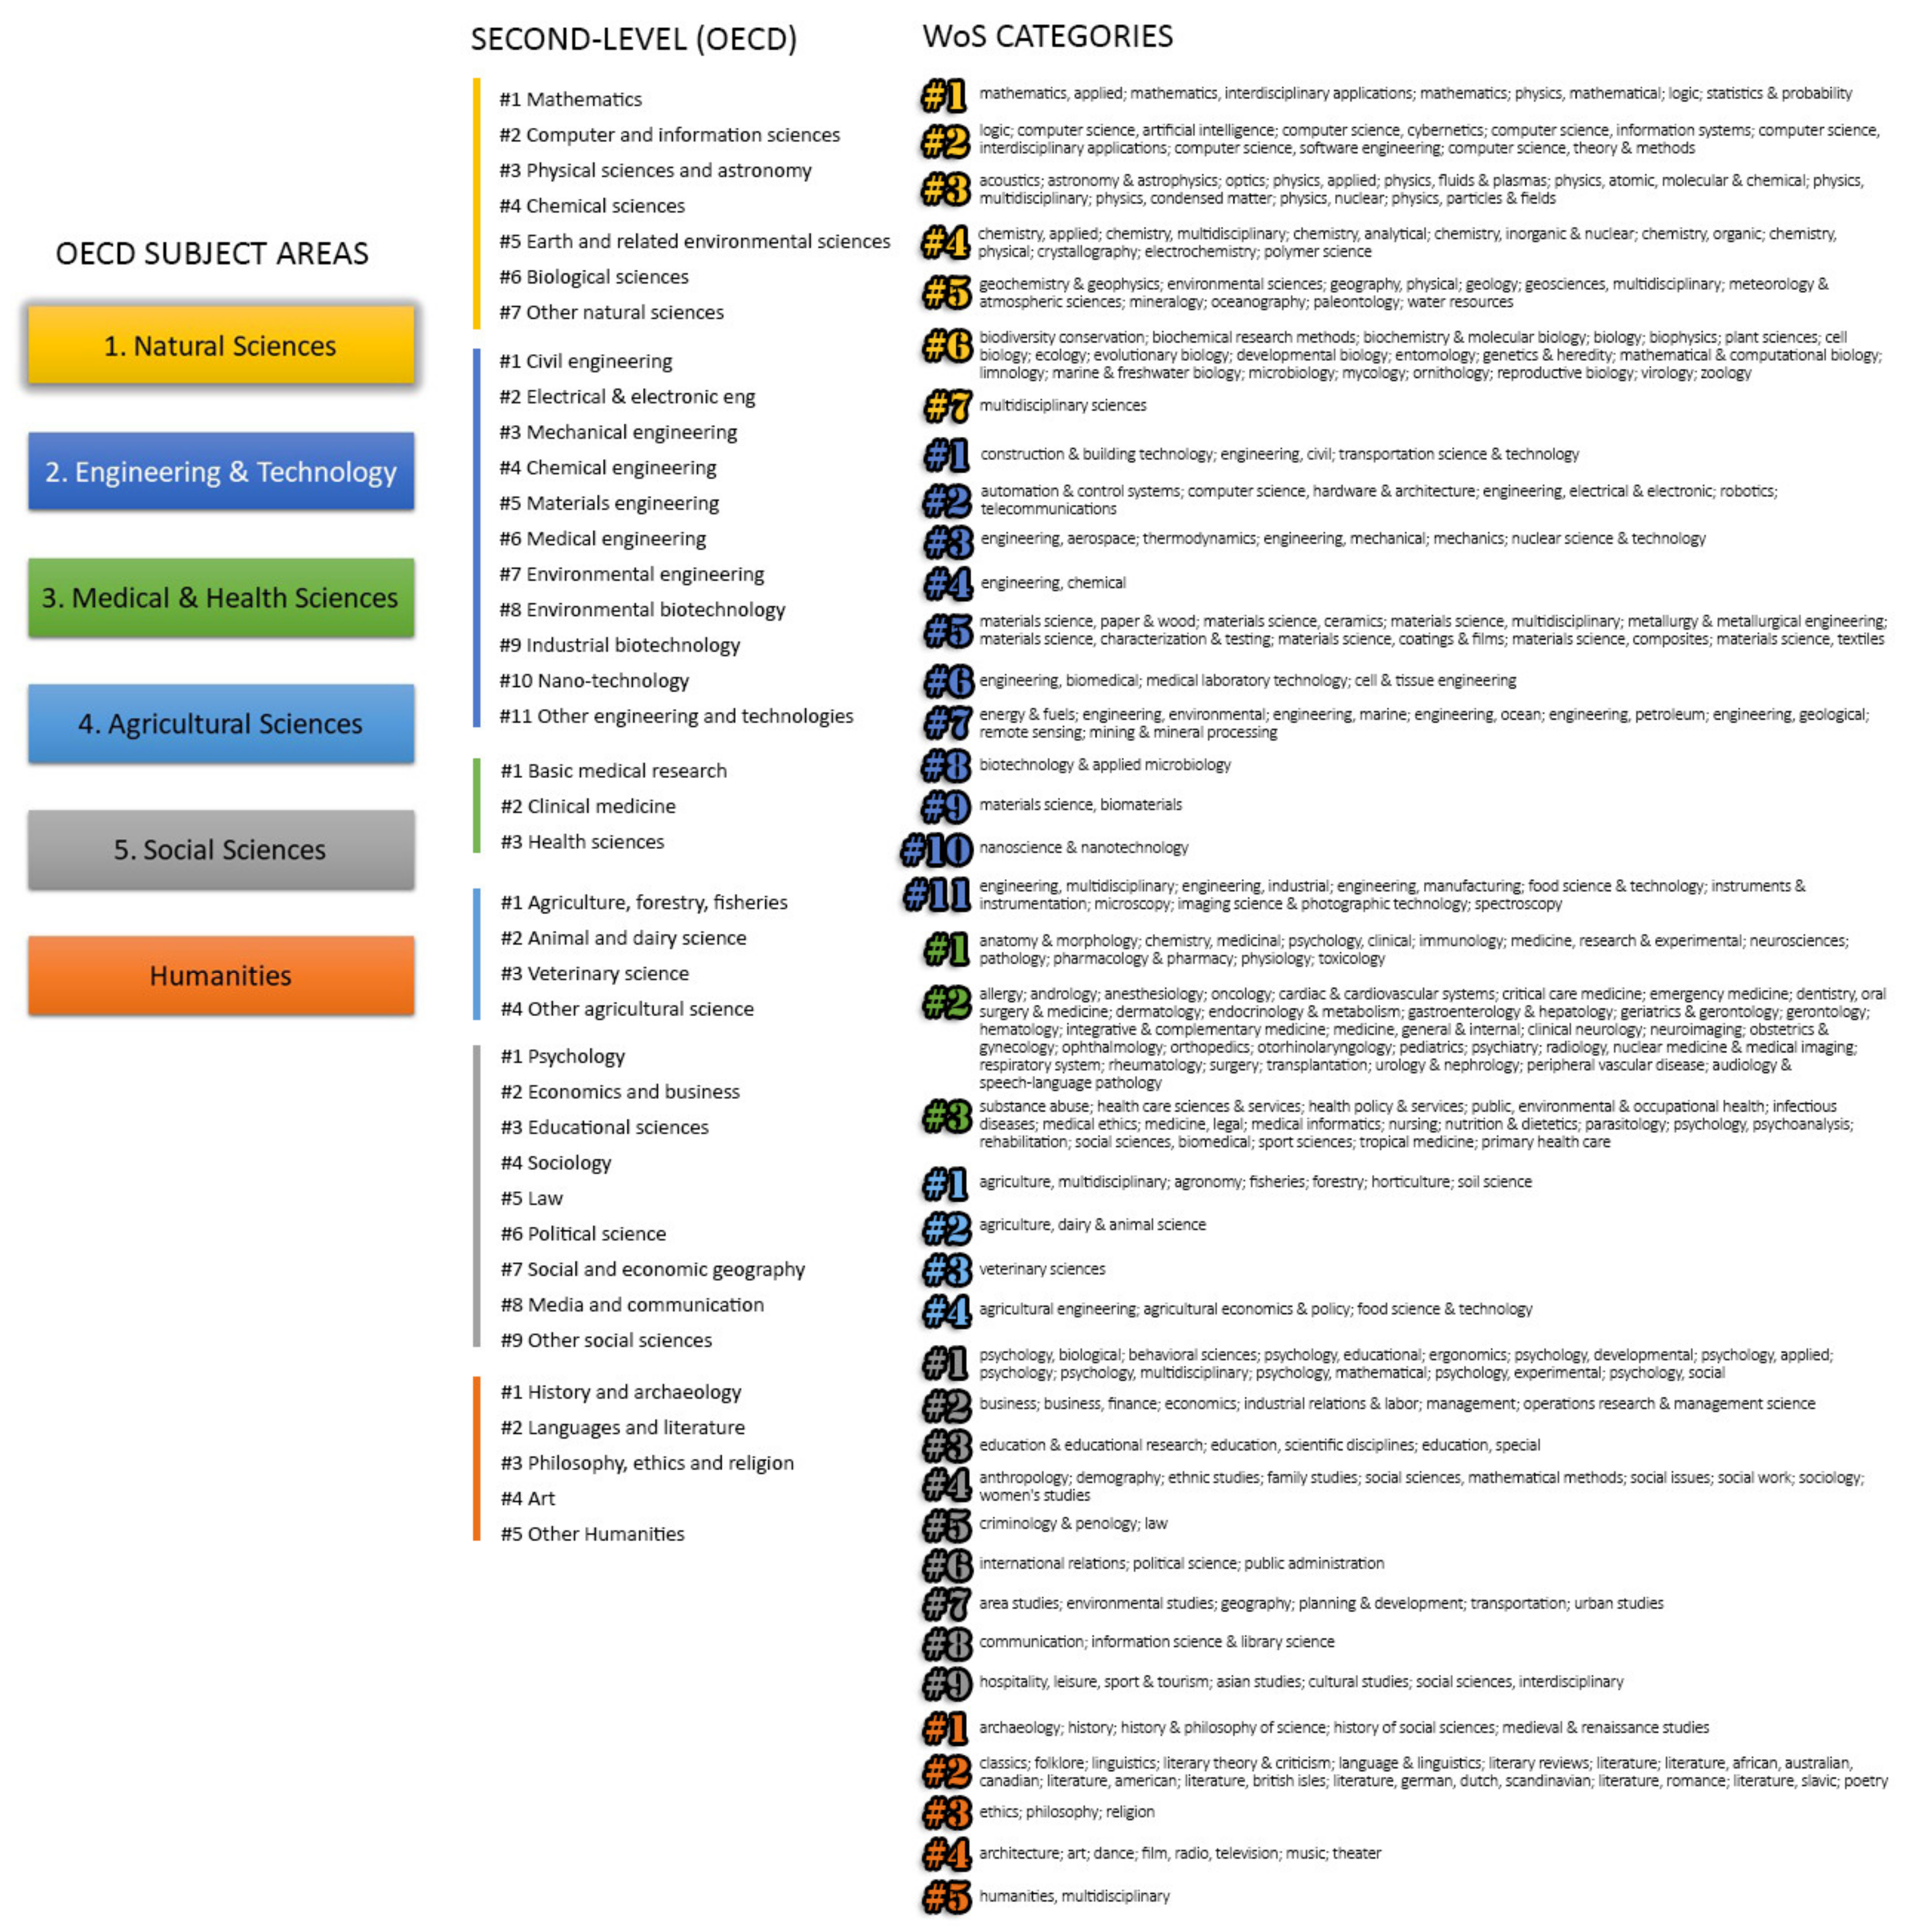
This study was based on two main datasets, retrieved on 9 September 2020 in InCites. The first included publication and citation data covering all document types for 255 subject categories of the Web of Science (WoS) (1980–2020). These 255 subject categories were grouped under 6 main and 39 s-level OECD subject areas: natural sciences (63 categories), engineering and technology (45 categories), medical and health sciences (59 categories), agricultural sciences (11 categories), social sciences (48 categories), and humanities (29 categories). The classification scheme of the WoS subject categories in the OECD, which is based on the WoS conversion table (OECD Category Scheme: http://help.prod-incites.com/inCites2Live/filterValuesGroup/researchAreaSchema/oecdCategoryScheme.html), is presented in Appendix A.
For the second dataset, we downloaded the data for 45,987 unique humanities sources (e.g., journals and books) indexed in the WoS to analyze whether there were differences among the subareas of humanities. We categorized these sources in terms of five OECD subareas for humanities, which were history and archaeology (16,805 sources); language and literature (14,338 sources); philosophy, ethics, and religion (12,026 sources); art (7541 sources); and other humanities (1224 sources). One source may have been classified into two or more subareas of humanities. If the source was related to two or more different subareas of humanities, it was added to both related subareas. Besides that, it is important to note that if a paper was indexed in SCIE or SSCI and related to the humanities in terms of its subject, the paper was also indexed in AHCI, even if the journal was not indexed in that index. For example, 115,211 publications published between 1900–2020 and indexed in the WoS were indexed in SCIE as well as AHCI. Therefore, in the list of articles, there were articles published in various pure science journals from acoustics to medical sciences, and they were considered for our study.
Considering whether the parametric testing assumptions (normal distribution, n > 30) were met, we carried out Kruskal–Wallis, Mann–Whitney, and two Independent Samples t-tests to compare six main areas and five subareas of humanities by the citation and collaboration variables. The citation variables were citations per publication, percentage of documents cited, and percentage of highly cited papers, whereas the collaboration variables were the percentage of industry collaboration and percentage of international collaboration. The effect sizes for the Kruskal–Wallis (), Mann–Whitney , and two Independent Samples t (Cohen’s d)-tests were also calculated to present more accurate results. The Kruskal–Wallis calculation was , where H is the test value, k is the number of groups, and n is the total number of observations [13] (pp. 19–20). The Mann–Whitney calculation was expressed as , where and are average ranks for two groups and is the total size [13] (pp. 10–11). The formula for Cohen’s d was [14] (pp. 241–242). In this formula, is the mean difference of two groups, and is a pooled estimate of the standard deviation, calculated as for unequal group sizes [15] (p. 79). 0.14, 0.8, 0.5 indicates a large effect [2,4]. The test results that seemed significant in terms of p values but had effect sizes below these indicated values were not reported as statistically significant. Median values and percentiles were also used for evaluating the data.
We used SPSS (version 21) for statistical tests and descriptive statistics. R Commander’s KMgglot2 plug-in was used to create the boxplot, scatter, and 95% confidence interval graphs. The boxplot shows citations per paper in six main areas, based on category data. Scatter and confidence interval graphs for citations per paper and the percentage of documents cited in five subareas of humanities were based on the source list of humanities. A boxplot is provided to present the median, minimum and maximum values, range, and interquartile range, which were calculated using the category values for each area in our example, and each box represents an area.
3. Results
The data were analyzed in two stages. First, we compared the six main areas in terms of five different variables on citations and collaboration statistics. Then, we focused on the humanities and compared five subareas of humanities using the same variables.
3.1. Comparisons of Six Main Areas
The six main OECD areas were compared by the citation and collaboration variables presented in Table 1. The values in Table 1 are the median values, meaning half of the categories in a specific area had greater values than those. As shown in Table 1, the humanities have the lowest values among the six areas for all five variables. The first three variables, based on citations, were evaluated in detail under the first subtitle, and the other two variables (percentage of industry collaboration and international collaboration) were evaluated under the second.
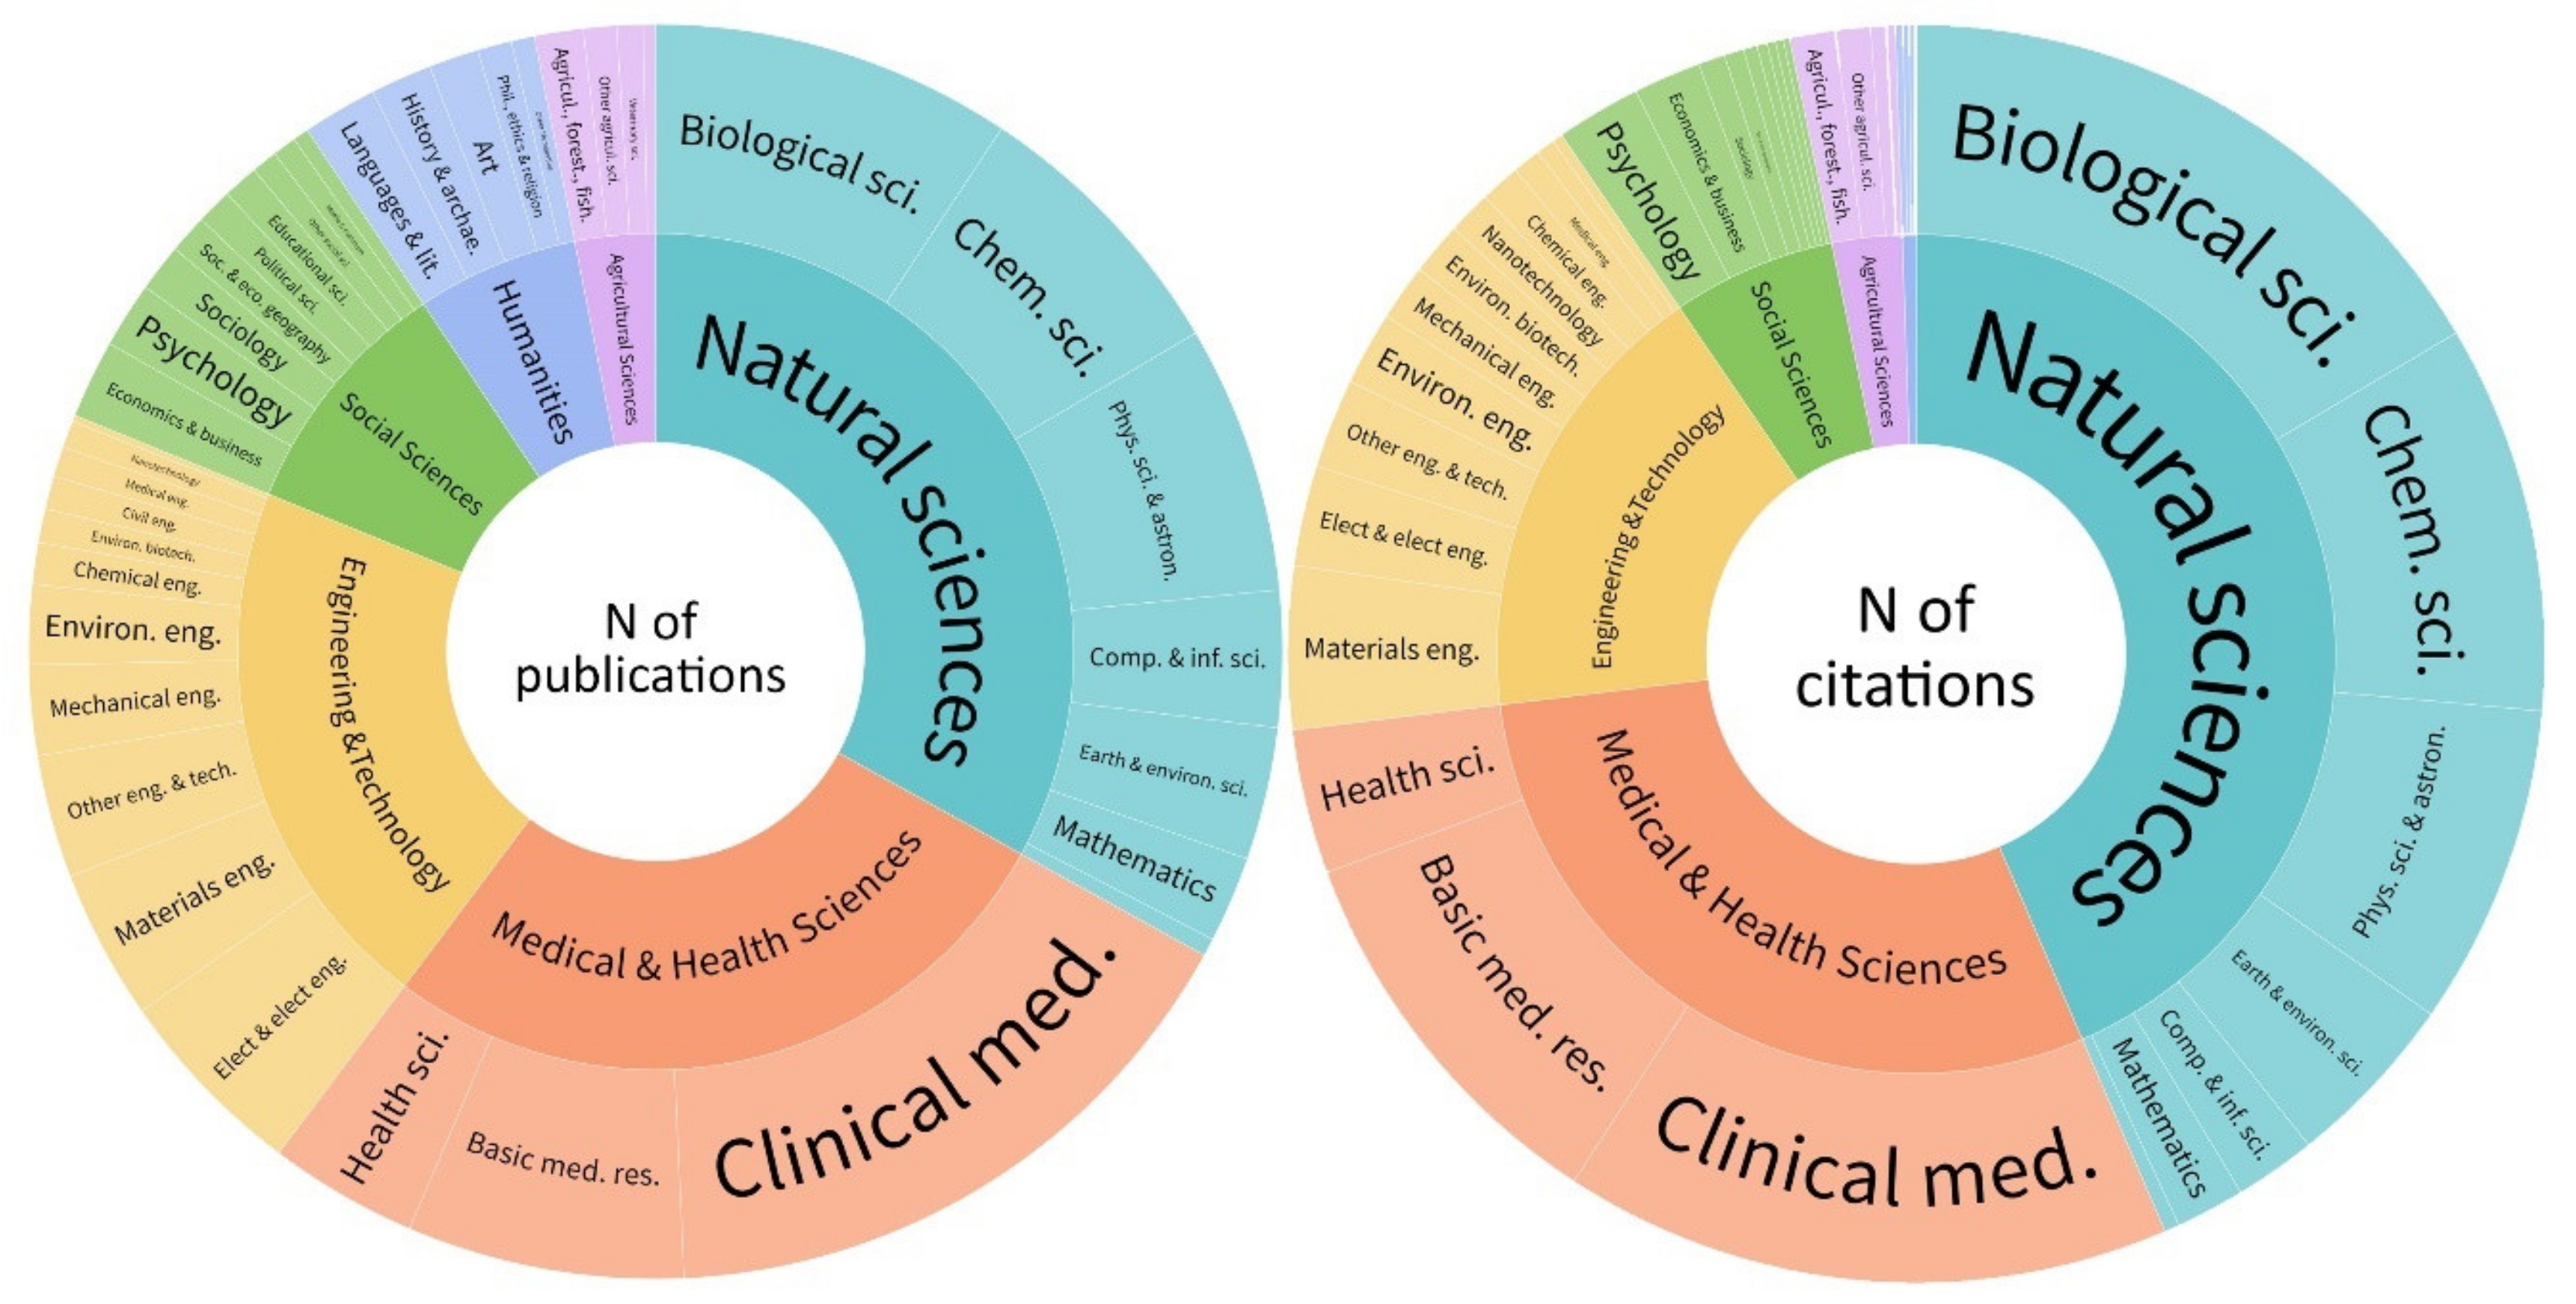
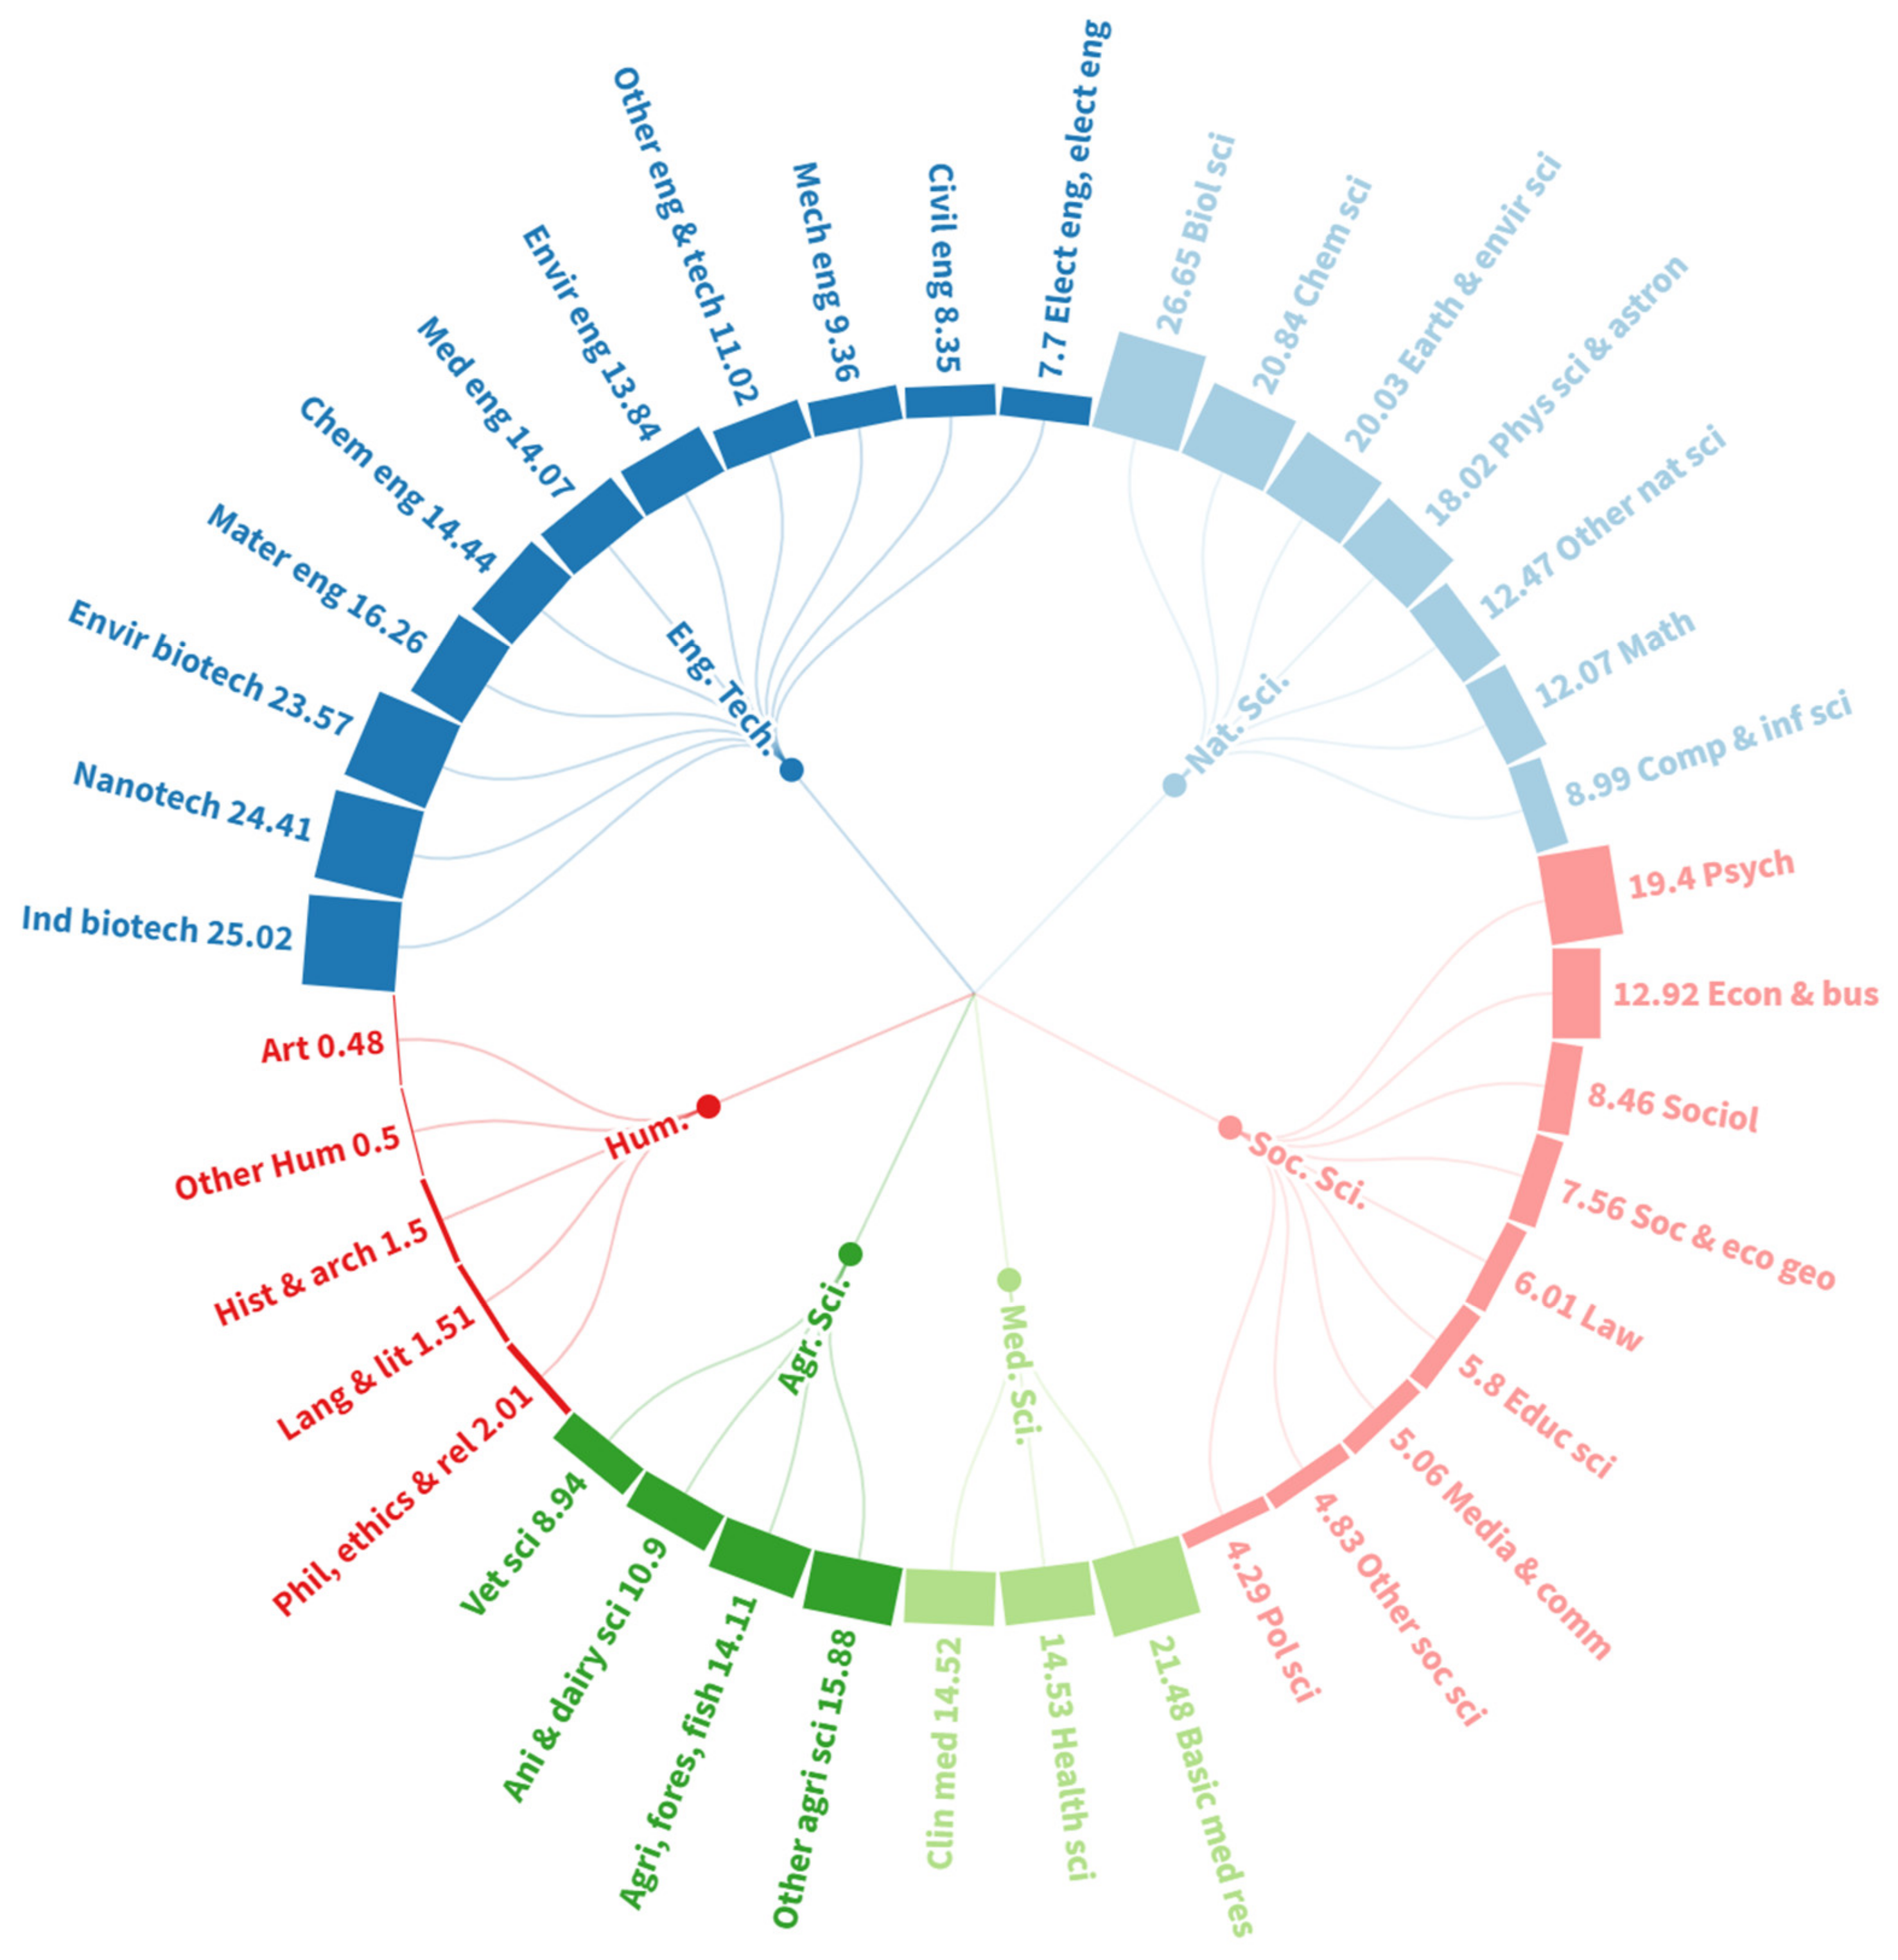
Figure 1 shows the distribution of publications and citations in the OECD areas. The figure proves the dominance of pure sciences in terms of publication patterns. Of the papers, 81% were published in three main pure sciences categories: natural sciences (33%), medical sciences (27%), and engineering and technology (21%). The total number of humanities publications was almost similar to a relatively small pure science area: agricultural sciences. However, the distribution of citations to the OECD subject areas revealed the main difference with humanities. Humanities had only 0.52% of whole citations in the dataset, while natural sciences had 44%, medical sciences had 30%, engineering and technology had 17%, social sciences had 6%, and agriculture had 1.5%.
The other important aspect of Figure 1 is proofing of the differences in subareas, not only for the humanities, but also for all scientific areas. The numerical advantages of psychology, economics and management, clinical medicine, biological sciences, and electrical and electronic engineering over the other sub-areas in their domain are obvious.
3.1.1. Citations
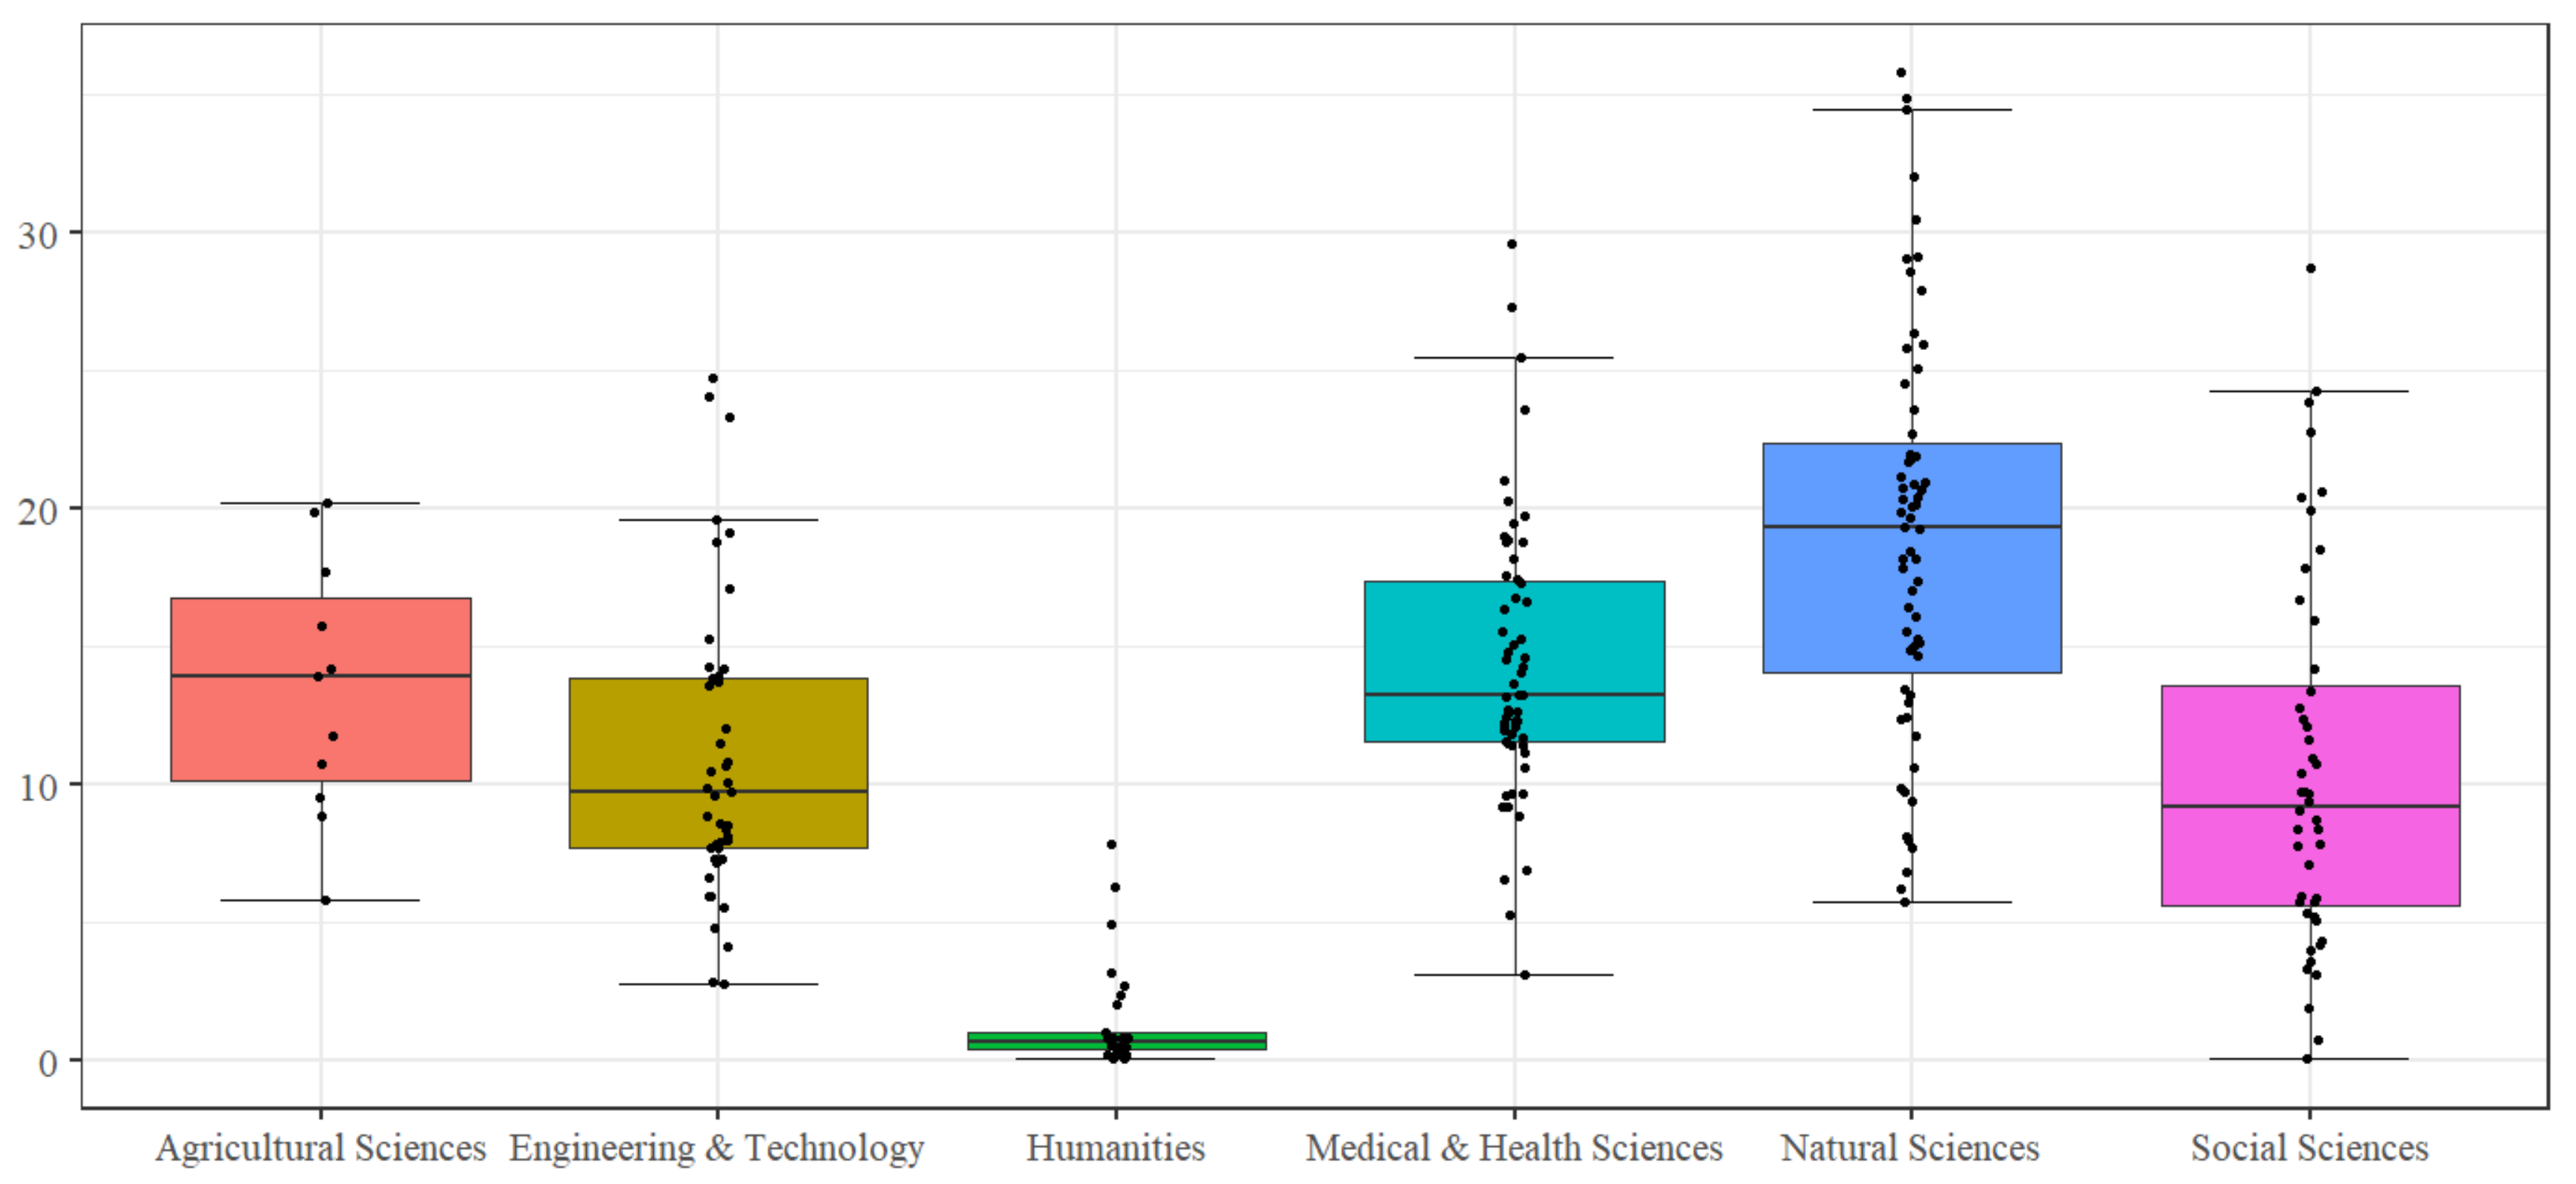
The median for citations per paper was 19 for natural sciences. Agricultural sciences and medical and health sciences followed with 14 and 13, respectively. It was 10 for engineering and technology and 9 for social sciences, but the median was not even 1 for the humanities (0.68). The boxplot graph in Figure 2 shows the values of citations per paper for the categories included in each area. Humanities stands out among others with its different position. Of the 29 categories classified under humanities, 7 had values greater than 2 (linguistics, ethics, archaeology, history and philosophy of science, language and linguistics, history of social sciences, and philosophy in descending order). The linguistics category had the highest value for citations per paper at 7.85, below the median value of all the other areas. The six main areas differed statistically in terms of citations per paper (H = 113.629, p < 0.001, = 0.436), and the humanities were the main reason that they had statistically significant differences from all five of the other areas (p < 0.001, > 0.87). Besides that, engineering and technology (U = 539.000, p < 0.001, = 0.620) and social sciences (U = 588.000, p < 0.001, = 0.611) differed from the natural sciences with reasonable effect sizes.
Similarly, the median for the percentage of cited publications in the humanities was considerably low (16%), which meant 84% of the papers for half of the categories in the humanities had not been cited yet. The median value of cited publication rates for other areas was between 51% and 78%. When we compared the areas by the categories’ cited paper rates, we found that the difference was statistically significant (H = 134.659, p < 0.001, = 0.521). This was mainly because of the humanities that differed from all other areas (p < 0.001). Note that was 0.833 for the social sciences and humanities, whereas it was calculated to be greater than 0.96 between the humanities and four other areas. Furthermore, the social sciences affected the difference between the areas. It differed from the agricultural sciences (U = 59.000, p < 0.001, = 0.777), medical and health sciences (t = 5.070, p < 0.001, = 1.023), engineering and technology (t = 4.187, p < 0.001, = 0.869), and natural sciences (U = 269.000, p < 0.001, = 0.822). In addition, the natural sciences differed from engineering and technology and the medical and health sciences, with values around 0.59 (p < 0.001 for both).
At least 1 in every 400 papers in the natural sciences, and 1 in every 500–700 papers in the social sciences (0.19%), agricultural sciences (0.18%), medical and health sciences (0.17%), and engineering and technology (0.15%) were highly cited for half of the categories included in these areas. More than half of the categories (15) in the humanities did not have any highly cited papers. Ethics had the highest rate of highly cited papers in the humanities (0.14%). The rates for the other 13 categories in the humanities changed between 0.015% (one in every 6667 publications) and 0.0003%. The humanities were significantly different from all other areas in regard to the percentage of highly cited papers (p < 0.001, > 0.91).
3.1.2. Collaborations
Similar differences among the six OECD areas were observed for the percentage of papers produced with international collaboration (H = 139.421, p < 0.001, = 0.540). Half of the categories in the natural sciences had at least one in five papers produced via international collaboration, which made it statistically different from the five other areas (p = 0.001, = 0.619 for agricultural sciences, p < 0.001, = 0.672 for medical and health sciences, and p < 0.001, d = −1.217 for engineering and technology). One in 167 papers had international collaboration for the humanities (0.60%), and it changed between 9% and 13% for the other four areas. Humanities differed from all other areas significantly (p < 0.001, = 0.859 for social sciences, and > 0.97 for others). Social sciences differed from agricultural sciences (p = 0.001, = 0.636), engineering and technology (p < 0.001, d = 1.00), and natural sciences (p < 0.001, d = 2.018) in addition to the humanities but, interestingly, not the medical and health sciences ( = 0.403).
The papers produced with industry collaboration rate was around 1–2%, except for social sciences and the humanities, and was highest for engineering and technology (at least 2% for half of the categories included). For 24 categories in the social sciences, at least 1 out of every 500 papers was produced with industry collaboration. Industry collaboration was not observed in almost one-quarter of the humanities categories (8 categories). Ethics (0.12%), the history and philosophy of science (0.10%), and language and linguistics (0.10%) were the categories in the humanities that differed from others in terms of having the highest rate of industry collaboration. All areas differed from each other, except the natural sciences and medical and health sciences (H = 150.059, p < 0.001, = 0.583). Considering the effect sizes, the humanities and social sciences were the two leading areas for statistically significant differences from all other areas. Except for the social sciences (U = 0.000, p < 0.001, = 0.830), humanities had values calculated as almost 1. Both the social sciences and humanities differed significantly from engineering and technology (humanities: U = 0.000, p < 0.001, = 1; social sciences: U = 53.000, p < 0.001, = 0.951).
3.2. Comparisons of Six Subareas of Humanities
The humanities were one of the main OECD areas that had very low values in comparison with other areas, in regard to the variables analyzed. We also compared five subareas of the humanities (history and archaeology, language and literature, philosophy, ethics and religion, art, and other humanities) regarding the citation and collaboration variables of the 51,934 sources.
First of all, it should be noted that about 21% of the 51,934 sources have not been cited yet. Philosophy, ethics and religion (24.5%), and art (23.4%) were the prominent subareas having the highest percentages of uncited sources. On the other side, for almost 89% of the sources, the highest number of citations per document was 3. Only 1% of the sources had more than 16 citations, and 2% of the sources had more than ten citations per paper. Only about 17% of the sources had more than half of the documents cited.
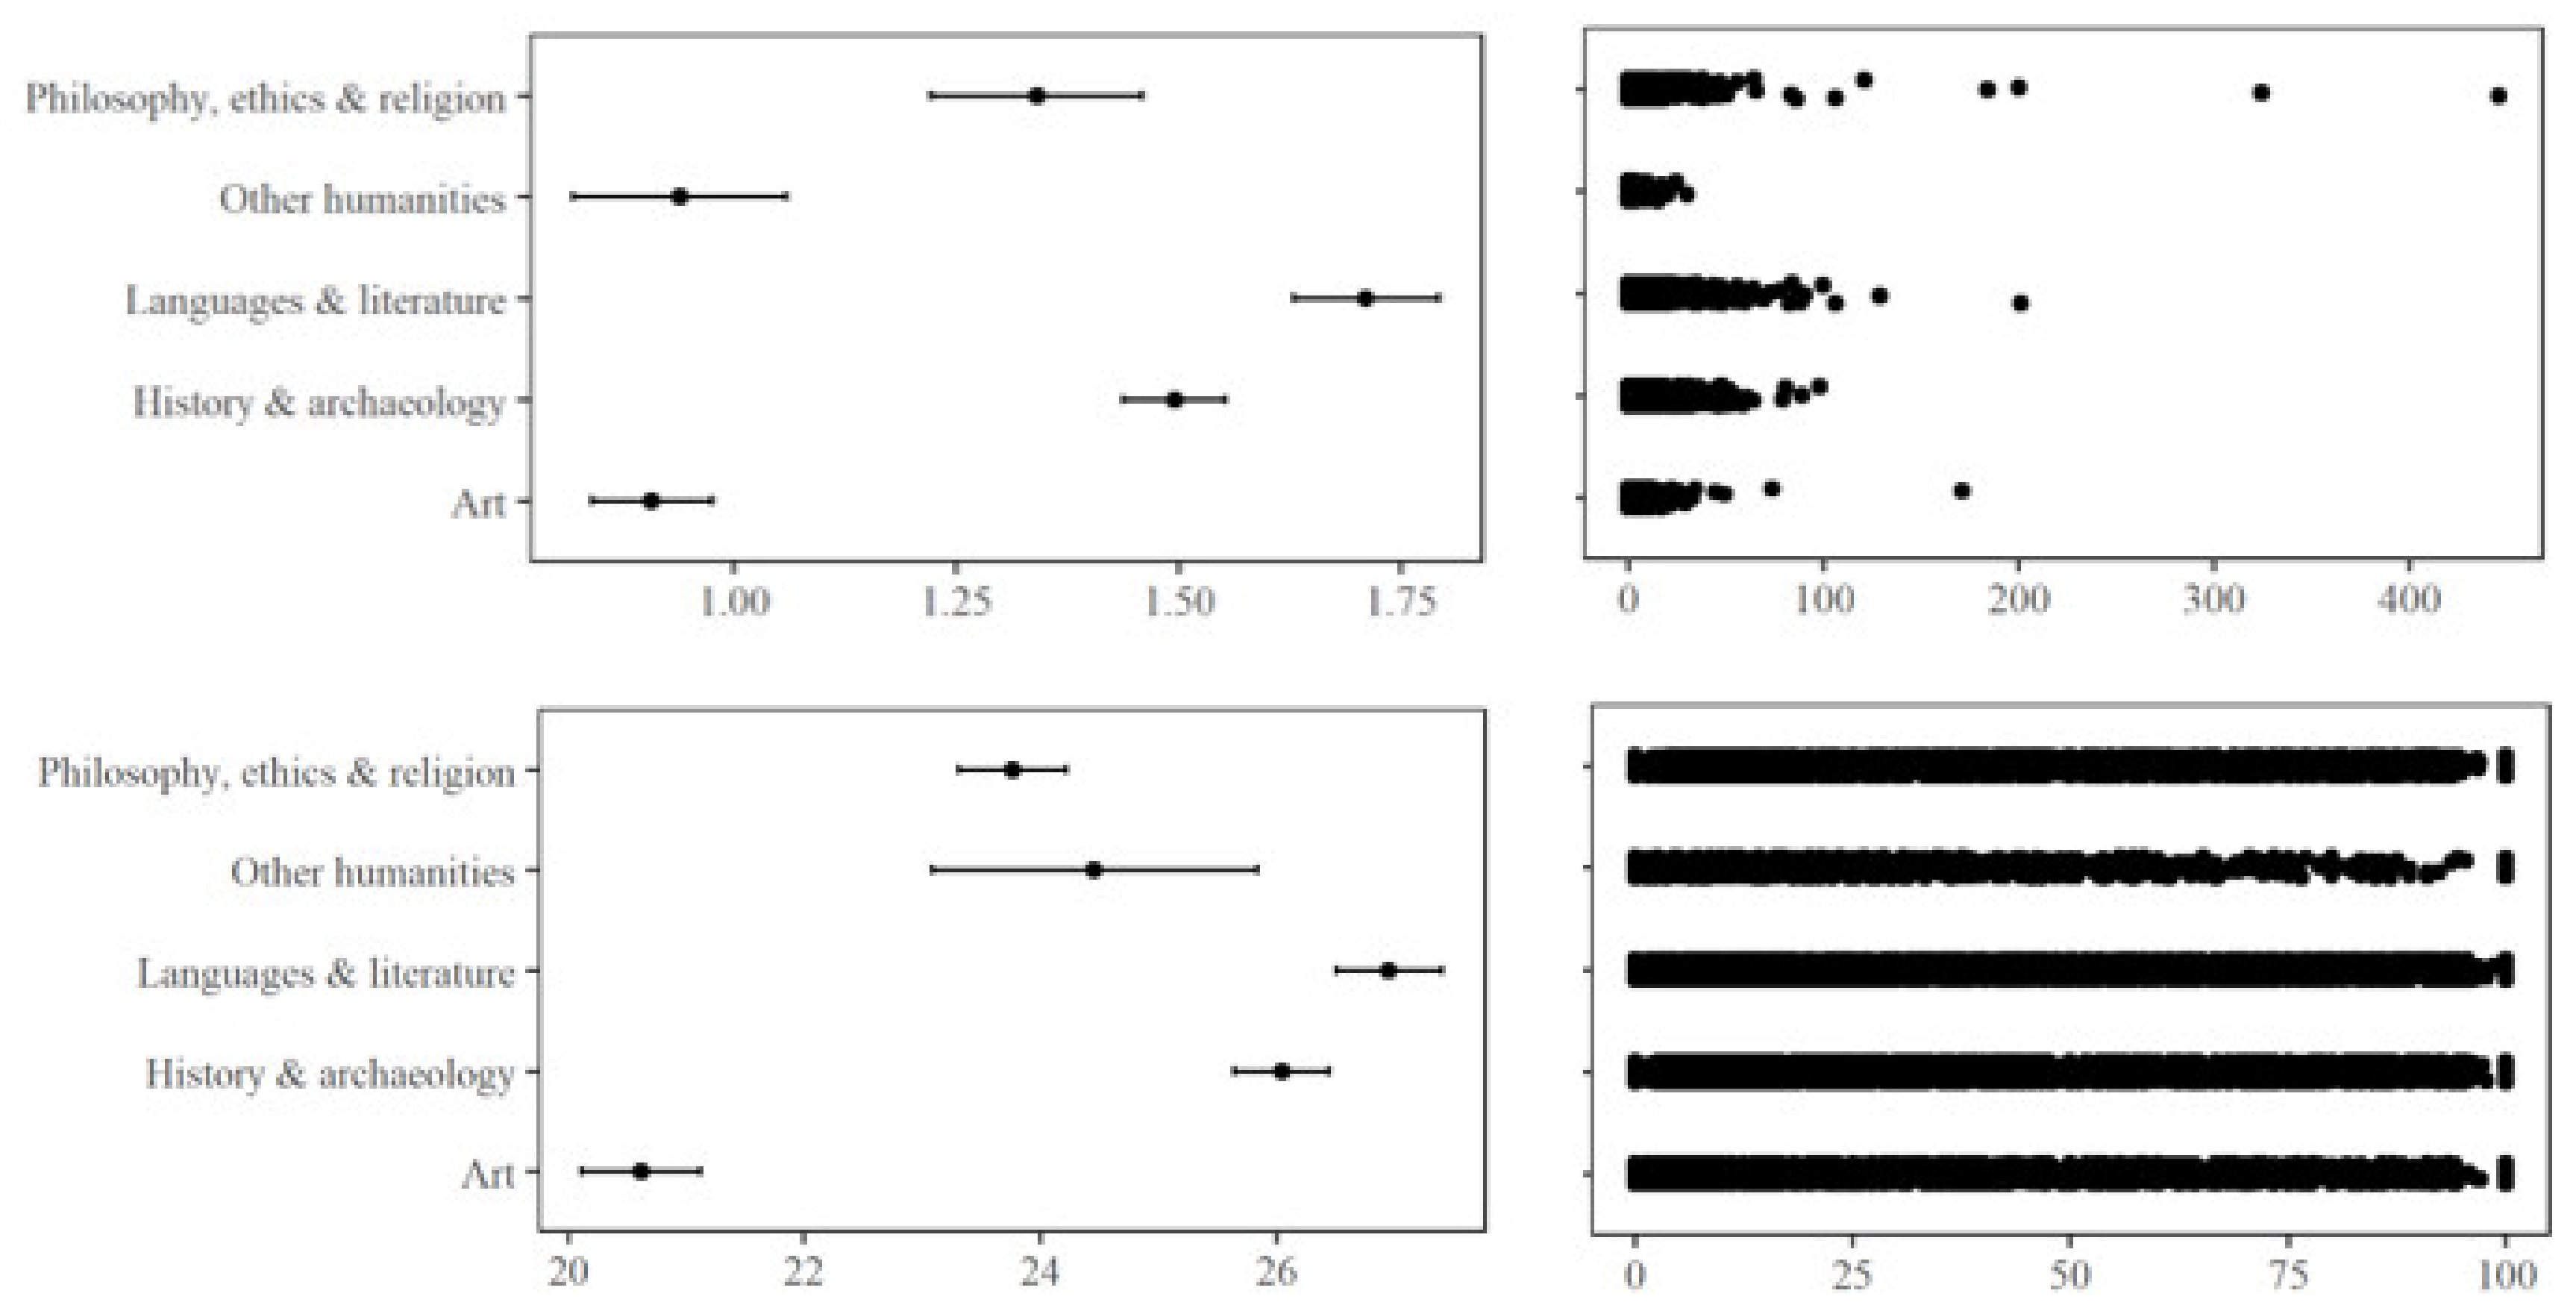
Considering Figure 3, which presents a 95% confidence interval and a scatter of sources based on the citation per publication and percentage of documents cited data, it is clear that all five subareas of the humanities are not the same. Art and other humanities had lower values in regard to citations per publication (see the upper left part of Figure 3). However, there were sources in the art subcategory that stood out with their high numbers of citations per publication compared with other sources (see the upper right part of Figure 3). The most remarkable one in this sense was the Canadian Medical Association Journal with 177 citations per publication. Note that the number of WoS documents was just one. The paper on art, entitled Playing-related musculoskeletal disorders in musicians: A systematic review of incidence and prevalence, had a high number of citations compared with the papers published in the arts category. The important thing was that the paper was indexed in the general internal medicine category of SCIE, as was mentioned in the Materials and Methods section. However, the paper was not indexed in AHCI in the WoS. It was only considered as a publication of art by the InCites database. These kinds of data issues prove the limitations of citation databases.
On the other hand, languages and literature, as well as history and archaeology, were the two subareas of humanities with the highest number of citations per publication. English for Academic Purposes: An Advanced Resource Book, which is a book series having 201 citations, followed by another book, Etymologies of Isidore of Seville (129 citations), had the highest number of citations per publication for the language and literature subarea. Philosophy, ethics, and religion had medium values for the number of citations per publication, but had many remarkable sources regarding this variable. There were two books that led the way: On Bullshit (446 citations) and Giving an Account of Oneself (324 citations). These were followed by an article published in PLOS Medicine (200 citations) and a book series entitled Birth of Biopolitics: Lectures at the College de France, 1978–1979 (184 citations per publication).
Table 2 presents the 95% confidence interval graph (lower left) and scatter graph (lower right) for the percentage of cited documents for each of the subareas of the humanities. The most different area, according to the 95% confidence interval graph, was art (mean = 20.6, median = 12.5), which had the lowest percentage of cited documents among other subareas. The scatter graph for the percentage of papers cited (lower right) presents a different picture, suggesting that there were also sources with all the documents cited (100%) at least one time. Note that 459 sources out of 1006 (45.6%), which had 100% of the papers cited, had only one document. They were mainly books or journals from other areas that had only one article indexed under a specific subcategory.
Although five subareas of the humanities differed by the number of citations per paper (H = 358.681, p < 0.001, = 0.0068) and the percentage of cited documents (H = 259.286, p < 0.001, = 0.0049), according to the p values, the effect sizes indicate that these test results are not statistically significant.
The rate of highly cited papers and collaboration statistics of each subarea of the humanities are presented in Table 2. The highly cited publication rate was highest for philosophy, ethics, and religion, with a rate of about two highly cited publications in 10,000 papers. Language and linguistics stood out with the highest percentage of industry collaboration, that being about 4 in 10,000 documents. It was almost two for history and archaeology, as well as philosophy, ethics, and religion. These two subareas also had international collaboration rates of about 2%, which was the highest. Art and other humanities, on the other hand, had the lowest percentage for all three variables.
4. Discussion
This study presents the differences between the humanities and other areas, in terms of size-independent bibliometric indicators produced by InCites, on a categorical basis. Understandably, humanities differed from medical and health sciences, natural sciences, engineering and technology, and agricultural sciences, but it also differed from social sciences in terms of all indicators. Although social sciences and the humanities are generally considered together, this study warns that they are different. The shift in social sciences, from publishing native language papers in local and national journals to publishing English language papers in WoS-indexed international journals with the effect of policies [16] (p. 9), may be a reason for this separation or differentiation. Moreover, social sciences only differed from the other areas, except for the humanities, in terms of the cited document rate and industry collaboration. Indeed, a recent report [17] on the role and value of social sciences for the private sector in the UK found that not only Science, Technology, Engineering and Math (STEM), but social sciences were also widely used and seen as valuable in businesses (see also the blog post in [18] on this report). Regarding citations per paper, the social sciences were only different from natural sciences, in addition to the humanities. Not finding a statistical difference between the social sciences and medical and health sciences in international collaboration turned out to be an interesting finding of this study.
One of the noticeable findings of this study is that some articles in SCIE journals with high impact factors might be indexed in AHCI, such as How to resolve an ethical dilemma concerning randomized clinical trials, published in the New England Journal of Medicine. This can change the indicator values for the humanities dramatically, and this must be the subject of future studies. The approach is correct because the papers are on transdisciplinary subjects of the humanities such as ethics. However, a few articles can change the general picture of the area. All these findings prove that journal-based approaches are not adequate to draw the picture of scientific fields, especially for the humanities. On the other hand, using core citation indexes (e.g., Web of Science or Scopus) as a research evaluation tool in the humanities limits research evaluation processes with numbers based on journals. Considering different types of data sources like Google Scholar should be a solution; however, attention should be given to the limitations of Google Scholar, such as data quality and reliability issues [17] (p. 269).
The degree of difference between the humanities and other areas, regarding bibliometric indicators found in this study, underline the need to evaluate humanities research and researchers differently. However, it is still seen as a positive by policymakers to have WoS-indexed papers as a humanities researcher. For example, in China, publishing in WoS-indexed journals is not a mandatory requirement for tenure, but only in arts and humanities disciplines. However, if one were to publish, it would be possible to be exempt from other requirements in the humanities discipline for some universities. It is even possible to get a direct promotion to full professorship [18]. Humanities researchers have strong critiques for being assessed with quantitative indicators not developed for them, but for positive sciences [19] (p. 3).
The question of how to evaluate the humanities has always been controversial. Although most studies criticize current assessment methods, there have been efforts in recent years to find a convenient approach for assessing humanities research. The bottom-up assessment is one of them which, instead of evaluating in a top-down manner (by policymakers or decisionmakers), is “based on the research practices in the respective discipline” [19] (p. 9). In this context, regarding the use of all scholarly outputs, the construction of national and regional databases is on the agenda to overcome the challenges of research assessment in the humanities [8,12]. Some countries have already achieved it. Current Research Information Systems in Norway (CRISTIN, https://www.cristin.no/english/), CINECA in Italy (https://www.cineca.it/en), Lattes in Brazil (http://lattes.cnpq.br/), the Indian Research Information Network System (IRINS, https://irins.org/irins/), and the Slovenian Current Research Information System (SICRIS, https://www.sicris.si/) are examples of national practices. The regional databases that come forward in the humanities are the Flemish Academic Bibliography for the Social Sciences and Humanities (VABB-SHW, https://www.ecoom.be/nodes/vabb/en), the European Reference Index for the Humanities (ERIH Plus, https://dbh.nsd.uib.no/publiseringskanaler/erihplus/), and Open Access Publication in the European Research Area for Social Science and Humanities (OPERAS, https://operas.hypotheses.org/).
The most important conclusion of this study is that the structures of each area and their subareas are different from each other, and all research assessment activities, without taking these differences into account, may produce erroneous results. Although there are works to reveal the differences in the practices of scientific fields in the literature, these works are generally done to be able to differentiate pure sciences from social sciences and the humanities. However, this study proves that not only scientific areas, but also their subareas, are different from each other, and the emerging need for research evaluation processes is to be able to provide responsible research evaluation methods for researchers and policymakers.
Author Contributions
G.D. and Z.T. conceptualized and formulated the research. Z.T. collected the data and managed data pre-processing. G.D. conducted formal analyses and wrote the original draft. Z.T. controlled review, editing and revision processes. All authors have read and agreed to the published version of the manuscript.
Funding
This research received no external funding.
Acknowledgments
We would like to thank the organizers and participants of ICTeSSH conference who selected our paper as the second-best paper for the ICTeSSH conference and provide us with an opportunity to publish the extended version of our proceeding.
Conflicts of Interest
The authors have declared no conflict of interest.
Appendix A
Figure A1.
OECD-WoS subject classification scheme (high-resolution image: http://zehrataskin.com/MDPI_Information/appendix.jpg).
Figure A1.
OECD-WoS subject classification scheme (high-resolution image: http://zehrataskin.com/MDPI_Information/appendix.jpg).

Appendix B
Figure A2.
Citations per paper for 6 main and 39 s-level OECD subjects.

References
- Garfield, E. “Science Citation Index”—A New Dimension in Indexing. Science 1964, 144, 649–654. [Google Scholar] [CrossRef] [PubMed]
- Al, U.; Şahiner, M.; Tonta, Y. Arts and humanities literature: Bibliometric characteristics of contributions by Turkish authors. J. Am. Soc. Inf. Sci. Technol. 2006, 57, 1011–1022. [Google Scholar] [CrossRef] [Green Version]
- Bates, M.J.; Wilde, D.N.; Siegfried, S. Research practices of humanities scholars in an online environment: The Getty online searching project report no. 3. Libr. Inf. Sci. Res. 1995, 17, 5–40. [Google Scholar] [CrossRef]
- Knievel, J.E.; Kellsey, C. Citation Analysis for Collection Development: A Comparative Study of Eight Humanities Fields. Libr. Q. 2005, 75, 142–168. [Google Scholar] [CrossRef] [Green Version]
- Larivière, V.; Archambault, É.; Gingras, Y.; Vignola-Gagné, É. The place of serials in referencing practices: Comparing natural sciences and engineering with social sciences and humanities. J. Am. Soc. Inf. Sci. Technol. 2006, 57, 997–1004. [Google Scholar] [CrossRef] [Green Version]
- Cullars, J. Citation Characteristics of Monographs in the Fine Arts. Libr. Q. Inf. Community Policy 1992, 62, 325–342. [Google Scholar] [CrossRef]
- Hicks, D. The Four Literatures of Social Science. In Handbook of Quantitative Science and Technology Research: The Use of Publication and Patent Statistics in Studies of S&T Systems; Moed, H.F., Glänzel, W., Schmoch, U., Eds.; Springer: Dordrecht, The Netherlands, 2005; pp. 473–496. ISBN 978-1-4020-2755-0. [Google Scholar]
- ENRESSH. Challenges of the Evaluation of Social Sciences and Humanities Research (SSH). 2017. Available online: https://enressh.eu/wp-content/uploads/2017/05/Evaluation_of_SSH_final.pdf (accessed on 23 November 2020).
- Hicks, D.; Wouters, P.; Waltman, L.; de Rijcke, S.; Rafols, I. Bibliometrics: The Leiden Manifesto for research metrics. Nature 2015, 520, 429–431. [Google Scholar] [CrossRef] [PubMed] [Green Version]
- The American Society for Cell Biology San Francisco Declaration on Research Assessment (DORA). Available online: https://sfdora.org/read/ (accessed on 27 August 2020).
- Helsinki Initiative on Multilingualism in Scholarly Communication, 2019, 621757 Bytes. Available online: https://figshare.com/articles/Helsinki_Initiative_on_Multilingualism_in_Scholarly_Communication/7887059 (accessed on 23 November 2020).
- Giménez Toledo, E. Research assessment in Humanities and Social Sciences in review. Rev. Esp. Doc. Científica 2018, 41, 208. [Google Scholar] [CrossRef]
- Cohen, B.H. Statistical tests for ordinal data. In Explaining Psychological Statistics; John Wiley & Sons, Inc.: Hoboken, NJ, USA, 2013. [Google Scholar]
- Cohen, B.H. Statistical Power and Effect Size. In Explaining Psychological Statistics; John Wiley & Sons, Inc.: Hoboken, NJ, USA, 2013; pp. 237–270. [Google Scholar]
- Hedges, L.V.; Olkin, I. Estimation of a Single Effect Size: Parametric and Nonparametric Methods. In Statistical Methods for Meta-Analysis; Hedges, L.V., Olkin, I., Eds.; Academic Press: San Diego, CA, USA, 1985; pp. 75–106. ISBN 978-0-08-057065-5. [Google Scholar]
- Fanelli, D.; Larivière, V. Researchers’ Individual Publication Rate Has Not Increased in a Century. PLoS ONE 2016, 11, e0149504. [Google Scholar] [CrossRef] [PubMed]
- Prins, A.A.M.; Costas, R.; van Leeuwen, T.N.; Wouters, P.F. Using Google Scholar in the research evaluation of humanities and social science programs: A comparison with Web of Science data. Res. Eval. 2016, 25, 264–270. [Google Scholar] [CrossRef]
- Shu, F.; Quan, W.; Chen, B.; Qiu, J.; Sugimoto, C.R.; Larivière, V. The role of Web of Science publications in China’s tenure system. Scientometrics 2020, 122, 1683–1695. [Google Scholar] [CrossRef] [Green Version]
- Ochsner, M.; Hug, S.; Galleron, I. The future of research assessment in the humanities: Bottom-up assessment procedures. Palgrave Commun. 2017, 3, 17020. [Google Scholar] [CrossRef] [Green Version]
Figure 1.
Distribution of publications and citations to the Organisation for Economic Co-operation and Development (OECD) subareas.
Figure 1.
Distribution of publications and citations to the Organisation for Economic Co-operation and Development (OECD) subareas.

Figure 2.
Boxplot of citations per publication for six main areas. (Each dot in the boxplot represents one Web of Science (WoS) subject category in the related OECD subject. The average citations per paper for 6 main and 39 s-level OECD subjects are shown in Appendix B.)
Figure 2.
Boxplot of citations per publication for six main areas. (Each dot in the boxplot represents one Web of Science (WoS) subject category in the related OECD subject. The average citations per paper for 6 main and 39 s-level OECD subjects are shown in Appendix B.)

Figure 3.
95% confidence interval and scatter graphs for subareas of the humanities, based on journal data for citations per publication (first line) and percentage of documents cited (second line).
Figure 3.
95% confidence interval and scatter graphs for subareas of the humanities, based on journal data for citations per publication (first line) and percentage of documents cited (second line).


Table 1.
Median values of variables for six main areas by category (1980–2020) 1.
| Variables | Nat. Sci. | Eng. Tech. | Med. Sci. | Agr. Sci. | Soc. Sci. | Hum. |
|---|---|---|---|---|---|---|
| Citations per pub. | 19.33 | 9.73 | 13.23 | 13.93 | 9.24 | 0.68 |
| Pub. cited (%) | 77.64 | 62.29 | 62.37 | 73.68 | 51.43 | 15.89 |
| Highly cited pub. (%) | 0.25 | 0.15 | 0.17 | 0.18 | 0.19 | 0.00 |
| Industry coll. (%) | 1.60 | 2.10 | 1.24 | 0.72 | 0.20 | 0.00 |
| International coll. (%) | 20.20 | 13.19 | 12.82 | 14.19 | 9.20 | 0.60 |
1 Nat. Sci. = natural sciences; Eng. Tech. = engineering and technology; Med. Sci.: medical and health sciences; Agr. Sci. = agricultural sciences; Soc. Sci. = social sciences; Hum. = humanities; pub. = publications; coll. = collaboration.
Table 2.
Collaboration and highly cited publication statistics for five subareas of the humanities 2,3.
Table 2.
Collaboration and highly cited publication statistics for five subareas of the humanities 2,3.
| Variables | Hist. Arc. | Lang. Lit. | Phil. Eth. Rel. | Art | Oth. Hum. |
|---|---|---|---|---|---|
| Highly cited pub. (%) | 0.0075 | 0.0076 | 0.0212 | 0.0012 | 0.0006 |
| Industry coll. (%) | 0.0189 | 0.0425 | 0.0188 | 0.0156 | 0.0068 |
| International coll. (%) | 1.76 | 1.35 | 1.76 | 0.78 | 0.60 |
2 Source: Incites, 2020. 3 Hist. Arc. = history and archaeology; Lang. Lit. = language and literature; Phil. Eth. Rel. = philosophy, ethics, and religion; Oth. Hum. = other humanities; pub. = publications; and coll. = collaboration.
Publisher’s Note: MDPI stays neutral with regard to jurisdictional claims in published maps and institutional affiliations. |
© 2020 by the authors. Licensee MDPI, Basel, Switzerland. This article is an open access article distributed under the terms and conditions of the Creative Commons Attribution (CC BY) license (http://creativecommons.org/licenses/by/4.0/).
Share and Cite
MDPI and ACS Style
Doğan, G.; Taşkın, Z. Humanities: The Outlier of Research Assessments. Information 2020, 11, 540. https://0-doi-org.brum.beds.ac.uk/10.3390/info11110540
AMA Style
Doğan G, Taşkın Z. Humanities: The Outlier of Research Assessments. Information. 2020; 11(11):540. https://0-doi-org.brum.beds.ac.uk/10.3390/info11110540
Chicago/Turabian StyleDoğan, Güleda, and Zehra Taşkın. 2020. "Humanities: The Outlier of Research Assessments" Information 11, no. 11: 540. https://0-doi-org.brum.beds.ac.uk/10.3390/info11110540
Note that from the first issue of 2016, this journal uses article numbers instead of page numbers. See further details here.