Strategy for the Appropriation of a DSS in Small Bovine Producers Using Simulation and a Serious Video Game


Abstract
:1. Introduction
- To reduce the gap in Information Technologies in the rural sector by helping farmers to appropriate a Decision Support System for managing their farms, because while useful tools exist, farmers use few of them [18].
- Make training of farmers easier with their participation in defining the simulation model. This model will then provide equations that will support the two other tools: the video game and the DSS. This will improve farmers’ confidence in the toolset and allow the definition of a common language used during the rest of the training and while using the tools.
- Guide farmers on how to use the DSS by using the serious video game as a learning tool as the decisions that must be made in the game are similar to those in reality.
- Allow farmers to make decisions about their production systems based on the information provided by the DSS about their processes autonomously and without assistance.
2. Concepts and Methods
2.1. Adoption and Appropriation of IT
2.2. IT Appropriation in Industrial Agriculture
2.3. Bovine Production System
- A birth requires: the mother’s milk production to be controlled, lactation of the calf a few months after birth to be stopped, three months after giving birth the cow to be inseminated.
- An insemination requires that the supply of milk to the calf stops after nine months.
- Each weight record requires checking that the value is consistent according to the age and breed of the animal.
2.4. Simulation Models with System Dynamics
2.5. Serious Video Games
2.6. Decision Support Systems (DSS)
2.7. Methodologies of Research
- Design and development research was used because it is oriented to educational innovation by introducing new tools in a traditional process to transform it and advance the didactic design of its teaching-learning process [42], and therefore directs the exploration of new context-based environments for teaching and learning, applying its developmental processes to creation of products, tools, and models [43].
- Case study was used because the authors had interest in working with communities, and each community could be considered as a unique social instance that could be analyzed to understand the way it works in order to generate hypotheses and apply proposals [44].
- The Rational Unified Process (RUP) was followed during the phase of the study related to building tools to develop the video game and the Decision Support System. The RUP is an iterative and incremental lifecycle run in work flows that involve modeling, analysis, design, implementation, testing, and deployment [45].
- System Dynamics was used to build the simulation model which supported the creation of the mechanics of the video game and the prognostic reports in the DSS. The methodology of System Dynamics is described in Section 2.4.
3. Results
3.1. IT Tools Developed for the Strategy
- While participating in the collaborative definition of the model.
- While simulating management in the video game and checking the obtained results in the DSS.
- While managing a real farm using the DSS.
3.1.1. The Simulation Model
- The capital is given at the start and after it is calculated by the previous value, the incomes and expenses.
- The incomes consist of milk, its price, the sale of calves, their price and weight.
- The expenses are calculated for the purchase of food and empty cows.
- In month 1 the empty cow is bought.
- In month 2 the cow is inseminated to become a pregnant cow (the gestation lasts 9 months).
- In month 11 the cow gives birth and becomes a cow at rest for three months.
- In month 11 a calf appears and is sold in month 23.
- The calf begins gaining weight from month 12 to 23.
- In month 1 an expense is generated for the purchase of the cow. From month 12 to 23, there is incomes from the sale of milk. In month 23, the calf is sold and an income is generated from it.
3.1.2. Serious Video Game
3.1.3. DSS
- Management of master entities such as sellers, customers, batches, breeds and users.
- Management of births.
- Management of other events (i.e., weigh, insemination, milk, medication, buying, selling and dying).
- Management of tasks to do (DSS forecasts dates of birth, weaning and insemination).
- Report of the animal’s details (it includes events such as birth, buying and other event logs).
- Report on genealogy.
- Report on individual production.
- Report on consolidate production.
- Report on income and expenditures.
- Report on sold and dead animals.
- Graphical report on individual production (it shows the expected weight and milk values according to age and breed) and graphic report on consolidate production.
- Graphical report on demographic distribution.
- The events report: The upper section shows the buttons the farmer can use to access other interfaces to add data for each event, and displays. The lower section shows a list of events, each one with data such as the event, number of the animal, date, value, and productive week of the animal when the event was registered.
- The list of forecasts: The list presents a task to be performed to support process control on the farm. Each one contain: the number of activity, number of the animal, the activity performed and the date.
- The graphical report on individual production of weight presents the registered value and a comparison with the expected value according to the breed and productive week of the animal (the farmer must select the animal, the desired event and the date range).
- The graphical report of consolidate production of milk presents the milk produced by all animals in a range of dates (The farmer must select the date range).
3.2. Appropriation Strategy
- The farmer’s participation in the collaborative construction of the model provides structure and a common language to use when using the three tools, which gives the farmers confidence and excites their interest in using them. Farmers receive training with simple models on System Dynamics so that they know the methodology, simulate scenarios in the proposed model, propose variables for a new version of the model, or approve it. At the end of this phase the tutor implements the variables that were discussed for the latest version.
- The training sessions usually run at the local rural school, allowed the creation of collaborative spaces that unified the way of handling processes. After the sessions the farmers could help each other to solve doubts and questions about aspects of the use of the DSS that some of them forgot.
- While the guided training process is aimed at learning how to use the tools, it improves comprehension of the benefits of having information about processes and provides practice of making decisions based on the information.
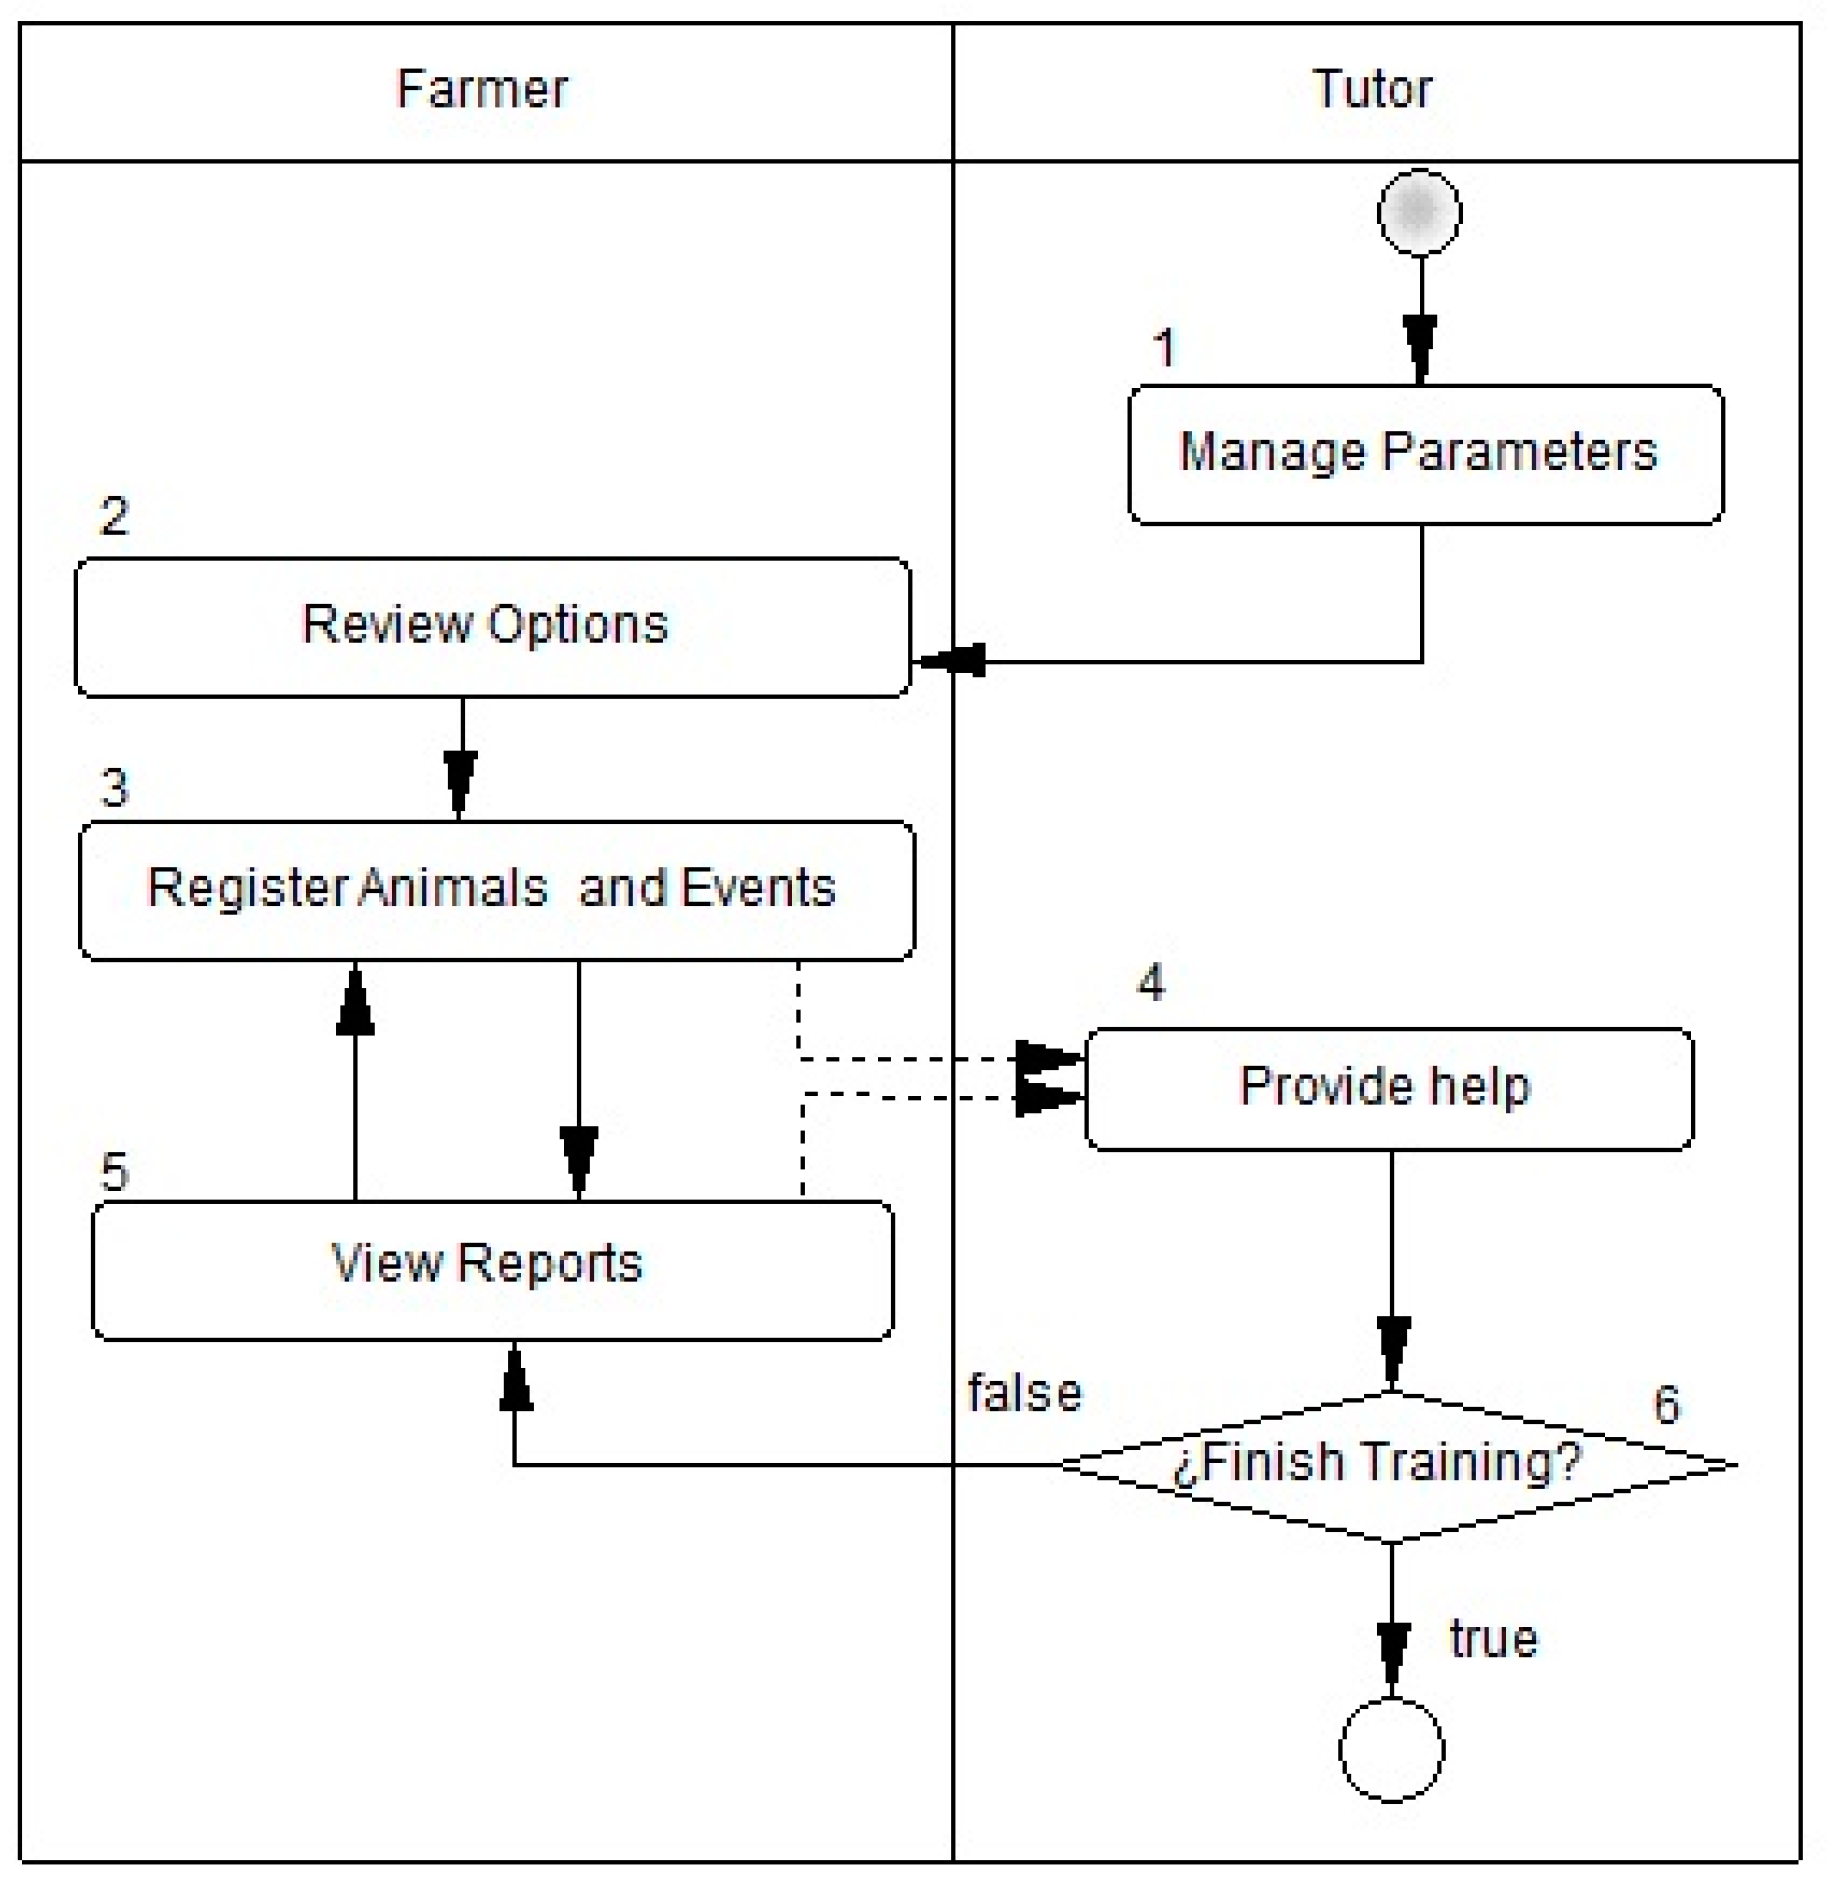
3.2.1. Steps of Phase 6—Training with the Game
- The tutor defines a scenario or challenge in the video game and invites farmers to start the game
- The farmer simulates his farm and makes choices based on the proposed challenge.
- The farmer continues to make decisions based on the results he obtains.
- The tutor aids the farmer by posing questions about the administration of the farm: when is the ideal date for a cow to give birth, what is the ideal weight of an animal for its age, how much milk should an animal produce, etc. In some cases, the number of animals in the virtual farm caused the farmers not to answer correctly due to the fact that they forgot to contemplate factors such as: the amount of milk produced, the time of insemination and the number of times it has given birth, among other things. The farmer must therefore consult the game reports that the DSS generates and there they will find different answers.
- Steps 2, 3, and 4 are repeated until the game is over.
- The farmer uses the DSS to solve pending questions by using the productivity reports the DSS generates. Based on the DSS the tutor, provides feedback about the decisions made in the game so that the farmer can better understand the way he should operate the system.
- In the next sessions, steps 2 to 6 are repeated as practicing.
3.2.2. Steps of Phase 7-Managing a Real Farm with the Help of the Tutor
- While the farmer is watching, the tutor sets up the system with the required parameters: data about the farm, the terrain, at least one seller or buyer, and a bull.
- The farmer gets to know the administrative options, fills in and checks data.
- The farmer adds data for an animal and a weighting event and loads a report to verify the information. If the farm produces milk, the farmer must add the data of the last birth, starting with the data on the pregnant cow, the birth, and the obtained amount of milk.
- The tutor aids the farmer when necessary while the farmer improves his skills of using the DSS.
- The farmer checks the productivity reports and forecasts in order to get used to them.
- In the next sessions, steps 3, 4, and 5 are repeated as practicing. When the farmer gets enough skill in the system, the tutor stops aiding him so that the farmer use the DSS autonomously.
3.3. Learned Lessons and Recommendations of the Implementation of the Strategy
- Training sessions should have little time between them (phases 4, 6, 7, 8) so that the process is kept coherent. It is important to periodically check the farmers as they usually have doubts about how to input data or check reports in the DSS. If there are errors in the input of data, they should be corrected as soon as possible to avoid repetition and learning bad habits.
- During the activities of collaboratively building the model (phase 4) it is important to mention that the model cannot be exactly the same as the system, as the model will lack certain aspects that exist in the real system (e.g., climate or residues) and include other aspects not taken into account in the real system (e.g., the costs of water). During the experience the farmers were aware that their systems are dynamic, but did not know about diagrams that could represent them. By including them in the construction of the simulation model they became engaged in the experience and had a representation methodology that they can try in other systems.
- When playing the serious video game, the farmers simulate the decision-making processes which they usually perform on their farms (phase 6), and the tutor recommends challenges that increase their difficulty as the farmers gain expertise. An initial challenge is to keep a single animal alive for 6 months and then manage the reproduction and breeding process of the animal. A more advanced challenge requires the player to duplicate his initial money or to buy enough animals to fill the stable. Players gain get confidence in the use of the tools by overcoming those incremental challenges with the aid of the tutor.
- In phases 6, 7, and 8 it is recommended to check the model to solve questions about the structure of the system. The activities in those phases therefore complement each other, that is, the farmer gains deeper and more detailed understanding of the tools with every phase he completes.
3.4. Measurement of the Appropriation of the DSS
- Percentage of appropriation: the ratio between the number of days that the farmer autonomously used the system and the number of days that passed since the aided phase finished.
- Percentage of appropriated farmers: the ratio between the number of farmers with a percentage of appropriation greater than or equal to the minimal expected percentage of appropriation and the total number of participating farmers.
3.5. Evaluation of the Acceptance of the DSS
- The first aspect is related to the reasons that led the farmers to using the DSS. Figure 9 shows that most of the appropriated farmers use the DSS because it is easy to use and allows handling large amounts of data.
- The second aspect is related to the reasons that led the farmers to considering the DSS useful. Figure 10 shows that most farmers found the DSS useful because of the reports it generates and because it makes decision making easier.
- The third aspect involves evaluating 10 features of the DSS evaluated with a Likert scale (strongly disagree, disagree, neither agree nor disagree, agree, strongly agree). Figure 11 shows that most farmers strongly agree that the DSS meets all the proposed usability features. However, a future version can improve aspects related to the UI (attractiveness, size, and coloring), response time, input recognition, and the usefulness of the alerts.
- The fourth aspect involve evaluating 10 functionalities of the DSS also evaluated with the Likert scale. Figure 12 shows that most farmers strongly agree with the importance of every functionality. Some features such as terrain management and insemination forecasting are not used a lot, and other features, including weighing, milking, and events reporting could be improved.
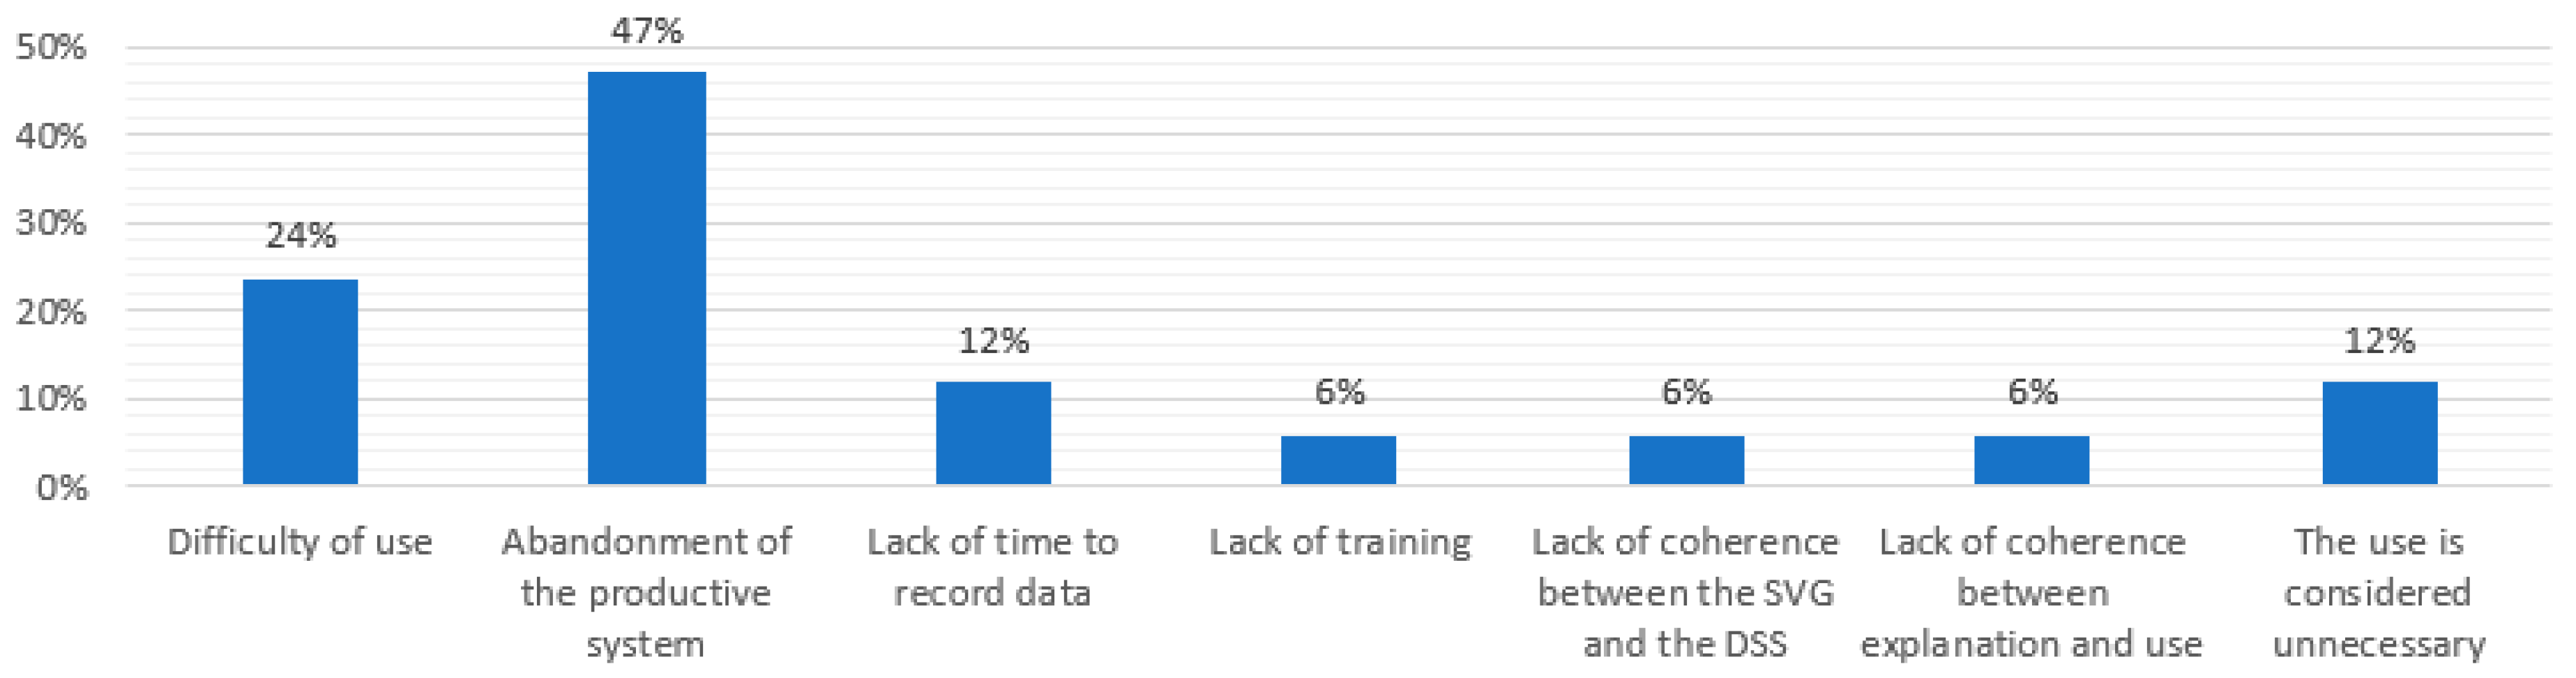
3.6. Evaluation for Abandoning the Strategy
4. Discussion
- Met the researchers’ intentions of (i) using a model with System Dynamics for the comprehension of the system, as expressed by Mejía and Cascante [16]; (ii) contributed to the use of this model to support the development of the software, as mentioned by Jaime [55] and Knox [56] to give clarity in the understanding of the production system and; (iii) mitigated the IT gap as it managed to achieve 34% of appropriation.
- Involved the farmers in the process of raising awareness of the limitations of simulations, which are natural and depend on the purpose of the model [57]. The model allowed the understanding and representation with System Dynamics (mainly in the causal loop diagram) and the use of its equations to define rules in the serious game and to do forecasting in the DSS [48].
- Integrated System Dynamics to support training, similarly to other works in the rural sector such as: (i) Protil and Barreiros [58] who represented critical processes during the commercialization of products of the cooperatives of agricultural communities; (ii) Basu and Sushanta [59] who showed reduction of poverty achieved thanks to the increase of capital and productivity in a region; (iii) Siregar et al. [60] who sought changes in politics based on the increase of agricultural production and access to technology; and (iv) Shikuku et al. [61] who prioritized productive strategies and technologies focused on the use of terrains to improve the return on investment.
- Used a serious video game as a computational teaching tool that, according to Samaniego [62], enhances self-regulation of learning and plays a fundamental role in training processes with purposes similar to those shown in the works of: (i) Pacheco et al. [63] to ease the transfer of knowledge with the participants; (ii) Moras [64] to innovate in educational and social processes that transform and improve society, and (iii) Kessler et al. [65] to raise legislators’ awareness of the amounts of information that are generated when dealing with the diverse issues that arise when managing terrains, and to develop best practices in the context of bovine producers.
5. Conclusions
- The simulation model generated a common language for the tutor and the farmers, which delimited the scope of the tools, as well as it gave uniformity of use and served as a guideline in the training sessions. The cooperative iterative process of simulation and validation of the model was enriching for the farmers.
- The serious video game allowed farmers to check the decisions they usually made on their farms and verify them in the DSS in a playful way. This query of data is an opportunity for farmers to understand that these decisions are usually forgotten or can be improved, and to become aware of the amount of data they usually handle and the importance of tracking decisions.
- Working with communities allowed cooperation among participants both to share points of view and questions about the benefits of the DSS and to aid each other with the use of the DSS during the phases of autonomous use. Aligning the DSS with a model that the farmers approve and can inspect to solve questions about the structure of the system, showing them the amount of data generated with the serious videogame, and consulting of previous decisions in the DSS strengthened the appropriation process.
- The help of the tutor while the farmer used the DSS to manage the data of his farm helped farmers to note the similarities between the experience on a real farm and the experience of the video game. This realization gave the farmers confidence in the use of the DSS. The confidence in the tools and the knowledge of the DSS that the farmers built with the help of the tutor and the simulated exercises made the farmers’ autonomous use of the DSS easier.
Author Contributions
Funding
Acknowledgments
Conflicts of Interest
References
- Boz, I.; Akbay, C.; Jordan, G.; Kamalak, A. Measuring livestock farmers’ effect on sustainable agricultural and rural development. Livest. Res. Rural Dev. 2005, 17, 73–90. [Google Scholar]
- De Buck, A.; Van Rijn, I.; Wossink, G. Farmers’ reasons for changing or not changing to more sustainable practices: An exploratory study of arable farming in the Netherlands. J. Agric. Educ. Ext. 2008, 7, 153–166. [Google Scholar] [CrossRef]
- Budiyanto, C. Decision support systems development for an artificial insemination project in community based precision livestock farming. In Proceedings of the 10th International Conference on Compressors and their Systems, London, UK, 11–13 September 2017. [Google Scholar]
- Whittenbury, K.; Davidson, P. Beyond adoption: The need for a broad understanding of factors that influence irrigators’ decision-making. Rural Soc. 2009, 19, 4–16. [Google Scholar] [CrossRef]
- Walmsley, B.; Oddy, V. Modelling systems to describe maternal productivity with the aim of improving beef production efficiency by eliciting practice change. Anim. Prod. Sci. 2018, 58, 193–205. [Google Scholar] [CrossRef]
- Park, S. Digital inequalities in rural Australia: A double jeopardy of remoteness and social exclusion. Rural Stud. 2017, 54, 399–407. [Google Scholar] [CrossRef]
- Chen, M.; Wichmann, B.; Luckert, M.; Winowiecki, L.; Förch, W.; Läderach, P. Diversification and intensification of agricultural adaptation from global to local scales. PLoS ONE 2018, 13. [Google Scholar] [CrossRef]
- Arévalo, J.; Bayona, R.; Rico, D. El problema de la brecha tecnológica: Un asunto de cultura. Rev. Sinapsis 2015, 7, 35–43. [Google Scholar]
- Zona-Ortiz, T.; Fajardo-Toro, C.H.; Aguilar, C. Propuesta de un Marco general para el despliegue de ciudades inteligentes apoyado en el desarrollo de IoT en Colombia. RISTI-Rev. Iber. Sist. Tecnol. Inf. 2020, 28, 894–907. [Google Scholar]
- Fedegan. Normativa General Agropecuaria. Available online: https://cutt.ly/Npwpg2Z (accessed on 30 June 2020).
- Jara, R.; Russy, S.; Roco, L.; Fleming-Muñoz, D.; Engler, A. Factors affecting the adoption of agroforestry practices: Insights from silvopastoral system of Colombia. Forests 2020, 11, 648. [Google Scholar] [CrossRef]
- Frias-Navarro, R.; Montoya-Restrepo, L. Understanding knowledge creation processes among rural communities in post-conflict settings in Colombia. Knowl. Manag. E-Learn. 2020, 12, 231–255. [Google Scholar] [CrossRef]
- Gobernación de Santander. Plan. de Desarrollo Social y Económico 2016–2019; Gobernación de Santander: Bucaramanga, Colombia, 2016.
- United Nations Development Programme. ¿Qué es el Índice de Pobreza Multidimensional? Available online: http://hdr.undp.org/en/node/2515 (accessed on 2 August 2020).
- Fernández, B.; González-Busto, B.; Castaño, Y. The Dynamics of growth in Franchising. J. Mark. Channels 2013, 20, 2–24. [Google Scholar] [CrossRef]
- Mejía, A.; Cascante, M. Hacia una dinámica de sistemas crítica: Un marco conceptual para investigación y una ilustración en educación. In Proceedings of the Fifth Latin American Congress of Systems Dynamics, Buenos Aires, Argentina, 7–10 November 2007. [Google Scholar]
- Checkland, P.; Ornelas, M. Los sistemas de información y el pensamiento de sistemas: ¿Tiempo de unirse? Col. Sonora 1994, 7, 125–140. [Google Scholar]
- Gómez-Prada, U.; Orellana-Hernández, M.; Salinas-Ibáñez, J. Apropiación de sistemas de tecnologías de la información para toma de decisiones de productores agroindustriales basada en videojuegos serios. Una revisión. Inf. Tecnol. 2019, 30, 331–340. [Google Scholar] [CrossRef]
- Chaveau, B.; Vergara, S. Proyecto Piloto de Escuelas Rurales de Informática y Ciudadanía: Un Modelo de Transformación Social en Chile, España; Publicaciones y Ediciones de la Universidad de Barcelona: Barcelona, Spain, 2011. [Google Scholar]
- Ortiz, R.; Franco, M. Políticas educativas de TIC en Colombia: Entre la inclusión digital y formas de transformación social. Pedagog. Saberes 2018, 48, 9–25. [Google Scholar] [CrossRef] [Green Version]
- Erumban, A.; De Jong, S. Cross-country differences in ICT adoption: A consequence of culture. J. World Bus. 2006, 41, 302–314. [Google Scholar] [CrossRef] [Green Version]
- Cobo, C. Aprendizaje Adaptable y Apropiación Tecnológica: Reflexiones Prospectivas. 2008. Available online: http://laisumedu.org/DESIN_Ibarra/autoestudio3/ponencias/ponencia33.pdf (accessed on 2 March 2020).
- Daza, L.; Hernández, C.; Quijano, A.; Serna, J. Plan Estratégico del Departamento de Santander. 2017. Available online: https://cutt.ly/LutBXUM (accessed on 15 September 2020).
- Sandia, B.; Luzardo, M.; Aguilar, A. Una visión del nivel de apropiación de las TIC en la Universidad de Los Andes. Mérida-Venezuela. Sist. Inf. Cient. 2016, 20, 99–112. [Google Scholar]
- Salemink, K.; Strijker, D.; Bosworth, G. The participation society and its inability to correct the failure of market players to deliver adequate service levels in rural areas. Telecommun. Policy 2018, 42, 757–765. [Google Scholar] [CrossRef]
- Suárez-Guerrero, C.; Rivera-Vargas, P.; Rebour, M. Preguntas educativas para la tecnología digital como respuesta. Rev. Electrón. Tecnol. Educ. 2020, 73, 7–22. [Google Scholar] [CrossRef]
- Zeng, H.; Xia, W.; Wang, J.; Wang, R. Approach of ICT in Education for Rural Development: Good Practices from Developing Countries; SAGE Publications India: New Delhi, India, 2015. [Google Scholar]
- Harris, R.W. Information and Communication Technologies for Poverty Alleviation; United Nations Development Programme (UNDP), Asia-Pacific Development Information Programme: Kuala Lumpur, Malaysia, 2004. [Google Scholar]
- Fritz, S.; See, L.; Bayas, J.C.L.; Waldner, F.; Jacques, D.; Becker-Reshef, I.; Whitcraft, A.; Baruth, B.; Bonifacio, R.; Crutchfield, J.; et al. A comparison of global agricultural monitoring systems and current gaps. Agric. Syst. 2019, 168, 258–272. [Google Scholar] [CrossRef]
- Universidad Nacional de Colombia. Agroindustria y Comercio Desaprovechan TIC. 2014. Available online: https://cutt.ly/uutBgLB (accessed on 19 September 2020).
- Gómez, U.; Andrade, H.; Vásquez, C. Lineamientos metodológicos para construir ambientes de aprendizaje en sistemas productivos agropecuarios soportados en dinámica de sistemas. Inf. Tecnol. 2015, 25, 125–136. [Google Scholar] [CrossRef] [Green Version]
- Cortés, H.; Aguilar, C.; Vera, R. Sistemas Bovinos de Doble Propósito en el Trópico—Modelo de Simulación; Pontificia Universidad Católica de Chile, Facultad de Agronomía e Ingeniería Forestal: Santiago, Chile, 2004. [Google Scholar]
- Markauskaite, L.; Kelly, N.; Jacobson, M. Model-based knowing: How do students ground their understanding about climate systems in agent-based computer models? Res. Sci. Educ. 2020, 50, 53–77. [Google Scholar] [CrossRef]
- Forrester, J. Industrial Dynamics; M.I.T Press: Cambridge, MA, USA; Wiley: New York, NY, USA, 1961; ISBN 9781614275336. [Google Scholar]
- Maani, K. System dynamics and organizational learning, System Dynamics. In Encyclopedia of Complexity and Systems Science; Meyers, R., Ed.; Springer: Berlin, Germany, 2020; ISBN 978149398790. [Google Scholar]
- Andrade, H.; Dyner, I.; Espinosa, A.; López, H.; Sotaquirá, R. Pensamiento Sistémico, Diversidad en Búsqueda de Unidad; Universidad Industrial de Santander: Bucaramanga, Colombia, 2001; ISBN 9589318789. [Google Scholar]
- Schell, J. The Art of Game Design: A Book of Lenses, 2nd ed.; CRC Press: Boca Raton, FL, USA, 2014; ISBN 9780123694966. [Google Scholar]
- Gros, B. Certezas e interrogantes acerca del uso de los videojuegos para el aprendizaje. Comunicación 2009, 7, 251–264. [Google Scholar]
- Fisher, J.; Farré, I.; Dray, A.; Khimashia, N.; Perez, P. Serious games to explore uncertainty of future farms. In Proceedings of the 16th Agronomy Conference 2012, New South Wales, Australia, 14–18 October 2012. [Google Scholar]
- Pressman, R. Ingeniería del Software, 7th ed.; Mc Graw Hill: Mexico City, Mexico, 2014; ISBN 9786073206037. [Google Scholar]
- Machado, C.; Berger, H. Uso de modelos de simulación para asistir decisiones en sistemas de producción de carne. Rev. Argent. Prod. Anim. 2012, 32, 87–105. [Google Scholar]
- Salinas, J.; Negre, F.; Gallardo, T.; Escandell, C. Modelos didácticos en entornos virtuales de formación: Identificación y valoración de elementos y relaciones en los diferentes niveles de gestión. In Proceedings of the Internation Congress Edutec, Tarragona, Spain, 29 May–1 June 2016. [Google Scholar]
- Richey, R.; Klein, D. Design and development research. In Handbook of Research on Educational Communications and Technology, 4th ed.; Spector, J., Merrill, M., Elen, J., Bishop, M., Eds.; Springer: New York, NY, USA, 2014. [Google Scholar]
- Merriam, S. Qualitative Research. A Guide to Design and Implementation, 4th ed.; Jossey-Bass: San Francisco, CA, USA, 2015; ISBN 9781119003618. [Google Scholar]
- Kruchten, P. The Rational Unified Process: An Introduction, 3rd ed.; Addison-Wesley Professional: New York, NY, USA, 2004; ISBN 03211977704. [Google Scholar]
- Victoria, R.; Utrilla, S.; Santamaría, A. Aprendizaje basado en juegos, una alternativa viable para la enseñanza significativa de la sustentabilidad. Rev. Electrón. Sobre Educ. Media Super. 2017, 7, 4. [Google Scholar]
- Gómez, U.; Orellana, M.; Salinas, J. Apropiación de TI para la toma de decisiones de pequeños productores bovinos—Diagnóstico de ganaderos beneficiarios. In Proceedings of the International Congress Edutec, Lima, Peru, 23–25 October 2019. [Google Scholar]
- Gómez, U.; Orellana, M.; Salinas, J. Systems dynamics and serious video games in an appropriation strategy of a decision support system of small bovine producers. Int. J. Interact. Mob. Technol. 2020, 14, 4–24. [Google Scholar] [CrossRef]
- Andrade, H.; Lince, E.; Hernández, E.; Monsalve, A. Evolución: Herramienta software para modelado y simulación con dinámica de sistemas. Rev. Dinámica Sist. 2011, 4, 1–27. [Google Scholar]
- Ghobakhloo, M.; Hong, T.; Sabouri, M.; Zulkifli, N. Strategies for successful information technology adoption in small and medium-sized enterprises. Information 2012, 3, 36–67. [Google Scholar] [CrossRef] [Green Version]
- Papadakis, S. Evaluating a game-development approach to teach introductory programming concepts in secondary education. Int. J. Technol. Enhanc. Learn. 2020, 12, 127–145. [Google Scholar] [CrossRef]
- Lundström, C.; Lindblom, J. Considering farmers’ situated knowledge of using agricultural decision support systems (AgriDSS) to foster farming practices: The case of CropSAT. Agric. Syst. 2018, 159, 9–20. [Google Scholar] [CrossRef]
- Somers, S.; Stapleton, L. E-Agricultural innovation using a humancentred systems lens, proposed conceptual framework. AI Soc. 2014, 29, 193–202. [Google Scholar] [CrossRef]
- Hancock, D.; Algozzine, B. Doing Case Study Research: A Practical Guide for Beginning Researchers; Teachers College Press: New York, NY, USA, 2017; ISBN 9780807758137. [Google Scholar]
- Jaime, R. Modelamiento semántico con Dinámica de Sistemas en el proceso de desarrollo de software. Rev. Ibérica Sist. Tecnol. Inf. 2012, 10, 19–33. [Google Scholar]
- Knox, K. Constructing an ‘Information Strategy’ in Higher Education: Perceptions, Structure and Action. Ph.D. Thesis, Nottingham Trent University, Nottingham, UK, March 2015. [Google Scholar]
- Featherston, C.; Doolan, M. Using system dynamics to inform scenario planning: A case study. In Proceedings of the 31st International Conference of the System Dynamics Society, Cambridge, MA, USA, 21–25 July 2013. [Google Scholar]
- Protil, R.; Barreiros, R. Strategic control of agro-industrial cooperatives: A strategic map proposal. In Proceedings of the 30th International Conference of the System Dynamics Society, St. Gallen, Switzerland, 22–26 July 2012. [Google Scholar]
- Basu, S.; Sushanta, M. When does growth trickle down to the poor? The Indian case. Camb. J. Econ. 2007, 32, 461–477. [Google Scholar] [CrossRef]
- Siregar, P.; Supriatna, J.; Koestoer, R.; Harmantyo, D. System Dynamics Modeling of Land Use Change in West Kalimantan, Indonesia. Biotropia Southeast. Asian J. Trop. Biol. 2018, 25, 103–111. [Google Scholar] [CrossRef]
- Shikuku, K.; Valdivia, R.; Paul, B.K.; Mwongera, C.; Winowiecki, L.; Läderach, P.; Herrero, M.; Silvestri, S. Prioritizing climate-smart livestock technologies in rural Tanzania: A minimum data approach. Agric. Syst. 2017, 151, 204–216. [Google Scholar] [CrossRef]
- Samaniego, R. Serious game as a way to boost self-regulated learning in higher education. Turk. Online J. Educ. Technol. 2017, 20, 625–630. [Google Scholar]
- Amado Pacheco, M.A.; Avila Avila, W.; González Moreno, J.C.; González Lozano, F.A.; Gualdrón Diaz, M.I.; Insuasty Burbano, O.I.; Manrique Estupiñan, R.; Morales Amaya, J.A.; Peña Tinoco, H.; Prada Forero, L.E.; et al. Aspectos Metodológicos para la Construcción de un Modelo Computacional para la Transferencia y Enseñanza en la Agroindustria Panelera. 2018. Available online: https://cutt.ly/TpwEl0T (accessed on 3 June 2020).
- Moras, J. Serious Games: Diseño de Videojuegos con una Agenda Educative; UOC: Barcelona, Spain, 2015. [Google Scholar]
- Kessler, A. Be an African Farmer in the Game African Highland Farmer. 2016. Available online: https://cutt.ly/4pwIxmt (accessed on 12 May 2020).


| # | Event | Simulation Model | Serious Video Game | DSS |
|---|---|---|---|---|
| 1 | Weigh | X | X | X |
| 2 | Insemination | X | X | X |
| 3 | Birth | X | X | X |
| 4 | Milk | X | X | X |
| 5 | Medication | X | X | X |
| 6 | Buying | X | X | X |
| 7 | Selling | X | X | X |
| 8 | Dying | X | X | X |
| 9 | Feeding | X | X | |
| 10 | Hydrating | X | X |
| # | Loop | Description |
|---|---|---|
| 1 | Demographics | Capital allows buying animals which grow and change weight and produce milk that is sell to obtain income that increases capital. |
| 2 | Food | Capital allows buying food that is fed to animals so that they improve their milk production or weight. Those milk and this weight can be sold to obtain income that increases capital. |
| 3 | Growth | Animals increase their weight and can be sold, which decreases the number of animals. |
| 4 | Insemination | Empty cow and empty lactating cow with sufficient age are inseminated to have calves. This cycle requires the purchase of insemination rods and it generates outcomes |
| 5 | Sickness | Animals get sick and can die, which reduces the number of animals. |
| 6 | Medicine | Sick animals must receive treatment to heal. This event requires the purchase of medicine, which generates outcomes. |
| 7 | Outcomes | Outcomes reduce capital. They are generated when paying for food, insemination rods, medicines, or fixed expenses. |
| 8 | Reproduction | The cycle starts by buying an empty cow. When it is inseminated, it changes status to pregnant cow. Nine months later, the cow gives birth and changes status to cow at rest for a few days. After the resting days the cow changes status to empty lactating cow, and can be inseminated again to become a pregnant lactating cow. Some months before giving birth the cow stops being milked and the cycle starts again. This cycle can be repeated depending on the condition of the animal. |
| 9 | Breeding | The Pregnant Cow gives birth to a calf. When calves grow, they become Empty Cows. |
| # | Purposes | Sessions | Results |
|---|---|---|---|
| 1 | To create a theoretical framework on bovine production systems, System Dynamics, serious video games, and DSS. To review published sources on the topics of interest. | Base knowledge on animal husbandry Systematic review paper based on articles from Scopus and Web of Science Definition of the scope of the tools | |
| 2 | To develop the preliminary versions of the simulation model, the serious video game, and the DSS based on the created theoretical framework. | Initial version of the model, the video game, and the DSS | |
| 3 | To identify the socioeconomic status of the farmers and the degree of their appropriation of IT, the characteristics of the participants’ farms and the scope of the model by identifying new variables and loops. | 1 | Instruments for defining characteristics Definition of the characteristics of the farmers and their productive systems |
| 4 | To present the preliminary version of the model to the farmers, as well as invite them to participate in the collaborative construction of an updated model. | 2 | Suggestions from the farmers to improve the model (variables, structure, equations). |
| 5 | To update and validate the tools based on the farmers‘ suggestions. | Updated versions of the tools | |
| 6 | To show the serious video game through challenge-oriented playthroughs in which the farmer must make decisions on the simulated farm based on the initial money and set conditions. | 3 | The farmers recognize the model. Challenges (conditions) for the game. Skill of the farmers when playing. Understanding the complexity of the production system using the game and the DSS with a common language. |
| 7 | To show the DSS to the farmers and motivate them to check reports about the decisions made while playing the serious video game. To ask the farmers questions they need to answer based on the DSS. The model can be used as a reference while using the DSS so that the farmers understand how to use it and its usefulness. | 4 | Questions about the farmers’ decisions. Awareness of the need to use the DSS to answer questions about the processes. |
| 8 | The farmers use the DSS with aid of the tutor to administer their real farm. | 4 | Production reports about the animals, the processes, and the forecasts. |
| 9 | The farmers use the DSS autonomously (without the aid from the tutor) on their real farms. | ||
| 10 | To measure appropriation based on usage reports from the DSS (parallel to phase 9). Poll the farmers about their acceptance of the DSS or their abandonment of the strategy according to their degree of appropriation | 1 | Tracking reports. Results of acceptance of the DSS and abandonment of the strategy. Measurements of the achieved levels of appropriation. |
| # | Productive System | Categories of Animals 1 | Number of Days Per Year to Record Data | ||||||
|---|---|---|---|---|---|---|---|---|---|
| Calf | Cow | Steer | Weight 2 | Inseminate | Birth 3 | Milking 4 | Medication 5 | ||
| 1 | Breeding | X | 12 | ||||||
| X | * | 1 | |||||||
| 2 | Fattening | X | 12 | ||||||
| 3 | Dairy | X | 12 | ||||||
| X | * | 1 | 1 | 270 | |||||
| 4 | Full cycle | X | 12 | 1 | |||||
| X | * | 1 | 270 | ||||||
| X | 12 | ||||||||
| # | Community | Number of Farmers | Number of Farmers with Appropriation >= 37.5% | Percentage of Appropriated Farmers | Percentage of Appropriation of Each Farmer |
|---|---|---|---|---|---|
| 1 | La Fortuna (Lebrija) | 7 | 2 | 29% | 56% and 69% |
| 2 | La Vega (Valle de San José) | 7 | 2 | 29% | 59% and 61% |
| 3 | Portugal (Lebrija) | 8 | 3 | 38% | 58% and 60% and 62% |
| 4 | San Lorenzo (Lebrija) | 5 | 2 | 40% | 64% and 63% |
| 5 | San Mateo (Betulia) | 5 | 2 | 40% | 67% and 75% |
| Total | 32 | 11 | - | - | |
Publisher’s Note: MDPI stays neutral with regard to jurisdictional claims in published maps and institutional affiliations. |
© 2020 by the authors. Licensee MDPI, Basel, Switzerland. This article is an open access article distributed under the terms and conditions of the Creative Commons Attribution (CC BY) license (http://creativecommons.org/licenses/by/4.0/).
Share and Cite
Gómez-Prada, U.; Orellana-Hernández, M.; Salinas-Ibáñez, J. Strategy for the Appropriation of a DSS in Small Bovine Producers Using Simulation and a Serious Video Game. Information 2020, 11, 566. https://0-doi-org.brum.beds.ac.uk/10.3390/info11120566
Gómez-Prada U, Orellana-Hernández M, Salinas-Ibáñez J. Strategy for the Appropriation of a DSS in Small Bovine Producers Using Simulation and a Serious Video Game. Information. 2020; 11(12):566. https://0-doi-org.brum.beds.ac.uk/10.3390/info11120566
Chicago/Turabian StyleGómez-Prada, Urbano, Martha Orellana-Hernández, and Jesús Salinas-Ibáñez. 2020. "Strategy for the Appropriation of a DSS in Small Bovine Producers Using Simulation and a Serious Video Game" Information 11, no. 12: 566. https://0-doi-org.brum.beds.ac.uk/10.3390/info11120566