Repeated Usage of an L3 Motorway Chauffeur: Change of Evaluation and Usage

WIVW GmbH, 97202 Veitshöchheim, Germany
*
Author to whom correspondence should be addressed.
Information 2020, 11(2), 114; https://0-doi-org.brum.beds.ac.uk/10.3390/info11020114
Submission received: 8 January 2020
/
Revised: 12 February 2020
/
Accepted: 14 February 2020
/
Published: 18 February 2020
(This article belongs to the Special Issue Test and Evaluation Methods for Human-Machine Interfaces of Automated Vehicles)
Abstract
:Most studies on users’ perception of highly automated driving functions are focused on first contact/single usage. Nevertheless, it is expected that with repeated usage, acceptance and usage of automated driving functions might change this perception (behavioural adaptation). Changes can occur in drivers’ evaluation, in function usage and in drivers’ reactions to take-over situations. In a driving simulator study, N = 30 drivers used a level 3 (L3) automated driving function for motorways during six experimental sessions. They were free to activate/deactivate that system as they liked and to spend driving time on self-chosen side tasks. Results already show an increase of experienced trust and safety, together with an increase of time spent on side tasks between the first and fourth sessions. Furthermore, attention directed to the road decreases with growing experience with the system. The results are discussed with regard to the theory of behavioural adaptation. Results indicate that the adaptation of acceptance and usage of the highly automated driving function occurs rather quickly. At the same time, no behavioural adaptation for the reaction to take-over situations could be found.
1. Introduction
As discussed in the media, vehicle manufacturers plan to introduce (partly-) self-driving cars in the (near) future. According to the classification of the Society of Automobile Engineers (SAE) [1], drivers will be allowed to use the time while the system is active for non-driving related activities (NDRAs) starting from level 3 automation onwards (L3, conditional automation). By definition, in L3, all aspects of the driving task are executed by the automated driving system (ADS). Consequently, with L3 ADS, the role of the driver fundamentally changes when compared to manual driving. Even though the driver remains the fall-back option in the event of system limits, there is no need to monitor the driving environment or the system’s performance while the ADS is driving. The driver is allowed to engage in NDRAs, such as browsing the internet or watching movies. However, in the event of a take-over request (TOR) by the system, the driver has to be able to retake control of the vehicle within a certain time frame. Therefore, from the driver’s perspective, L3 is the first level of automation where vehicle automation can be experienced as completely self-driving within system boundaries with all the expected benefits.
The H2020 EU-funded project L3Pilot deals with L3/L4 vehicle automation (https://www.l3pilot.eu/). The overall objective of L3Pilot is to test and study the viability of automated driving as a safe and efficient means of transportation and to explore and promote new service concepts to provide inclusive mobility. Besides testing and evaluating current prototype versions of L3/L4 functions in on-road rests, one part of the project deals with the change of drivers’ acceptance and usage of L3/L4-systems with repeated usage. Due to the real-world systems still being at a prototype stage, this cannot be done in on-road tests, e.g., due to safety reasons. Instead, a study in a driving simulator is conducted in which drivers have the possibility to use an L3-motorway ADS during several drives. The main goals of this study are to gain insight into the change of user attitudes and trust with repeated experience of an L3-function, to identify user and situational factors that affect driver behaviour and acceptance and to investigate changes in driver behaviour in terms of engagement in non-driving related activities, take-over performance and mode awareness.
1.1. Behavioural Adaptation
With increasing vehicle automation, the role of the driver changes fundamentally. On a technological level vehicle automation is progressing rapidly. Still, there are challenges regarding the interaction between human drivers and automated systems. This includes the impact of automated systems on the driver’s mental workload, situation awareness and acceptance of automated driving, as well as trust and reliance issues [2]. Another important aspect that has to be considered is that drivers may change their behaviour due to automation. This phenomenon is referred to as “behavioural adaptation”, which is defined as “behaviours which may occur following the introduction of changes to the road–vehicle–user system and which were not intended by the initiators of the change” [3]. It is known that in the past, many road safety measures did not have the expected safety benefit in terms of a decrease in accidents. It is argued that drivers react to a lower safety risk, for instance, by increasing their traffic intensity and increasing their travel speed [4]. The first theory explaining changes in driver behaviour following changes in the vehicle or road infrastructure was the theory of risk homeostasis [5]. The theory assumes that individuals have a target level of accepted risk in driving situations and that they adjust their behaviour such that the perceived level of risk matches their target level of risk. After the introduction of safety-promoting vehicle technology, drivers might increase risky driving behaviour to adjust their perceived level of risk to their original target level. More recent theories shift away from the concept of ‘risk perception’ as an underlying mechanism. Two more recent models of behavioural adaptation might explain drivers’ behaviour when using advanced driver assistance systems (ADAS) or ADSs: The driver-in-control model [6] considers the driver and the vehicle as a unit, the joint driver–vehicle system. The model describes a cycle of intentions, actions and outcomes. The probably most applicable model in the context of automated driving is the qualitative model of behavioural adaptation [7] which is specially designed to explain behavioural adaptation to in-vehicle driver assistance systems. One main factor in this model is trust in the system. Trust is affected by the driver’s personality (especially the variables locus of control and sensation-seeking). The model seems highly applicable since there is evidence suggesting that trust is one of the main factors in driver behaviour when using ADSs [8,9].
The manifestation of behavioural adaptation highly depends on system functionality. For instance, it was found that when using adaptive cruise control (ACC), drivers reacted more slowly to a hazardous situation and had a greater deviation from lane position than when driving without ACC [7] and that drivers increased their maximum speed when provided a congestion tail. In addition, drivers’ engagement in a secondary task increased when driving with a congestion tail warning system [10].
Compared to the investigation of behavioural adaptation for ADAS, a slightly different approach needs to be chosen for studying behaviour adaptation for ADSs. During automated driving, driving parameters such as speed or steering behaviour do not depend on the driver but rather on the system implementation. Hence, simply comparing these parameters when using the system compared to manual driving is not applicable. Therefore, other indicators need to be defined to measure behavioural changes to highly ADS, e.g., in terms of lane choice and secondary task engagement [11]. It is also reported that drivers visually focus less on the centre of the road when driving in the automated mode.
For ADAS, six more high-level categories of changes in drivers’ behaviour are proposed to study behavioural adaptation [12]. Those categories seem relevant when investigating behavioural adaptation to ADSs, too. Behavioural changes are defined in terms of:
- Perceptive changes (seeing, hearing, feeling).
- Cognitive changes (comprehending, interpreting, prioritizing, selecting, deciding).
- Performance changes (driving, system handling, error).
- Driver state changes (attentiveness/awareness, workload, stress, drowsiness).
- Attitudinal changes (acceptance, rejection, overreliance, mistrust).
- Changes in the adaptation to environmental conditions (weather, visibility, etc.).
It can be hypothesized that behavioural changes on different levels are interconnected. An increase in trust in the ADS (attitudinal change—acceptance), for instance, may lead to a higher willingness to engage in secondary activities (cognitive change—prioritizing), which could then lead to a decreased perception of the environment (driver state changes—attentiveness) or a decreasing performance in case of a TOR (performance changes—driving). Such links must be considered in the assessment of behavioural adaptation to ADSs.
1.2. Usage and Evaluation of ADS
One of the major preconditions of acceptance and usage of ADSs is the drivers’ trust in the system. If drivers do not trust the automation, they will not use it (disuse). On the other hand, if drivers over-rely on the automated system, this might lead to decision errors, for example, in terms of not responding appropriately to takeover requests (TOR) [13]. Increasing acceptance of ADSs can already be found after the first drive. Drivers who have experienced crashes or safety-critical situations report lower trust levels [9]. Trust is therefore closely tied to the perceived reliability of an automated system. If the perceived reliability increases, trust is likely to increase as well.
The acceptance of ADS is also highly related to its perceived usefulness. The perceived usefulness of an ADS for the user might increase along with the increasing automation level. When drivers are not required to monitor the system’s performance and are allowed to engage in other activities, they will perceive the system as more useful. Several surveys have been conducted on the NDRAs which drivers want to engage in while driving in the automated mode. The perceived usefulness of the ADS depends on the extent to which drivers are able to perform these activities [14]. NDRAs that drivers would like to engage in include eating, interacting with passengers, phoning, observing the scenery, emailing, etc. [15].
Another relevant aspect arises from the rather passive role of the driver while driving with the ADS: fatigue or sleepiness. Due to the monotony of the situation, while being driven by the car, drivers experience fatigue much earlier than in manual driving and at much higher levels [11,16]. The generation of fatigue during highly automated driving might in extreme cases even cause the driver to fall asleep while driving in automated driving (AD) mode. In a simulator study on the assessment of trust in automation, two participants fell asleep while driving in AD mode [9].
1.3. Change with Repeated Usage
Studies investigating user experiences of ADAS and ADSs mostly assess the drivers’ behaviour and attitudes when they first encounter the new technology. In most studies, for practical reasons, only the first 1–2 h of using a new technology is investigated. However, it is likely that after a certain time of using and experiencing the behaviour of the system in various use cases, drivers will adapt their behaviour accordingly. However, changes with repeated usage are assessed very rarely since this is rather complex and expensive.
Theories on behavioural adaptation distinguish different phases: The learning process is crucial for drivers to gain an appropriate understanding of the system’s functionality as well as system limits and helps to build an appropriate level of trust. The learning process takes some time and requires an experience of the system in different situations and different environments. Two phases in the learning process are suggested: in the “learning phase”, the driver learns how to operate the system, identifies system limits and internalizes the system functionality. The learning phase heavily depends on the way the system is introduced to the driver. In the second stage, the “integration phase”, the driver integrates the system into the management of the overall driving task by increasing experience in different situations [17].
When testing ADAS in the AIDE project [17], the focus was on directly observable behavioural changes due to the ADAS, mainly in terms of changes in driving parameters. However, when assessing L3 ADS, the approach must be adapted. Since the vehicle is controlled by the ADS most of the time, changes in human driving behaviour can only be assessed to a limited extent. However, attitudes towards automation can change dramatically over time, for instance when experiencing the system in different traffic situations.
The term ‘behavioural adaptation’ is said to have an inherent association with time because it suggests that changes in behaviour are a result of being exposed to e.g., a certain ADAS/ADS and experiencing it in different situations [18]. From a methodological point of view, it is therefore crucial not only to consider a single usage of a system but sufficiently long exposure. The question is: How long is long enough to capture behavioural adaptation? For the investigation of ADAS (like ACC or lane departure warnings), a few hours to a few weeks are considered to be short-term usage whereas long-term usage is meant to last at least 6 months [18].
In another approach, five phases of behavioural adaptation to ADAS are distinguished with defined durations [12]:
- First encounter: First day (1–6 h).
- Learning: 3–4 weeks.
- Trust: 1–6 months.
- Adjustment: 6–12 months.
- Readjustment: 1–2 years.
The First encounter phase depends greatly on how intuitive and self-explaining the human-machine interface (HMI) is. The Learning phase still depends highly on the HMI, especially in terms of required system input. The timely dimension of the learning phases is empirically supported by studies on e.g., electronic speed control [7]. The Trust phase is mainly characterized by a shift in the locus of control [19] from the driver to the vehicle. Related problems might be overreliance, passivity and drowsiness. In the phases Adjustment and Readjustment, drivers adjust their adapted behaviour depending on their experience of (critical) situations and system limitations. It can be expected that trust plays an important role in the behavioural adaptation to ADS and indeed, for the overall acceptance of the system. According to Muir [20], trust depends on the degree of experience with automation and thus can be expected to change over time.
The durations given in the literature for the different phases of behavioural adaptation relate to the time period during which an equipped vehicle is available to the driver and the system can be used. The required period of actual system usage can be expected to be much less. From the literature, it is not known how many hours of driving with an active system or how many occurrences of a certain system intervention/warning is needed to study behavioural adaptation. For our research, it also has to be considered that the phases defined in Martens and Jenssen [12] refer to behavioural adaptation to ADAS, not to ADSs. The learning phase for a system that only intervenes very occasionally can be expected to be much longer than for a system whose behaviour can be experienced continuously by the driver. For ADSs, it can be expected that the learning process is much faster. It seems likely that the phases of behavioural adaptation defined by Martens and Jenssen [12] only give a rough estimate and do not apply for behavioural adaptation to high automation.
One study is known that investigated secondary task engagement during highly automated driving with a repeated usage perspective. Six drivers were invited to undertake five 30-min journeys with a highly automated system in a driving simulator. They were encouraged to use the system just as they would in a real automated vehicle. Participants were asked to bring with them any objects or devices that they would be willing to engage with during the drives. The most common activities during the drives were reading articles or magazines, using mobile devices for social networking activities, web browsing and watching programmes or films on a laptop. Although the study was set up with a focus on repeated usage, no findings on changes in behaviour over time were reported [21].
1.4. Objective
In summary, there is literature that discusses the concept of behavioural adaptation especially with the focus of usage of ADAS. But even for ADAS, studies investigating behavioural adaptation are rare, probably due to the fact that such research is time-consuming and expensive. For L3/L4-ADSs it seems reasonable to assume that behavioural adaptation will have a relevant impact e.g., on function usage as soon as there are functions on the market. Nevertheless, experimental results are still lacking on that topic. The aim of our research is to study behavioural adaptation to an L3 motorway ADS with repeated usage. The focus is on
- Attitudinal changes, that is the change of e.g., acceptance and trust measured via questionnaires.
- Cognitive changes, that is the change of prioritizing and selecting side tasks, measured via indicators derived from driver behaviour and via questionnaires.
- Driver state changes, that is the change of attentiveness/awareness, stress, drowsiness, measured via objective indicators and via questionnaires.
- Performance changes, that is the change of system handling in take-over situations measured via objective indicators and via questionnaires.
Due to practical limitations, it is not possible to study the full process of behavioural adaptation where changes are still expected to occur even after several months. Instead, the focus is on the beginning of this process including the first encounter, the learning phase and maybe the beginning of the trust phase. It is expected that during the learning phase there is still some change of behaviour. For the trust phase, a more constant level is expected.
2. Materials and Methods
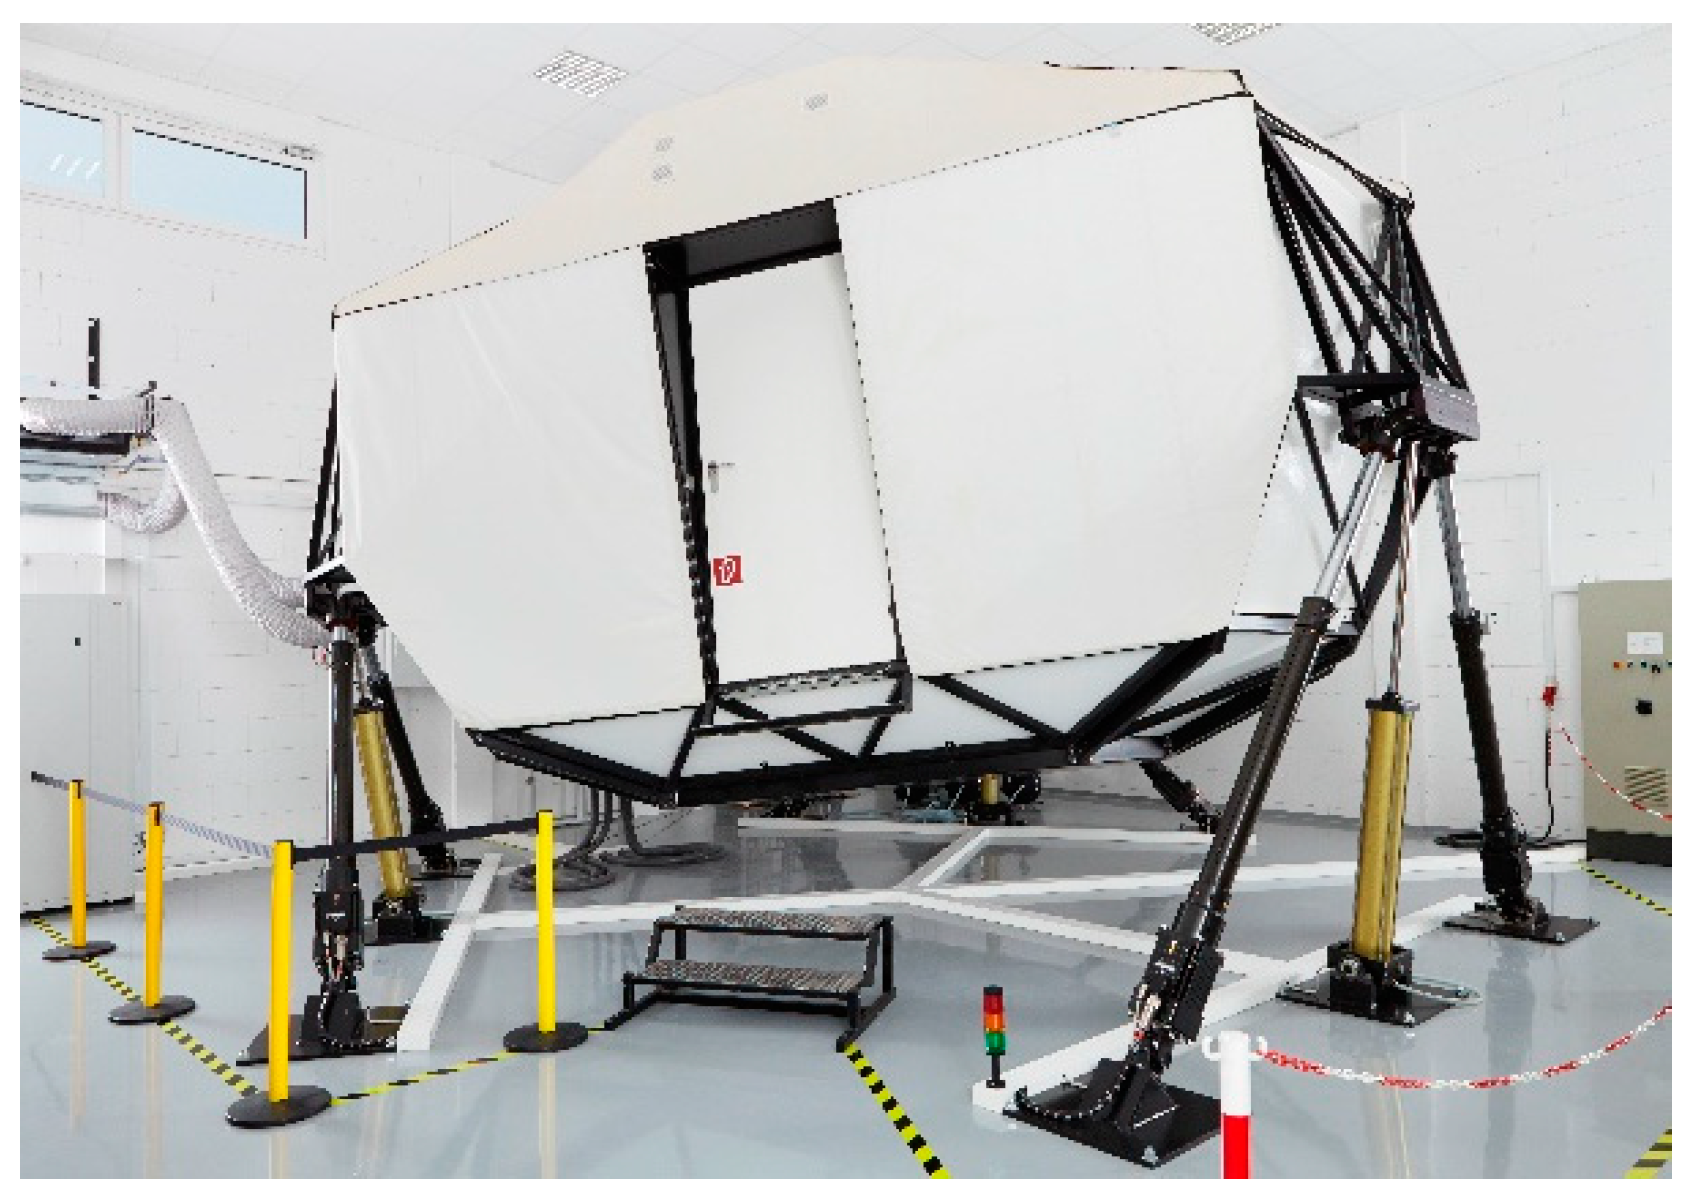
The study was conducted in the high-fidelity moving base driving simulator of the WIVW GmbH (see Figure 1). The mock-up consisted of a production type BMW 520i. The motion system used six degrees of freedom and could display a linear acceleration up to 5 m/s². All vehicle dynamics and noises were displayed realistically. The simulation software was SILAB® Version 6.0 (WIVW GmbH, Veitshöchheim).
Drivers were invited to participate in a study on the long-term effects of an L3-motorway ADS (L3ADS). The study consisted of six drives on a motorway during which the L3ADS could be used. The drives took place on six different days. In all drives, the drivers were free to use the L3ADS as they liked, meaning they could activate and deactivate it and attend to NDRAs as they wished. Drivers were instructed that while in the automated mode, they were not required to pay attention to the driving task and they were allowed to engage in other activities. However, when the system issued a TOR, they had to retake the vehicle guidance and were responsible for the driving task. For the description of the system and the responsibility of the driver, the actual wording of §1b of the German Road Transport Law [22] defining the responsibility of the driver when driving with an ADS, was used.
2.1. System Implementation
The study focused on acceptance, evaluation and usage of an L3ADS by ordinary, non-professional drivers. Therefore, participants tested a simulated L3ADS that worked realistically in the motorway scenarios included in the six test drives. The system was implemented based on the descriptions of L3 motorway systems to be tested in the on-road tests of L3Pilot [23]. It was designed to work in the driving scenarios tested in the study by using controllers already available in SILAB®.
The L3ADS had an operational design domain (ODD) that is similar to the ODD of highway ADSs tested in the on-road experiments in L3Pilot [23]:
- The implemented L3ADS had a speed range of 0 to 130 km/h. The system adopted the driven speed to the surrounding traffic as well as to speed limits along the road. This means that the system set the maximum speed situationally adapted based on the current speed limit and in sections with no speed limit, the system kept a maximum speed of 130 km/h. In case a lead vehicle was present, the system obtained a safe distance to the lead vehicle and adjusted speed accordingly. The regulation of speed and distance was based on a standard ACC-controller implemented in SILAB®.
- The system was able to execute lane changes automatically. Lane changes to the left were initiated when a slower vehicle was detected on the own lane and the adjacent lane on the left was free. The vehicle changed lanes back as soon as slower vehicles were passed and the lane to the right was free again. For decisions on lane changes, a simple controller was used that was tuned in a way that in the implemented experimental drives the behaviour of the ADS seemed reasonable and felt smooth. The trajectory during a lane change was defined such that the lane change itself felt smooth; the trajectory was not situationally adapted.
- The following situations were outside the ODD and therefore led to a TOR: highway exits and entries, construction sites, adverse weather conditions (i.e., heavy rain) and missing lane markings.
- All TORs were issued with a time budget of 15 s (based on take-over times of functions tested in on-road tests in L3Pilot [23]). Although not mandatory for L3-functions, a safe stop manoeuvre was performed in case the driver did not take control back during the take-over time.
2.2. Test Scenarios
Four of the six experimental drives had a duration of 30–35 min (drive 1 to drive 4 in Table 1). In those drives, it was taken care that the driving environment was not too boring and that traffic density and driving situations changed within and between the drives. As can be seen in Table 1, all four drives contained sections with low traffic density and changing speed limits (in three of them also unlimited), in three of the four drives, sections lasting between five and ten minutes with traffic jams occurred. The number of TORs varied between two and five per drive. Reasons for TORs were missing lane markings, approaches to construction sites, highway intersections and at the end of every drive the approach to the exit. Table 2 gives more details on the takeover scenarios. All scenarios were defined in a way that included common non-critical driving situations. Very critical, unusual or rare scenarios were avoided because the focus of the study was on simulating potential everyday usage of the L3ADS.
The two other drives were longer (90 min) and more monotonous, one of them taking place at 6 am in the morning. Those two drives were included to study specific hypotheses on driver state which will be presented elsewhere (in preparation). The order of the drives was varied between participants to avoid sequence effects. The two monotonous drives always took place in the third and the fifth session.
2.3. Data Logging
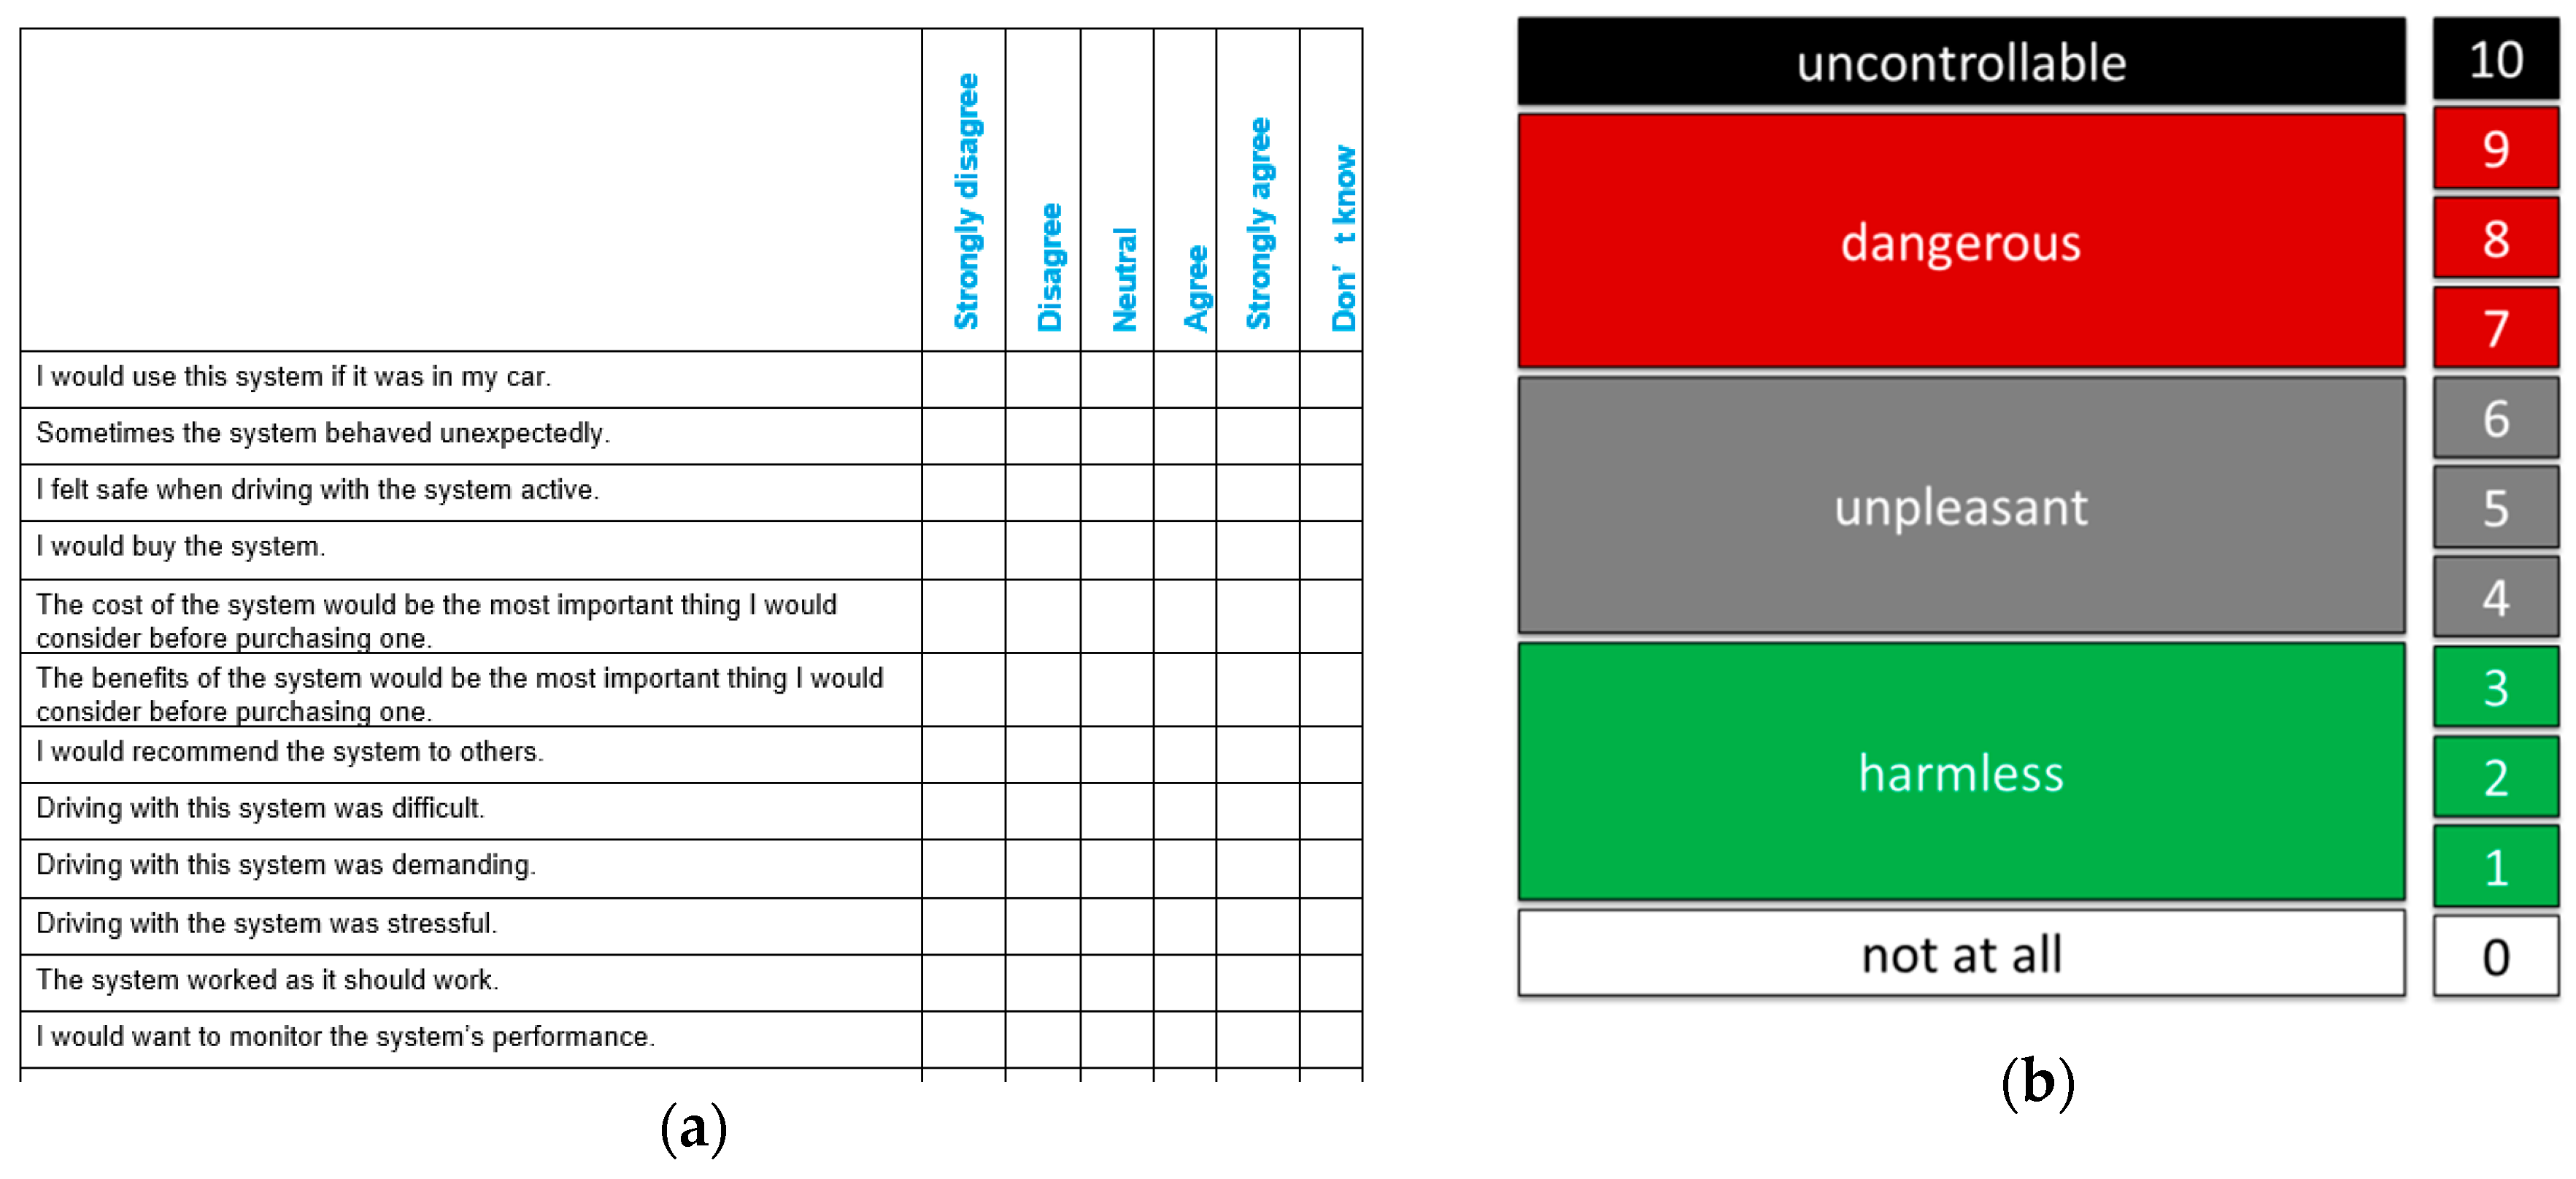
Most methods used were defined in the common methodological approach within L3Pilot and that will also be used for the on-road tests of L3Pilot [24]. This specifically relates to the questionnaire developed within L3Pilot which assesses aspects like acceptance, perceived safety, trust, workload, etc. The questionnaire was designed for on-road tests where drivers have the opportunity to test an L3/L4-system once. It consisted of a pre-drive questionnaire in which demographic information, as well as pre-experiences with in-vehicle systems, were collected. The post-drive questionnaire assessed the evaluation of the tested system through a mixture of standardized items (e.g., [25]) and items specifically tailored to the project questions of L3Pilot. The specifically developed questionnaire items mostly consisted of a statement with which the participants could agree or disagree on a 5-point scale (for example see Figure 2a). In the present study, the pre-drive questionnaire was administered once at the beginning of the first session. The full post-drive questionnaire was filled in after the 1st and the 6th session, a shortened version was used after session two to five. Directly after every TOR, drivers rated the criticality of the previous driving situation on a ten-point scale, ranging from harmless to uncontrollable with intermediate steps of unpleasant and dangerous (based on [26], see Figure 2b). The rating related to the TOR itself and to the following driving scenario (e.g., drive through a construction site).
Furthermore, during all sessions a variety of objective parameters was logged:
- Signals from the driving simulator software that cover the areas of vehicle dynamics (v, ax, ay), state of the L3-system (TORs, system status), vehicle handling (brake pedal position, steering angle, hands-on detection) and vehicle environment (distance to other vehicles, lane position).
- Continuous video recording of the driver and the driving scenery.
- Continuous coding by the experimenter whether participants were engaged in NDRAs, whether the NDRA involved the hands (manual distraction, e.g., through browsing on a smartphone, holding food) and whether drivers closed their eyes for a longer time.
- Gaze and head direction, as well as eyelid-opening level, were logged with the 3-camera gaze tracker Smart Eye Pro® (SmartEye; Gothenburg, Sweden).
2.4. Procedure
In the introductory session, drivers were informed about the schedule for their test drives. Before each session, they knew the length of the oncoming trip and they were informed that they were free to prepare for the drive as they liked to. This meant for instance that they could bring something to read, something to eat or prepare other potential side tasks to fill the time of the automated drive. Besides being free to attend to side tasks as they liked while in automated mode, drivers were also free to use the system as they liked. This meant that they were allowed to override the system or deactivate it in situations where they preferred to drive manually. Table 3 gives an overview of the 6 experimental sessions.
2.5. Sample
The study was conducted with N = 31 drivers (mean age = 37, sd = 11.75); 58% of the sample were male. Nearly 70% of the sample have had their driving license for at least 10 years. In the pre-questionnaire, participants also stated on average that for them driving on a highway is neither difficult nor stressful, but that they also do not enjoy driving on motorways; 42% of the sample stated that they drive on a highway at least 1–2 times per week; 10% that they are stuck in traffic jams on highway with the same frequency of 1–2 times per week. All participants had completed an extensive training for the driving simulator before participating in the study in order to avoid learning effects and simulator sickness.
2.6. Data Analysis
To investigate drivers’ performance in takeover scenarios, two approaches were chosen:
- Reaction times are calculated that are defined as the duration between the start of the TOR and the first time point the analysed driver reaction was observed (eyes on road, hands on the steering wheel and deactivation of the AD).
- Expert rating of takeover performance based on the video. For that the take-over controllability (TOC) rating was performed ([27], for more details see https://toc-rating.de/en/) which defines a standardized procedure for the evaluation of take-over situations. Relevant dimensions for evaluation are provided with defined criteria for the different rating categories. In the end, a final rating is given on a 10-point scale which corresponds to the categories shown in Table 4. Besides the overall rating, detailed information on the observed error types is provided by the method.
Reaction times and TOC-rating were only analysed for situations where drivers took control back after a takeover request was issued by the L3ADS.
For all questionnaire items, general agreement or disagreement was evaluated with single t-tests against zero (meaning neutral on the scale). Results are reported for the evaluation of the system after the first and after the sixth session.
To investigate the behavioural adaptations with repeated usage, the changes over experimental sessions were analysed for the following parameters:
- Agreement with various statements regarding the evaluation of the L3ADS, derived from post-drive questionnaires (see [24]).
- Subjective change of alertness over the drives measured with the Karolinska Sleepiness Scale (KSS, [28]) directly before and after the drives.
- The proportion of time the L3ADS was activated [%] in relation to the time it was available, derived from signals logged in SILAB®.
- The proportion of time with active L3ADS spent on NDRAs [%] and proportion of time with active L3ADS spent on NDRAs with active involvement of the hands [%], derived from table application.
- Subjective criticality of an experienced take-over situation (see [30]).
- Reaction times after a TOR occurred until eyes were on the road, hands on the steering wheel and until control was taken back (ADS deactivated) (sec) (see [30]).
- TOC rating measuring overall take over performance [27].
For statistical testing of the effect of repeated usage, repeated measures ANOVAs were calculated with time (session) as a within-subject factor. To avoid having the effects of repeated usage mixed with effects of drive state (which was experimentally influenced in the two monotonous drives) only the four shorter drives are included in the analysis of behavioural adaptation. These drives always took place in the first, second, fourth and sixth experimental sessions. In the result section, graphs show means and 95% confidence interval.
3. Results
3.1. Evaluation of the L3 Motorway ADS
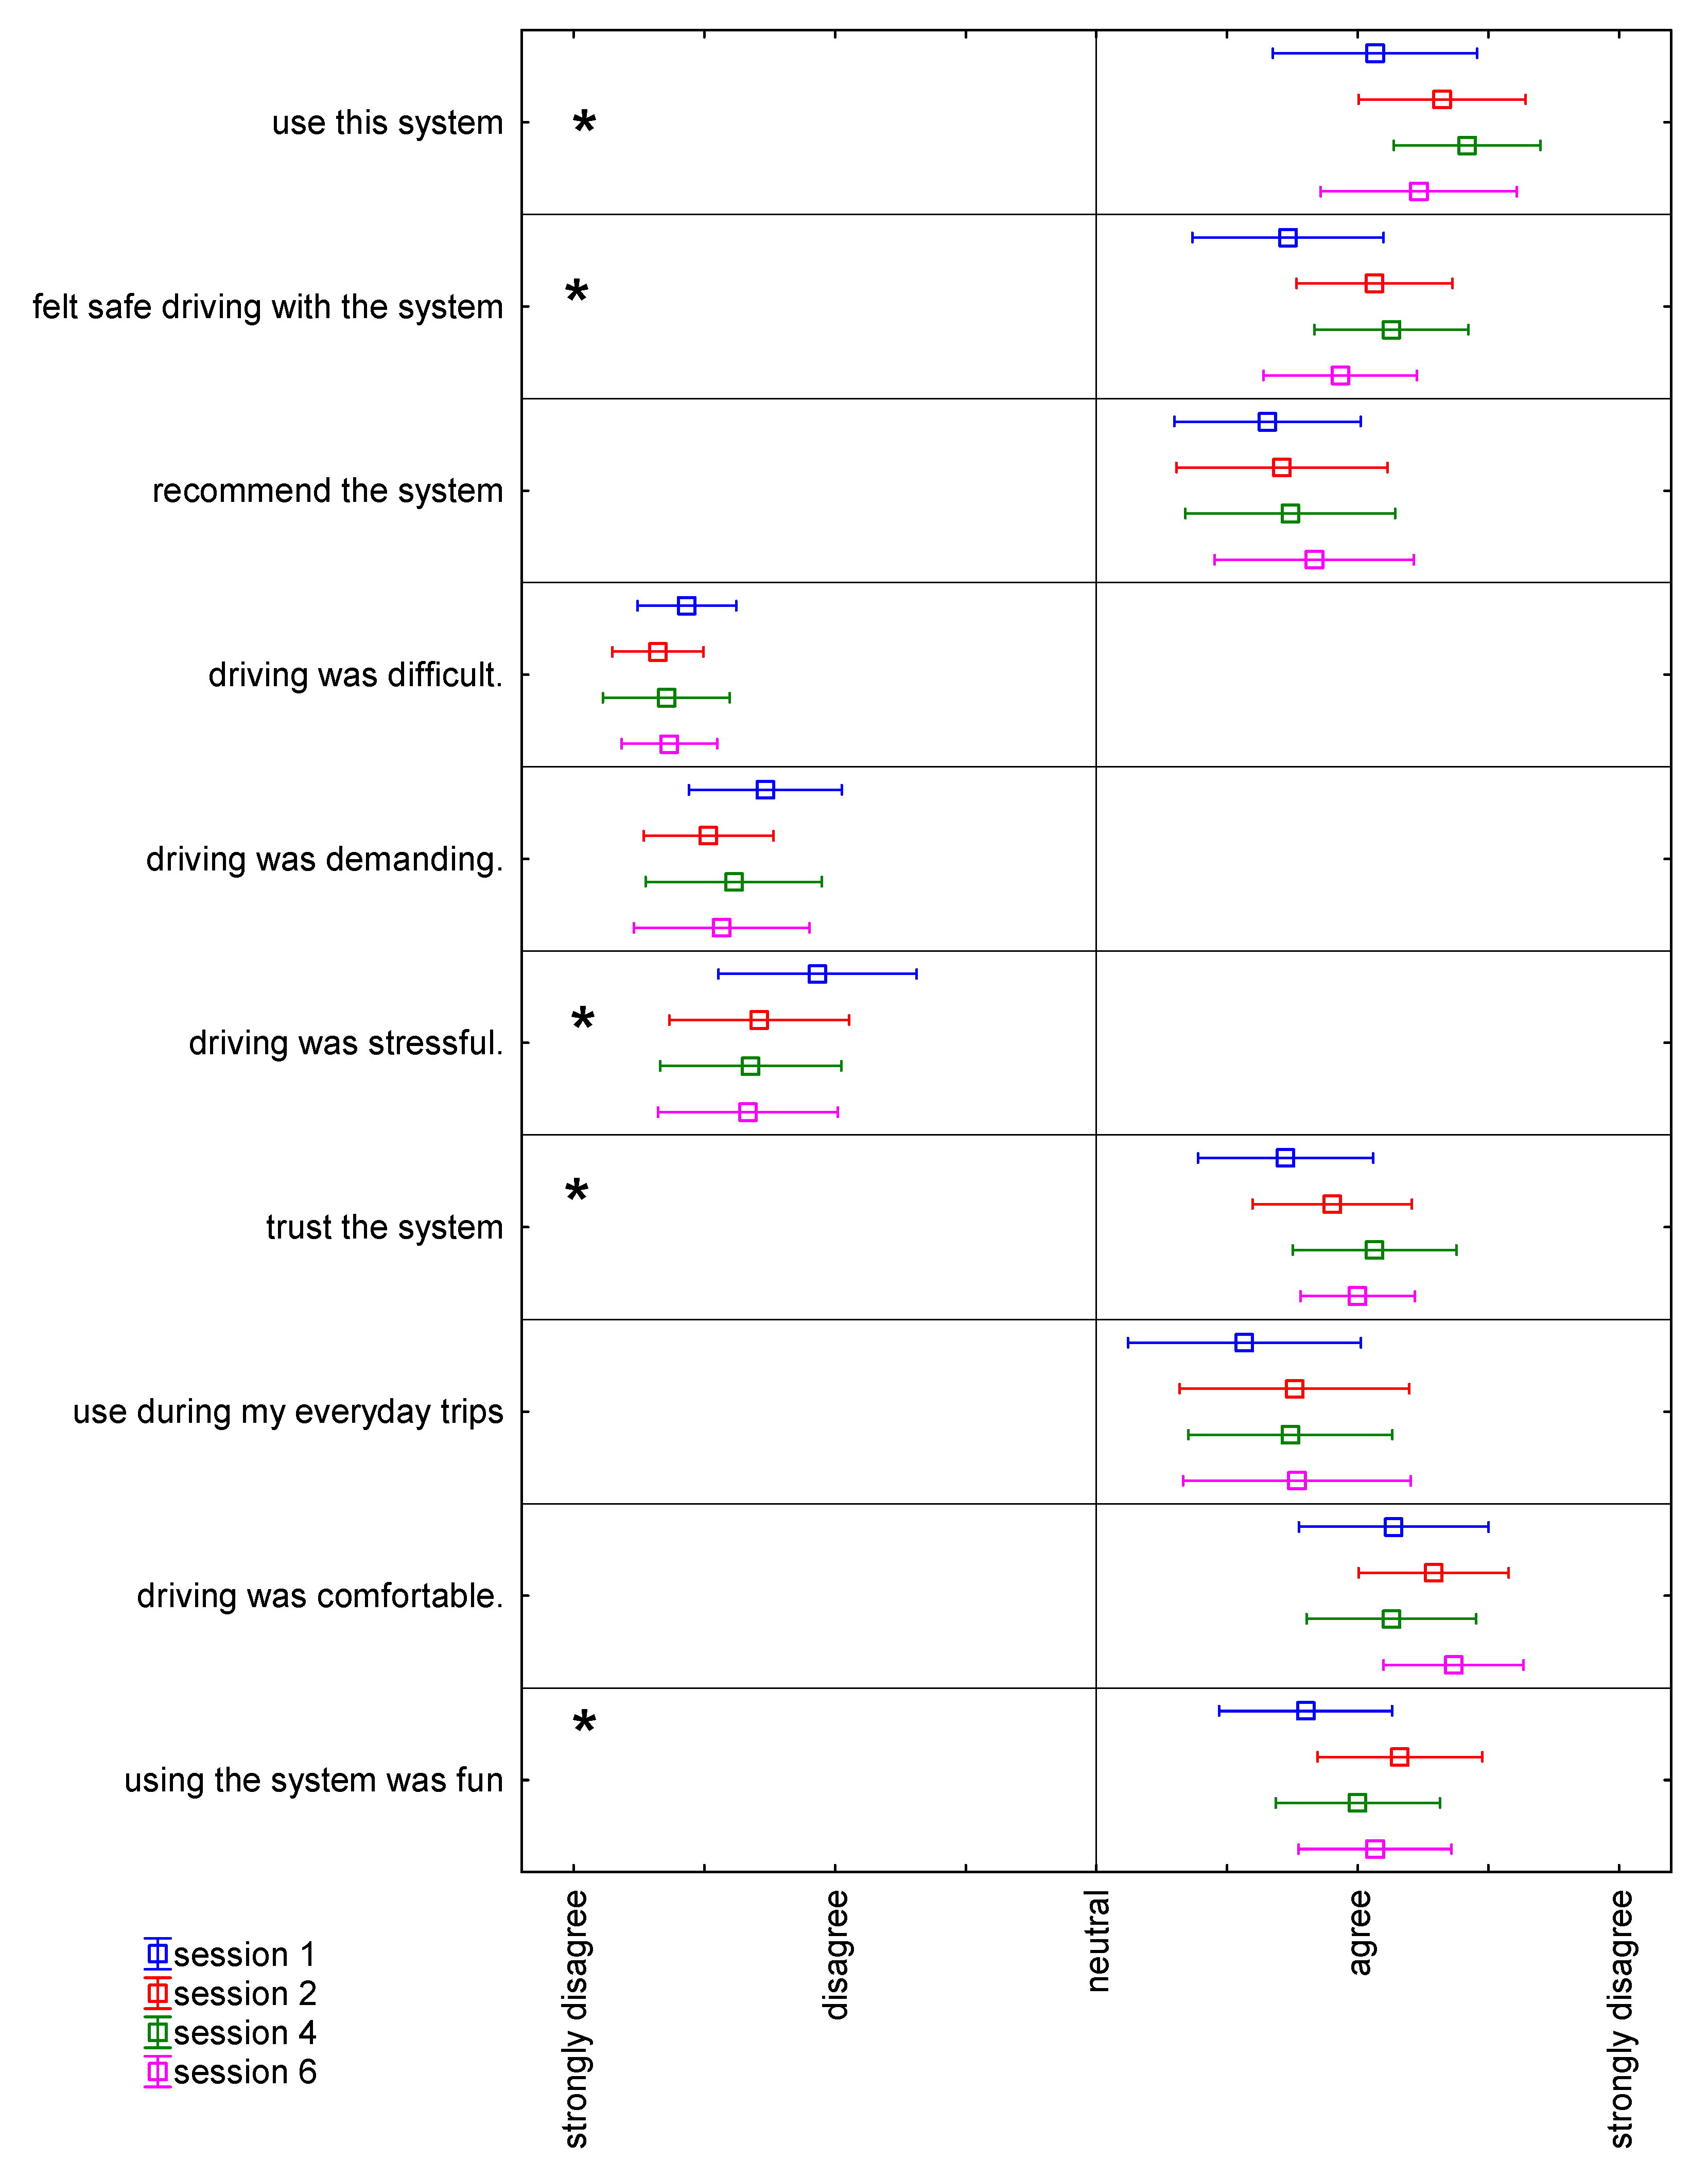
For more general statements about the L3ADS, there is either a general agreement or disagreement (see Figure 3 and Table 5). Drivers state that they would use the system, recommend it and trust it. Furthermore, driving with L3ADS was rated as being comfortable and fun, drivers did not evaluate it as demanding, stressful or difficult and drivers felt safe while driving with the system. Therefore, drivers evaluate L3ADS positively.
A significant change of drivers’ evaluation with repeated usage occurs for the statements “driving was stressful” (F(3, 84) = 2.99, p = 0.03536), “I felt safe driving with the system” (F(3, 84) = 5.54, p = 0.00161), “I trust the system” (F(3, 81) = 3.87, p = 0.01221), “I would use this system” (F(3, 84) = 3.16, p = 0.02882) and “Using the system was fun” (F(3, 84) = 3.06, p = 0.03260). Post-hoc tests show that with repeated usage, there is an increase in trust and driving safety going together with a decrease of subjective stress which is most pronounced during the fourth drive. Afterwards, there is again a decrease of expressed trust. Experienced fun is most pronounced during the second drive.
3.2. Usage of L3 Motorway ADS
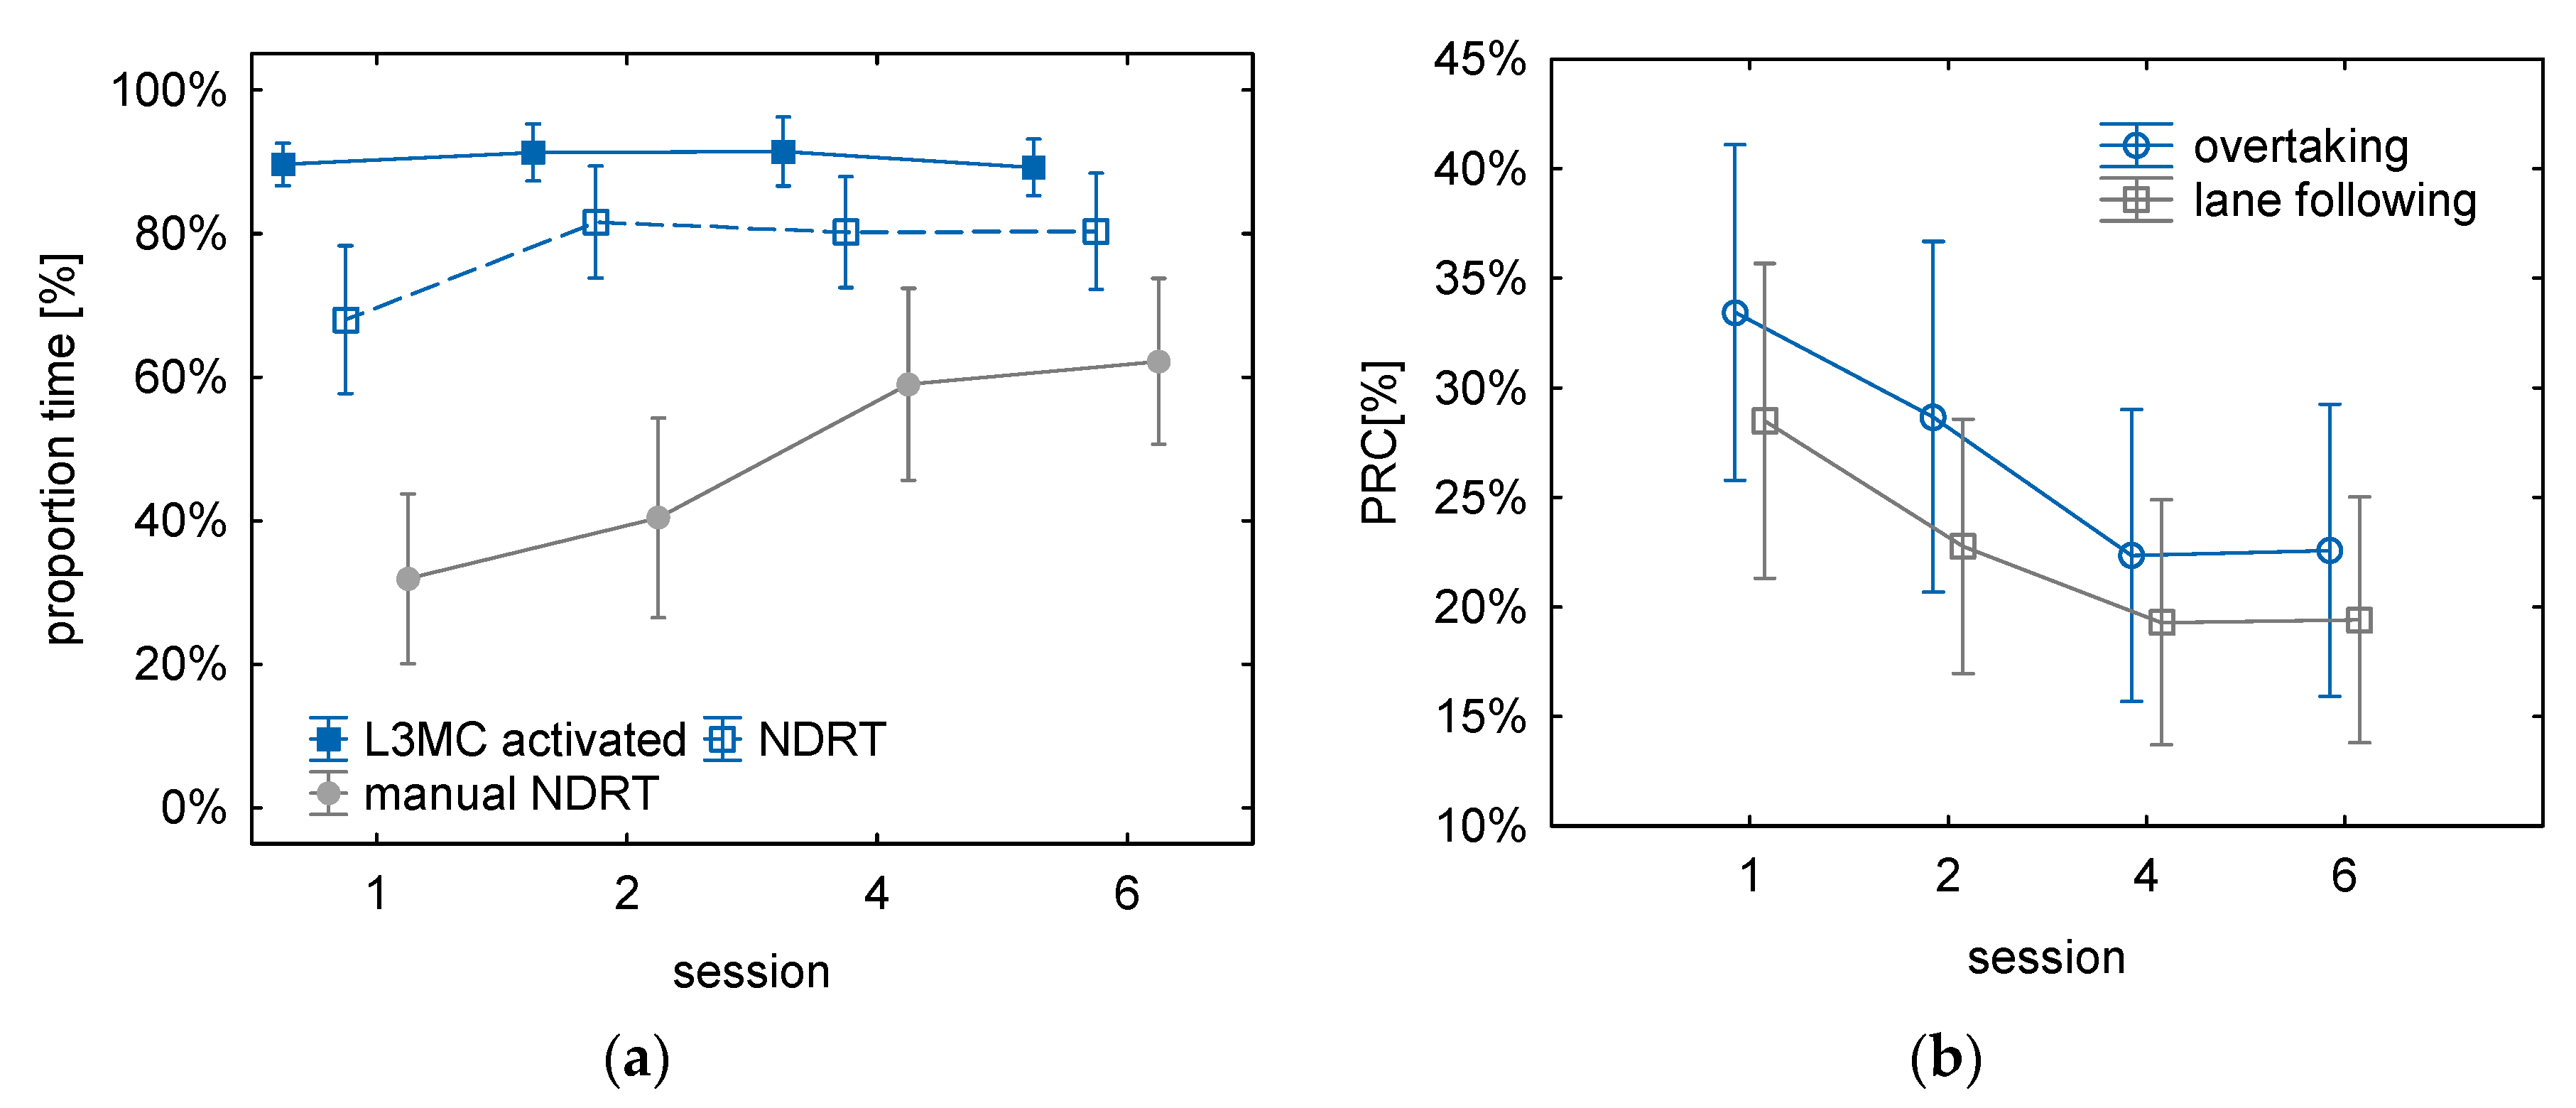
The overall positive evaluation of the system is reflected in system usage: 90% of the time the L3ADS is available it is actually activated (see Figure 4a). There is no change of system activation with repeated usage (F(3, 90) = 1.03, p = 0.38470). Instead, the increase of trust is reflected in a significant increase of engagement in NDRAs (F(3, 90) = 5.87, p = 0.00104) from 68% during the first session to about 80% in the following sessions. The significant increase in manual NDRAs (F(3, 90) = 7.95, p = 0.00009) is even more pronounced; from 32% of driving time in session one, over 40% in session two up to 59% in session four and 63% in session six.
With the increase of manual NDRAs while driving with the L3ADS activated, the proportion of glances directed to the road decreases (F(3, 90) = 5.79, p = 0.00115, see Figure 4a). There is a decrease between sessions one and two and a further decrease during session four. Then, PRC stays at a constant level. PRC decreases from 30% of the time with the system active in session one to 20% in sessions four and six. The decrease is similar for situations where the L3ADS overtakes other vehicles including lane changes and for situations where the L3ADS follows its own lane. However, during overtaking manoeuvres, drivers’ gaze is direct on average during 5% more driving time to the road compared to lane following (F(1, 30) = 12.073, p = 0.00158, see Figure 4b). Therefore, with repeated usage of the L3ADS, the willingness of the drivers increases to engage in other activities and to draw attention away from the driving environment, but situational differences remain unchanged.
3.3. Driver State with L3 Motorway ADS
The measurable behavioural changes are reflected in the subjective evaluation as well (see Figure 5): over the sessions, drivers agreed significantly more strongly with the statement “I use the time to do other activities“ (F(3, 78) = 6.38, p = 0.00063) and significantly less with the statement “I monitored the environment more than in manual driving” (F(3, 84) = 8.40, p = 0.00006). For both statements, the change is most pronounced after the first session.
Drivers agree significantly with the statement “driving with the system would make me tired” (see Table 5). This subjective impression is supported by the comparison of ratings of fatigue assessed with the KSS directly before and after the drives. There is a significant increase of fatigue (F(1, 26) = 17.71, p = 0.00027) of about 0.6 scale points on average for the four drives.
3.4. Take-Over Situations
Drivers agree significantly with the statements “during take-overs I felt safe”, “it was obvious to me why take-over requests occurred”, “take-overs were warned appropriately” and “take-overs were with sufficient time” (see Table 5). For none of the statements on takeover situations, there is a significant change in the evaluation with repeated usage.
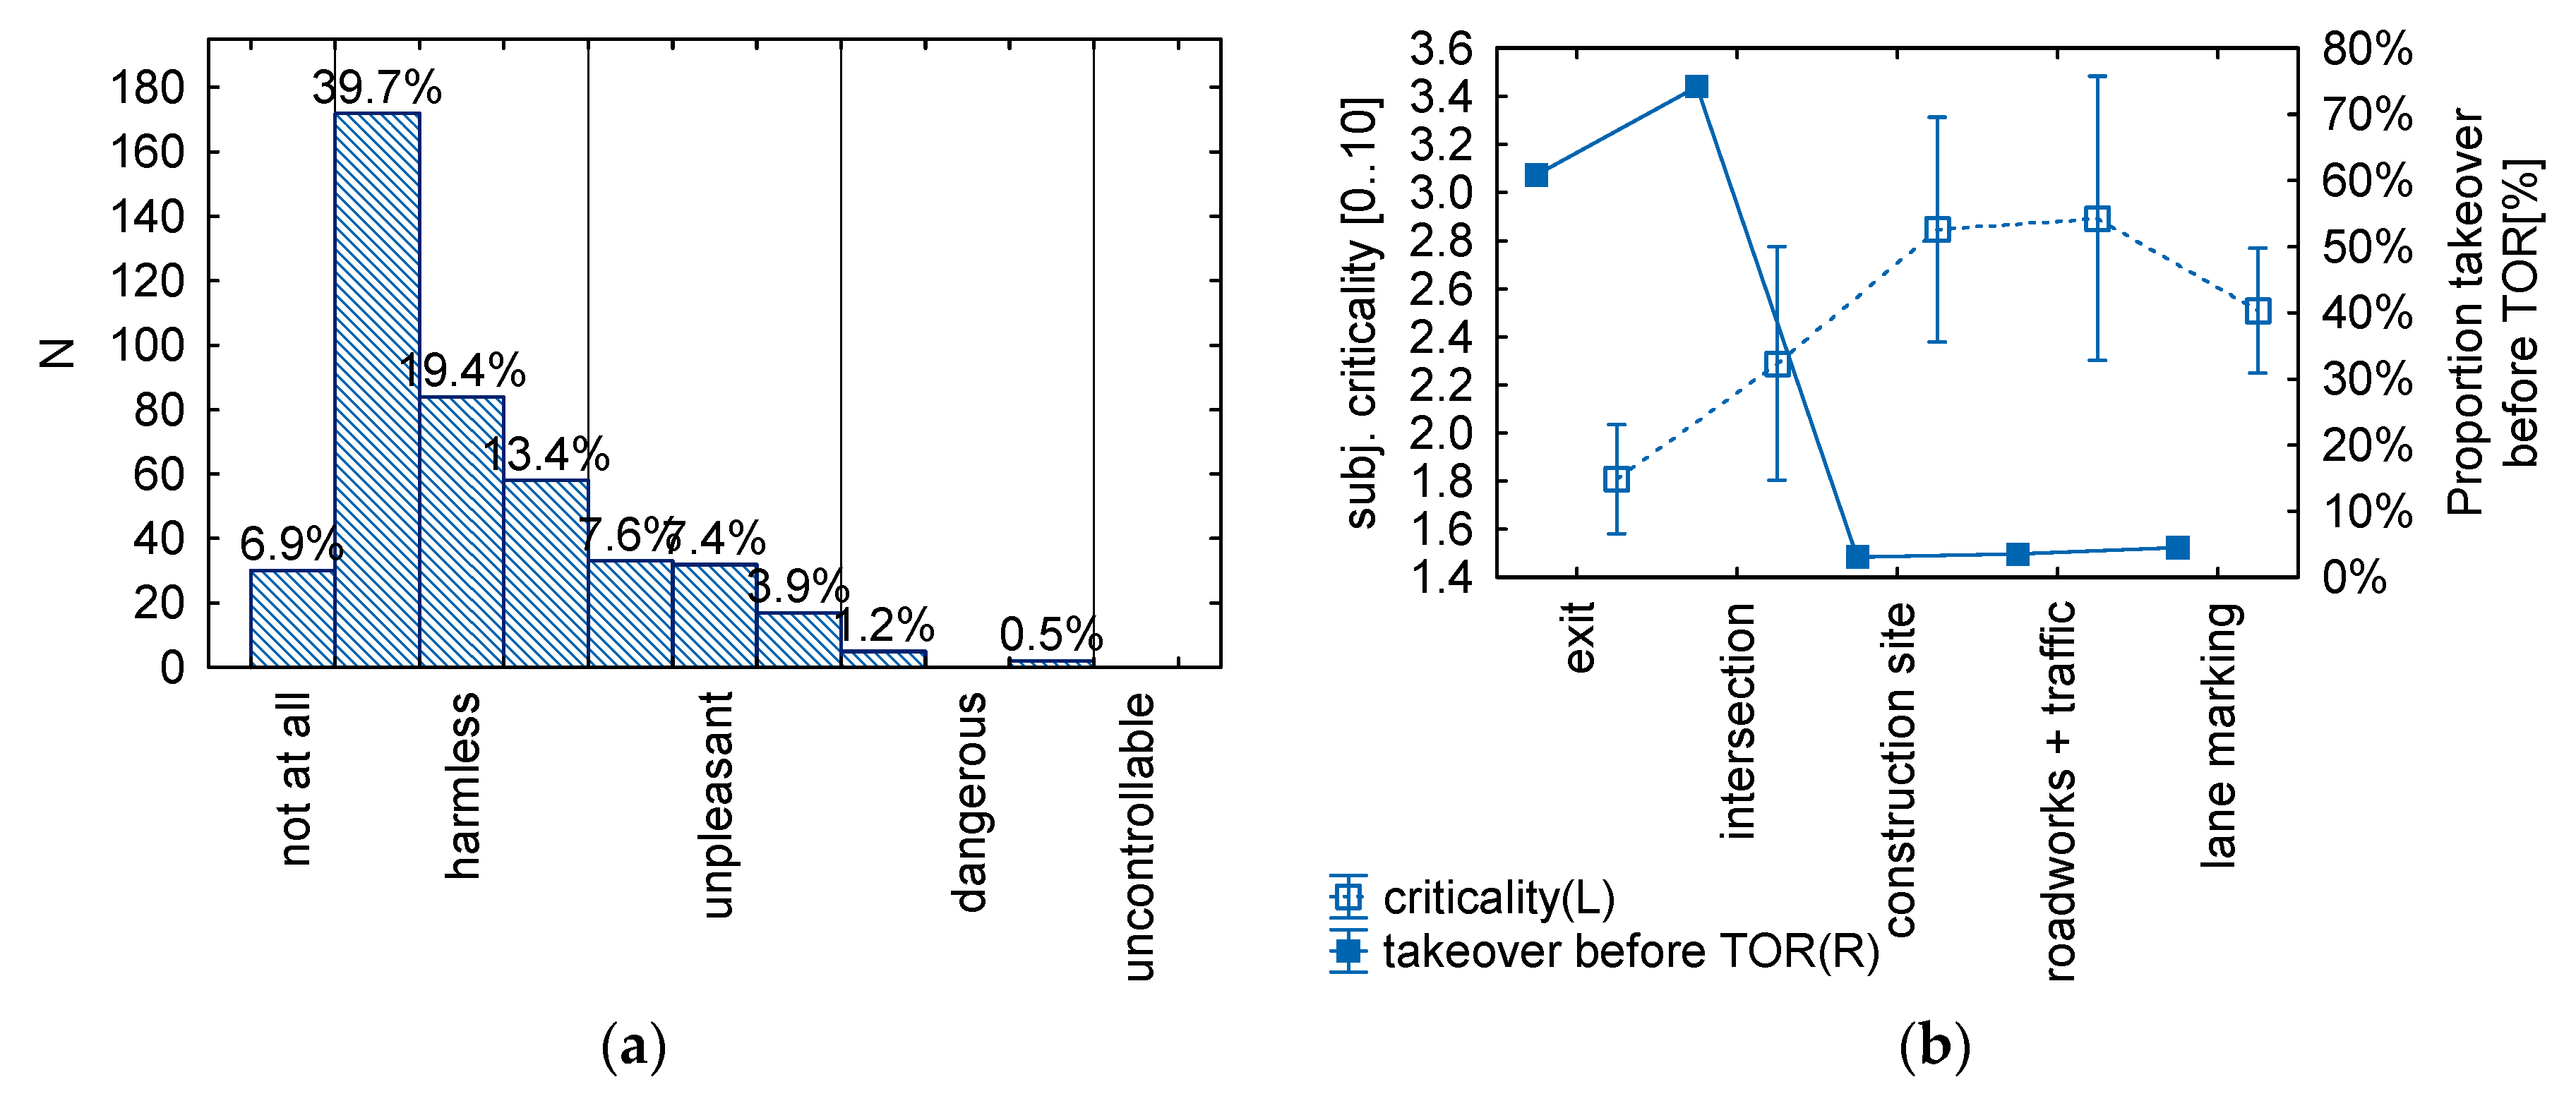
Within the four drives, frequency and reasons of TORs varied. Overall, the majority of take-over situations are experienced as being harmless or unpleasant (see Figure 6a). N = 7 out of 433 situations are rated as dangerous, but in four of these situations, drivers took control back even before a TOR was issued by the system. Therefore, the rating mostly relates to the following driving situation, which was a highway intersection with traffic in the two most critical situations.
As can be seen in Figure 6b, there are situations in which control is taken back quite frequently before a TOR actually occurred (exit and highway intersection) because these system limits are announced by the navigation system before a TOR. These situations are rated as less critical than situations without a pre-announcement like TORs before a construction site, before roadworks or because of missing lane markings (F(4, 108) = 8.12, p = 0.00001).
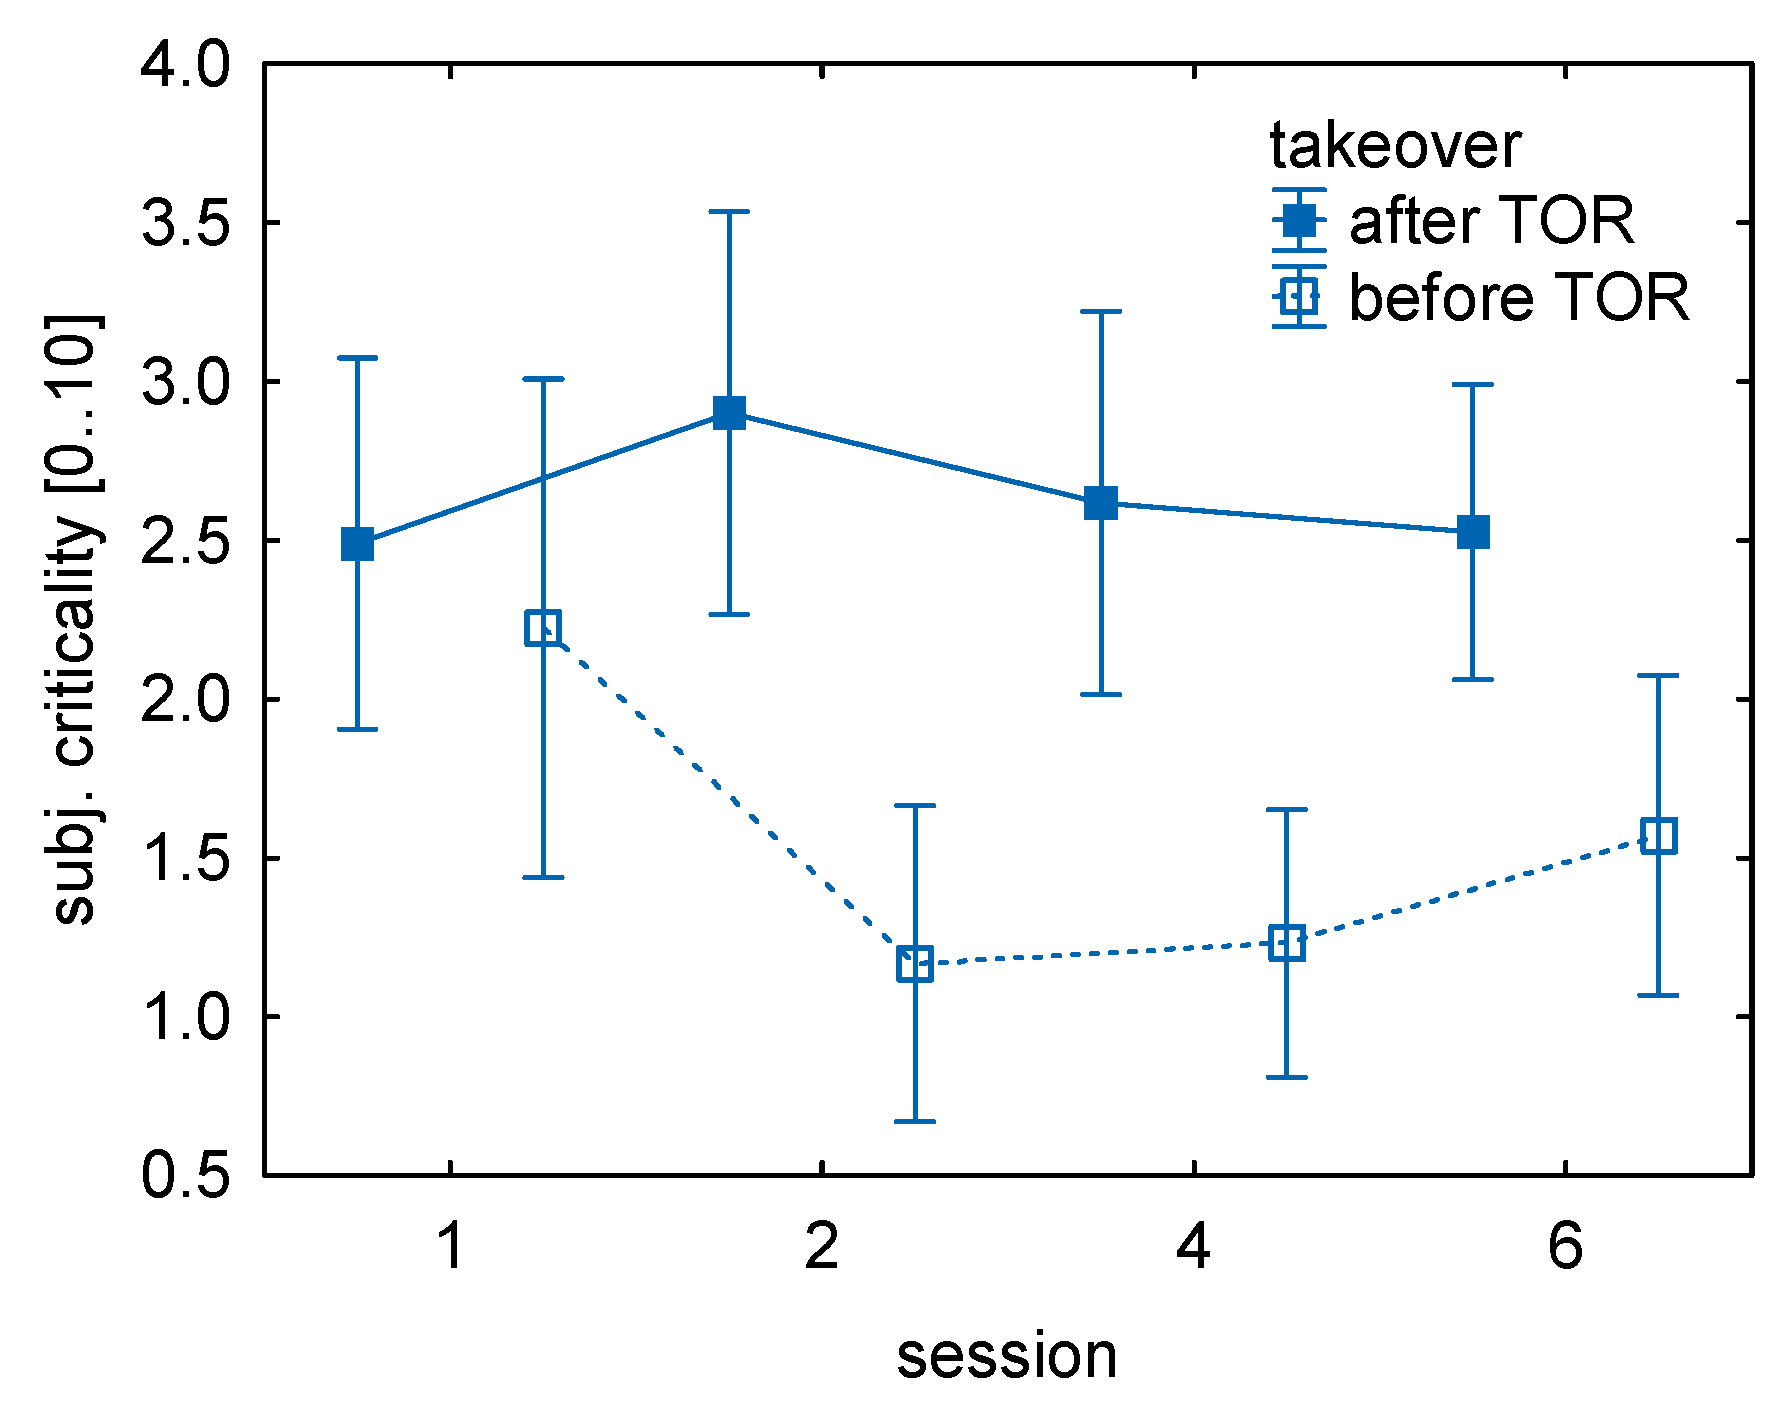
To analyse behavioural adaptation to TORs, take-over situations are averaged per driver and driving session separately for situations where drivers take control back before or after a TOR. For subjective criticality, there is a significant interaction between the type of take-over situation and the number of sessions (F(3, 100) = 3.20, p = 0.02671, see Figure 7). During the first session, experienced criticality is similar to situations where drivers take control back before and after a TOR. After the first session, situations are rated as less critical when the driver takes control back before the system issues a TOR. There is no change in the evaluation of situations where control is taken back after a TOR.
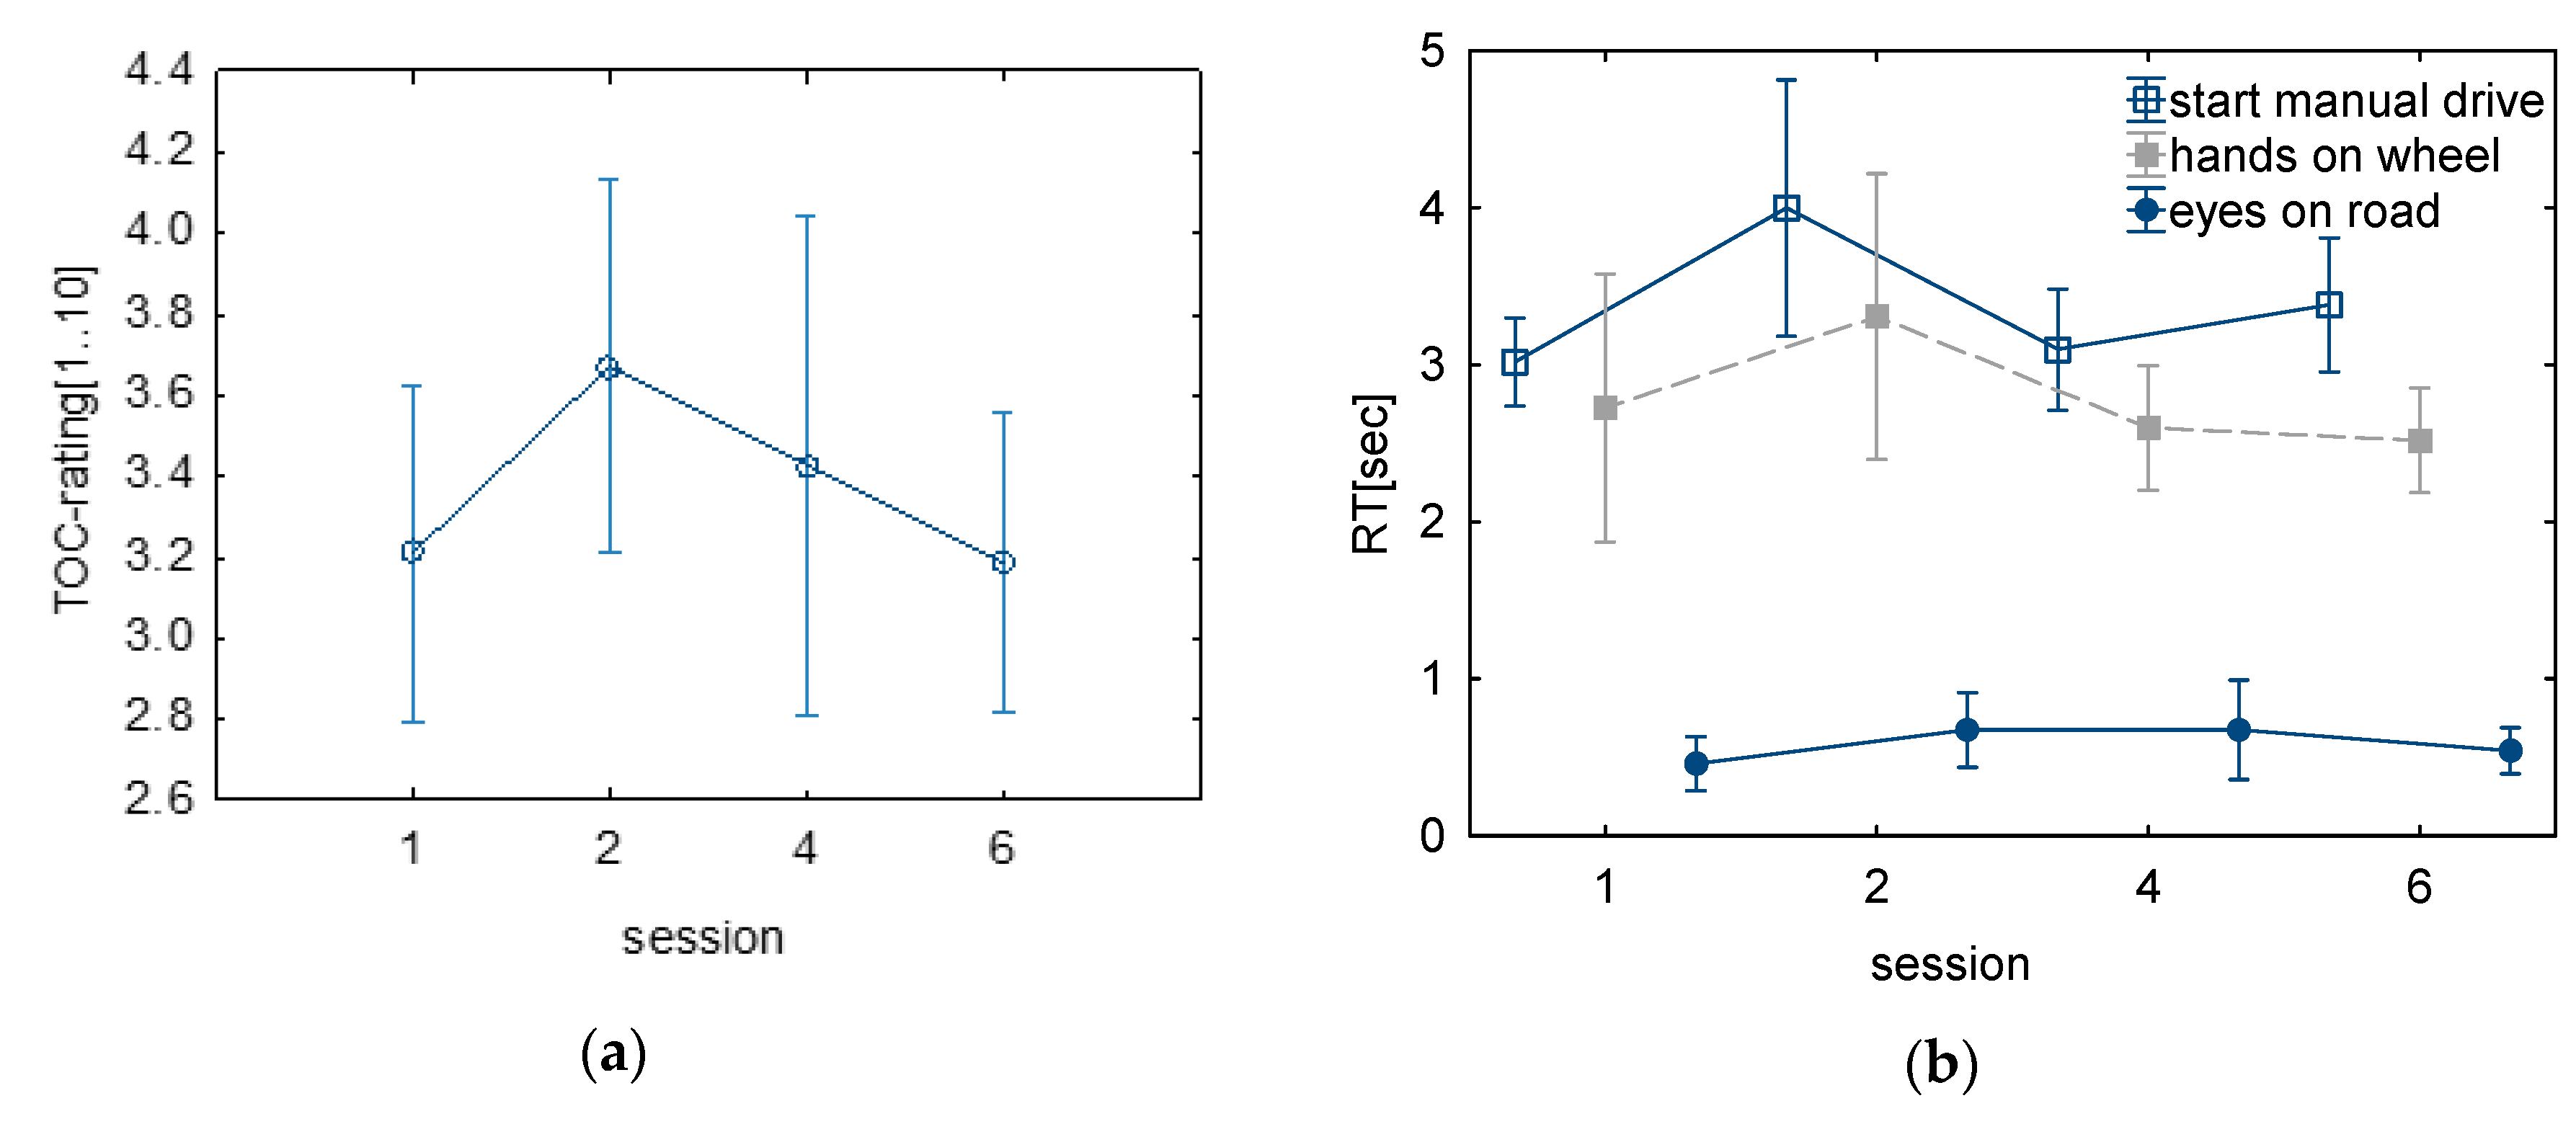
For situations where drivers react after the TOR, TOC-rating and reaction times are analysed (see Figure 8). The time it takes until drivers look onto the road (eyes on-road) is shorter than one second for all sessions and it does not change with repeated usage (F(3, 72) = 0.26, p = 0.85355, Figure 8b, lowest parameter). It takes between two and three seconds until drivers put their hands on the wheel (Figure 8b, middle parameter) and between three and four seconds until the L3ADS is deactivated and the driver starts driving manually (Figure 8b, upmost parameter). For the time until drivers put their hands on the wheel there is a tendency (F(3, 87) = 2.51, p = 0.06424) and for the time until control is actually taken back there is a significant (F(3, 87) = 4.51, p = 0.00547) change over time. For both parameters, the effect is based on an increase of reaction times during the second session. This pattern resembles the results for the TOC-rating. Descriptively there is an increase in average TOC-rating in session 2, which means a worsened takeover performance. Nevertheless, this change is not significant (F(3, 87) = 1.3382, p = 0.26723). In all sessions, between 31% and 42% of all takeover reactions are rated either as perfect or good (on the scale 1–3) with the highest proportion during the first session and the lowest during the second. Between 56% and 69% of takeover reactions are evaluated as being with errors (on the scale 4–6), now vice version session one having the lowest and session two the highest proportion. Overall there is only one takeover scenario rated as being critical that occurred during session one.
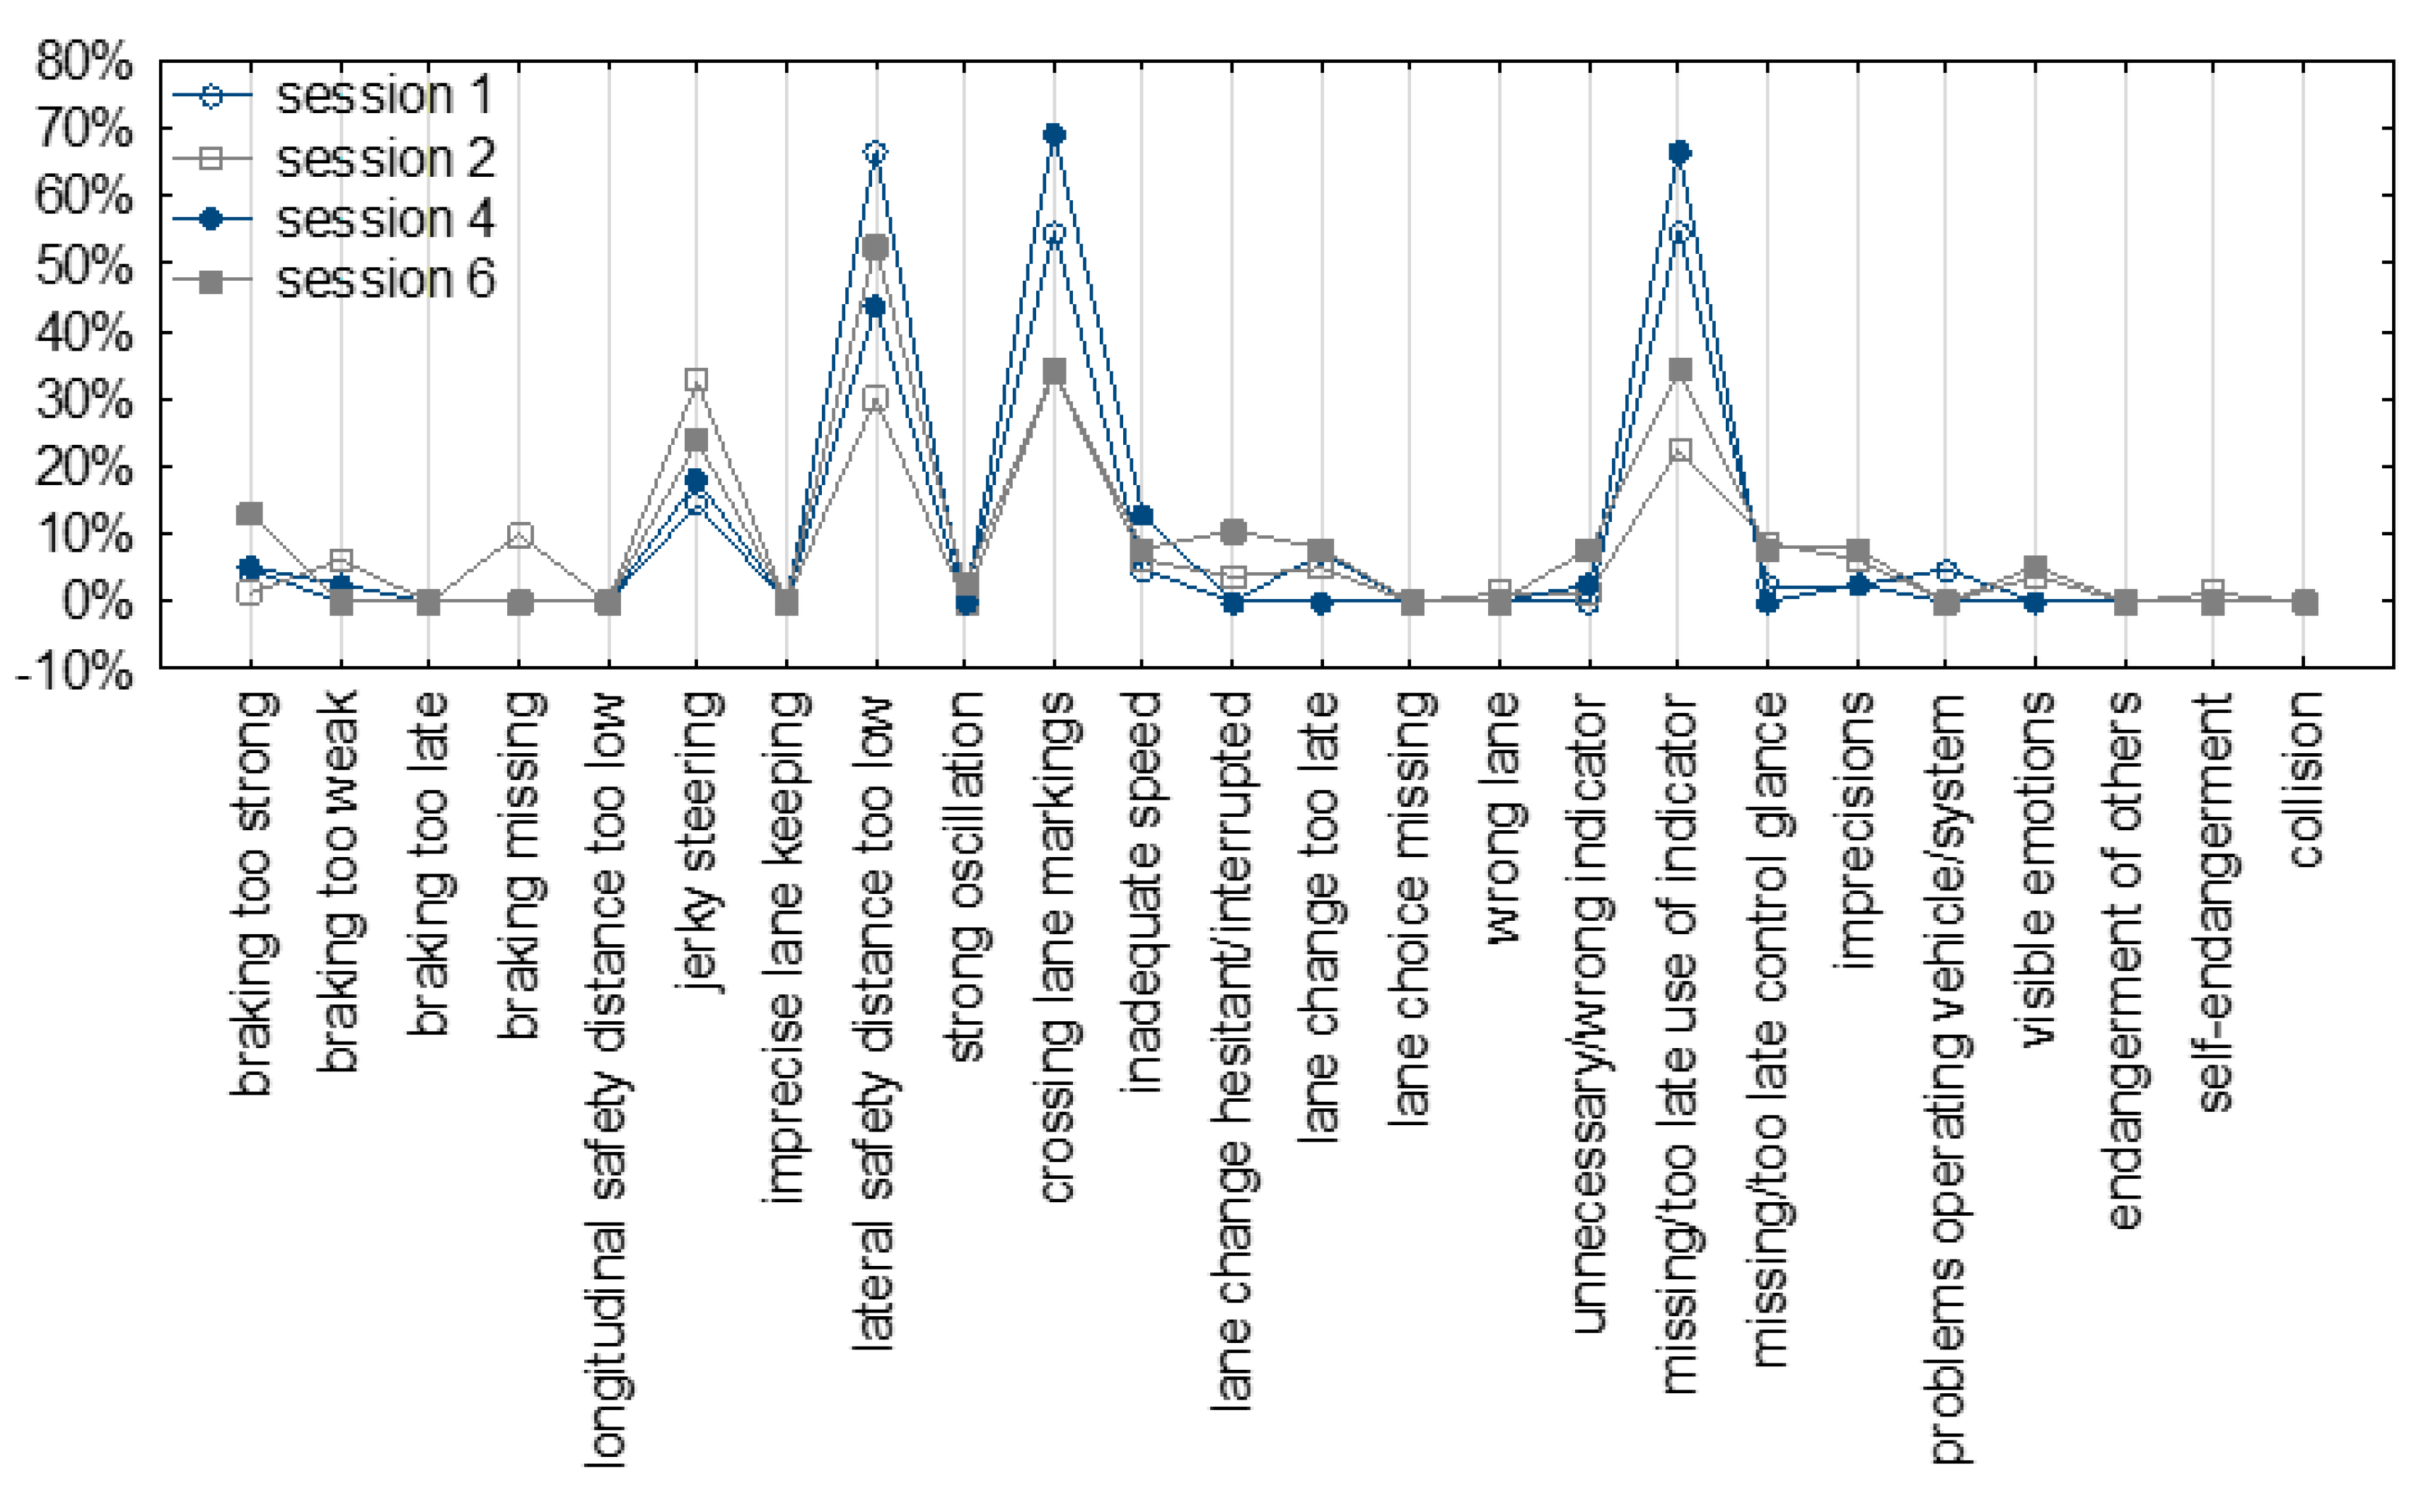
The pattern of errors occurring in the takeover scenarios remains similar to repeated usage (see Figure 9). Most errors/imprecision rated relate to imprecise lateral control like jerky steering, too low lateral safety distance and crossing of lane markings. Furthermore, drivers frequently forget to use the indicator or use it too late. Errors in longitudinal control (like braking too strong or too late) and errors indicate problems on the decision level (e.g., missing, hesitant or wrong lane change) are rare.
4. Discussion
In summary, several of the investigated measures change with repeated usage of the L3ADS:
- With repeated usage, drivers trust the function more and feel safer and less stressed.
- With repeated usage, drivers spent more time with the function active on NDRAs, especially on tasks that involve both hands.
- With repeated usage, drivers feel less the need to monitor the system and they direct less attention to the road.
In the course of the drives, there is no change in the proportionate time that the system is activated. This can be explained by the fact that during the first drive the usage is already very high, with the system being activated more than 80% of the time it is available. This level remains rather stable in the course of the six drives. Therefore, the growing trust in the system is reflected not in an increase of usage of the system but rather in an increase in the willingness to engage in NDRAs and let the system be unsupervised. For most measures, the main increase can be observed between the first and the fourth drive, the second drive ranging somewhere in between. For the proportion of time the gaze is directed to the road, there is a continuous decrease from session one to session four. During sessions four and six, the level remains stable. Therefore, subjective as well as objective measures indicate an increase of trust over the first four drives. Afterwards, no further behavioural change can be observed. The results are in-line with the model of Martens and Jenssen [12] that describes that after the first encounter where the driver first explores the system, a phase of learning starts. In this phase, the driver experiences the system behaviour in different situations or scenarios. Even though the timely dimensions stated in the model (1–6 h for the first encounter and 3–4 weeks for the learning phase) do not apply to the results of our study, the phases seem applicable.
Performance changes over time as assumed by the model of behavioural adaptation [12] were expected in terms of better reactions to TORs. In summary, drivers were able to handle TORs safely and easily within the available timeframe of 15 s. There is a small effect of repeated usage on reaction time to a TOR based on increased reaction times in the second drive which is reflected at least on a descriptive level in the TOC-rating. This pattern does not support the assumption of a learning effect in terms of a constant improvement of take-over performance. However, it has to be considered that the applied take-over situations were easy to handle. This is also reflected by an overall very low subjective criticality. Especially, situations that were designed such that drivers received a cue that a take-over situation would occur soon, e.g., the information from the navigation system that was given before the TOR was issued were rated as not critical. During the first session, drivers learn to use the pre-announcement to react without time pressure before reaching the system limit and to take control back even before a TOR is issued by the L3ADS.
For those take-over situations where drivers react after a TOR was issued, there is no change of experienced criticality over time. Probably, due to the time pressure after a TOR announces the on-coming end of ODD 15 s before it is actually reached and probably also due to the variability and the changing complexity of the oncoming driving situations, there is no change of experienced criticality over time. It might either be that the number of actual TORs experienced in the experimental drives was too low for such an adaptation to take place or that there is no room for adaptation because appropriate reaction and timing are largely pre-defined by the situation itself. For reactions after a TOR, reaction times for later parts of the reaction (hands-on the steering wheel and control taken back) are delayed during the second session. Whether this indicates a relevant but short change with regard to the concept of behavioural adaptation is questionable.
5. Conclusions
Investigating behavioural adaptation to ADSs poses high requirements for the study design. Simply comparing driving parameters when using the system with driving without the system as applied in studies on ADAS (see e.g., [7]) is not applicable for automated driving systems from SAE level 3 onwards. This would mean that manual driving behaviour is compared to a driving behaviour defined by the automation technology. An alternative approach is to investigate the drivers’ behaviour in a timely perspective when interacting with the system. As described by Martens and Jenssen [12], drivers’ behaviour when using an ADAS changes over time. Especially the phase of building trust in the system seems highly critical for explaining changes in the drivers’ behaviour. Self-reported trust in the L3ADS in our study increased in the course of the driving sessions. Between the first and the fourth drive, an increase in trust in the system was evident. Along with increasing trust, a decrease in monitoring behaviour (decrease in PRC) and increasing engagement in NDRAs was observed. Even though the causal relation of this development is unclear, it can be assumed that drivers change their monitoring behaviour as well as their engagement in NDRAs due to their growing trust in the L3ADS. Furthermore, the observed changes are in line with the predictions of the theory of risk homeostasis [5]. The increase in subjective trust went along with an increase in perceived safety. The increased trust explains why drivers led their attention away from the driving environment and engaged in other activities. Therefore, it can be argued that the overall subjective risk was kept constant by the drivers.
It seems likely that the progress in behavioural adaptation varies for different aspects of using and handling an L3-system. Since driving with the activated system, seeing the system work and experiencing its advantages included the largest proportion of the total 8 h of driving time, the six sessions seem to be sufficient to investigate changes in drivers’ attitudes and also in their decisions regarding handling the activated system and using the driving time. Compared to that, actual TORs are rare and short situations. Furthermore, they often lead to situations that require a situationally adapted reaction from the driver with little room for behavioural variations. It is likely that TORs were not frequent enough to study behavioural adaptation, especially because they were experienced as being harmless and manageable.
Regarding the different dimensions of behavioural adaptation discussed in the literature, a clear differentiation between cognitive changes and performance changes turned out to be difficult to capture for driving with L3 automation. This is mainly because the driving task is performed by automation most of the time, therefore the performance of the driver cannot be measured. What can be measured is the decision to activate the system and how the time with the system active is used. These are measures that to our understanding mirror the cognitive decisions of the driver. Also, for driving with ADAS, these two dimensions are probably the ones that interact most, because with mostly manual driving a decision (e.g., to attend to an NDRA) often directly impacts the measured driving performance (e.g., lane-keeping performance). With L3 ADSs, drivers’ performance is only measurable in take-over situations where control is handed back to the driver. For situations with a pre-announcement of a system limit (e.g., due to the navigation system), experienced criticality decreases in parallel to other measures during the second session. To gain further insight into potential behavioural adaptation in takeover scenarios more research is needed. It needs to be investigated whether no behavioural adaptation to TORs occurs, e.g., due to the nature of takeover situations (time pressure, varying situational demands) or whether the number of TOR in our study was too low to observe behavioural adaptation.
The approach of operationalizing behavioural adaptation by comparing the driver’s attitudes and behaviours over different points in time seems applicable to ADSs. Therefore, the driver’s behaviour when using the system for the first time can be compared to the behaviour when using the system at a later point in time. The only question is: When do changes in behaviour occur? What is a reasonable period of usage to observe a change? The timely dimension of the five phases of behavioural adaptation to ADAS by Martens and Jenssen [12] is 1–2 years and was clearly not covered in the presented study. However, the results suggest that for the use of highly automated driving systems this process might be faster. Between the first and the fourth drive, an increase in subjectively reported trust, perceived safety and the willingness to use the system was evident (attitudinal changes). The engagement in NDRAs also increased in parallel with reported trust (cognitive changes). It seems that especially the learning phase (3–4 weeks) passes much faster since besides the system handling (activation/deactivation) there were mainly the system limits that had to be learned. Drivers experienced various system limits during the experimental drives. This might have been sufficient for “learning” the system. It is obvious that if drivers use the system for an extended period of time and experience the system in more diverse situations, drivers might adjust their behaviour at a later point in time (see adjustment phase, [12]). However, it can be argued that behavioural adaptation to ADSs seems to occur faster than for ADAS. A longer-term user study on ADSs preferably in a real driving environment could yield more insights into further behavioural changes due to ADSs. Nevertheless, such a study requires that L3/L4-ADSs are on the market or at least available in a market-ready version. Such a study would also help to replicate the findings from the presented study.
Author Contributions
conceptualization, B.M. and J.W.; methodology, B.M. and J.W.; software, M.H.; analysis, B.M.; study conduction, J.W., A.L. and M.S.; writing—original draft preparation, B.M.; writing—review and editing, J.W. All authors have read and agreed to the published version of the manuscript.
Funding
The study is part of the research project L3Pilot (https://www.l3pilot.eu/), which receives funding from the European Union’s Horizon 2020 research and innovation programme under grant agreement No 723051.
Acknowledgments
The research leading to these results has received funding from the European Commission Horizon 2020 program under the project L3Pilot, grant agreement number 723051. Responsibility for the information and views set out in this publication lies entirely with the authors. The authors would like to thank all partners within L3Pilot for their cooperation and valuable contribution.
Conflicts of Interest
The authors declare no conflict of interest.
References
- SAE. Taxonomy and Definitions for Terms Related to on-Road Motor Vehicle Automated Driving Systems; Society of Automotive Engineers: Warrendale, PA, USA, 2018; Volume 3016, pp. 1–16. [Google Scholar]
- Kyriakidis, M.; de Winter, J.C.; Stanton, N.; Bellet, T.; van Arem, B.; Brookhuis, K.; Martens, M.H.; Bengler, K.; Andersson, J.; Merat, N.; et al. A human factors perspective on automated driving. Theor. Issues Ergon. Sci. 2019, 10, 223–249. [Google Scholar] [CrossRef]
- OECD. Behavioural Adaptations to Changes in the Road Transport System 1990; Organisation for Economic Co-Operation and Development: Paris, France, 1990. [Google Scholar]
- Peltzman, S. The effects of automobile safety regulation. J. Political Econ. 1975, 83, 677–725. [Google Scholar] [CrossRef]
- Wilde, G.J. The theory of risk homeostasis: Implications for safety and health. Risk Anal. 1982, 2, 209–225. [Google Scholar] [CrossRef]
- Hollnagel, E.; Nåbo, A.; Lau, I.V. A systemic model for driver-in-control. In Proceedings of the Second International Driving Symposium on Human Factors in Driver Assessment, Training and Vehicle Design, Park City, UT, USA, 21–24 July 2003. [Google Scholar]
- Rudin-Brown, C.M.; Parker, H.A. Behavioural adaptation to adaptive cruise control (ACC): Implications for preventive strategies. Transp. Res. F 2004, 7, 59–76. [Google Scholar] [CrossRef]
- Dikmen, M.; Burns, C. Trust in autonomous vehicles: The case of Tesla Autopilot and Summon. In Proceedings of the IEEE International Conference on Systems, Man, and Cybernetics (SMC), Banff, AB, Canada, 5–8 October 2017. [Google Scholar]
- Gold, C.; Körber, M.; Hohenberger, C.; Lechner, D.; Bengler, K. Trust in automation–Before and after the experience of take-over scenarios in a highly automated vehicle. Procedia Manuf. 2015, 3, 3025–3032. [Google Scholar] [CrossRef]
- Naujoks, F.; Totzke, I. Behavioral adaptation caused by predictive warning systems—The case of congestion tail warnings. Transp. Res. F Traffic Psychol. Behav. 2014, 26, 49–61. [Google Scholar] [CrossRef]
- Jamson, H.; Merat, N.; Carsten, O.M.; Lai, F.C. Behavioural changes in drivers experiencing highly-automated vehicle control in varying traffic conditions. Transp. Res. C 2013, 30, 116–125. [Google Scholar] [CrossRef] [Green Version]
- Martens, M.H.; Jenssen, G.D. Behavioral adaptation and acceptance. In Handbook of Intelligent Vehicles; Springer: New York, NY, USA, 2012; pp. 117–138. [Google Scholar]
- Parasuraman, R.; Riley, V. Humans and automation: Use, misuse, disuse, abuse. Hum. Factors 1997, 39, 230–253. [Google Scholar] [CrossRef]
- Naujoks, F.; Wiedemann, K.; Schömig, N. The importance of interruption management for usefulness and acceptance of automated driving. In Proceedings of the 9th International Conference on Automotive User Interfaces and Interactive Vehicular Applications, Oldenburg, Germany, 24–27 September 2017. [Google Scholar]
- Kyriakidis, M.; Happee, R.; de Winter, J.C. Public opinion on automated driving: Results of an international questionnaire among 5000 respondents. Transp. Res. F 2015, 32, 127–140. [Google Scholar] [CrossRef]
- Vogelpohl, T.; Kühn, M.; Hummel, T.; Vollrath, M. Asleep at the automated wheel—Sleepiness and fatigue during highly automated driving. Accid. Anal. Prev. 2018, 126, 70–84. [Google Scholar] [CrossRef]
- Saad, F.; Hjälmdahl, M.; Cañas, J.; Alonso, M.; Garayo, P.; Macchi, L.; Nathan, F.; Ojeda, L.; Papakostopoulos, V.; Panou, M.; et al. Literature Review of Behavioural Effects; AIDE deliverable D1. 2.1 2004; Information Society Technologies: Brussels, Belgium, 2004. [Google Scholar]
- Patten, C.J. Behavioural adaptation to in-vehicle intelligent transport systems. In Behavioural Adaptation and Road Safety: Theory, Evidence and Action; CRC Press: Boca Raton, FL, USA, 2013; pp. 161–176. [Google Scholar]
- Ajzen, I. Perceived behavioral control, self-efficacy, locus of control, and the theory of planned behavior 1. J. Appl. Soc. Psychol. 2002, 32, 665–683. [Google Scholar] [CrossRef]
- Muir, B.M. Trust between humans and machines, and the design of decision aids. Int. J. ManMach. Stud. 1987, 27, 527–539. [Google Scholar] [CrossRef]
- Large, D.R.; Burnett, G.; Morris, A.; Muthumani, A.; Matthias, R. A Longitudinal Simulator Study to Explore Drivers’ Behaviour during Highly-Automated Driving. In Proceedings of the International Conference on Applied Human Factors and Ergonomics, Los Angeles, CA, USA, 17–21 July 2017. [Google Scholar]
- Straßenverkehrsgesetz 2018, §1b Rechte und Pflichten des Fahrzeugführers bei Nutzung hoch- und vollautomatisierter Fahrfunktionen, (Germany). Available online: https://www.gesetze-im-internet.de/stvg/StVG.pdf (accessed on 3 October 2019).
- Griffin, T.; Sauvaget, J.-L.; Geronimi, S.; Bolovinou, A.; Brouwer, T. Deliverable D4.1—Description and Taxonomy of Automated Driving Functions. Deliverable D3.3 of L3Pilot Project. 2019. Available online: https://l3pilot.eu/fileadmin/user_upload/Downloads/Deliverables/L3Pilot-SP4-D4.1-Description_and_taxonomy_of_AD_functions-v2.0_for_website.pdf (accessed on 17 February 2020).
- Metz, B.; Rösener, C.; Louw, T.; Aitoniemi, E.; Bjorvatn, A.; Wörle, J.; Weber, H.; Torrao, G.A.; Silla, A.; Malin, F.; et al. Deliverable D3.3—Evaluation Methods; Deliverable D3.3 of L3Pilot Project. 2019. Available online: https://l3pilot.eu/fileadmin/user_upload/L3Pilot-SP3-D3.3_Evaluation_Methods-v1.0_DRAFT_for_website.pdf (accessed on 3 October 2019).
- Van der Laan, J.D.; Heino, A.; De Waard, D. A simple procedure for the assessment of acceptance of advanced transport telematics. Transp. Res. C 1997, 5, 1–10. [Google Scholar] [CrossRef]
- Neukum, A.; Lübbeke, T.; Krüger, H.-P.; Mayser, C.; Steinle, J. ACC-Stop&Go: Fahrerverhalten an funktionalen Systemgrenzen. In 5 Workshop Fahrerassistenzsysteme—FAS 2008; Maurer, M., Stiller, C., Eds.; Fmrt: Karlsruhe, Germany, 2008; pp. 141–150. [Google Scholar]
- Naujoks, F.; Wiedemann, K.; Schömig, N.; Jarosch, O.; Gold, C. Expert-based controllability assessment of control transitions from automated to manual driving. MethodsX 2018, 5, 579–592. [Google Scholar] [CrossRef] [PubMed]
- Akerstedt, T.; Anund, A.; Axelsson, J.; Kecklund, G. Subjective sleepiness is a sensitive indicator of insufficient sleep and impaired waking function. J. Sleep Res. 2014, 23, 240–252. [Google Scholar] [CrossRef] [PubMed]
- Wiedemann, K.; Naujoks, F.; Wörle, J.; Kenntner-Mabiala, R.; Kaussner, Y.; Neukum, A. Effect of different alcohol levels on take-over performance in conditionally automated driving. Accid. Anal. Prev. 2018, 115, 89–97. [Google Scholar] [CrossRef] [PubMed]
- Victor, T. Keeping Eye and Mind on the Road. Ph.D. Thesis, Universitet Uppsala, Uppsala, Sweden, 2005. [Google Scholar]
Figure 1.
The high-fidelity driving simulator at WIVW.

Figure 2.
Example of questionnaire items used to assess concepts like acceptance and trust (a) and scale used to asses experienced criticality for takeover scenarios (b).
Figure 2.
Example of questionnaire items used to assess concepts like acceptance and trust (a) and scale used to asses experienced criticality for takeover scenarios (b).

Figure 3.
Drivers’ agreement with general statements about the L3-motorway automated driving system (ADS) (L3ADS). * marks statements with a significant effect of the session.
Figure 3.
Drivers’ agreement with general statements about the L3-motorway automated driving system (ADS) (L3ADS). * marks statements with a significant effect of the session.

Figure 4.
The proportion of time L3ADS was activated, drivers attended to non-driving related activities (NDRAs), drivers attended to NDRAs involving manual distraction (a) and drivers spent looking on the road (percentage road centre, PRC) during all time with L3ADS active and during time L3ADS was overtaking other vehicles (b).

Figure 5.
Drivers’ agreement with statements about the effect of L3ADS on drivers’ state. * marks statements with a significant effect of the session.
Figure 5.
Drivers’ agreement with statements about the effect of L3ADS on drivers’ state. * marks statements with a significant effect of the session.

Figure 6.
Experienced criticality of take-over situations (a) and criticality and proportion of take-over before take-over request (TOR) split by situation type (b).
Figure 6.
Experienced criticality of take-over situations (a) and criticality and proportion of take-over before take-over request (TOR) split by situation type (b).

Figure 7.
Experienced criticality in a situation where drivers took control back before and after a TOR.
Figure 7.
Experienced criticality in a situation where drivers took control back before and after a TOR.

Figure 8.
Experienced criticality in a situation where drivers took control back before and after a TOR (a) and reaction times until eyes were on the road, hands were on the steering wheel and control was taken back (b).
Figure 8.
Experienced criticality in a situation where drivers took control back before and after a TOR (a) and reaction times until eyes were on the road, hands were on the steering wheel and control was taken back (b).

Figure 9.
The proportion of takeover scenarios with the different types of errors/imprecision rated in the TOC-rating.
Figure 9.
The proportion of takeover scenarios with the different types of errors/imprecision rated in the TOC-rating.


Table 1.
Content of the six experimental drives. Results from the drives in bold are included in this paper. The two other sessions are excluded to avoid confusion of the effects of repeated usage and driver state.
Table 1.
Content of the six experimental drives. Results from the drives in bold are included in this paper. The two other sessions are excluded to avoid confusion of the effects of repeated usage and driver state.
| Drive | Driving in ODD | Driving Outside ODD | Reasons for Take-Over Requests |
|---|---|---|---|
| Drive 1 | section with low traffic density and changing speed limit traffic jam | On parking area In motorway junction | 1 × before highway intersection 1 × before exit 1 × bad lane markings |
| Drive 2 | section with low traffic density and changing speed limit traffic jam | On parking area In construction site | 1 × construction site 1 × exit 2 × bad lane markings |
| Drive 3 | section with low traffic density and changing speed limit traffic jam | On parking area | 1 × exit 1 × before moving roadworks (+traffic) |
| Drive 4 | section with low traffic density and changing speed limit | On parking area In motorway junction In construction site | 1 × construction site 1 × highway junction 1 × before exit 2 × bad lane markings |
| Drive 5 | section with low traffic density and changing speed limit | On parking area In heavy rain | 1 × exit 1 × moving roadworks 1 × heavy rain |
| Drive 6 | section with low traffic density and changing speed limit | On parking area In heavy rain | 1 × exit 1 × moving roadworks 1 × heavy rain |
Table 2.
Description of the analysed takeover scenarios.
| Takeover Scenario | Drivers’ Task | Occurrence in Drives | Speed | |
|---|---|---|---|---|
| Before TOR | During Situation | |||
| Highway intersection | Take driving task back Follow direction signs through intersection Two-lane changes are required for right way | 1,3 | 120 km/h | Situationally adapted through intersection |
| Exit | Take driving task back Take exit lane Stop vehicle in car park | 1,2,3,4 | 120 km/h | Situationally adapted on exit lane |
| Bad lane markings | Take driving task back Stay on lane through the section with bad lane marking (no traffic, no curvature) | 1,2,4 | 120 km/h | 80 km/h |
| Construction site | Take driving task back Slow down Drive through construction site | 2,4 | 120 km/h | 80 km/h |
| Roadworks + traffic | Take driving task back Check driving environment Change unto unblocked lane while taking rear traffic into account | 3 | 120 km/h | 120 km/h |
Table 3.
Overview of the content of the six sessions of the experiment. Results from the sessions in bold are included in this paper. The two other sessions are excluded to avoid a confusion of the effects of repeated usage and driver state.
Table 3.
Overview of the content of the six sessions of the experiment. Results from the sessions in bold are included in this paper. The two other sessions are excluded to avoid a confusion of the effects of repeated usage and driver state.
| Session | Content |
|---|---|
| Session 1—introductory session 90 min | Information on experiment and planned schedule Informed Consent Handing out of Pilot site questionnaire part 1 Introductory drive (10 min) Drive 1 (30 min) Post drive questionnaire (full version) |
| Session 2 45 min | Short pre-drive questionnaire Drive 2, Drive 3 or Drive 4 (30 min) Post drive questionnaire (short version) |
| Session 3 2 h 30 min | Short pre-drive questionnaire Drive 5 or Drive 6 (2 h) Post drive questionnaire (short version) |
| Session 4 45 min | Short pre-drive questionnaire Drive 2, Drive 3 or Drive 4 (30 min) Post drive questionnaire (short version) |
| Session 5 2 h 30 min | Short pre-drive questionnaire Drive 5 or Drive 6 (2 h) Post drive questionnaire (short version) |
| Session 6 90 min | Short pre-drive questionnaire Drive 2, Drive 3 or Drive 4 (30 min) Post drive questionnaire (full version) |
Table 4.
Scale for take-over controllability (TOC)-rating which was used to evaluate takeover performance.
Table 4.
Scale for take-over controllability (TOC)-rating which was used to evaluate takeover performance.
| 1 | 2 | 3 | 4 | 5 | 6 | 7 | 8 | 9 | 10 |
| Perfect | Good with imperfections | Reduced performance with driving errors | Endangerment, critical situations | Uncontrollable | |||||
Table 5.
Results of t-tests evaluation agreement or disagreement with the questionnaire items for evaluation of the ADS. The table gives mean (m), standard deviation (sd), number of included participants (N), t-value, degrees of freedom (df) and p-value. Significant t-tests are marked in bold.
Table 5.
Results of t-tests evaluation agreement or disagreement with the questionnaire items for evaluation of the ADS. The table gives mean (m), standard deviation (sd), number of included participants (N), t-value, degrees of freedom (df) and p-value. Significant t-tests are marked in bold.
| Item | Session | m | sd | N | t | df | p |
|---|---|---|---|---|---|---|---|
| driving was comfortable | 1 | 2.138 | 0.953 | 29 | 6.43 | 28 | 0.0000 |
| 6 | 2.367 | 0.718 | 30 | 10.42 | 29 | 0.0000 | |
| driving was demanding | 1 | −0.267 | 0.785 | 30 | −8.84 | 29 | 0.0000 |
| 6 | −0.433 | 0.898 | 30 | −8.75 | 29 | 0.0000 | |
| driving was difficult | 1 | −0.567 | 0.504 | 30 | −17.03 | 29 | 0.0000 |
| 6 | −0.633 | 0.490 | 30 | −18.25 | 29 | 0.0000 | |
| driving was stressful | 1 | −0.067 | 1.015 | 30 | −5.76 | 29 | 0.0000 |
| 6 | −0.333 | 0.922 | 30 | −7.92 | 29 | 0.0000 | |
| felt safe driving with the system | 1 | 1.733 | 0.980 | 30 | 4.10 | 29 | 0.0003 |
| 6 | 1.933 | 0.785 | 30 | 6.51 | 29 | 0.0000 | |
| recommend the system | 1 | 1.655 | 0.936 | 29 | 3.77 | 28 | 0.0008 |
| 6 | 1.833 | 1.020 | 30 | 4.48 | 29 | 0.0001 | |
| trust the system | 1 | 1.724 | 0.882 | 29 | 4.42 | 28 | 0.0001 |
| 6 | 2.000 | 0.587 | 30 | 9.33 | 29 | 0.0000 | |
| use during my everyday trips | 1 | 1.567 | 1.194 | 30 | 2.60 | 29 | 0.0146 |
| 6 | 1.767 | 1.165 | 30 | 3.60 | 29 | 0.0012 | |
| use this system | 1 | 2.067 | 1.048 | 30 | 5.57 | 29 | 0.0000 |
| 6 | 2.233 | 1.006 | 30 | 6.71 | 29 | 0.0000 | |
| using the system was fun | 1 | 1.800 | 0.887 | 30 | 4.94 | 29 | 0.0000 |
| 6 | 2.067 | 0.785 | 30 | 7.44 | 29 | 0.0000 | |
| driving would make me tired | 1 | 1.821 | 1.124 | 28 | 3.87 | 27 | 0.0006 |
| 6 | 1.767 | 1.223 | 30 | 3.43 | 29 | 0.0018 | |
| use the time to do other activities | 1 | 2.069 | 0.998 | 29 | 5.77 | 28 | 0.0000 |
| 6 | 2.500 | 0.682 | 30 | 12.04 | 29 | 0.0000 | |
| want to monitor the system’s performance | 1 | 1.600 | 0.932 | 30 | 3.53 | 29 | 0.0014 |
| 6 | 1.400 | 1.192 | 30 | 1.84 | 29 | 0.0763 | |
| monitored environment more | 1 | 0.800 | 1.424 | 30 | −0.77 | 29 | 0.4479 |
| 6 | 0.067 | 1.311 | 30 | −3.90 | 29 | 0.0005 | |
| more aware of hazards | 1 | 0.000 | 0.910 | 30 | −6.02 | 29 | 0.0000 |
| 6 | −0.233 | 0.971 | 30 | −6.95 | 29 | 0.0000 | |
| obvious why takeover requests occurred | 1 | 2.733 | 0.521 | 30 | 18.23 | 29 | 0.0000 |
| 6 | 2.625 | 0.576 | 24 | 13.83 | 23 | 0.0000 | |
| during takeovers I felt safe | 1 | 2.167 | 0.986 | 30 | 6.48 | 29 | 0.0000 |
| 6 | 2.208 | 0.833 | 24 | 7.11 | 23 | 0.0000 | |
| takeovers warned appropriately | 1 | 2.467 | 0.629 | 30 | 12.78 | 29 | 0.0000 |
| 6 | 2.542 | 0.509 | 24 | 14.84 | 23 | 0.0000 | |
| takeovers were with sufficient time | 1 | 2.333 | 0.758 | 30 | 9.63 | 29 | 0.0000 |
| 6 | 2.167 | 0.868 | 24 | 6.58 | 23 | 0.0000 |
© 2020 by the authors. Licensee MDPI, Basel, Switzerland. This article is an open access article distributed under the terms and conditions of the Creative Commons Attribution (CC BY) license (http://creativecommons.org/licenses/by/4.0/).
Share and Cite
MDPI and ACS Style
Metz, B.; Wörle, J.; Hanig, M.; Schmitt, M.; Lutz, A. Repeated Usage of an L3 Motorway Chauffeur: Change of Evaluation and Usage. Information 2020, 11, 114. https://0-doi-org.brum.beds.ac.uk/10.3390/info11020114
AMA Style
Metz B, Wörle J, Hanig M, Schmitt M, Lutz A. Repeated Usage of an L3 Motorway Chauffeur: Change of Evaluation and Usage. Information. 2020; 11(2):114. https://0-doi-org.brum.beds.ac.uk/10.3390/info11020114
Chicago/Turabian StyleMetz, Barbara, Johanna Wörle, Michael Hanig, Marcus Schmitt, and Aaron Lutz. 2020. "Repeated Usage of an L3 Motorway Chauffeur: Change of Evaluation and Usage" Information 11, no. 2: 114. https://0-doi-org.brum.beds.ac.uk/10.3390/info11020114
Note that from the first issue of 2016, this journal uses article numbers instead of page numbers. See further details here.