The Impact of Situational Complexity and Familiarity on Takeover Quality in Uncritical Highly Automated Driving Scenarios


Abstract
:1. Introduction
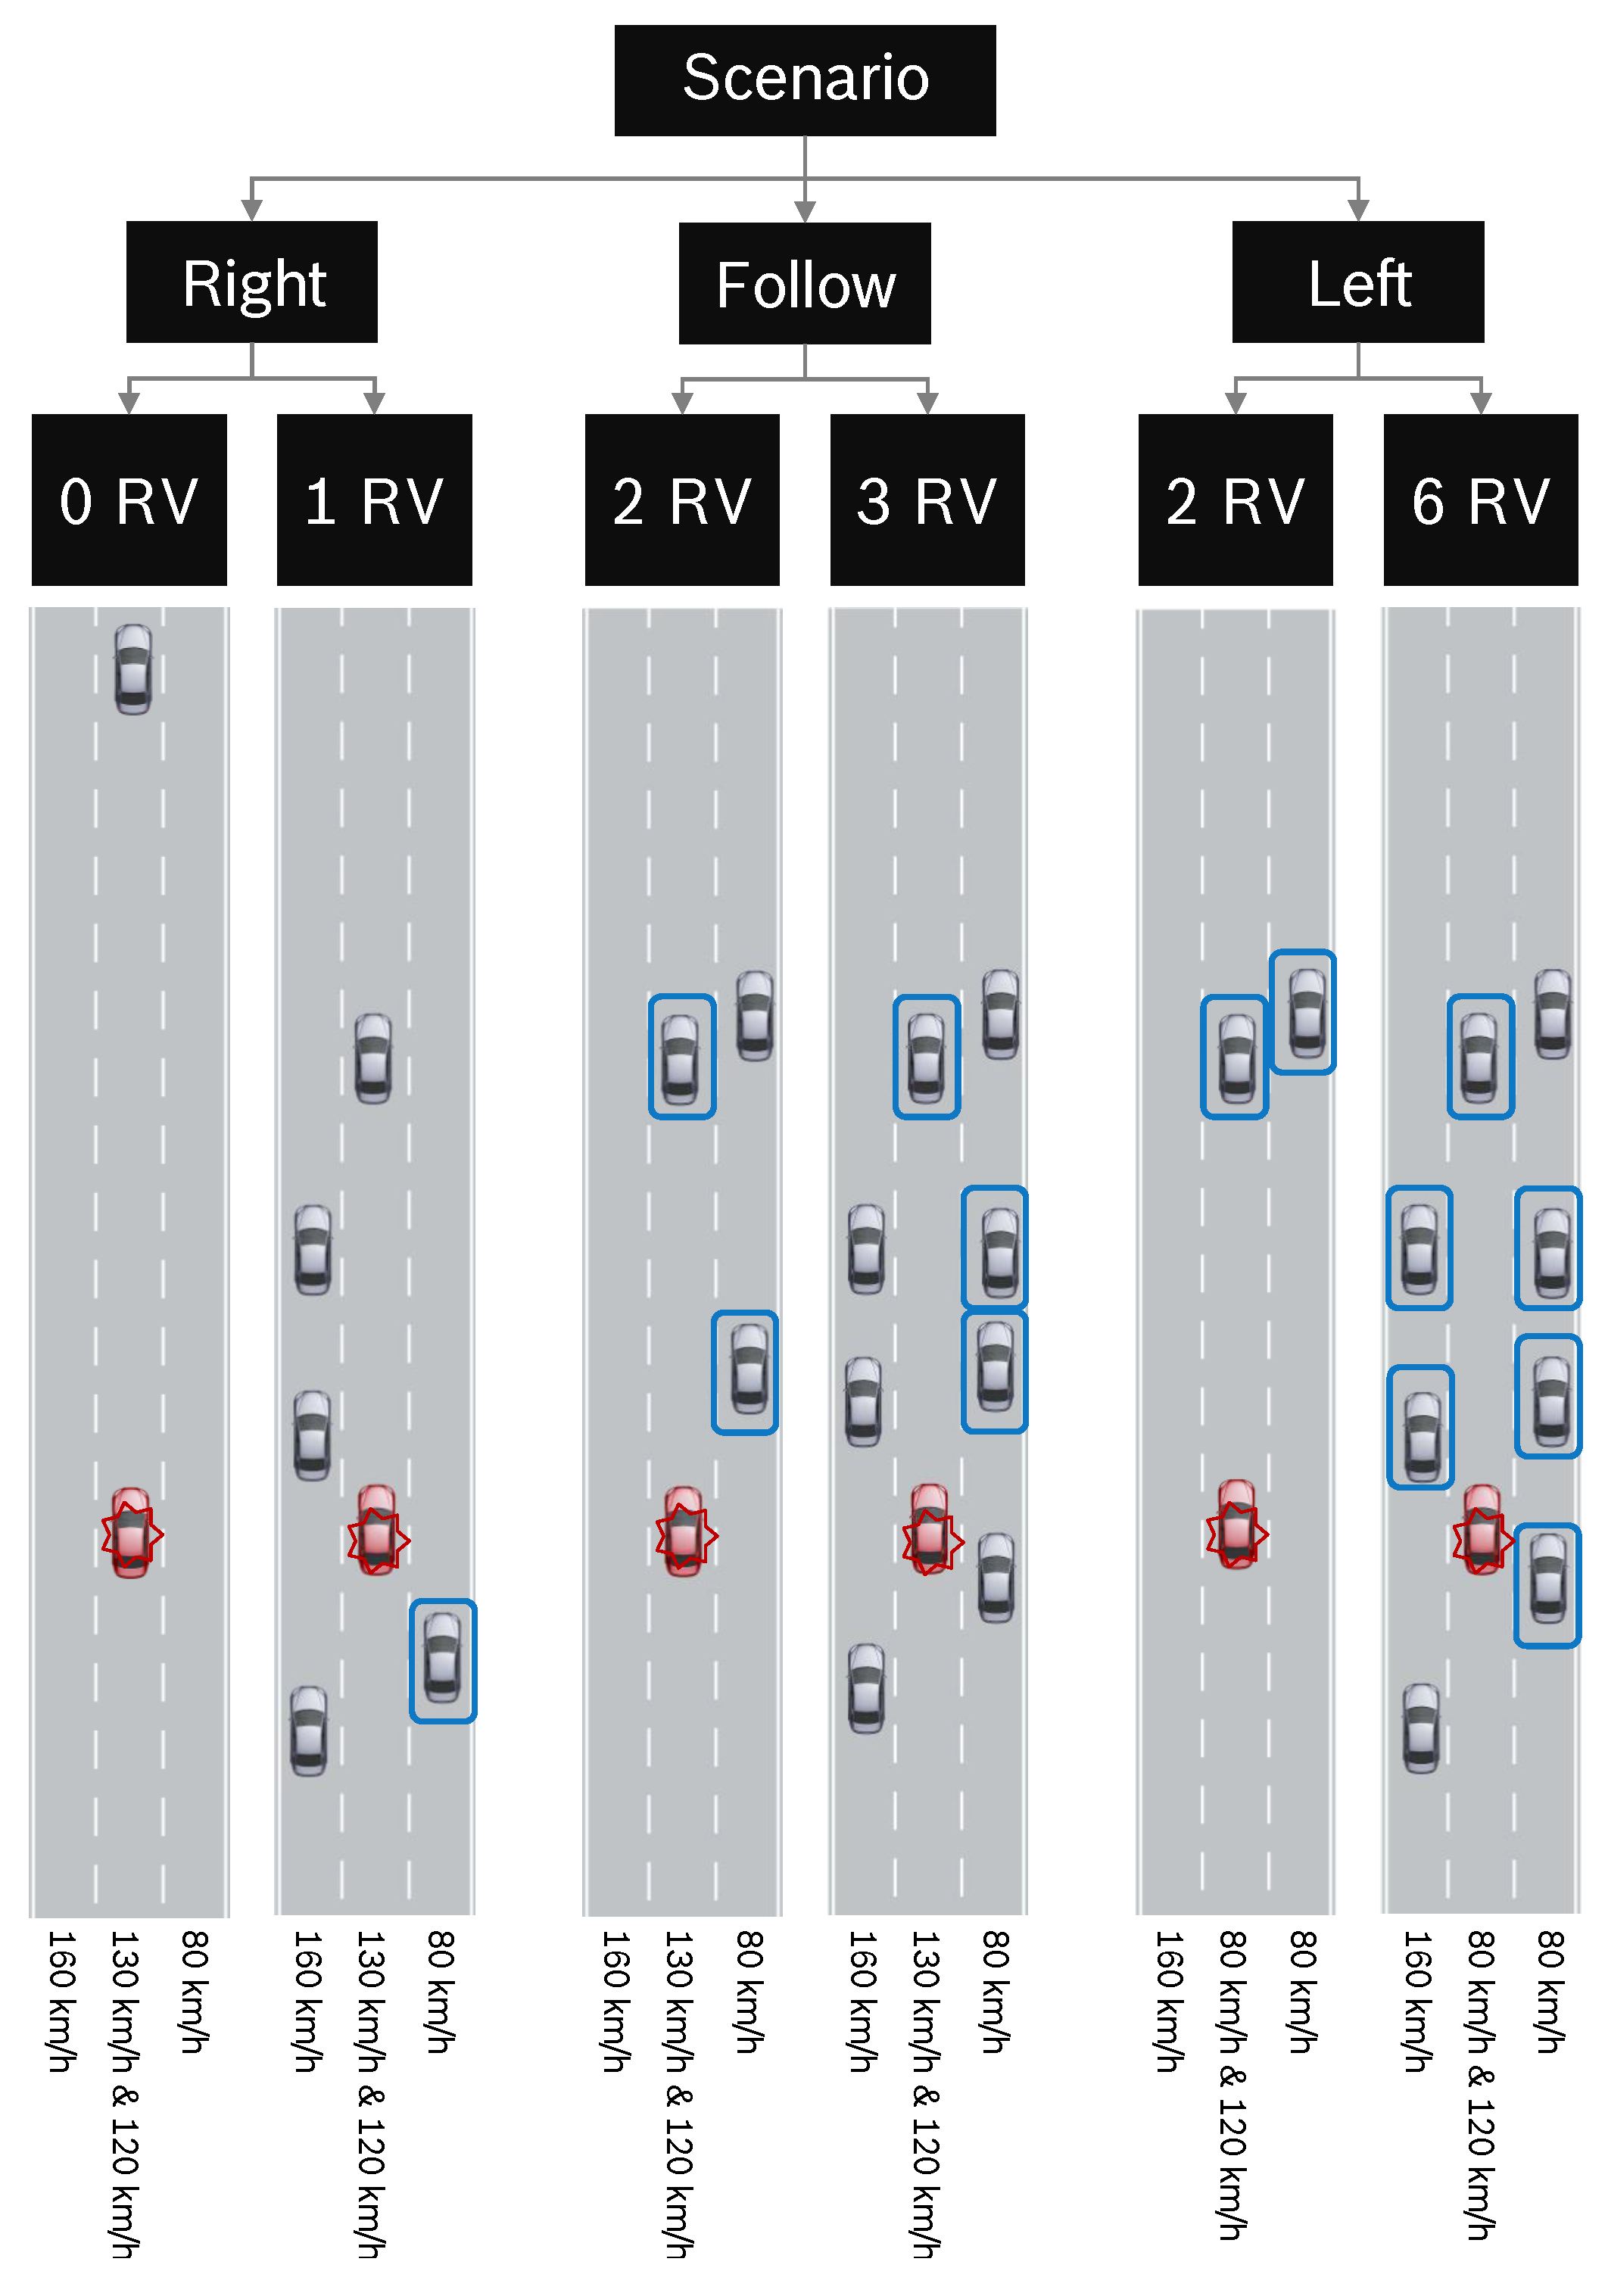
2. Methods
2.1. Study Design
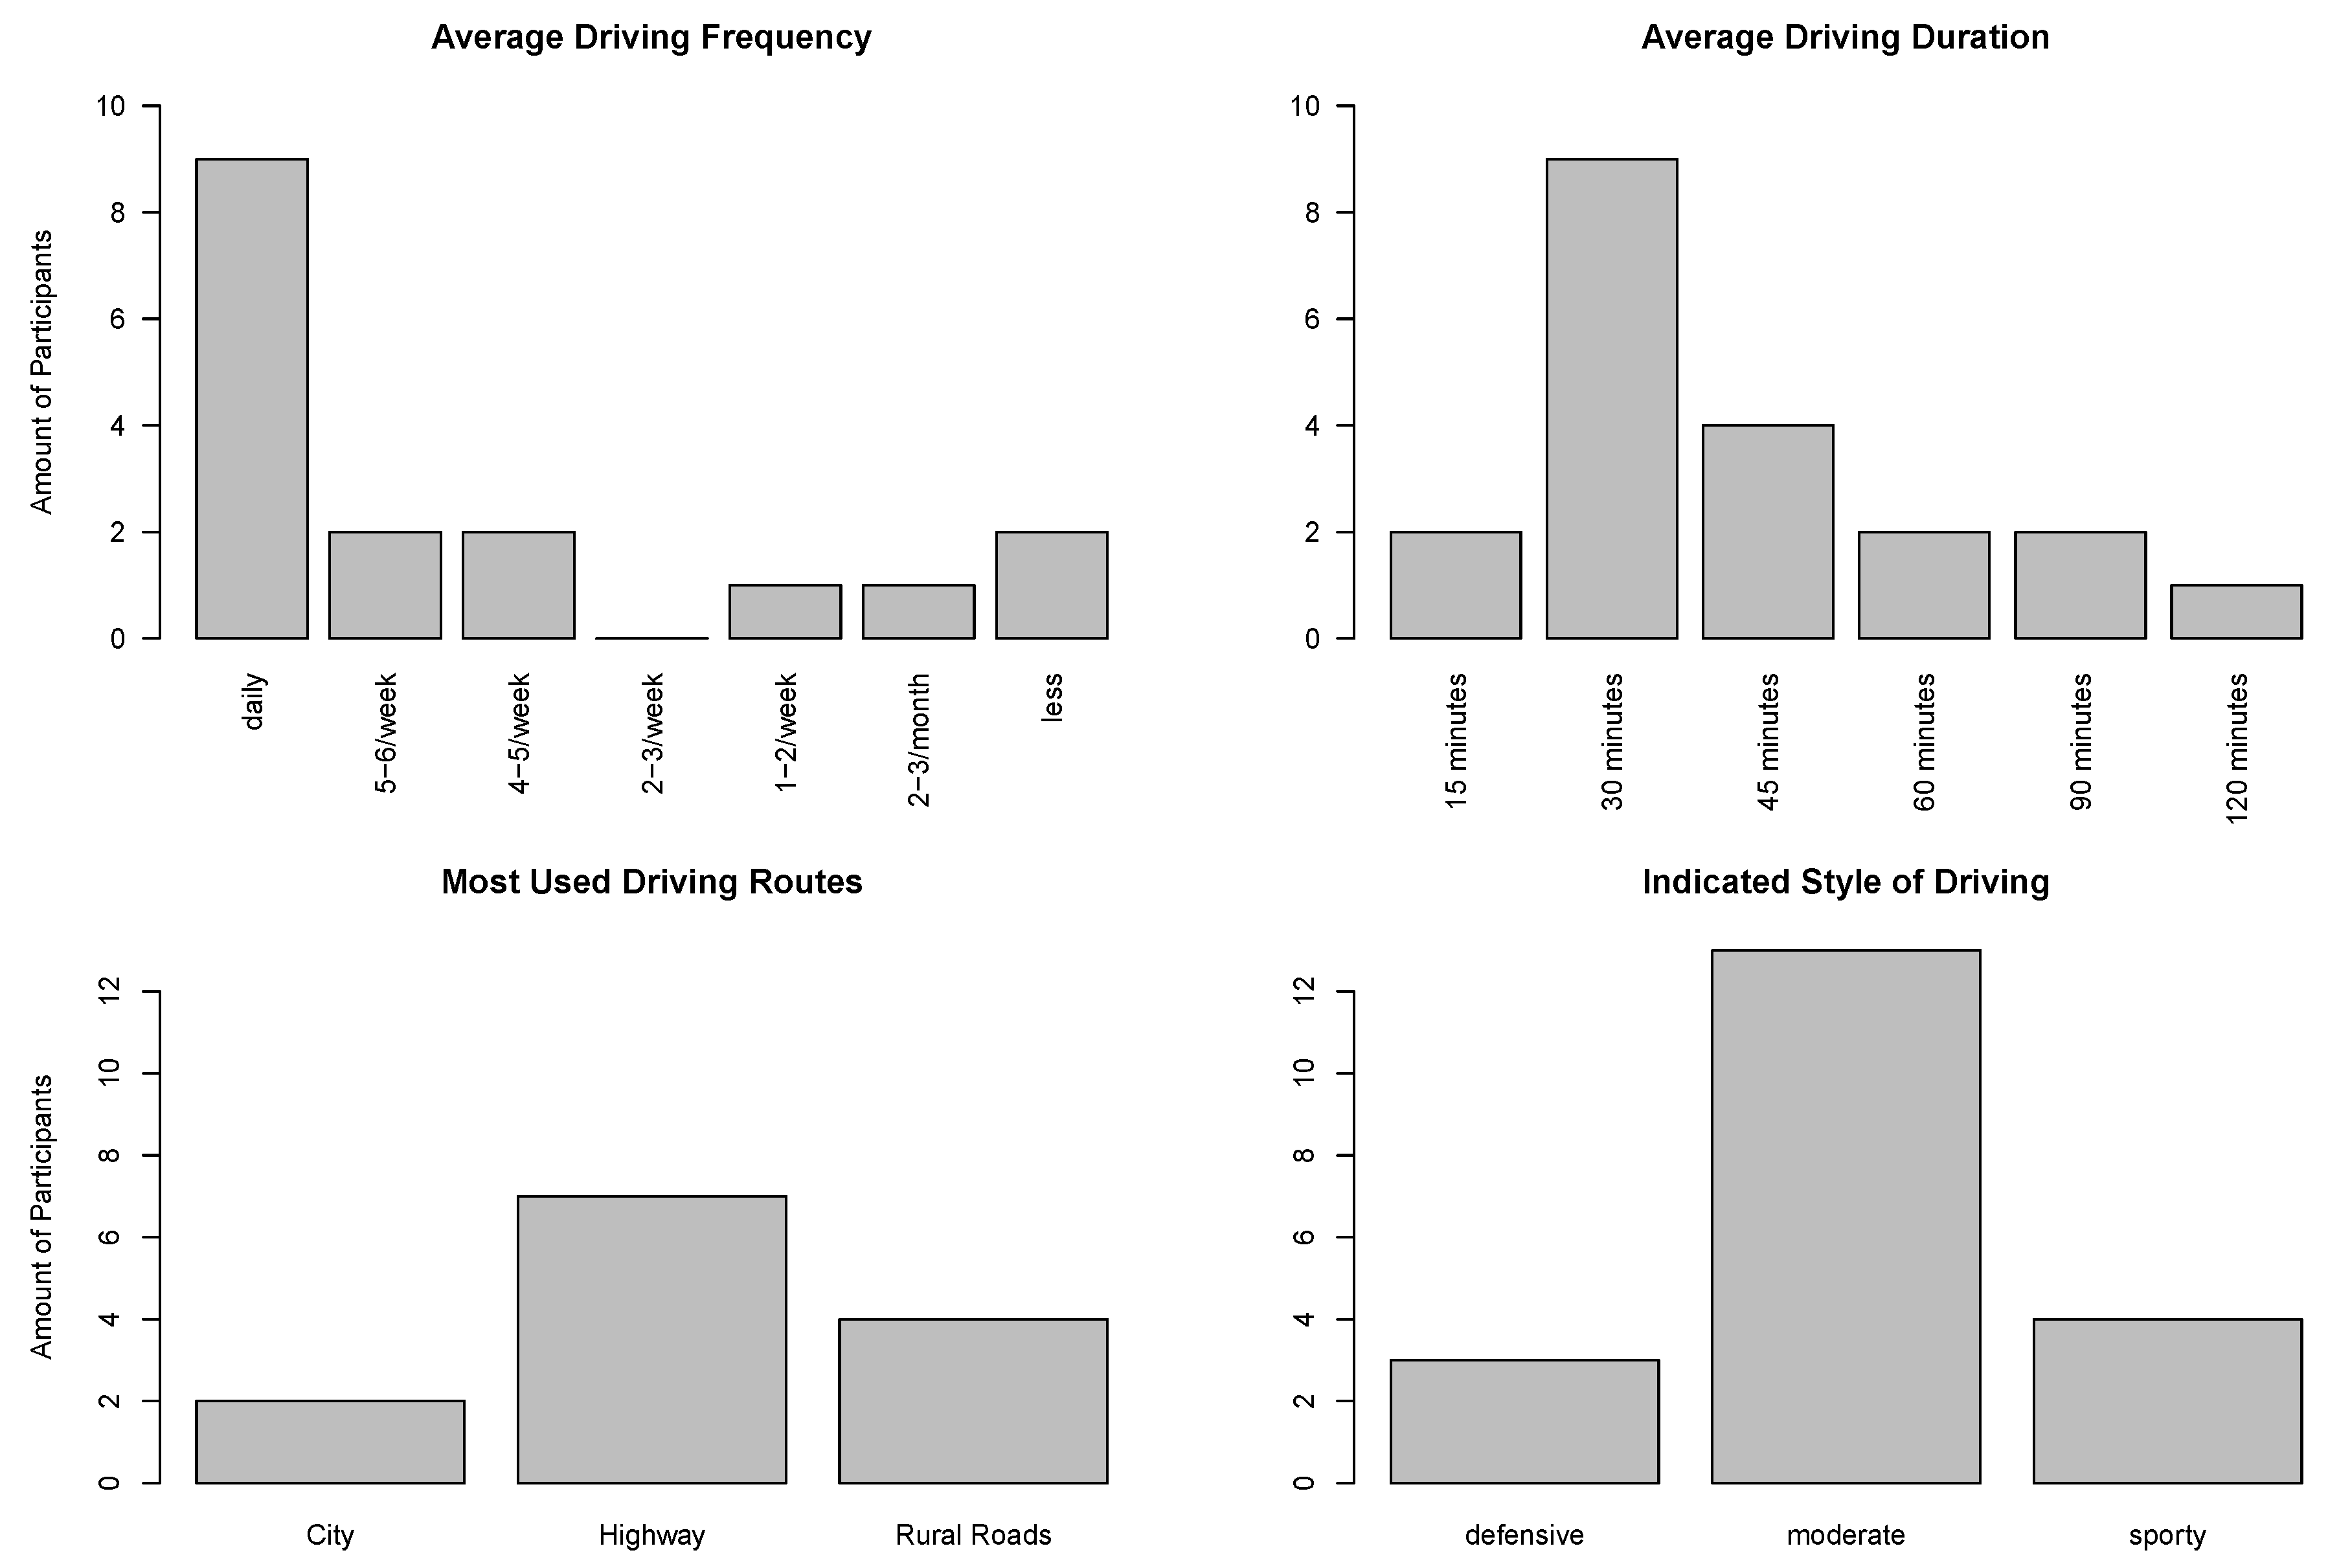
2.2. Participants
2.3. Variables and Measurements
2.3.1. Objective Complexity
2.3.2. Familiarity
2.3.3. Subjective Complexity
2.3.4. Takeover Quality
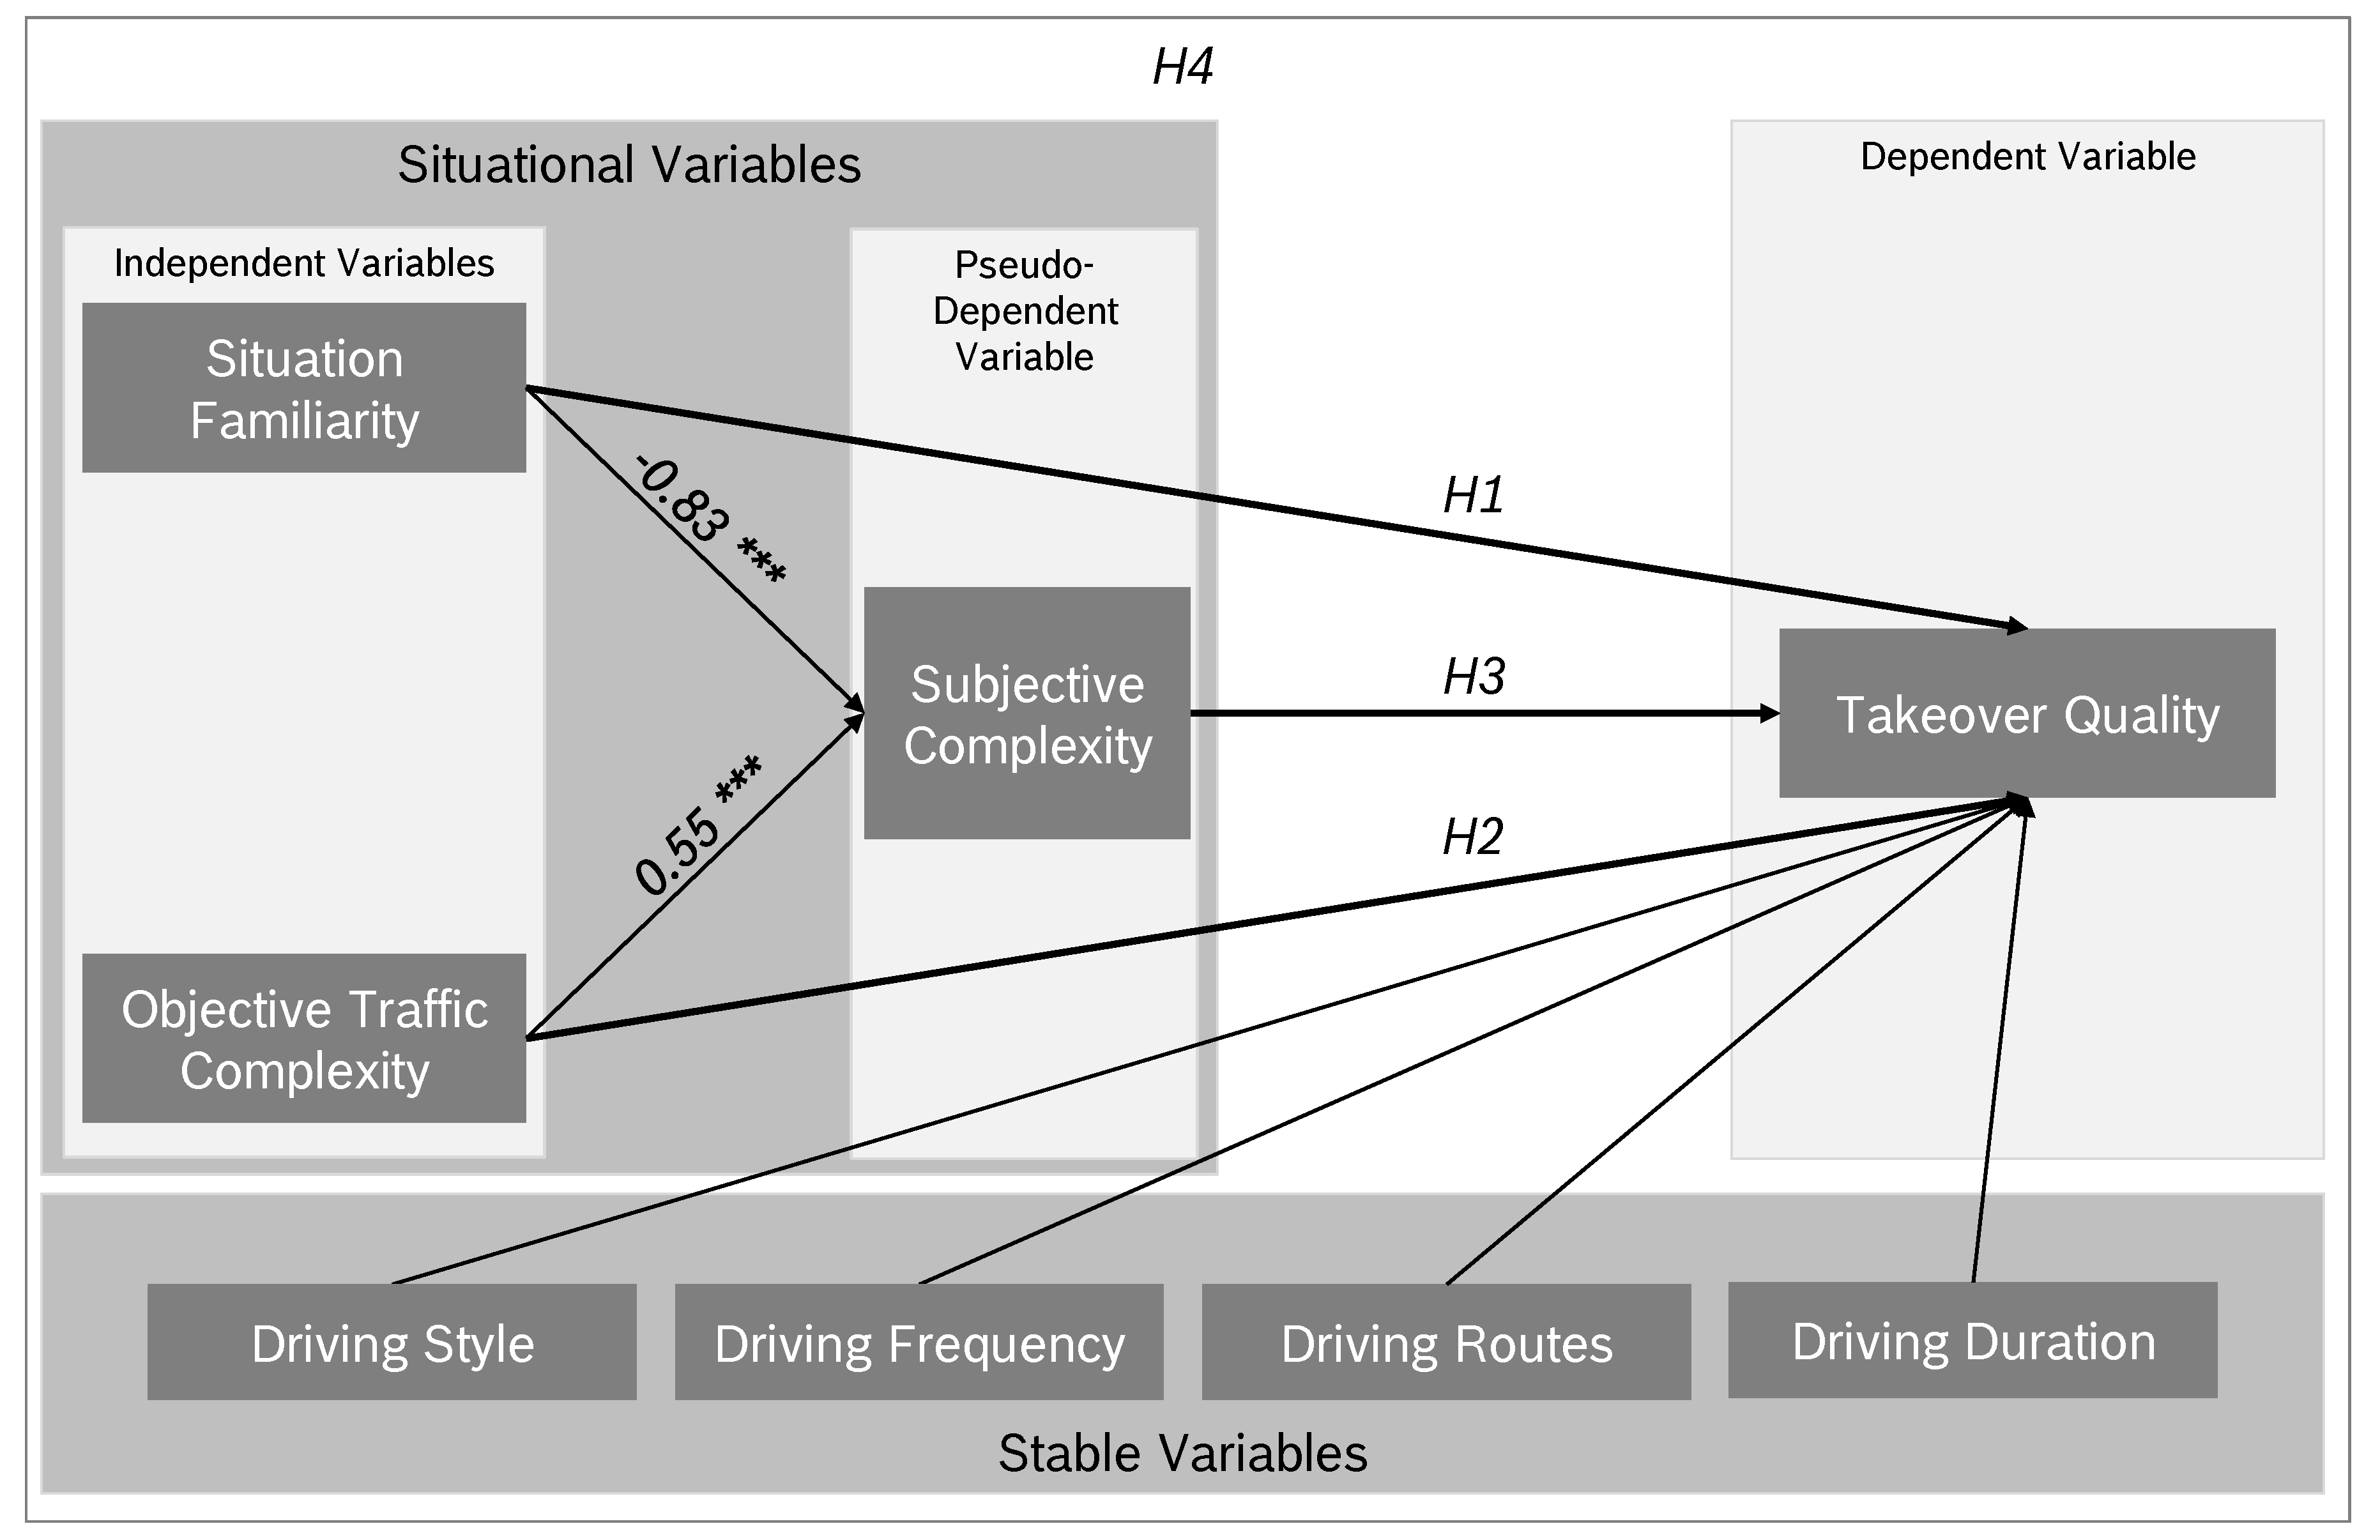
3. Results
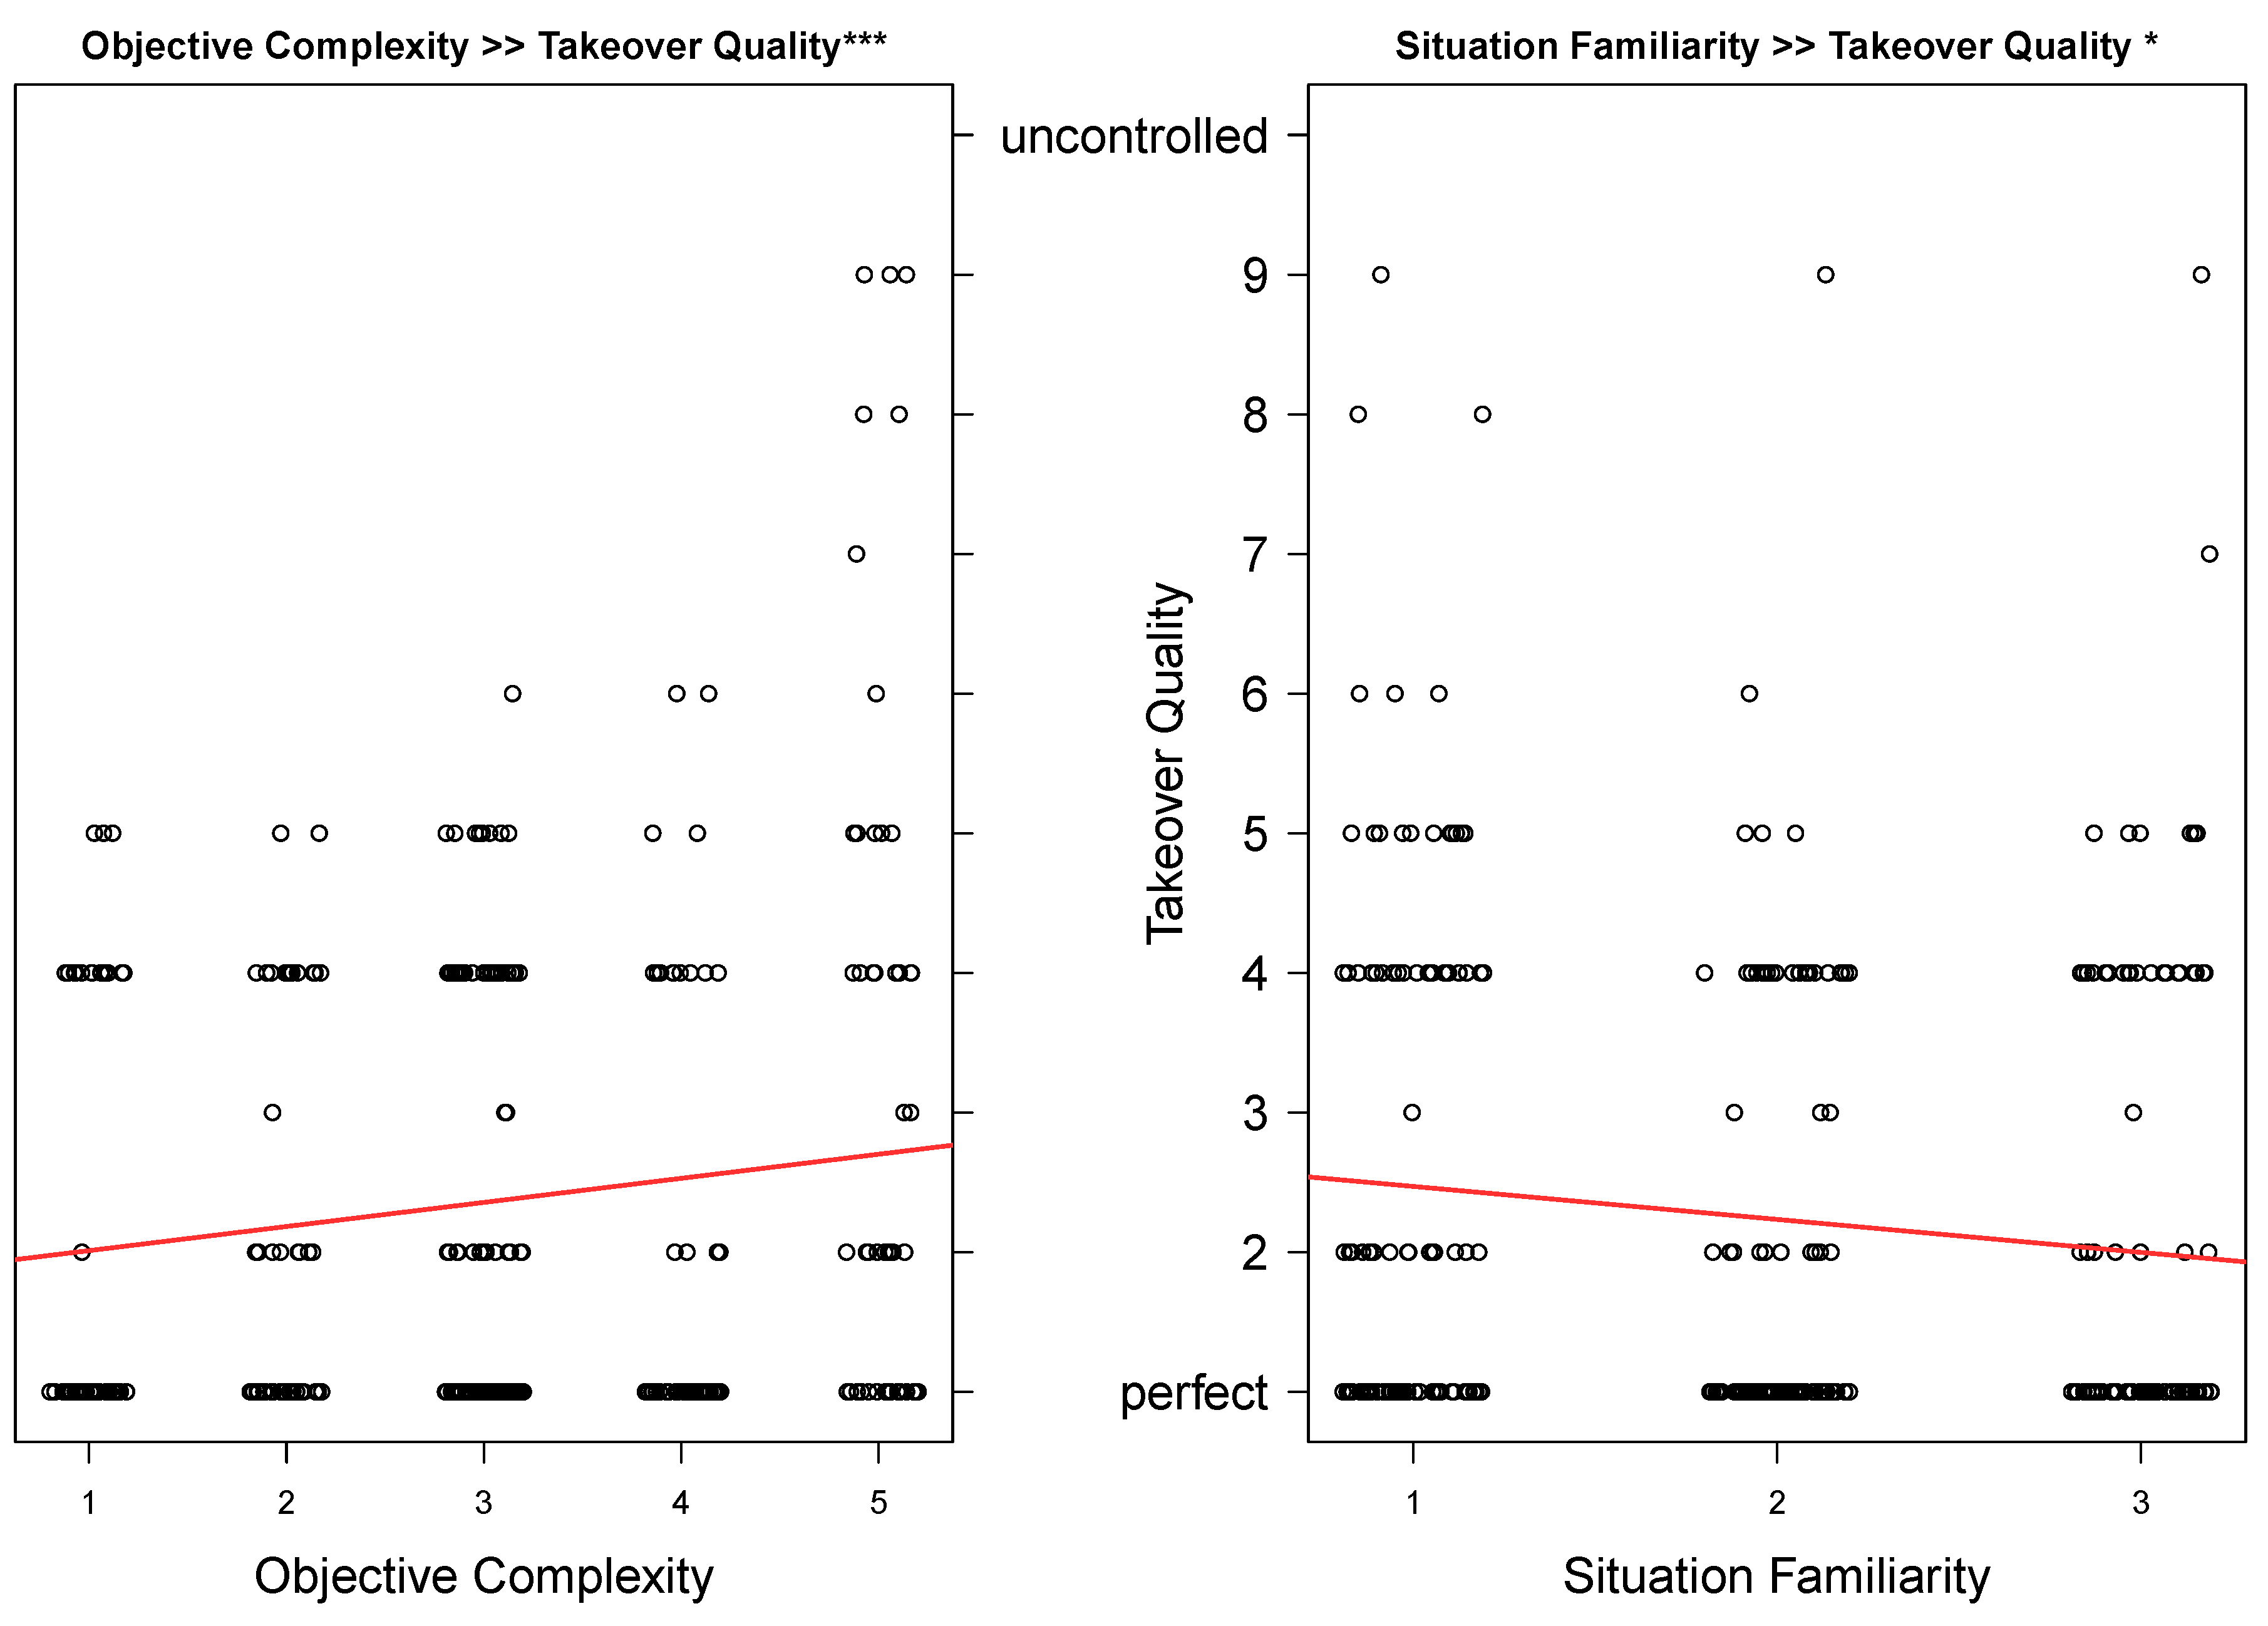
3.1. The Impact of Familiarity on Takeover Quality (H1)
3.2. The Impact of Objective Complexity on Takeover Quality (H2)
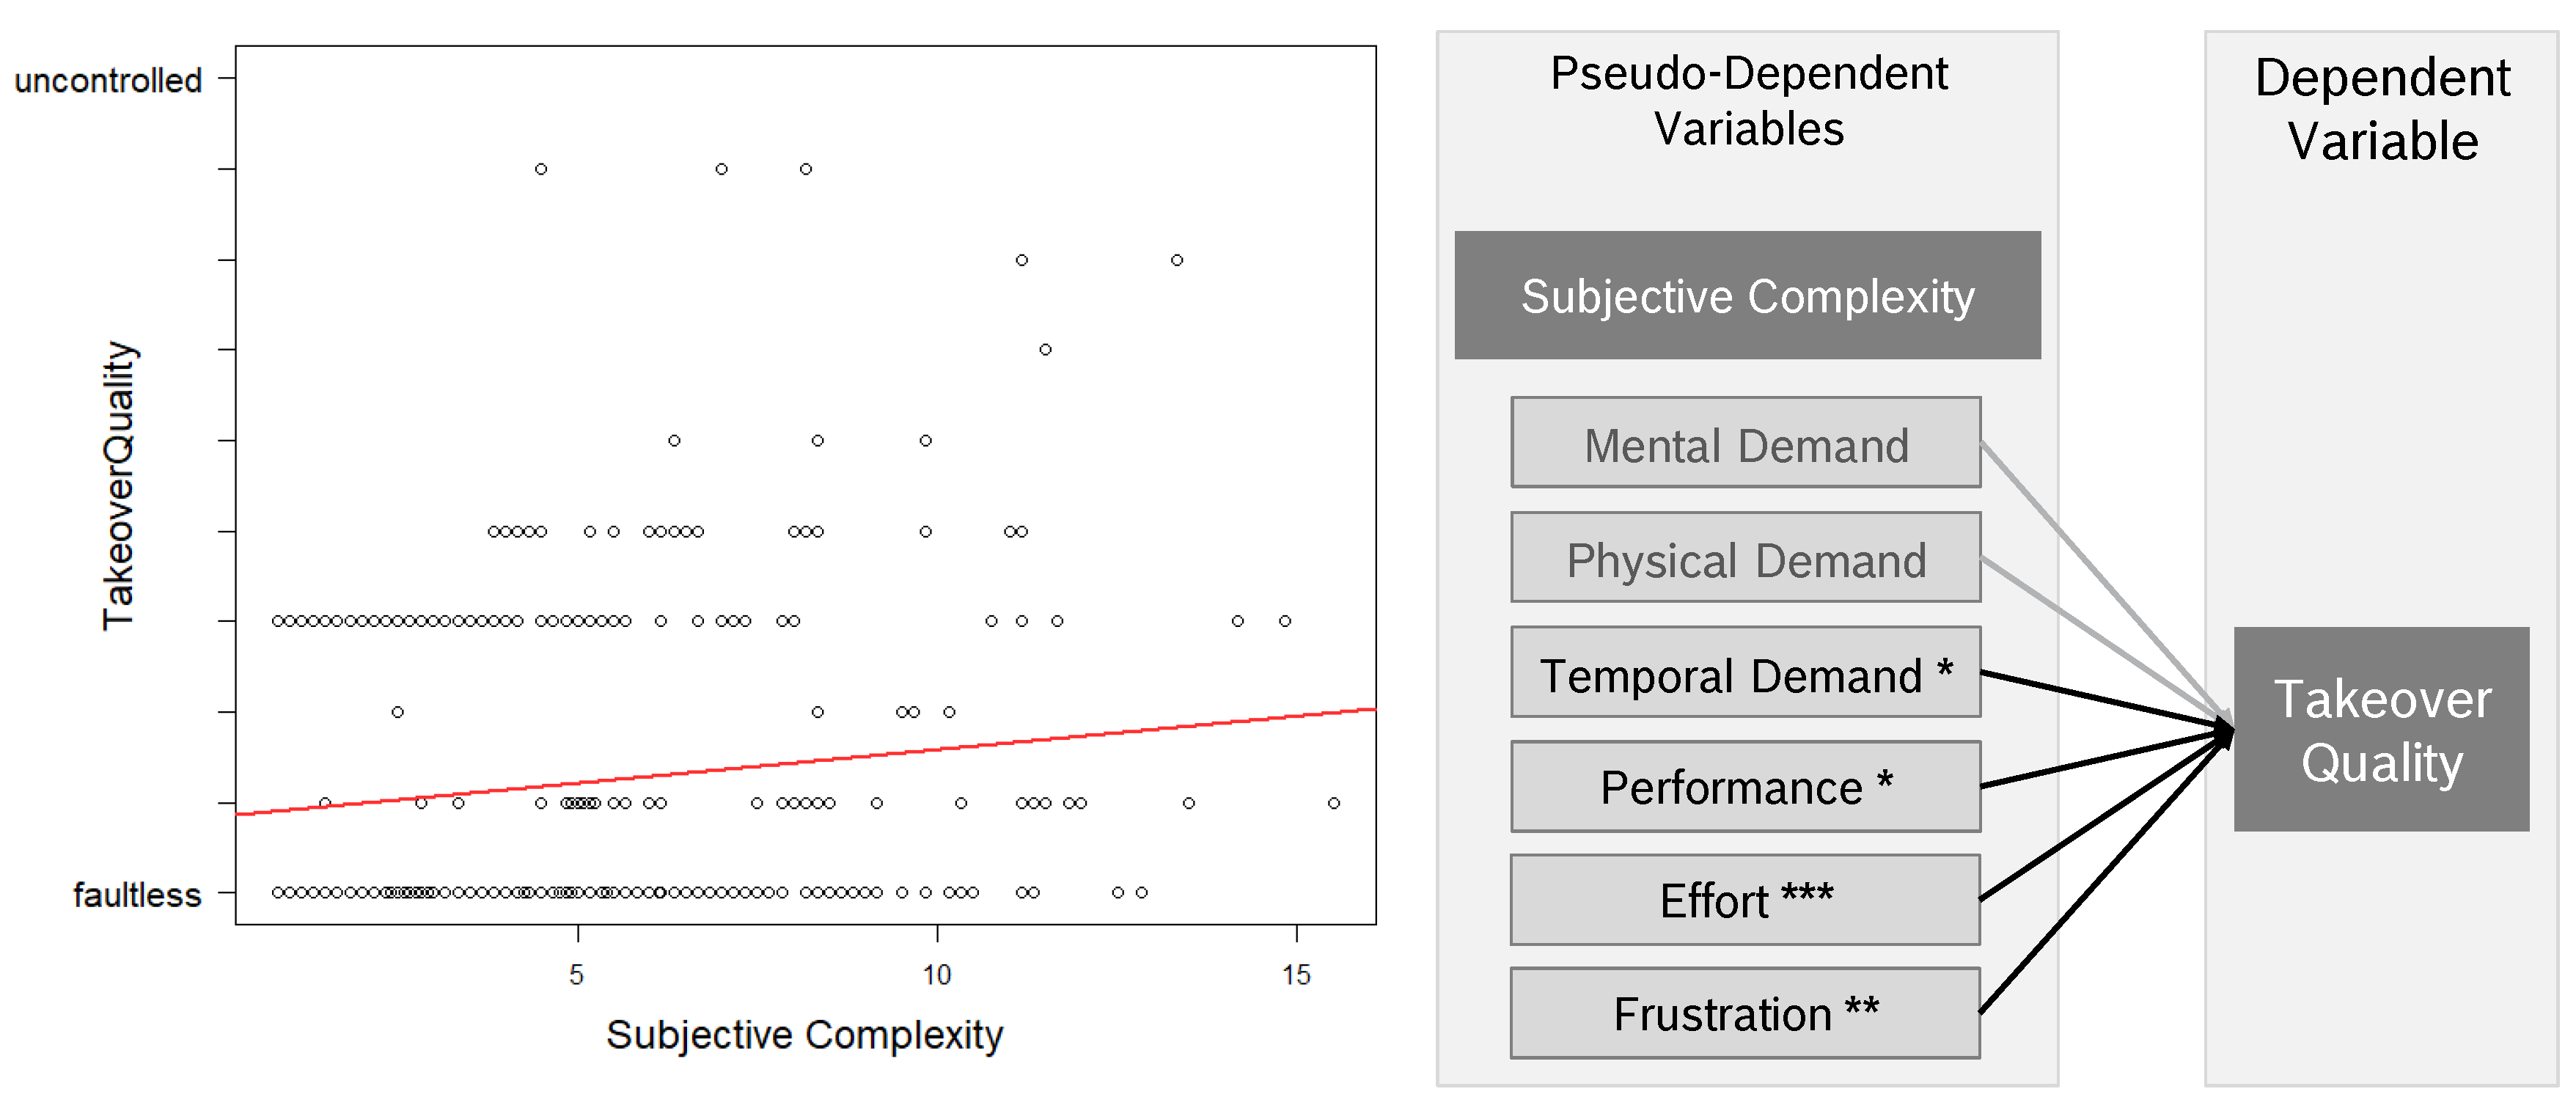
3.3. The Impact of Subjective Complexity on Takeover Quality (H3)
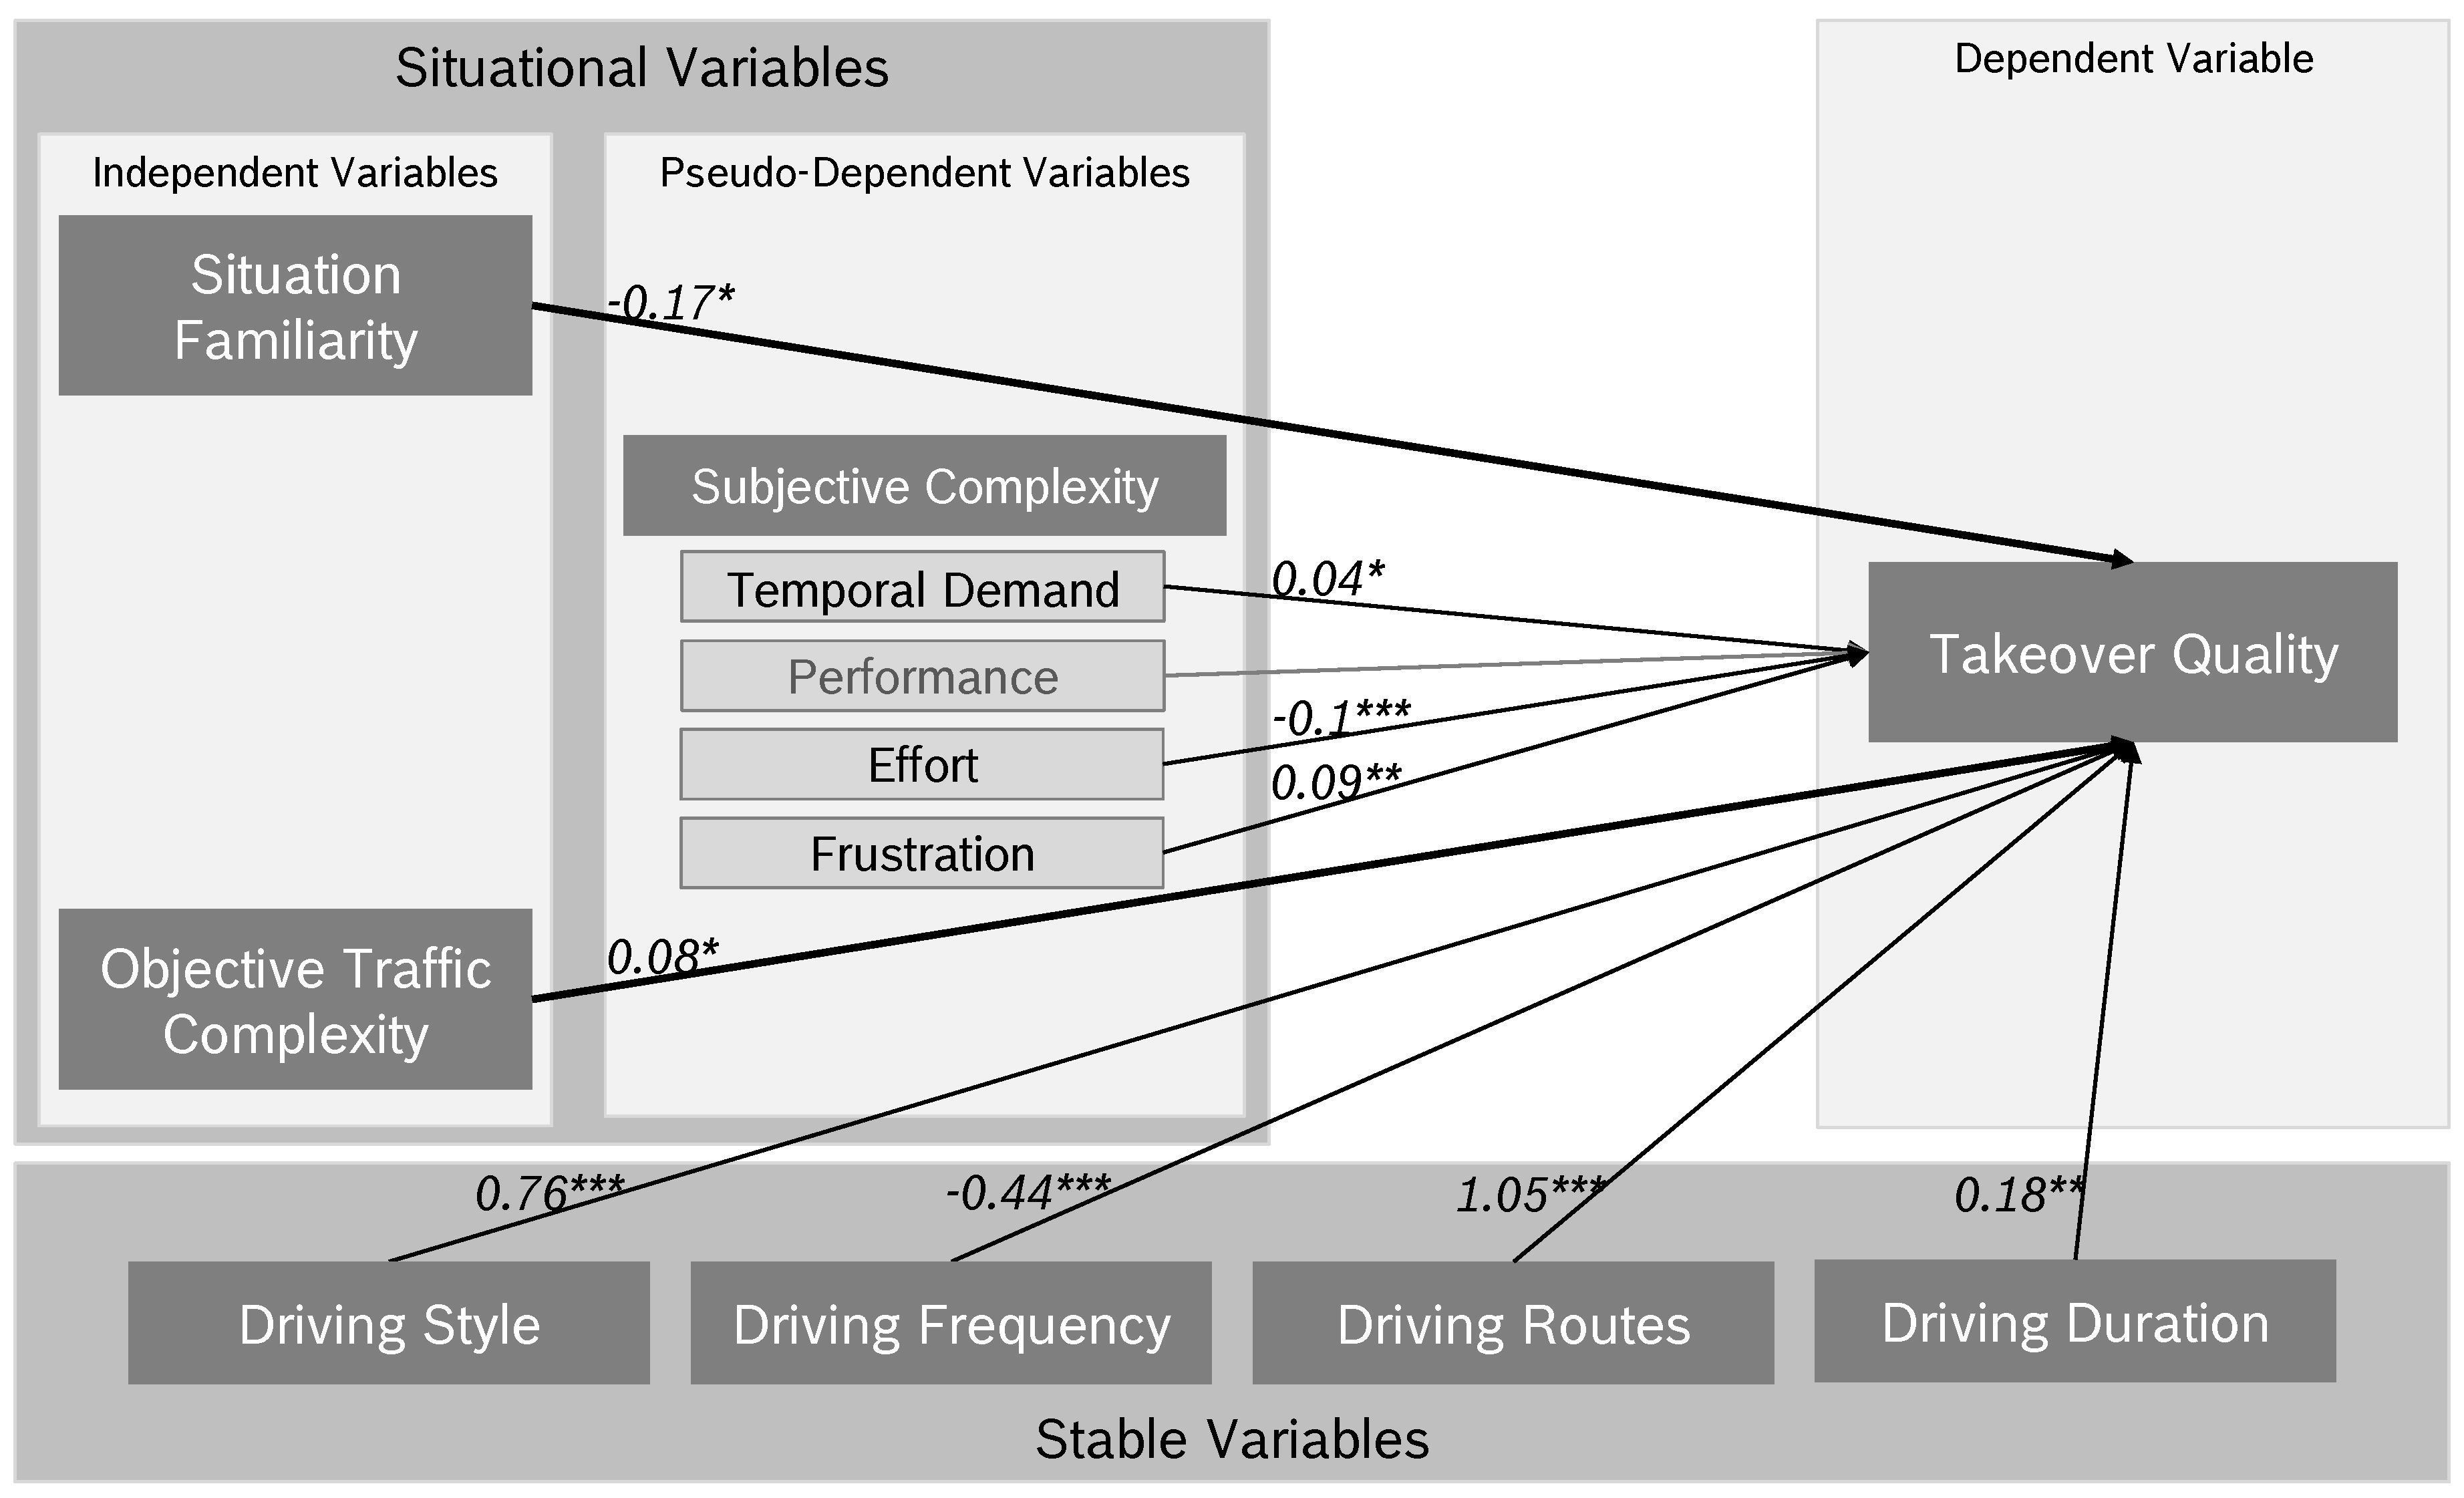
3.4. Multiple Regression Analysis on Takeover Quality Including Stable Driver Variables (H4)
4. Discussion
5. Conclusions
Author Contributions
Funding
Acknowledgments
Conflicts of Interest
Abbreviations
| HMI | Human Machine Interface |
| NASA-TLX | NASA Task Load Index |
| NDRT | Non driving related task |
| TOC | Take-over controllability rating |
| TOR | Takeover request |
References
- Gold, C.; Happee, R.; Bengler, K. Modeling take-over performance in level 3 conditionally automated vehicles. Accid. Anal. Prev. 2018, 116, 3–13. [Google Scholar] [CrossRef] [PubMed]
- SAE-International. Taxonomy and Definitions for Terms Related to On-Road Motor Vehicle Automated Driving Systems. Available online: https://www.sae.org/standards/content/j3016_201806/ (accessed on 18 February 2020).
- Eriksson, A.; Stanton, N.A. Takeover time in highly automated vehicles: Noncritical transitions to and from manual control. Hum. Factors 2017, 59, 689–705. [Google Scholar] [CrossRef] [PubMed]
- National Highway Traffic Safety Administration. Preliminary Statement of Policy Concerning Automated Vehicles; National Highway Traffic Safety Administration: Washington, DC, USA, 2013; pp. 1–14.
- Kerschbaum, P.; Lorenz, L.; Bengler, K. A transforming steering wheel for highly automated cars. In Proceedings of the 2015 IEEE Intelligent Vehicles Symposium (IV), Seoul, Korea, 28 June–1 July 2015; pp. 1287–1292. [Google Scholar]
- Zeeb, K.; Buchner, A.; Schrauf, M. What determines the take-over time? An integrated model approach of driver take-over after automated driving. Accid. Anal. Prev. 2015, 78, 212–221. [Google Scholar] [CrossRef] [PubMed]
- Gold, C.; Körber, M.; Lechner, D.; Bengler, K. Taking over control from highly automated vehicles in complex traffic situations: The role of traffic density. Hum. Factors 2016, 58, 642–652. [Google Scholar] [CrossRef] [PubMed]
- Radlmayr, J.; Gold, C.; Lorenz, L.; Farid, M.; Bengler, K. How Traffic Situations and Non-Driving Related Tasks Affect the Take-Over Quality in Highly Automated Driving. Sage J. 2014, 58, 2063–2067. [Google Scholar] [CrossRef] [Green Version]
- Scharfe, M.; Russwinkel, N. The Individual in the Loop—The Influence of Familiarity and Complexity during a Takeover in Highly Automated Driving. 2020; in press. [Google Scholar]
- Larsson, A.F.; Kircher, K.; Hultgren, J.A. Learning from experience: Familiarity with ACC and responding to a cut-in situation in automated driving. Transp. Res. Part F Traffic Psychol. Behav. 2014, 27, 229–237. [Google Scholar] [CrossRef]
- Paxion, J.; Galy, E.; Berthelon, C. Overload depending on driving experience and situation complexity: Which strategies faced with a pedestrian crossing? Appl. Ergon. 2015, 51, 343–349. [Google Scholar] [CrossRef] [PubMed] [Green Version]
- Haerem, T.; Rau, D. The influence of degree of expertise and objective task complexity on perceived task complexity and performance. J. Appl. Psychol. 2007, 92, 1320. [Google Scholar] [CrossRef] [PubMed]
- WIVW-GmbH. Driving Simulation and SILAB. 2014. Available online: https://wivw.de/en/silab (accessed on 7 September 2019).
- Hart, S.G. NASA Task load Index (TLX); NASA’s—Ames Research Center: Mountain View, CA, USA, 1986; Volume 1. [Google Scholar]
- Gross, U. Bestimmung Von Schwierigkeitsgraden in Einer Zu Entwickelnden Versuchsumgebung. Master’s Thesis, Humboldt Universität zu Berlin, Berlin, Germany, November 2004. [Google Scholar]
- Pfendler, C. Vergleichende Bewertung der NASA-TLX-Skala und der Zeis-Skala bei der Erfassung von Lernprozessen; Technische Informationsbibliothek (TIB): Hannover, Germany, 1991. [Google Scholar]
- Nygren, T. Psychometric properties of subjective workload measurement techniques: Implications for their use in the assessment of perceived mental workload. Hum. Factors 1991, 33, 17–33. [Google Scholar] [CrossRef]
- Naujoks, F.; Wiedemann, K.; Schömig, N.; Jarosch, O.; Gold, C. Expert-based controllability assessment of control transitions from automated to manual driving. MethodsX 2018, 5, 579–592. [Google Scholar] [CrossRef] [PubMed]
- Hayhoe, M. Advances in relating eye movements and cognition. Infancy 2004, 6, 267–274. [Google Scholar] [CrossRef]
- Recarte, M.A. Nunes, L.M. Effects of verbal and spatial-imagery tasks on eye fixations while driving. J. Exp. Psychol. Appl. 2000, 6, 31. [Google Scholar] [CrossRef]
- Miyaji, M.; Kawanaka, H.; Oguri, K. Driver’s cognitive distraction detection using physiological features by the adaboost. In Proceedings of the 12th International IEEE Conference on Intelligent Transportation Systems (ITSC’09), St. Louis, MO, USA, 4–7 October 2009; pp. 1–6. [Google Scholar]
- De Winter, J.C.; Happee, R.; Martens, M.H.; Stanton, N.A. Effects of adaptive cruise control and highly automated driving on workload and situation awareness: A review of the empirical evidence. Transp. Res. Part F Traffic Psychol. Behav. 2014, 27, 196–217. [Google Scholar] [CrossRef] [Green Version]


© 2020 by the authors. Licensee MDPI, Basel, Switzerland. This article is an open access article distributed under the terms and conditions of the Creative Commons Attribution (CC BY) license (http://creativecommons.org/licenses/by/4.0/).
Share and Cite
Scharfe, M.S.L.; Zeeb, K.; Russwinkel, N. The Impact of Situational Complexity and Familiarity on Takeover Quality in Uncritical Highly Automated Driving Scenarios. Information 2020, 11, 115. https://0-doi-org.brum.beds.ac.uk/10.3390/info11020115
Scharfe MSL, Zeeb K, Russwinkel N. The Impact of Situational Complexity and Familiarity on Takeover Quality in Uncritical Highly Automated Driving Scenarios. Information. 2020; 11(2):115. https://0-doi-org.brum.beds.ac.uk/10.3390/info11020115
Chicago/Turabian StyleScharfe, Marlene Susanne Lisa, Kathrin Zeeb, and Nele Russwinkel. 2020. "The Impact of Situational Complexity and Familiarity on Takeover Quality in Uncritical Highly Automated Driving Scenarios" Information 11, no. 2: 115. https://0-doi-org.brum.beds.ac.uk/10.3390/info11020115