A Big Data Analytics Approach for the Development of Advanced Cardiology Applications


1
Department of Mathematics, Computer, Physics and Hearth Sciences (MIFT), University of Messina, 98122 Messina, Italy
2
BIG DATA Laboratory, CINI–Consorzio Interuniversitario Nazionale per l’Informatica, 00185 Rome, Italy
3
IRCCS Centro Neurolesi “Bonino-Pulejo”, 98124 Messina, Italy
*
Author to whom correspondence should be addressed.
†
Current address: Viale F. Stagno d’Alcontres, 31 98166 Messina, Italy.
Information 2020, 11(2), 60; https://0-doi-org.brum.beds.ac.uk/10.3390/info11020060
Submission received: 16 November 2019
/
Revised: 20 January 2020
/
Accepted: 20 January 2020
/
Published: 23 January 2020
(This article belongs to the Special Issue Big Data Evaluation and Non-Relational Databases in eHealth)
Abstract
:Nowadays, we are observing a growing interest about Big Data applications in different healthcare sectors. One of this is definitely cardiology. In fact, electrocardiogram produces a huge amount of data about the heart health status that need to be stored and analysed in order to detect a possible issues. In this paper, we focus on the arrhythmia detection problem. Specifically, our objective is to address the problem of distributed processing considering big data generated by electrocardiogram (ECG) signals in order to carry out pre-processing analysis. Specifically, an algorithm for the identification of heartbeats and arrhythmias is proposed. Such an algorithm is designed in order to carry out distributed processing over the Cloud since big data could represent the bottleneck for cardiology applications. In particular, we implemented the Menard algorithm in Apache Spark in order to process big data coming form ECG signals in order to identify arrhythmias. Experiments conducted using a dataset provided by the Physionet.org European ST-T Database show an improvement in terms of response times. As highlighted by our outcomes, our solution provides a scalable and reliable system, which may address the challenges raised by big data in healthcare.
1. Introduction
Healthcare is facing many challenges such as costs reduction for providing more efficient services, integration of new generation cutting-edge electronic medical devices and efficient analysis of a big amount of health data. Although the healthcare sector has been quite reluctant so far about the adoption of new emerging cutting-edge ICT technologies, both private and public healthcare operators have begun to encourage the adoption of such technologies envisioning the possibility to improve services, but at the same time reducing costs and improving revenues.
Among these, a particular attention is given to the adoption of Big Data analytics solutions. In fact, health data in many healthcare sectors are characterized by the well-known “three-v” typical of Big Data, i.e., volume, velocity and variety. Moreover, an in-depth analysis of Big Data performed by means of high-processing decision making systems help healthcare operators to predict diagnosis.
In this scientific work, we focus on Big Data analytics in cardiology. Data generated by electrocardiogram (ECG) signals observed in critical patients who are continuously monitored are an example of Big Data. In particular, by analysing ECG signals reporting the patient’s heart health status, our objective is to detect arrhythmias, i.e., problems with the rate or rhythm of the heartbeat. To this end, we choose to use the Menard algorithm and simplified relations for arrhythmias identification such as Tachycardia, Brachycardia, Asystole, etc. Specifically, the heart rhythm was calculated considering R-R intervals, i.e., the time elapsed between two successive R waves of the Q, R and S sequence of waves (that are referred with the term QRS complex) in the ECG.
We implemented such an algorithm considering Apache Spark, i.e., an open-source distributed general-purpose cluster-computing framework. Spark provides an interface for programming entire clusters with implicit data parallelism and fault tolerance. Spark facilitates the implementation of both iterative algorithms in parallel and interactive/exploratory data analysis. The choice to adopt Spark is motivated by the fact that applications can be reduced by several orders of magnitude compared to other alternative solutions such as Apache Hadoop MapReduce. We stress that the aim of this paper is to study a solution able to process ECG big data for arrthymia detection that can be deployed over either a private clinical or public Cloud. Consequent concerns regarding security and privacy during data transfer to/from the Cloud are out of the scope of this paper.
Experiments, were conducted considering a real case of study based on a dataset provided by the Physionet.org European ST-T Database that includes data used for the evaluation of algorithms analysing ST and T wave changes in ECG.
Experimental results show good response times and represent the bases for the development of future complex cardiology applications deployed over the Cloud.
This paper extends our previous scientific work [1] providing additional methodological details and experimental results that allow to analyse the scalability of the system in the perspective of using big data sources.
The rest of the paper is organized as follows. Section 2 provides a brief summary about the state of the art. Basic concepts regarding hearth physiognomy and ECG are discussed in Section 3. The Menard algorithm and its parallel and distributed implementation by means of Spark is discussed in Section 4. Extensions of the Menard algorithm allowing to detect arrhythmia are discussed in Section 5. Experiments are discussed in Section 6. Section 7 concludes the paper with final considerations and light to the future.
2. Related Work
Many software solutions have been proposed up to now for the analysis of heart diseases. In this Section, in order to demonstrate the novelty of our research work, we provide a brief analysis of the state of the art.
Several initiatives available in literature use different algorithms for the analysis of ECG signals. The arrhythmia analysis requires the study of a ECG signals that can present noise. In order to address such an issue, an approach for detecting and eliminating five kinds of noises is discussed in [2]. In particular, if a piece of signal does not present any important information and can not be repaired, it can be deleted and remaining pieces of signals are recombined. An automatic detection of P-wave in an ECG for the identification of arrhythmia is discussed in [3]. Specifically, an improved method based on local distance transform, such as horizontal segments and rising or declining segment is proposed. Results prove the simplicity and efficiency of algorithms for transplanting to wearable medical devices whose processing ability is weak. A cardiovascular disease (CVD) detection algorithm is discussed in [4]. Its input is represented by patients’ demographic data and several ECG signal features that are automatically extracted by means of signal processing methods. Signals are sent from ECG sensors attached to Android smartphones of patients. Such an algorithm runs within a web based system that can be used by patients to check their heart health status when required. A report generator software package that analyses routine cardiology laboratory exams is discussed in [5]. Its main features are fast processing and easy access especially for non-computer experts. Case studies regarding nuclear cardiology, M-mode echocardiography and 24-h ambulatory electrocardiogram tapes reporting are analysed. A web-based Cardiology Web Picture Archiving and Communication System (PACS) is discussed in [6]. Specifically, a Digital Imaging and Communications in Medicine (DICOM) case study is presented guaranteeing medical images availability and accessibility. An alternative web-based solution, i.e., Hydra that helps the cardiovascular diagnosis and treatment also allowing to carry out more accurate clinical results and reducing costs is discussed in [7].
An approach using a cluster computing approach is the tele-ecg system [8]. Big Data coming from ECG signals are processed in order to identify and monitor heart diseases. Specifically, a cluster adopting the Apache Spark framework is discussed. Data are classified using decision tree and random forest approaches.
Two simulators, i.e., HeartLab and EkgLab, that helps the electrocardiogram interpretation are discussed in [9]. Specifically, requirements analysis, architectural design, patient modeling, programming language, implementation, and testing are discussed.
Recently, Cloud computing solutions have been used to develop arrhytmia detection services. An approach for transmitting data from several medical devices to Cloud storage is discussed in [10]. In particular, the blueprint of a system able to collect health Big Data and manage them by means of a workflow is discussed. A Cloud-based system able to detect arrhythmia in real-rime was presented in [11]. For reducing energy consumption in the mobile devices of a patients, lightweight tasks are processed locally, whereas the massive arrhythmia classification processing is moved over the Cloud. Experiments performed using data coming from the MIT-BIH arrhythmia database validated the efficiency and efficacy of the system. An alternative initiative for the processing and analysis of ECG Big Data is Cloudwave [12].
In recent years, also machine learning techniques have been adopted for arrhytmia detection. A review of arrhythmia detection approaches of using MIT-BIH arrhythmia database is discussed in [13]. Specifically, various techniques including neural networks and Support Vector Machine (SVM), etc are analysed also discussing next future challenges. An approach for the automatic classification of intracardiac electrograms (EGMs) is proposed in [14]. Specifically, a compression-based similarity measure (CSM) approach is adopted that reduce processing times compared with other CSM approaches available in literature. Using Machine Learning, a set of EGMs extracted from the Scientific COOperation Platform (SCOOP) database was classified in seven cardiac arrhythmia classes and one noise class. The improved accuracy of results allows improving patient diagnosis. A method based on Logistic Regression Multinomial (LRM) able to provide a powerful and accurate insight into arrhythmia detection is discussed in [15]. Specifically, LRM learns the posterior probability distributions of each class, in order to create knowledge-based system that helps to detect arrhythmia from Big Data sources. A high-precise arrhythmia detection method based on biorthogonal wavelets and fully connected neural networks is discussed in [16]. Biorthogonal spline wavelet is applied for QRS complex detection. Specifically, in the first stage, signals are decomposed with the equivalent filters of a biorthogonal wavelet by Mallat algorithm. After that, threshold and slope methods are used for auxiliary monitoring of QRS complex. In the end, a fully connected neural network is proposed for arrhythmia detection.
From the analysis of literature of cardiology applications, we highlight that most researchers are looking at Cloud-based applications whose back-end makes use of parallel processing systems. The objective of this paper is to contribute to improve such a state of the art, by proposing a solution for arrhythma detection by means of the implementation of the Menard algorithm by means of the Apache Spark framework. Even though, this is a preliminary study, we stress that our solution is highly scalable, able to manage Big Data and easy to be deployed in Cloud systems for the development of advanced cardiology services.
3. Overview on Heart Cycle and ECG
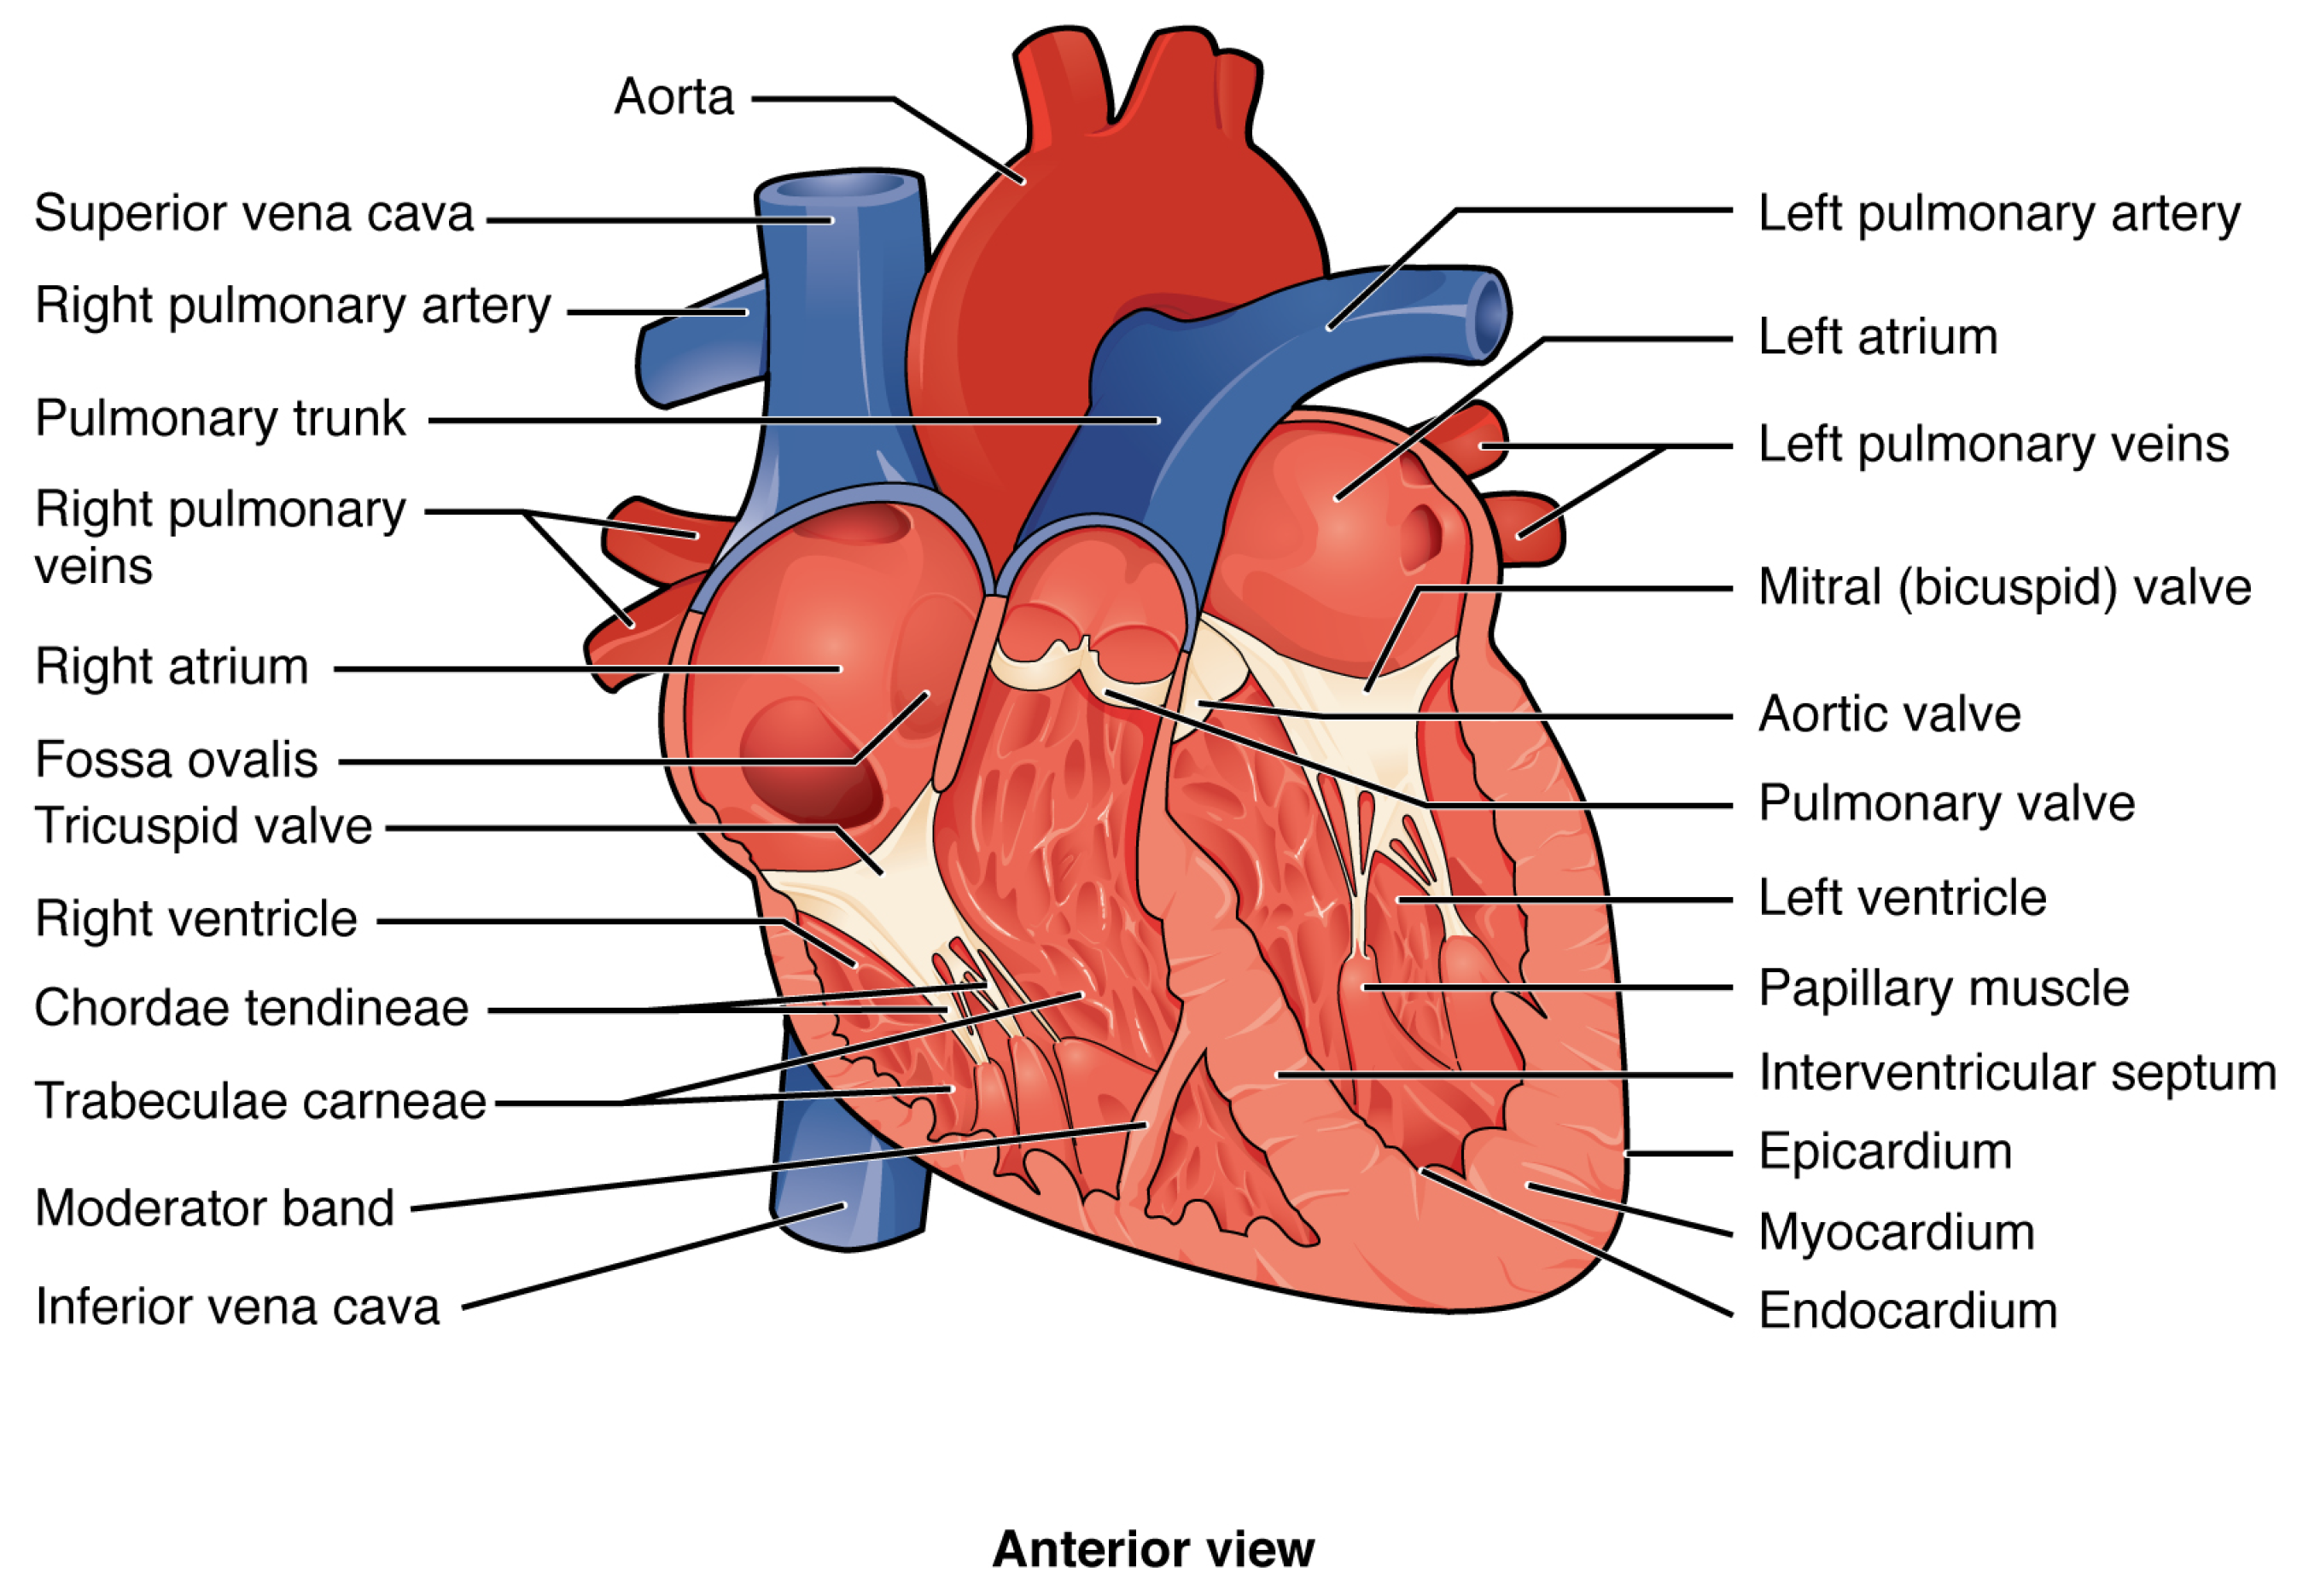
The cardiovascular system is composed both by a pump, that is the heart, and a tubular vessels network used to carry blood. The latter are divided into: arteries, veins and capillaries. The entire system contributes to oxygen and nutrients transport, body temperature regularization, hormones distribution and immunitary defense. The heart, the central organ, is located in thoracic cavity, between the lungs, behind the sternum and the ribs cartilage, in front of the spinal column and on the diaphragm.
3.1. The Heart Cycle
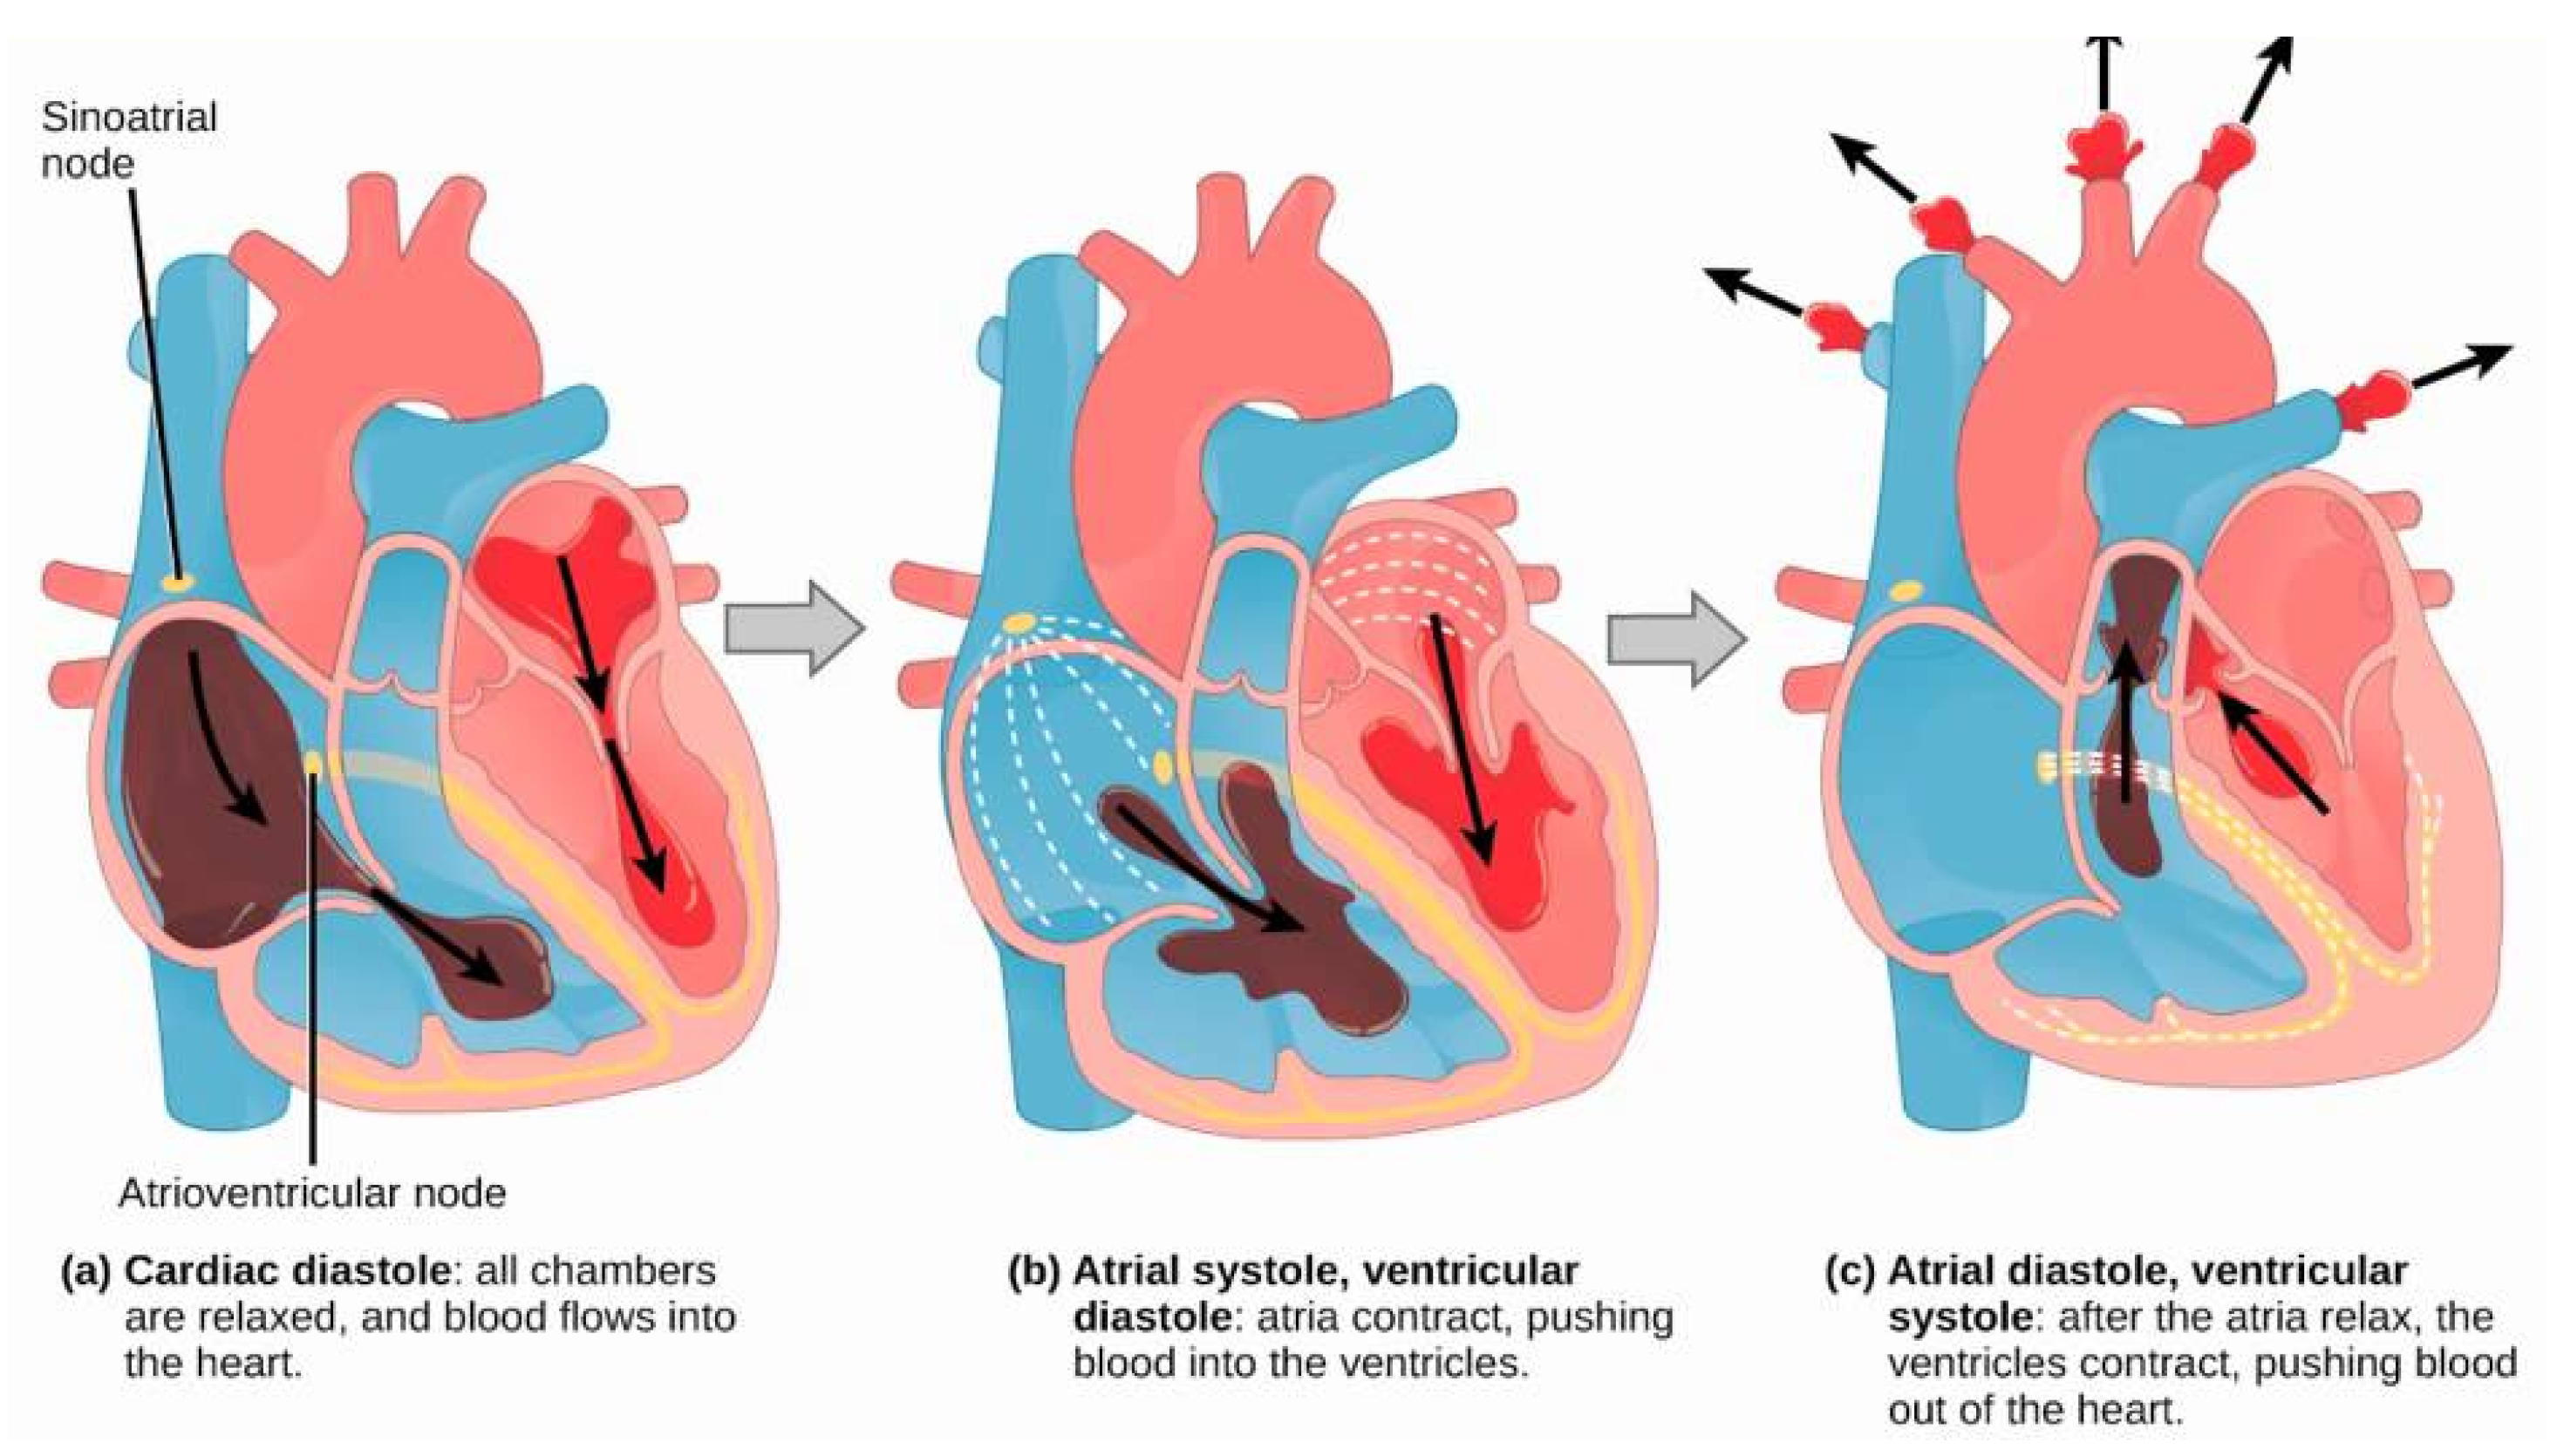
The heart, shown in Figure 1, constantly pushes blood around the organism. A full contraction and relaxation process is defined heart cycle (Figure 2), that is generally repeated about 75 times per minute. In particular, at the first stage (i.e., diastole) the heart is totally relaxed and the blood flows through its four cavities by means of the atriovascular valves opening. The second stage (i.e., systole) starts with a brief limbs contraction that fills ventricles with blood. Normally, ventricles contract for roughly 0.3 seconds. Contraction closes the atrioventricular valves, opens the semilunar valves and pushes blood into the large arteries. During the last stage, blood flows through the atrioventriculars.
3.2. ECG
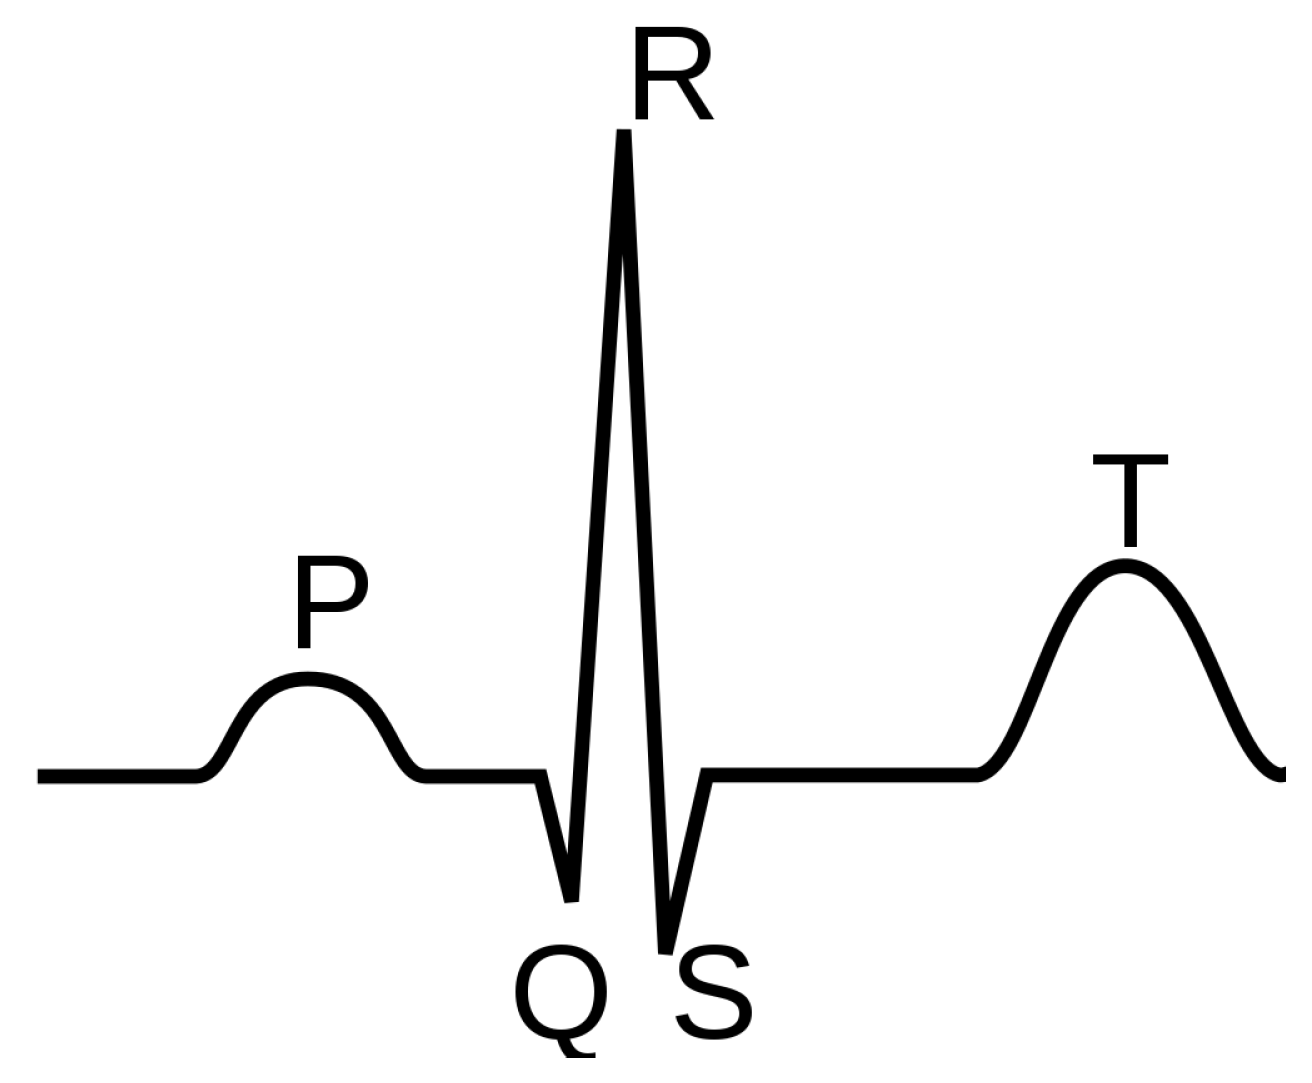
Electrocardiogram (ECG) is an instrumental diagnostic exam that graphically reports the electrical activity and the rhythm of the heart. It allows cardiologists to observe the health status and the possible presence of anomalies such as myocardial infarction, ischemia, heart arrhythmias, or any other outcome of a previous heart attack. Generally, a heart pathological condition creates an abnormal behavior of the muscle fibrocells. This causes in the ECG report a different pattern with respect to a standard one. However, also health people may manifest abnormal pattern that does not represent a heart disease. In this case, the medical opinion of an expert is always needed.
Each ECG exam generates positive and negative waves, according to the signal position compared to the baseline, called isoelectric. Each wave is the graphical representation of an electric phenomenon that occurs in the heart. In particular, as reported in the Figure 3, it is possible to consider five periods:
- P-Wave. Depolarization of atria in response to SinoAtrial (SA) node triggering.
- PR Interval. Delaty of AV node to allowing filling of ventricles.
- QRS Complex. Depolarization of ventricles triggering main pumping contractions.
- ST Segment. Beginning of ventricle repolarization, shoud be flat.
- T-Wave. Ventricular repolarization.
For our purpose, here we consider the QRS complex as the stimulus propagation to the ventricular muscle.
4. Application Design
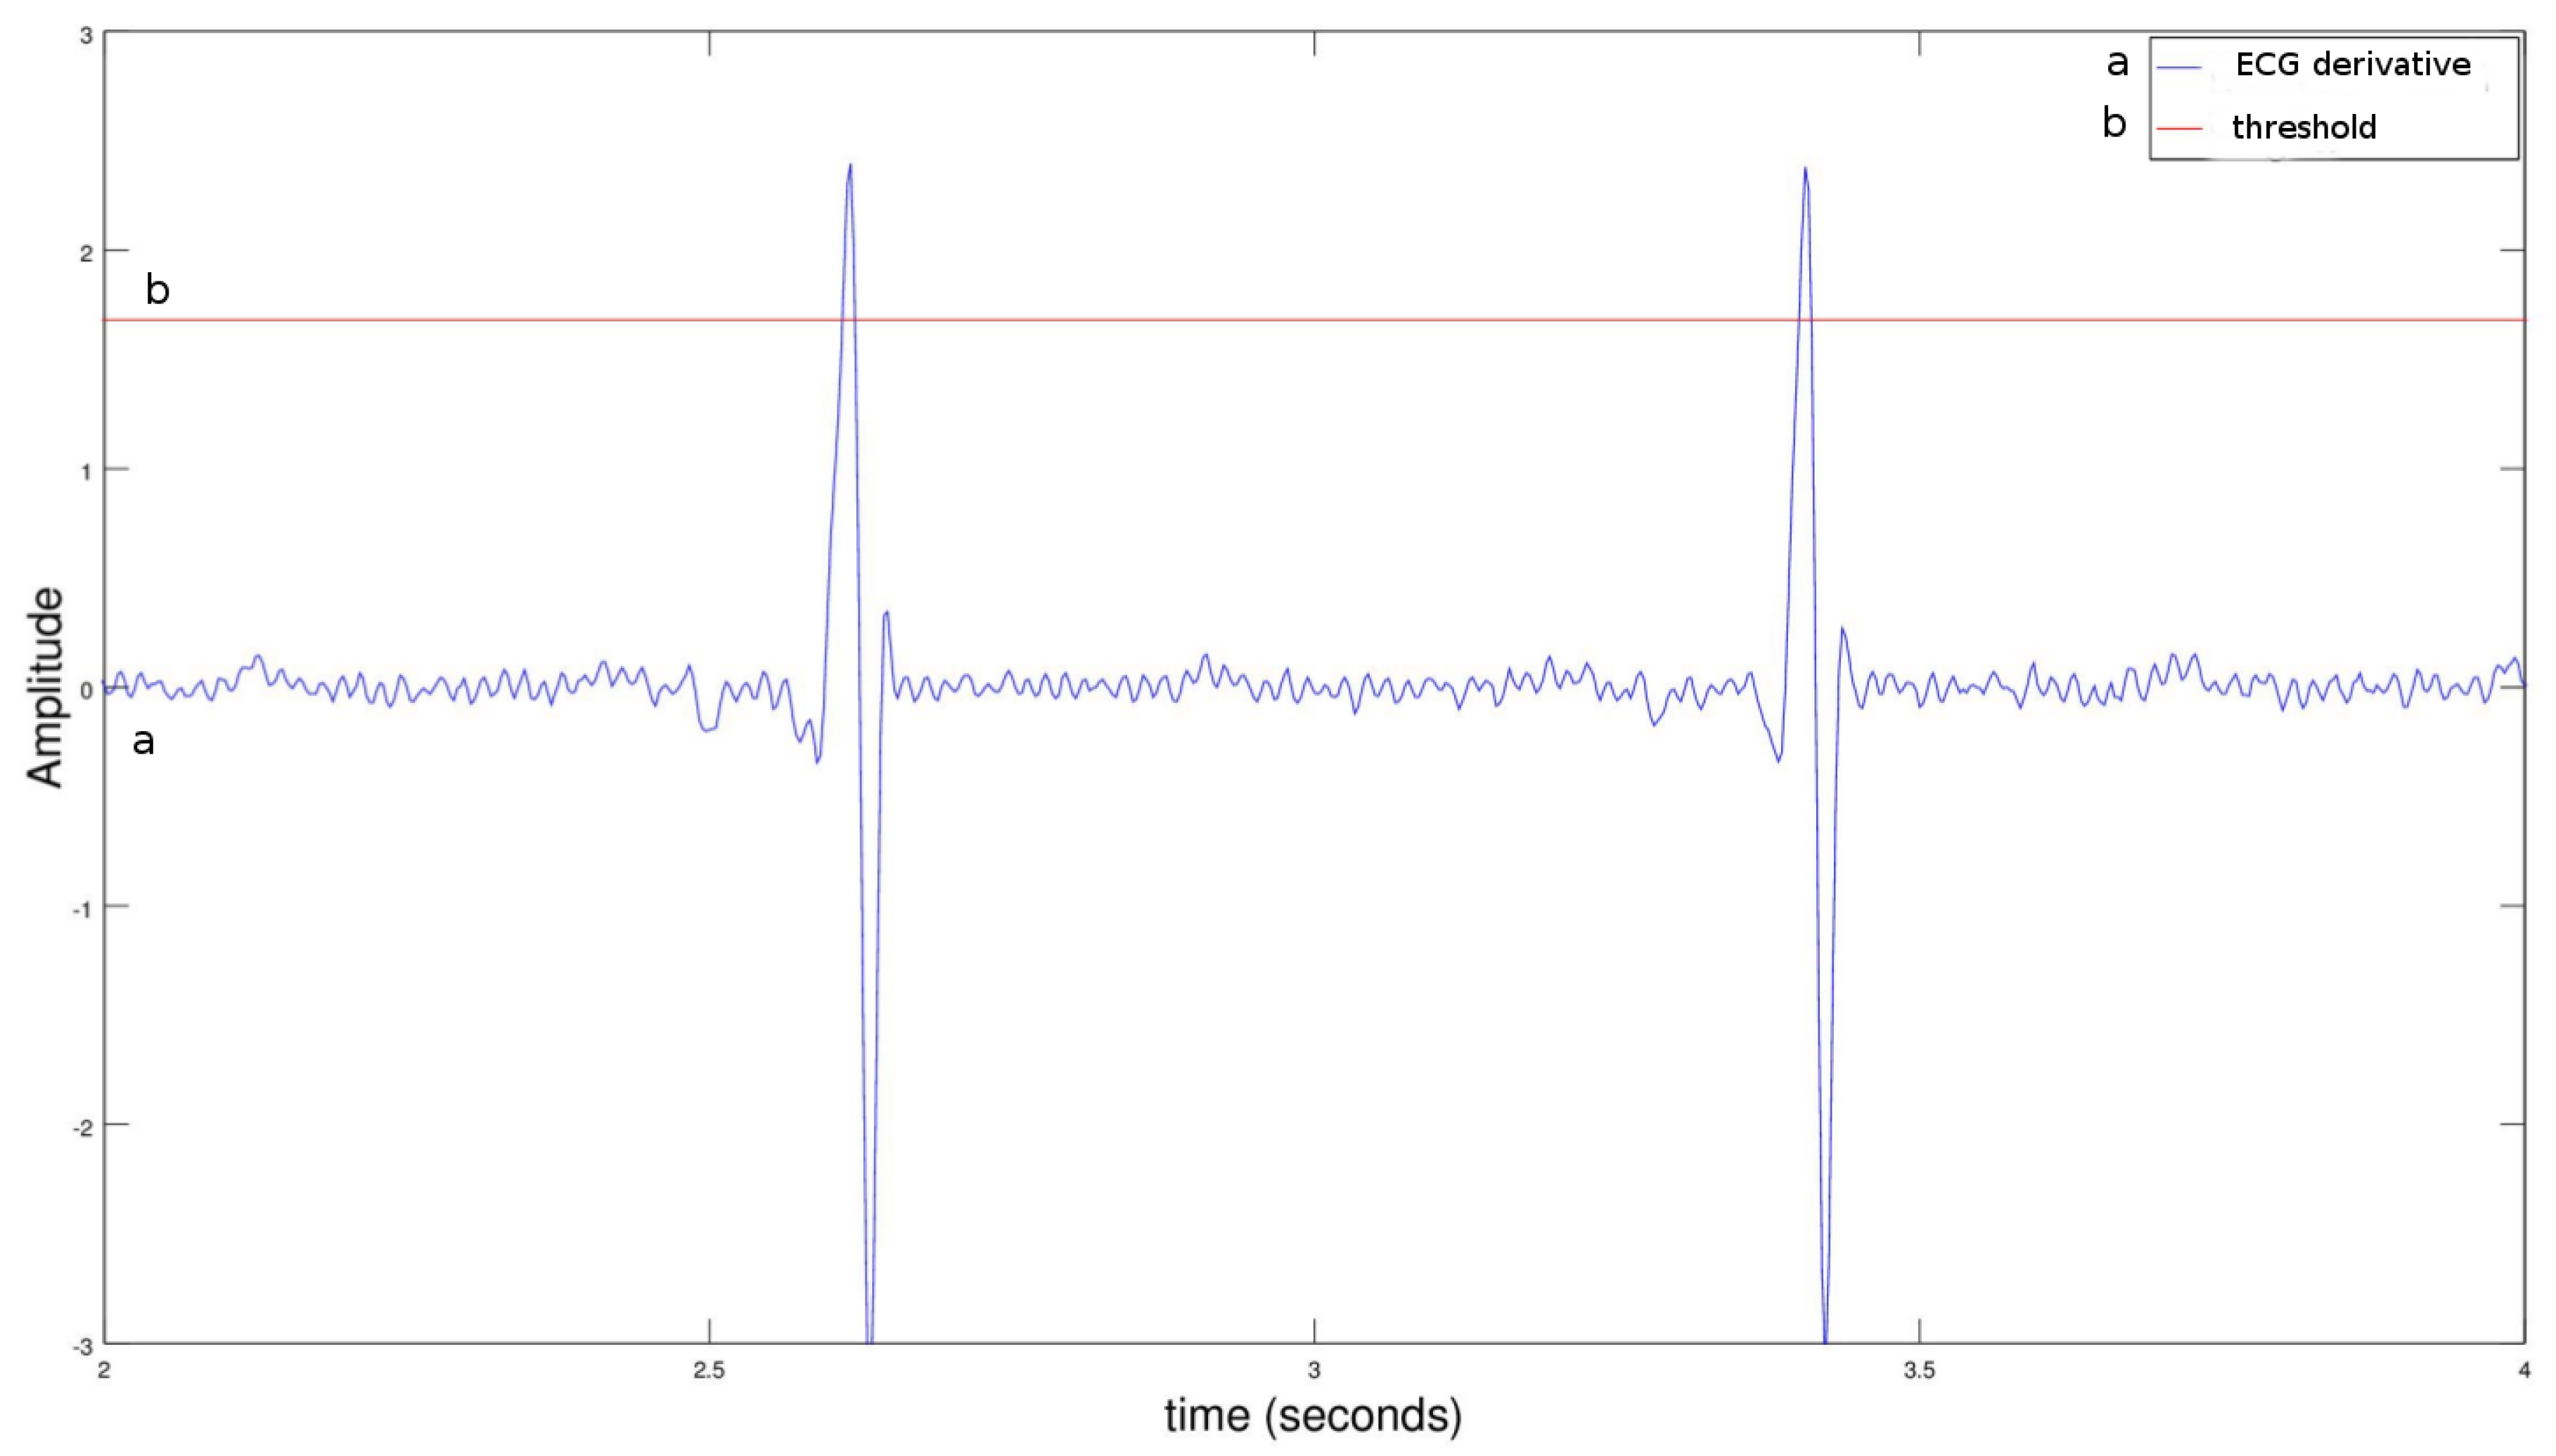
Several algorithms have been proposed so far to pick out and analyse the QRS complex. They can be classified according to their complexity and performance. In particular, most complex and efficient ones are based on particular mechanisms able to filter and elaborate ECG signals, whereas less complex ones are based on statistical thresholds. In this paper, we adopt the Menard algorithm based on the derivation of ECG signals according to the following equation:
After that, a threshold of 70% of the maximum value is chosen:
In the end, the algorithm adopts the following decision rule to detect the QRS complex:
In this paper, we implemented the Menard algorithm by means of Apache Spark. The dataset used in our experiments comes from the Physionet.org European. Specifically, our implementation stores signals acquired by a digitizer with sampling rate equal to Hz. In order to process it, the file that includes the dataset was properly formatted. Accordingly, two preliminary phases were needed. Since we had to process multiple samples simultaneously, we needed to organize them on different lines because Apache Spark processes each of them as Resilient Distributed Datasets (RDD) strings. Moreover, Spark distributes the workload in tasks, each one processing multiple lines of the RDD. In fact, the Menard algorithm implementation performs the derivation through the Formula 1, which requires a continuous set of data. Actually, so as to determine the n-th element of the derivative, we needed to know the two previous and subsequent elements of the nth ECG signal. Therefore, we overlapped the content introducing row by row redundancy (i.e., the four values in the next row), except the last one. This allowed us to avoid information losing during the cluster distribution task. Moreover, during the source file formatting process, each line was indexed for tracking related samples.
In order to understand how many samples should form a RDD element and how many values should be placed in a row of the file, we considered that an electrocardiogram typically oscillates between −20 mv and 20 mv. Since the calculation of the Menard algorithm threshold could not take in consideration these variations using a large portion of signal, it could not be correct to detect heartbeat peaks. Therefore, we implemented a version of the algorithm with an adaptive threshold, which is calculated according to each specific sample block. Therefore, our implementation used a set of samples with a duration equal to 10 s. To this end, if we indicate with the sampling frequency of the ECG signal, all the file lines (except the last one) have , where 4 is due to the above mentioned overlap.
The only information required for calculating the QRS complex is represented by the detected peak index because, multiplying it by the sampling frequency reciprocal, it is useful to trace the beat time. Moreover, we had to determine which peak signals above the threshold may be considered a heartbeat. Actually, these values are more than one around a QRS complex. In order to simplify it, we chose the first value above the threshold. Figure 4 shows the peak signals of an ECG derivative.
In order to distribute the RDD to the cluster’s nodes and create a list of elements on the driver, it was necessary to use the collect() method. This is the first action performed by the application. Indeed, up to this moment, we only talked about transformations. Therefore, the saveAsTextFile() method examines all the peaks’ RDD transformations in order to save it on a file.
What if the threshold values of a ECG signal section were between two blocks (or between two nodes)? Both the first index above the threshold of the first block and the first index above the threshold of the second block could be selected as peaks. The proposed solution requires that application knows the found values, and recognizes the extremely close peaks.
5. Arrhythmia Detection Methodology
Developing complex distributed algorithm, it is possible to obtain several information regarding the heart health condition from the ECG signal analysis. Nevertheless, we have chosen to implement easier algorithms for analyzing the R-R intervals and determine any cardiac rhythm anomalies. In this Section, we are briefly going to describe some arrhythmias that can be determined through algorithms implemented on Apache Spark. Note these are not standard, but a ECG analysis simplification designed to validate our theories. Before proceeding, let’s provide the notation that will be used:
- indicates the current heartbeat index, whereas indicates the previous heartbeat index, etc.;
- indicates the current R-R interval and is calculated as . indicates the previous interval and is calculated as , etc.;
- indicates the mean interval based on 6 previous intervals coming from .
In the following, we report several arrhythmia problems that have been implemented in our application.
5.1. Tachycardia
Tachycardia represents a heart rate acceleration above 100 beats per minute, and is readily detected through the cardiac rhythm analysis. Considering the algorithm that we have designed, if the average of the R-R interval is less than or equal to 0.5 s then the presence of the aforementioned permutation is detected. The following condition can be schematized as follows:
5.2. Brachycardia
Bradycardia represents a heart rhythm reduction. Typically, it is diagnosed when the beats frequency is less than 60, or less than one beat per second.
Considering the algorithm that we have designed, if the average of the R-R interval is greater than 1.2 s (less than 50 bpm), then a bradycardia is detected. In formulas:
5.3. Asystole
Asystolia is the absence of cardiac systole. This anomaly blocks the bloodstream and can cause death. Such arrhythmia can be detected through the cardiac rhythm analysis. More specifically, the detection condition is an absence of the QRS complex for a time greater than or equal to 1.6 s. In formulas:
5.4. Premature Ventricular Contraction (PVC)
A PVC can be recognized if the QRS complex is premature and is followed by a complete compensatory pause, the QRS is wider, the T wave polarity is opposite compared to the normal beat and there is not P wave. Considering the algorithm that we have designed, a compensatory pause is completed if the sum of the interval at the premature and the next beat is about 2 times the average interval read before the premature beat. In formulas:
5.5. Phenomenon
The phenomenon is a premature ventricular contraction occurring during ventricular repolarization (T wave). Specifically, this phenomenon indicates a very early extrasule anticipation compared to the previous beat. Therefore, its QRS complex is on the repolarization T wave of the previous beat. Thus, if the R-R interval is less than 1/3 of the previous average interval and is followed by a complete compensatory pause, the phenomenon is detected.
5.6. Interpolated PVC
Interpolated PVC is a premature beat that is not followed by a compensatory pause. Thus, the R-R interval sum between premature and next beat is about average. In formulas:
5.7. Trigeminy
The trigeminy condition has two normal beats followed both by a premature beat and a compensatory pause. In this case, a complete compensatory pause is defined as follows: the previous R-R interval is less than 0.9 times the average R-R interval (before the premature beat), and the sum of the R-R previous and two previous interval is about three times the average interval. In formulas:
5.8. Implementation
The following of this section is based on the results obtained in Section 4. In this regard, the output generated by the Menard algorithm was represented by a RDD containing the signal peaks, which was returned to the master node for eliminating any anomalies. As done in Section 4, a preprocessing phase was necessary before run the computation. More specifically, first values of each block needed last values of the next block. On the other hand, given that we want to distribute computation through cluster’s nodes, the processed unit should be a beats values set related to a ECG signal with a 10 min section. To this end, we planned to calculate the sample time in order to check in which 10 min block each value entered. Indeed, if the sampling rate is 360 Hz then, in a 10 min recording time, a maximum sample rate is 360 × 600 (10 min = 600 s). In general, any section will be a 10 min block if we consider a k index that start from 1 and increment every time the block creation is completed. For the implementation of the arrhythmia detection algorithm, we have included the first 9 values of the next section tagging along each list that contains the peaks of the 10 min section of signal.
The code faithfully follows the formulas previously described for each arrhythmia in this section. However, the relationship ≅ is implemented as a ratio between the values to be matched in the range . Moreover, when an anomaly is detected, a satisfied string returns the range index of the beats and the name of the arrhythmia itself.
6. Experiments
In order to performe experiments, we arranged a testbed including three nodes (one master, two slaves) considering a docker distributed environment with the following hardware configuration: CPU Intel Core i5-6400 Processor (6 M Cache, up to 3.30 GHz) and RAM 8 GB. Each node was configured with Ubuntu 14.04, OpenJDK 7, Spark 1.6.1 and Scala 2.11.8. Moreover, the Apache Spark framework used its scheduling process, without relying on third party cluster manager, such as YARN.
We have conducted 20 consecutive tests on 500 MB, 1.5 GB, 2.5 GB, 3.5 GB and 5 GB files. Each of these included an one hour ECG signal with sampling rate equal to 360 Hz. Each test was repeated 30 times in order to calculate average values and 95% confidence intervals.
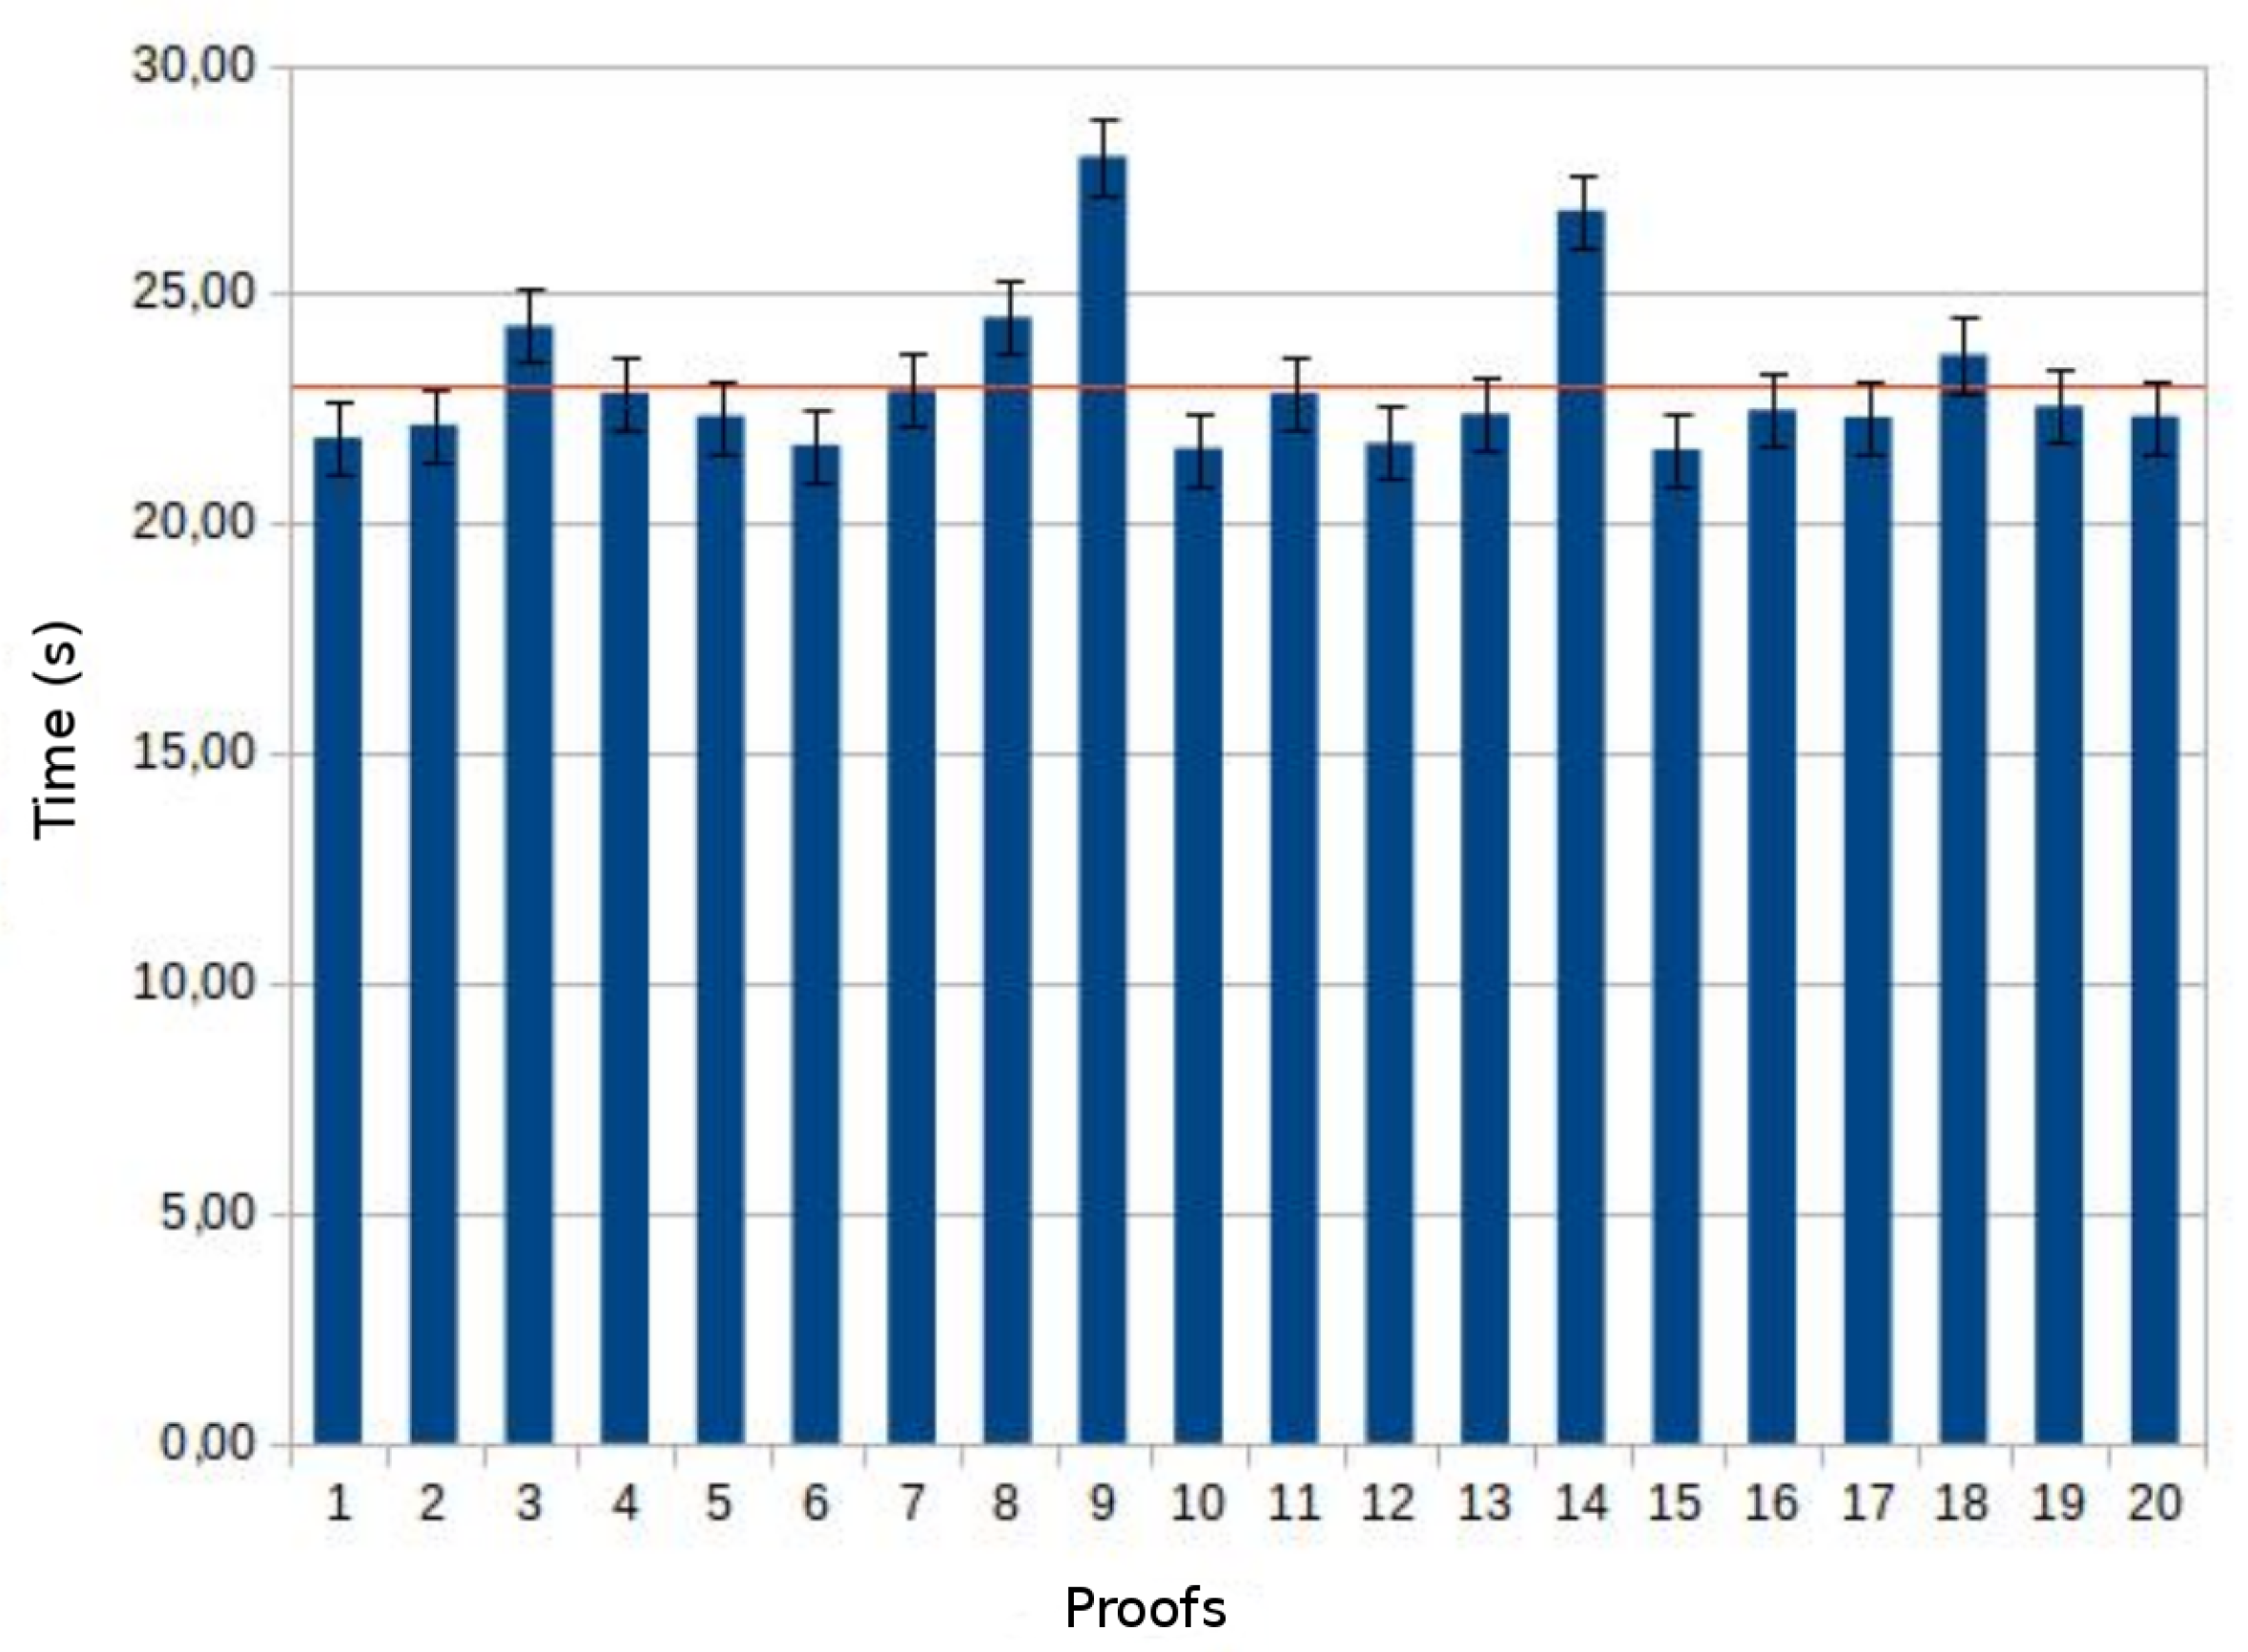
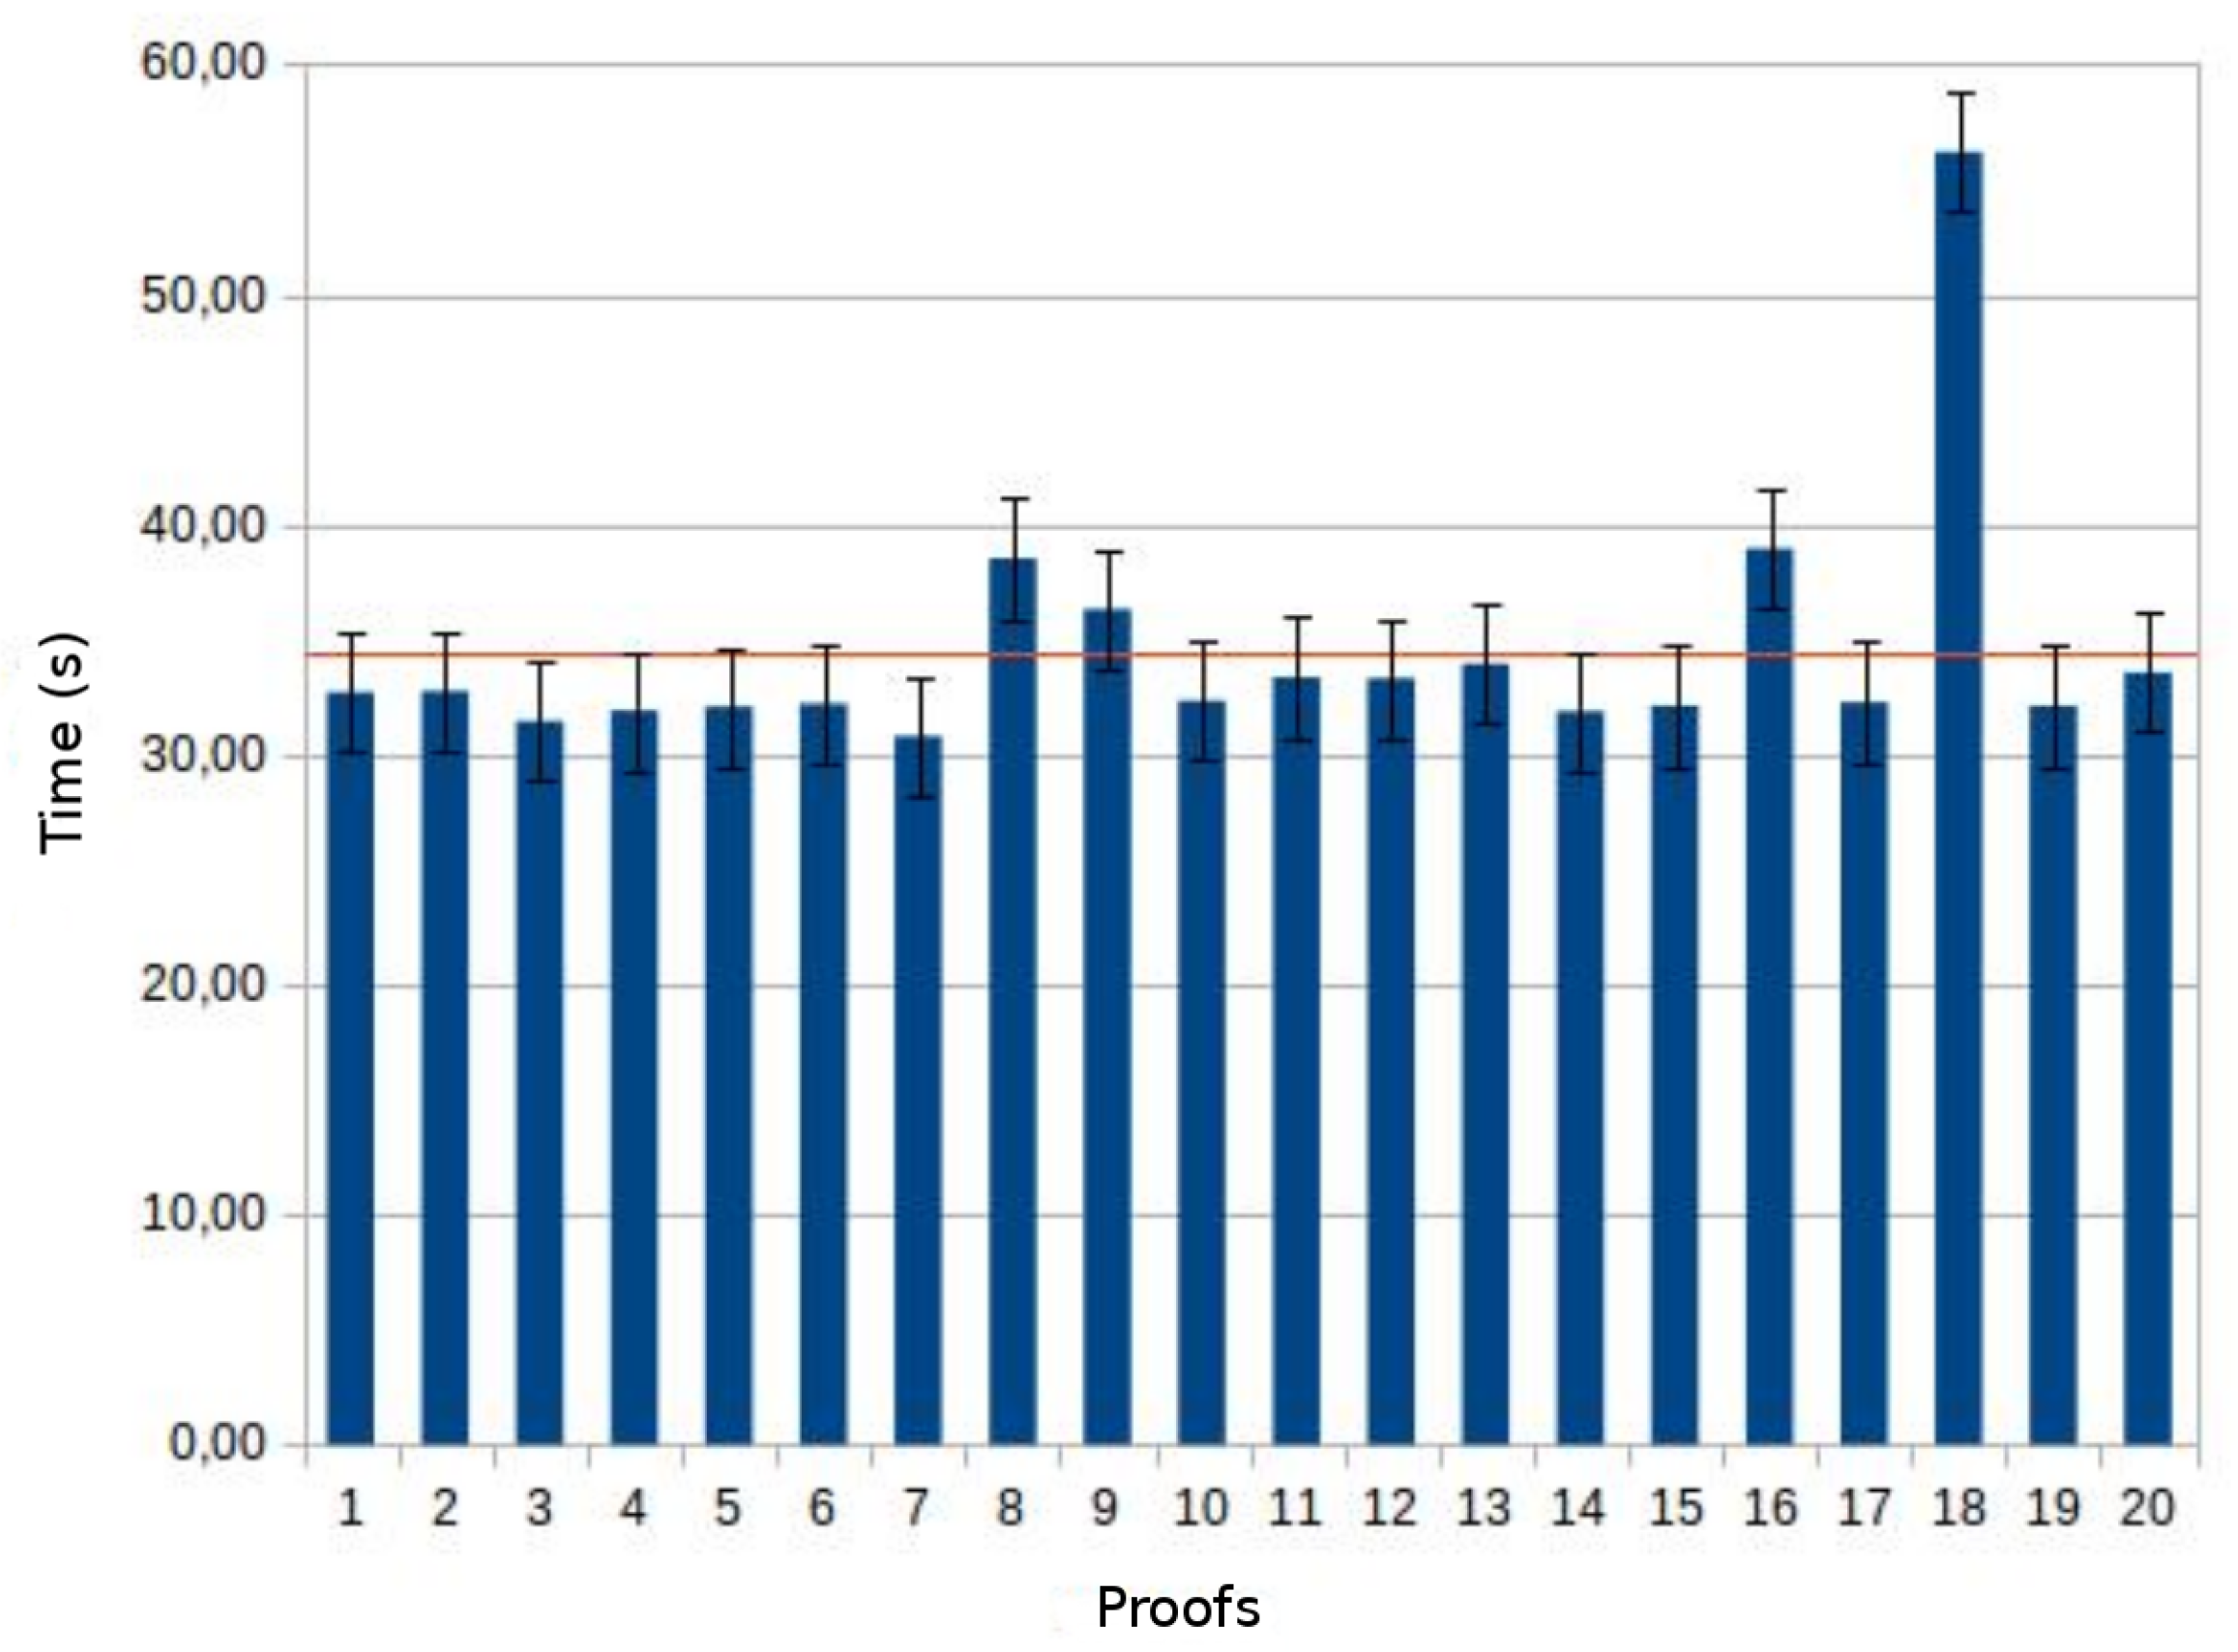
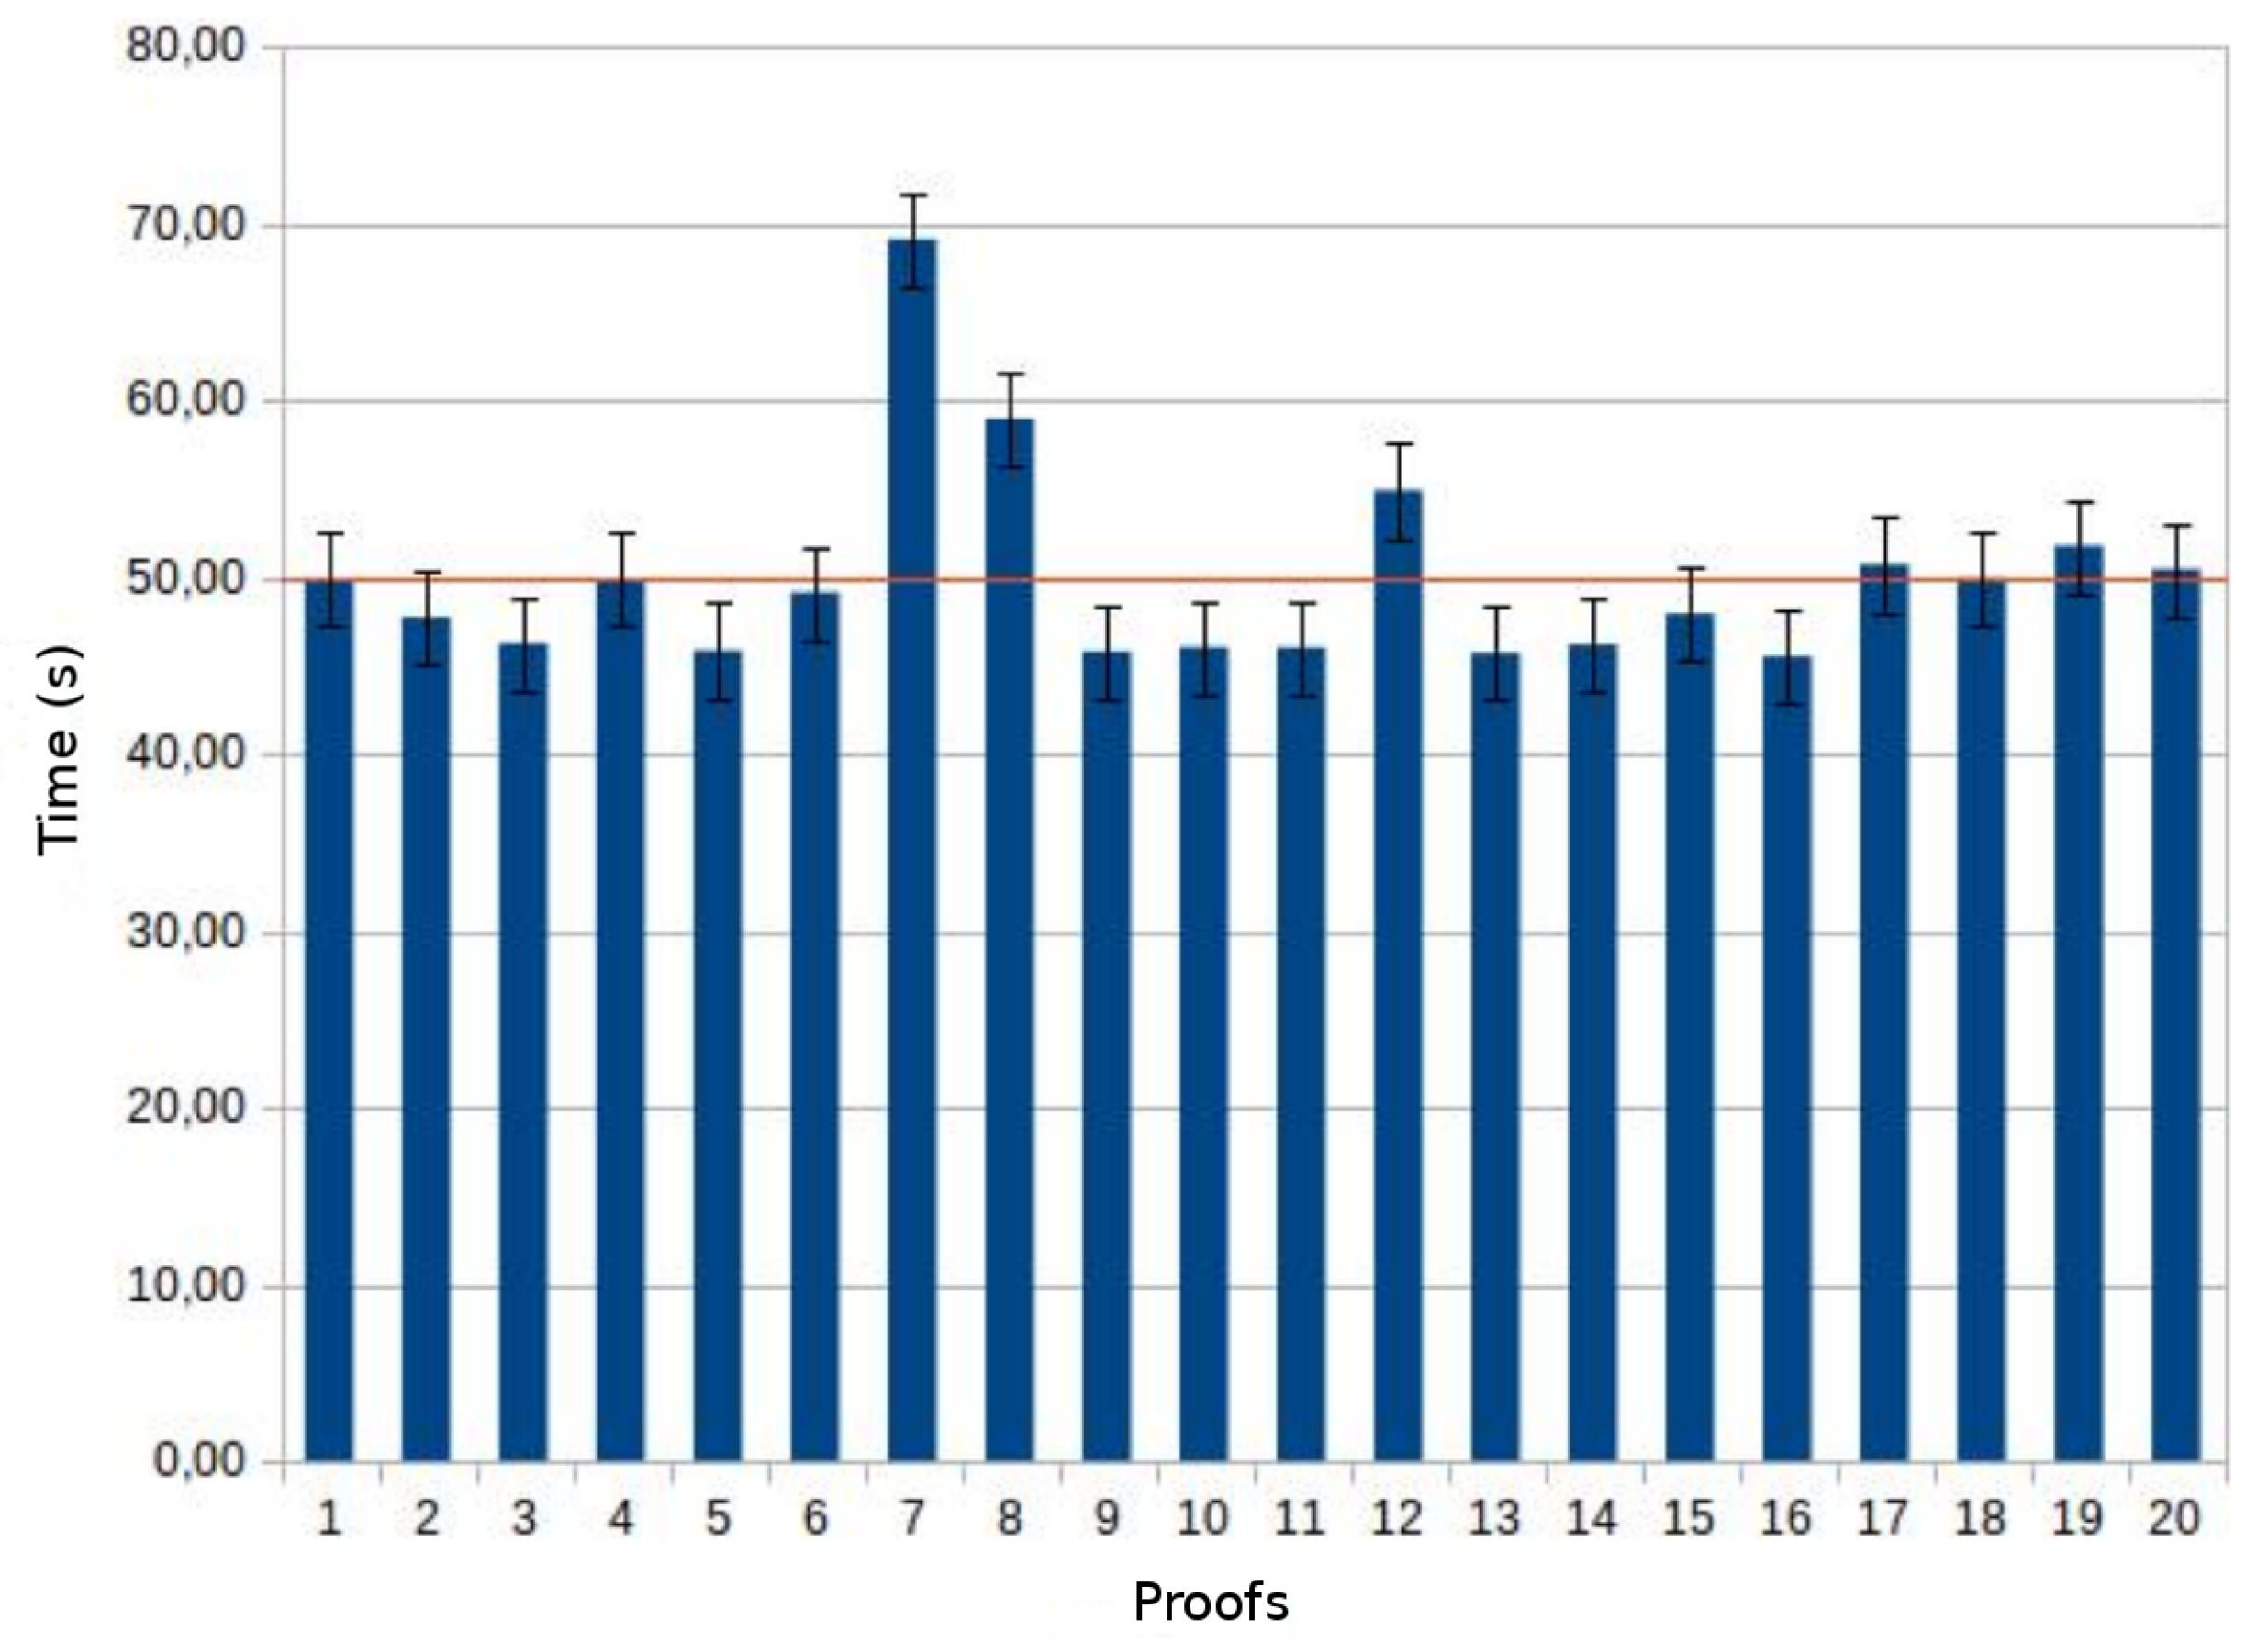
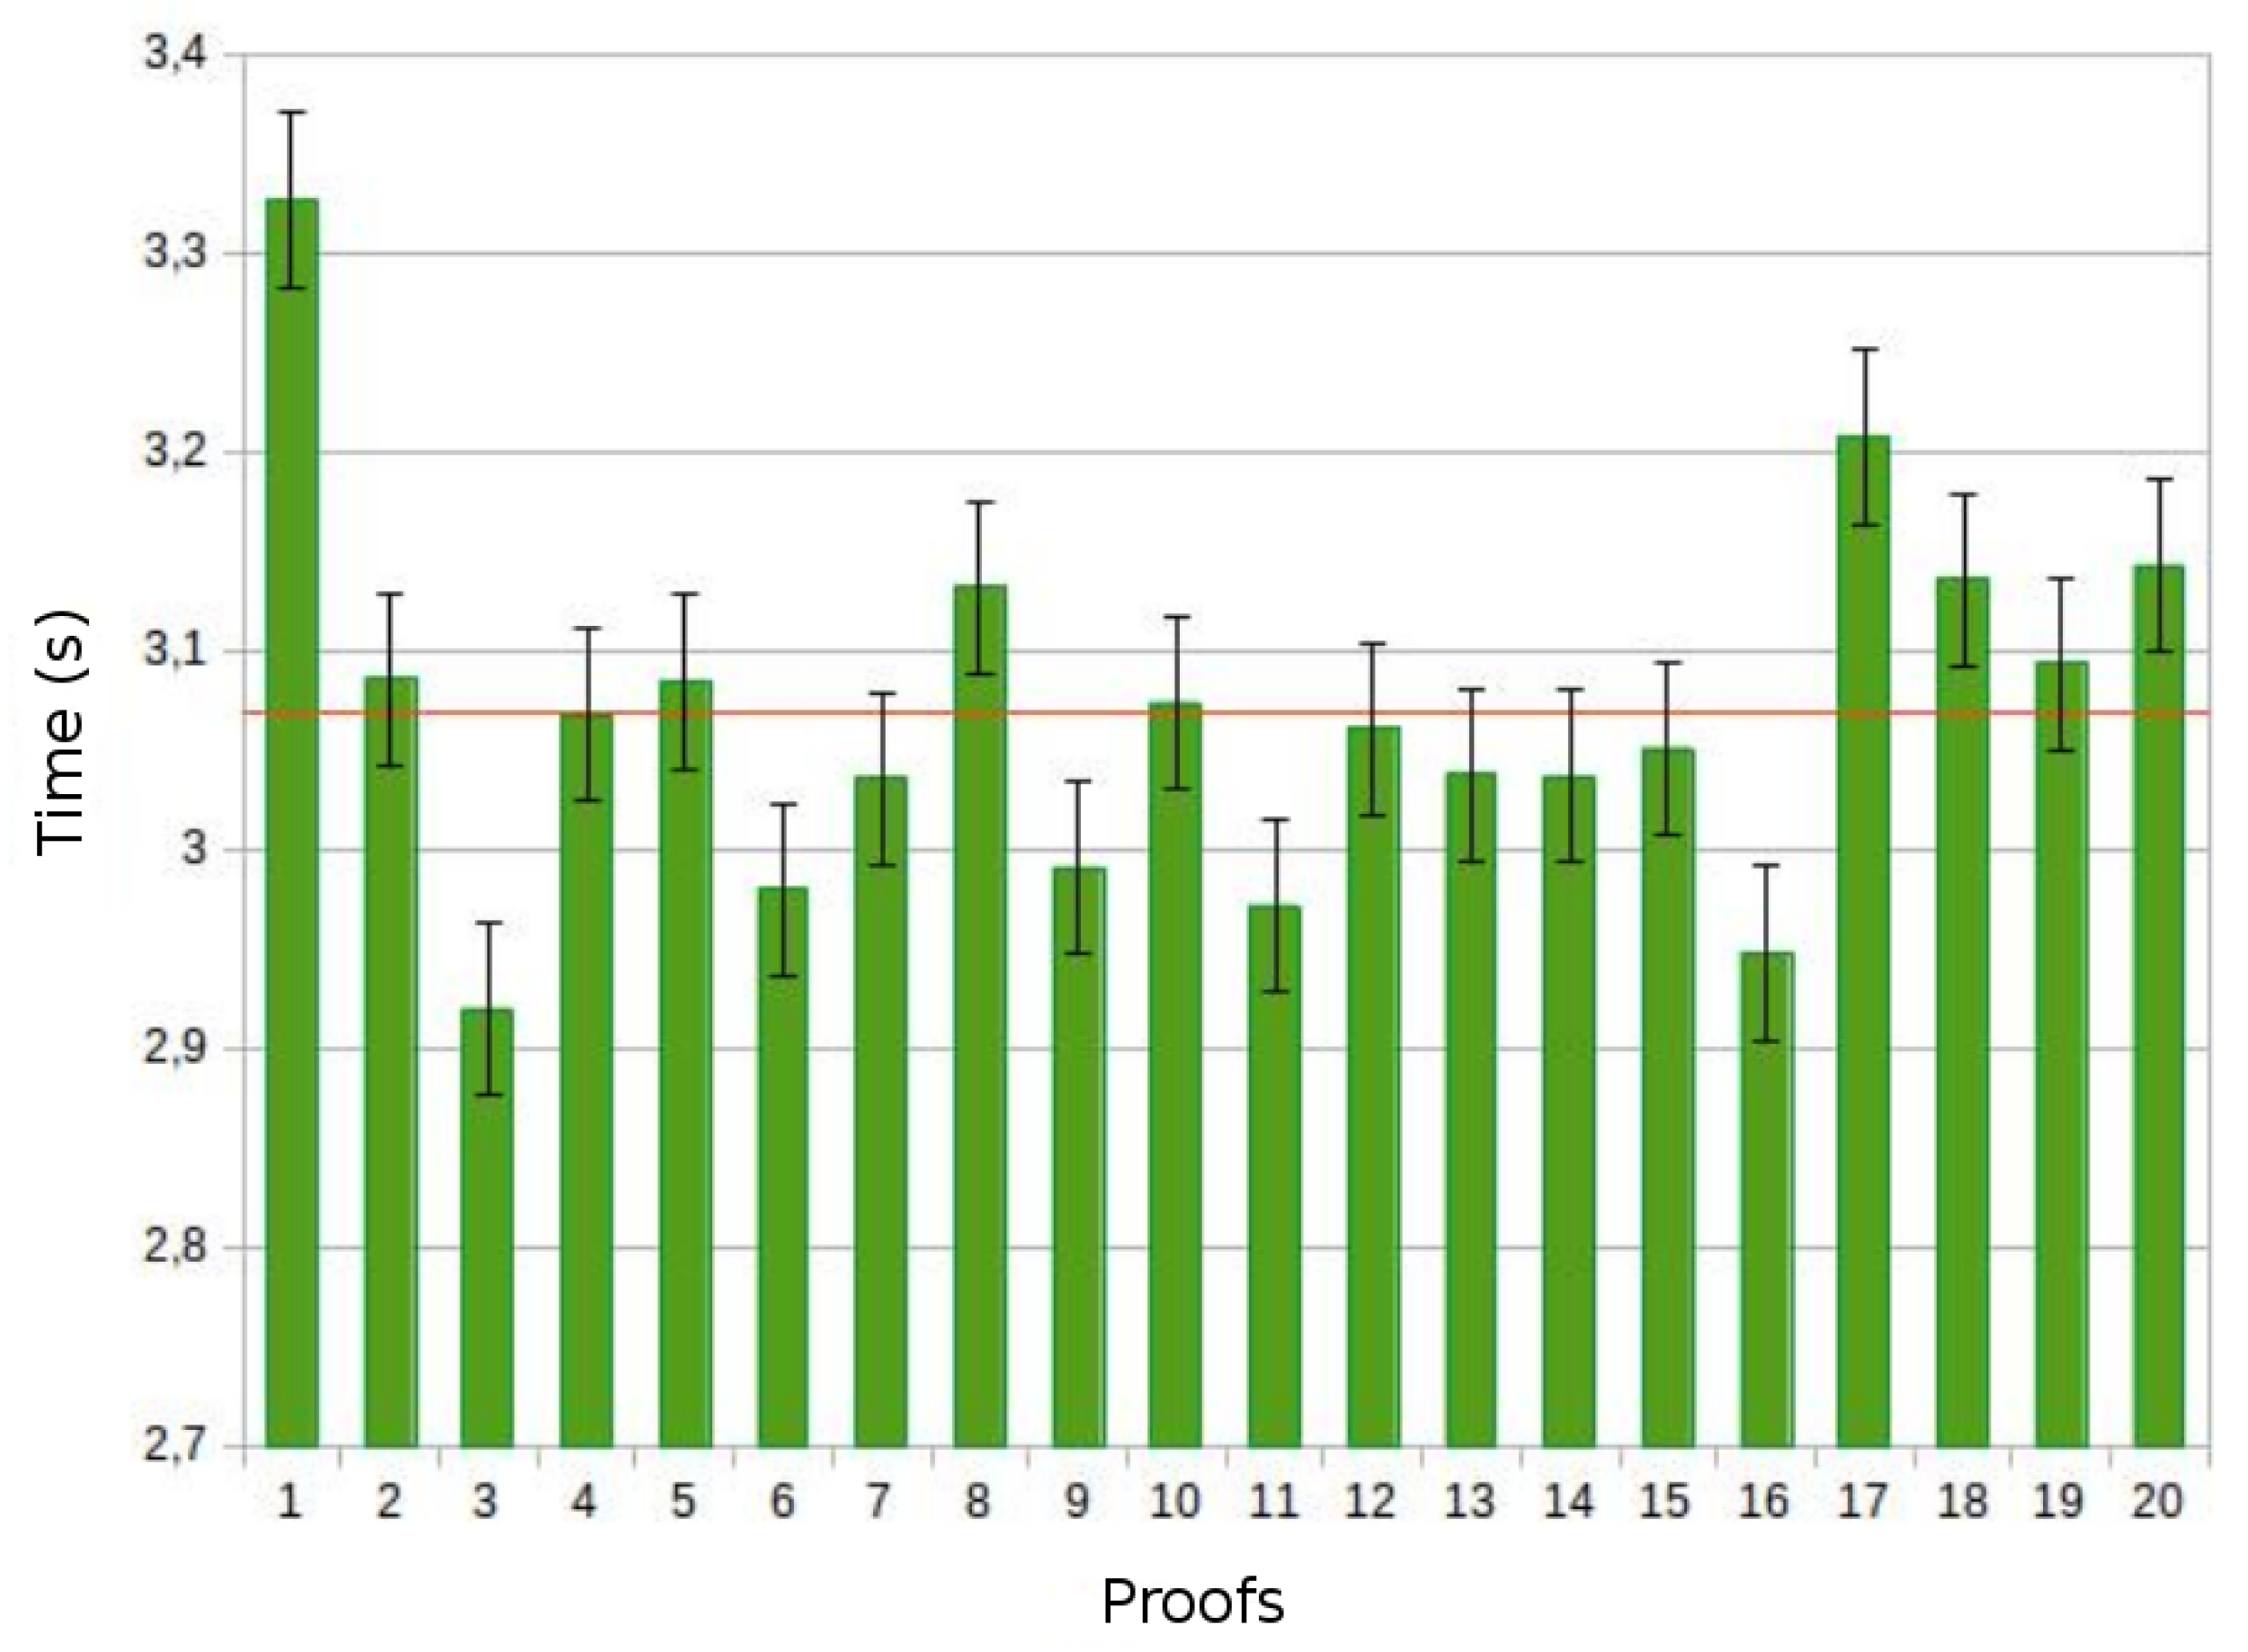
According to Section 4, actions carried out by the Spark application are collect and saveAsTextFile. The collect tests outcomes are shown in Figure 5, Figure 6 and Figure 7.
The temporal outcomes are quite similar, as highlighted by the small confidence interval. With reference to Figure 5, the collect average time value for a 500 MB file is about 23 s. Considering files five (2.5 GB) and ten (5 GB) times larger than the previous one, the execution time of the action nonlinearly increases, respectively by 40% and 50%.
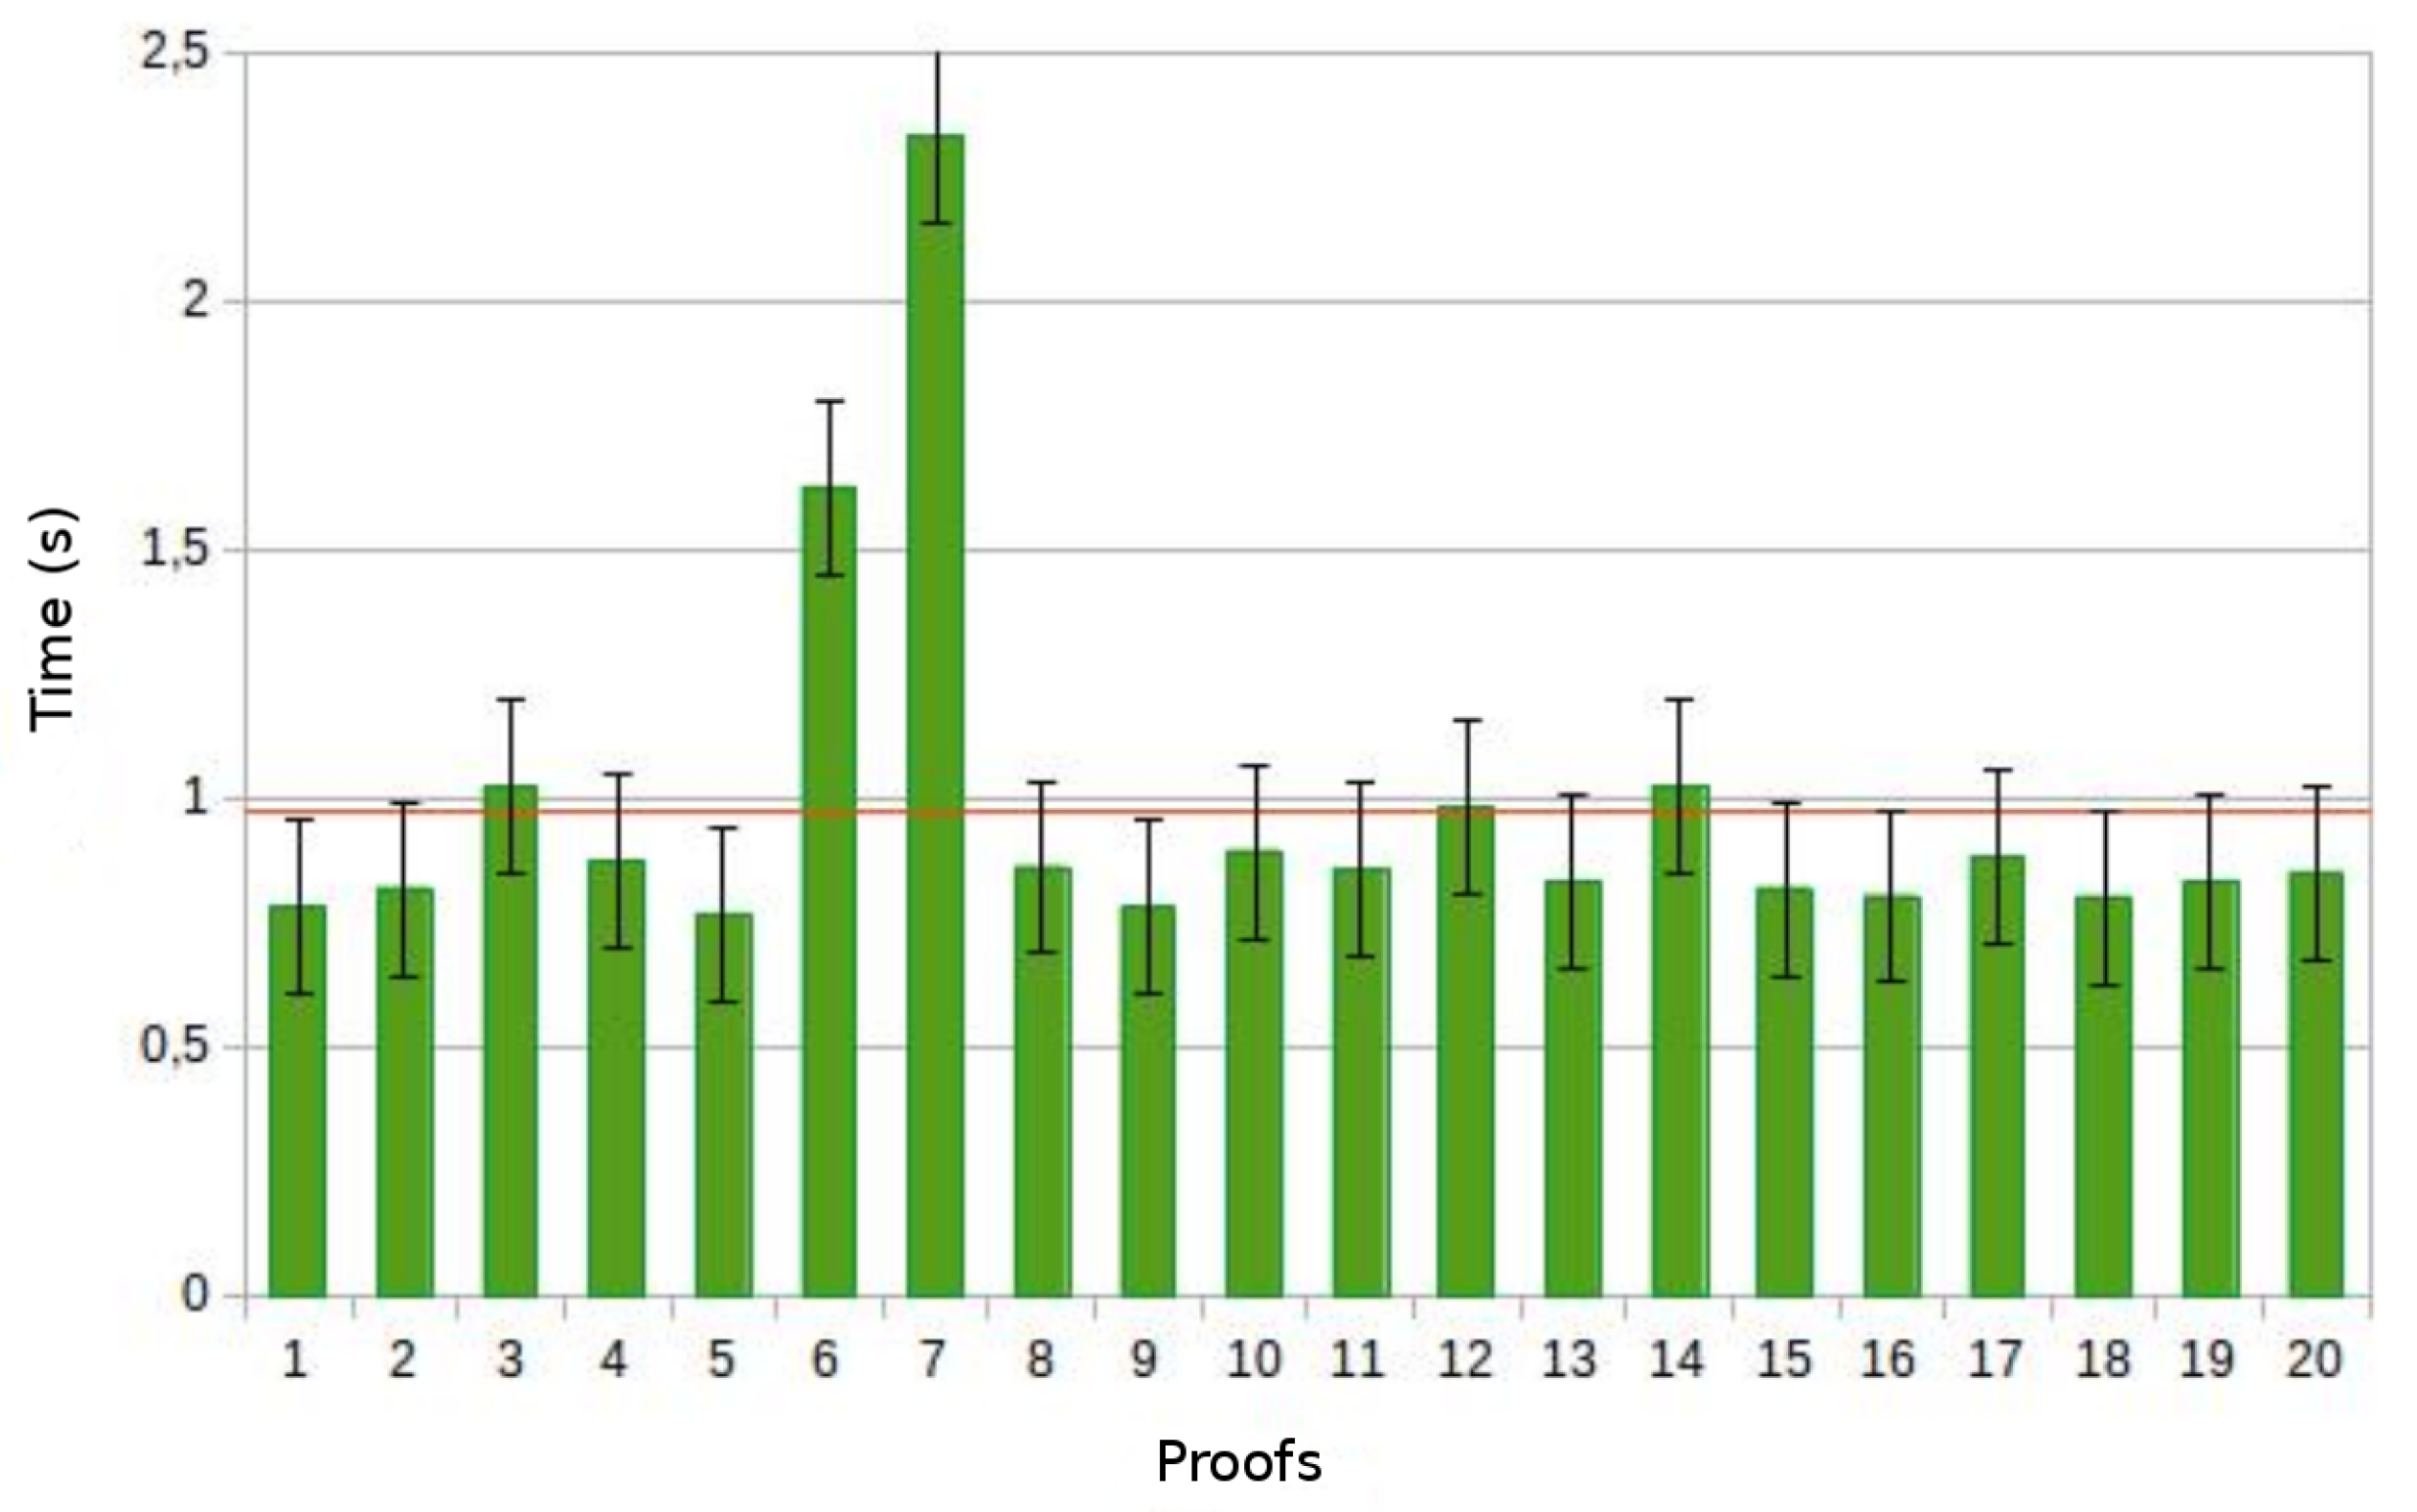
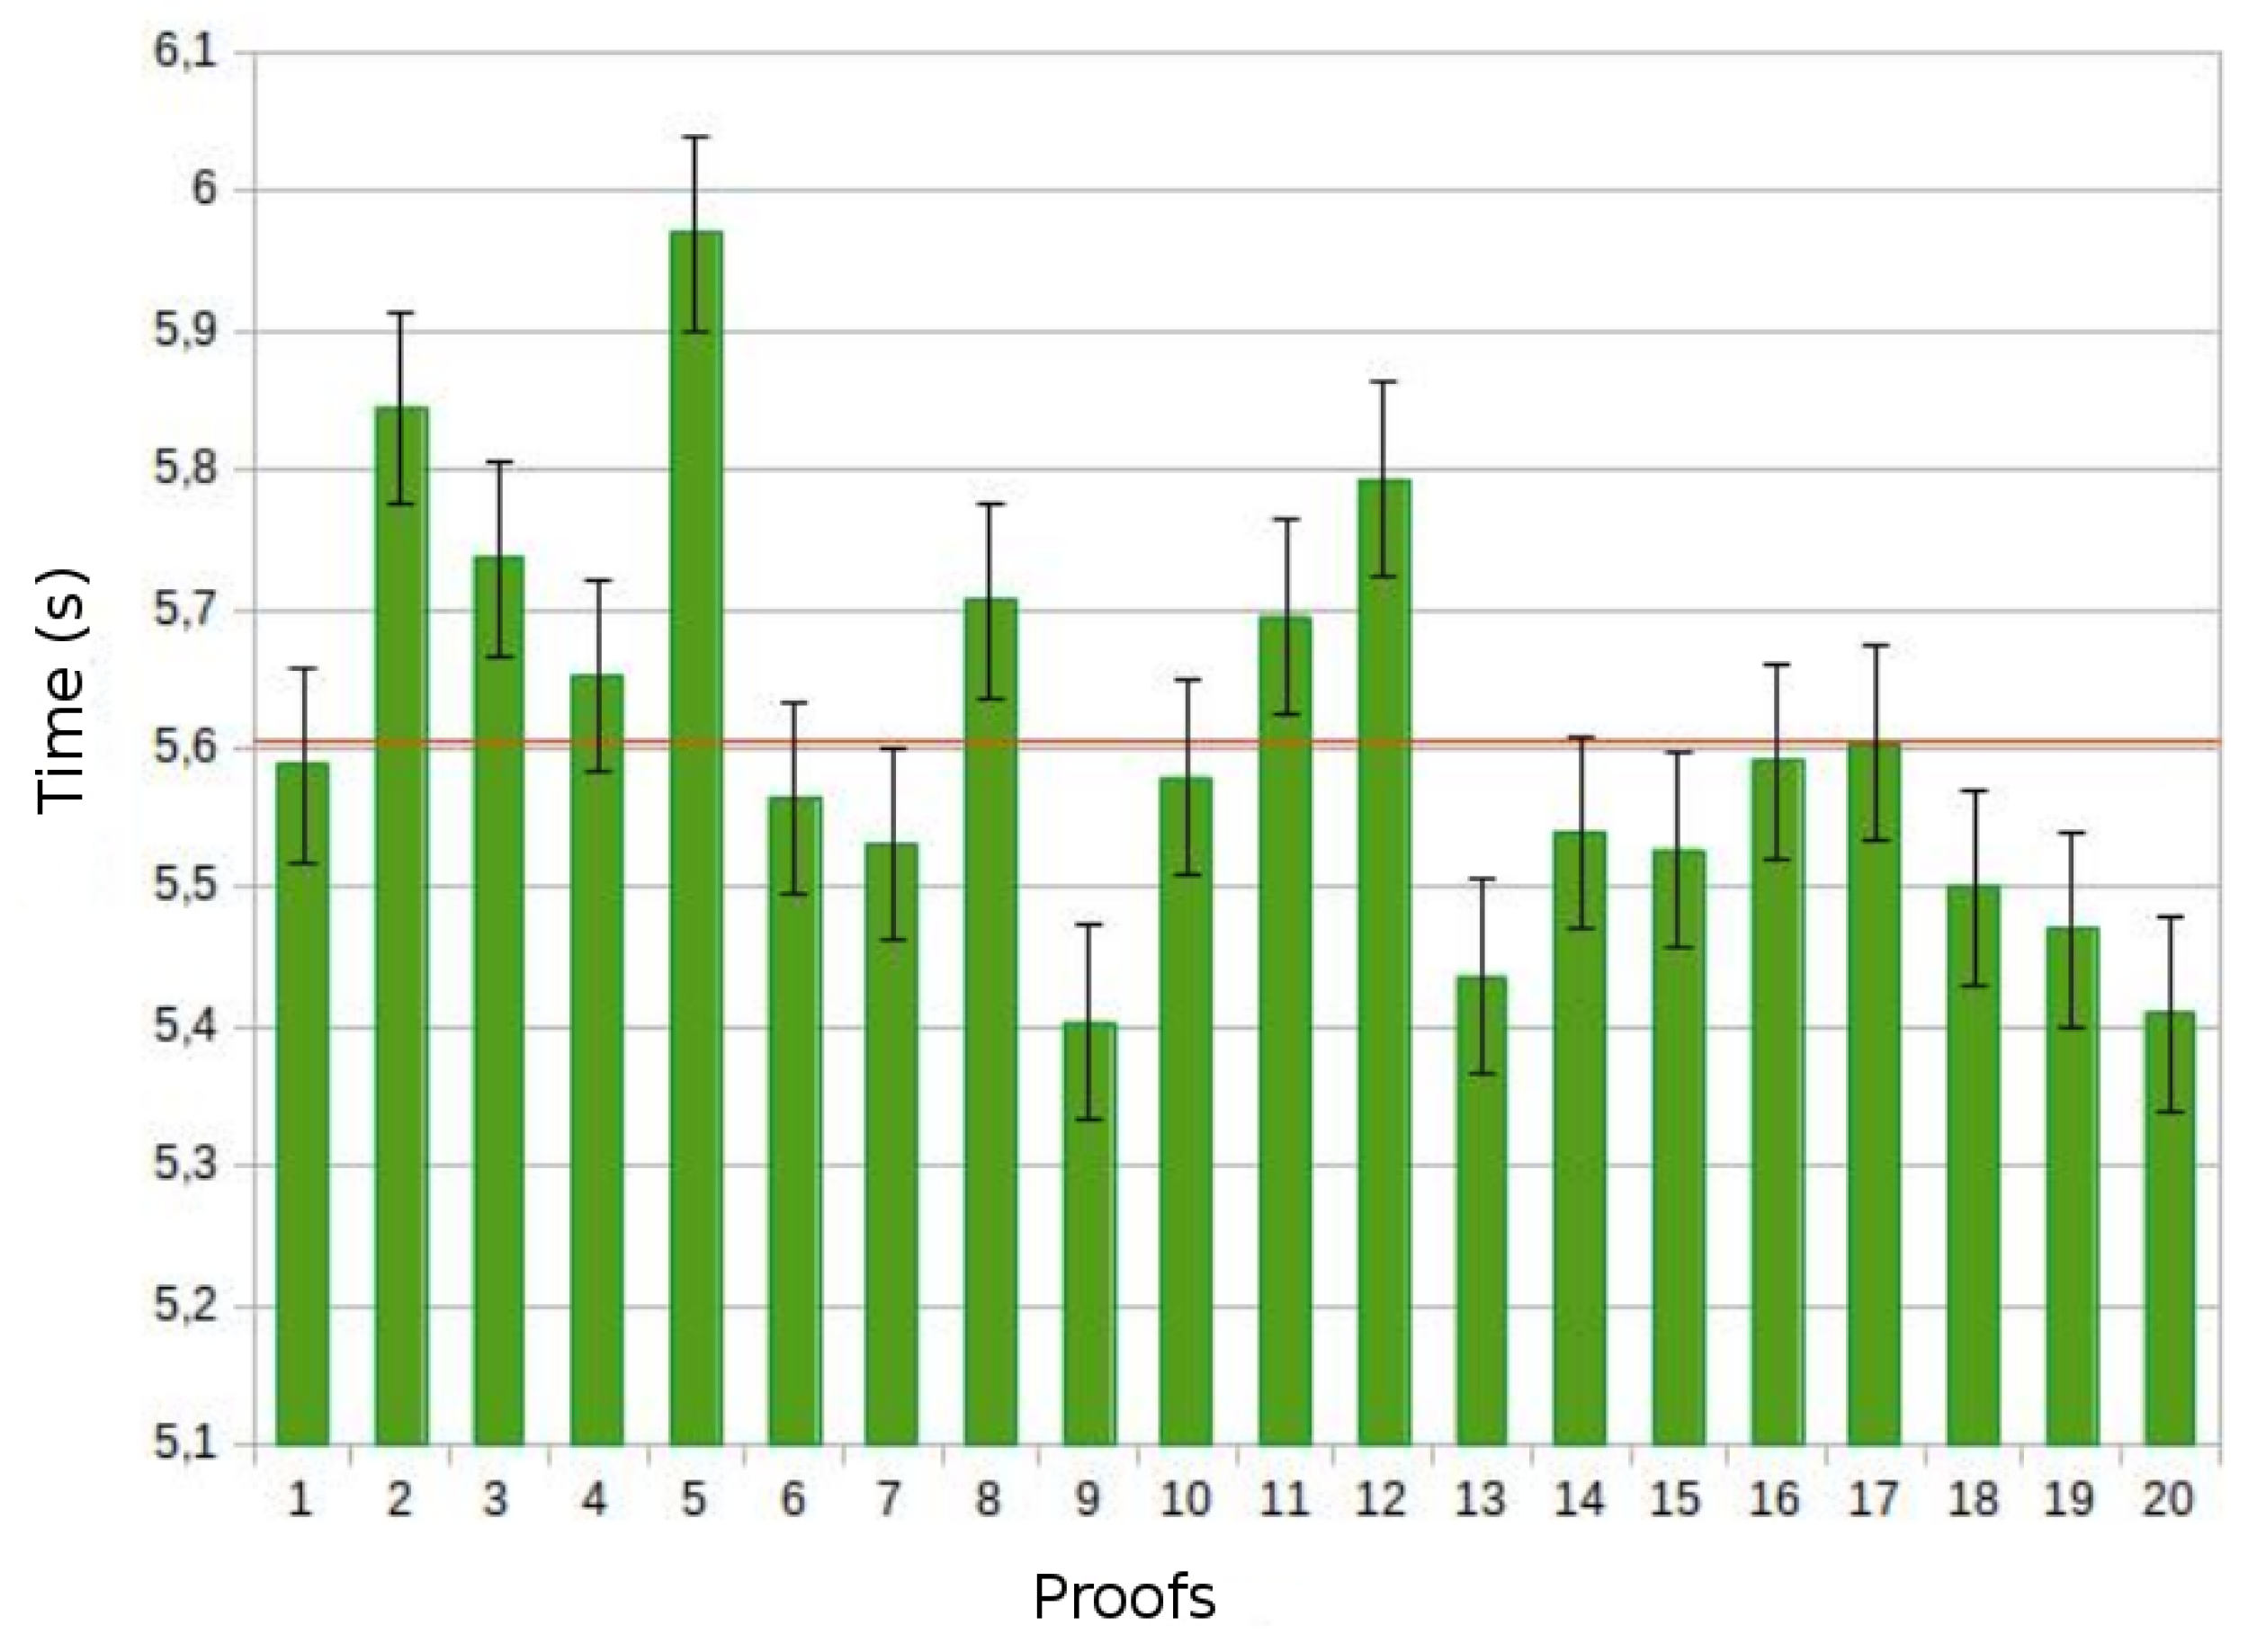
Instead, considering the case of the saveAsTextFile action, shown in Figure 8, Figure 9 and Figure 10, we notice again that the input size increment causes a nonlinear increasing of the action execution time. Specifically, the average execution time of the 500 MB file is about 1 s, whereas it is 3 s for the 2.5 GB file. Moreover, the average value of the 5 GB file is about 5.6 s, that is 5 times more than the 500 MB file. In this specific context, the collect benefits more from parallelization than saveAsTextFile.
7. Discussion and Conclusions
In this paper, we focused on distributed ECG signal processing specifically focusing on arrhythmias detection. In particular, we implemented the Menard algorithm in a distributed fashion by means of Apache Spark in order to take the advantage of high-performance computing in a context of Big Data consisting of a huge amount of ECG signaling information. The gain in term of performance that we got by means of Spark was evident. In our experience, we performed the pre-processing of ECG signals locally in order to maximize the benefits of parallel processing in the cluster. Accordingly, for future real scenarios, an alternative idea might be to use ad-hoc devices for recording the electrocardiogram in a data format that is ready for the parallel processing tasks performed by our system prototype. Specifically, if we suppose to make a medical device that during the recording of the ECG signal introduces the overlapping required by the algorithm, any limitation due to the nature of the data itself would be eliminated.
The analyses carried out were related to a specific ECG signal. Clearly, each ECG differs from others in terms of peaks and abnormalities, therefore these outcomes are not considered indicative for generic ECG signal. In the end, the behavior is exactly what expected is from a piece of Big data framework. In fact, increasing amount of data, the computation distribution gets benefits. The ECG signal analysis was performed by our algorithm considering the heart rhythm obtained by calculating R-R intervals. Actually, more complex operations could be implemented by making elaborations based on the shape of the waves that make up a heartbeat. Therefore, leveraging parallel processing, it would be possible to implement computationally highly costly algorithms and obtaining reduce response times. Furthermore, Spark Streaming could be used to perform continuous and Real Time processing. In this regard, an ad-hoc device for sending electrocardiogram sections should be implemented, allowing continuous monitoring of the patient’s health status.
This scientific work could represent the basis for Future Internet applications in cardiology. In fact, due to the scalability of the system, it is suitable to an easy-deployment a Cloud system able to process Big Data. In the end, our system could be used as back-end for the development of different of Cloud-based cardiology services. As mentioned at the beginning of this paper, another important issue regards security and privacy of data that are sent to the Cloud for processing and data that are sent back from the Cloud to the clinical personnel’s devices. In future, work we plan also to study such an issue in a real clinical workflow by adopting a message authentication and encryption approach for hybrid Cloud/Edge environments [17] and hybrid Cloud storage system approaches able to guaranty big data reliability and obfuscation [18].
Author Contributions
Conceptualization, A.C.; Methodology, L.C.; Software, L.C.; Supervision, M.V.; Validation, M.F.; Writing—review & editing, A.C. All authors have read and agreed to the published version of the manuscript.
Funding
This research was funded by Ministero della Salute GR-2016-02361306.
Acknowledgments
This work was supported by the Italian Healthcare Ministry founded project Young Researcher (under 40 years) entitled “Do Severe acquired brain injury patients benefit from Telerehabilitation? A Cost-effectiveness analysis study”—GR-2016-02361306.
Conflicts of Interest
The authors declare no conflict of interest.
References
- Carnevale, L.; Celesti, A.; Fazio, M.; Bramanti, P.; Villari, M. Heart Disorder Detection with Menard Algorithm on Apache Spark. In Service-Oriented and Cloud Computing; De Paoli, F., Schulte, S., Broch Johnsen, E., Eds.; Springer: Berlin/Heidelberg, Germany, 2017; pp. 229–237. [Google Scholar]
- Ho, T.W.; Lin, F.C.; Lin, C.M.; Lai, F. Smart computing mechanism for noise detection and elimination in ECG signal. In Proceedings of the 2017 IEEE International Conference on Big Data and Smart Computing (BigComp), Jeju Island, Korea, 13–16 February 2017; pp. 28–33. [Google Scholar]
- Wang, Y.; Wang, L.; Chen, X.; Zhu, W. P Wave Detection and Delineation Based on Distances Transform. In Proceedings of the 2016 IEEE Trustcom/BigDataSE/ISPA, Tianjin, China, 23–26 August 2016. [Google Scholar]
- Alshraideh, H.; Otoom, M.; Al-Araida, A.; Bawaneh, H.; Bravo, J. A Web Based Cardiovascular Disease Detection System. J. Med. Syst. 2015, 39, 242–247. [Google Scholar] [CrossRef] [PubMed]
- Cochrane, T.; Dunlop, A. A report generator package for routine laboratory tests in a hospital cardiology department. Comput. Methods Programs Biomed. 1985, 20, 63–68. [Google Scholar] [CrossRef]
- Costa, C.; Oliveira, J.L.; Silva, A.; Ribeiro, V.G.; Ribeiro, J. Design, development, exploitation and assessment of a Cardiology Web PACS. Comput. Methods Programs Biomed. 2009, 93, 273–282. [Google Scholar] [CrossRef] [PubMed]
- Novo, J.; Hermida, A.; Ortega, M.; Barreira, N.; Penedo, M.; López, J.; Calvo, C. Hydra: A web-based system for cardiovascular analysis, diagnosis and treatment. Comput. Methods Programs Biomed. 2017, 139, 61–81. [Google Scholar] [CrossRef] [PubMed]
- Ma’sum, M.A.; Jatmiko, W.; Suhartanto, H. Enhanced tele ECG system using Hadoop framework to deal with big data processing. In Proceedings of the 2016 International Workshop on Big Data and Information Security (IWBIS), Jakarta, Indonesia, 18–19 October 2016; pp. 121–136. [Google Scholar]
- Bergeron, B.P.; Greenes, R.A. Clinical skill-building simulations in cardiology: HeartLab and EkgLab. Comput. Methods Programs Biomed. 1989, 30, 111–126. [Google Scholar] [CrossRef]
- Carnevale, L.; Celesti, A.; Fazio, M.; Bramanti, P.; Villari, M. How to Enable Clinical Workflows to Integrate Big Healthcare Data. In Proceedings of the 2017 IEEE Symposium on Computers and Communications (ISCC 2017), Heraklion, Greece, 3–6 July 2017; pp. 1–6. [Google Scholar]
- Chen, X.; Ji, J.; Loparo, K.; Li, P. Real-time personalized cardiac arrhythmia detection and diagnosis: A cloud computing architecture. In Proceedings of the 2017 IEEE EMBS International Conference on Biomedical and Health Informatics (BHI 2017), Orlando, FL, USA, 16–19 February 2017; pp. 201–204. [Google Scholar]
- Sahoo, S.S.; Jayapandian, C.; Garg, G.; Kaffashi, F.; Chung, S.; Bozorgi, A.; Chen, C.H.; Loparo, K.; Lhatoo, S.D.; Zhang, G.Q. Heart beats in the cloud: Distributed analysis of electrophysiological ‘Big Data’ using cloud computing for epilepsy clinical research. J. Am. Med. Inform. Assoc. 2014, 21, 263–271. [Google Scholar] [CrossRef] [PubMed] [Green Version]
- Apandi, Z.F.M.; Ikeura, R.; Hayakawa, S. Arrhythmia Detection Using MIT-BIH Dataset: A Review. In Proceedings of the 2018 International Conference on Computational Approach in Smart Systems Design and Applications (ICASSDA), Kuching, Malaysia, 15–17 August 2018; pp. 1–5. [Google Scholar]
- Lillo-Castellano, J.; Mora-Jiménez, I.; Santiago-Mozos, R.; Chavarría-Asso, F.; Cano-González, A.; García-Alberola, A.; Rojo-Álvarez, J. Symmetrical Compression Distance for Arrhythmia Discrimination in Cloud-Based Big-Data Services. IEEE J. Biomed. Health Inform. 2015, 19, 1253–1263. [Google Scholar] [CrossRef] [PubMed]
- Behadada, O.; Trovati, M.; Chikh, M.A.; Bessis, N.; Korkontzelos, Y. Logistic Regression Multinomial for Arrhythmia Detection. In Proceedings of the 2016 IEEE 1st International Workshops on Foundations and Applications of Self* Systems (FAS*W), Augsburg, Germany, 12–16 September 2016; pp. 133–137. [Google Scholar]
- Wang, H.; Shi, H.; Lin, K.; Zhao, L.; Liu, C. A High-Precise Arrhythmia Detection Method Based on Biorthogonal Wavelet and Fully Connected Neural Network. In Proceedings of the 2019 IEEE Fifth International Conference on Big Data Computing Service and Applications (BigDataService), San Francisco East Bay, CA, USA, 4–9 April 2019; pp. 316–321. [Google Scholar]
- Celesti, A.; Fazio, M.; Galletta, A.; Carnevale, L.; Wan, J.; Villari, M. An approach for the secure management of hybrid cloud–edge environments. Future Gener. Comput. Syst. 2019, 90, 1–19. [Google Scholar] [CrossRef]
- Celesti, A.; Galletta, A.; Fazio, M.; Villari, M. Towards Hybrid Multi-Cloud Storage Systems: Understanding How to Perform Data Transfer. Big Data Res. 2019, 16, 1–17. [Google Scholar] [CrossRef]
Figure 1.
An anterior view of the heart [courses.lumenlearning.com/contemporaryhealthissues].

Figure 2.
The heart cycle: The mammalian heart & cardiac cycle.

Figure 3.
ECG outcomes.

Figure 4.
ECG derivative and threshold.

Figure 5.
collect action for 500 MB file. 20 proofs average and confidence interval equal to 95%.

Figure 6.
collect action for 2.5 GB file. 20 proofs average and confidence interval equal to 95%.

Figure 7.
collect action for 5 GB file. 20 proofs average and confidence interval equal to 95%.

Figure 8.
saveAsTextFile action for 500 MB file. 20 proofs average and confidence interval equal to 95%.
Figure 8.
saveAsTextFile action for 500 MB file. 20 proofs average and confidence interval equal to 95%.

Figure 9.
saveAsTextFile action for 2.5 GB file. 20 proofs average and confidence interval equal to 95%.
Figure 9.
saveAsTextFile action for 2.5 GB file. 20 proofs average and confidence interval equal to 95%.

Figure 10.
saveAsTextFile action for 5 GB file. 20 proofs average and confidence interval equal to 95%.
Figure 10.
saveAsTextFile action for 5 GB file. 20 proofs average and confidence interval equal to 95%.

© 2020 by the authors. Licensee MDPI, Basel, Switzerland. This article is an open access article distributed under the terms and conditions of the Creative Commons Attribution (CC BY) license (http://creativecommons.org/licenses/by/4.0/).
Share and Cite
MDPI and ACS Style
Carnevale, L.; Celesti, A.; Fazio, M.; Villari, M. A Big Data Analytics Approach for the Development of Advanced Cardiology Applications. Information 2020, 11, 60. https://0-doi-org.brum.beds.ac.uk/10.3390/info11020060
AMA Style
Carnevale L, Celesti A, Fazio M, Villari M. A Big Data Analytics Approach for the Development of Advanced Cardiology Applications. Information. 2020; 11(2):60. https://0-doi-org.brum.beds.ac.uk/10.3390/info11020060
Chicago/Turabian StyleCarnevale, Lorenzo, Antonio Celesti, Maria Fazio, and Massimo Villari. 2020. "A Big Data Analytics Approach for the Development of Advanced Cardiology Applications" Information 11, no. 2: 60. https://0-doi-org.brum.beds.ac.uk/10.3390/info11020060
Note that from the first issue of 2016, this journal uses article numbers instead of page numbers. See further details here.