Bimodal Emotion Recognition Model for Minnan Songs


1
School of Computer Science, Wuhan University, Wuhan 430072, China
2
School of Physics and Information Engineering, Minnan Normal University, Zhangzhou 363000, China
3
College of Information and Engineering, Jingdezhen Ceramic Institute, Jingdezhen 333000, China
*
Authors to whom correspondence should be addressed.
Information 2020, 11(3), 145; https://0-doi-org.brum.beds.ac.uk/10.3390/info11030145
Submission received: 29 January 2020
/
Revised: 20 February 2020
/
Accepted: 2 March 2020
/
Published: 4 March 2020
Abstract
:Most of the existing research papers study the emotion recognition of Minnan songs from the perspectives of music analysis theory and music appreciation. However, these investigations do not explore any possibility of carrying out an automatic emotion recognition of Minnan songs. In this paper, we propose a model that consists of four main modules to classify the emotion of Minnan songs by using the bimodal data—song lyrics and audio. In the proposed model, an attention-based Long Short-Term Memory (LSTM) neural network is applied to extract lyrical features, and a Convolutional Neural Network (CNN) is used to extract the audio features from the spectrum. Then, two kinds of extracted features are concatenated by multimodal compact bilinear pooling, and finally, the concatenated features are input to the classifying module to determine the song emotion. We designed three experiment groups to investigate the classifying performance of combinations of the four main parts, the comparisons of proposed model with the current approaches and the influence of a few key parameters on the performance of emotion recognition. The results show that the proposed model exhibits better performance over all other experimental groups. The accuracy, precision and recall of the proposed model exceed 0.80 in a combination of appropriate parameters.
UTF8gkai
1. Introduction
Minnan songs (also called Hokkien Song) are an important part of ancient Chinese music, the pronunciation, grammar and tone of Minnan songs are quite different from that of Mandarin songs. Minnan songs, which originated in the 1930s and formed in the 1950s and 1960s, are widely spread in Southern Fujian and Taiwan [1,2,3]. Minnan songs are popular among people in south Fujian and Taiwan, overseas Chinese and Chinese businessmen in southeast Asia [1,4,5]. The vivid rhythms and lyrics of Minnan songs contain rich cultural and spiritual treasures, and become the spiritual link connecting the Chinese in Southern Fujian [1]. The broad market demand and the significant effect of Minnan songs has gradually attracted the attention of experts and scholars [5]. Current studies that research the emotion of Minnan songs are mainly from the perspectives of music analysis theory and music appreciation [6], such as context, linguistic mode and the history of music development. These studies provide suggestions for inheriting the Minnan songs, as well as guidance for social media to develop the Minnan song market. In the Internet era, the availability of cloud-based streaming music applications with extensive libraries bring about the popularity of the song-recommended system. Current music recommendation systems are mostly based on song similarity and user similarity. Although these methods can match music genre and user needs to a certain extent, they do not consider whether the emotion of recommended songs matches the user’s desired sentiment. Therefore, effective emotion recognition has become a hot issue, especially in the field of music recommendation. Though current recommender systems that include emotion recognition could be applied to Minnan music, the research of emotion recognition based recommending system for Minnan music is not reported.
The audio signal and lyrical text of songs are semantically rich with respect to the expression of the emotion of music [7]. Most of the current work has concentrated their studies on the emotion recognition of music from two aspects, i.e., acoustic and semantic features. In the early stage of the music emotion recognition (MER), the main research task is to extract the features of the audio signals and use machine learning methods to realize the emotion classification. Tao Li et al. employed an independent real-time audio processing framework (denoted as Marsyas) to extract three features of audio signal, namely quality, rhythm and pitch, and then classified music emotion based on libsvm [8]. They further introduced the Daubechies Wavelet Coefficient Histograms (DWCH) to extract music features from audio content, then machine learning classifiers, for example, support vector machine, were applied to study the issue of detecting music emotion [9]. Kirandziska et al. in 2013 introduced a novel approach, including knowledge from psychological studies, that analyzed the human perception of emotions to help find the most relevant sound features and then used these features as input to the classifiers which were in the form of neural networks, SVM, classification trees etc., to predict the emotion of songs [10]. Misro et al. in 2014 extracted musical features from the vocal part and instrumental part of a song, and used Fuzzy K-Nearest Neighbors (FKNN) and Artificial Neural Network (ANN) to classify whether the selected Malay popular music contains “sad” or “happy” emotion [11]. Ridoean et al. in 2013 researched music mood recognition using audio power and audio harmonicity features. The classifying accuracy by Support Vector Machine (SVM) reached up to 74.28%, which performed better than using the feature extracted from audio spectrum projection [12]. Eerola et al. not only proposed a model to predict perceived emotions by the extracted features from the audio using MIR [13], they also developed a MIR toolbox to generate features, including two pitches (salient pitch and chromagram center) and three tonality (key clarity, mode and harmonic change) [14]. Emilia Gómez proposed algorithms to extract tonal descriptors which directly process digital audio recordings from acoustical instruments, and the proposed algorithms achieved an accuracy of around 80% [15]. Stoller presented a novel model based on a modified Wave-U-Net architecture, which could predict emotion classification directly from raw audio, and the training process of the proposed model was simplified as the model does not use any additional fine-grained annotations [16].
Lyrics also have rich emotional information within songs, which have a profound impact on the human perception of music [4]. People can get the emotional feelings easily, for example sadness, happiness or angry, from the lyrics of a song. Some researchers used natural language processing methods, such as word2vec [17], bag-of-words [18], part-of-speech [19] and latent semantic vectors [20] to extract music features from lyrics [21,22,23,24,25,26,27]. Dang et al. believed that a grasp of emotions in songs might be a great help for users to discover music effectively, taking lyrics and metadata as dataset, they proposed several supervised learning based classifiers to classify moods of songs automatically [28]. Xia et al. used the lyric text as the data resource for analyzing music emotion, then they extracted lyrical features and constructed emotion space vector model [29]. Li et al. classified the emotions of lyrics according to Hevner’s emotional ring [30], and found that the emotional space vector model based on emotional feature words and the text feature vector representation could improve the accuracy of emotional classification of songs [31]. Raschka applied a naive Bayes classifier to predict the sentiment of songs based on song lyrics alone, and the experimental results showed that the happy mood of music could be detected with a higher precision than that of other emotions [32]. Patra et al. studied the Hindi music mood classification by combining semantic and stylistic features extracted from textual lyrics. The experiments could achieve F-measure 38.49% at most for classifying emotions of the Hindi lyrics [33]. Miotto explored new music retrieval methods which are based on lyric description, acoustic similarity and a combination of the two factors, respectively, and their results showed that the proposed approaches can obtain efficient solutions compared with other alternative state-of-the-art strategies [34].
In spite of using lyrics or audio alone, some researchers combines the two materials to improve the accuracy of emotion recognition. Xiao et al. proposed a hybrid system combining the lyric features and audio features with fusion methods, and experiments showed that the hybrid system with fewer training samples could achieve the same or better classification accuracies than systems using lyrics or audio alone [35]. Jamdar et al. in 2015 proposed a method which considers the lyrical and audio features of songs to detect the emotion of songs [36]. In [36], for extracting lyrical features, the linguistic association rules are applied to ensure ambiguity is being addressed properly, and audio features are extracted from a music intelligence platform—Echo Nest. The emotion classification is conducted on the KNN algorithm by using feature weighting and stepwise threshold reduction [36]. Lee et al. proposed a convolutional attention networks model to learn the features of both speech and text data, and the proposed model obtained better results for classifying emotions in the benchmark datasets [37]. Some studies considered to use other mid-level or high-level audio features, such as chord progression and genre metadata in [27,38,39,40]. Lin et al. presented the association between genre and emotion, and proposed a two-layer scheme that could exploit the correlation for emotion classification [38]. Schuller et al. [40] incorporated genre, ballroom dance style, chord progression and lyrics to classify music emotion, and the experiments showed that most of the considered factors would improve the classification accuracy.
Inspired by these studies, this paper studies the emotion recognition of Minnan music by using the lyrics and audio. We get the songs of Southern Fujian from the platform of Kugou during the 80s–10s (1984–2017). The lyrical features are extracted by attention-based Long Short-Term Memory (LSTM) neural network, and the audio features are extracted by a proposed Convolutional Neural Network (CNN) from the Mel spectrum. Then the extracted two kinds of features are combined by adopting multimodal compact bilinear pooling. The music emotion is further determined by a fully-connected layers and softmax function. We set three groups of experiments according to the used data resource, i.e., experiments with lyric modality, experiments with audio modality and experiments with lyric and audio modality. In the experiments, we also set comparable groups for studying the performance of approaches in current studies and investigating the effect of a few key parameters on the music emotion recognition (MER).
The rest of the paper is structured as follows: Section 2 briefly introduces the proposed model, and the details of four main parts of the model are presented in detail. Section 3 presents the used dataset and preprocessing strategy of the data. Section 4 reports the setting of experiments, results of different combinations of the four main parts, the comparison of proposed model with the current new studies and meanwhile shows the effect of parameters on the performance of MER. Section 5 discusses the advantages and parameter settings of the proposed approach. Section 6 concludes this paper.
2. Model
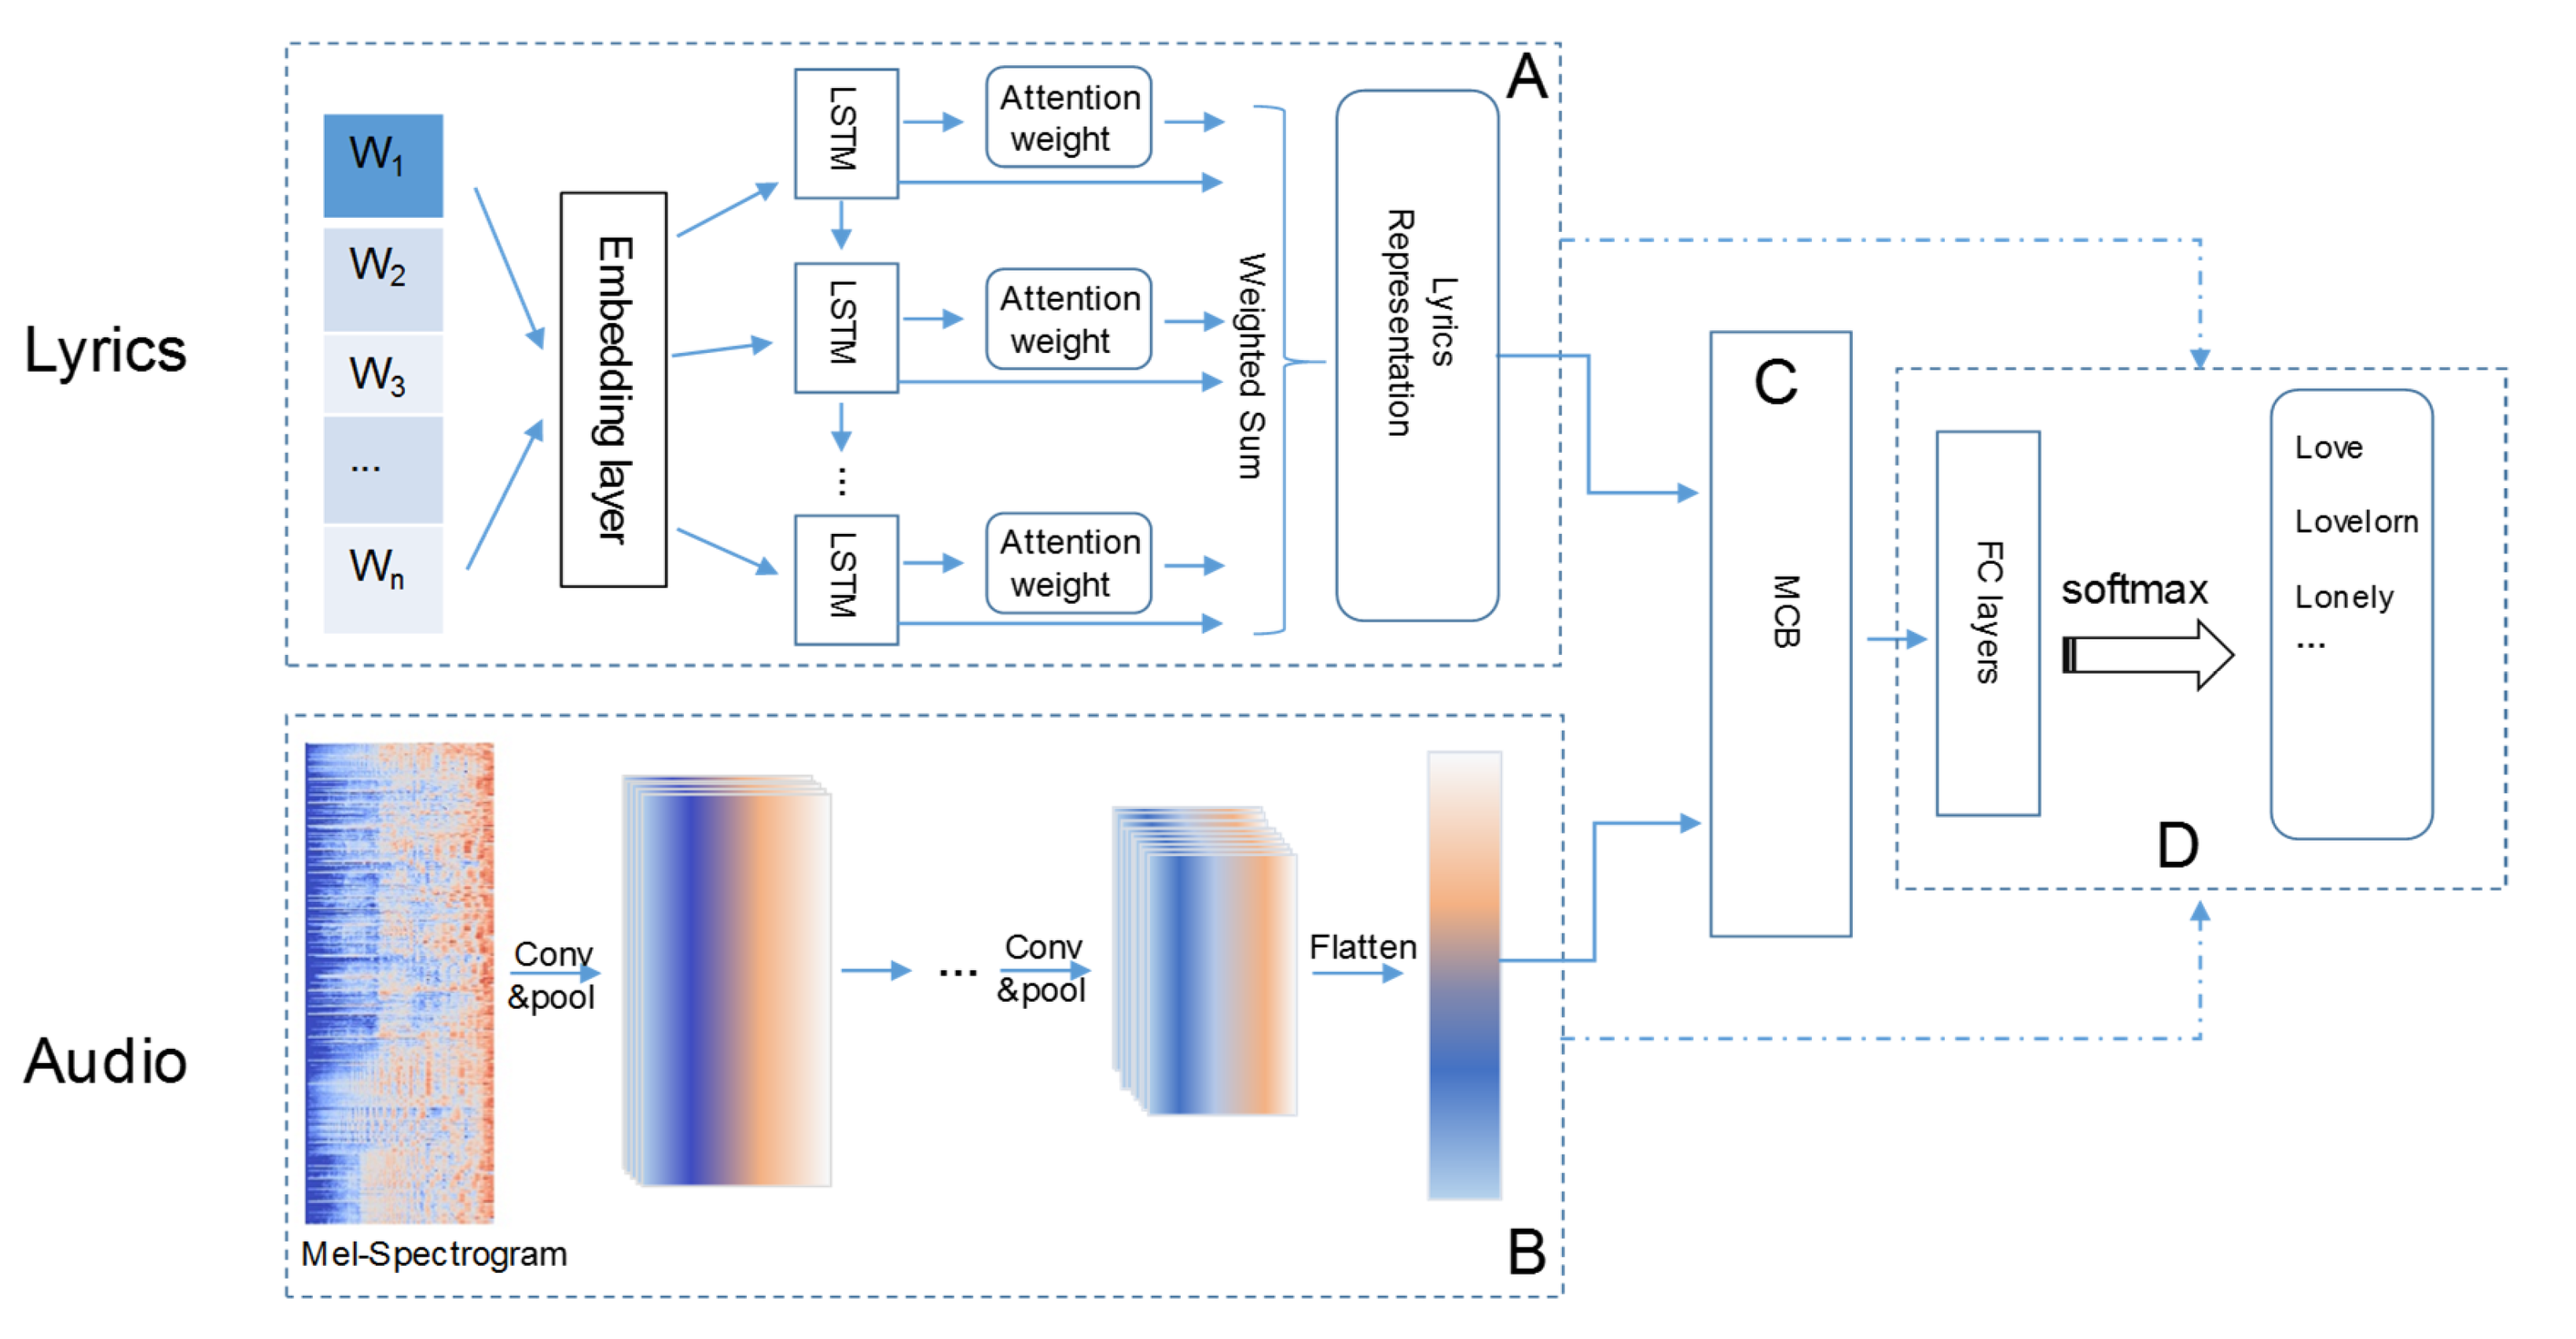
The overall architecture of the proposed model is shown in Figure 1, which is mainly consisted of four modules. In the first two modules (denoted as module and in Figure 1), two separated unimodal models learn the most discriminative features from audio and lyrics respectively. The attention mechanism based on a LSTM (Long short-term memory) neural network is used to highlight the most emotional words in lyrics. The CNN (convolutional neural network) model with a few stacked convolution-pooling layers extracts the audio features from the inputting spectrum. Instead of a simple concatenation of the generated audio features and lyric features, we combined the two types of features by the Multimodal Compact Bilinear pooling (MCB) in the third module (denoted as in Figure 1). Then in the fourth module (denoted as in Figure 1) the combined joint representation is fed to the classifier to determine the final decision of emotion classification.
2.1. Attention-Based LSTM for Extracting Lyric Features
In the lyrics of a song, some words usually express stronger emotion than other words. In our model, we use the attention-based LSTM (Long short-term memory) neural network to highlight the most important words. Let denotes lyrics of a set of n songs, where is the one hot vector representation. For the lyrics of each song , we embed the words into a vector space as Equation (1). The denotes the matrix of parameters, and parameters E and L are for the embedding and dimension length of lyrics.
Then higher level features are extracted from the word embedding vector . In Equation (2), the is the parameters of LSTM, and B is the size of LSTM cell.
According to the effect of words on the emotion classification, the attention mechanism is to assign different weights to each word . The exp(.) is the exponential function. The normalized attention over all words is calculated as follows:
where
is the unnormalized attention weight, and it reflects how closely the word is related to emotions. The parameters K and b are the learned weight matrix and bias term, respectively. The is the activation function Tanh. The attended features is computed as a weighted sum over the word annotations:
So the attended features of the ith song lyrics is generated as Equation (6), where the parameter denotes the weight parameters.
2.2. CNN Model for Extracting Audio Features
The rhythm and melody of music, usually relevant to song emotion, are mainly determined by the distribution and variance of signal energy on time and frequency domains. The Mel spectrogram is a visual representation for variances of the frequency spectrum over time of a signal, and it is computed as the nonlinear transform to the frequency axis of the Short-Time-Fourier-Transformation (STFT). The Mel spectrogram is usually applied in audio signal related applications due to its simple estimation, lower level acoustic representation.
As shown in Figure 1B, the CNN model only uses the Mel spectrogram of the audio signal as input, and a few stacked convolution-pooling layers extract audio features. The convolution calculation is written in Equation (7), where is the output feature map of layer l, and is the input feature map of layer . In Equation (7), is the parameter of the kth filter from layer to l; is the bias of layer l; the is the activation function, such as Relu, Sigmoid or Tanh, and here we use the Tanh function.
After one convolution layer, a max polling layer is then followed to understand the spectrogram. The pooling operation is written in Equation (8)
Finally, the output feature of ith song is denoted as after the flatten operation.
2.3. Multimodal Compact Bilinear Pooling
Bilinear pooling is the outer product between two vectors. Compared with the method of element-wise product or simple concatenation, bilinear pooling allows all elements of two vectors to interact, but the high dimensionality and infeasible number of parameters result in a high computation cost and an over-fitting problem. In order to reduce the number of parameters and avoid computing the outer product explicitly, we adopt the Multimodal Compact Bilinear pooling (MCB), projecting the joint outer product to a lower dimensional space and avoiding computing the outer product directly, to combine the extracted audio and lyric features.
A vector can be projected to a lower dimension by the count sketch projection function [41]. For example, the lyric features of the ith song is projected to a representation with a lower dimension (). Rather than calculating the outer product of two generated feature vectors directly, in Equation (9) the MCB computes the outer product of two vectors as convolution of two count sketches. The ∗ is the convolution operator.
2.4. Classifier for Determining Song Emotion
The combined audio and lyric features are fed to the module with Fully-Connected (FC) layers and a softmax function, and the formula is written in Equation (10). The is the parameters of the FC layers, and the is the joint embedding generated by MCB from Equation (9). As a result, the output vector o includes several values, which are the probabilities of emotions of a song.
3. Dataset and Preprocessing
3.1. Dataset
We get 1162 Minnan songs from the 80s to 10s (ranging from 1980 to 2017) from the Kugou musical platform, and the obtained songs include lyrical texts and audio in MP3 format. Different from the mainstream emotional classification for songs, the emotional expression of Minnan songs, based on the research in [42], are marked as seven categories, including love (相爱), lovelorn (失恋), inspirational (励志), lonely (漂泊孤苦), homesickness (思乡), miss someone (思人) and leave (离别). The detailed information for the seven types of songs are shown in Table 1.
3.2. Data Preprocessing
The data processing includes two parts, the processing of lyrical texts and the audio data. The lyrics of modern Minnan songs consist of Chinese and written Hokkien (the written form of the Minnan language). The Jieba segmentation module [43] can only work on Chinese texts, which means that the segmentation for the Minnan lyrics is inaccurate. So we add a new Minnan dictionary [44] to the Jieba database, such that the Minnan–Jieba dictionary is formed. For the preprocessing of lyrics, nontextual characters are removed at first. Then the lyrics are segmented by the formed Minnan–Jieba dictionary.
In this paper we have two kinds of preprocessing methods for the song audio. The first one is the open-source integrated platform, OpenSMILE [45], for extracting the physical characteristics (for example signal energy, loudness and pitch) from song audio. We first transform the song audio into the WAV format, then we extract features of each WAV formatted song audio by the OpenSMILE platform and further normalize the extracted features. The extracted physical attributes (denoting the dimension as k) includes frame energy, frame intensity and critical spectrum etc.
The second kind of audio preprocessing is to generate the Mel spectrum for the song audio. The climax of a song can reflect the real feelings of the song [4], so we select n seconds in the middle of a song audio. Then we can get a Mel spectrogram from the selected n seconds song audio, and we set the size of the obtained spectrum as in the following experiments. The window size is set as 1024, and the distance between adjacent windows is 512, i.e., there is a 50% overlap between two adjacent windows.
4. Experimental Results
4.1. Experiment Settings
The experiments were designed as three groups according to the used data resource, and we set the comparisons between two experimental groups using three aspects: the method for extracting features, classifier and main parameters, which are shown in Table 2. The first two groups a1–a7 and b1–b4 are single-modal based experiments, which use lyrical text and song audio alone as input data, respectively. The multimodal experimental groups, i.e., c1–c4, classify song emotion by combining song lyrics and song audio. In Table 2, the parameters and are the dimension of output lyric features and output audio features, respectively; the used classifiers in our experiments include the common used SVM (Support Vector Machine) and full-connected (FC) layers combining softmax (Figure 1D); the methods for extracting features consisted of the TF-IDF, LSTM, attention-based LSTM (Figure 1A), OpenSMILE and the CNN (Convolutional Neural Network, Figure 1B). In addition, we also set experimental comparisons for the concatenating approach of the extracted lyric and audio features. Further, the experiments of current approaches [46,47,48,49,50,51] on our used Minnan music dataset were also investigated. Groups a8–a9 and b5–a6 are the approaches for using unimodal data, and c4–a5 are the experiments for multimodal data.
The Group a1, as a compared base line for a2–a9, extracts features from the song lyrics by TF-IDF, then an SVM classifier is used to classify the emotion of songs, in which the dimension of extracted lyric features is set as 297. Group a2 extracts lyric features by using an LSTM model and using an SVM classifier to recognize song emotion. To compare the performance of different classifiers, different with the used classifier in group a2, the group a3 with determines a song emotion by the classifier—FC layers and softmax (Figure 1D). The group a4 also determines a song emotion by the module in Figure 1D, while the dimension of extracted features increases to compared with group a3. In the groups a6–a7, we apply the attention-based LSTM (Figure 1A) and the module in Figure 1D, and set as 64 and 128, respectively. Compared with the group a6, all settings are the same except that the group a5 uses the classifier SVM. In addition, the approaches in [46,47], as a comparison with groups a6–a7, apply the transfer learning-based DNN model and a Naive Bayes model, respectively, to estimate music emotion from lyric modality.
In groups b1–b8, the song audio is used as the data resource. The group Gb1 extracts audio features by OpenSMILE directly, and the dimension of extracted features is 384. Gb3 uses the CNN module to extract audio features from the spectrogram at first, and then inputs the extracted features to an SVM for classifying the song emotion. Different with the used classifier in group Gb3, group Gb4 uses fully-connected layers and softmax (Figure 1D) to determine the emotion of songs. As to group Gb5 and Gb6, the parameter n increases to 30 seconds, and the classifiers are designed to be the module in Figure 1D, and the values of are set as 64 and 128, respectively. It is noticeable that groups b4–b6 use the modules Figure 1B,D, respectively, which belong to the main parts of our proposed model. The groups b7–b8, for comparing with groups b4–b6, are the audio modality based approaches in current studies [48,49]. In particular, [48] combines CNN and LSTM to classify speech emotion, and [49] applies a deep neural network to determine speech emotion.
The groups Gc1–Gc8 use both song lyrics and song audio as data resource, which extract features by three different methods and two different types of classifiers. The methods for extracting features and classifiers are the same as groups Ga1–Gb8, and we select the best main parameters = 64, = 64 and n = 30 for Gc2–Gc6, and for Gc1. In the groups Gc1–Gc3, the extracted lyric and audio features are combined directly, while in Gc4–Gc6 the two types of features are concatenated by MCB (Multimodal Compact Bilinear pooling), i.e., Figure 1C. Further, two current approaches [50,51], using both lyric and audio modality, are denoted as groups Gc5–Gc6, which are designed for comparing with our proposed model Gc6.
The structure of our proposed model are set as follows. In the module A, the LSTM has 256 hidden neurons in each cell. The proposed CNN in Figure 1B, one convolution and a max-pooling layer are stacked for learning representation. The audio and lyric features are combined by the MCB in Figure 1C as a vector with the dimension 1024. The FC layers in Figure 1D is set as 1024–512–7(Tanh). For training the model, the common used stochastic gradient descent with learning rate 0.01 is used. To avoid the over-fitting problem, we use the dropout technique for the FC layers with a probability of 0.5, and we also use the dropout with a probability of 0.3 before and after the module in Figure 1C. All of the implementations of our model are trained on 2 × NVIDIA Tesla V100.
4.2. Results
4.2.1. Results for Unimodal Data
The experimental results consisted of two parts (i.e., the unimodal and multimodal data based experiments) in general by the modality of input data. In Table 3, experiments based on one modality (lyrics or audio) were conducted on different classifiers, feature-extraction methods and main parameters. Similar to most of the current studies, the classification performance is evaluated by accuracy, precision and recall. The accuracy is the ratio of the number of correct predictions to the total number of samples and it is defined in Equation (11). The precision is defined as the ratio of number of correct results to the number of all obtained results and it is formatted as Equation (12). Recall, written as Equation (13), is the ratio of the number of correct results to the total number of results that should have been obtained. In Equations (11)–(13), TP, TN, FP and FN represent “True Positives”, “True Negatives”, “False Positives” and “False Negatives”, respectively.
In the experiments, we set multiple splits of train and test dataset, and the fraction of train samples increases from 0.5 to 0.9. Every experimental group ran 20 times under each split in our experiments. The performance of group Ga1, extracting lyrical features by IF-IDF and training model by SVM classifier, is the worst among the experimental groups based on the lyrics modality. The precision of Ga2 with the same SVM classifier increases by more than 10% when extracting features with LSTM. Compared with Ga2, the accuracy/precision/recall increases by 2–7% in Ga3, where the classifier is replaced with the module in Figure 1D, i.e., the full-connection layers and softmax. In Ga4, the dimension of extracted lyric features grows to 128, while the result of Ga4 is slightly lower than that of Ga3. By adding the attention mechanism in groups Ga5–Ga7, the accuracy of Ga5–Ga7 is up to 10% higher than that of Ga2–Ga4 under the same classifier and parameter, and the accuracy, precision and recall reach up to 0.45, 0.38 and 0.35, respectively. Similar to the statistics of Ga3 and Ga4, the comparison between group Ga6 and Ga7 also show that the increase of cannot ensure a better emotion recognizing result.
By comparing the results of groups Ga1–Ga7 with groups Gb1–Gb6, the classification results based on audio modality outperform the results based on lyric modality in general. The accuracy of group with is almost the same with that of group with . So, a large dimension of extracted audio features by OpenSMILE may not promote the classifying accuracy. The performance of group Gb1 is at least 10% lower than that of Gb3, which means that the OpenSMILE is worse than CNN for extracting features from song audio. By setting the classifier of Gb4 as fully-connected layers and softmax (i.e., the module in Figure 1D), the classification performance of Gb4 is much better than that of Gb3, and the accuracy/precision/recall increases to 0.51/0.49/0.44 under the 90:10 train–test split in Gb4. The accuracy/precision/recall of group Gb5 increases when the parameter n grows from 15 in Gb4 to 30 in Gb5. The classification performance of group Gb6 with dimension is about 5% higher than that of Gb5 with .
In addition to the above mentioned results, we also investigate the song emotion recognition of current one-modality data based approaches with the Minnan song dataset. The results for lyric modality are the groups Ga8–Gb9, and results for audio modality are the groups Gb7–Gb8. The group Ga8 applies the transfer learning-based DNN models [46] to estimate song emotion from lyrics. The accuracy and precision of group Ga8 are slightly smaller than that of the attention-based LSTM (i.e., Ga6–Ga7), while the recall of Ga8 is far smaller than that of group Ga6–Ga7. As to the group Ga9, a simple Naive Bayes machine learning approach [47] is used for music emotion classification based on lyrics, the result of which is similar to that of group Ga1. Two audio-based emotion recognition approaches (i.e., the groups Gb7 and Gb8) are also compared with our designed experiments. In [48], the proposed method combined CNN and LSTM to classify speech emotion. Though the method in [48] applied in our dataset can get a better performance than group Gb5 and Gb6, the architecture of the method is complex and the computation cost is high. The [49] uses a deep multilayered neural network for the emotion recognition, and the result of which is similar to that of in Gb5. However, the group Gb6 with the parameter is still slightly higher than that of Gb8.
4.2.2. Results of Bimodal Data
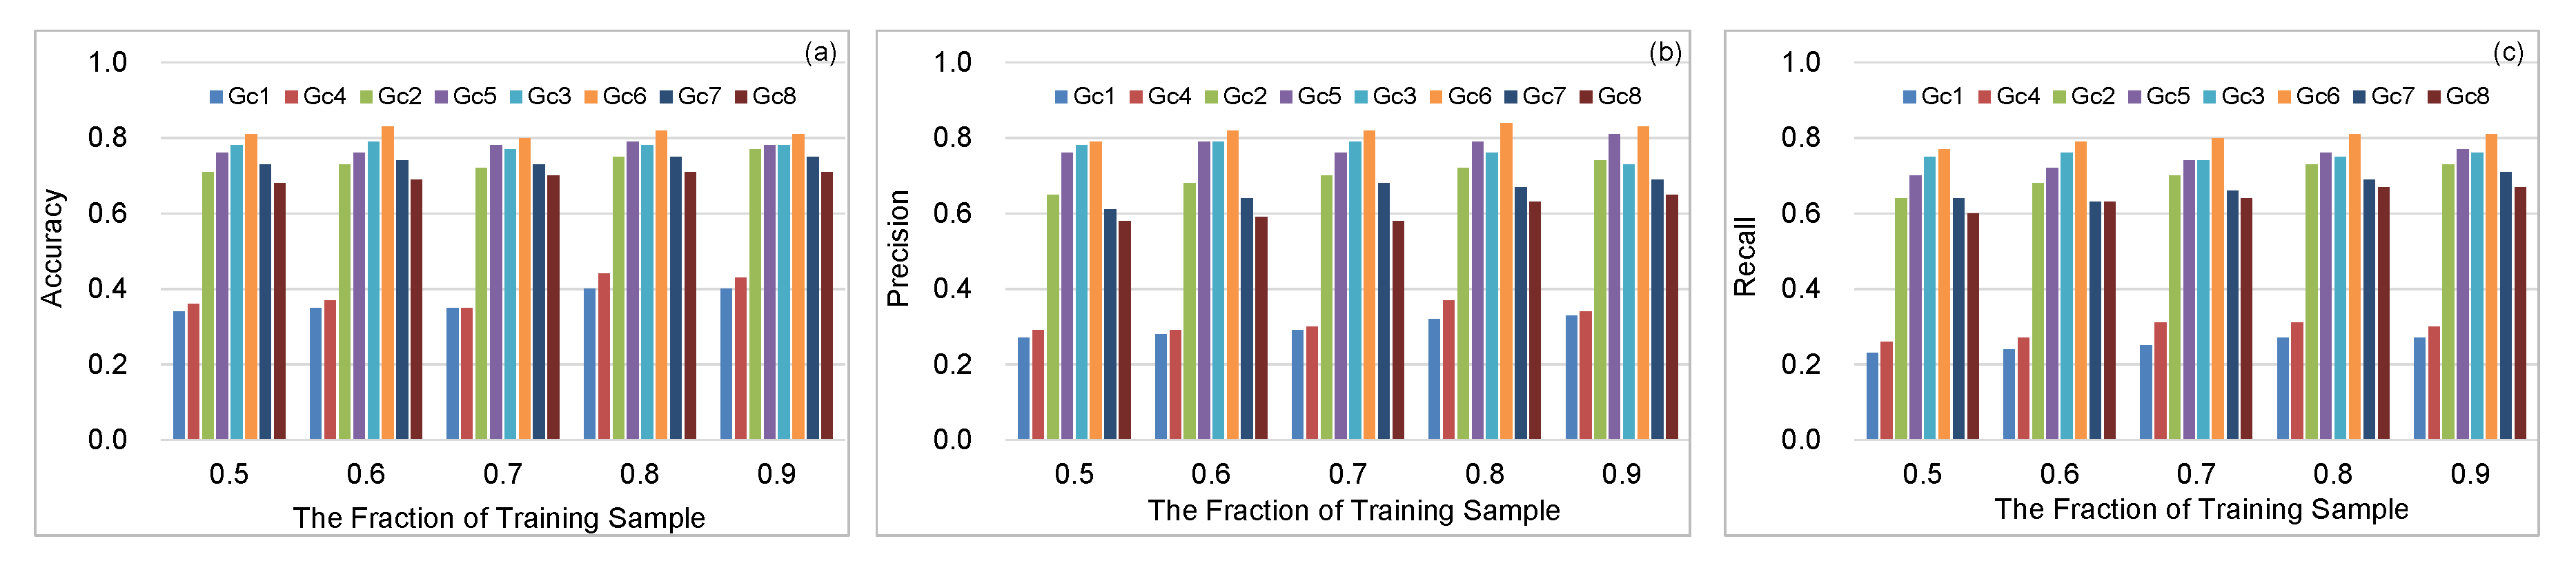
The results of emotion recognition based on the bimodal data, i.e., the combination of the lyrics and audio, are presented in Figure 2 and Table 4. From Table 3 and Table 4, the results by bimodal data is significantly higher than the experiment groups by unimodal data in general.
Group Gc1 extracts audio features and lyric features by by OpenSMILE and TF-IDF, respectively, and the accuracy increases to 0.4 at most in Figure 2, which is about 10% higher than that of group Ga1 and Gb1. Group Gc2 combines the feature-extraction method and main parameters of Ga3 and Gb5, and its accuracy is about 20% higher than that of Ga3 and Gb5. The group Gc3, combining group Ga6 and Gb5 together, achieves a better performance than that of Ga6 and Gb5, and the accuracy/precision/recall of which is up to 0.78/0.79/0.76, respectively. In Table 4 and Figure 2, groups Gc1–Gc3 are the results of concatenating two different types of features by multimodal compact bilinear pooling (MCB), while groups Gc1–Gc3 concatenate two features directly. We can see that the accuracy/precision/recall of groups Gc4–Gc6 are about 6% higher than that of Gc1–Gc3. It is noticeable that the result of group Gc6 (i.e., our proposed model in Figure 1) performs better than the other groups from Table 4 and Figure 2, which suggests that our model can recognize the emotion of songs more effectively. Groups Gc7–Gc8 are the results of two current studies [50,51], which combines two or more data resource to realize emotion recognition. The accuracy of group Gc7 is no larger than 5% the accuracy of our proposed model Gc6, while the accuracy and recall of Gc7 is over 10% lower than that of Gc6. In group Gc8, the performance of MER is significantly worse than Gc6 as the used model in Gc8 only focuses on positive and negative emotion in [50].
5. Discussion
From Table 3 and Table 4 we can conclude that the accuracy/precision/recall by using the Mel Spectrogram is higher than that of lyrics in general. The experiment results also show that by combining the audio and lyric modality can achieve a much better performance than that of only using audio or lyric modality alone. Moreover, the strategy, combining extracted audio and lyric features by multimodal compact bilinear pooling, can improve the results of Minnan music emotion recognition (MER) compared with concatenating two types of extracted features directly. The results of Table 3 show that the combined modules of our proposed model is better than the approaches of current studies. Table 4 and Figure 2 prestent that the performance of our proposed model on MER is the best compared with multimodal data based models in the two current studies. The results that using the extracted audio features from Mel Spectrogram by the CNN module of our proposed model can also get achieve a satisfactory level of performance. However, the Minnan MER of extracting features by OpenSMILE is the worst when only using audio modality, which indicates that the extracted audio features by OpenSMILE cannot describe the characteristics of Minnan songs well. The experimental results also show that the performance of attention strategy based LSTM is more effective for extracting lyric features than the LSTM.
To study the effect of parameters on the performance of music emotion recognition, we design a few comparable groups in the experiments. In Table 3 and Table 4, we can see that the longer selected segment n (in seconds) for generating the Mel spectrum, the better classifying performance on song emotion. However, in contrast to previous studies, a large dimension of extracted lyric features may result in a unsatisfactory classification result. The comparisons between the feature-extraction method by OpenSMILE also indicate that the large dimension of extracted audio features by OpenSMILE cannot guarantee a high classifying performance.
6. Conclusions and Future Work
This paper proposes a model that combines audio features and lyrical features to classify emotion of songs, in which the model includes four modules. In the first module, the audio features are extracted from the Mel spectrum by a proposed CNN model; in the the second module, features are extracted by an attention-based LSTM; the extracted audio and lyric features are concatenated by the multimodal compact bilinear pooling in the third module; then the emotion of a song is determined through the full-connected layers with softmax in the fourth module. We set three experimental groups to investigate the performance of different combinations of the four modules in the proposed model. The experiment results show that the performance of our proposed model on music emotion recognition (MER) is the best compared with all other experimental groups and approaches of current studies. Moreover, the results by combining the audio and lyric modality can achieve a much better performance than that of only using audio or lyric modality. Furthermore, the MER by combining extracted audio and lyric features with multimodal compact bilinear pooling is better than the results obtained by concatenating two extracted features directly. The comparisons show that the attention strategy is effective for obtaining a satisfactory classification result when extracting features from lyrics. It is noticeable that the MER by OpenSMILE is the worst when only using audio modality, so the statistics means that the extracted audio features by OpenSMILE cannot describe characteristics of Minnan songs well.
Further, to explore the influence of parameters on the performance (i.e., accuracy, precision and recall) of experimental groups, we offer different parameter combinations as comparable groups in the experiments. When using the Mel spectrum to extract audio features, the longer selected segment of song audio, the better classifying performance on song emotion. On the contrary, a larger dimension of extracted features by OpenSMILE may result in a unsatisfied classifying result.
There are a few interesting directions can be explored further. For example, the synchronization between lyrics and audio should be researched, i.e., the lyrical line corresponds to the portion of song audio, when extracting features from lyrics and audio. The consideration of synchronization may improve the accuracy of emotion recognition greatly. Separating the vocal part from the song audio in the preprocessing of song audio should be tried, and the emotion classification experiments by extracting features from vocal signal and a mixture of instruments signal can be compared. The multimodal data, combining vocal modality, instruments modality and lyrics modality, the model should be proposed to research music emotion recognition. In this paper, we concatenate the lyrical features and audio features by multimodal compact bilinear pooling. Other concatenation approaches, for example, an attention mechanism, can be studied to improve the efficiency of emotion recognition.
Author Contributions
Z.X. performed the experiments and wrote the paper; X.D. collected the data and processed the raw data; H.W. and F.Y. designed the model and the experiments; X.X. and Y.L. edited the paper. All authors have read and agreed to the published version of the manuscript.
Funding
This work was funded by the Fujian Province Great Teaching Reform, China (No. FBJG 20180015), the National Natural Science Foundation of China (No. 61702239, 61672391), the Science Foundation of Jiangxi Provincial Department of Education (GJJ170765,GJJ170798) and the Project of Jingdezhen Science and Technology Bureau (20161GYZD011-011).
Conflicts of Interest
The authors declare no conflict of interest.
References
- Clark, H.R. The Fu of Minnan: A Local Clan in Late Tang and Song China (9th–13th Centuries). J. Econ. Soc. Hist. Orient 1995, 38, 1. [Google Scholar] [CrossRef]
- Chuimei, H. The ceramic boom in Minnan during Song and Yuan times. In The Emporium of the World: Maritime Quanzhou, 1000–1400; Brill: Leiden, the Netherlands, 2001; pp. 237–282. [Google Scholar]
- Lin, M.; Chu, C.C.; Chang, S.L.; Lee, H.L.; Loo, J.H.; Akaza, T.; Juji, T.; Ohashi, J.; Tokunaga, K. The origin of Minnan and Hakka, the so-called Taiwanese, inferred by HLA study. Tissue Antigens 2001, 57, 192–199. [Google Scholar] [CrossRef] [PubMed]
- Ali, S.O.; Peynircioğlu, Z.F. Songs and emotions: Are lyrics and melodies equal partners? Psychol. Music 2006, 34, 511–534. [Google Scholar] [CrossRef]
- Hu, Z.L.; Xu, G.H.; Li, Y.; Liu, Q.M. Study on Choral Music in Minnan Dialect in Fujian and Taiwan. J. Jimei Univ. (Philosophy Soc. Sci.) 2011, 14, 17. [Google Scholar]
- Lihong, C. An Analysis of Folk Songs in Minnan Dialect. J. Jimei Univ. (Philosophy Soc. Sci.) 2011, 30, 136–140. [Google Scholar]
- Perlovsky, L. Cognitive function, origin, and evolution of musical emotions. Music. Sci. 2012, 16, 185–199. [Google Scholar] [CrossRef] [Green Version]
- Li, T.; Ogihara, M. Detecting Emotion in Music. 2003. Available online: https://0-jscholarship-library-jhu-edu.brum.beds.ac.uk/handle/1774.2/41 (accessed on 2 March 2020).
- Li, T.; Ogihara, M. Toward intelligent music information retrieval. IEEE Trans. Multimed. 2006, 8, 564–574. [Google Scholar]
- Kirandziska, V.; Ackovska, N. Finding important sound features for emotion evaluation classification. In Proceedings of the Eurocon 2013, Zagreb, Croatia, 1–4 July 2013; pp. 1637–1644. [Google Scholar]
- Misron, M.M.; Rosli, N.; Manaf, N.A.; Halim, H.A. Music Emotion Classification (MEC): Exploiting Vocal and Instrumental Sound Features. In Recent Advances on Soft Computing and Data Mining; Springer: Cham, Switzerland, 2014. [Google Scholar]
- Ridoean, J.A.; Sarno, R.; Sunaryo, D.; Wijaya, D.R. Music mood classification using audio power and audio harmonicity based on MPEG-7 audio features and Support Vector Machine. In Proceedings of the 2017 3rd International Conference on Science in Information Technology (ICSITech), Bandung, Indonesia, 25–26 October 2017; pp. 72–76. [Google Scholar]
- Eerola, T.; Lartillot, O.; Toiviainen, P. Prediction of Multidimensional Emotional Ratings in Music from Audio Using Multivariate Regression Models. In Proceedings of the 10th International Society for Music Information Retrieval Conference, Kobe, Japan, 26–30 October 2009; pp. 621–626. [Google Scholar]
- Lartillot, O.; Toiviainen, P. A Matlab toolbox for musical feature extraction from audio. In Proceedings of the International Conference on Digital Audio Effects, Bordeaux, France, 10–15 September 2007; pp. 237–244. [Google Scholar]
- Gómez, E. Tonal Description of Music Audio Signals. Ph.D. Thesis, Universitat Pompeu Fabra, Barcelona, Spain, 2006. [Google Scholar]
- Stoller, D.; Durand, S.; Ewert, S. End-to-end Lyrics Alignment for Polyphonic Music Using an Audio-to-character Recognition Model. In Proceedings of the ICASSP 2019—2019 IEEE International Conference on Acoustics, Speech and Signal Processing (ICASSP), Brighton, UK, 12–17 May 2019; pp. 181–185. [Google Scholar]
- Mikolov, T.; Chen, K.; Corrado, G.; Dean, J. Efficient estimation of word representations in vector space. arXiv 2013, arXiv:1301.3781. [Google Scholar]
- Sivic, J.; Zisserman, A. Efficient visual search of videos cast as text retrieval. IEEE Trans. Pattern Anal. Mach. Intell. 2008, 31, 591–606. [Google Scholar] [CrossRef] [PubMed] [Green Version]
- Sebastiani, F. Machine learning in automated text categorization. ACM Comput. Surv. (CSUR) 2002, 34, 1–47. [Google Scholar] [CrossRef]
- Hofmann, T. Probabilistic latent semantic indexing. ACM SIGIR Forum; ACM Press: New York, NY, USA, 1999; Volume 51, pp. 211–218. [Google Scholar]
- Hu, X.; Downie, J.S.; Ehmann, A.F. Lyric text mining in music mood classification. Am. Music 2009, 183, 2–209. [Google Scholar]
- Laurier, C.; Herrera, P. Mood cloud: A real-time music mood visualization tool. In Computer Music Modeling and Retrieval. Sense of Sounds; Springer: Cham, Switzerland, 2008. [Google Scholar]
- Lu, Q.; Chen, X.; Yang, D.; Wang, J. Boosting for Multi-Modal Music Emotion. In Proceedings of the 11th International Society for Music Information and Retrieval Conference, Utrecht, The Netherlands, 9–13 August 2010; p. 105. [Google Scholar]
- Meyers, O.C. A mood-based music classification and exploration system. Master’s Thesis, Massachusetts Institute of Technology, Cambridge, MA, USA, 2007. [Google Scholar]
- Yang, D.; Lee, W.S. Disambiguating Music Emotion Using Software Agents. In Proceedings of the 5th International Conference on Music Information Retrieval, Barcelona, Spain, 10–14 October 2004; pp. 218–223. [Google Scholar]
- Yang, Y.H.; Lin, Y.C.; Su, Y.F.; Chen, H.H. A regression approach to music emotion recognition. IEEE Trans. Audio Speech Lang. Process. 2008, 16, 448–457. [Google Scholar] [CrossRef]
- Cheng, H.T.; Yang, Y.H.; Lin, Y.C.; Liao, I.B.; Chen, H.H. Automatic chord recognition for music classification and retrieval. In Proceedings of the 2008 IEEE International Conference on Multimedia and Expo, Hannover, Germany, 23 June–26 April 2008; pp. 1505–1508. [Google Scholar]
- Dang, T.T.; Shirai, K. Machine learning approaches for mood classification of songs toward music search engine. In Proceedings of the 2009 International Conference on Knowledge and Systems Engineering, Hanoi, Vietnam, 13–17 October 2009; pp. 144–149. [Google Scholar]
- Xia, Y.; YANG, Y.; ZHANG, P.; LIU, Y. Lyric-Based Song Sentiment Analysis by Sentiment Vector Space Model. J. Chin. Inf. Process. 2010, 24, 99–104. [Google Scholar]
- Hevner, K. Expression in music: A discussion of experimental studies and theories. Psychol. Rev. 1935, 42, 186. [Google Scholar] [CrossRef]
- Li, J.; Lin, H.; Li, R. Sentiment Vector Space Model Based Music Emotion Tag Prediction. J. Chin. Inf. Process. 2012, 26, 45–51. [Google Scholar]
- Raschka, S. MusicMood: Predicting the mood of music from song lyrics using machine learning. arXiv 2016, arXiv:1611.00138. [Google Scholar]
- Patra, B.G.; Das, D.; Bandyopadhyay, S. Mood classification of hindi songs based on lyrics. In Proceedings of the 12th International Conference on Natural Language Processing; Sharma, D.M., Sangal, R., Sherly, E., Eds.; NLP Association of India: Trivandrum, India, 2015; pp. 261–267. [Google Scholar]
- Miotto, R. Content-based Music Access: Combining Audio Features and Semantic Information for Music Search Engines. Master’s Thesis, Universita degli Studi di Pavia, Pavia, Italy, 2011. [Google Scholar]
- Hu, X.; Downie, J.S. Improving mood classification in music digital libraries by combining lyrics and audio. In Proceedings of the 10th Annual Joint Conference on Digital Libraries; Association for Computing Machinery: New York, NY, USA, 2010; pp. 159–168. [Google Scholar]
- Jamdar, A.; Abraham, J.; Khanna, K.; Dubey, R. Emotion analysis of songs based on lyrical and audio features. arXiv 2015, arXiv:1506.05012. [Google Scholar] [CrossRef]
- Lee, C.W.; Song, K.Y.; Jeong, J.; Choi, W.Y. Convolutional attention networks for multimodal emotion recognition from speech and text data. In Proceedings of the first Grand Challenge and Workshop on Human Multimodal Language (Challenge-HML), Vancouver, BC, Canada, 15–20 July 2018; pp. 28–34. [Google Scholar]
- Lin, Y.C.; Yang, Y.H.; Chen, H.H.; Liao, I.B.; Ho, Y.C. Exploiting genre for music emotion classification. In Proceedings of the 2009 IEEE International Conference on Multimedia and Expo, New York, NY, USA, 28 June–3 July 2009; pp. 618–621. [Google Scholar]
- Schuller, B.; Eyben, F.; Rigoll, G. Tango or waltz?: Putting ballroom dance style into tempo detection. EURASIP J. Audio Speech Music Process. 2008, 2008, 846135. [Google Scholar] [CrossRef] [Green Version]
- Schuller, B.; Dorfner, J.; Rigoll, G. Determination of nonprototypical valence and arousal in popular music: Features and performances. EURASIP J. Audio Speech Music Process. 2010, 2010, 735854. [Google Scholar] [CrossRef]
- Charikar, M.; Chen, K.; Farach-Colton, M. Finding Frequent Items in Data Streams. In Automata, Languages and Programming; Widmayer, P., Eidenbenz, S., Triguero, F., Morales, R., Conejo, R., Hennessy, M., Eds.; Springer: Berlin/Heidelberg, Germany, 2002; pp. 693–703. [Google Scholar]
- Huang, R. Taiwanese Songs Cultural Communication Studies. Ph.D. Thesis, Huazhong Normal University, Wuhan, China, 2015. [Google Scholar]
- Durrani, N.; Hussain, S. Urdu Word Segmentation. In Proceedings of the Human Language Technologies: Conference of the North American Chapter of the Association of Computational Linguistics, Los Angeles, CA, USA, 2–4 June 2010. [Google Scholar]
- Yang, Y. Discussion on the construction technology and usage of Taiwan Chinese Online Dictionary. In Proceedings of the 2003 3rd International Symposium on Chinese Online Education; Taiwan University: Taibei, Taiwan, 2003; pp. 132–141. [Google Scholar]
- Eyben, F.; Wöllmer, M.; Schuller, B. openSMILE—The Munich Versatile and Fast Open-Source Audio Feature Extractor. In Proceedings of the 9th ACM International Conference on Multimedia, Firenze, Italy, 25–29 October 2010. [Google Scholar]
- Matsumoto, K.; Sasayama, M.; Yoshida, M.; Kita, K.; Ren, F. Transfer Learning Based on Utterance Emotion Corpus for Lyric Emotion Estimation. In Proceedings of the 2018 5th IEEE International Conference on Cloud Computing and Intelligence Systems (CCIS), Nanjing, China, 23–25 November 2018; pp. 699–703. [Google Scholar] [CrossRef]
- An, Y.; Sun, S.; Wang, S. Naive Bayes classifiers for music emotion classification based on lyrics. In Proceedings of the 2017 IEEE/ACIS 16th International Conference on Computer and Information Science (ICIS), Wuhan, China, 24–26 May 2017; pp. 635–638. [Google Scholar] [CrossRef]
- Lim, W.; Jang, D.; Lee, T. Speech emotion recognition using convolutional and Recurrent Neural Networks. In Proceedings of the 2016 Asia-Pacific Signal and Information Processing Association Annual Summit and Conference (APSIPA), Jeju, Korea, 13–16 December 2016; pp. 1–4. [Google Scholar] [CrossRef]
- Fayek, H.M.; Lech, M.; Cavedon, L. Evaluating deep learning architectures for Speech Emotion Recognition. Neural Netw. 2017, 92, 60–68. [Google Scholar] [CrossRef] [PubMed]
- Poria, S.; Chaturvedi, I.; Cambria, E.; Hussain, A. Convolutional MKL Based Multimodal Emotion Recognition and Sentiment Analysis. In Proceedings of the 2016 IEEE 16th International Conference on Data Mining (ICDM), Barcelona, Spain, 12–15 December 2016; pp. 439–448. [Google Scholar] [CrossRef] [Green Version]
- Jeon, B.; Kim, C.; Kim, A.; Kim, D.; Park, J.; Ha, J.W. Music Emotion Recognition via End-to-End Multimodal Neural Networks. 2017. Available online: https://pdfs.semanticscholar.org/ce3b/93d715b16ab9f7b65442d37a9fedcee18071.pdf (accessed on 3 March 2020).
Figure 1.
Model for bimodal representation learning between song audio and lyrics for emotion classification. The model includes four main modules: module A: the attention-based Long Short-Term Memory (LSTM) for extracting lyric features; module B: the proposed Convolutional Neural Network (CNN) for extracting audio features; module C: concatenating extracted audio and lyrics features by multimodal compact bilinear pooling; module D: determining song emotion by Fully-Connected (FC) layers and softmax.

Figure 2.
The performance of bimodal data based eight experimental groups. (a) The accuracy of bimodal emotion classification on eight experimental groups. (b) The precision of bimodal emotion classification on eight experimental groups. (c) The recall of bimodal emotion classification on eight experimental groups.


Table 1.
Experimental dataset.
| Time | Love | Lovelorn | Inspirational | Lonely | Homesick | Missing someone | Leave | Total |
|---|---|---|---|---|---|---|---|---|
| 80’s | 39 | 68 | 34 | 47 | 28 | 36 | 35 | 287 |
| 90’s | 45 | 107 | 24 | 33 | 6 | 48 | 17 | 280 |
| 00’s | 44 | 119 | 33 | 26 | 12 | 46 | 15 | 295 |
| 10’s | 54 | 99 | 34 | 23 | 22 | 59 | 9 | 300 |
Table 2.
Details of designed three experimental groups.
| Experimental Group | Data Resource | Method for Extracting Features | Main Parameters | Classifier |
|---|---|---|---|---|
| a1 | Lyrics | TF-IDF | = 297 | SVM |
| a2 | Lyrics | LSTM | = 64 | SVM |
| a3 | Lyrics | LSTM | = 64 | D |
| a4 | Lyrics | LSTM | = 128 | D |
| a5 | Lyrics | A | = 64 | SVM |
| a6 | Lyrics | A | = 64 | D |
| a7 | Lyrics | A | = 128 | D |
| a8 | Lyrics | [46] | \ | \ |
| a9 | Lyrics | [47] | \ | \ |
| b1 | Audio | OpenSMILE | = 384 | SVM |
| b2 | Audio | OpenSMILE | = 1582 | SVM |
| b3 | Audio | B | = 64, n = 15 | SVM |
| b4 | Audio | B | = 64, n = 15 | D |
| b5 | Audio | B | = 64, n = 30 | D |
| b6 | Audio | B | = 128, n = 30 | D |
| b7 | Audio | [48] | \ | \ |
| b8 | Audio | [49] | \ | \ |
| c1 | Lyrics, Audio | TF-IDF+OpenSMILE | = 297, = 384 | D |
| c2 | Lyrics, Audio | LSTM+B | = 64, = 64, n = 30 | D |
| c3 | Lyrics, Audio | A+B | = 64, = 64, n = 30 | D |
| c4 | Lyrics, Audio | TF-IDF+OpenSMILE+C | = 297, = 384, n = 30 | D |
| c5 | Lyrics, Audio | LSTM+B+C | = 64, = 64, n = 30 | D |
| c6 | Lyrics, Audio | A+B+C | = 64, = 64, n = 30 | D |
| c7 | Lyrics, Audio | [51] | \ | \ |
| c8 | Lyrics, Audio | [50] | \ | \ |
Table 3.
Average performance of unimodal data based experimental groups.
| Group | Accuracy | Precision | Recall | ||||||||||||
|---|---|---|---|---|---|---|---|---|---|---|---|---|---|---|---|
| 0.5 | 0.6 | 0.7 | 0.8 | 0.9 | 0.5 | 0.6 | 0.7 | 0.8 | 0.9 | 0.5 | 0.6 | 0.7 | 0.8 | 0.9 | |
| a1 | 0.22 | 0.23 | 0.25 | 0.27 | 0.30 | 0.12 | 0.12 | 0.15 | 0.16 | 0.16 | 0.14 | 0.14 | 0.14 | 0.14 | 0.14 |
| a2 | 0.28 | 0.28 | 0.31 | 0.30 | 0.31 | 0.21 | 0.21 | 0.22 | 0.25 | 0.29 | 0.18 | 0.19 | 0.19 | 0.23 | 0.26 |
| a3 | 0.31 | 0.31 | 0.34 | 0.35 | 0.35 | 0.23 | 0.23 | 0.25 | 0.32 | 0.32 | 0.20 | 0.21 | 0.21 | 0.27 | 0.30 |
| a4 | 0.30 | 0.30 | 0.32 | 0.32 | 0.33 | 0.24 | 0.21 | 0.25 | 0.31 | 0.31 | 0.19 | 0.19 | 0.20 | 0.24 | 0.28 |
| a5 | 0.35 | 0.37 | 0.39 | 0.40 | 0.40 | 0.29 | 0.28 | 0.28 | 0.38 | 0.36 | 0.27 | 0.26 | 0.27 | 0.31 | 0.34 |
| a6 | 0.37 | 0.37 | 0.40 | 0.41 | 0.45 | 0.26 | 0.29 | 0.32 | 0.36 | 0.38 | 0.26 | 0.26 | 0.28 | 0.30 | 0.35 |
| a7 | 0.34 | 0.35 | 0.35 | 0.37 | 0.42 | 0.28 | 0.29 | 0.31 | 0.32 | 0.35 | 0.24 | 0.26 | 0.27 | 0.31 | 0.27 |
| a8 | 0.32 | 0.32 | 0.36 | 0.33 | 0.36 | 0.24 | 0.22 | 0.25 | 0.28 | 0.33 | 0.19 | 0.21 | 0.22 | 0.25 | 0.26 |
| a9 | 0.20 | 0.20 | 0.22 | 0.23 | 0.24 | 0.12 | 0.11 | 0.13 | 0.14 | 0.14 | 0.11 | 0.12 | 0.13 | 0.12 | 0.14 |
| b1 | 0.28 | 0.28 | 0.28 | 0.29 | 0.30 | 0.20 | 0.20 | 0.20 | 0.21 | 0.22 | 0.19 | 0.18 | 0.18 | 0.20 | 0.19 |
| b2 | 0.27 | 0.27 | 0.28 | 0.28 | 0.28 | 0.19 | 0.19 | 0.21 | 0.21 | 0.21 | 0.17 | 0.17 | 0.18 | 0.19 | 0.19 |
| b3 | 0.38 | 0.42 | 0.44 | 0.49 | 0.52 | 0.34 | 0.38 | 0.41 | 0.45 | 0.48 | 0.29 | 0.31 | 0.32 | 0.36 | 0.41 |
| b4 | 0.43 | 0.45 | 0.46 | 0.48 | 0.51 | 0.41 | 0.43 | 0.43 | 0.44 | 0.49 | 0.32 | 0.34 | 0.35 | 0.38 | 0.44 |
| b5 | 0.49 | 0.51 | 0.51 | 0.53 | 0.57 | 0.46 | 0.46 | 0.43 | 0.48 | 0.53 | 0.37 | 0.41 | 0.41 | 0.46 | 0.52 |
| b6 | 0.54 | 0.56 | 0.58 | 0.60 | 0.62 | 0.49 | 0.51 | 0.55 | 0.54 | 0.58 | 0.41 | 0.44 | 0.47 | 0.51 | 0.56 |
| b7 | 0.50 | 0.53 | 0.56 | 0.56 | 0.60 | 0.50 | 0.51 | 0.44 | 0.49 | 0.57 | 0.38 | 0.45 | 0.45 | 0.48 | 0.53 |
| b8 | 0.52 | 0.54 | 0.52 | 0.56 | 0.59 | 0.47 | 0.50 | 0.44 | 0.53 | 0.53 | 0.38 | 0.43 | 0.41 | 0.49 | 0.52 |
Table 4.
Average performance of bimodal data based experimental groups.
| Group | Accuracy | Precision | Recall | ||||||||||||
|---|---|---|---|---|---|---|---|---|---|---|---|---|---|---|---|
| 0.5 | 0.6 | 0.7 | 0.8 | 0.9 | 0.5 | 0.6 | 0.7 | 0.8 | 0.9 | 0.5 | 0.6 | 0.7 | 0.8 | 0.9 | |
| c1 | 0.34 | 0.35 | 0.35 | 0.4 | 0.4 | 0.27 | 0.28 | 0.29 | 0.32 | 0.33 | 0.23 | 0.24 | 0.25 | 0.27 | 0.27 |
| c2 | 0.71 | 0.73 | 0.72 | 0.75 | 0.77 | 0.65 | 0.68 | 0.70 | 0.72 | 0.74 | 0.64 | 0.68 | 0.7 | 0.73 | 0.73 |
| c3 | 0.78 | 0.79 | 0.77 | 0.78 | 0.78 | 0.78 | 0.79 | 0.79 | 0.76 | 0.73 | 0.75 | 0.76 | 0.74 | 0.75 | 0.76 |
| c4 | 0.36 | 0.37 | 0.35 | 0.44 | 0.43 | 0.29 | 0.29 | 0.30 | 0.37 | 0.34 | 0.26 | 0.27 | 0.31 | 0.31 | 0.33 |
| c5 | 0.76 | 0.76 | 0.78 | 0.79 | 0.78 | 0.76 | 0.79 | 0.76 | 0.79 | 0.81 | 0.70 | 0.72 | 0.74 | 0.76 | 0.77 |
| c6 | 0.81 | 0.83 | 0.80 | 0.82 | 0.81 | 0.79 | 0.82 | 0.82 | 0.84 | 0.83 | 0.77 | 0.79 | 0.80 | 0.81 | 0.81 |
| c7 | 0.73 | 0.74 | 0.73 | 0.75 | 0.75 | 0.61 | 0.64 | 0.68 | 0.67 | 0.69 | 0.64 | 0.63 | 0.66 | 0.69 | 0.71 |
| c8 | 0.68 | 0.69 | 0.70 | 0.71 | 0.71 | 0.58 | 0.59 | 0.58 | 0.63 | 0.65 | 0.60 | 0.63 | 0.64 | 0.67 | 0.67 |
© 2020 by the authors. Licensee MDPI, Basel, Switzerland. This article is an open access article distributed under the terms and conditions of the Creative Commons Attribution (CC BY) license (http://creativecommons.org/licenses/by/4.0/).
Share and Cite
MDPI and ACS Style
Xiang, Z.; Dong, X.; Li, Y.; Yu, F.; Xu, X.; Wu, H. Bimodal Emotion Recognition Model for Minnan Songs. Information 2020, 11, 145. https://0-doi-org.brum.beds.ac.uk/10.3390/info11030145
AMA Style
Xiang Z, Dong X, Li Y, Yu F, Xu X, Wu H. Bimodal Emotion Recognition Model for Minnan Songs. Information. 2020; 11(3):145. https://0-doi-org.brum.beds.ac.uk/10.3390/info11030145
Chicago/Turabian StyleXiang, Zhenglong, Xialei Dong, Yuanxiang Li, Fei Yu, Xing Xu, and Hongrun Wu. 2020. "Bimodal Emotion Recognition Model for Minnan Songs" Information 11, no. 3: 145. https://0-doi-org.brum.beds.ac.uk/10.3390/info11030145
Note that from the first issue of 2016, this journal uses article numbers instead of page numbers. See further details here.