Screening System for Cardiac Problems through Non-Invasive Identification of Blood Pressure Waveform


1
LAETA–INEGI, Faculty of Engineering, University of Porto, 4200-465 Porto, Portugal
2
INEGI, Faculty of Engineering, University of Porto, 4200-465 Porto, Portugal
*
Author to whom correspondence should be addressed.
Information 2020, 11(3), 150; https://0-doi-org.brum.beds.ac.uk/10.3390/info11030150
Submission received: 30 December 2019
/
Revised: 24 February 2020
/
Accepted: 5 March 2020
/
Published: 10 March 2020
(This article belongs to the Special Issue Online Experimentation and the IoE)
Abstract
:This paper presents the initial development of a non-invasive system for identification of the pulse pressure waveform to be used for screening cardiac problems. The system employs a tonometric method using an off-the-shelf force sensor and custom-designed electronic circuits. Initial results on the use of the system are presented.
1. Introduction
Arterial blood pressure has been recognized as of primary importance for assessment of cardiac function [1,2,3]. Distinct methods can be employed for measuring arterial blood pressure, providing discrete values, such as peak values or continuous values. The measurement of the systolic and diastolic blood pressure on the brachial artery is used for diagnosis and management of hypertension. Nevertheless, when assessing central aortic blood pressure, carotid and aortic pressures are physiologically more relevant than peripheral pressures. The fact that the blood pressure waveform is modified as it moves outward from the heart to the peripheral arteries, due to the occurrence of wave reflections, creates a challenge in obtaining accurate estimations. As central blood pressure has been recognized as a good predictor of cardiovascular risk, the continuous assessment of the blood pressure along the cardiac cycle—the blood pressure waveform—presents a challenge that is explored in this paper.
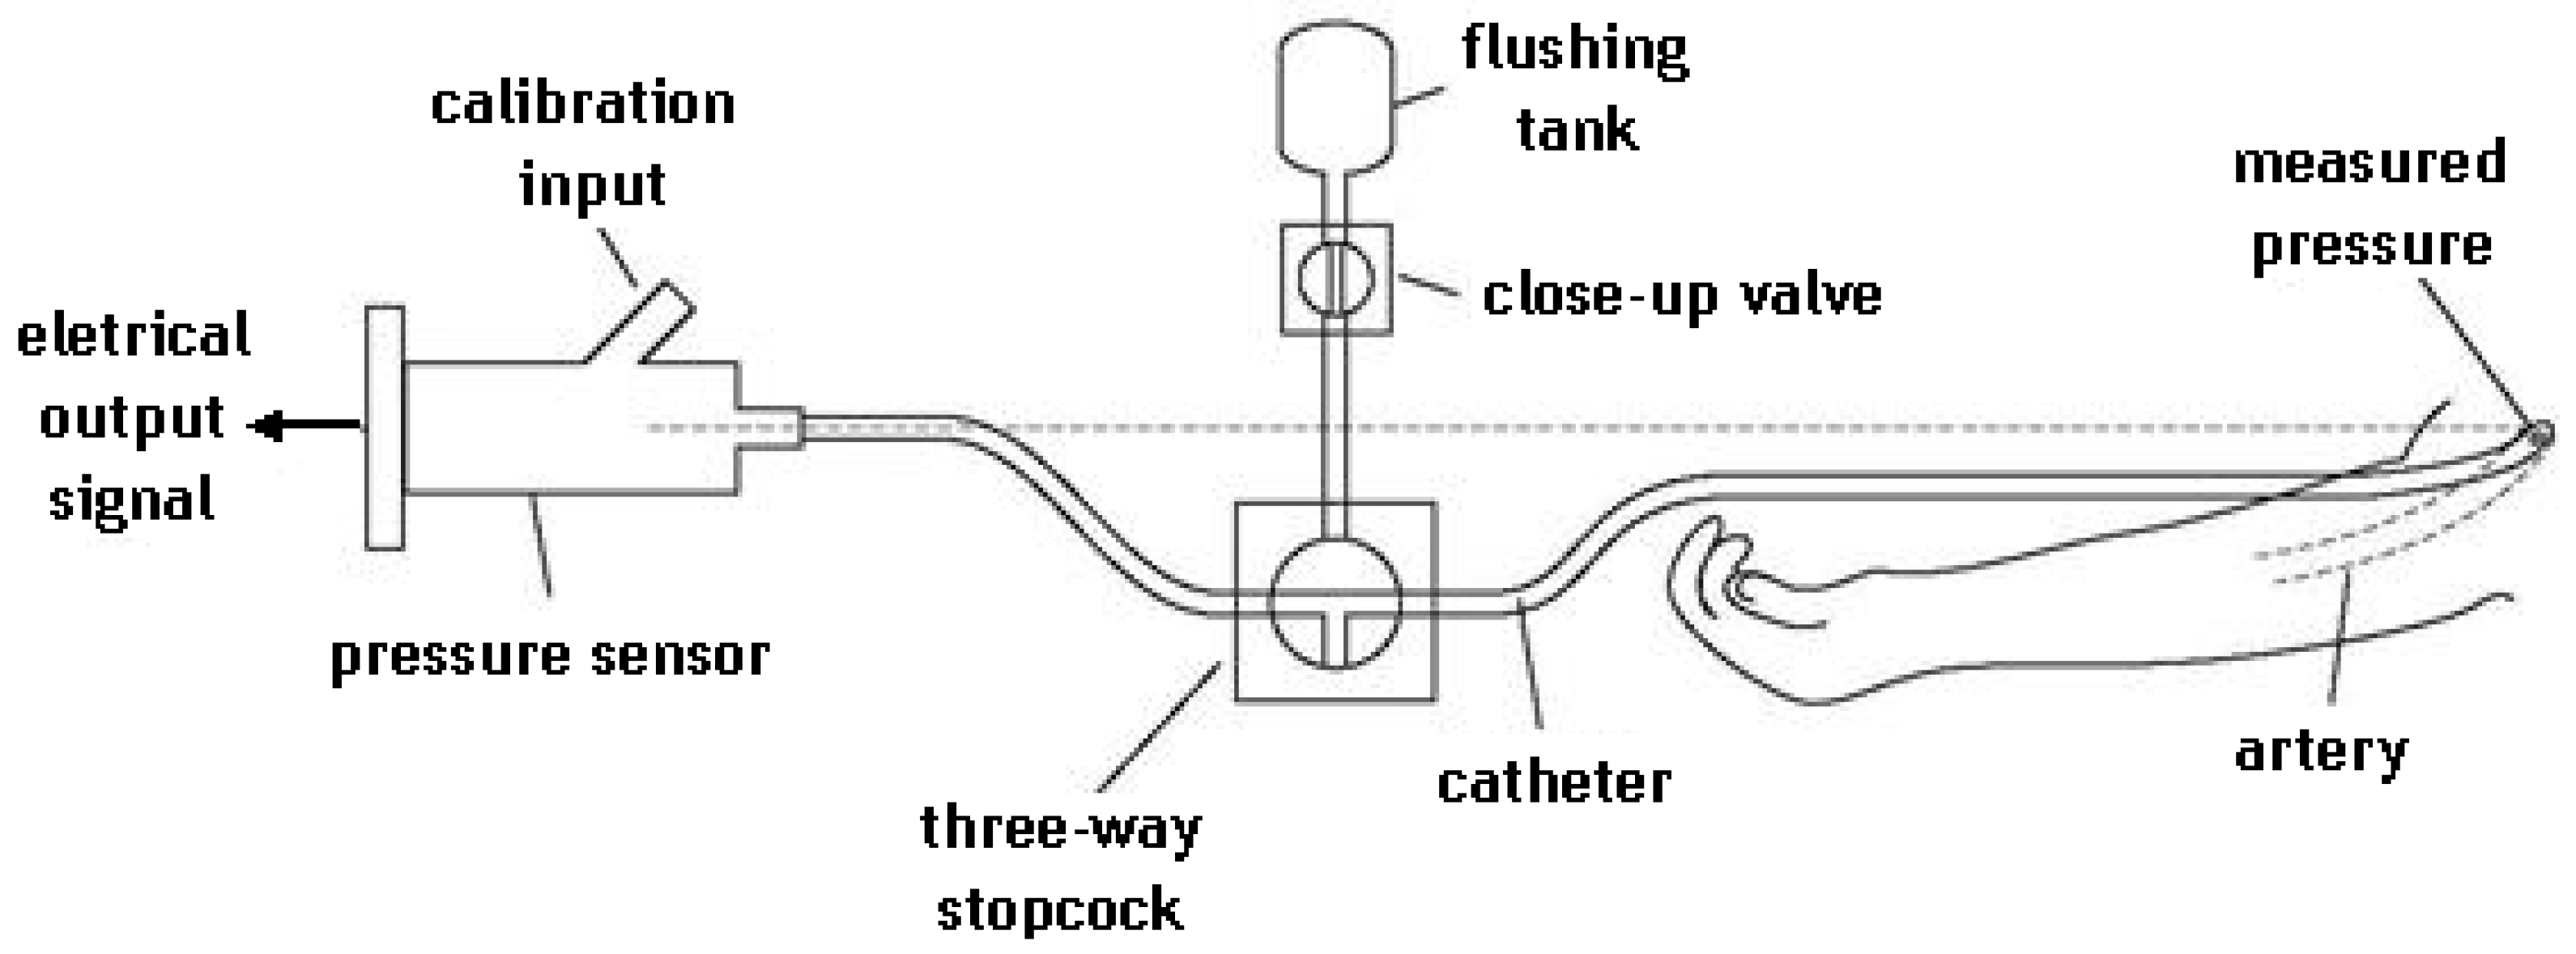
Distinct techniques and devices are available for measuring or estimating the central blood pressure waveform. These methods can be grouped under invasive and non-invasive ones and present distinct features, in terms of ease of use, for single measurement or continuous monitoring, and in the way the acquired data is processed. The invasive blood pressure measurement can use extravascular sensors (a fluid-filled catheter) or intravascular sensors (a micro-tip pressure catheter). In the fluid-filled catheter method, a cannula needle is inserted in an artery and a sterile fluid is used to connect the artery to the external pressure sensor, as seen in Figure 1. For the intravascular sensor, a micro-tip pressure catheter is inserted directly in the artery. When using fluid-filled catheter methods, as the blood pressure is transmitted to the sensor through the fluid, overdamping and underdamping can occur, affecting the accuracy of the results [4]. A typical practice is to catheterize the radial artery, since it is the one with least risk while assuring the patient’s comfort. In the cases where the radial artery is not a possibility, the femoral or brachial artery are catheterization alternatives. Lakhal et al. [5] report that the catheterization of the brachial artery is a safe short-term alternative to that of the radial artery, provided that hand perfusion is regularly assessed.
The choice of artery to use for an invasive method is not critical since the peripheral arterial blood pressure can adequately track central arterial blood pressure, as shown in the study conducted by Mignini et al. [7]. The advancement of technology encouraged the work on systems that provide remote monitoring to ensure that patients requiring long-term care can be supervised by their physician from any location. The use of invasive techniques poses particular requirements, since the patient is usually recommended to minimize movements and activities. Stupin et al. [8] developed a device providing invasive-type blood pressure remote monitoring. The device uses an implanted capacitive blood pressure sensor with wireless data transmission. This type of device improves the possibility of long-distance long-term care for patients with permanent or lengthy illnesses, but it is still in development. Although invasive approaches show a high rate of accuracy and are helpful in emergency room situations, their invasive nature may not be suitable for many patients. They require medical assistance to execute the catheterization procedure and have inherent risks. In the health domain, one of the main concerns is patient safety and comfort, in parallel with their health and recovery; therefore, non-invasive solutions might be considered.
Non-invasive blood pressure measurement methods are widely used due to their non-intrusive nature and ease of use. Within these methods, there are those that provide a discrete measurement of blood pressure parameters (systolic and diastolic pressure), such as the use of an inflatable cuff, and others that produce a continuous measurement of the blood pressure waveform, such as the arterial applanation tonometry or the volume clamp method.
The inflatable cuff method can be used in a manual mode, where the auscultatory method, based on listening to Korotkoff sounds, and the palpatory method, play an important role in determining the systolic and diastolic blood pressure. When the inflatable cuff is used in automated devices, the use of oscillometry, based on measuring the pressure oscillation that occurs when the cuff is deflated during the measurement procedure, allows the automatic identification of the systolic and diastolic pressure. Some of the devices can use the data from the brachial cuff to estimate the central blood pressure. While this approach is attractive, its accuracy is limited, leading to possible errors in the estimation of central blood pressure [9,10].
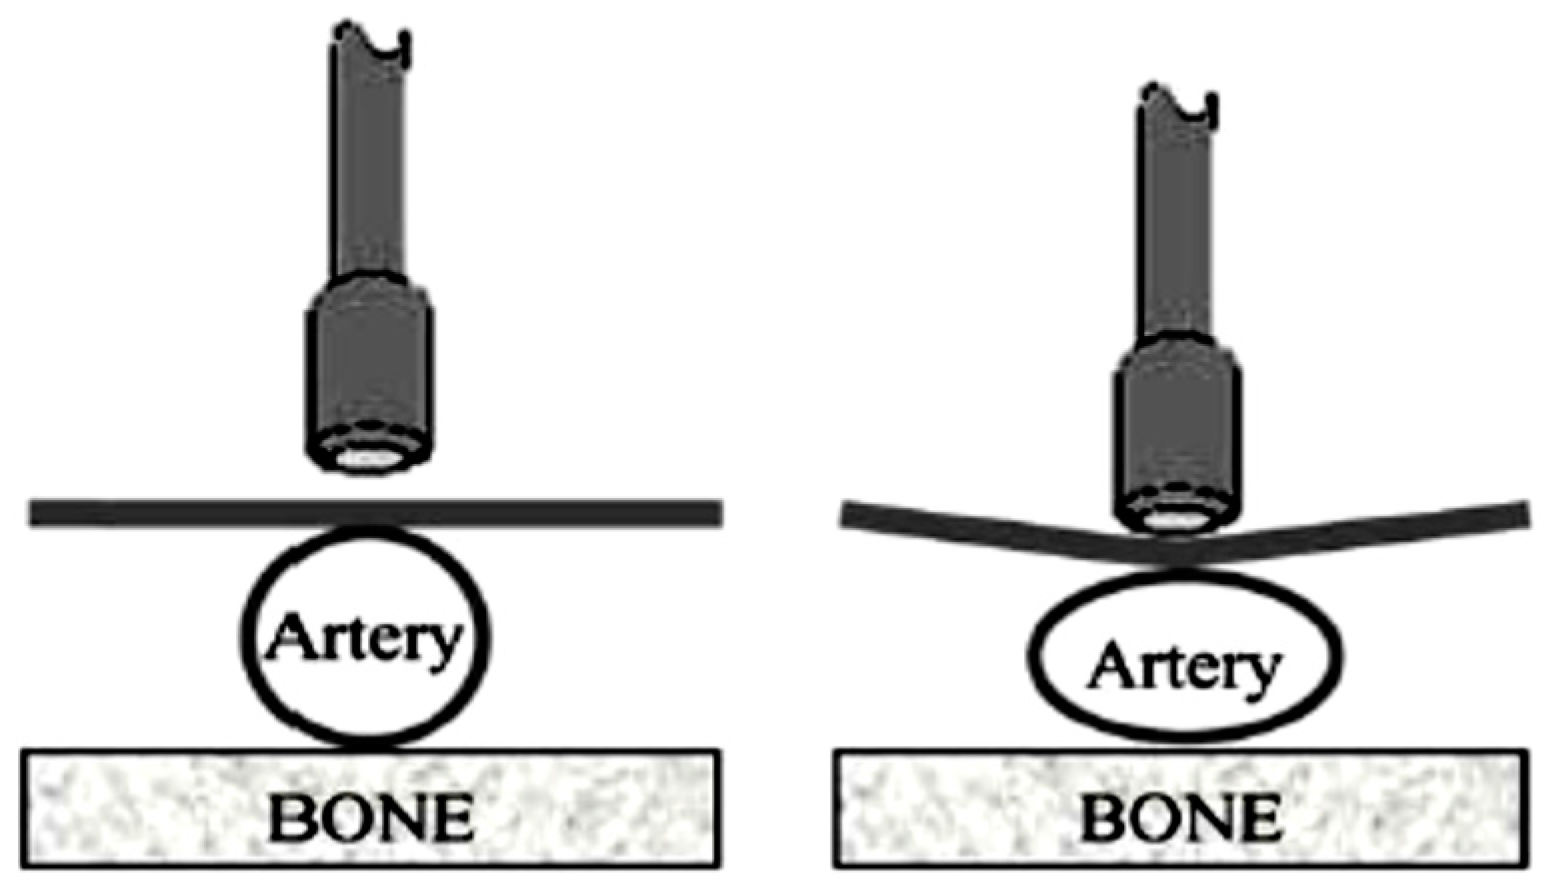
The arterial applanation tonometry allows for monitoring the blood pressure waveform, overcoming the limitation of the inflatable cuff method that can only measure discrete values of systolic and diastolic blood pressure. The applanation method is based on the application of a controlled force to the wall of a superficial artery using a force sensor that identifies the deformation of the artery imposed by the blood flow. This contact-based sensor, like the SphygmoCor or Complior, captures transducer-reading changes that occur when the tonometer probe is pressed against the artery (Figure 2 [11]). These tonometer systems allow for recording of the blood pressure waveform.
When conducting any measurement with these type of devices, any movement done by either the patient or the holder of the tonometer probe should be avoided since it could create noise, leading to less accurate blood pressure profiles. As the tonometer probe cannot provide absolute values of the systolic and diastolic pressures, when these values are required a calibration procedure has to also be performed. Typically, the mean arterial pressure and diastolic blood pressure values are used for calibration purposes. These values are obtained with a conventional method, such as the inflatable cuff at the brachial artery. These tonometer devices are also required to assess other characteristics related to blood flow, such as pulse wave velocity (PWV), pulse transit time (PTT) and arterial stiffness [12,13,14,15,16,17].
The volume clamp method uses photoplethysmography (PPG) to detect blood volume change within blood vessels over time [18]. This method is used with the finger clamp pulse oximeter. These type of devices can identify important physiological parameters such as peripheral oxygen saturation (SpO2), and heart and breathing rate. Several methods are available for estimating the blood pressure and recording the blood pressure waveform from the pulse oximeter. In conjunction with the electrocardiogram (ECG), it is also possible to assess the pulse transit time [19,20,21,22].
The blood pressure waveform, regardless of the location where obtained, at the carotid, femoral or brachial arteries or even at the finger, can provide important information on the cardiac system. The analysis of the waveform and other related parameters is being used to assess cardiac problems, such as hypertension, arterial stiffness or heart arrhythmia, and has been recognized as of great interest [23,24].
2. Development of Screening System
Since the emergence of the Internet of Healthcare Things (IoHT), some of the available medical systems have included communication features, which ultimately can provide the possibility to be connected to a network. With these features, it is possible to provide doctors and care takers with the option to assess and examine their patient’s condition. Further, these devices can be a source for generating a large anonymous set of medical data that can be useful for medical studies.
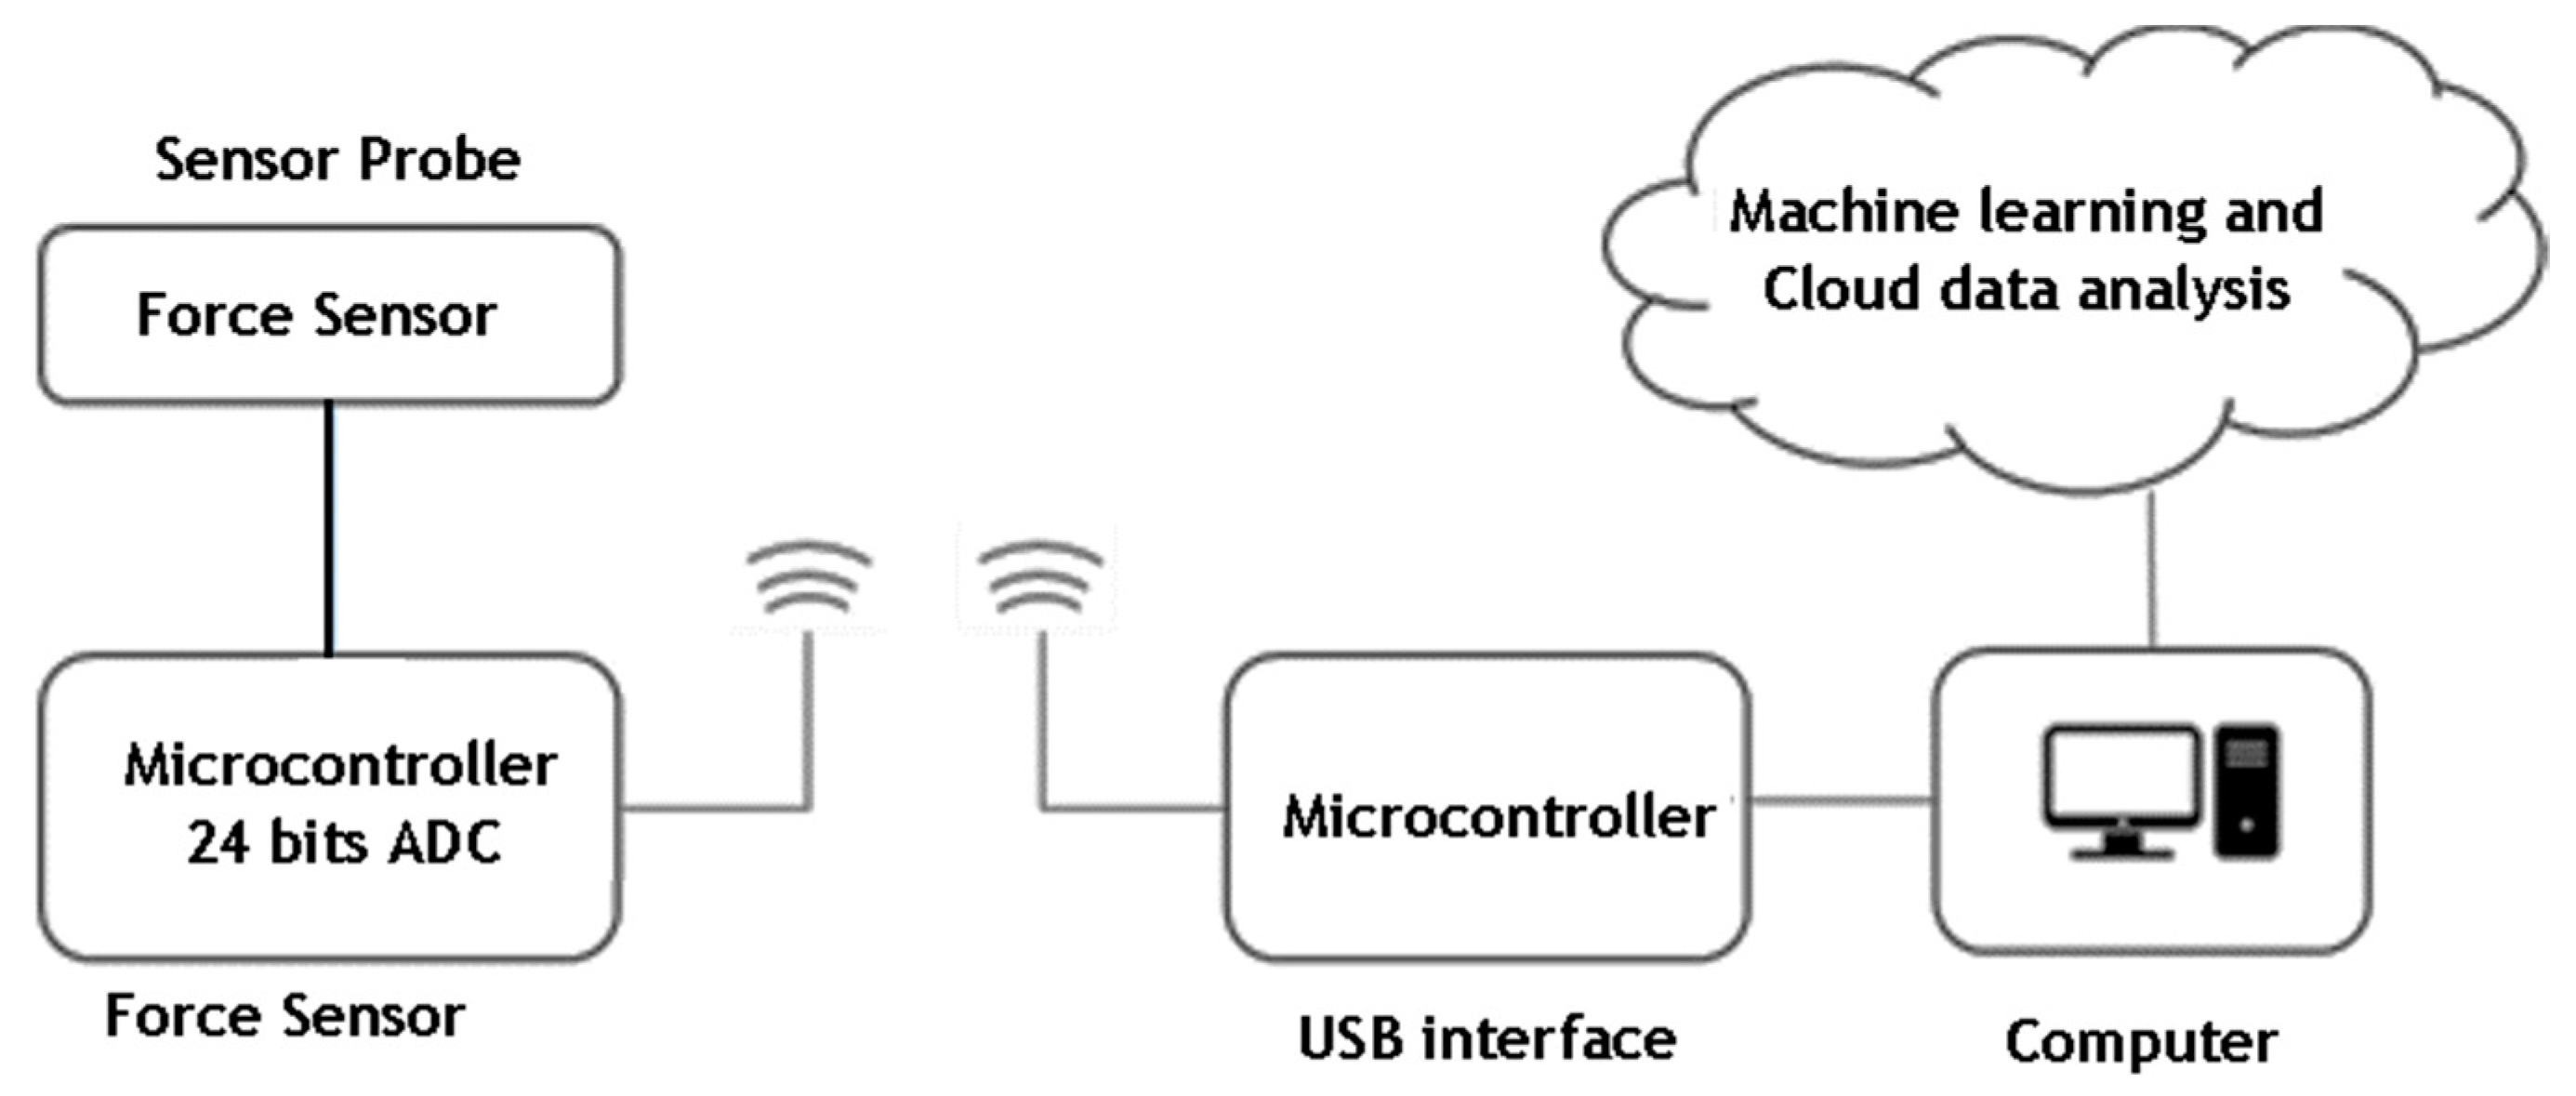
Therefore, a novel solution is suggested of a system for screening cardiac problems through non-invasive identification of the blood pressure waveform. The system, based on tonometry technology, provides short-term monitoring of the blood pressure waveform (Figure 3). The data collected from the patient is sent to a cloud platform, to be processed with machine-learning techniques and data analysis, and the result is returned to the person that conducted the exam. It is intended to be used as a screening tool for identification or prediction of potential cardiac health problems, such as identifying bisferiens and alternans cardiac pulses and not as a measuring device.
Preliminary testing with a force sensor revealed that the pulse waveform was discernible even with a handheld sensor and without advanced signal processing. Thus, a proof-of-concept device was produced using some commercially available components coupled with custom-developed electronic circuits. Figure 4 shows the sensor probe and the USB interface for wireless communication.
The developed device is based on a Honeywell force sensor with a measuring range of 0 to 15 N (FSG015WNPB) and an analogue digital converter (ADC) from Maxim Integrated (MAX11410). It allows waveform acquisition with real-time wireless transmission for data visualization and logging. The prototype consists of a force sensor, mounted into a plastic grip, connected to a signal conditioning and acquisition board, which communicates digitally with another board that houses a microcontroller and wireless module. A wireless receiver, connected to a computer, allows the waveform to be shown in a custom-developed application.
The chosen ADC is a 24-bit module that allows for interfacing with several fully differential or unipolar inputs, and includes a low-noise programmable gain amplifier (PGA) with up to 128× amplification and digital filters. It also contains two dedicated differential voltage reference inputs and uses serial peripheral interface (SPI)-based communication for interfacing with the host microcontroller.
In order to allow maximum development flexibility, a printed circuit board was designed around the chosen ADC module. The board allows for interfacing with up to two resistive force sensors or load cells, in quarter-bridge to full-bridge configuration, through two independent Wheatstone bridges. Each bridge output is connected both directly to the ADC and to an external amplification circuit. This was meant to allow testing, if necessary, of sensors with different sensitivities, as well as for the amplification of the ADC module. The independent amplification circuit is based on the Texas Instruments instrumentation amplifier, the INA326. This ADC board also contains a dedicated low-noise voltage regulator, for powering the ADC and the amplifier, as well as providing excitation voltages to the force sensor.
The main microcontroller board hosts a Microchip microcontroller, the dsPIC33EP256MC202, as well as a MiWi module from the same manufacturer, MRF24J40MA. The microcontroller handles all ADC initialization, configuration and issues sampling instructions. The returned samples are then transmitted through the wireless module.
On the computer side, a previously-built MiWi to USB transceiver was used to enable communication with the device. The accompanying application features a rolling chart with a representation of the sampled waveform, with vertical limits corresponding the data extremes within the last few seconds of sampling. This is intended to help the operator control the applied force and position the probe, by allowing to verify whether or not a pulse waveform is discernible. When a session is concluded, the waveform data is stored in a CSV file for future analysis.
For the current implementation, the sensor was connected directly to the ADC module, with the internal PGA gain set to 128×. The acquisition was configured for continuous acquisition, with a fourth-order SINC digital filter configured with a first notch frequency of 240 Hz, enabling 240 Hz of continuous acquisition.
The sensor presents a typical sensitivity of 2.4 mV/N/V (system excitation voltage), according to manufacturer data. As an excitation voltage of 3.3 V and 128× amplification were used, the sensitivity of this force measuring system should be, approximately, 1.014 V/N. Considering the 24-bit resolution of the ADC, this means the system exhibits a maximum force measurement resolution of N. However, according to the ADC manufacturer, for the chosen combination of gain, filter and data rate, the noise free resolution should be 14 bits, which results in a force measurement resolution of 61 µN. Due to ADC saturation, the maximum measurement range is 0 to 3.25 N. Initial tests with this sensor probe showed its feasibility, having been built a system to test it [25].
This setup was tested by several lab members, none of which having any medical training, by pressing the sensor probe to the carotid artery. An example of the obtained results is shown in Figure 5.
As can be seen in Figure 5, most waveforms resemble the nominal pulse waveform expected from a healthy subject. The variations in the measurement baseline are to be expected, as the probe was placed manually and there were occasional shifts in positioning. Still, this should not present an issue for waveform shape analysis. As the amplitude is approximately constant, the baseline can be corrected through software and outliers discarded. These results also confirm that the achieved resolution, sampling rate and force range are adequate for the proposed system.
As range is limited by the signal conditioning, one improvement that can be done in the future is the replacement of the force sensor with another from the same series, but with a measuring range of 0 to 5 N. As it exhibits three times the sensitivity, it would require lower amplification to achieve the same result, effectively enabling the acquisition of higher resolution waveforms at a higher frequency.
3. Discussion
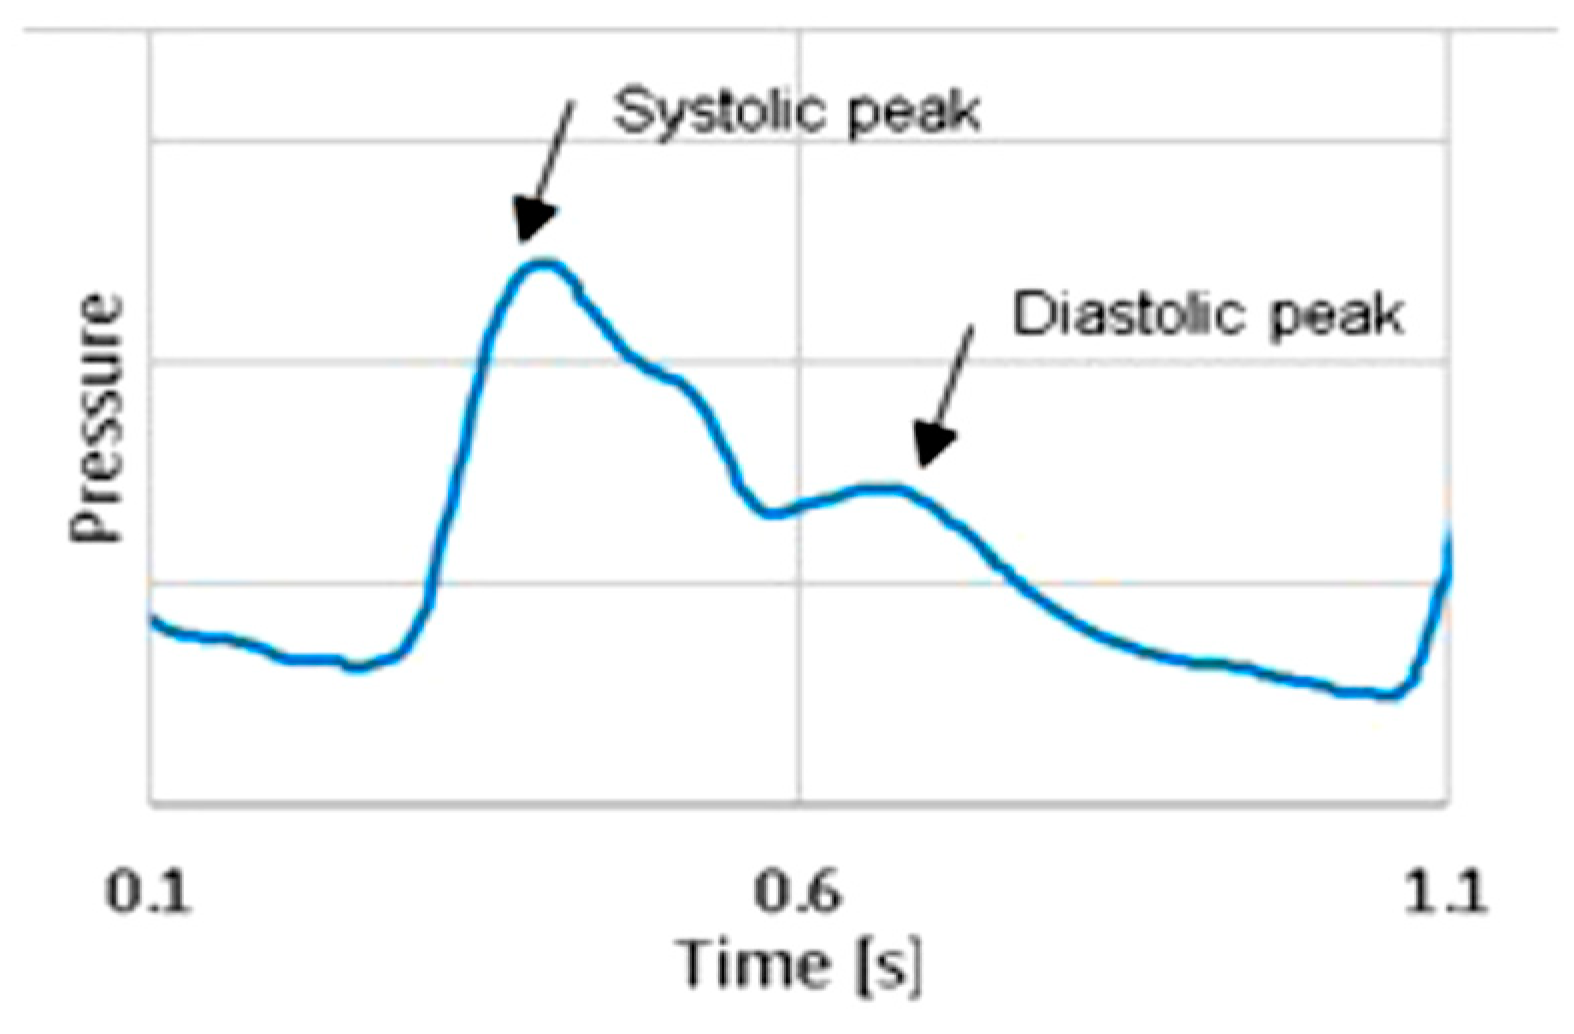
The described system, developed to identify the blood pressure waveform, has the typical drawbacks of the tonometer systems. Changes in relative position of the sensor probe and the exerted force are responsible for different levels of values acquired during the 20 s test, as seen in Figure 5. Nevertheless, with that data it is possible to identify the blood pressure waveform and the heart beat rate. Figure 6 presents one pulse, extracted from the acquired data on a healthy individual. The systolic and the diastolic peaks are clearly identified and a typical waveform of blood pressure at the carotid is observed. Future developments will explore other methods to place the probe that can overcome some of these limitations. A validation study of the developed tonometer probe using an invasive method has not yet been conducted, as the current version of the probe is not adequate to pass the criteria of system admission in a cardiac catheterization room. Regarding the data analysis of the acquired blood pressure waveform, initial studies carried out involved the detection of abnormalities in the waveform using machine-learning techniques [25]. The obtained results showed the feasibility of using the system for screening purposes in identifying bisferiens and alternans cardiac pulses.
4. Conclusions
The paper presents commonly-used methods to assess blood pressure waveform and presents results from a system under development. The proposed system uses a tonometer sensor probe, with an architecture designed for data cloud processing and analysis. Since our goal is to address the blood pressure waveform, our method refers to the shape of the signal rather than its absolute values, having it in mind to be used as a screening tool for detecting cardiac problems.
Author Contributions
Conceptualization, supervision, review and editing is contributed by P.A. and M.T.R.; Investigation and writing—original draft preparation is contributed by P.A. and F.C. All authors have read and agreed to the published version of the manuscript.
Funding
This research was funded by of Project NORTE-01-0145-FEDER-000022—SciTech—Science and Technology for Competitive and Sustainable Industries, co-financed by Programa Operacional Regional do Norte (NORTE2020), through Fundo Europeu de Desenvolvimento Regional (FEDER). This work was also funded by Project LAETA—UID/EMS/50022/2013.
Acknowledgments
The authors acknowledge the contribution of the past researcher involved in this work, Daniel Badran.
Conflicts of Interest
The authors declare no conflicts of interest.
References
- Ochoa, A.; Patarroyo-Aponte, G.; Rahman, M. The Role of Central Blood Pressure Monitoring in the Management of Hypertension. Curr. Cardiol. Rep. 2018, 20, 41. [Google Scholar] [CrossRef] [PubMed]
- Jekell, A.; Kahan, T. The usefulness of a single arm cuff oscillometric method (Arteriograph) to assess changes in central aortic blood pressure and arterial stiffness by antihypertensive treatment: Results from the Doxazosin-Ramipril Study. Blood Press. 2018, 27, 88–98. [Google Scholar] [CrossRef] [PubMed] [Green Version]
- Sasaki-Nakashima, R.; Kino, T.; Chen, L.; Doi, H.; Minegishi, S.; Abe, K.; Sugano, T.; Taguri, M.; Ishigami, T. Successful prediction of cardiovascular risk by new non-invasive vascular indexes using suprasystolic cuff oscillometric waveform analysis. J. Cardiol. 2017, 69, 30–37. [Google Scholar] [CrossRef] [PubMed] [Green Version]
- Romagnoli, S.; Ricci, Z.; Quattrone, D.; Tofani, L.; Tujjar, O.; Villa, G.; Romano, S.M.; De Gaudio, A.R. Accuracy of invasive arterial pressure monitoring in cardiovascular patients: An observational study. Crit. Care 2014, 18, 644. [Google Scholar] [CrossRef] [PubMed] [Green Version]
- Lakhal, K.; Robert-Edan, V. Invasive monitoring of blood pressure: A radiant future for brachial artery as an alternative to radial artery catheterisation? J. Thorac. Dis. 2017, 9, 4812–4816. [Google Scholar] [CrossRef]
- Jobbágy, A.; Varga, S. Biomedical Instrumentation; Typotex Kft: Budapest, Hungary, 2013; ISBN 13 978-963-2791-73-9. [Google Scholar]
- Mignini, M.A.; Piacentini, E.; Dubin, A. Peripheral arterial blood pressure monitoring adequately tracks central arterial blood pressure in critically ill patients: An observational study. Crit. Care 2006, 10, R43. [Google Scholar] [CrossRef] [Green Version]
- Stupin, V.A.; Silina, E.V.; Oganov, R.G.; Bogdanov, Y.A.; Shusharina, N.N. Development of an invasive device for long-term remote monitoring of cardiovascular system parameters, including blood pressure, in patients with comorbid conditions. Biosci. Biotechnol. Res. Asia 2015, 12, 1255–1263. [Google Scholar] [CrossRef]
- Sharman, J.E.; Avolio, A.P.; Baulmann, J.; Benetos, A.; Blacher, J.; Blizzard, C.L.; Cruickshank, J.K. Validation of non-invasive central blood pressure devices: Artery society task force (abridged) consensus statement on protocol standardization. Artery Res. 2017, 20, 35–43. [Google Scholar] [CrossRef]
- Pessana, F.M.; Lev, G.; Mirada, M.; Ramirez, A.J.; Mendiz, O.; Fischer, E.I.C. Central Blood Pressure Waves Assessment: A Validation Study of Non-Invasive Aortic Pressure Measurement in Human Beings. In Proceedings of the 2019 Global Medical Engineering Physics Exchanges/Pan American Health Care Exchanges (GMEPE/PAHCE), Buenos Aires, Argentina, 26–31 March 2019; pp. 1–4. [Google Scholar] [CrossRef]
- Papaioannou, T.G.; Protogerou, A.D.; Stamatelopoulos, K.S.; Vavuranakis, M.; Stefanadis, C. Non-Invasive Methods and Techniques for Central Blood Pressure Estimation: Procedures Validation, Reproducibility and Limitations. Curr. Pharm. Des. 2009, 15, 245–253. [Google Scholar] [CrossRef] [PubMed]
- Salvi, P.; Lio, G.; Labat, C.; Ricci, E.; Pannier, B.; Benetos, A. Validation of a new non-invasive portable tonometer for determining arterial pressure wave and pulse wave velocity: The PulsePen device. J. Hypertens. 2004, 22, 2285–2293. [Google Scholar] [CrossRef] [PubMed] [Green Version]
- Peter, L.; Noury, N.; Cerny, M. A review of methods for non-invasive and continuous blood pressure monitoring: Pulse transit time method is promising? Irbm 2014, 35, 271–282. [Google Scholar] [CrossRef]
- Segers, P.; O’Rourke, M.F.; Parker, K.; Westerhof, N.; Hughes, A. Towards a consensus on the understanding and analysis of the pulse waveform: Results from the 2016 Workshop on Arterial Hemodynamics: Past, present and future. Artery Res. 2017, 18, 75–80. [Google Scholar] [CrossRef] [PubMed] [Green Version]
- Kaur, H.; Bhutto, J.K.; Choudhary, B.S. Methods for Continuous Non-invasive Measurement of Blood Pressure: Pulse Transit Time a Review. Asian J. Pharm. 2018, 12, S863–S872. [Google Scholar] [CrossRef]
- Supiano, M.A.; Lovato, L.; Ambrosius, W.T.; Bates, J.; Beddhu, S.; Drawz, P.; Lustigova, E. Pulse wave velocity and central aortic pressure in systolic blood pressure intervention trial participants. PLoS ONE 2018, 13. [Google Scholar] [CrossRef] [PubMed]
- Thambiraj, G.; Gandhi, U.; Devanand, V.; Mangalanathan, U. Noninvasive cuffless blood pressure estimation using pulse transit time, Womersley number, and photoplethysmogram intensity ratio. Physiol. Meas. 2019, 40. [Google Scholar] [CrossRef] [PubMed]
- Alian, A.A.; Shelley, K.H. Photoplethysmography. Best Pract. Res. Clin. Anaesthesiol. 2014, 28, 395–406. [Google Scholar] [CrossRef] [PubMed]
- Agro, D.; Canicatti, R.; Tomasino, A.; Giordano, A.; Adamo, G.; Parisi, A.; Pernice, R.; Stivala, S.; Giaconia, C.; Busacca, A.C.; et al. PPG Embedded System for Blood Pressure Monitoring. In Proceedings of the 2014 AEIT Annual Conference–From Research to Industry: The Need for a More Effective Technology Transfer (AEIT), Trieste, Italy, 18–19 September 2014; pp. 1–6. [Google Scholar] [CrossRef]
- Kumar, S.; Ayub, S. Estimation of Blood Pressure by Using Electrocardiogram (ECG) and Photo-plethysmogram (PPG). In Proceedings of the 2015 Fifth International Conference on Communication Systems and Network Technologies (Csnt2015), Gwalior, India, 4–6 April 2015; pp. 521–524. [Google Scholar] [CrossRef]
- Rundo, F.; Conoci, S.; Ortis, A.; Battiato, S. An Advanced Bio-Inspired PhotoPlethysmoGraphy (PPG) and ECG Pattern Recognition System for Medical Assessment. Sensors 2018, 18, 405. [Google Scholar] [CrossRef] [PubMed] [Green Version]
- Wang, G.X.; Atef, M.; Lian, Y. Towards a Continuous Non-Invasive Cuffless Blood Pressure Monitoring System Using PPG: Systems and Circuits Review. IEEE Circuits Syst. Mag. 2018, 18, 6–26. [Google Scholar] [CrossRef]
- Townsend, R.R.; Rosendorff, C.; Nichols, W.W.; Edwards, D.G.; Chirinos, J.A.; Fernhall, B.; Cushman, W.C. American Society of Hypertension position paper: Central blood pressure waveforms in health and disease. J. Am. Soc. Hypertens. 2016, 10, 22–33. [Google Scholar] [CrossRef] [PubMed]
- Nogueira, D.; Tavares, R.; Abreu, P.; Restivo, M.T. Demonstration: Online Detection of Abnormalities in Blood Pressure Waveform: Bisfiriens and Alternans Pulse. In Smart Industry & Smart Education 2019; Springer: Berlin/Heidelberg, Germany, 2019; Volume 47, pp. 536–545. ISBN 978-3-319-95678-7. [Google Scholar]
- Carneiro, F.; Abreu, P.; Restivo, M.T. Hysteresis Compensation in a Tactile Device for Arterial Pulse Reproduction. Sensors 2018, 18, 1631. [Google Scholar] [CrossRef] [PubMed] [Green Version]
Figure 1.
Invasive blood pressure measurement with a fluid-filled catheter [6].
Figure 1.
Invasive blood pressure measurement with a fluid-filled catheter [6].

Figure 2.
Schematic of using a tonometer probe [11].
Figure 2.
Schematic of using a tonometer probe [11].

Figure 3.
System architecture.

Figure 4.
Sensor probe (a) with electronics and USB interface (b) for wireless communication.

Figure 5.
Pressure waveform (a) measured with sensor probe (b) on the carotid artery.

Figure 6.
Pressure waveform during one heartbeat.

© 2020 by the authors. Licensee MDPI, Basel, Switzerland. This article is an open access article distributed under the terms and conditions of the Creative Commons Attribution (CC BY) license (http://creativecommons.org/licenses/by/4.0/).
Share and Cite
MDPI and ACS Style
Abreu, P.; Carneiro, F.; Restivo, M.T. Screening System for Cardiac Problems through Non-Invasive Identification of Blood Pressure Waveform. Information 2020, 11, 150. https://0-doi-org.brum.beds.ac.uk/10.3390/info11030150
AMA Style
Abreu P, Carneiro F, Restivo MT. Screening System for Cardiac Problems through Non-Invasive Identification of Blood Pressure Waveform. Information. 2020; 11(3):150. https://0-doi-org.brum.beds.ac.uk/10.3390/info11030150
Chicago/Turabian StyleAbreu, Paulo, Fernando Carneiro, and Maria Teresa Restivo. 2020. "Screening System for Cardiac Problems through Non-Invasive Identification of Blood Pressure Waveform" Information 11, no. 3: 150. https://0-doi-org.brum.beds.ac.uk/10.3390/info11030150
Note that from the first issue of 2016, this journal uses article numbers instead of page numbers. See further details here.