Ensemble Deep Learning Models for Heart Disease Classification: A Case Study from Mexico

 ,
,  , and
, and 
Abstract
:1. Introduction
2. Related Work
3. Preliminaries
3.1. Unidirectional Neural Network
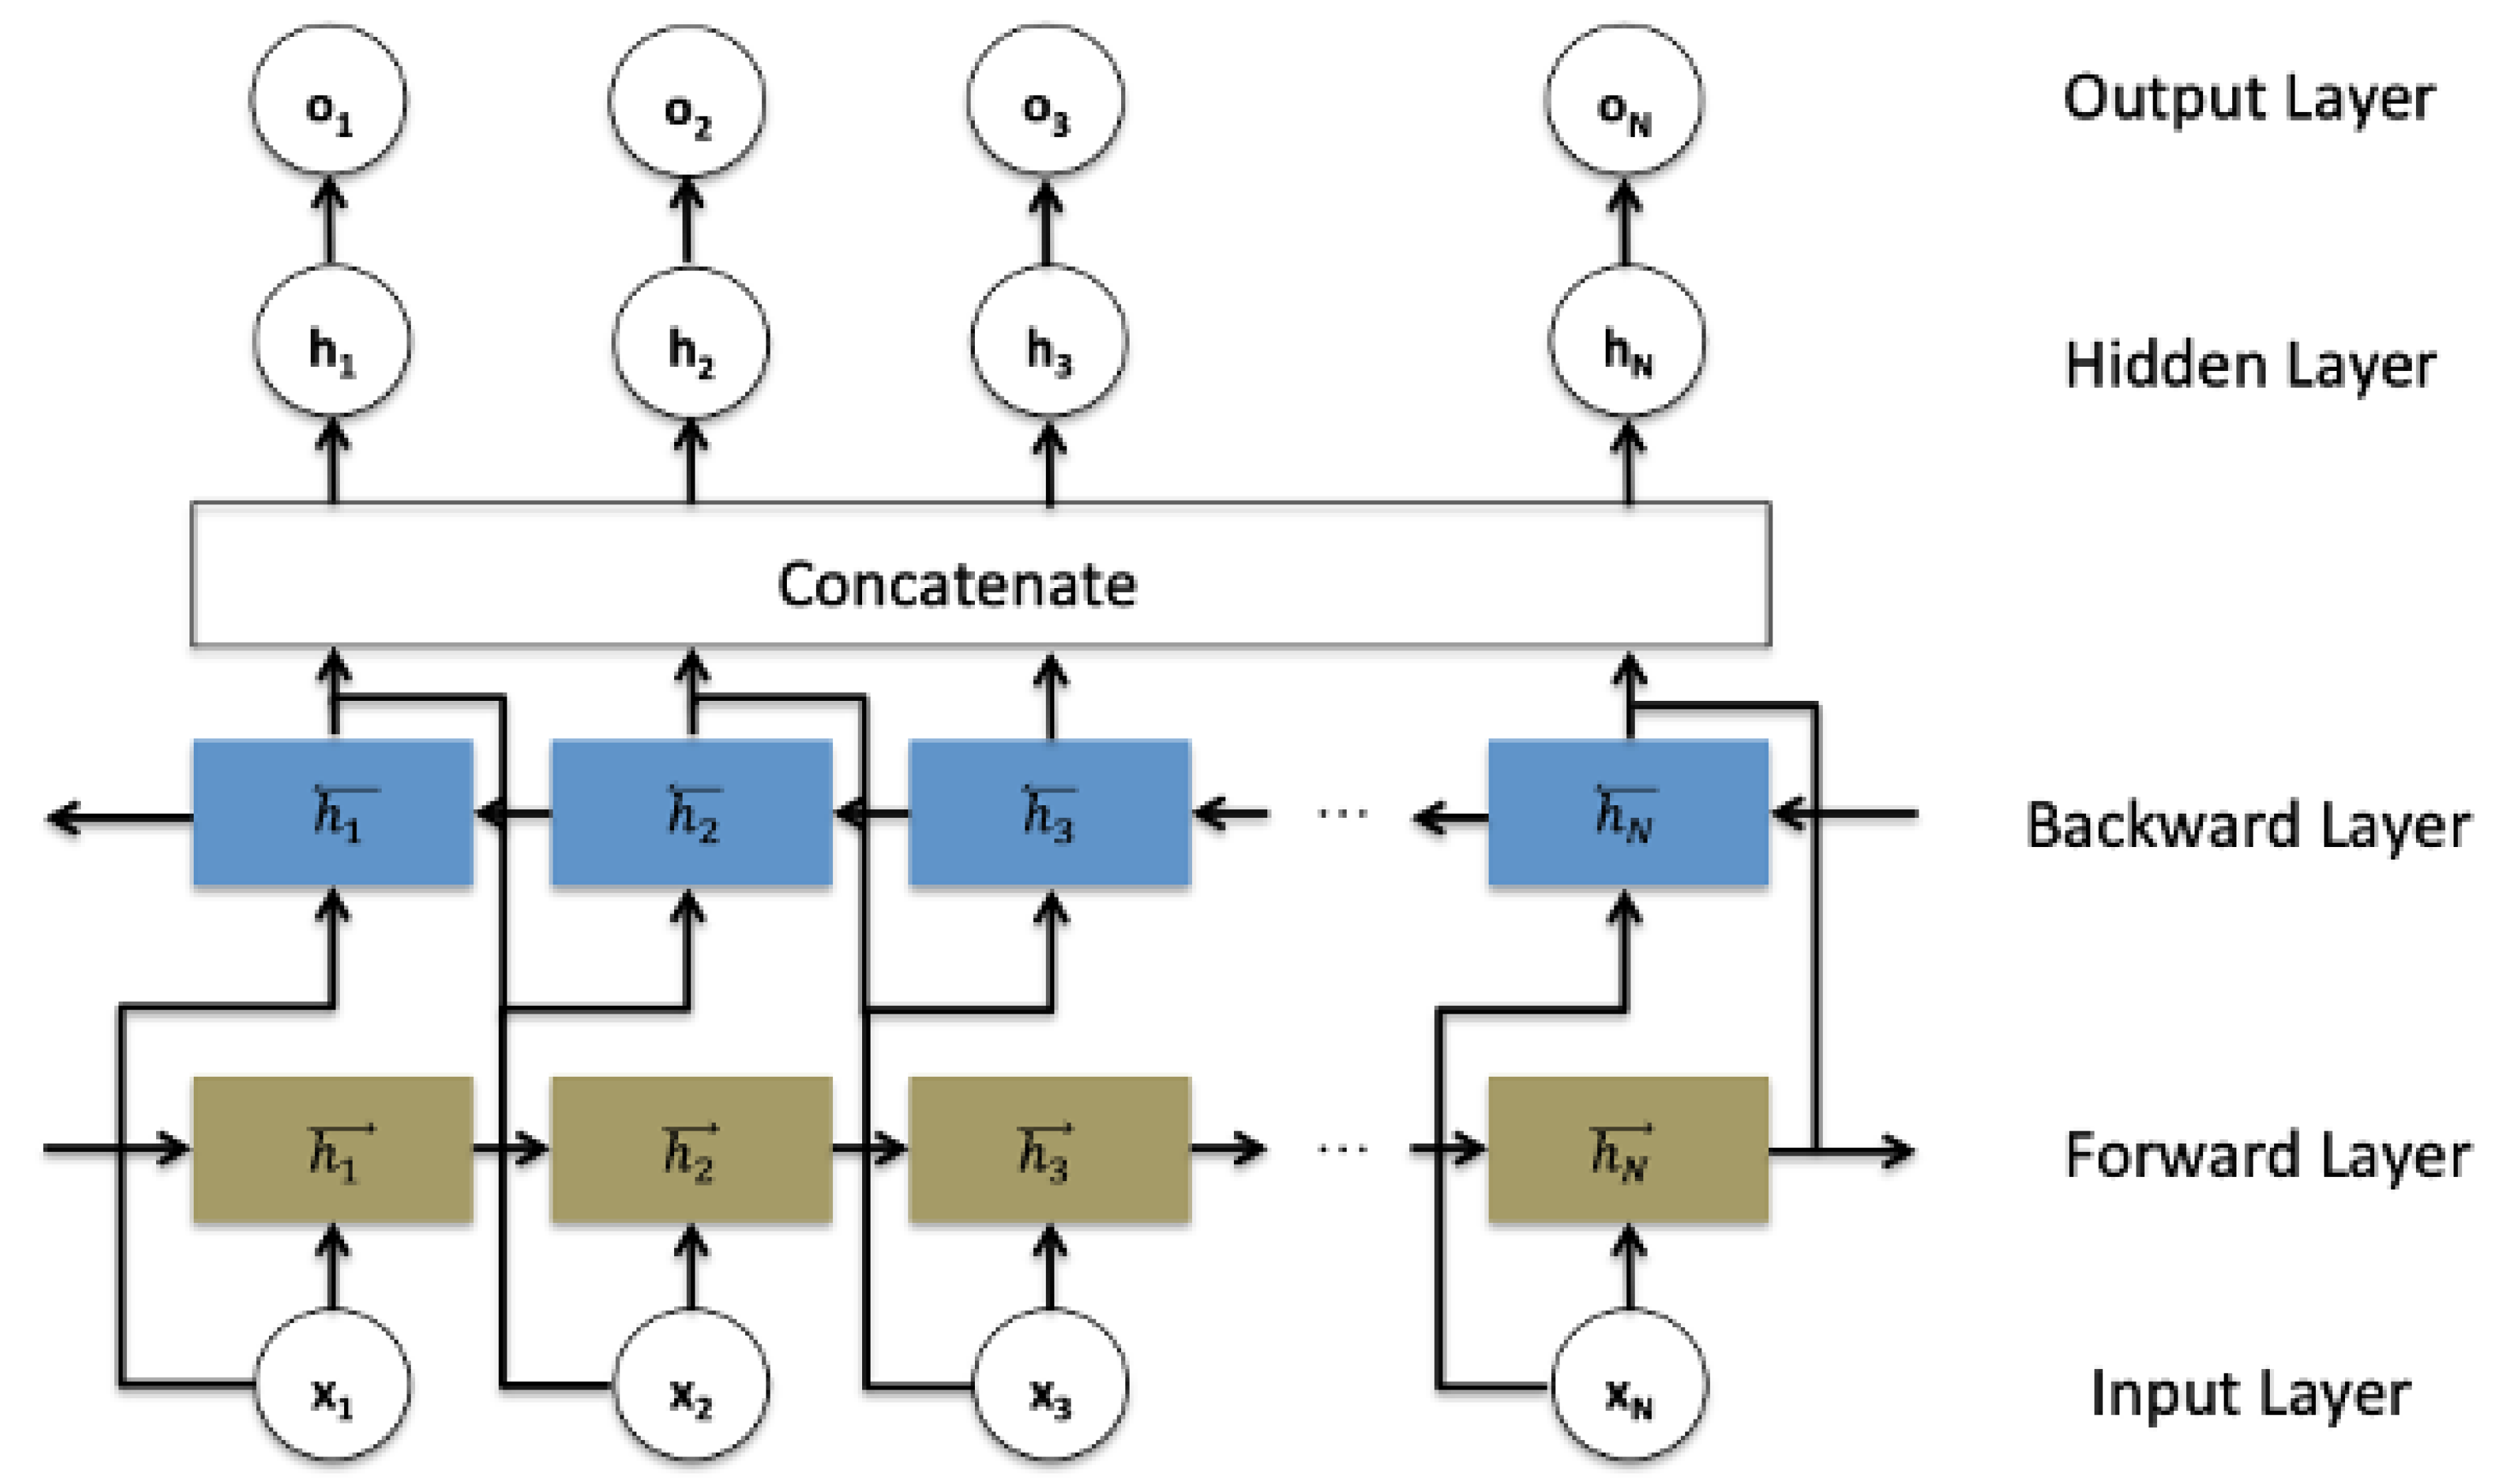
3.2. Bidirectional Recurrent Neural Network
3.3. Data Balancing Methods
3.4. Features Selection Methods
3.4.1. Model-Based Selection Method
3.4.2. Recursive Feature Elimination Method
4. Methodology
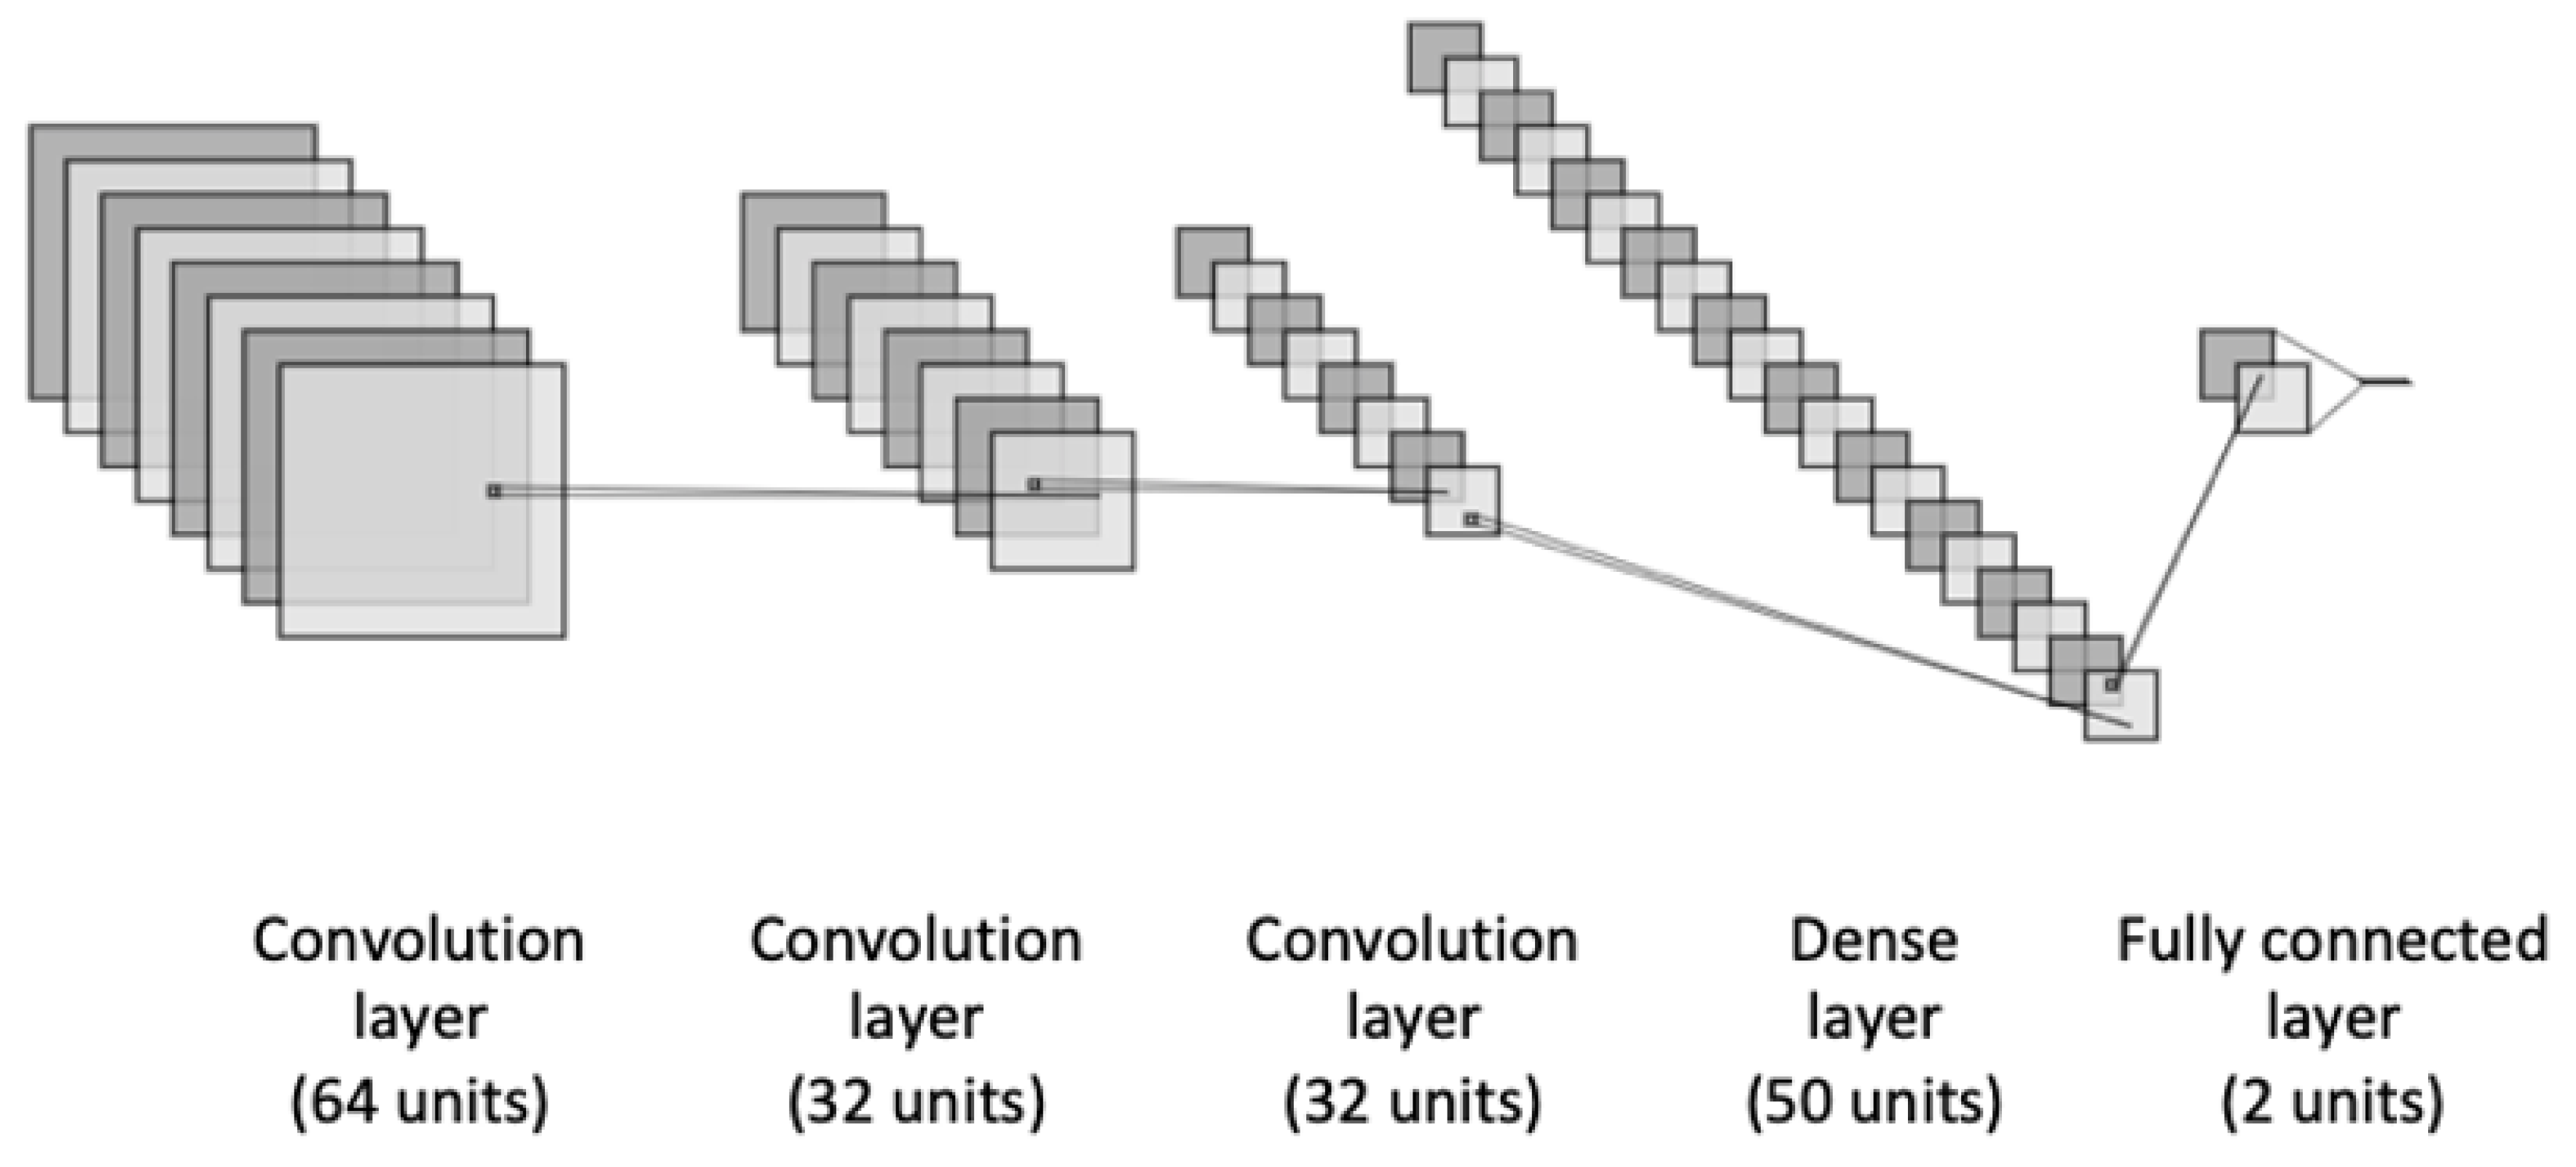
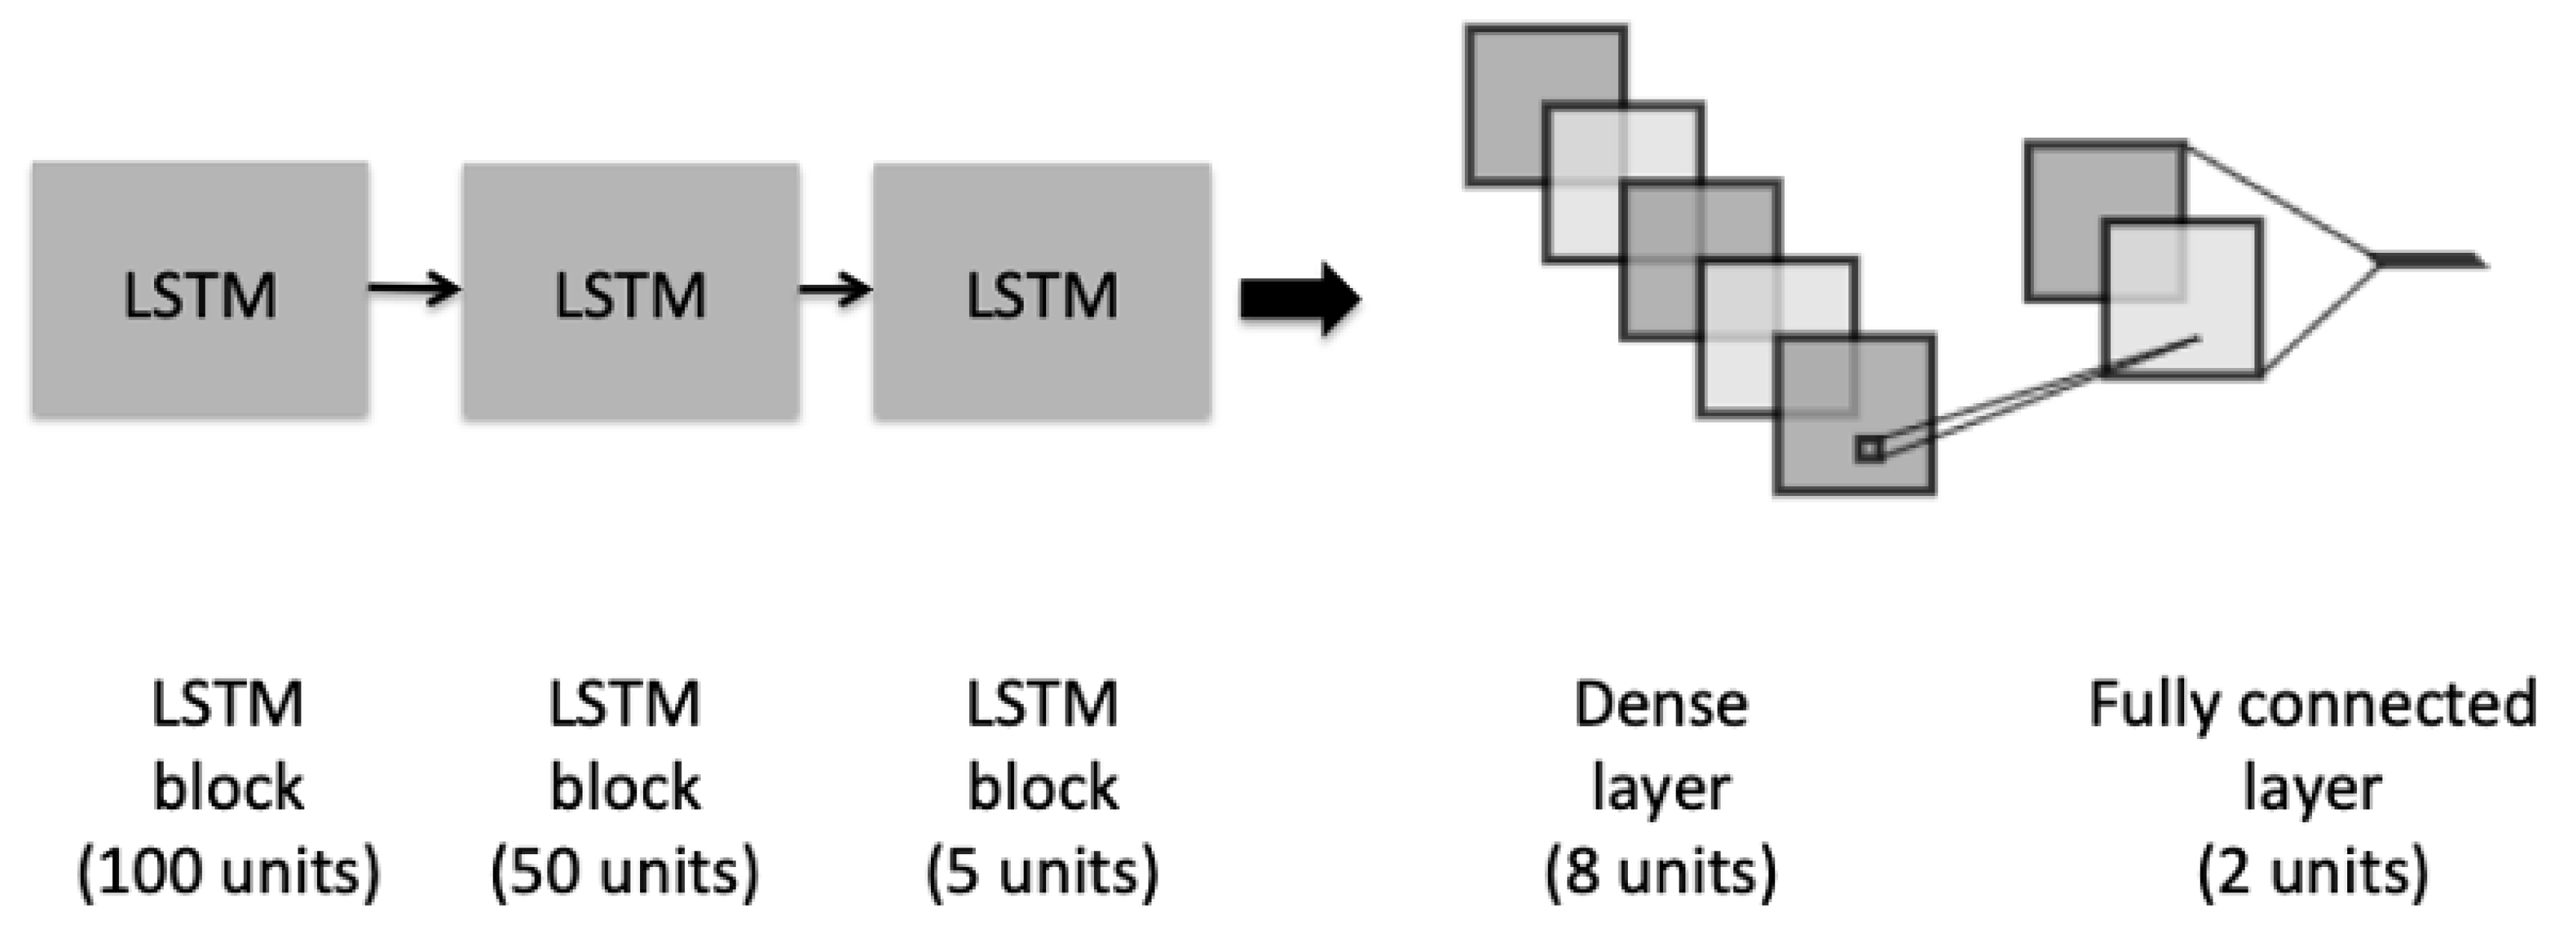
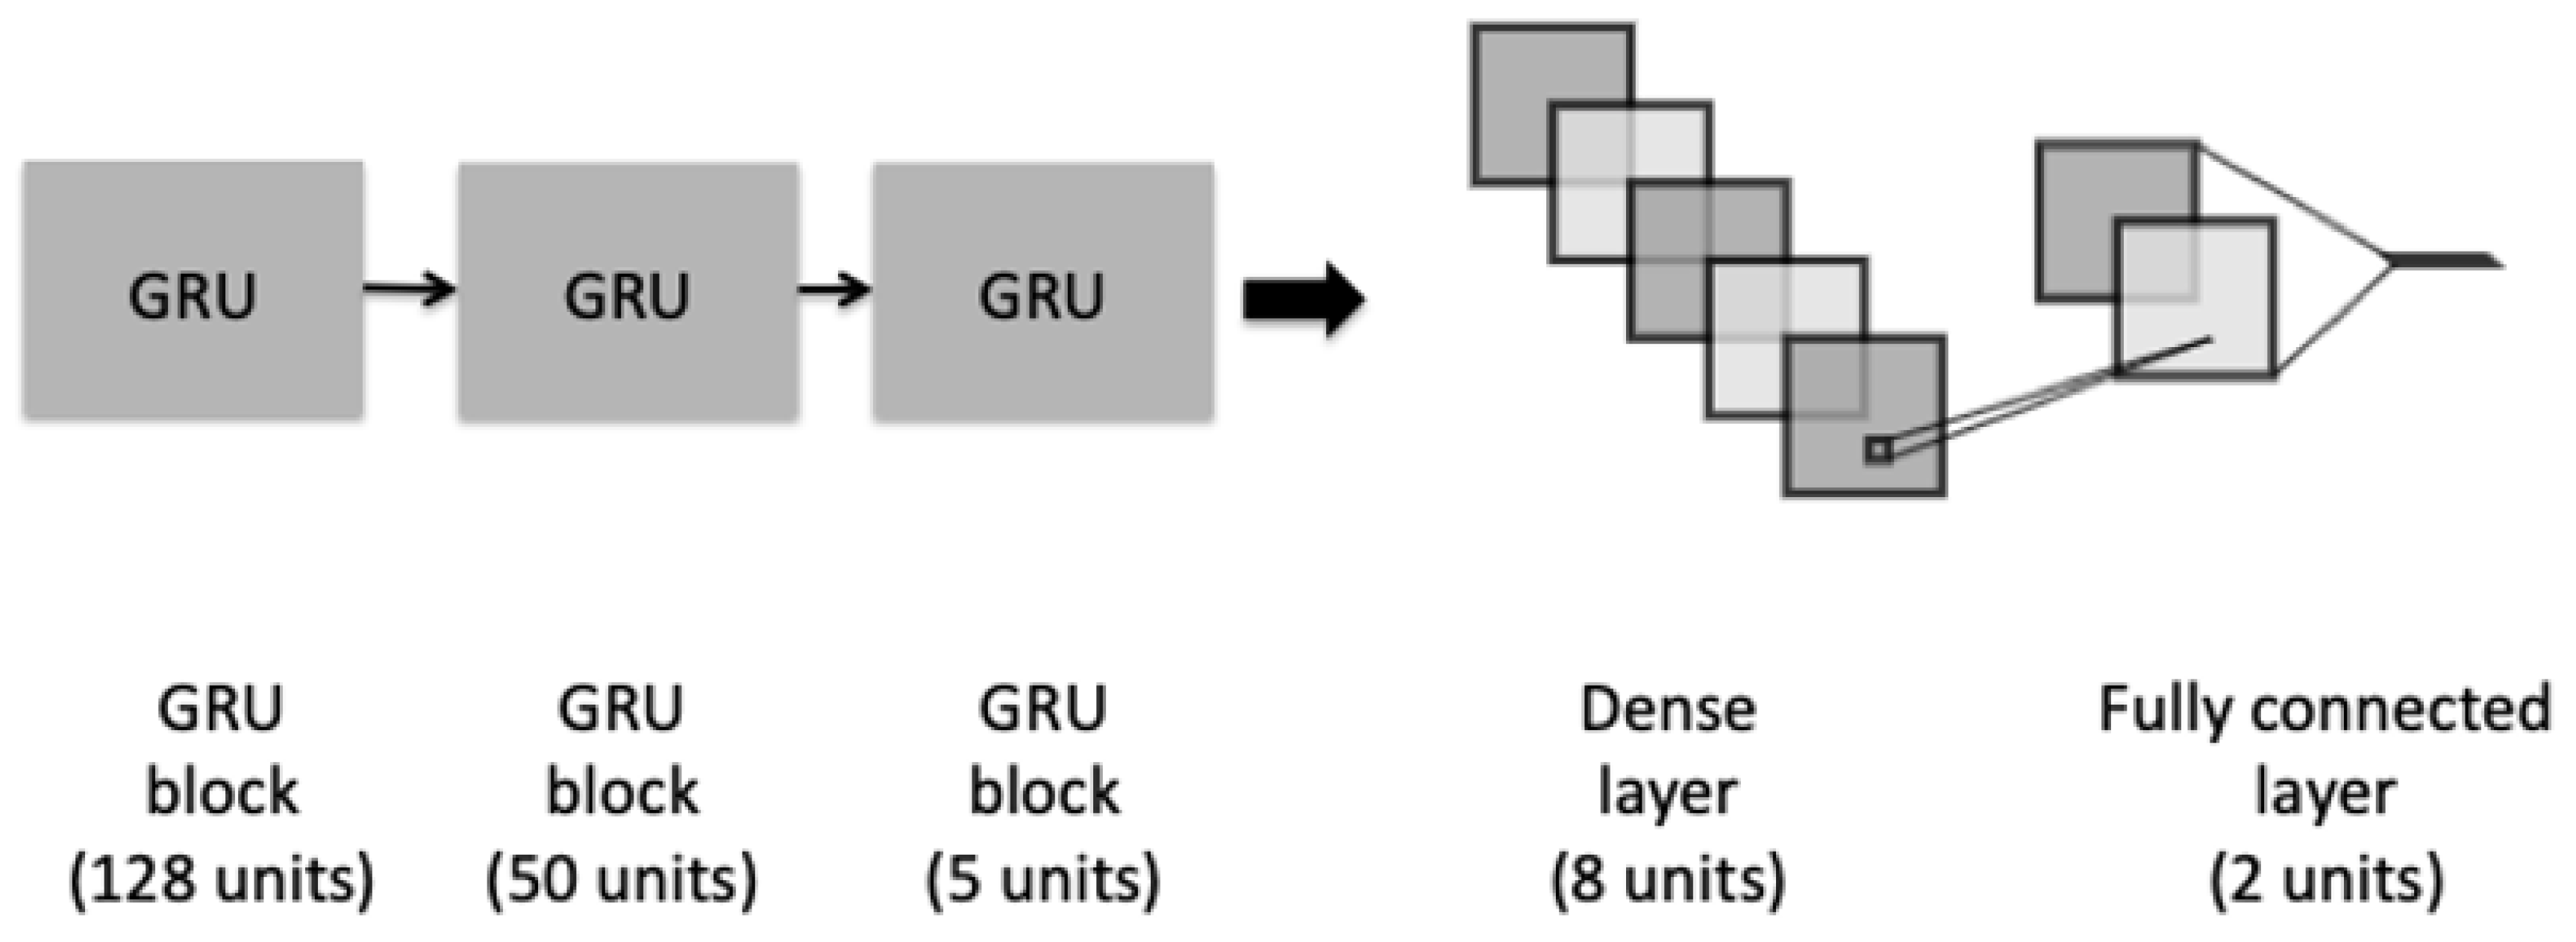
4.1. Classification Models
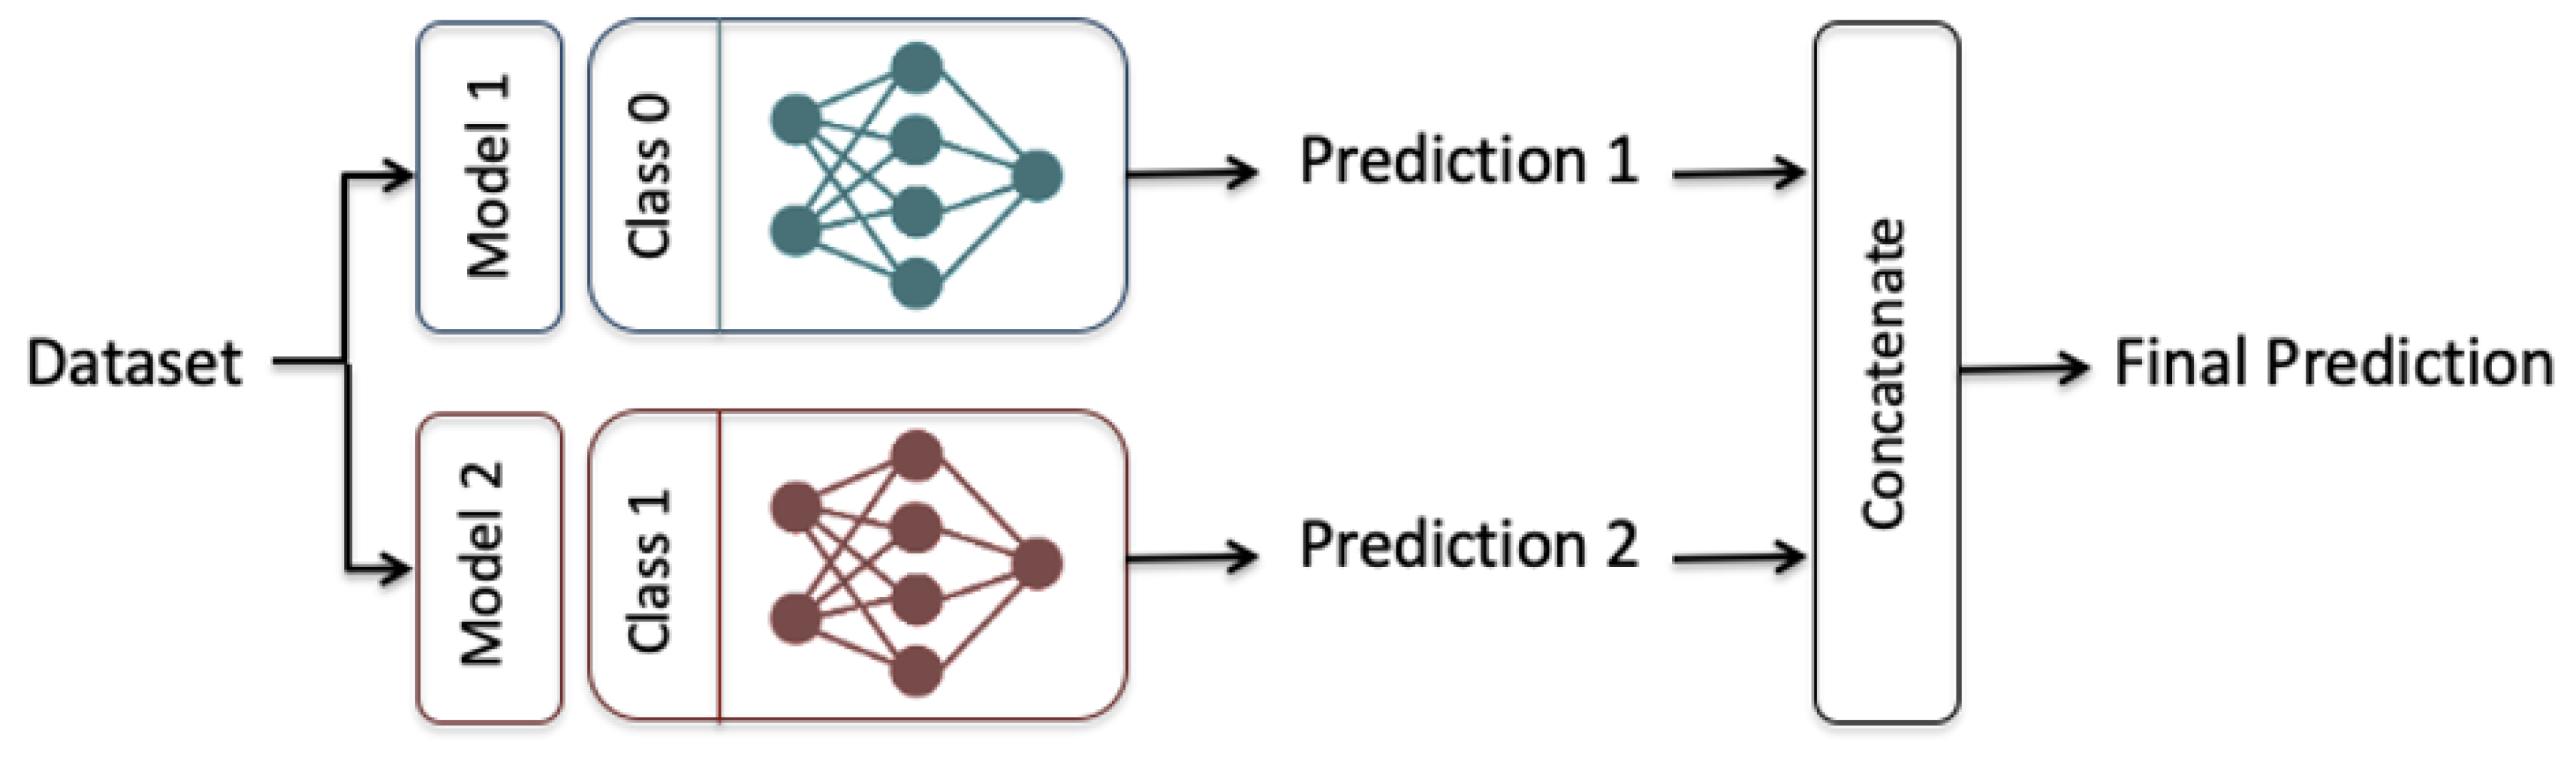
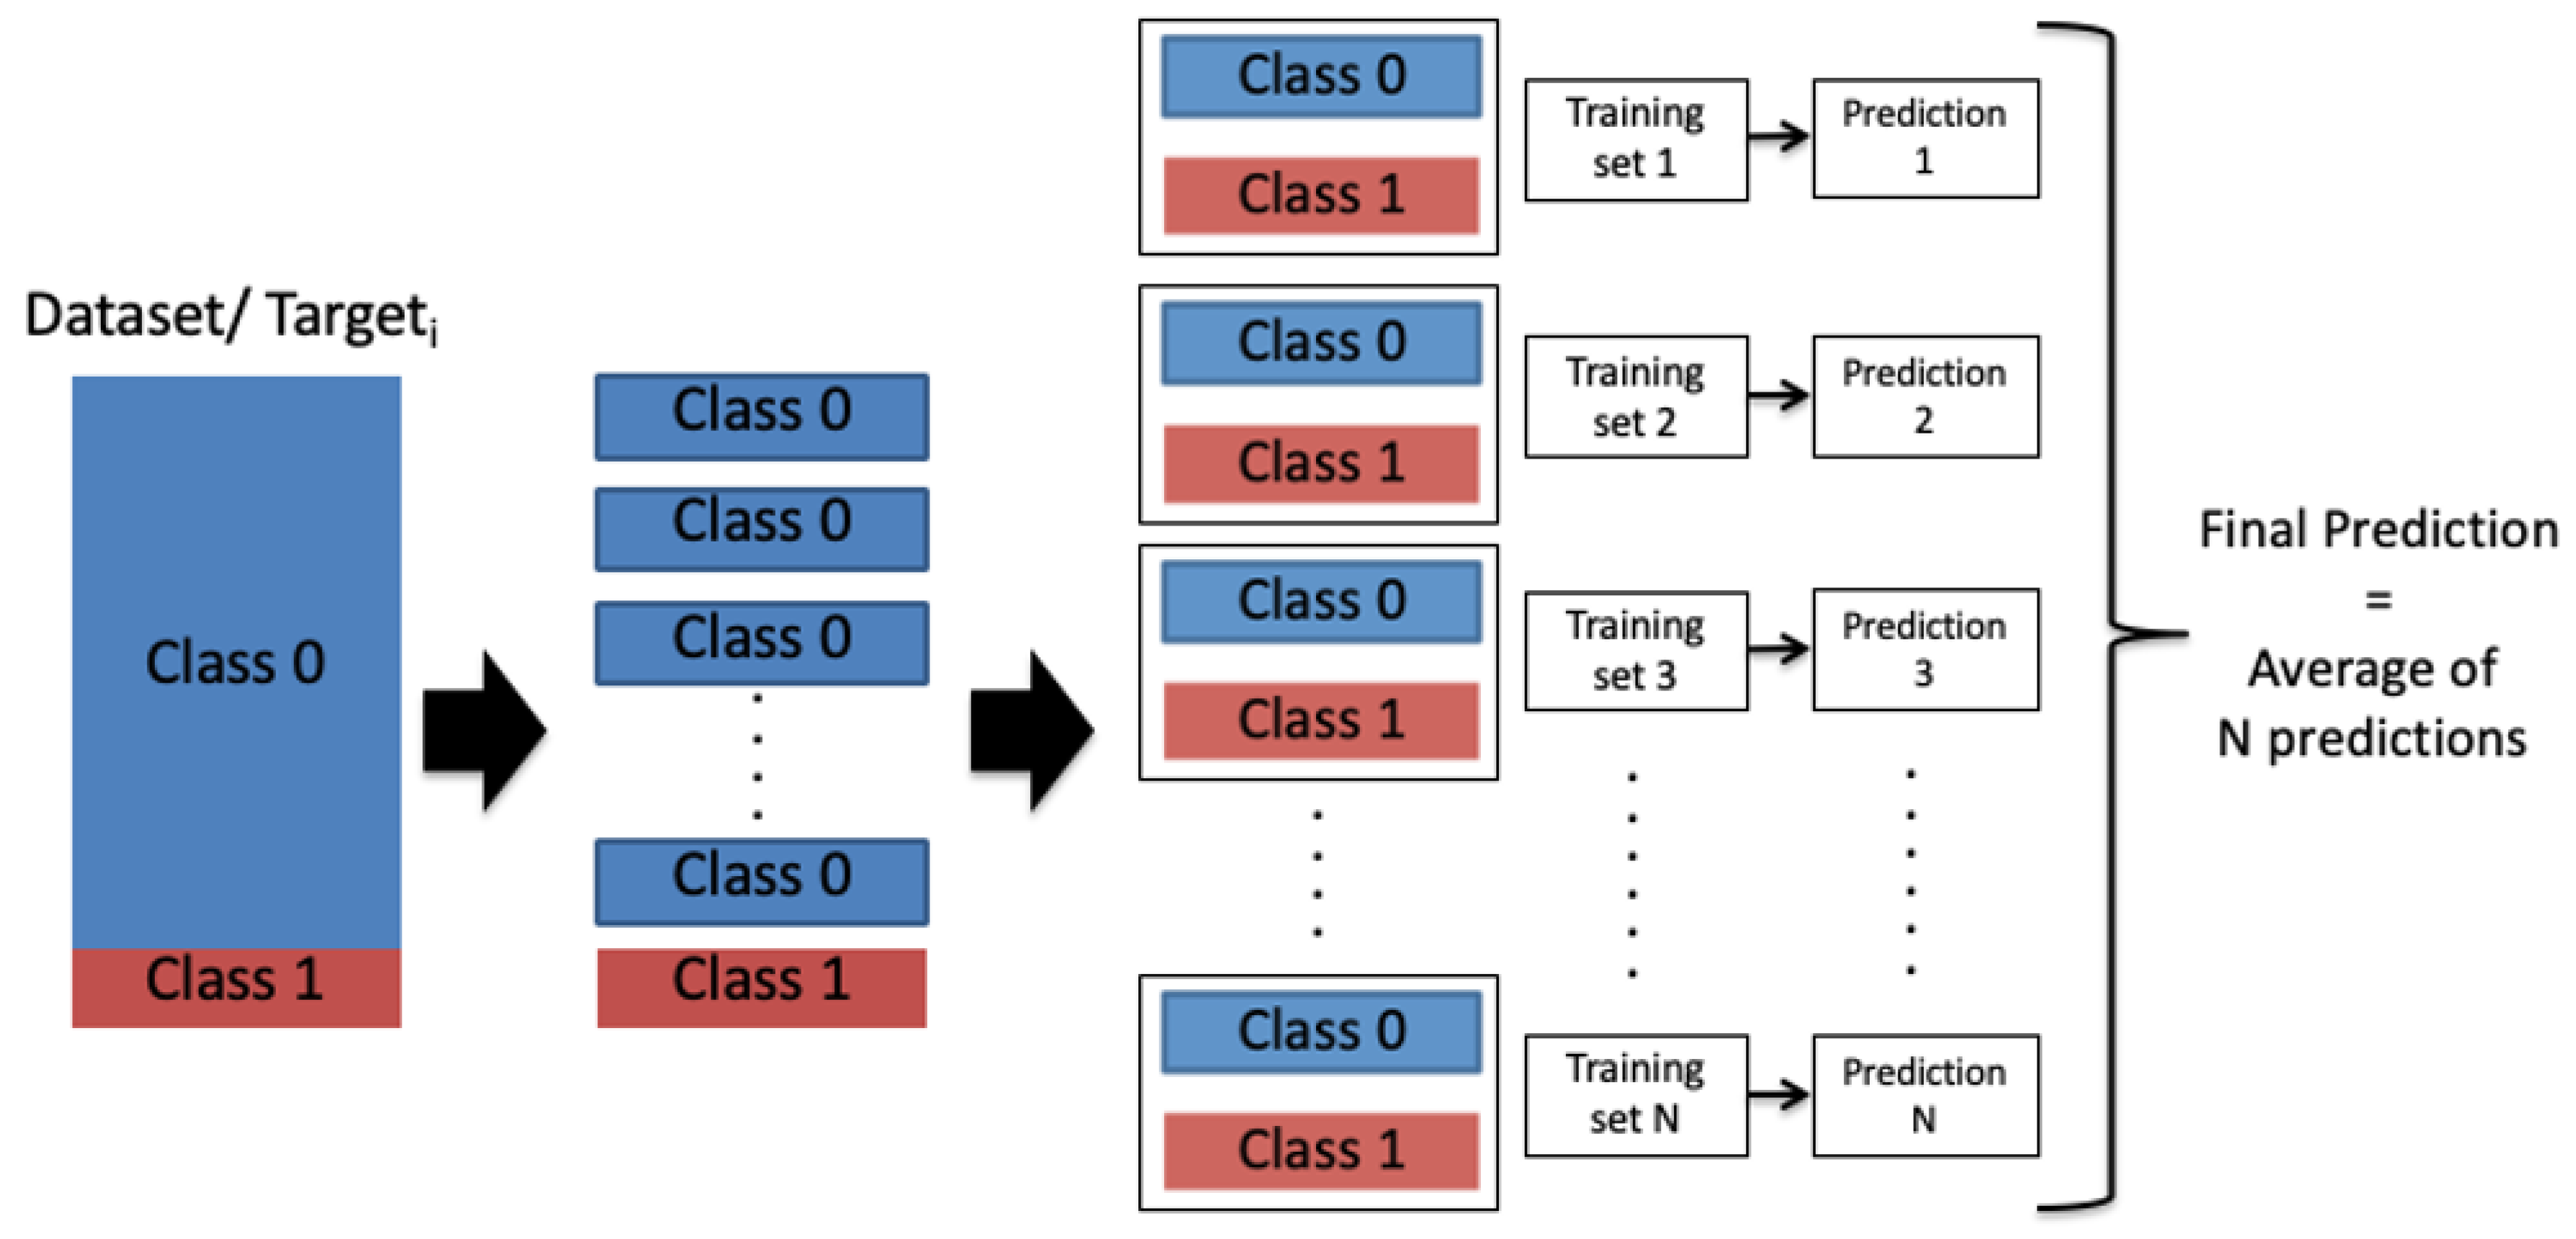
4.2. Ensemble-Learning Framework
5. Experimental Results
5.1. Dataset
5.2. Evaluation Metrics
5.3. Hyperparameters Setting
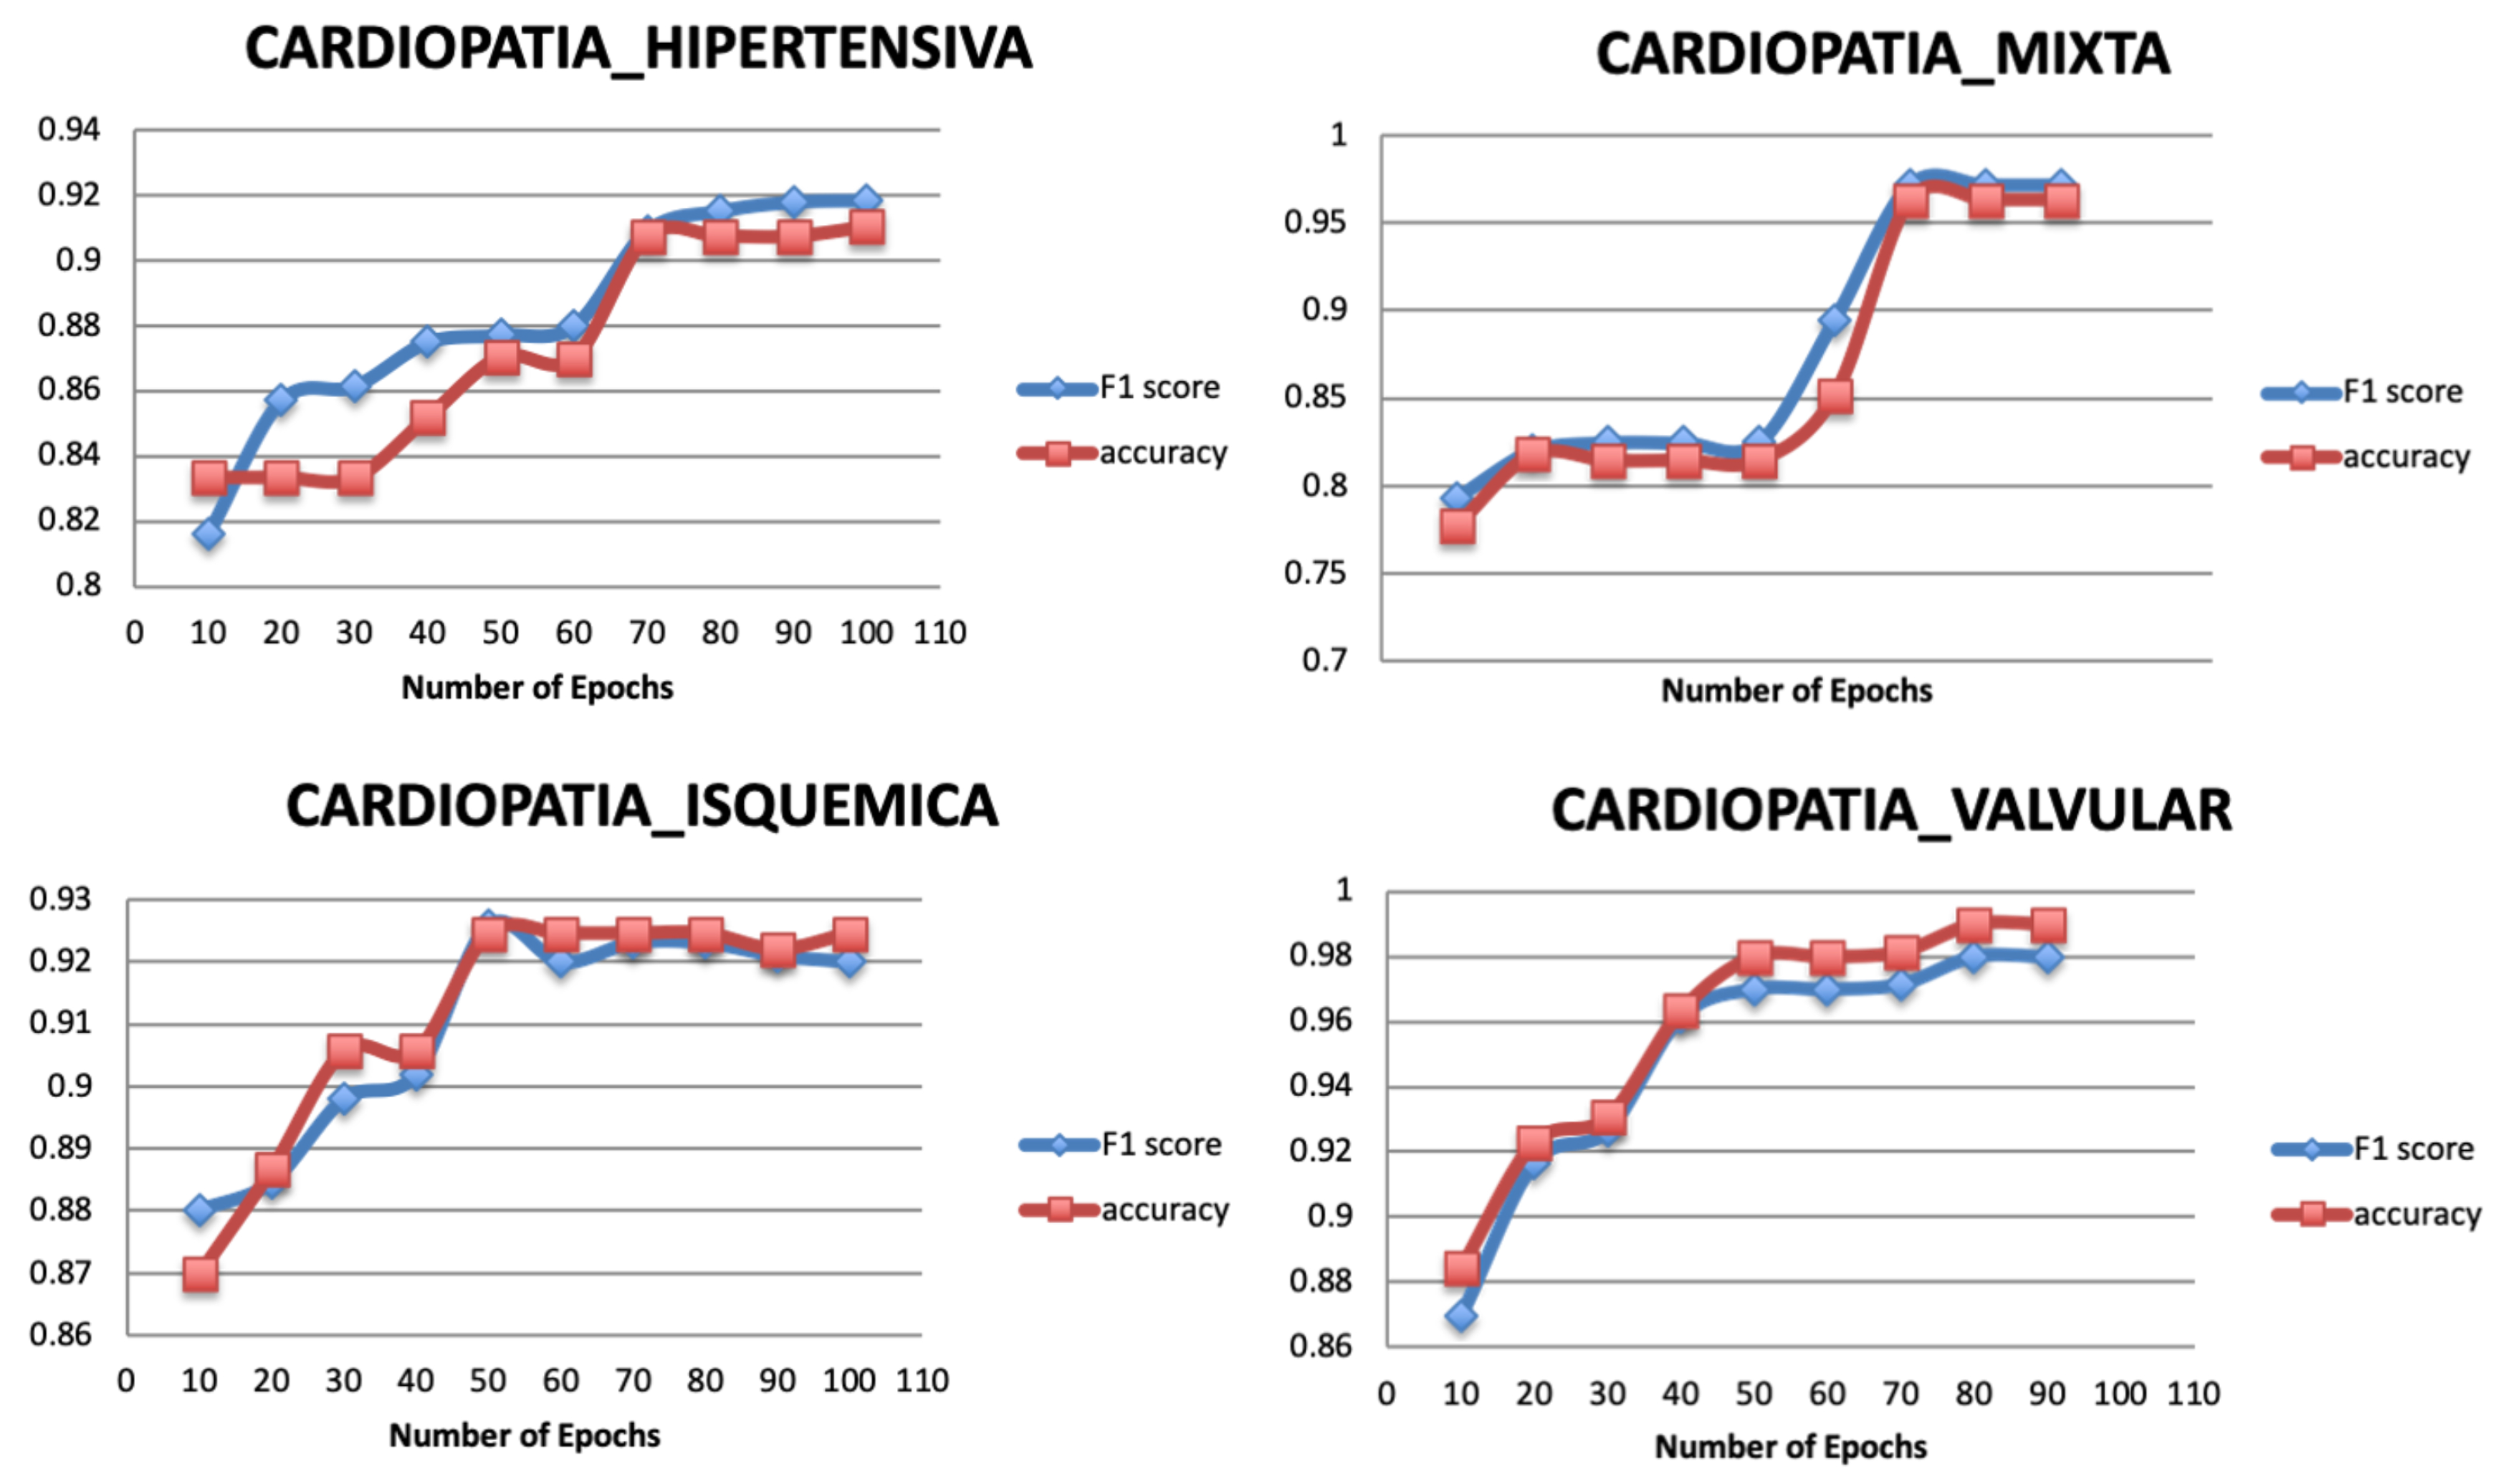
5.3.1. Number of Epochs
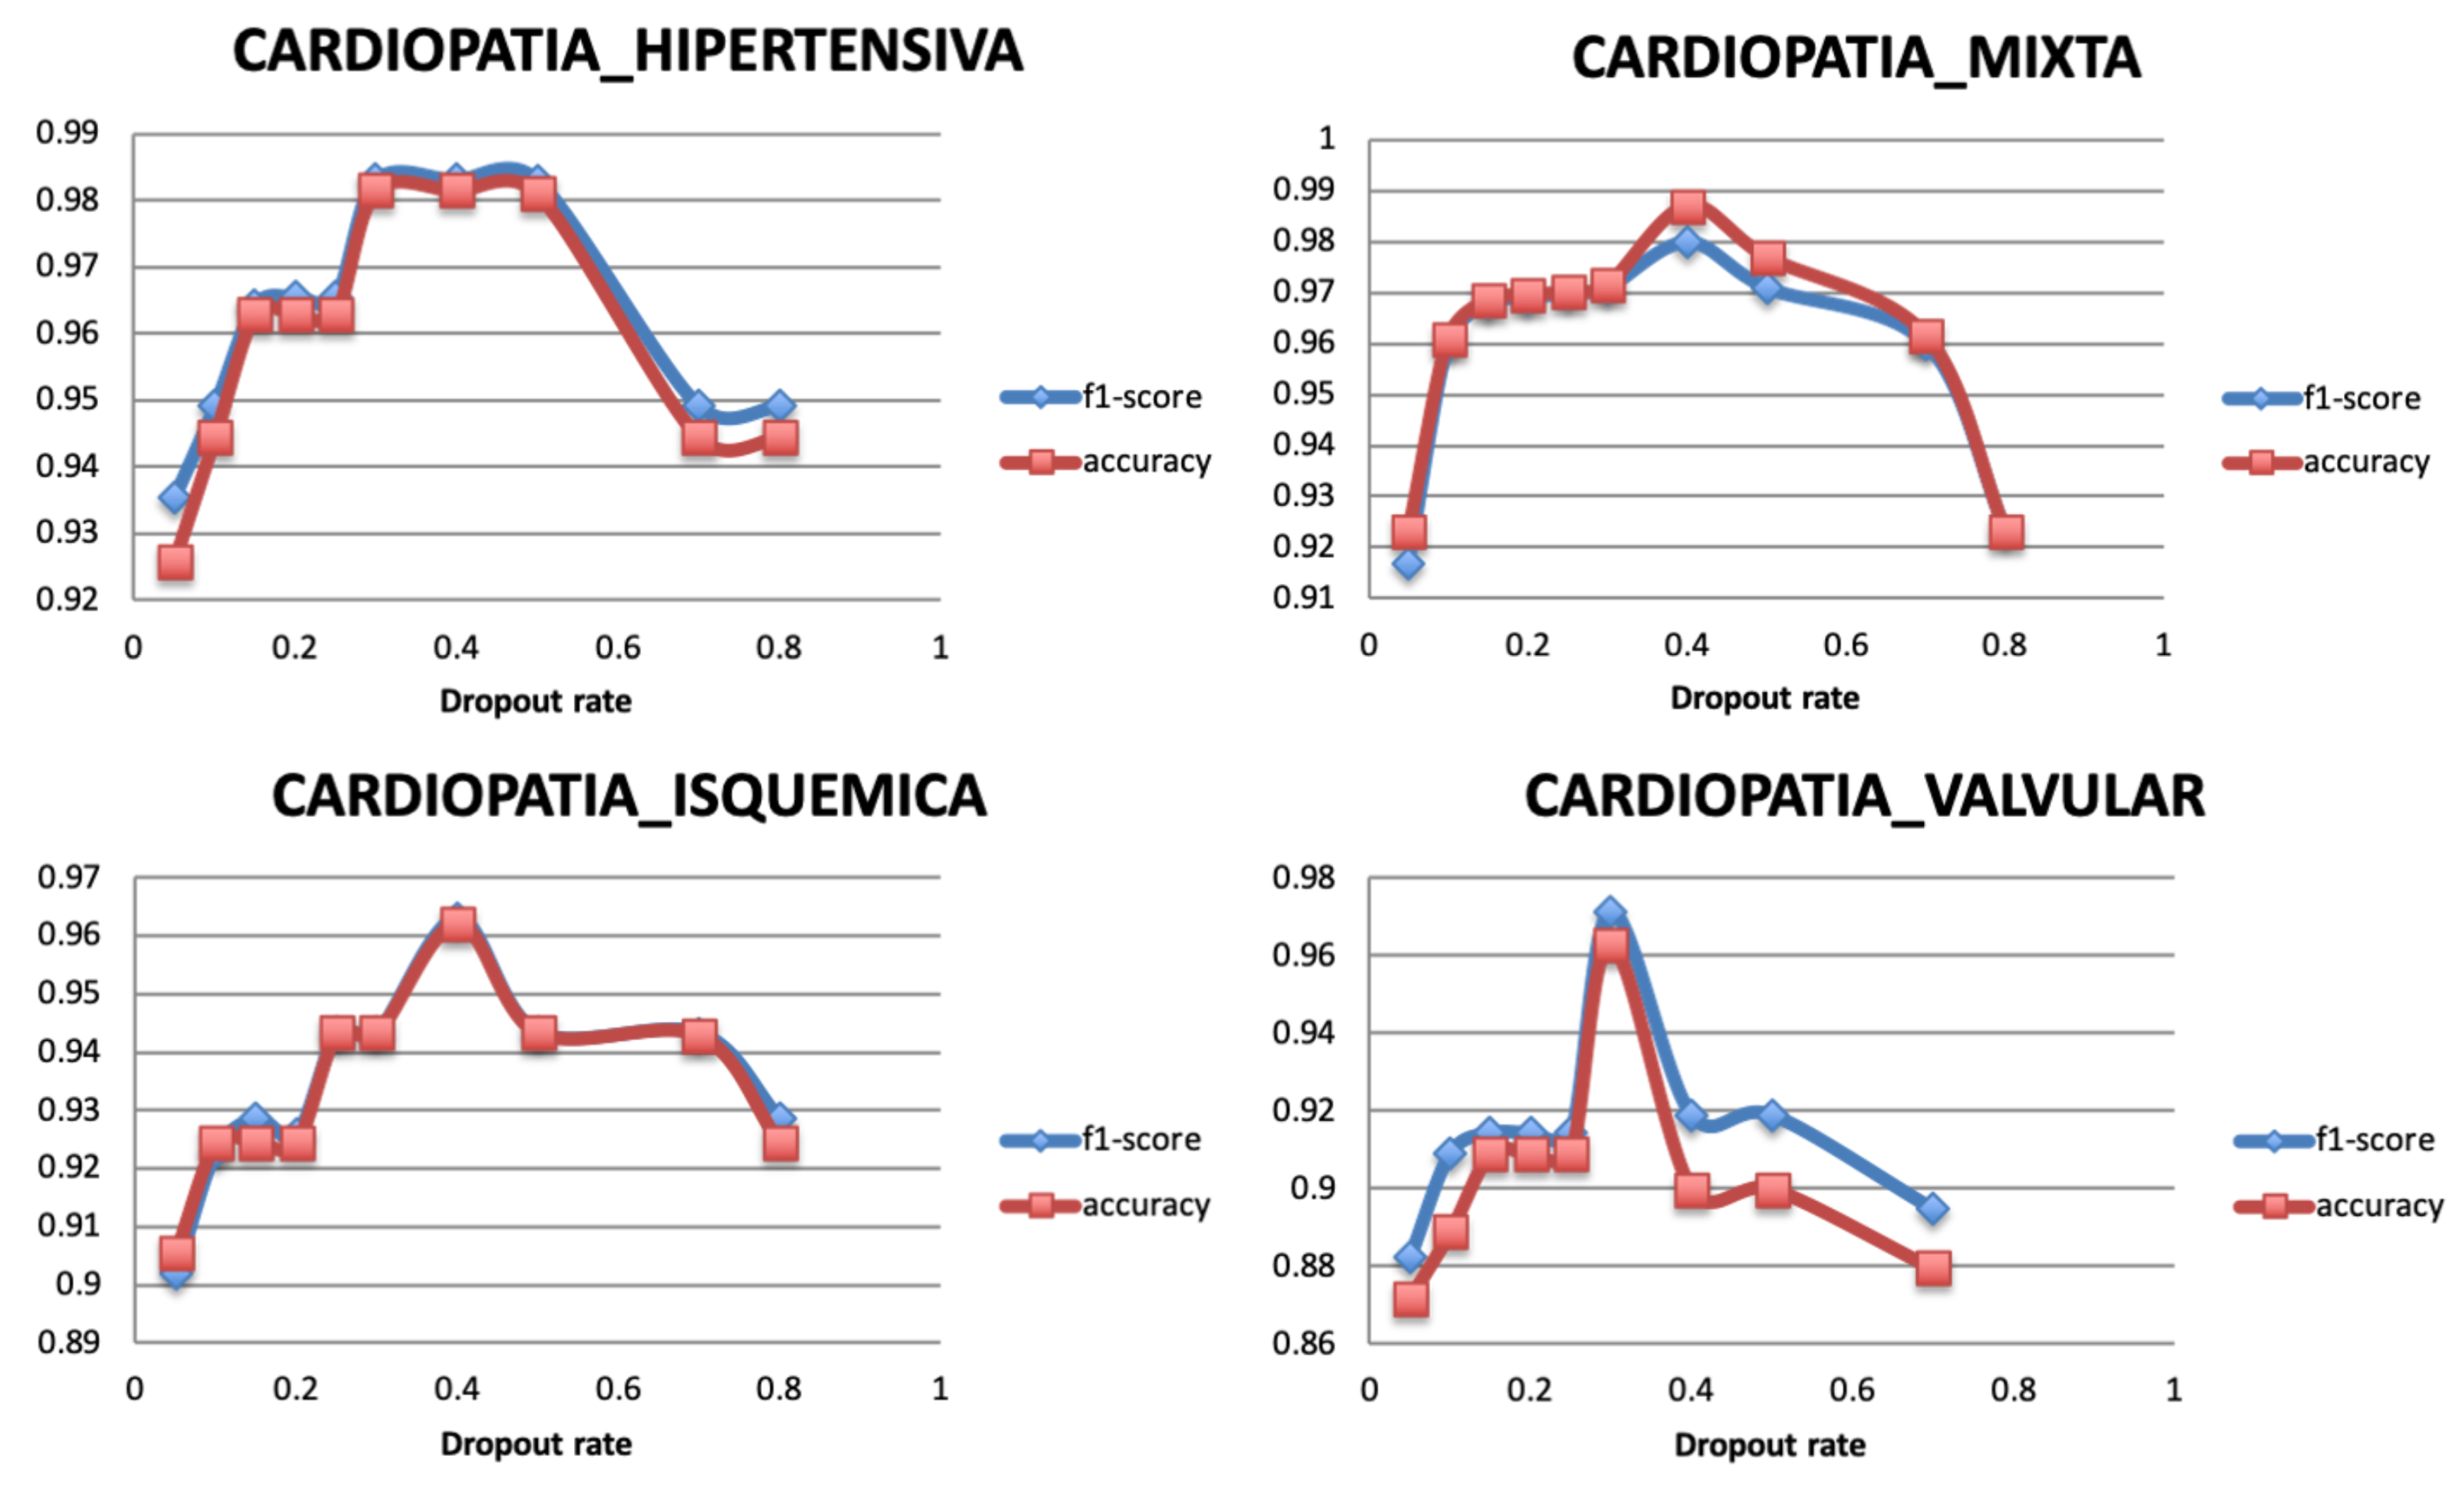
5.3.2. Dropout Rate
5.3.3. Optimizer
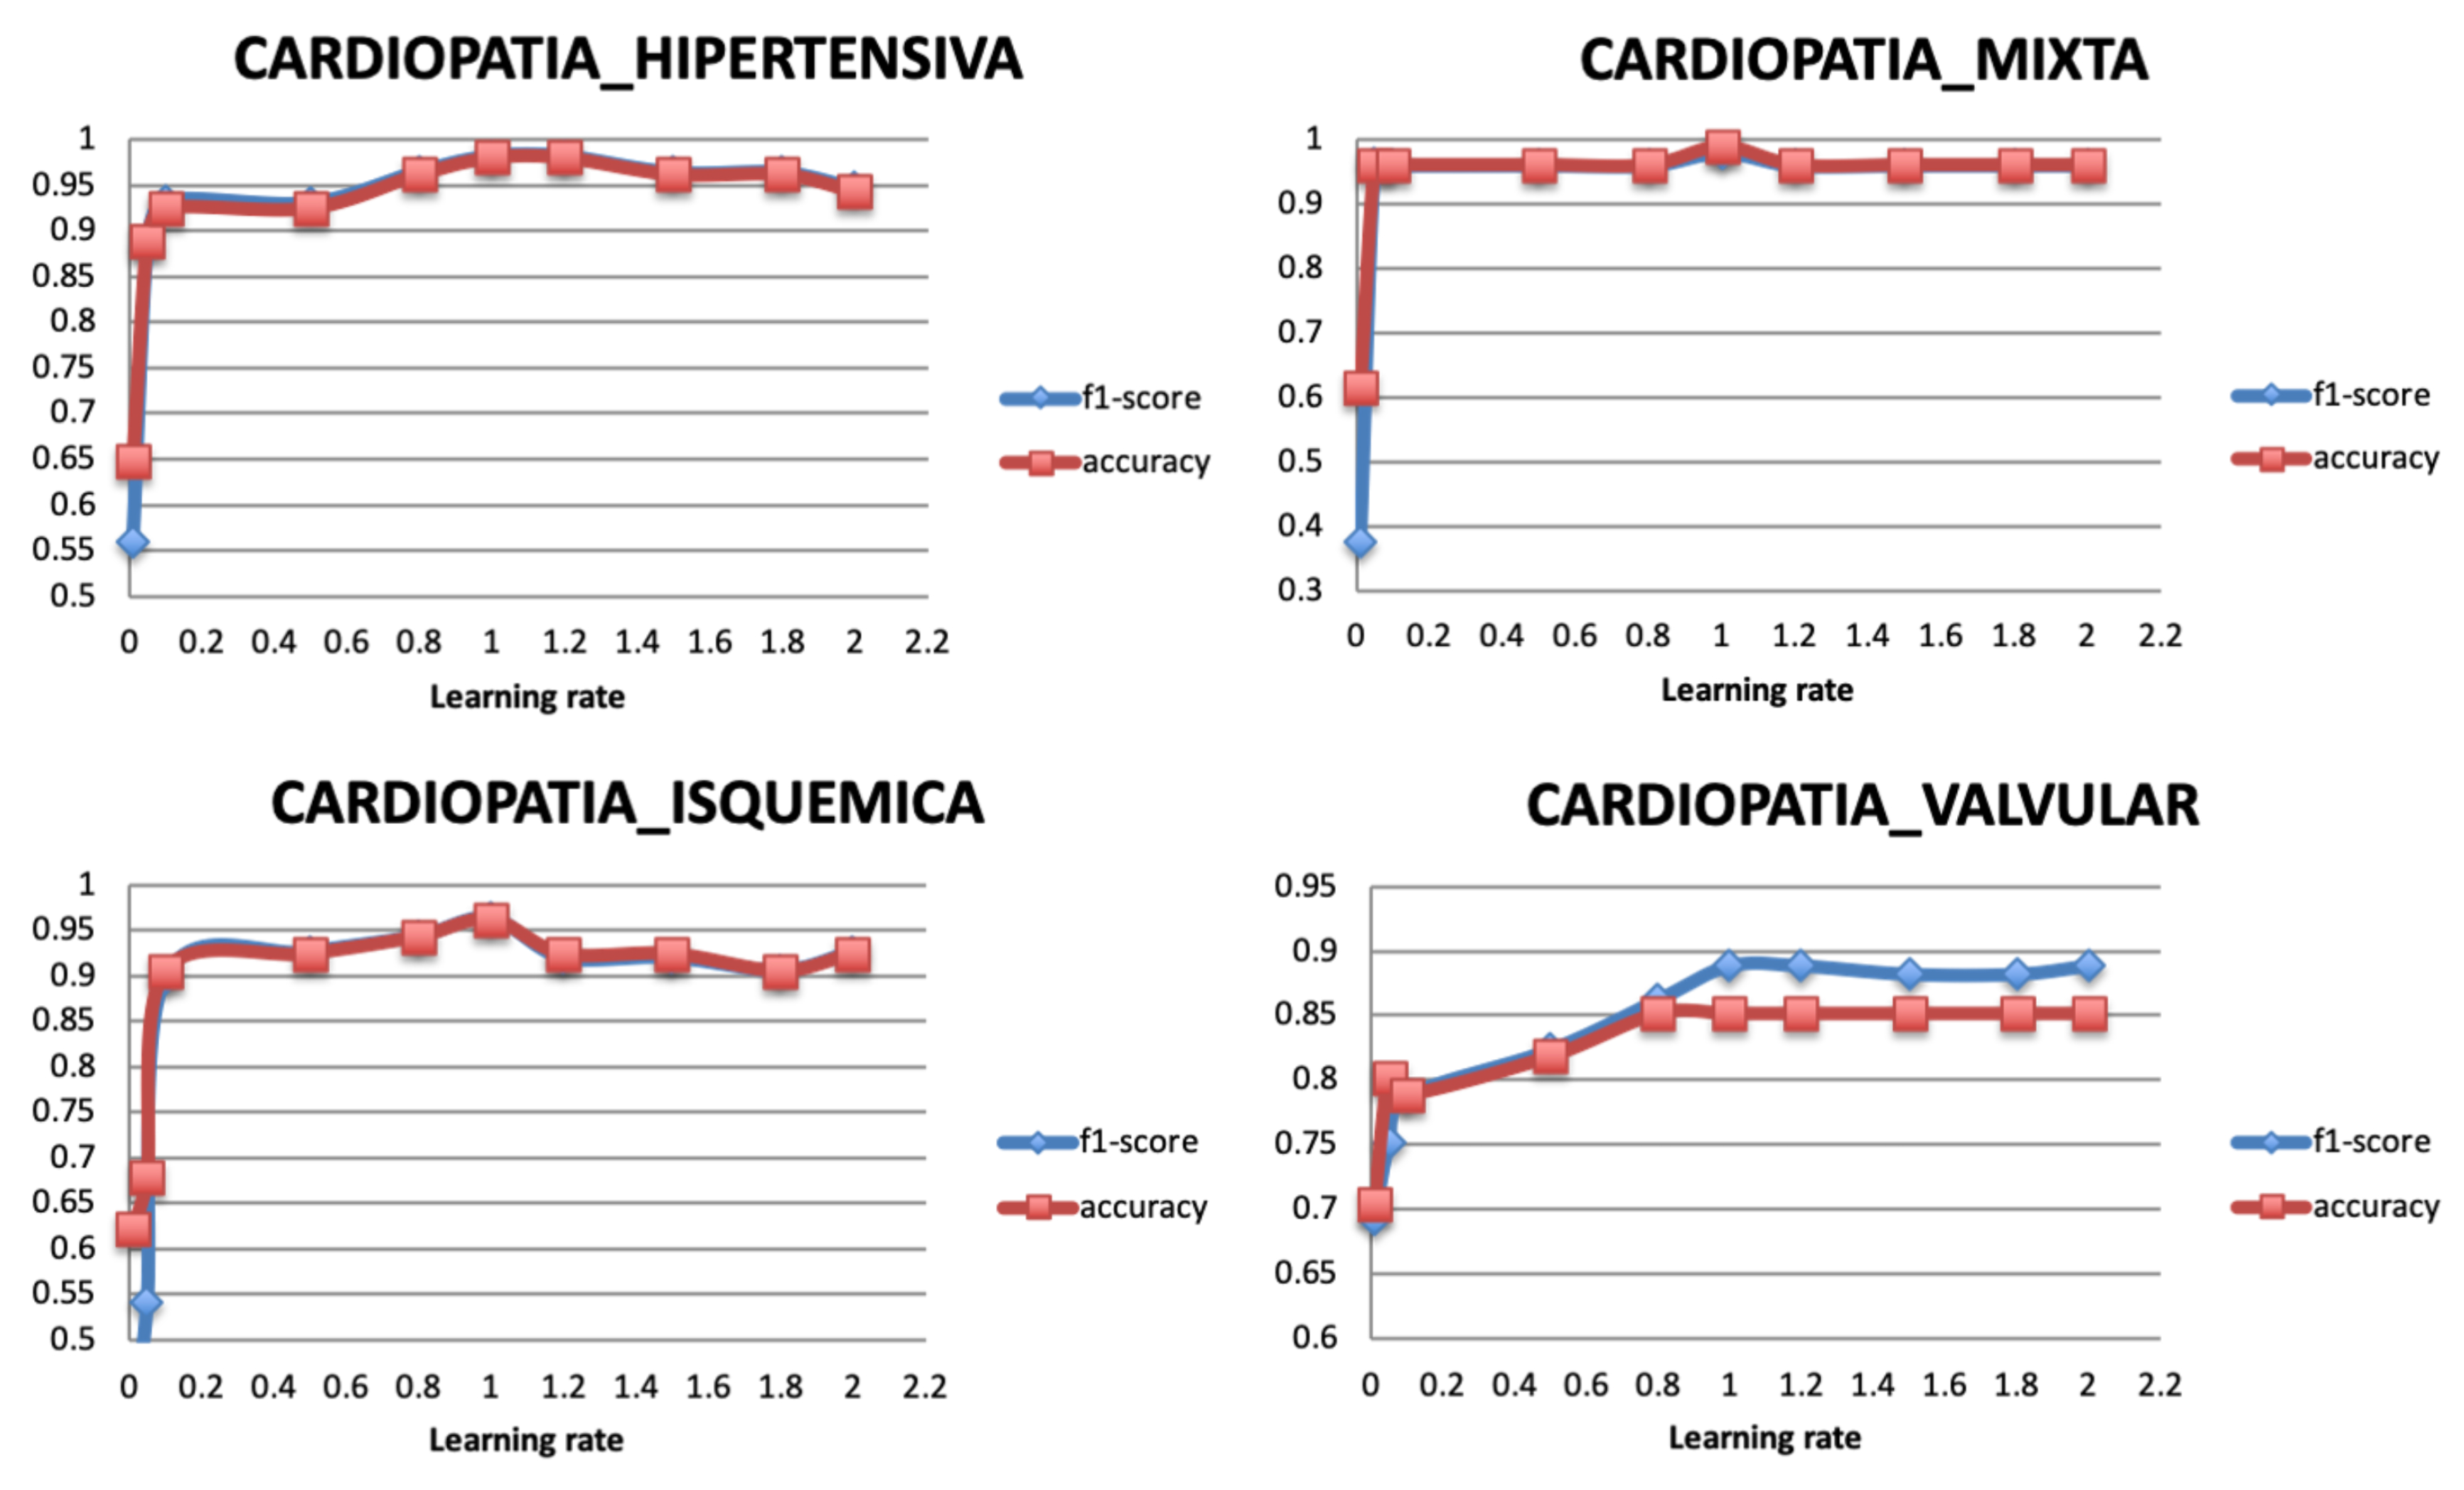
5.3.4. Learning Rate
5.4. Comparative Experiments Results
5.4.1. Classification Performance of the Single Model
5.4.2. Comparison of the Classification Performance for Different Subsets
5.4.3. Comparison of the Classification Performance for Different Models
6. Discussion and Conclusions
Author Contributions
Funding
Acknowledgments
Conflicts of Interest
Appendix A
| Index | Variables | Description |
| 1 | Age | |
| 2 | Gender Female | |
| 3 | Gender Male | |
| 4 | TA_sist | Systolic Blood Pressure |
| 5 | TA_dist | Diastolic Blood Pressure |
| 6 | FC | Heart Rate |
| 7 | Col | cholesterol |
| 8 | LDL | lipoproteins- bad |
| 9 | HDL | high density lipoprotein |
| 10 | TG | Triglycerides |
| 11 | HVI | Left ventricular hypertrophy |
| 12 | GL | Glycemic load (day value) |
| 13 | Peso | |
| 14 | HAS | Systolic Arterial Hypertension |
| 15 | HAS_REACTIVA | |
| 16 | HAS_limitrofe | |
| 17 | HAScFondo | |
| 18 | PRE-HAS | |
| 19 | Dislipidemia | It is the presence of abnormal elevation of fat concentration in the blood (cholesterol, triglycerides, HDL and LDL cholesterol). |
| 20 | Dislipidemia_aterogenica | is a triad of lipoprotein alterations characterized by elevated triglycerides (<150 mg/dL), low HDL cholesterol (<40 mg/dL in men and <50 mg/dL in women) and a greater presence of small LDL particles and dense that is associated with an elevated cardiovascular risk |
| 21 | Dislipidemia_hipercolesterolemia | Increases in triglyceride concentrations |
| 22 | Dislipidemia_mixta | is a lipid and lipoprotein alteration associated with elevated cardiovascular risk and characterized by the joint presence of hypercholesterolemia and hypertriglyceridemia, with elevations of cholesterol linked to very low density lipoproteins (cVLDL) and low density lipoprotein cholesterol (LDLc) |
| 23 | DM2 | Diabetes_melitus 2 |
| 24 | Diabetes_melitus | |
| 25 | Pre-Diabetes | |
| 26 | ObesidadI | |
| 27 | ObesidadII | |
| 28 | ObesidadIII | |
| 29 | CARDIOANGIOESCLEROSIS | It consists of an increase in collagen fibers and acid mucopolysaccharides and a decrease in elastic and smooth muscle fibers. These alterations produce an arterial ectasia with loss of elasticity, as can be seen in the aorta of the elderly. |
| 30 | HIPOTIROIDISMO | occurs when the thyroid gland does not produce enough thyroid hormone to meet the body’s needs |
| 31 | HIPOTIROIDISMO_SUBCLINICO | it is an alteration in the function of the thyroid gland that has few symptoms or very nonspecific and that is detected in a blood test when high TSH values (above the reference range of the laboratory) but with a normal free T4. |
| 32 | BRADICARDIA | it supposes the emission, on the part of the sinus node, of less than 60 ppm (pulsations per minute), or its lack of total function, in which case the frequency that takes control is that of the atrioventricular nodule, of about 45–55 ppm, approximately. |
| 33 | BRADICARDIA_EXTREMA | coronary heart disease |
| 34 | TAQUIARRITMIA | (heart rate> 100 bpm) occurring ’above’ the ventricles, ie in the atria or atrioventricular node |
| 35 | TAQUICARDIA_COMPENSADORA | |
| 36 | TAQUICARDIA_REFLEJA_REACTIVA | |
| 37 | TAQUICARDIA_SAPRAVENTRICULAR | they are arrhythmias with a heart rate higher than 100 bpm that originate in the atria or atrioventricular node |
| 38 | TAQUICARDIA_SINUSAL | It consists of a heart rhythm originated and driven normally, but with a heart rate higher than usual. It is physiological and occurs due to anxiety, exercise, anemia, alcohol consumption, heart failure or nicotine. In general, it does not require specific treatment, but the cause must be acted upon: quitting tobacco, correcting anemia, etc. |
| 39 | TAQUICARDIA_SINUSAL_REACTIVA | |
| 40 | TSVP | Paroxysmal supraventricular tachycardia |
| 41 | ANGOR_PECTORIS | is a pain and disease of the coronary arteries, usually of an oppressive nature, located in the retrosternal area, caused by insufficient blood supply (oxygen) to the cells of the heart muscle. |
| 42 | INSUFICIENCIA TRICUSPIDEA | Its most frequent cause is dilatation of the right ventricle. It does not usually produce signs or symptoms, although severe tricuspid regurgitation can cause cervical pulsations, a holosystolic murmur, and heart failure induced by right ventricular dysfunction or atrial fibrillation. |
| 43 | INSUFICIENCIA_MITRAL | Also known as mitral regurgitation, it is a disorder of the mitral valve of the heart, characterized by reflux of blood from the left ventricle to the left atrium during systole. |
| 44 | INSUFICIENCIA_VENOSA_LINFATICA | It is a condition in which the veins have problems returning blood from the legs to the heart. |
| 45 | INSUFICIENCIA_VENOSA_PERIFERICA | Is a disease in which the venous return is difficult, especially in standing, and in which the venous blood flows back in the opposite direction to the normal, that is, in the case of the lower limbs, it circulates from the deep venous system to the superficial one. |
| 46 | FA_PAROXISTICA | It is the most frequent sustained cardiac arrhythmia. |
| 47 | HIPOTENSION_ORTOSTATICA | It is defined as the inability of the body to regulate blood pressure quickly. It is produced by sudden changes in body position (from lying down to standing). It usually lasts a few seconds or minutes and can cause fainting. |
| 48 | HIPOTENSION_POSTURAL | It is a form of low blood pressure that occurs when you stand up after sitting or lying down. Orthostatic hypotension can make you feel dizzy or dazed, and you can even faint |
| 49 | ANSIEDAD | Mental state characterized by great restlessness, intense excitement and extreme insecurity. |
| 50 | SX_METABOLICO | Is a group of conditions that put you at risk of developing heart disease and type 2 diabetes? These are High blood pressure. Glucose (a type of sugar) high in the blood |
| 51 | ANGIODISPLASIA_INTESTINAL | It is a small malformation that causes dilation and vascular fragility of the colon, resulting in an intermittent loss of blood from the intestinal tract. The lesions are often multiple and often involve the blind or the colonascent, although it can occur in other areas. |
| 52 | ANEMIA | A syndrome that is characterized by an abnormal decrease in the number or size of red blood cells in your blood or in your hemoglobin level |
| 53 | ANEMIA_CRONICA | is a type of anemia found in people with certain long-term (chronic) conditions that involve inflammation. |
| 54 | SOPLO | The heart has valves that close with each heartbeat, which causes the blood to flow in only one direction. The valves are located between the chambers. The murmurs can happen for many reasons, for example: When a valve does not close well, and the blood is returned (regurgitation) |
| 55 | HIPERURICEMIA | Increase in the amount of uric acid in the blood |
| 56 | CIC | Chronic ischemic heart disease |
| 57 | IRC | Chronic renal insufficiency |
| 58 | DISFUNCION_SISTOLICA | It refers to a clinical syndrome characterized by signs and / or symptoms of heart failure in the context of a structural heart disease that causes a decrease in the contractile function of the left ventricle |
| 59 | ARRITMIA | It is a disorder of the heart rate (pulse) or heart rate. The heart may beat too fast (tachycardia), too slow (bradycardia), or irregularly |
| 60 | ARRITMIA_CARDIACA | |
| 61 | ARRITMIA_SINUSAL | Is the variation of the heart rate of the sinus node with the respiratory cycle? |
| 62 | ARRITMIA_VENTRICULAR | Is a heart rhythm disorder (arrhythmia) caused by abnormal electrical signals in the lower chambers of the heart (ventricles)? |
| 63 | CALCIFICACION_CORONARIA | A passive and degenerative process that frequently occurred with advanced age, atherosclerosis, several metabolic alterations (such as diabetes mellitus and final stages of kidney disease), and in rare genetic diseases. |
| 64 | PROSTATISMO | when it causes urinary retention |
| 65 | UROPATIA_OBSTRUCTIVA | It occurs when urine cannot be drained through the urinary tract. The urine is returned to the kidney and causes it to swell. This condition is known as hydronephrosis. Obstructive uropathy can affect one or both kidneys |
| 66 | TROMBOFLEBITIS | It is an inflammatory process that causes blood clots to form that produce blockages in one or more veins, in general, in the legs. The affected vein may be near the surface of the skin (thrombophlebitis superficial) or at a deep level of a muscle (deep vein thrombosis). |
| 67 | TROMBOSIS | Colloquially called blood clot, it is the final product of the blood coagulation stage in hemostasis. There are two components in a thrombus: aggregate platelets and red blood cells that form a plug, and a mesh of reticulated fibrin protein |
| 68 | ATEROMATOSIS | It is a multifactorial inflammatory process that affects the wall of the arteries, has a long clinical evolution, and manifests itself in highly evolved stages causing a cardiovascular event |
| 69 | ESTEATOSIS | fatty liver disease |
| 70 | FIBROSIS_PULMONAR | Is a condition in which the tissue in the lungs heals and, therefore, becomes thick and hard. This causes difficulties when breathing and it is possible that the blood does not receive enough oxygen |
| 71 | COLITIS | is an inflammatory bowel disease that causes lasting inflammation and ulcers (sores) in the digestive tract |
| 72 | HIPERCOLESTEROLEMIA | Increase in the normal amount of cholesterol in the blood |
| 73 | FARINGOAMIGDALITIS | Is the acute infection of the pharynx or the palatine tonsils? Symptoms may include angina, dysphagia, cervical lymphadenopathy, and fever. The diagnosis is clinical, complemented by culture or rapid antigenic testing. |
| 74 | DIVERTICULAR | It is a condition that occurs when small bags or sacs are formed that push outward through the weak points in the wall of your colon. Diverticulosis can also cause problems such as diverticular bleeding and diverticulitis. |
| 75 | CEFALEA_CRONICA | headache |
| 76 | CEFALE_VASOMOTORA | tension headache |
| 77 | ANEURISMA_RENAL | The etiology is usually related to fibromuscular dysplasia, arteriosclerosis of the renal artery, which may be congenital, associated with arteritis, or with a traumatic history. |
| 78 | LITIASIS_RENAL | |
| 79 | ALZHEIMER | |
| 80 | EPOC | Chronic obstructive pulmonary disease (COPD) is a chronic inflammatory disease of the lungs that obstructs the flow of air from the lungs. Symptoms include shortness of breath, cough, mucus production (sputum) and whistling when breathing. |
| 81 | ACALASIA_ESOFAGICA | This is called the lower esophageal sphincter (LES). Normally, this muscle relaxes when you swallow to let food pass into the stomach. In people with achalasia, this muscle ring does not relax so well. In addition, the normal muscular activity of the esophagus (peristalsis) is reduced. |
| 82 | CANDIDIASIS_ESOFAGICA | It refers to the infection of the oral mucosa. Candida is responsible for the majority of oral fungal infections and C. albicans is the main causative species of infection. The infection can spread to the esophagus causing esophageal candidiasis. |
| 83 | RAYNAUD | Is a rare disorder of the blood vessels that usually affects the fingers and toes? |
| 84 | ORTOSTATISMO | It is a drop in blood pressure that comes because of a person having been standing for a long time or when standing after sitting or lying down. |
| 85 | HEPATITIS_C | |
| 86 | CREST | It is a limited form of scleroderma. In this modality of the entity, it is typical that Raynaud’s syndrome precedes the presentation of the rest of the disease symptoms in years. |
| 87 | GLAUCOMA | is an eye disease that steals your vision gradually |
| 88 | DISFUNCION_ERECTIL | |
| 89 | HIPPERPARATIROIDISMO | is an alteration that consists of the parathyroid glands secreting a greater amount of parathyroid hormone, regulator of calcium, magnesium, and phosphorus in the blood and bone |
| 90 | RESEQUEDAD_VAGINAL | |
| 91 | TABAQUISMO_CRONICO | |
| 92 | STENT | (coronary artery stent) is a small tube of metal mesh that expands inside a heart artery |
| 93 | FA_CRONICA | chronic arterial frequency |
| 94 | ICVV | diastolic heart failure |
| 95 | AORTA_BIVALVA | It regulates the flow of blood from the heart to the aorta. The aorta is the largest blood vessel that carries oxygen-rich blood to the heart |
| 96 | AASV | extracorporeal, more invasive or implantable ventricular assist devices (AAV)—AASVs divert the patient’s circulation so that they completely discharge the ventricle (blood is taken from the atrium or directly from the injured ventricle and recast in the aorta or AP) |
| 97 | ITG | Impaired glucose tolerance. |
| 98 | LES | Systemic lupus erythematosus (SLE) is an inflammatory disease |
| 99 | Aldactone_25 | Drugs |
| 100 | Almetec_tri | |
| 101 | Aspirina_100 | |
| 102 | Aspirina_81 | |
| 103 | AspirinaInf | |
| 104 | Atacand_8mg | |
| 105 | Atacand_16mg | |
| 106 | Angiotrofin_30mg | |
| 107 | Atorvastatina_41 | |
| 108 | Atozet_10 | |
| 109 | Atozet_40 | |
| 110 | Biconcor_6 | |
| 111 | Centrum_performance | |
| 112 | Co-Enzyme_401 | |
| 113 | Concor_11 | |
| 114 | CONCOR_2.6 | |
| 115 | Cordarone_201 | |
| 116 | Crestor_41 | |
| 117 | Daflon_501 | |
| 118 | Diltiazem_121 | |
| 119 | DUOALMETEC_41 | |
| 120 | Elantan_21 | |
| 121 | Elicuis_6 | |
| 122 | Espironolactona_26 | |
| 123 | Eutirox_100 | |
| 124 | Eutirox_75 | |
| 125 | HALCION_0.26 | |
| 126 | Insulina_tresiba | |
| 127 | Jardianz_6 | |
| 128 | Jardianz_Duo | |
| 129 | Carnitine_501 | |
| 130 | Lanoxin_0.26 | |
| 131 | Lipitor_81 | |
| 132 | Metformina_500 | |
| 133 | Metformina_850 | |
| 134 | Miccil_2 | |
| 135 | Norfenon_301 | |
| 136 | Omega_3.1001 | |
| 137 | Procorolan_6 | |
| 138 | Telmisartan_81 | |
| 139 | Trulicity_1.6 | |
| 140 | Trulicity_2.6 | |
| 141 | VYTORIN_11 |
References
- Mozaffarian, D.; Benjamin, E.J.; Go, A.S.; Arnett, D.K.; Blaha, M.J.; Cushman, M.; Howard, V.J. Heart disease and stroke statistics-2016 update a report from the American Heart Association. Circulation 2016, 133, e38–e48. [Google Scholar]
- Trifirò, G.; Pariente, A.; Coloma, P.M.; Kors, J.A.; Polimeni, G.; Miremont-Salamé, G.; Caputi, A.P. Secondary use of EHR: Data quality issues and informatics opportunities. Pharmacoepidemiol. Drug Saf. 2009, 18, 1176–1184. [Google Scholar] [PubMed]
- Botsis, T.; Hartvigsen, G.; Chen, F.; Weng, C. Data mining on electronic health record databases for signal detection in pharmacovigilance: Which events to monitor. Summit Transl. Bioinform. 2010, 1, 1176–1184. [Google Scholar]
- Birkhead, G.S.; Klompas, M.; Shah, N.R. Uses of electronic health records for public health surveillance to advance public health. Annu. Rev. Public Health 2015, 36, 345–359. [Google Scholar] [CrossRef] [Green Version]
- Impedovo, D.; Pirlo, G.; Vessio, G. Dynamic handwriting analysis for supporting earlier Parkinson’s disease diagnosis. Information 2018, 9, 247. [Google Scholar] [CrossRef] [Green Version]
- Kumar, S.; Singh, M. Big data analytics for healthcare industry: Impact, applications, and tools. Big Data Min. Anal. 2018, 2, 48–57. [Google Scholar] [CrossRef]
- Wang, G.; Li, W.; Zuluaga, M.A.; Pratt, R.; Patel, P.A.; Aertsen, M.; Vercauteren, T. Interactive medical image segmentation using deep learning with image-specific fine tuning. IEEE Trans. Med Imaging 2018, 37, 1562–1573. [Google Scholar] [CrossRef]
- Zhang, J.; Kowsari, K.; Harrison, J.H.; Lobo, J.M.; Barnes, L.E. Patient2vec: A personalized interpretable deep representation of the longitudinal electronic health record. IEEE Access 2018, 6, 65333–65346. [Google Scholar] [CrossRef]
- Shin, H.C.; Roth, H.R.; Gao, M.; Lu, L.; Xu, Z.; Nogues, I.; Summers, R.M. Deep convolutional neural network for computer-aided detection: CNN architectures, dataset characteristics and transfer learning. IEEE Trans. Med Imaging 2016, 35, 1285–1298. [Google Scholar] [CrossRef] [Green Version]
- Ghoniem, R.M. A Novel Bio-Inspired Deep Learning Approach for Liver Cancer Diagnosis. Information 2020, 11, 80. [Google Scholar] [CrossRef] [Green Version]
- Nikhar, S.; Karandikar, A.M. Prediction of heart disease using machine learning algorithms. Int. J. Adv. Eng. Manag. Sci. 2016, 2, 1275–1278. [Google Scholar]
- Abdar, M.; Książek, W.; Acharya, U.R.; Tan, R.S.; Makarenkov, V.; Pławiak, P. A new machine learning technique for an accurate diagnosis of coronary artery disease. Comput. Methods Programs Biomed. 2019, 179, 104992. [Google Scholar] [CrossRef] [PubMed]
- Maglogiannis, I.; Loukis, E.; Zafiropoulos, E.; Stasis, A. Support vectors machine-based identification of heart valve diseases using heart sounds. Comput. Methods Programs Biomed. 2009, 95, 47–61. [Google Scholar] [CrossRef] [PubMed]
- Tjahjadi, H.; Ramli, K. Noninvasive Blood Pressure Classification Based on Photoplethysmography Using K-Nearest Neighbors Algorithm: A Feasibility Study. Information 2020, 11, 93. [Google Scholar] [CrossRef] [Green Version]
- Shickel, B.; Tighe, P.J.; Bihorac, A.; Rashidi, P. Deep EHR: A survey of recent advances in deep learning techniques for electronic health record (EHR) analysis. IEEE J. Biomed. Health Inform. 2017, 22, 1589–1604. [Google Scholar] [CrossRef]
- Miotto, R.; Wang, F.; Wang, S.; Jiang, X.; Dudley, J.T. Deep learning for healthcare: Review, opportunities and challenges. Brief. Bioinform. 2017, 19, 1236–1246. [Google Scholar] [CrossRef]
- Rajamhoana, S.P.; Devi, C.A.; Umamaheswari, K.; Kiruba, R.; Karunya, K.; Deepika, R. Analysis of neural networks based heart disease prediction system. In Proceedings of the 2018 11th International Conference on Human System Interaction (HSI), Gdańsk, Poland, 4–6 July 2018; pp. 233–239. [Google Scholar]
- Acharya, U.R.; Oh, S.L.; Hagiwara, Y.; Tan, J.H.; Adam, M.; Gertych, A.; San Tan, R. A deep convolutional neural network model to classify heartbeats. Comput. Biol. Med. 2017, 89, 389–396. [Google Scholar] [CrossRef]
- Khan, M.A. An IoT Framework for Heart Disease Prediction Based on MDCNN Classifier. IEEE Access 2020, 8, 34717–34727. [Google Scholar] [CrossRef]
- Miotto, R.; Li, L.; Dudley, J.T. Deep learning to predict patient future diseases from the electronic health records. In Proceedings of the European Conference on Information Retrieval, Padua, Italy, 20–23 March 2016; pp. 768–774. [Google Scholar]
- Choi, E.; Schuetz, A.; Stewart, W.F.; Sun, J. Using recurrent neural network models for early detection of heart failure onset. J. Am. Med Inform. Assoc. 2016, 24, 361–370. [Google Scholar] [CrossRef]
- Park, H.D.; Han, Y.; Choi, J.H. Frequency-Aware Attention based LSTM Networks for Cardiovascular Disease. In Proceedings of the 2018 International Conference on Information and Communication Technology Convergence (ICTC), Jeju Island, Korea, 17–19 October 2018; pp. 1503–1505. [Google Scholar]
- Park, S.; Kim, Y.J.; Kim, J.W.; Park, J.J.; Ryu, B.; Ha, J.W. [Regular Paper] Interpretable Prediction of Vascular Diseases from Electronic Health Records via Deep Attention Networks. In Proceedings of the 2018 IEEE 18th International Conference on Bioinformatics and Bioengineering (BIBE), Taichung, Taiwan, 29–31 October 2018; pp. 110–117. [Google Scholar]
- Yang, Y.; Wang, Y.; Yuan, X. Bidirectional extreme learning machine for regression problem and its learning effectiveness. IEEE Trans. Neural Netw. Learn. Syst. 2012, 23, 1498–1505. [Google Scholar] [CrossRef]
- Fei, H.; Tan, F. Bidirectional grid long short-term memory (bigridlstm): A method to address context-sensitivity and vanishing gradient. Algorithms 2018, 11, 172. [Google Scholar] [CrossRef] [Green Version]
- Wang, P.; Qian, Y.; Soong, F.K.; He, L.; Zhao, H. A unified tagging solution: Bidirectional lstm recurrent neural network with word embedding. arXiv 2015, arXiv:1511.00215. Available online: www.arxiv.org/abs/1511.00215 (accessed on 9 March 2020).
- Jagannatha, A.N.; Yu, H. Bidirectional RNN for medical event detection in electronic health records. In Proceedings of the Conference Association for Computational Linguistics, Berlin, Germany, 7–12 August 2016; pp. 473–482. [Google Scholar]
- He, R.; Liu, Y.; Wang, K.; Zhao, N.; Yuan, Y.; Li, Q.; Zhang, H. Automatic cardiac arrhythmia classification using combination of deep residual network and bidirectional LSTM. IEEE Access 2019, 7, 102119–102135. [Google Scholar] [CrossRef]
- Usama, M.; Ahmad, B.; Wan, J.; Hossain, M.S.; Alhamid, M.F.; Hossain, M.A. Deep Feature Learning for Disease Risk Assessment Based on Convolutional Neural Network With Intra-Layer Recurrent Connection by Using Hospital Big Data. IEEE Access 2018, 6, 67927–67939. [Google Scholar] [CrossRef]
- Rajesh, K.N.; Dhuli, R. Classification of imbalanced ECG beats using re-sampling techniques and AdaBoost ensemble classifier. Biomed. Signal Process. Control. 2018, 41, 242–254. [Google Scholar] [CrossRef]
- Esfahani, H.A.; Ghazanfari, M. Cardiovascular disease detection using a new ensemble classifier. In Proceedings of the 2017 IEEE 4th International Conference on Knowledge-Based Engineering and Innovation (KBEI), Tehran, Iran, 22 December 2017; pp. 1011–1014. [Google Scholar]
- Pasanisi, S.; Paiano, R. A hybrid information mining approach for knowledge discovery in cardiovascular disease (CVD). Information 2018, 9, 90. [Google Scholar] [CrossRef] [Green Version]
- Zabihi, M.; Rad, A.B.; Kiranyaz, S.; Gabbouj, M.; Katsaggelos, A.K. Heart sound anomaly and quality detection using ensemble of neural network without segmentation. In Proceedings of the 2016 Computing in Cardiology Conference (CinC), Vancouver, BC, Canada, 11–14 September 2016; pp. 613–616. [Google Scholar]
- Kang, Q.; Chen, X.; Li, S.; Zhou, M. A noise-filtered under-sampling scheme for imbalanced classification. IEEE Trans. Cybern. 2016, 47, 4263–4274. [Google Scholar] [CrossRef]
- Wang, S.; Minku, L.L.; Yao, X. Resampling-based ensemble methods for online class imbalance learning. IEEE Trans. Knowl. Data Eng. 2014, 27, 1356–1368. [Google Scholar] [CrossRef] [Green Version]
- Chatzakis, I.; Vassilakis, K.; Lionis, C.; Germanakis, I. Electronic health record with computerized decision support tools for the purposes of a pediatric cardiovascular heart disease screening program in Crete. Comput. Methods Programs Biomed. 2018, 159, 159–166. [Google Scholar] [CrossRef]
- Sowmiya, C.; Sumitra, P. Analytical study of heart disease diagnosis using classification techniques. In Proceedings of the 2017 IEEE International Conference on Intelligent Techniques in Control, Optimization and Signal Processing (INCOS), Tamilnadu, India, 23–25 March 2017; pp. 1–5. [Google Scholar]
- Mohan, S.; Thirumalai, C.; Srivastava, G. Effective Heart Disease Prediction Using Hybrid Machine Learning Techniques. IEEE Access 2019, 7, 81542–81554. [Google Scholar] [CrossRef]
- Wu, J.; Roy, J.; Stewart, W.F. Prediction modeling using EHR data: Challenges, strategies, and a comparison of machine learning approaches. Med. Care 2010, 48, S106–S113. [Google Scholar] [CrossRef] [PubMed]
- Tao, R.; Zhang, S.; Huang, X.; Tao, M.; Ma, J.; Ma, S.; Shen, C. Magnetocardiography-Based Ischemic Heart Disease Detection and Localization Using Machine Learning Methods. IEEE Trans. Biomed. Eng. 2018, 66, 1658–1667. [Google Scholar] [CrossRef] [PubMed]
- Pérez, J.; Pérez, A.; Casillas, A.; Gojenola, K. Cardiology record multi-label classification using latent Dirichlet allocation. Comput. Methods Programs Biomed. 2018, 164, 111–119. [Google Scholar] [CrossRef] [PubMed]
- Arabasadi, Z.; Alizadehsani, R.; Roshanzamir, M.; Moosaei, H.; Yarifard, A.A. Computer aided decision making for heart disease detection using hybrid neural network-Genetic algorithm. Comput. Methods Programs Biomed. 2017, 141, 19–26. [Google Scholar] [CrossRef]
- Kumar, V.; Garg, M.L. Deep learning in predictive analytics: A survey. In Proceedings of the 2017 International Conference on Emerging Trends in Computing and Communication Technologies (ICETCCT), Dehradun, India, 17–18 November 2017; pp. 1–6. [Google Scholar]
- Taslimitehrani, V.; Dong, G.; Pereira, N.L.; Panahiazar, M.; Pathak, J. Developing EHR-driven heart failure risk prediction models using CPXR (Log) with the probabilistic loss function. J. Biomed. Inform. 2016, 60, 260–269. [Google Scholar] [CrossRef]
- Bizopoulos, P.; Koutsouris, D. Deep Learning in Cardiology. IEEE Rev. Biomed. Eng. 2018, 12, 168–193. [Google Scholar] [CrossRef] [Green Version]
- Hsiao, H.C.; Chen, S.H.; Tsai, J.J. Deep learning for risk analysis of specific cardiovascular diseases using environmental data and outpatient records. In Proceedings of the 2016 IEEE 16th International Conference on Bioinformatics and Bioengineering (BIBE), Taichung, Taiwan, 31 October–2 November 2016; pp. 369–372. [Google Scholar]
- Manogaran, G.; Varatharajan, R.; Priyan, M.K. Hybrid recommendation system for heart disease diagnosis based on multiple kernel learning with adaptive neuro-fuzzy inference system. Multimed. Tools Appl. 2018, 77, 4379–4399. [Google Scholar] [CrossRef]
- Li, J.; Chen, Z.Z.; Huang, L.; Fang, M.; Li, B.; Fu, X.; Zhao, Q. Automatic classification of fetal heart rate based on convolutional neural network. IEEE Internet Things J. 2018, 6, 1394–1401. [Google Scholar] [CrossRef]
- Golgooni, Z.; Mirsadeghi, S.; Baghshah, M.S.; Ataee, P.; Baharvand, H.; Pahlavan, S.; Rabiee, H.R. Deep Learning-Based Proarrhythmia Analysis Using Field Potentials Recorded From Human Pluripotent Stem Cells Derived Cardiomyocytes. IEEE J. Transl. Eng. Health Med. 2019, 7, 1–9. [Google Scholar] [CrossRef]
- Maknickas, V.; Maknickas, A. Atrial fibrillation classification using qrs complex features and lstm. In Proceedings of the 2017 Computing in Cardiology (CinC), Rennes, France, 24–27 September 2017; pp. 1–4. [Google Scholar]
- Grzegorczyk, I.; Soliński, M.; Łepek, M.; Perka, A.; Rosiński, J.; Rymko, J.; Gierałtowski, J. PCG classification using a neural network approach. In Proceedings of the 2016 Computing in Cardiology Conference (CinC), Vancouver, BC, Canada, 11–14 September 2016; pp. 1129–1132. [Google Scholar]
- Bozkurt, B.; Germanakis, I.; Stylianou, Y. A study of time-frequency features for CNN-based automatic heart sound classification for pathology detection. Comput. Biol. Med. 2018, 100, 132–143. [Google Scholar] [CrossRef]
- Li, R.; Zhang, X.; Dai, H.; Zhou, B.; Wang, Z. Interpretability Analysis of Heartbeat Classification Based on Heartbeat Activity’s Global Sequence Features and BiLSTM-Attention Neural Network. IEEE Access 2019, 7, 109870–109883. [Google Scholar] [CrossRef]
- Lee, J.G.; Jun, S.; Cho, Y.W.; Lee, H.; Kim, G.B.; Seo, J.B.; Kim, N. Deep learning in medical imaging: General overview. Korean J. Radiol. 2017, 18, 570–584. [Google Scholar] [CrossRef] [PubMed] [Green Version]
- Mamoshina, P.; Vieira, A.; Putin, E.; Zhavoronkov, A. Applications of deep learning in biomedicine. Mol. Pharm. 2016, 13, 1445–1454. [Google Scholar] [CrossRef] [PubMed]
- Zhu, F.; Ye, F.; Fu, Y.; Liu, Q.; Shen, B. Electrocardiogram generation with a bidirectional LSTM-CNN generative adversarial network. Sci. Rep. 2019, 9, 1–11. [Google Scholar] [CrossRef] [PubMed] [Green Version]
- Li, L.J.; Niu, C.Q.; Pu, D.X.; Jin, X.Y. Electronic Medical Data Analysis Based on Word Vector and Deep Learning Model. In Proceedings of the 2018 9th International Conference on Information Technology in Medicine and Education (ITME), Hangzhou, China, 19–21 October 2018; pp. 484–487. [Google Scholar]
- Chen, C.W.; Tseng, S.P.; Kuan, T.W.; Wang, J.F. Outpatient Text Classification Using Attention-Based Bidirectional LSTM for Robot-Assisted Servicing in Hospital. Information 2020, 11, 106. [Google Scholar] [CrossRef] [Green Version]
- Miao, K.H.; Miao, J.H.; Miao, G.J. Diagnosing coronary heart disease using ensemble machine learning. Int. J. Adv. Comput. Sci. Appl. (IJACSA) 2016, 7, 30–39. [Google Scholar]
- Yekkala, I.; Dixit, S.; Jabbar, M.A. Prediction of heart disease using ensemble learning and Particle Swarm Optimization. In Proceedings of the 2017 International Conference on Smart Technologies for Smart Nation (SmartTechCon), Bengaluru, India, 17–19 August 2017; pp. 691–698. [Google Scholar]
- Das, R.; Turkoglu, I.; Sengur, A. Effective diagnosis of heart disease through neural network ensembles. Expert Syst. Appl. 2009, 36, 7675–7680. [Google Scholar] [CrossRef]
- Das, R.; Turkoglu, I.; Sengur, A. Diagnosis of valvular heart disease through neural network ensembles. Comput. Methods Programs Biomed. 2009, 93, 185–191. [Google Scholar] [CrossRef]
- Wang, L.; Zhou, W.; Chang, Q.; Chen, J.; Zhou, X. Deep Ensemble Detection of Congestive Heart Failure using Short-term RR Intervals. IEEE Access 2019, 7, 69559–69574. [Google Scholar] [CrossRef]
- Altan, G.; Kutlu, Y.; Allahverdi, N. A new approach to early diagnosis of congestive heart failure disease by using Hilbert–Huang transform. Comput. Methods Programs Biomed. 2016, 137, 23–34. [Google Scholar] [CrossRef]
- Batista, G.E.; Prati, R.C.; Monard, M.C. A study of the behavior of several methods for balancing machine learning training data. ACM SIGKDD Explor. Newsl. 2004, 6, 20–29. [Google Scholar] [CrossRef]
- Wosiak, A.; Karbowiak, S. Preprocessing compensation techniques for improved classification of imbalanced medical datasets. In Proceedings of the 2017 Federated Conference on Computer Science and Information Systems (FedCSIS), Prague, Czech Republic, 3–6 September 2017; pp. 203–211. [Google Scholar]
- Ge, H.; Sun, K.; Sun, L.; Zhao, M.; Wu, C. A selective ensemble learning framework for ECG-based heartbeat classification with imbalanced data. In Proceedings of the 2018 IEEE International Conference on Bioinformatics and Biomedicine (BIBM), Madrid, Spain, 3–6 December 2018; pp. 2753–2755. [Google Scholar]
- LeCun, Y.; Bengio, Y.; Hinton, G. Deep learning. Nature 2015, 521, 436. [Google Scholar] [CrossRef] [PubMed]
- Jain, A.; Zamir, A.R.; Savarese, S.; Saxena, A. Structural-RNN: Deep learning on spatio-temporal graphs. In Proceedings of the IEEE Conference on Computer Vision and Pattern Recognition, Las Vegas, NV, USA, 26 June–1 July 2016; pp. 5308–5317. [Google Scholar]
- Hochreiter, S.; Schmidhuber, J. Long short-term memory. Neural Comput. 1997, 9, 1735–1780. [Google Scholar] [CrossRef] [PubMed]
- Chung, J.; Gulcehre, C.; Cho, K.; Bengio, Y. Gated feedback recurrent neural network. In Proceedings of the 2015 International Conference on Machine Learning, Lille, France, 6–11 July 2015; pp. 2067–2075. [Google Scholar]
- Dal Pozzolo, A.; Caelen, O.; Johnson, R.A.; Bontempi, G. Calibrating probability with undersampling for unbalanced classification. In Proceedings of the 2015 IEEE Symposium Series on Computational Intelligence, Cape Town, South Africa, 8–10 December 2015; pp. 159–166. [Google Scholar]
- Fernández, A.; Garcia, S.; Herrera, F.; Chawla, N.V. SMOTE for learning from imbalanced data: Progress and challenges, marking the 15-year anniversary. J. Artif. Intell. Res. 2018, 61, 863–905. [Google Scholar] [CrossRef]
- Liang, T.; Xu, X.; Xiao, P. A new image classification method based on modified condensed nearest neighbor and convolutional neural network. Pattern Recognit. Lett. 2017, 94, 105–111. [Google Scholar] [CrossRef]
- Yu, Y.; Lin, H.; Meng, J.; Wei, X.; Zhao, Z. Assembling deep neural networks for medical compound figure detection. Information 2017, 8, 48. [Google Scholar] [CrossRef] [Green Version]
- King, R.D.; Ouali, M.; Strong, A.T.; Aly, A.; Elmaghraby, A.; Kantardzic, M.; Page, D. Is it better to combine predictions? Protein Eng. 2000, 13, 15–19. [Google Scholar] [CrossRef] [Green Version]
- Zeng, Z.Y.; Lin, J.J.; Chen, M.S.; Chen, M.H.; Lan, Y.Q.; Liu, J.L. A Review Structure Based Ensemble Model for Deceptive Review Spam. Information 2019, 10, 243. [Google Scholar] [CrossRef] [Green Version]
- Lin, W.C.; Tsai, C.F.; Hu, Y.H.; Jhang, J.S. Clustering-based undersampling in class-imbalanced data. Inf. Sci. 2017, 409, 17–26. [Google Scholar] [CrossRef]
- Loyola-González, O.; Martínez-Trinidad, J.F.; Carrasco-Ochoa, J.A.; García-Borroto, M. Study of the impact of resampling methods for contrast pattern based classifiers in imbalanced databases. Neurocomputing 2016, 175, 935–947. [Google Scholar] [CrossRef]


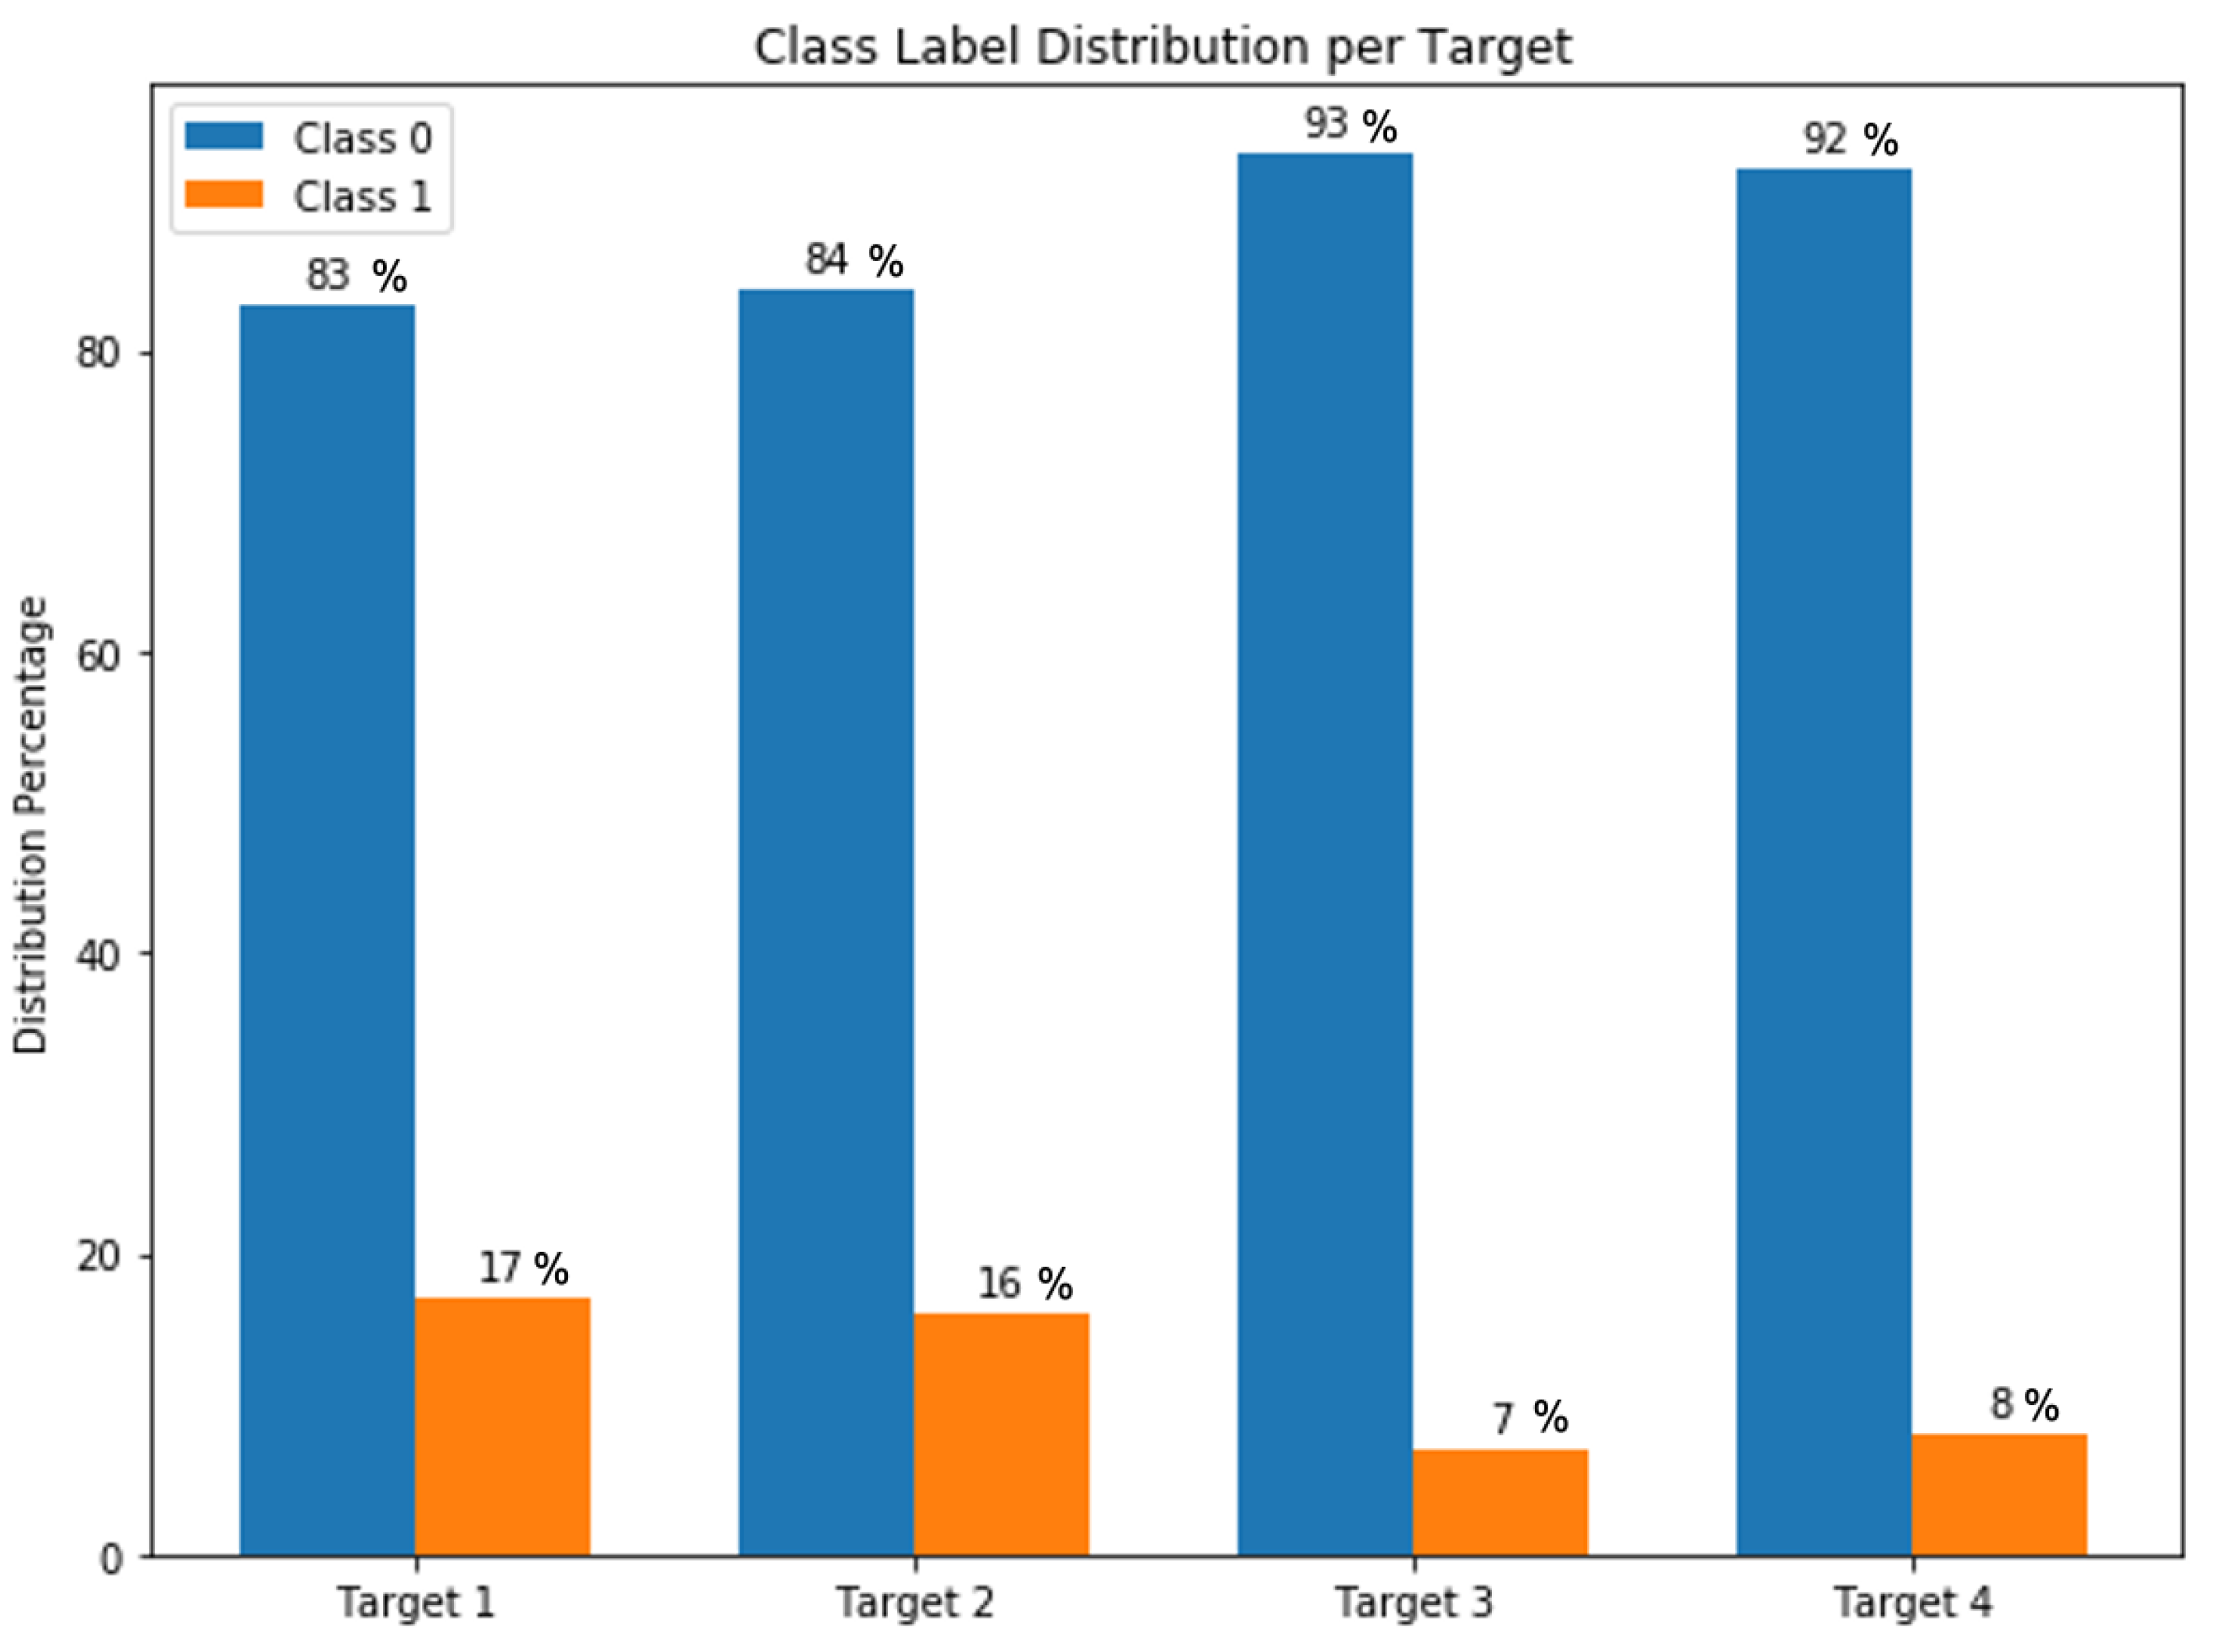
| Type 1 | CARDIOPATIA_HIPERTENSIVA (Hypertensive Heart disease) | It refers to heart problems that occur due to high blood pressure that remain for a long time. |
| Type 2 | CARDIOPATIA_ISQUEMICA (Ischemic Heart disease) | It is also called “coronary artery disease” and “coronary heart disease”; the term applies to cardiac problems caused by narrowed heart arteries. |
| Type 3 | CARDIOPATIA_MIXTA (Mixed Heart disease) | It is known as the combined systolic and diastolic heart failure, which refers to the first presentation of mixed connective tissue disease. |
| Type 4 | CARDIOPATIA_VALVULAR (Valvular Heart disease) | It occurs mainly in the elderly and is characterized by a narrowing of the aortic valve opening which increases resistance to blood flow. |
| Gender | Gender Female | Gender Male |
|---|---|---|
| Female | 1 | 0 |
| Male | 0 | 1 |
| Age | Age Category | Age Category Code |
|---|---|---|
| <20 | 0–20 | 1 |
| >20 and <40 | 20–40 | 2 |
| >40 and <60 | 40–60 | 3 |
| >60 and <80 | 60–80 | 4 |
| >80 | 80–100 | 5 |
| Dataset | Size | Method | Features | Features Index |
|---|---|---|---|---|
| Initial Dataset | 800 | — | 141 | All |
| Original Dataset | 798 | Cleaned with full features | 141 | All |
| Subset 1 | 798 | Model-Based Selection (Random Forest Classifier) | 60 | 1, 2, 3, 4, 5, 6, 7, 8, 10, 11, 12, 13, 16, 17, 20, 21, 23, 24, 25, 28, 29, 30, 31, 32, 38, 39, 44, 47, 48, 50, 54, 57, 60, 62, 69, 70, 74, 79, 89, 90, 97, 99, 100, 101, 102, 108, 115, 116, 122, 127, 128, 129, 131, 132, 136, 137, 138, 139, 140, 141 |
| Subset 2 | 798 | Recursive Feature Elimination (RFE) | 98 | 1, 2, 3, 4, 5, 6, 7, 8, 9, 10, 11, 13, 14, 16, 19, 20, 25, 26, 27, 29, 30, 31, 33, 34, 35, 36, 37, 38, 39, 40, 41, 42, 43, 45, 46, 47, 48, 49, 50, 51, 54, 55, 56, 59, 61, 62, 63, 64, 65, 66, 71, 75, 76, 77, 78, 80, 83, 84, 85, 86, 87, 88, 89, 91, 93, 94, 95, 97, 98, 99, 103, 104, 105, 106, 107, 109, 110, 111, 112, 114, 116, 118, 119, 120, 121, 122, 124, 125, 126, 129, 131, 132, 133, 135, 136, 137, 138, 139 |
| Subset 3 | 798 | 39 | 1, 2, 3, 4, 5, 6, 7, 8, 10, 11, 13, 16, 20, 25, 29, 30, 31, 38, 39, 47, 48, 50, 54, 55, 62, 89, 91, 97, 99, 107, 114, 116, 122, 129, 131, 136, 137, 138, 139 |
| True Class 0 | True Class 1 | |
|---|---|---|
| Predicted Class 0 | tp (true positive) | fp (false positive) |
| Predicted Class 1 | fn (false negative) | tn (true negative) |
| Target | Models | P | R | F1 | ACC | AUC |
|---|---|---|---|---|---|---|
| Target 1 | MLP | 0.81 | 0.57 | 0.66 | 0.57 | 0.59 |
| CNN | 0.39 | 0.62 | 0.48 | 0.62 | 0.62 | |
| LSTM | 0.86 | 0.67 | 0.74 | 0.67 | 0.65 | |
| GRU | 0.82 | 0.62 | 0.70 | 0.62 | 0.71 | |
| BiLSTM | 0.82 | 0.67 | 0.74 | 0.67 | 0.74 | |
| BiGRU | 0.76 | 0.87 | 0.81 | 0.87 | 0.79 | |
| Target 2 | MLP | 0.71 | 0.62 | 0.65 | 0.62 | 0.67 |
| CNN | 0.80 | 0.69 | 0.72 | 0.69 | 0.75 | |
| LSTM | 0.81 | 0.76 | 0.78 | 0.76 | 0.77 | |
| GRU | 0.62 | 0.79 | 0.69 | 0.79 | 0.79 | |
| BiLSTM | 0.70 | 0.84 | 0.76 | 0.84 | 0.81 | |
| BiGRU | 0.82 | 0.81 | 0.81 | 0.81 | 0.82 | |
| Target 3 | MLP | 0.95 | 0.62 | 0.93 | 0.62 | 0.63 |
| CNN | 0.47 | 0.69 | 0.56 | 0.69 | 0.67 | |
| LSTM | 0.88 | 0.74 | 0.79 | 0.74 | 0.79 | |
| GRU | 0.94 | 0.75 | 0.83 | 0.75 | 0.82 | |
| BiLSTM | 0.96 | 0.8 | 0.87 | 0.8 | 0.88 | |
| BiGRU | 0.96 | 0.79 | 0.86 | 0.79 | 0.86 | |
| Target 4 | MLP | 0.96 | 0.72 | 0.8 | 0.72 | 0.71 |
| CNN | 0.85 | 0.75 | 0.78 | 0.75 | 0.78 | |
| LSTM | 0.85 | 0.77 | 0.8 | 0.77 | 0.74 | |
| GRU | 0.83 | 0.8 | 0.81 | 0.8 | 0.82 | |
| BiLSTM | 0.80 | 0.81 | 0.80 | 0.81 | 0.80 | |
| BiGRU | 0.76 | 0.87 | 0.82 | 0.87 | 0.85 |
| Target | Dataset | P | R | F1 | ACC |
|---|---|---|---|---|---|
| Target 1 | Original Dataset | 0.88 | 0.91 | 0.89 | 0.90 |
| Subset 1 | 0.99 | 0.96 | 0.98 | 0.98 | |
| Subset 2 | 0.93 | 0.96 | 0.95 | 0.94 | |
| Subset 3 | 0.90 | 0.99 | 0.95 | 0.94 | |
| Target 2 | Original Dataset | 0.96 | 0.83 | 0.89 | 0.88 |
| Subset 1 | 0.96 | 0.92 | 0.94 | 0.94 | |
| Subset 2 | 0.95 | 0.88 | 0.91 | 0.92 | |
| Subset 3 | 0.92 | 0.96 | 0.94 | 0.94 | |
| Target 3 | Original Dataset | 0.90 | 0.77 | 0.87 | 0.88 |
| Subset 1 | 0.99 | 0.84 | 0.91 | 0.92 | |
| Subset 2 | 0.98 | 0.95 | 0.90 | 0.92 | |
| Subset 3 | 0.99 | 0.90 | 0.90 | 0.91 | |
| Target 4 | Original Dataset | 0.70 | 0.87 | 0.77 | 0.85 |
| Subset 1 | 0.99 | 0.88 | 0.93 | 0.92 | |
| Subset 2 | 0.93 | 0.88 | 0.90 | 0.88 | |
| Subset 3 | 0.85 | 0.99 | 0.91 | 0.88 |
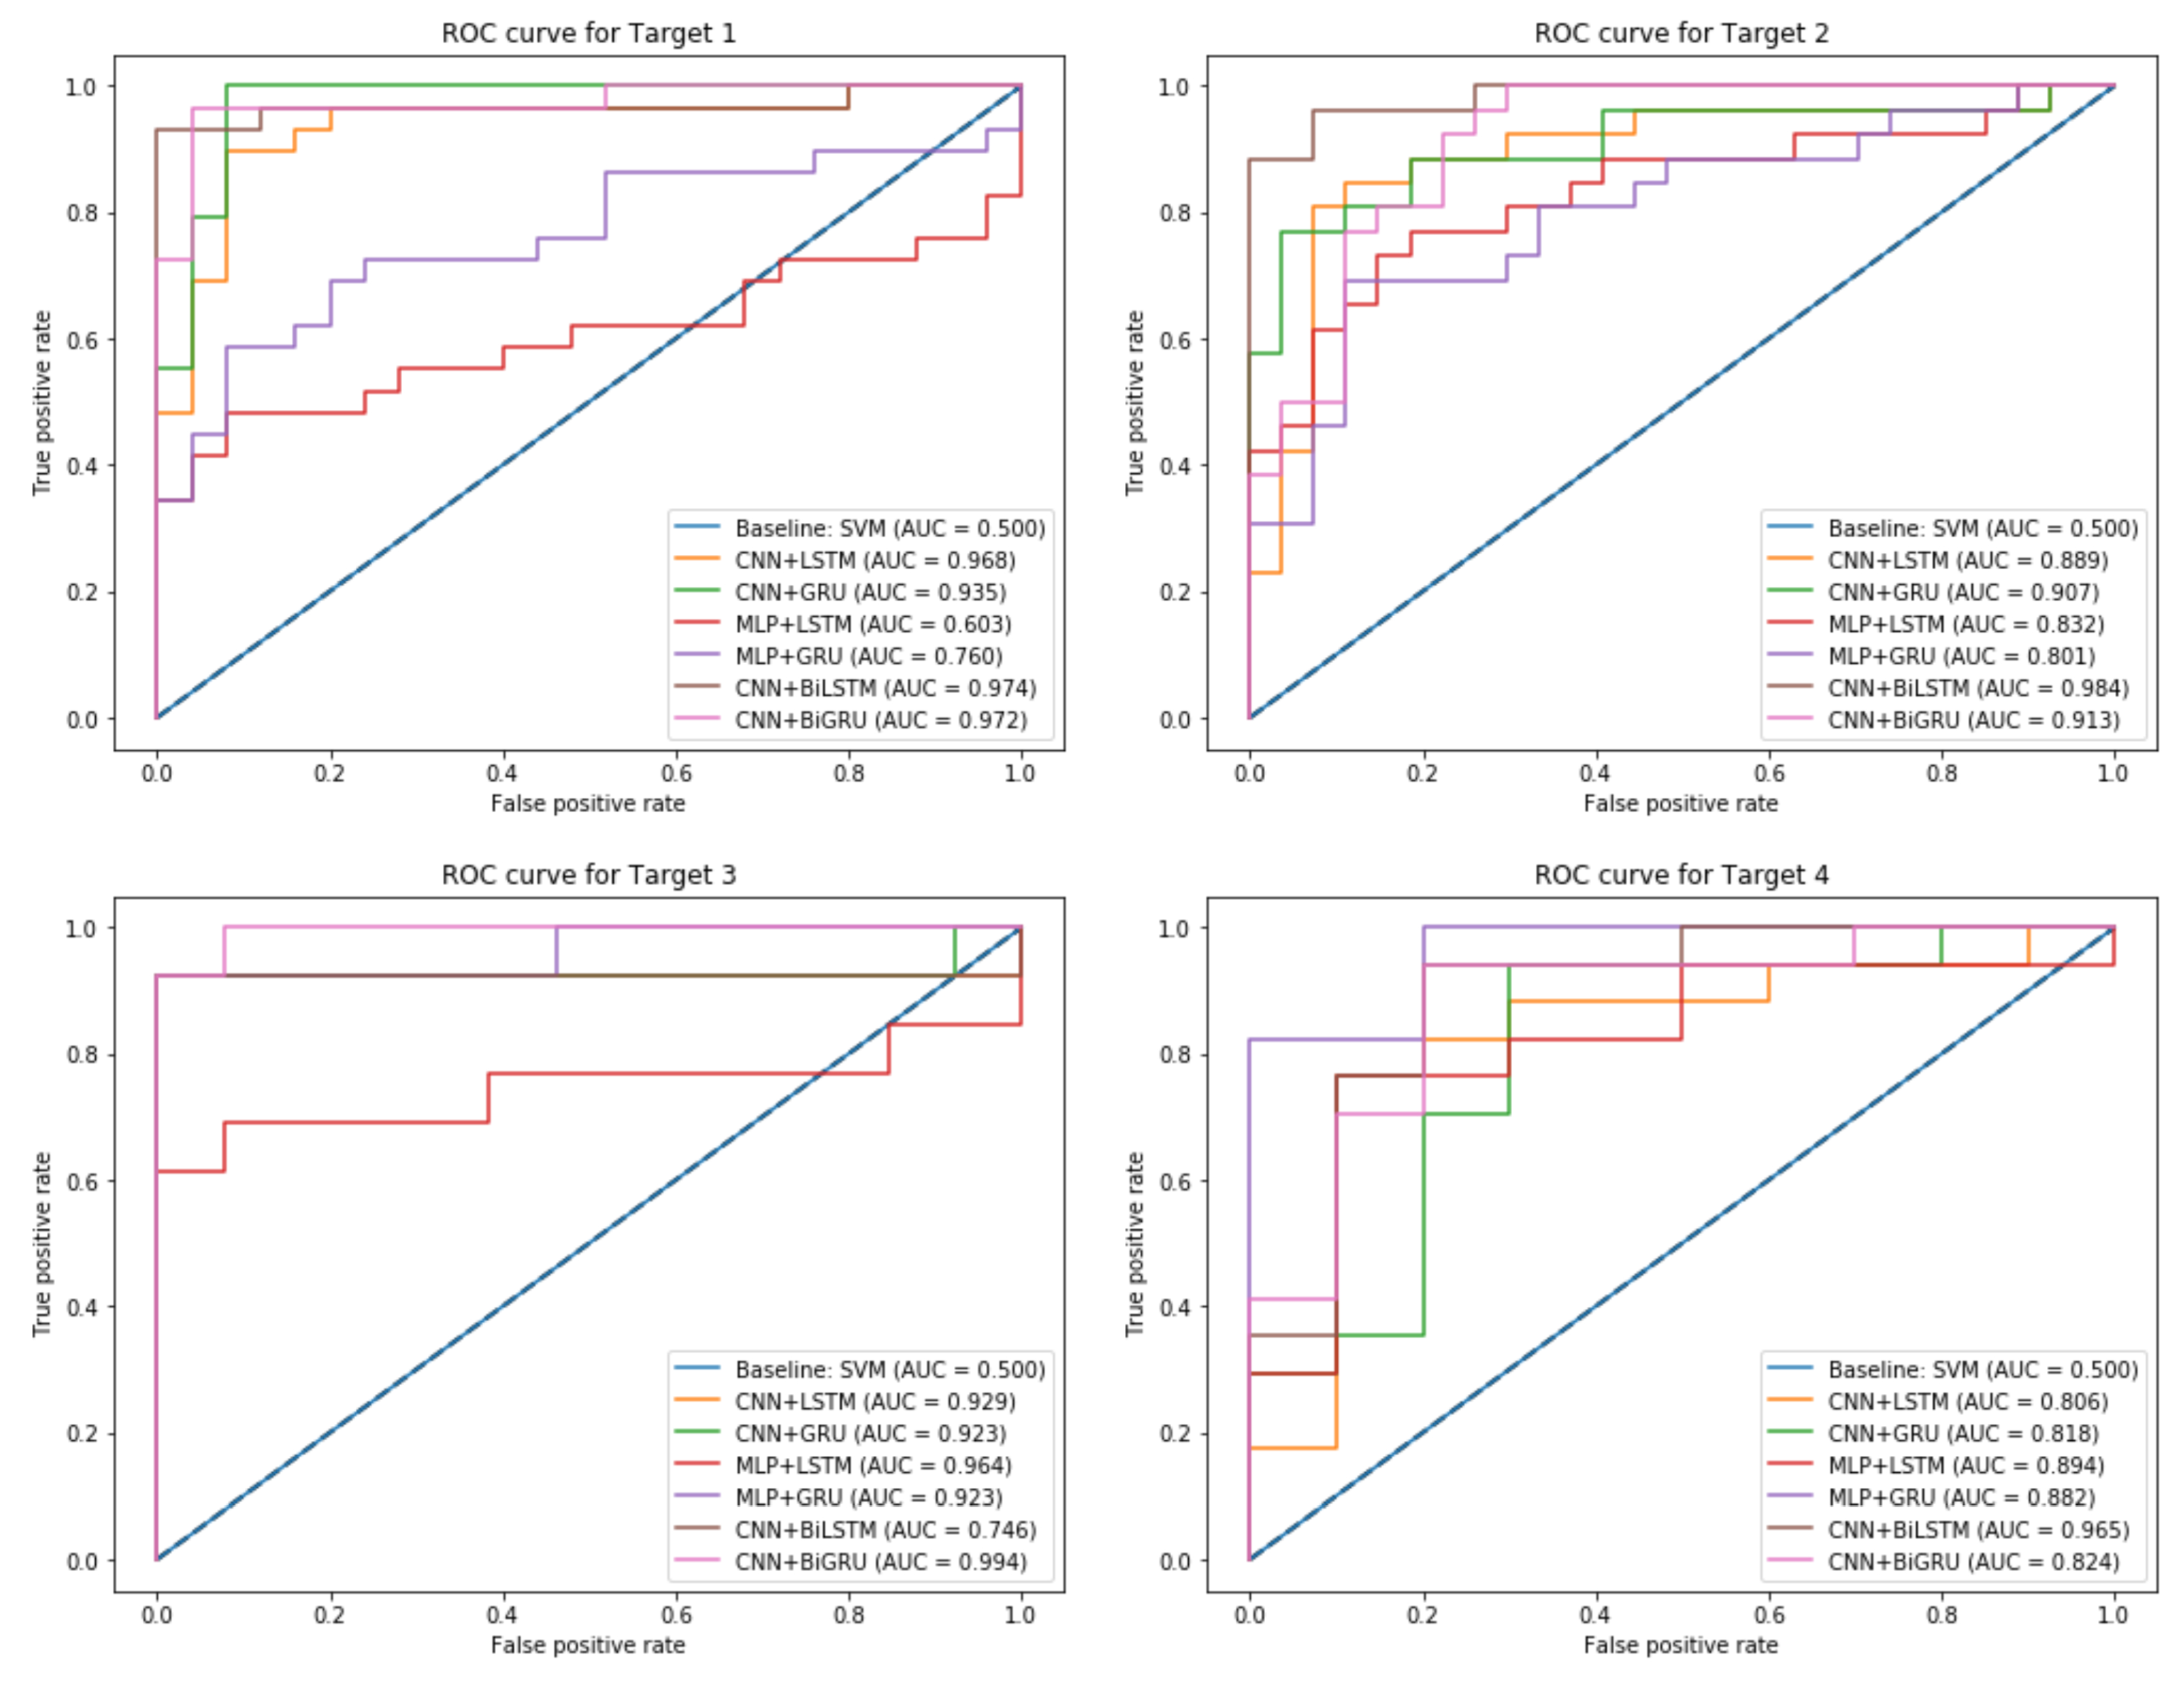
| Target | Models | P | R | F1 | ACC | AUC |
|---|---|---|---|---|---|---|
| Target 1 | Baseline: SVM | 0.64 | 0.56 | 0.57 | 0.62 | 0.50 |
| CNN + LSTM | 0.88 | 0.91 | 0.89 | 0.90 | 0.97 | |
| CNN + GRU | 0.84 | 0.84 | 0.83 | 0.85 | 0.93 | |
| MLP + LSTM | 0.84 | 0.87 | 0.85 | 0.87 | 0.60 | |
| MLP + GRU | 0.92 | 0.85 | 0.88 | 0.89 | 0.76 | |
| CNN + BiLSTM | 0.90 | 0.96 | 0.93 | 0.92 | 0.97 | |
| CNN + BiGRU | 0.92 | 0.85 | 0.88 | 0.89 | 0.97 | |
| Target 2 | Baseline: SVM | 0.51 | 0.90 | 0.68 | 0.68 | 0.50 |
| CNN + LSTM | 0.96 | 0.83 | 0.89 | 0.88 | 0.89 | |
| CNN + GRU | 0.92 | 0.83 | 0.87 | 0.86 | 0.90 | |
| MLP + LSTM | 0.88 | 0.85 | 0.87 | 0.86 | 0.83 | |
| MLP + GRU | 0.89 | 0.89 | 0.89 | 0.88 | 0.80 | |
| CNN + BiLSTM | 0.88 | 0.96 | 0.92 | 0.92 | 0.98 | |
| CNN + BiGRU | 0.88 | 0.92 | 0.90 | 0.90 | 0.91 | |
| Target 3 | Baseline: SVM | 0.52 | 0.90 | 0.68 | 0.52 | 0.50 |
| CNN + LSTM | 0.90 | 0.92 | 0.94 | 0.95 | 0.93 | |
| CNN + GRU | 0.99 | 0.84 | 0.91 | 0.92 | 0.92 | |
| MLP + LSTM | 0.96 | 1.0 | 0.92 | 0.96 | 0.96 | |
| MLP + GRU | 0.88 | 1.0 | 0.76 | 0.86 | 0.92 | |
| CNN + BiLSTM | 0.88 | 0.88 | 0.88 | 0.85 | 0.74 | |
| CNN + BiGRU | 0.99 | 0.92 | 0.95 | 0.96 | 0.99 | |
| Target 4 | Baseline: SVM | 0.63 | 0.88 | 0.69 | 0.61 | 0.50 |
| CNN + LSTM | 0.70 | 0.87 | 0.77 | 0.85 | 0.80 | |
| CNN + GRU | 0.80 | 0.80 | 0.81 | 0.85 | 0.82 | |
| MLP + LSTM | 0.85 | 0.84 | 0.94 | 0.88 | 0.89 | |
| MLP + GRU | 0.90 | 0.81 | 0.85 | 0.88 | 0.88 | |
| CNN + BiLSTM | 0.88 | 0.88 | 0.94 | 0.91 | 0.96 | |
| CNN + BiGRU | 0.80 | 0.88 | 0.84 | 0.88 | 0.82 |
© 2020 by the authors. Licensee MDPI, Basel, Switzerland. This article is an open access article distributed under the terms and conditions of the Creative Commons Attribution (CC BY) license (http://creativecommons.org/licenses/by/4.0/).
Share and Cite
Baccouche, A.; Garcia-Zapirain, B.; Castillo Olea, C.; Elmaghraby, A. Ensemble Deep Learning Models for Heart Disease Classification: A Case Study from Mexico. Information 2020, 11, 207. https://0-doi-org.brum.beds.ac.uk/10.3390/info11040207
Baccouche A, Garcia-Zapirain B, Castillo Olea C, Elmaghraby A. Ensemble Deep Learning Models for Heart Disease Classification: A Case Study from Mexico. Information. 2020; 11(4):207. https://0-doi-org.brum.beds.ac.uk/10.3390/info11040207
Chicago/Turabian StyleBaccouche, Asma, Begonya Garcia-Zapirain, Cristian Castillo Olea, and Adel Elmaghraby. 2020. "Ensemble Deep Learning Models for Heart Disease Classification: A Case Study from Mexico" Information 11, no. 4: 207. https://0-doi-org.brum.beds.ac.uk/10.3390/info11040207