Article

Recognizing Indonesian Acronym and Expansion Pairs with Supervised Learning and MapReduce

1
Department of Informatics, Universitas Syiah Kuala, Banda Aceh 23111, Indonesia
2
Department of Electrical and Computer Engineering, Universitas Syiah Kuala, Banda Aceh 23111, Indonesia
3
Department of Statistics, Universitas Syiah Kuala, Banda Aceh 23111, Indonesia
*
Author to whom correspondence should be addressed.
Submission received: 10 February 2020 / Revised: 3 April 2020 / Accepted: 10 April 2020 / Published: 15 April 2020
(This article belongs to the Section Information and Communications Technology)

Abstract

:
During the previous decades, intelligent identification of acronym and expansion pairs from a large corpus has garnered considerable research attention, particularly in the fields of text mining, entity extraction, and information retrieval. Herein, we present an improved approach to recognize the accurate acronym and expansion pairs from a large Indonesian corpus. Generally, an acronym can be either a combination of uppercase letters or a sequence of speech sounds (syllables). Our proposed approach can be computationally divided into four steps: (1) acronym candidate identification; (2) acronym and expansion pair collection; (3) feature generation; and (4) acronym and expansion pair recognition using supervised learning techniques. Further, we introduce eight numerical features and evaluate their effectiveness in representing the acronym and expansion pairs based on the precision, recall, and F-measure. Furthermore, we compare the k-nearest neighbors (K-NN), support vector machine (SVM), and bidirectional encoder representations from transformers (BERT) algorithms in terms of accurate acronym and expansion pair classification. The experimental results indicate that the SVM polynomial model that considers eight features exhibits the highest accuracy (97.93%), surpassing those of the SVM polynomial model that considers five features (90.45%), the K-NN algorithm with k = 3 that considers eight features (96.82%), the K-NN algorithm with k = 3 that considers five features (95.66%), BERT-Base model (81.64%), and BERT-Base Multilingual Cased model (88.10%). Moreover, we analyze the performance of the Hadoop technology using various numbers of data nodes to identify the acronym and expansion pairs and obtain their feature vectors. The results reveal that the Hadoop cluster containing a large number of data nodes is faster than that with fewer data nodes when processing from ten million to one hundred million pairs of acronyms and expansions.

1. Introduction

Big data can be distinguished based on the large amount of digital data that is being created at an unprecedented rate by humans, sensor networks, mobile telecommunications, the Internet of Things, and many other heterogeneous devices [1,2,3,4]. These data exist in the form of query logs [5,6]; transaction records in database [7]; images, videos, and audios; abstracts of digital manuscripts; webpages; and microblog posts [8]. The accumulation of mobile telecommunication data has been predicted to considerably increase with the increasing number of smartphone users, which is predicted to reach 6.1 billion users in 2020 [9]. Furthermore, new online trading trends have contributed to the rapid accumulation of records in databases by ecommerce companies, such as Alibaba and Amazon, which generate and store several terabytes of data every day [7]. The analysis of a large amount of data requires machine learning techniques to automate the creation of analytical models based on historical data and then use the model for learning from the data [10], discovering useful patterns [11], and performing automated decisions with little human intervention [12]. Many queries are posed by millions of users from across the globe each day on Google’s search engine, which has attracted considerable attention from researchers who have analyzed the query logs using machine learning techniques to track and predict phenomena, including the spread patterns of flu symptoms in the United States [5,6]. The web search queries are considered to be less biased and more effective data sources for analysis because they are randomly submitted by users from different regions.
Another challenging problem is the intelligent identification of the acronym and expansion pairs in large unstructured documents. Many approaches, such as the letter-matching techniques [13], heuristic extraction algorithms [14], hybrid text mining approaches [15], statistical learning approaches using logistic regression [16], supervised learning with weaker constraints [17], machine learning approaches [18], and mining and ranking approaches [19], have been introduced in the previous two decades to identify acronyms and their definitions because the acronym writing and formation rules generally differ for different languages. Furthermore, several methods have been developed to identify accurate acronyms and expansions from specific data sources such as biomedical literature [16], the Internet [20], and Wikipedia [21]. Various approaches to recognize the accurate acronyms and their definitions in specific languages have been introduced in previously conducted studies [22,23].
Herein, we extend the studies conducted by Wahyudi et al. [23] and Abidin et al. [24] and propose the recognition of acronym and expansion pairs from a large Indonesian corpus using machine learning techniques and the Hadoop big data technology. An acronym can be a combination of uppercase letters of the first letter in an expansion or a sequence of syllables [25]. A previously conducted study [23] successfully recognized the acronym and expansion pairs by the K-NN method using five feature vectors; however, their method failed to identify the accurate acronyms of the typed initialisms, i.e., acronyms that are pronounceable as words such as “Pilkada” (“regional election” in English), “Damkar” (“firefighters”), and “Kemendagri” (“Ministry of Home Affairs”). In this study, we used all the numerical features introduced by Wahyudi et al. [23] with some modifications to accommodate the acronyms of the typed initialisms and introduced three additional new features to improve accuracy. This study and a previously conducted study [24] used the Hadoop MapReduce technology to expedite the processing time associated with the generation of numerical features and candidate acronym and expansion pairs. However, in this analysis, more data nodes were added into the Hadoop ecosystem, and the performance evaluation for several different datasets was conducted on an improved machine specification. Each data node has an 8-core 2 GHz processor, 16 GB memory, 200 GB storage, and a Centos7 (x86 64) operating system. Our contributions are as follows:
  • We introduce eight continuous features to represent the acronym and expansion pairs, which differ from the feature vectors introduced by Chang et al. [16] for scoring abbreviations. The first five features were initially proposed by Wahyudi et al. [23]; however, in this study, two of these features are modified to accommodate the acronyms of typed initialisms, whereas the remaining three are new features that have been introduced to improve the accuracy. The three new features measure the ratio of accurate matching between the characters in the expansion and those in the acronym; furthermore, they can distinguish between accurate and inaccurate ratios. The formulas and their definitions are discussed in Section 4.
  • We compare the performance of several supervised learning algorithms, namely SVM [26], K-NN [27], and Bidirectional Encoder Representations from Transformers (BERT) [28], to automatically determine the accurate acronym and expansion pairs from a large Indonesian corpus based on precision, recall, and F-measure. Further, we measure the performance of the SVM using several different kernels, the performance of K-NN using various k values, and the performance of BERT-Base and BERT-Base Multilingual Cased models [28].
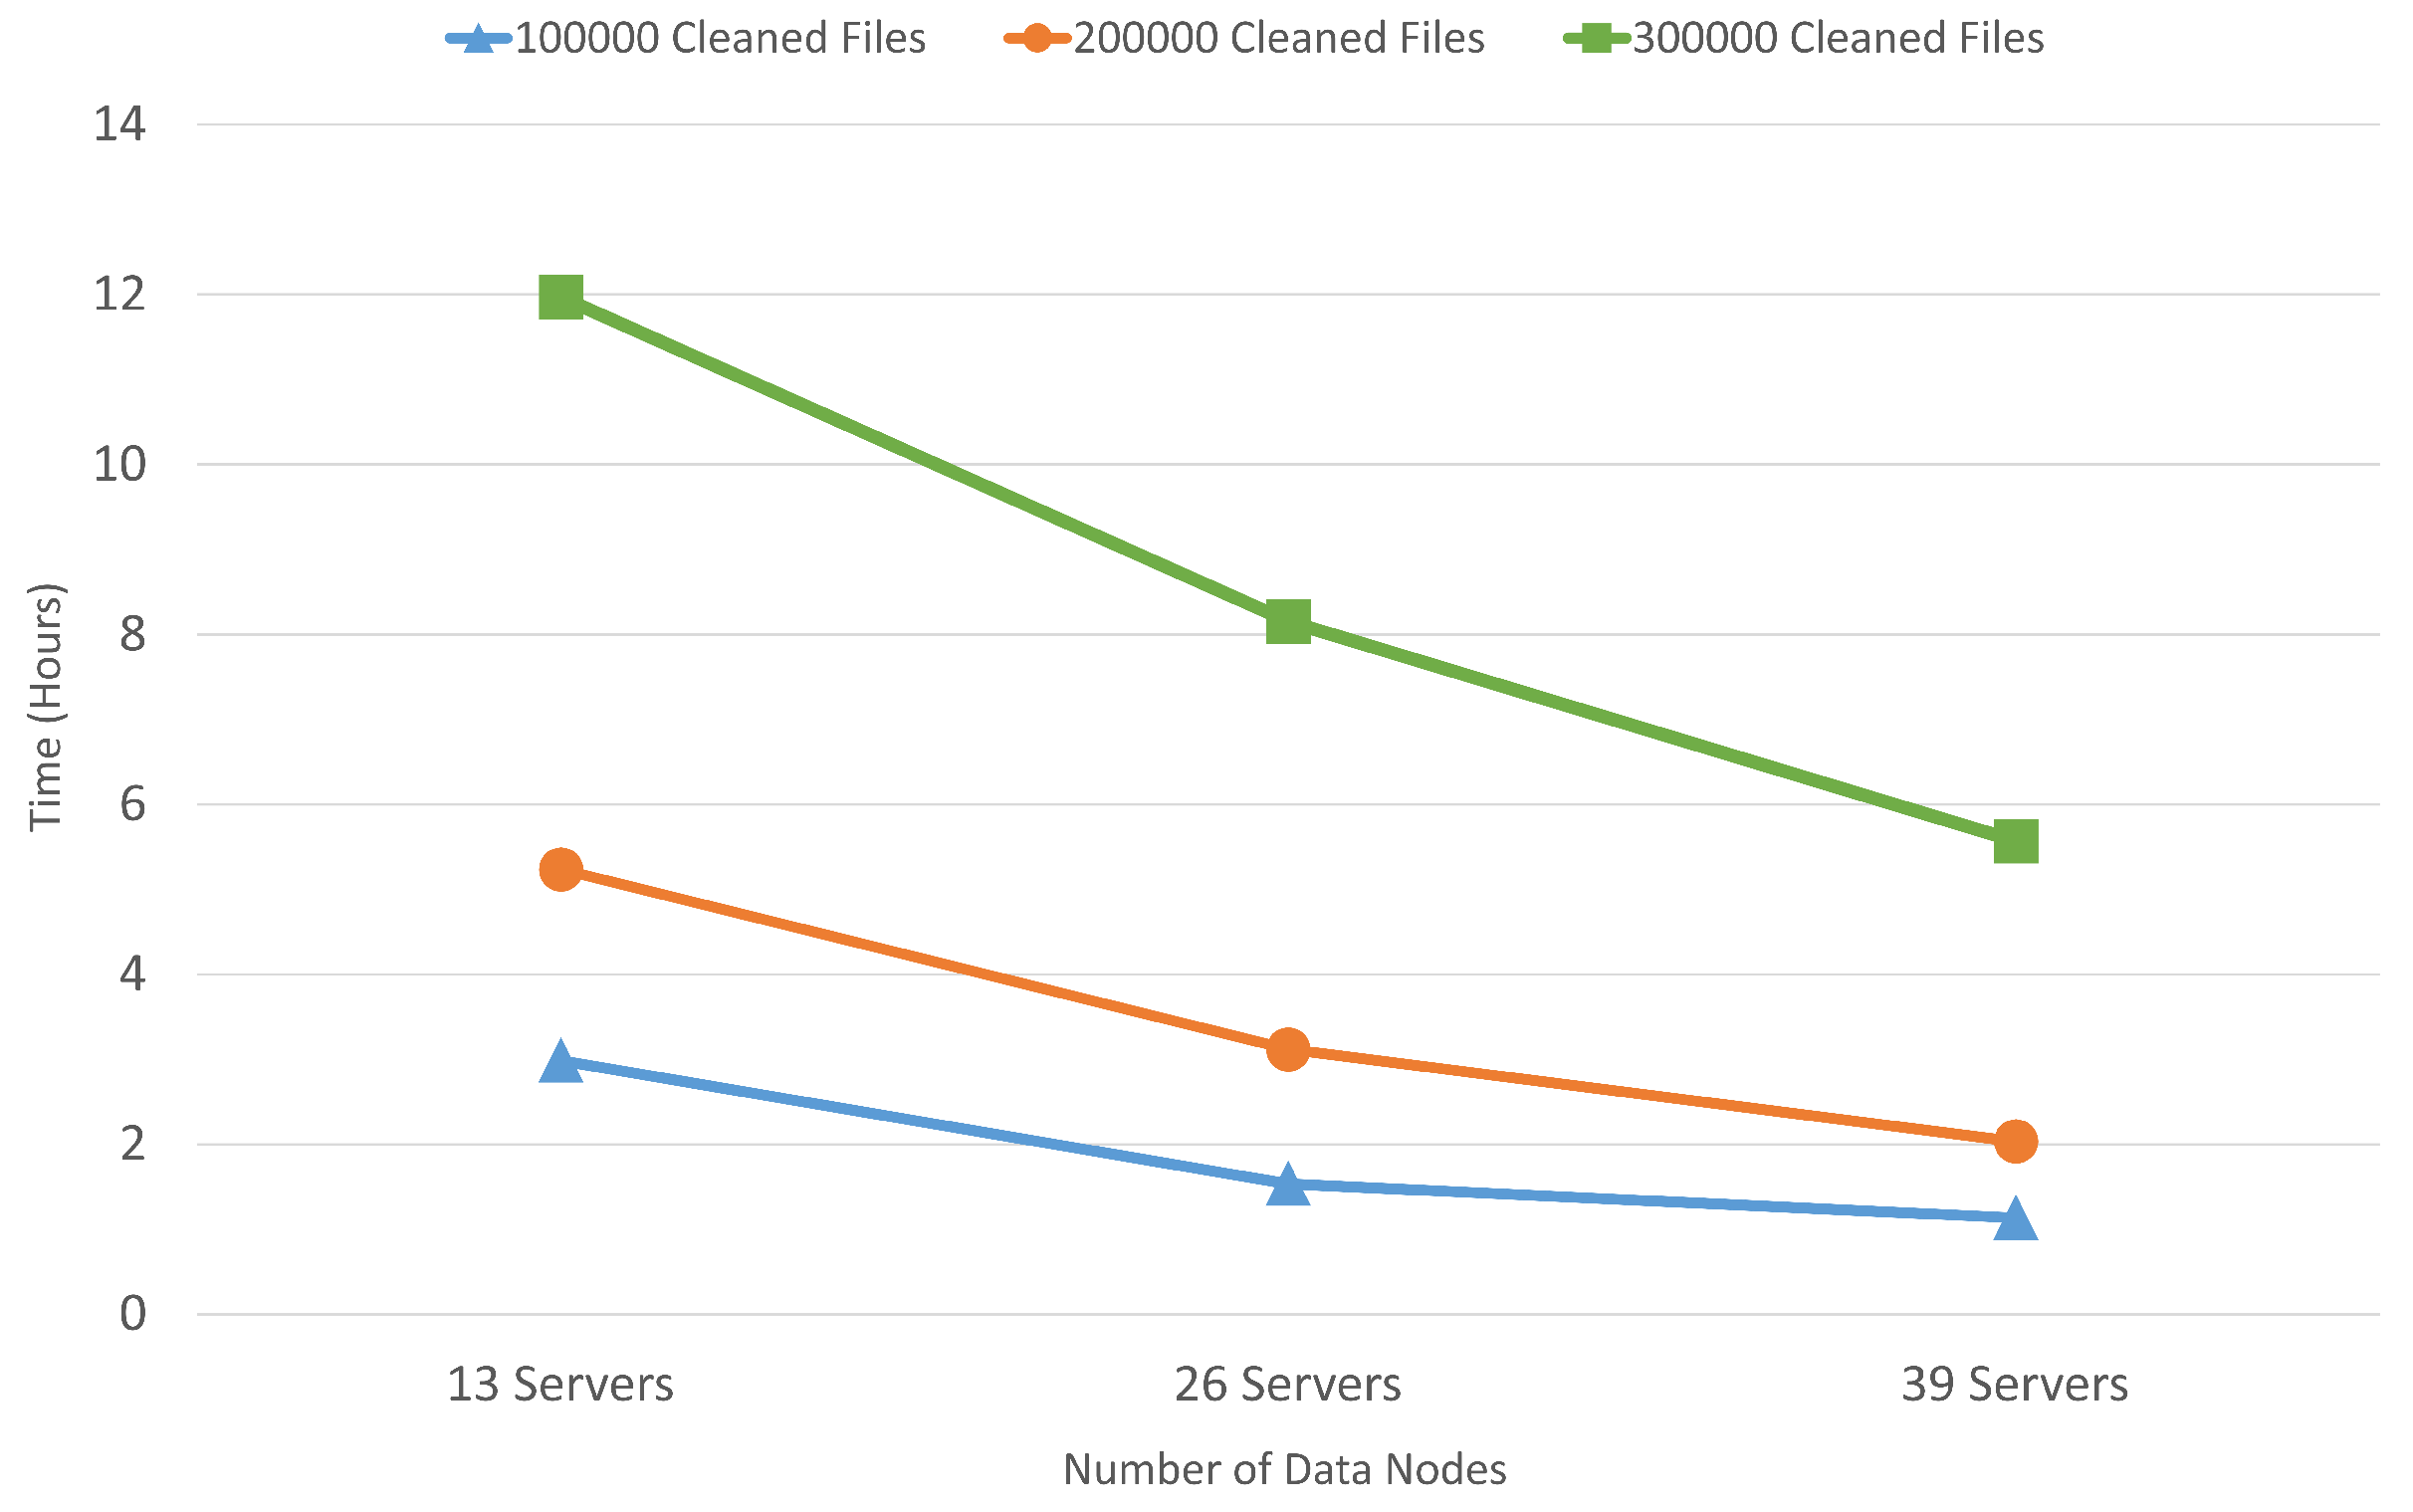
  • We evaluate the throughput of the big data technology under different data nodes using Hadoop MapReduce to construct the candidate pairs of acronym and expansion and obtain their feature vectors.
This article is organized as follows. In Section 2, the discussion of several related works (literature review) is presented. In Section 3, we present an approach to recognize potential acronym and expansion pairs, and we discuss the new definitions and formulas of the eight numerical features in Section 4. Further, we present our methodology in Section 5, results and discussions in Section 6, and conclusions in Section 7.

2. Related Works

An automated method, known as the acronym finding program (AFP), was introduced by Taghva et al. [13] to recognize the acronym and expansion pairs in unstructured texts. An acronym and its expansion can be recognized by matching the acronym’s characters with the initial letter of each word in the definition based on a certain confidence level. If the confidence level is above the given threshold, the matching is acceptable. The AFP demonstrated high accuracy and was tested using 1328 text files.
Park et al. [15] introduced a hybrid text mining approach based on the abbreviation pattern rules, linguistic cue words, and text markers that were specifically designed for documents containing English text. The pattern rules specify the manner in which each character in an acronym is formed from the expansion. The text markers are symbols that are often used to describe the relation of an acronym and its expansion, whereas the linguistic cue words are words that are frequently used to relate the abbreviation and its definition such as “short”, “stand”, and “or”. They verified their hybrid approach using three different types of documents: automotive technical books, pharmaceutical books, and National Aeronautics and Space Administration (NASA) press releases; moreover, they determined that their method exhibited high recall and precision rates.
Another statistical learning method to identify the acronym and expansion pairs in biomedical literature was proposed by Chang et al. [16]. This method is divided into four main steps: identifying possible abbreviations, aligning the abbreviations with their prefix strings, computing their feature vectors, and scoring them using logistic regression. Although the overall accuracy is high with a precision of 99% and a recall rate of 82%, the researchers discovered that errors occurred with respect to MEDLINE because of the presence of synonyms and words with identical meanings; therefore, the algorithm failed when examining the correspondences between letters, which is a major drawback of the letter-matching techniques [16]. Furthermore, Nadeau et al. [17] proposed supervised learning with weak constraints to detect the acronym–definition pairs in English texts. The results indicate that the method was comparable with other methods that used stronger constraint rules. A previously conducted study [18] used SVM to heuristically determine the accurate expansion candidates based on words similar to the acronyms. Moreover, Choi et al. [21] introduced a method to extract the acronym and expansion pairs and examined the co-occurrence of words in Wikipedia to solve the problem of polysemous acronyms.
The problem of finding acronyms in texts and present them with their related expansion is a particular form of Named Entity Recognition (NER). Devli et al. [29] introduced BERT, a new language representation model designed to pre-train deep bidirectional representations from texts by jointly conditioning on the left and right context in all layers. The pre-trained model can be further fine-tuned with an additional output layer to produce a state-of-the-art model for many different tasks, for instance, NER task to find acronym and expansion pairs in texts. BERT models have been applied to the CoNLL-2003 NER task and they performed competitively with state-of-the-art methods [29].
For conducting big data analysis, many studies have used Hadoop technology to obtain a solution to the scalability and performance problems associated with traditional computing techniques [1,30]. Hadoop is a parallel and distributed processing platform that uses the MapReduce computing paradigm [31,32] to uniformly distribute the computing tasks across data nodes to rapidly process large amounts of data on the Hadoop distributed file system (HDFS) [33]. MapReduce simplifies data processing using two functions, i.e., map and reduce. The map function separates the data input into key-value pairs. It subsequently uses the computational power of the data nodes to process the key-value pairs and returns a set of intermediate key-value pairs to the reduce function for obtaining the results [32].
A previously conducted study [34] introduced a set of a priori algorithms for data association analysis using the MapReduce paradigm and investigated their effectiveness using a set of 5 million unique single items. The authors determined that MapReduce is suitable for conducting big data analysis. Xun et al. [35] proposed a method for identifying frequent itemsets in a parallel and distributed manner using MapReduce. Zhonghua [36] performed big data processing using Hadoop in petroleum exploration applications to extract the seismic attributes. The seismic attribute analysis is usually unable to handle a large volume of data when using traditional computing paradigms.

3. Determining the Candidate Pairs of Acronym and Expansion

The acronym candidates can be determined by splitting each sentence in a text into words. Then, the ratio of the uppercase letters and the length of the word is calculated for each word. If the ratio is more than ≥75%, then the word is an acronym candidate; however, if the ratio is 50% to 75%, then the word is examined to determine whether it contains digits. If it contains at least one digit, then it is an acronym candidate; otherwise, it is further examined to check if the word is present in the Indonesian dictionary. If it is not present, then it is an acronym candidate; otherwise, it is ignored. Algorithm 1 shows the step-by-step procedure to determine the candidate of acronym and Algorithm 2 shows the step-by-step procedure to obtain the candidate pairs of acronym and expansion.
After identifying an acronym candidate, the next step is to build all the expansion candidates from the words surrounding the acronym; i.e., the sentences on the left and right sides of the acronym [15], beginning from 2 words to n words, where n can be calculated as follows. Let S be a sentence on the right or left side of acronym A that comprises two words or more, denoted as W = { w 1 , w 2 , , w k } , such that the elements in W represent the words in S. Let | W | be the number of elements in W. Then, assuming that A is an acronym formed by uppercase letters, U is either the number of uppercase letters in A or it is the number of vowels in A assuming that A is an acronym formed by a combination of syllables, and D is a digit value in A. Indonesian acronyms can be formed by a combination of letters and a digit. The digit represents the number of the appearance of the letter before it. For example “L2Dikti” can be written as “LLDikti” and denotes “Lembaga Layanan Pendidikan Tinggi” or “The Institute for Higher Education Services” in English. Therefore, the value of n can be set using the following equation:
n = m i n ( W , U + D + 1 ) if D 2 m i n ( W , U + 2 ) otherwise
Algorithm 1. Generate candidate of acronyms.
1:
proceduregetCandidates( s e n t e n c e )
2:
     p a i r s EMPTY
3:
    for all w o r d in s e n t e n c e do
4:
         v a l i d FALSE
5:
         r a t i o CHECK C HARACTER R ATIO ( w o r d )         ▹ ratio is in the range of 0 to 1
6:
        if r a t i o > = 75 % then
7:
            v a l i d TRUE
8:
        else if r a t i o > = 50 %   &   CONTAIN D IGIT ( w o r d ) then
9:
            v a l i d TRUE
10:
        else if ! IN D ICTIONARY ( w o r d ) then     ▹ lookup if the word is found in the dictionary
11:
            v a l i d TRUE
12:
        else
13:
            v a l i d FALSE
14:
        end if
15:
        if v a l i d then
16:
            p a i r s GET C ANDIDATE P AIRS ( w o r d , s e n t e n c e )
17:
        end if
18:
    end for
19:
    return p a i r s      ▹ return an array containing candidate acronym and expansion pairs
20:
end procedure
21:
 
22:
procedurecheckCharacterRatio( w o r d )
23:
     u c COUNT U PPERCASE C HARS V OWEL ( w o r d )
24:
     a c COUNT C HARACTERS ( w o r d )
25:
    return u c / a c                ▹ return a ratio in the range of 0 to 1
26:
end procedure
Algorithm 2. Generate candidate of acronym and expansion pairs.
1:
proceduregetCandidatePairs( w o r d , s e n t e n c e )
2:
     p a i r s EMPTY                ▹ an empty array of string
3:
     l e f t S e n t e n c e GET S ENTENCE ( l e f t , s e n t e n c e )
4:
     n DET NV ALUE ( w o r d , l e f t S e n t e n c e )
5:
    for k 2 to n do
6:
         p a i r s p a i r s + ( w o r d , k _ g r a m s )      ▹ push the acronym and expansion pairs to the array
7:
    end for
8:
     r i g h t S e n t e n c e GET S ENTENCE ( r i g h t , s e n t e n c e )
9:
     n DET NV ALUE ( w o r d , r i g h t S e n t e n c e )
10:
    for k 2 to n do
11:
         p a i r s p a i r s + ( w o r d , k _ g r a m s )      ▹ push the acronym and expansion pairs to the array
12:
    end for
13:
    return p a i r s      ▹ return an array containing candidate of the acronym and expansion pairs
14:
end procedure
15:
 
16:
proceduredetNValue( w o r d , s u b s e t s e n t e n c e )
17:
     W L ENGTH ( s u b s e t s e n t e n c e )
18:
     U COUNT U PPERCASE C HARS V OWEL ( w o r d )
19:
     D GET D IGIT V ALUE ( w o r d )
20:
    if D > = 2 then
21:
        return m i n ( W , U + D + 1 )
22:
    else
23:
        return m i n ( W , U + 2 )
24:
    end if
25:
end procedure

4. Numerical Features

Once n is determined, the next step is to calculate the continuous features of each acronym and its definition pair, representing the correlation between the acronym and its expansion. The features show the correlation between the uppercase letters in the acronym and the letters in the expansion for acronyms of type uppercase letters, whereas, for acronyms of type speech sound, the features show the relation between the words in the expansion and the syllables of the acronym. The features are as follows:
  • F 1 measures the correlation between the total number of characters in the acronym and the total number of words in the expansion; generally, the former matches the latter. Therefore, F 1 is equal to 1 if they match exactly; otherwise, F 1 is less than 1. Let A be an acronym and E be the expansion. Let L A be the length of A for an acronym of type uppercase letters or the number of syllables for an acronym of type sequence of speech sounds. In addition, let L E be the number of words in E excluding conjunctions and prepositions. Then, F 1 is calculated using the following equation:
    F 1 = L A L A + L E log 2 L A L A + L E + L E L A + L E log 2 L E L A + L E
  • F 2 measures the number of words in the expansion that are in title case (capitalized in the first word). Let A be an acronym and E be an expansion comprising several words that is denoted as W = { w 1 , w 2 , , w k } , such that the elements in W represent the words in E. Let | W | be the number of elements that are written in title case, excluding conjunctions and prepositions, and let L E be the number of words in E, excluding conjunctions and prepositions. Then, F 2 is calculated as follows:
    F 2 = W L E
  • F 3 weights the matching of the letters in the acronym and its expansion, excluding conjunctions and prepositions. The acronyms formed by the combination of uppercase letters are generally abbreviated based on the letters in the expansion; thus, F 3 provides a good weight for the matching of the letters. Let A be an acronym and L A be the length of A. Further, we assume that T m is a total match and t m is a total mismatch between the letters in the acronym and its expansion. Then, F 3 is calculated using the following equation:
    F 3 = T m t m L A
    For example, “NPWP,” which stands for “Nomor Pokok Wajib Pajak” (“Tax ID number” in English), has F 3 = 1 because it is abbreviated according to the letters in the expansion, i.e., T m = 4 , t m = 0 , and L A = 4 . However, F 3 would be less than 1 if at least one mismatch occurred.
  • F 4 weights the correlation between the first and last letters of the acronym. The first letter of the acronym will be matched with the first letter of the expansion and the last letter of the acronym will be matched with the first letter of the last word of the expansion. For the acronyms formed by a sequence of speech sounds (syllables), this feature weights the correlation between the first syllable of the acronym and that of the expansion. Furthermore, it measures the matching between the last syllable of the acronym and the first syllable of the last word in the definition. F 4 is 1 if both the correlations match, 0.5 if at least one correlation matches, and 0 otherwise.
  • F 5 penalizes the acronym definitions that contain many prepositions and conjunctions because acronyms usually do not contain many prepositions and conjunctions. Let E be an expansion that comprises several words and W p = { w 1 , w 2 , , w k } be the conjunctions and prepositions present in E. Furthermore, let | W p | be the number of elements and L E be the number of words in E. Then, the equation of F 5 can be given as follows:
    F 5 = 1 W p L E
  • F 6 is the ratio of accurate matching between the characters in the expansion and those in the acronym. Let A be an acronym and L A be the length of A. Assuming that T m is a total match, the ratio F 6 can be measured using the following equation:
    F 6 = T m L A
  • F 7 is introduced to distinguish between the accurate ratio of appearance ( F 6 ) and an inaccurate ratio. Therefore, the value of F 7 is 1 if F 6 is 1, indicating that the order of the acronym characters matches the characters in the expansion; otherwise, the value of F 7 is 0 if F 6 is less than 1.
  • F 8 is the mean of F 1 to F 7 .

5. Methodology

Our proposed approach encompasses several important stages, as shown in Figure 1. The initial stage is the crawling stage, which intends to collect a large number of online news articles from the web. The web articles are downloaded from trusted sources such as news.detik.com, okezone.com, liputan6.com, sindonews.com, jpnn.com, tribunnews.com, kompas.com, and viva.co.id. After the web articles are downloaded, they are stored locally. The second stage is the cleaning stage, which includes the process of removing hypertext markup language (HTML) tags, links, images, and JavaScript codes from the webpages. After the completion of the cleaning process, the webpages become plain texts. The next stage involves identification of the acronym candidates by tokenizing each sentence into words and determining the possible expansions on both sides of the acronyms [15]. Subsequently, the value of n is determined using Equation (1). The next stage involves the generation of the feature vectors for each acronym and expansion pair; the feature vectors represent the correlation between the two. For the acronyms of type uppercase letters, the features show the relation between the uppercase letters in the acronym and its expansion. However, for acronyms of type syllables, the features show the correlation between the words in the expansion and the syllables.
A collection of the acronym and expansion pairs along with the feature vectors and class labels (either p o s i t i v e or n e g a t i v e ) are separated into two sets, namely training and testing. Label p o s i t i v e indicates that the acronym and expansion pair is an accurate pair (true), whereas n e g a t i v e indicates that the acronym and expansion pair is inaccurate (false). The first two examples show the samples of class p o s i t i v e , whereas the last two examples show the samples of class n e g a t i v e :
  • BLU::Badan Layanan Umum or Public Service Agency
  • Cawapres::Calon Wakil Presiden or Vice-President Candidate
  • ZEE::Zona Ekonomi or Economic Zone
  • Mapolda::Humas Polda or Regional Police Public Relations
Models are constructed using the training set, and the accuracy of the models is verified using the testing set and measured using the precision, recall, and F-measure (F1-score). F1-measure is the weighted average of precision and recall. For the bi-class classification problem, T P represents an accurately predicted positive class, F P represents an inaccurately predicted positive class, F N represents an inaccurately predicted negative class, and T N represents an accurately predicted negative class. The equations for precision, recall, and F-measure can be given as follows:
P r e c i s i o n = T P T P + F P
R e c a l l = T P T P + F N
F m e a s u r e = 2 · P r e c i s i o n · R e c a l l P r e c i s i o n + R e c a l l
We used SVM-Light [37] to build the SVM models using linear, polynomial, radial, and sigmoid kernels and the Weka data mining tool [38] to learn using the K-NN method with k values of 3, 5, 7, and 9. In addition, we used BERT-Base and BERT-Base Multilingual Cased models [28] to compare the SVM and K-NN algorithms with the state-of-the-art language model to find acronym and expansion pairs. The default BERT parameters such as the number of epochs for training, learning rate, the maximum sequence length, etc. were used for the fine-tuning process. We used 5000 manually annotated acronym and expansion pairs to train and evaluate the models using ten-fold cross-validation [39].

6. Experimental Results

6.1. Data

In this study, many news articles were successfully downloaded from the trusted online news portals. All downloaded webpages were initially cleaned. Furthermore, the 5000 acronym and expansion pairs used as the training set were manually annotated from the candidate set. Similarly, the 2000 acronym and expansion pairs in the testing set were also manually annotated from the candidate set. The distribution of each acronym type that satisfies the rules for the training set is 3073 (61.46%) for the acronym of type capital letters or the ratio is greater than 75%; 25 (0.50%) for the acronym of type combination of characters and a digit or the ratio is between 50% and 75%, for example “LP2M” or “LPPM” that stands for “Lembaga Penelitian dan Pengabdian kepada Masyarakat” or “The Institute for Research and Community Services” in English; and 1902 (38.04%) for the acronym of type syllables or the ratio is below 50% and they are checked if they can be found in an Indonesian dictionary. In addition, the distribution for the testing set is 1118 (55.90%) for the acronym of type capital letters, 26 (1.30%) for the acronym of type combination of characters and a digit, and 856 (42.80%) for the acronym of type syllables.
The uniform resource locator (URL) pattern of each news portal must be initially determined, including the publication date of the articles, to facilitate the automatic crawling process. Table 1 presents several examples of the URL patterns.

6.2. Training Models

We evaluated the accuracy of the training models using ten-fold cross-validation. The learning process was repeated ten times, and each training subsample was used for validation. The model with the highest accuracy was selected as the final model [39]. The ten-fold cross-validation test was performed for the SVM, K-NN, and BERT algorithms. The SVM algorithm used linear, polynomial, radial, and sigmoid kernels, whereas the K-NN algorithm used four different k values, i.e., 3, 5, 7, and 9. The pre-trained BERT-Base and BERT-Base Multilingual Cased models that support the Indonesian language were used and fine-tuned using the default parameters. There were 5000 manually annotated training data, comprising 2469 positive and 2531 negative samples, denoting a fairly balanced amount of training data. The TP, FP, FN, and TN of the training models are summarized in Table 2.
Table 2 denotes that the accuracy (F1-score) of the SVM model constructed using the polynomial kernel is higher than those of the models constructed using the remaining three kernels. The accuracy of the SVM model is 99.52%, whereas the accuracy of the SVM model with radial, linear, and sigmoid kernels is 99.37%, 99.17%, and 99.09%, respectively. The accuracy of the K-NN model with k = 3 is the same as that of the K-NN model with k = 5 (99.15%); however, it is slightly higher than the accuracy of the K-NN model with k = 7 and k = 9 (99.11%). Furthermore, the accuracies of the BERT-Base and BERT-Base Multilingual Cased model are 95.36% and 95.99%, respectively. Hence, the SVM model with the polynomial kernel is the best supervised learning model to find acronym and expansion pairs from Indonesian corpus.

6.3. Determining the Best Method

We evaluated and compared the performance of the SVM model based on the polynomial kernel using the eight feature vectors proposed in this study. Moreover, we examined the performance of the K-NN model with k = 3 using eight feature vectors and the K-NN model with k = 3 using five feature vectors ( F 1 , F 2 , F 3 , F 4 , and F 5 ), as previously proposed by Jufri et al. [23]. We also evaluated the performance of the two BERT-Base methods. We used 2000 additional manually annotated acronym and expansion pairs for performing this evaluation. The results demonstrate that the accuracy of the SVM model with the polynomial kernel (97.93%) was greater than that of the SVM model that used five feature vectors, the two K-NN methods, and the two BERT-Base models. The findings indicated that our proposed approach and the incorporation of the eight feature vectors resulted in superior accuracy to the other supervised learning methods. The confusion matrix, summarized in Table 3, denotes that the SVM model obtained using eight feature vectors is superior to the SVM model obtained using five feature vectors, the two K-NN methods obtained using two different feature vectors, and the two BERT-Base models, measured based on the F-measure (F1-score). Both BERT-Base models predicted more negative samples as positive; therefore, the precision of the models was low. The results also denote that the specificity (true negative rate) of the proposed method is high and did not considerably differ from the positive rate. We display the acronyms and their expansions identified automatically using our proposed approach in a web-based repository at http://indoacro.cs.unsyiah.ac.id.

6.4. Hadoop Performance Analysis

Performance evaluation was conducted using cleaned web files of various sizes, i.e., 100,000, 200,000, and 300,000. Different file sizes were created to observe the time trends associated with the generation of acronym and definition pairs and the calculation of their numerical features. Approximately 52 million pairs of acronyms and expansions were generated from 100,000 cleaned files; approximately 103 million pairs were generated from 200,000 cleaned files; and approximately 145 million pairs were generated from 300,000 cleaned files. Further, we evaluated the performance using several virtual servers, each of which has the Centos7 (x86 64) operating system installed, 8-core 2 GHz processor, 16 GB memory, and a storage of 200 GB. Figure 2 shows that the performance improves when additional data nodes are added into the Hadoop cluster.

7. Conclusions

Our proposed method can effectively find the accurate acronym and expansion pairs and successfully recognize the acronyms that are pronounceable, such as “Pilkada” (“regional election” in English), “Damkar” (“firefighters”), and “Kemendagri” (“Ministry of Home Affairs”). The SVM polynomial model obtained using eight feature vectors exhibits the highest accuracy (97.93%), outperforming the SVM model obtained using five feature vectors (90.45%), the K-NN algorithm with k = 3 using eight feature vectors (96.82%), the K-NN algorithm with k = 3 using five feature vectors (95.66%), the BERT-base model (81.64%), and the BERT-base multilingual cased model (88.10%). Furthermore, the results confirm that the Hadoop MapReduce rapidly and effectively generates candidates of acronym and expansion pairs and calculates the feature vectors of the pairs. The results also confirm that a large number of data nodes improves the performance.

Author Contributions

Conceptualization, T.F.A.; Data curation, T.F.A. and A.M.; Formal analysis, T.F.A., A.M., M.S., and R.F.; Methodology, T.F.A. and A.M.; Validation, T.F.A.; Visualization, R.F.; Writing—original draft, T.F.A.; and Writing—review and editing, T.F.A. and K.M. All authors have read and agreed to the published version of the manuscript.

Funding

This study was funded by Universitas Syiah Kuala under the PCP Research Grant 20/UN11.2/PP/PNBP/SP3/2017 and the Ministry of Research, Technology, and Higher Education under the Basic Research Grant 215/SP2H/LT/DRPM/2019.

Acknowledgments

The authors would like to thank the experts from Solusi247 who helped us to set and ensure the appropriate operation of the Hadoop MapReduce technology. The authors would also like to thank Denny Syaputra and Teuku Wahyu Ardhian Putera for their technical supports.

Conflicts of Interest

The authors declare no conflict of interest.

Abbreviations

The following abbreviations are used in this manuscript:
AFPAcronym finding program
BERTBidirectional encoder representations from transformers
HDFSHadoop distributed file system
HTMLHypertext markup language
K-NNK-nearest neighbors
NASANational aeronautics and space administration
NERNamed entity recognition
SVMSupport vector machine
URLUniform resource locator

References

  1. Oussous, A.; Benjelloun, F.-Z.; Lahcen, A.A.; Belfkih, S. Big data technologies: A survey. J. King Saud Univ. Comput. Inf. Sci. 2018, 30, 431–448. [Google Scholar] [CrossRef]
  2. Chen, C.L.P.; Zhang, C.-Y. Data-intensive applications, challenges, techniques and technologies: A survey on Big Data. Inf. Sci. 2014, 275, 314–347. [Google Scholar] [CrossRef]
  3. Ali, A.; Shah, G.A.; Farooq, M.O.; Ghani, U. Technologies and challenges in developing machine-to-machine applications: A survey. J. Netw. Comput. Appl. 2017, 83, 124–139. [Google Scholar] [CrossRef]
  4. Botta, A.; de Donato, W.; Persico, V.; Pescape, A. Integration of cloud computing and Internet of things: A survey. Future Gener. Comput. Syst. 2016, 56, 684–700. [Google Scholar] [CrossRef]
  5. Lazer, D.; Kennedy, R.; King, G.; Vespignani, A. The parable of Google flu: Traps in big data analysis. Science 2014, 343, 1203–1205. [Google Scholar] [CrossRef] [PubMed]
  6. Ginsberg, J.; Mohebbi, M.H.; Patel, R.S.; Brammer, L.; Smolinski, M.S.; Brilliant, L. Detecting influenza epidemics using search engine query data. Nature 2009, 457, 1012–1014. [Google Scholar] [CrossRef] [PubMed]
  7. Chen, M.; Mao, S.; Liu, Y. Big data: A survey. Mob. Netw. Appl. 2014, 19, 171–209. [Google Scholar] [CrossRef]
  8. Dobre, C.; Xhafab, F. Intelligent services for big data science. Future Gener. Comput. Syst. 2014, 37, 267–281. [Google Scholar] [CrossRef]
  9. Woetzel, J.; Remes, J.; Boland, B.; Katrina, L.V.; Sinha, S.; Strube, G.; Means, J.; Law, J.; Cadena, A.; Tann, V.V.D. Smart Cities: Digital Solutions for a More Livable Future; McKinsey Global Institute: New York, NY, USA, 2018. [Google Scholar]
  10. Lee, I. Big data: Dimensions, evolution, impacts, and challenges. Bus. Horiz. 2017, 60, 293–303. [Google Scholar] [CrossRef]
  11. Majumdar, J.; Naraseeyappa, S.; Ankalaki, S. Analysis of agriculture data using data mining techniques: Application of big data. J. Big Data 2017, 4, 1–15. [Google Scholar] [CrossRef] [Green Version]
  12. Almada, M. Human intervention in automated decision-making: Toward the construction of contestable systems. In Proceedings of the 17th International Conference on Artificial Intelligence and Law (ICAIL), Montreal, QC, Canada, 17–21 June 2019. [Google Scholar]
  13. Taghva, K.; Gilbreth, J. Recognizing acronyms and their definitions. Int. J. Doc. Anal. Recognit. 1999, 1, 191–198. [Google Scholar] [CrossRef] [Green Version]
  14. Larkey, L.S.; Ogilvie, P.; Price, A.; Tamilio, B. Acrophile: An automated acronym extractor and server. In Proceedings of the 5th ACM Conference on Digital Libraries, San Antonio, TX, USA, 2–7 June 2000; pp. 205–214. [Google Scholar]
  15. Park, Y.; Byrd, R.J. Hybrid text mining for finding abbreviations and their definitions. In Proceedings of the Conference on Empirical Methods in Natural Language Processing, Pittsburgh, PA, USA, 3–4 June 2001; pp. 126–133. [Google Scholar]
  16. Chang, J.T.; Schutze, H.; Altman, R.B. Creating an online dictionary of abbreviations from MEDLINE. J. Am. Med. Inform. Assoc. 2002, 9, 612–620. [Google Scholar] [CrossRef] [PubMed] [Green Version]
  17. Nadeau, D.; Turney, P.D. A supervised learning approach to acronym identification. In Advances in Artificial Intelligence; Kégl, B., Lapalme, G., Eds.; Springer: Berlin, Germany, 2005; Volume 3501, pp. 319–329. [Google Scholar]
  18. Xu, J.; Huang, Y. Using SVM to extract acronym from text. Soft Comput. 2007, 11, 369–373. [Google Scholar] [CrossRef]
  19. Ji, X.; Xu, G.; Bailey, J.; Li, H. Mining, ranking, and using acronym patterns. Lect. Notes Comput. Sci. 2008, 4976, 371–382. [Google Scholar]
  20. Sanchez, D.; Isern, D. Automatic extraction of acronym definitions from the web. J. Appl. Intell. 2011, 34, 311–327. [Google Scholar] [CrossRef]
  21. Choi, D.; Kim, P. Identifying the most appropriate expansion of acronyms used in wikipedia text. Softw. Pract. Exp. 2015, 45, 1073–1086. [Google Scholar] [CrossRef]
  22. Jacobs, K.; Itai, A.; Wintner, S. Acronyms: Identification, expansion and disambiguation. Ann. Math. Artif. Intell. 2018, 49. [Google Scholar] [CrossRef]
  23. Wahyudi, J.; Abidin, T.F. Automatic determination of acronyms and their expansion from Indonesian texts data. In Proceedings of the SNATIKA, Malang, Indonesia, 10 November 2011; pp. 115–119. (In Indonesian). [Google Scholar]
  24. Abidin, T.F.; Adriman, R.; Ferdhiana, R. Performance analysis of Apache Hadoop for generating candidates of acronym and expansion pairs and their numerical features. In Proceedings of the 3rd International Conference on Information Technology, Information System and Electrical Engineering, Yogyakarta, Indonesia, 13–14 November 2018; pp. 189–193. [Google Scholar]
  25. Senthilkumar, R.M.; Jayanthi, V.E. A survey on acronym-expansion mining approaches from text and web. In Proceedings of the 2nd International Conference on SCI, Vijayawada, India, 27–28 January 2018; Volume 1, pp. 121–133. [Google Scholar]
  26. Boser, B.E.; Guyon, I.M.; Vapnik, V.N. A training algorithm for optimal margin classifiers. In Proceedings of the 5th Annual ACM Workshop on Computational Learning Theory, Pittsburgh, PA, USA, 27–29 July 1992; pp. 144–152. [Google Scholar]
  27. Cover, T.M.; Hart, P.E. Nearest neighbor pattern classification. IEEE Trans. Inf. Theory 1967, 13, 21–27. [Google Scholar] [CrossRef]
  28. Turc, I.; Chang, M.-W.; Lee, K.; Toutanova, K. Well-read students learn better: On the importance of pre-training compact models. arXiv 2019, arXiv:1908.08962v2. [Google Scholar]
  29. Devlin, J.; Chang, M.-W.; Lee, K.; Toutanova, K. BERT: Pre-training of deep bidirectional transformers for language understanding. In Proceedings of the NAACL-HLT, Minneapolis, MN, USA, 2–7 June 2019; pp. 4171–4186. [Google Scholar]
  30. Dean, J.; Ghemawat, S. MapReduce: Simplified data processing on large clusters. Commun. ACM 2004, 51, 1–13. [Google Scholar] [CrossRef]
  31. L’Heureux, A.; Grolinger, K.; Capretz, M.A.M. Machine learning with big data: Challenges and approaches. IEEE Access 2017, 5, 7776–7797. [Google Scholar] [CrossRef]
  32. Li, R.; Hu, H.; Li, H.; Wu, Y.; Yang, J. MapReduce parallel programming model: A state-of-the-art survey. Int. J. Parallel Program. 2016, 44, 832–866. [Google Scholar] [CrossRef]
  33. Ghazi, M.R.; Gangodkar, D. Hadoop, mapreduce and HDFS: A developers perspective. Procedia Comput. Sci. 2015, 48, 45–50. [Google Scholar] [CrossRef] [Green Version]
  34. Luna, J.M.; Padillo, F.; Pechenizkiy, M.; Ventura, S. Apriori versions based on MapReduce for mining frequent patterns on big data. IEEE Trans. Cybern. 2017, 47, 1–15. [Google Scholar] [CrossRef]
  35. Xun, Y.; Zhang, J.; Qin, X. FiDoop: Parallel mining of frequent itemsets using MapReduce. IEEE Trans. Syst. Man Cybern. Syst. 2016, 46, 313–325. [Google Scholar] [CrossRef]
  36. Zhonghua, M. Seismic data attribute extraction based on Hadoop platform. In Proceedings of the 2nd IEEE International Conference on Cloud Computing and Big Data Analysis, Chengdu, China, 28–30 April 2017; pp. 180–184. [Google Scholar]
  37. Joachims, T. Making Large-Scale SVM Learning Practical; Scholkopf, B., Burges, C., Smola, A., Eds.; MIT Press: Cambridge, MA, USA, 1998. [Google Scholar]
  38. Witten, I.H.; Frank, E.; Hall, M. Data Mining: Practical Machine Learning Tools and Techniques, 3rd ed.; Morgan Kaufmann Publishers: Burlington, MA, USA, 2011. [Google Scholar]
  39. Zouina, M.; Outtaj, B. A novel lightweight URL phishing detection system using SVM and similarity index. Hum. Centric Comput. Inf. Sci. 2017, 7, 1–13. [Google Scholar] [CrossRef]
Figure 1. The proposed method.
Information 11 00210 g001
Figure 2. Time comparison between different Hadoop data node settings.
Information 11 00210 g002
Table 1. URL patterns of the online news portals.
SourceURL Patterns
Viva news portalviva.co.id/indeks/berita/all/yyyy/mm/dd
Detik news portalnews.detik.com/indeks/[page]?date=mm/dd/yyyy
Liputan6 technology portalliputan6.com/tekno/indeks/yyyy/mm/dd
Liputan6 business portalliputan6.com/bisnis/indeks/yyyy/mm/dd
Liputan6 automotive portalliputan6.com/otomotif/indeks/yyyy/mm/dd
Okezone news portalnews.okezone.com/indeks/yyyy/mm/dd
Kompas news portalnews.kompas.com/search/yyyy-mm-dd
Table 2. Evaluation results for the training models in the ten-fold cross-validation test.
Supervised Learning MethodActual LabelPredictionPrecision (%)Recall (%)F1-Score (%)
{ + 1 } { 1 }
SVM linear { + 1 } 24521799.0399.3199.17
{ 1 } 242507
SVM polynomial { + 1 } 2463699.2799.7699.52
{ 1 } 182513
SVM radial { + 1 } 24581199.1999.5599.37
{ 1 } 202511
SVM sigmoid { + 1 } 24492098.9999.1999.09
{ 1 } 252506
K-NN k = 3 { + 1 } 24511899.0399.2799.15
{ 1 } 242507
K-NN k = 5 { + 1 } 24511899.0399.2799.15
{ 1 } 242507
K-NN k = 7 { + 1 } 24511898.9599.2799.11
{ 1 } 262505
K-NN k = 9 { + 1 } 24511898.9599.2799.11
{ 1 } 262505
BERT-base { + 1 } 235111895.4995.2295.36
{ 1 } 1112420
BERT-base multilingual cased { + 1 } 23848595.4496.5695.99
{ 1 } 1142417
Table 3. Evaluation results of all the methods using test data.
Supervised Learning MethodActual LabelPredictionPrecision (%)Recall (%)F1-Score (%)
{ + 1 } { 1 }
SVM polynomial using eight features { + 1 } 9683299.0896.8097.93
{ 1 } 9991
SVM polynomial using five features { + 1 } 82917199.5282.9090.45
{ 1 } 4996
K-NN k = 3 using eight features { + 1 } 9435799.4794.3096.82
{ 1 } 5995
K-NN k = 3 using five features { + 1 } 9257599.0492.5095.66
{ 1 } 9991
BERT-base { + 1 } 9742670.2797.4081.64
{ 1 } 412588
BERT-base multilingual cased { + 1 } 992879.2399.2088.10
{ 1 } 260740

