Anti-Shake HDR Imaging Using RAW Image Data


School of Computer and Communication Engineering, Zhengzhou University of Light Industry, Zhengzhou 450002, China
*
Author to whom correspondence should be addressed.
Information 2020, 11(4), 213; https://0-doi-org.brum.beds.ac.uk/10.3390/info11040213
Submission received: 10 March 2020
/
Revised: 12 April 2020
/
Accepted: 13 April 2020
/
Published: 16 April 2020
(This article belongs to the Special Issue Computational Intelligence for Audio Signal Processing)
Abstract
:Camera shaking and object movement can cause the output images to suffer from blurring, noise, and other artifacts, leading to poor image quality and low dynamic range. Raw images contain minimally processed data from the image sensor compared with JPEG images. In this paper, an anti-shake high-dynamic-range imaging method is presented. This method is more robust to camera motion than previous techniques. An algorithm based on information entropy is employed to choose a reference image from the raw image sequence. To further improve the robustness of the proposed method, the Oriented FAST and Rotated BRIEF (ORB) algorithm is adopted to register the inputs, and a simple Laplacian pyramid fusion method is implanted to generate the high-dynamic-range image. Additionally, a large dataset with 435 various exposure image sequences is collected, which includes the corresponding JPEG image sequences to test the effectiveness of the proposed method. The experimental results illustrate that the proposed method achieves better performance in terms of anti-shake ability and preserves more details for real scene images than traditional algorithms. Furthermore, the proposed method is suitable for extreme-exposure image pairs, which can be applied to binocular vision systems to acquire high-quality real scene images, and has a lower algorithm complexity than deep learning-based fusion methods.
1. Introduction
Raw images capture all image data recorded by the sensor, providing many advantages compared with common compressed image formats, such as lossless compression, linear response to scene radiance, non-destructive white balance, wider color gamut, higher dynamic range (generally 12–14 bits), and so on. Most vision tasks are finished using 8-bit standard RGB (sRGB) compressed JPEGs because raw images require large amounts of memory space and are not well supported by many imaging applications. However, while compression algorithms may be optimized perfectly, the sRGB images are highly processed by the color Image Processing Pipeline (IPP) in terms of color and scene radiance. The process of IPP may result in noise and loss of detail, causing sRGB image information distortion in many advanced vision tasks. Hence, researchers need to increase the complexity of algorithms to obtain better results when using the compressed JPEG formats in vision tasks.
High-dynamic-range (HDR) imaging provides the capacity to capture, manipulate, and display real-world lighting in different imaging conditions, significantly improving the visual experience. Some HDR imaging methods enhance the dynamic range by using particular sensors [1,2,3], and others use image processing techniques to generate a high-quality HDR image by merging multiple low-dynamic-range (LDR) images captured sequentially with different exposure times. HDR imaging has many applications in augmented reality [4,5], photography, lighting [6,7,8], saliency detection [9,10], data hiding [11], quality assessment [12,13], and image stitching [14], etc. Many HDR imaging methods [15,16,17,18,19,20,21,22,23,24] have been proposed, which can be divided into two categories: tone-mapping methods [15,18,20,25,26,27,28], and multi-exposure image fusion (MEF) methods [16,23,29,30,31]. In addition, some methods of HDR acquisition based on dynamic scenes [32,33] have also been proposed. Tone-mapping methods produce HDR images by adjusting the grayscale image, which may create some halos in the mapping process. MEF methods merge well-exposed regions from numerous LDR input images to produce a single visually appealing LDR result that appears to possess a higher dynamic range, but the fusion result is usually unsatisfactory due to camera shaking and object movement. Most researchers have designed complicated HDR image fusion algorithms to improve the quality of produced HDR images using the compressed JPEG images as inputs. Nevertheless, camera shaking and object movement in the fusion process still represent a tricky problem. In this paper, an anti-shake HDR image acquisition method is proposed for real scenes based on raw camera data. This method is ghost-free and can save more details than traditional HDR fusion methods.
In summary, the main contributions of this paper are as follows:
- A new dataset of multi-exposure raw image sequences featuring camera shaking is collected, and each raw image has a corresponding JPEG format.
- A reference image selection method for multi-exposure raw image sequences with camera shaking is proposed based on information entropy.
- A pipeline for raw image sequences with camera shaking to produce ghost-free HDR images is designed, with more robust performance for extreme-exposure raw image pairs.
2. Related Work
HDR imaging technology has been the focus of a significant body of imaging science and computer vision in recent years. There are three related categories of work: tone mapping, multi-exposure image fusion, and raw image processing.
Reinhard et al. [25] proposed a tone-mapping method based on photographic models that automatically adjusts the brightness. Durand et al. [27] used an edge-preserving filter called the bilateral filter to reduce contrast and preserve details. The method of Drago et al. [28] is based on the logarithmic compression of luminance values by introducing a bias power function to adaptively vary logarithmic bases. Mantiuk et al. [26] utilized higher-order image statistics and quadratic programming through the model of the human visual system to reduce image distortion. Although the above methods [25,26,27,28] can improve the quality of images, they fail to restore the details of image and are sensitive to lighting conditions. To enrich the details of images, Kinoshita et al. [23] proposed a novel pseudo multi-exposure image fusion method based on a single image, utilizing the local contrast enhancement method to obtain high-quality pseudo multi-exposure images. However, with this method the fusion results depend on the quality of input images, resulting unsatisfactory for extreme exposures.
Zhang et al. [29] suggested a wavelet-based fusion algorithm for multi-exposure images. However, the method cannot enhance the details adequately for low-resolution images. Kinoshita et al. [31] proposed a multi-exposure image fusion method based on exposure compensation, but the method requires that the inputs have no moving artifacts. Zhen et al. [34] proposed an algorithm to improve accurate contrast enhancement, but it has a poor effect on over-exposed regions. Some HDR algorithms [35,36,37] based on deep learning have been proposed to generate HDR images, but these algorithms do not solve the problems of camera shaking and object movement.
Given the advantages of raw images, they are desirable for many algorithms because they allow flexibility for post-processing. Hasinoff et al. [38] described a computational photography pipeline that captures, aligns, and merges a burst of frames to reduce noise and increase dynamic range, but the pipeline failed to suppress the noise of high-contrast features. Chen et al. [35] developed a pipeline for processing low-light raw images, but with this method some obvious details are lost, and as such it is not suitable for images with high amounts of light.
Due to the poor performance of existing HDR algorithms with respect to camera shaking and extreme exposure, an anti-shake HDR image acquisition method based on raw image sequences with position offsets is proposed. The method is not only robust to camera shaking and extreme-exposure image pairs, but also has lower algorithmic complexity and better performance.
3. The Proposed Method
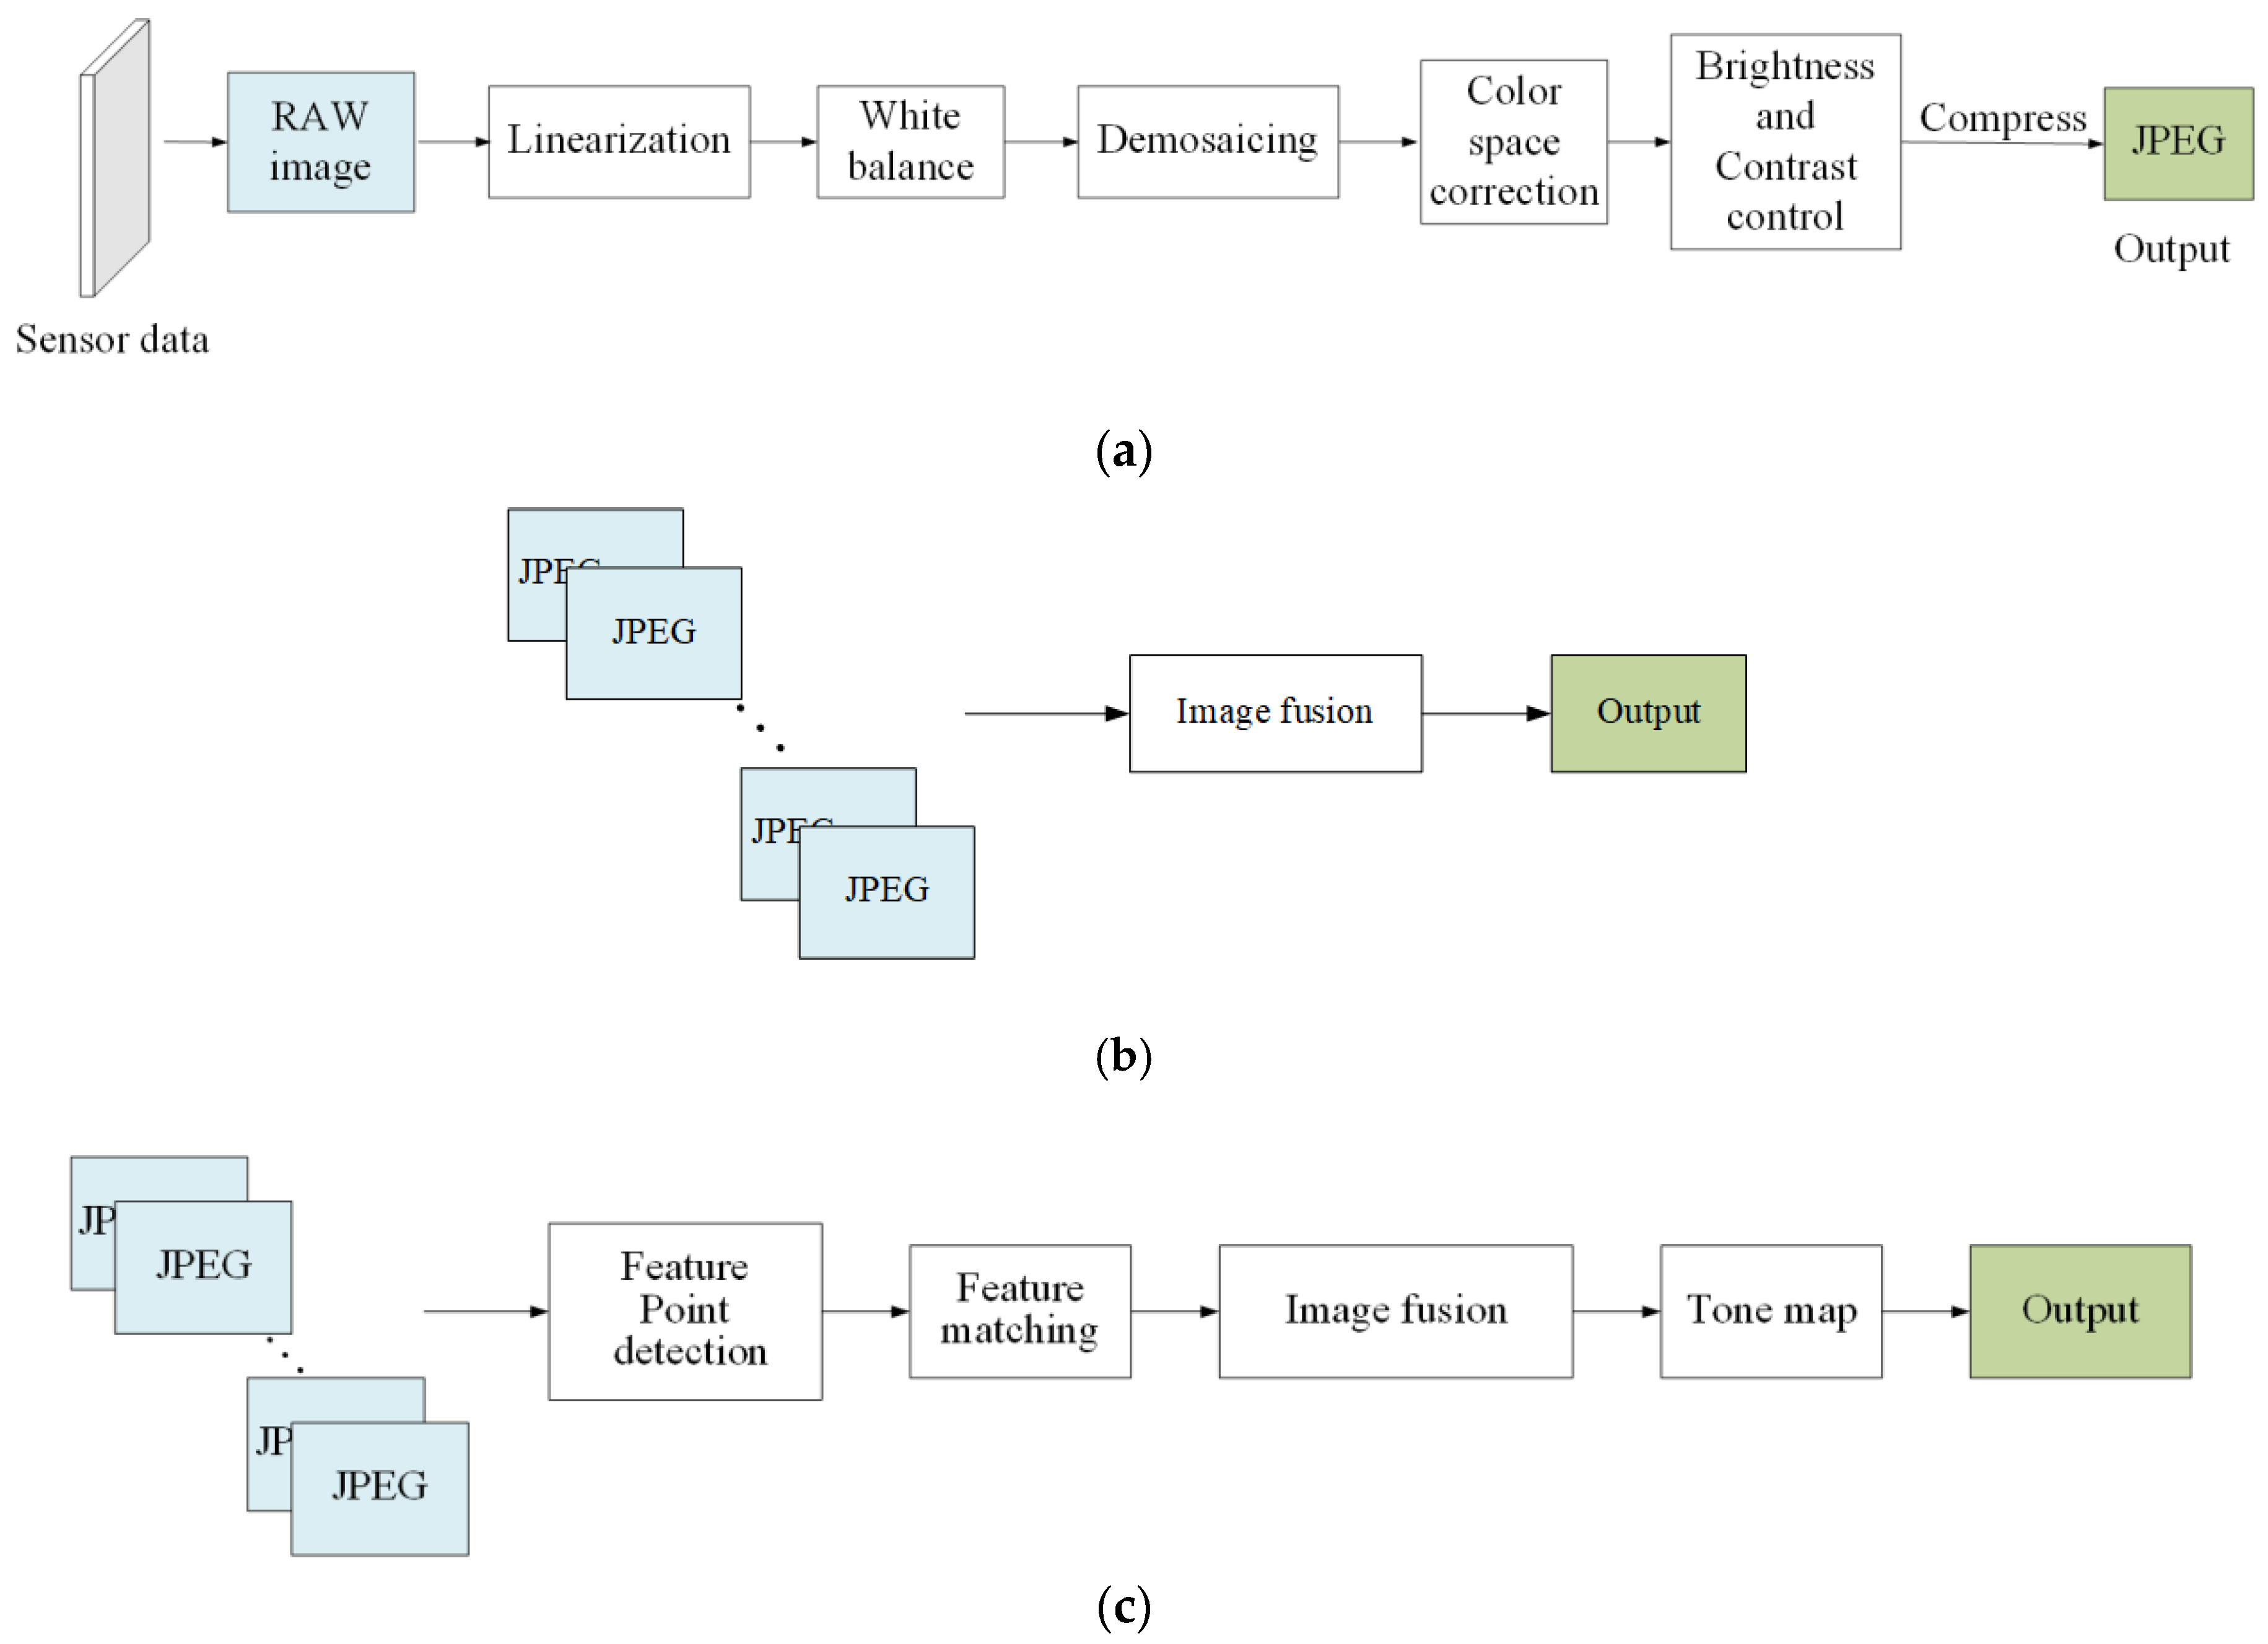
Modern digital cameras attempt to render a pleasant and accurate image of the world, similar to that perceived by the human eye [39]. As shown in Figure 1a, a typical camera IPP includes linearization, white balance, demosaicking, color correction, brightness, and contrast control, with the aim of converting raw sensor images to JPEG images. As shown in Figure 1b, the conventional direct fusion algorithm for multi-exposure sequences usually uses compressed JPEG formats, which are only suitable for inputs without camera shaking and object movement. Another traditional improved multi-exposure image fusion pipeline is shown in Figure 1c, which can be used to process the inputs with position offsets. However, the loss of key feature information in compressed images cannot be recovered by the fusion algorithms, and therefore the fusion results are usually undesirable.
In this paper, an anti-shake HDR image acquisition method based on raw image sequences with camera shaking and object movement is proposed, which includes raw image processing, reference image selection, image registration, and image fusion, as shown in Figure 1d. Raw images are chosen instead of JPEG images for reference, as more feature points can be detected for matching. In the process of image matching, incorrect matches are rejected many times to achieve better matching accuracy and ensure the fused HDR images are of higher quality.
3.1. Reference Image Selection
Instead of operating on sRGB images produced by the traditional camera processing pipeline, we operated using raw sensor data. Hence, we needed to convert raw images from a single channel to three channels based on Bayer interpolation algorithm to obtain full-color images, as shown in Figure 2.
To better automatically correct the position offsets caused by camera shaking between multi-exposure image sequences, we introduced a reference image selection method based on information entropy for raw image sequences. In information theory, entropy is a measure of the uncertainty in a random variable [40]. The concept of information entropy describes how much information is provided by the signal or image. The image with different exposure values contains different image information and the higher the entropy of the image, the more information the image contains. For the grayscale image, we calculated the image information entropy by Equation (1):
where p(i) is the distribution probability of image gray i.
Table 1 shows the information entropy average values of the raw images and corresponding JPEG images. As shown in Table 1, the information entropy of raw images is higher than that of the JPEG images, and the middle image has the highest entropy. Hence, we chose the middle image as the reference image for multi-exposure raw image sequences.
3.2. Feature Point Detection and Matching
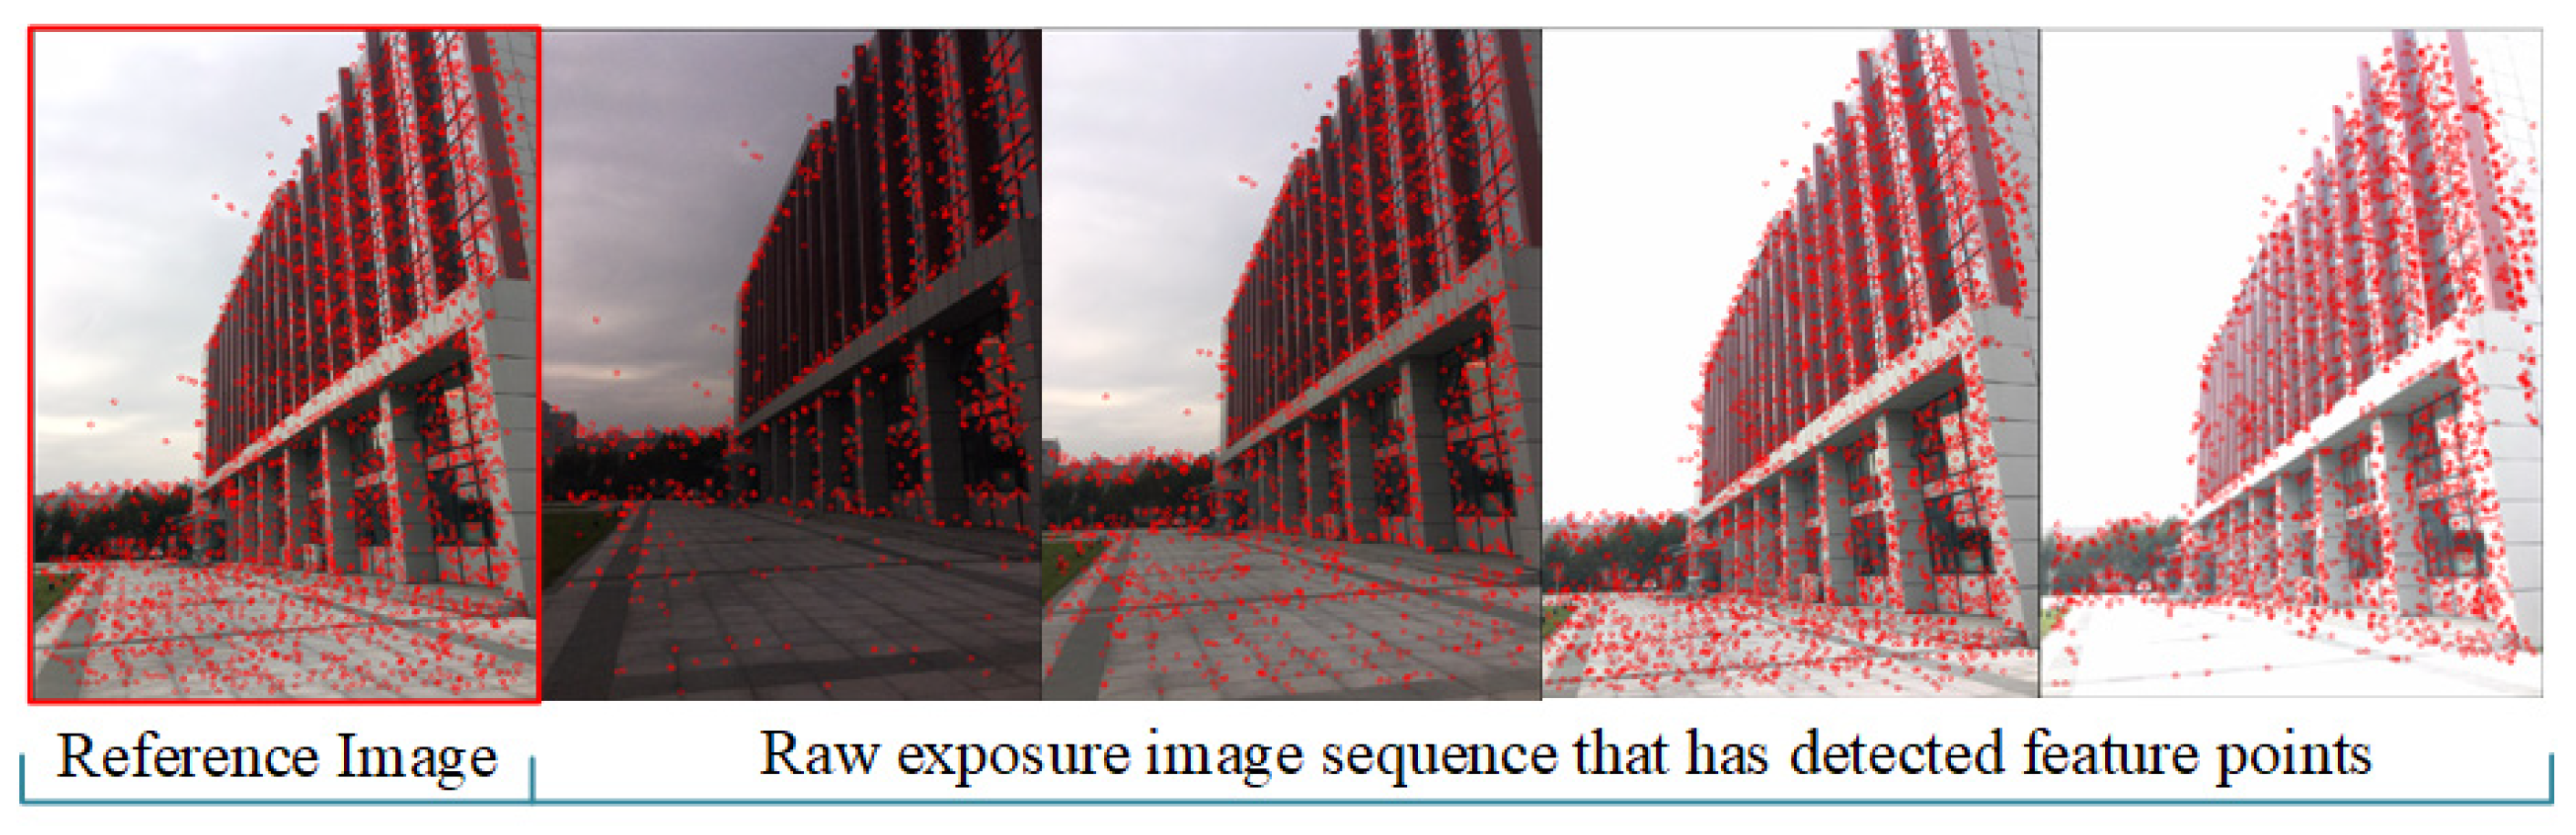
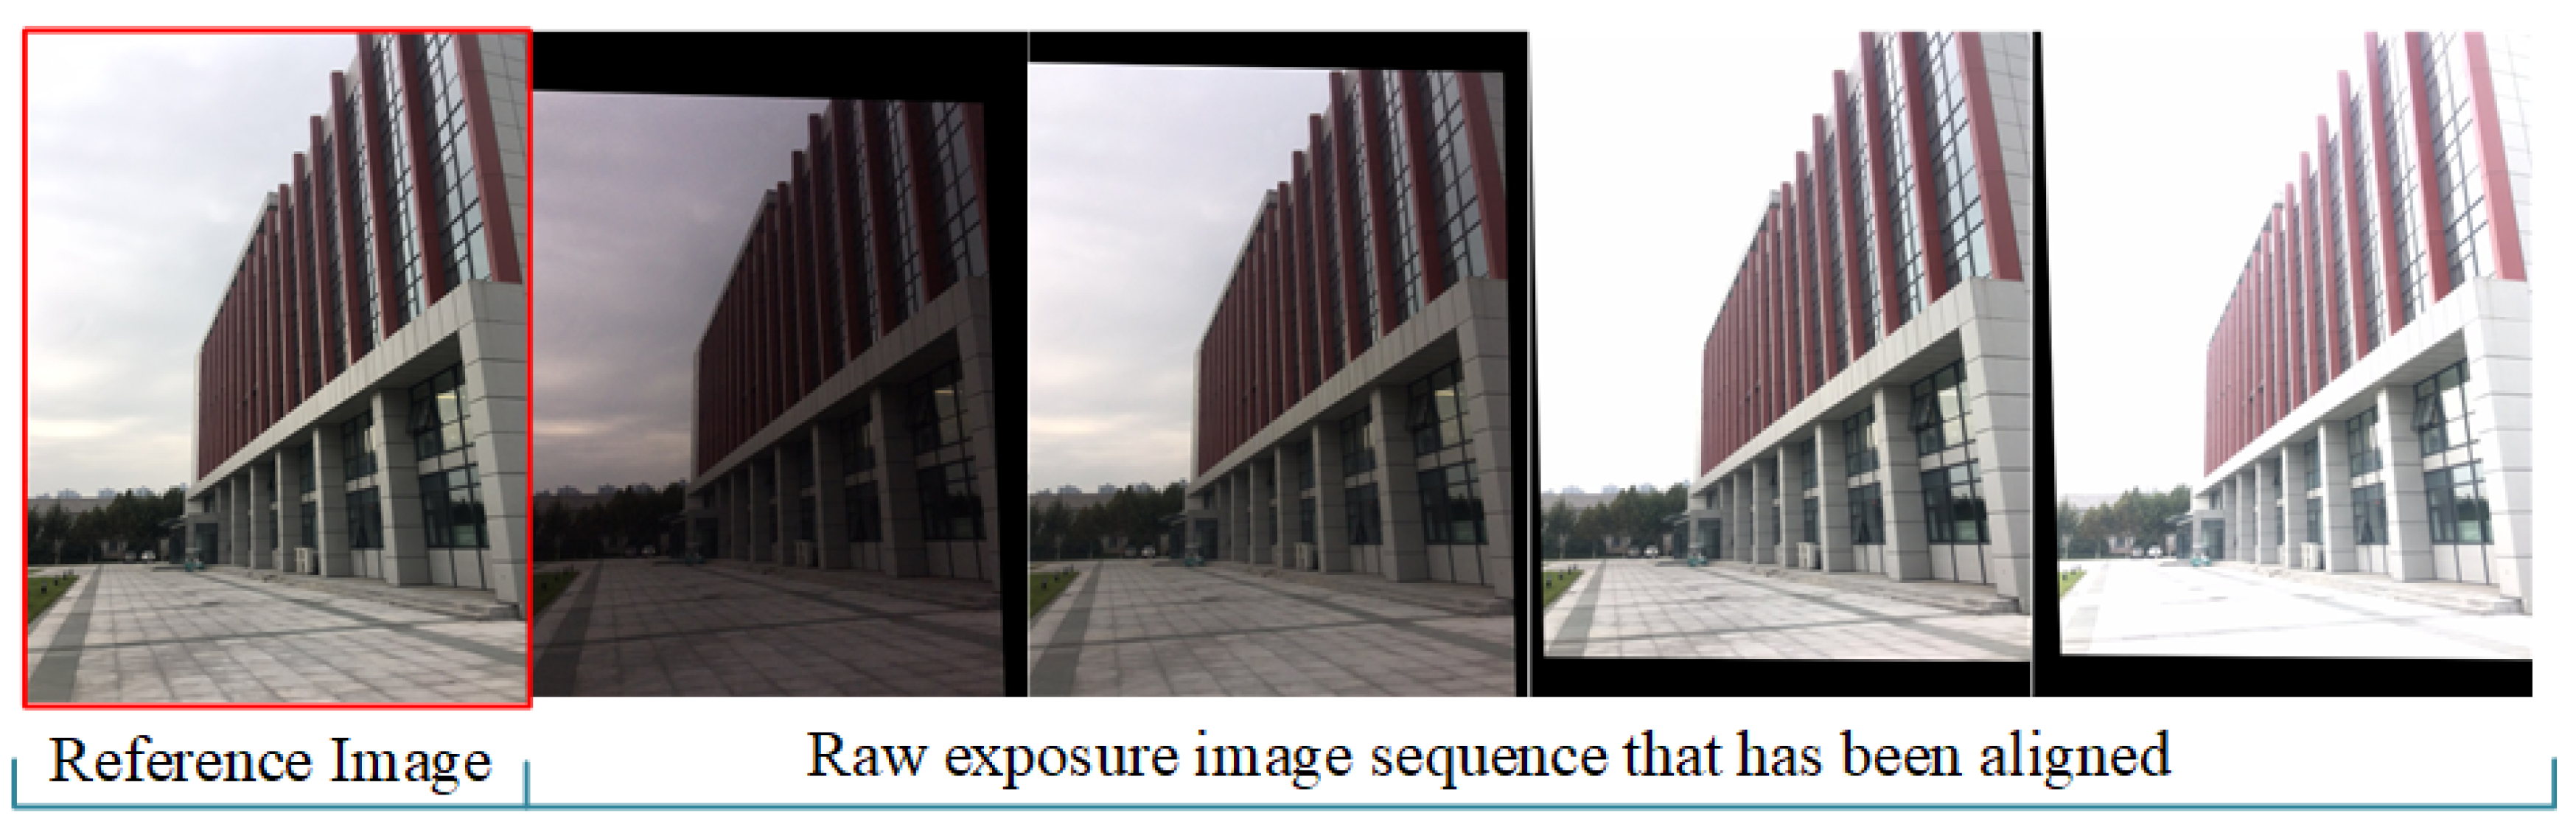
The proposed method utilizes the Oriented FAST and Rotated BRIEF (ORB) algorithm [41] to extract feature points of three channels raw images. The image marked with red box in Figure 3 is the selected reference image, and the rest of images are the raw image sequences to be matched. The red points in Figure 3 stand for the detected key points.
There were a large number of incorrect matches in the matching process, but we required good matches to estimate the transform matrix. The method to reject incorrect matches can be divided into three steps.
The first step is to utilize the Brute-Force (BF) algorithm to match the feature points of reference images and exposure images according to Hamming distance. The smaller the Hamming distance, the more similar the two feature points. If the Hamming distance is less than certain threshold T1, the two feature points will be considered to match. T1 can be calculated by Equation (2):
where s is a variable, and dmax and dmin represent the maximum Hamming distance and the minimum Hamming distance, respectively. We can find the best T1 by changing the value of s. If the Hamming distance is greater than the best T1 value, the matched pair will be eliminated; otherwise, it will be considered a correctly matched pair.
The second step is to further eliminate the incorrect matches by the KNN algorithm. For each feature point in the reference image, we must find the two best matches in the raw image to be registered. Then we also should find the two best matches for the feature point of the raw image in the reference image. The best match for each feature point should be chosen based on the Hamming distance between their descriptors from the two candidate matches. The threshold T2 is used to choose a good match, which defined as:
where dbest and dsecond denote the measured distance for the best and the second-best match, respectively. If the dbest is much smaller than the dsecond, the best match will be regarded as the better of the two candidate matches.
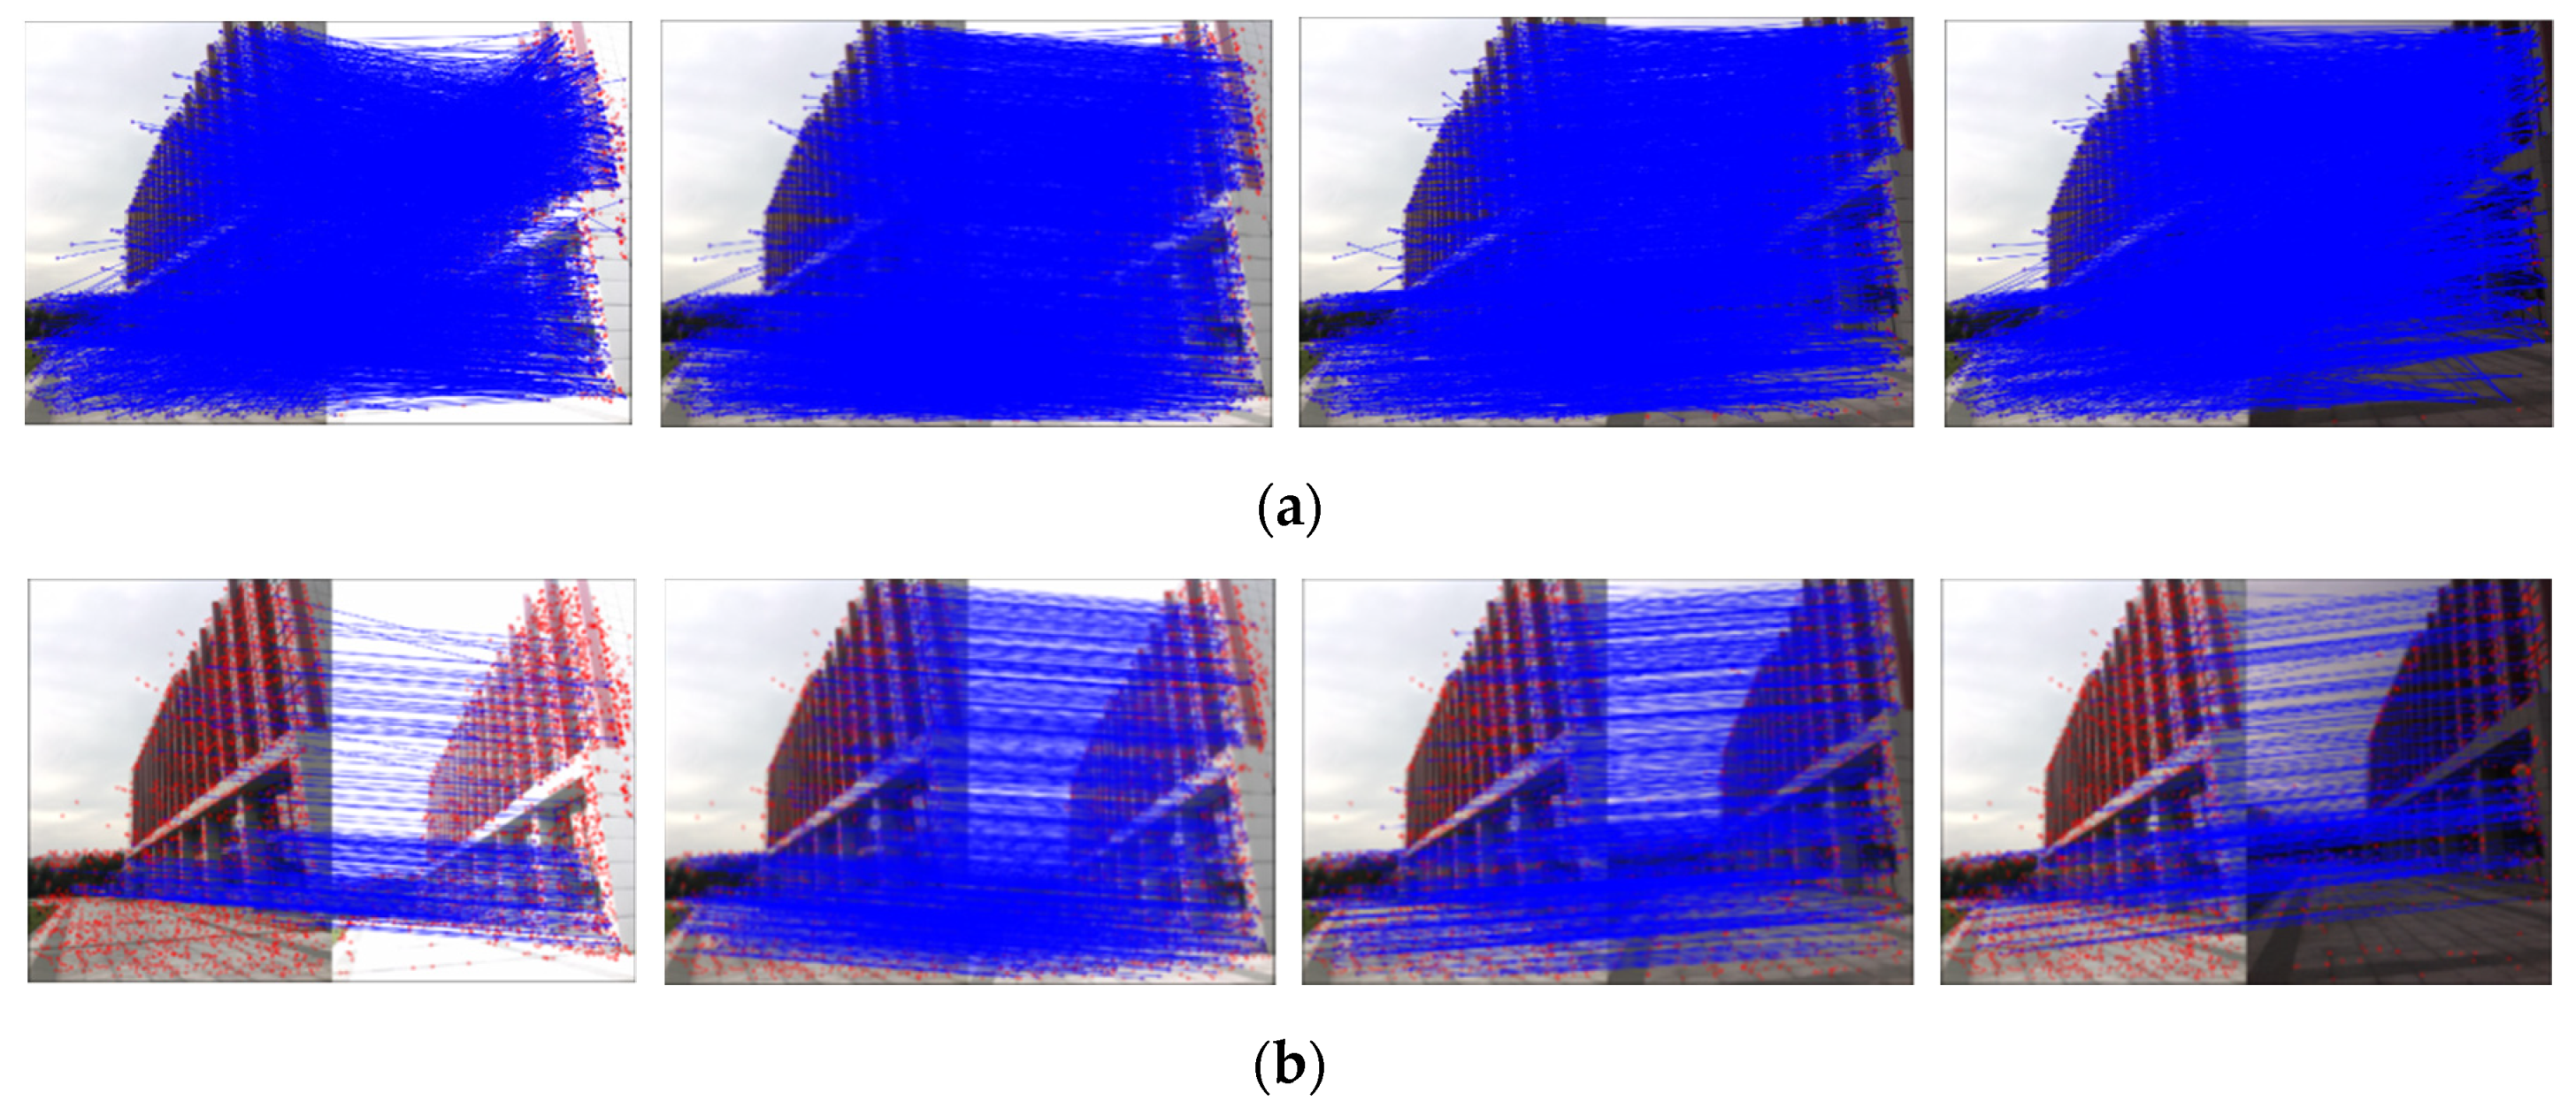
Although a large number of incorrect matches are eliminated in step one and step two, we cannot guarantee that the matches obtained will be perfectly exact. Hence, the last step is to reject the matches that do not obey the epipolar constraint by utilizing the RANSAC algorithm [42]. RANSAC is an uncertain algorithm that can estimate mathematical model parameters from the match set containing “outliers”, which are the matches that do not fit the model, and “inliers”, which are the matches that can be explained by model parameters. In this step, we assume all the matches retained in step one and step two are “inliers”, and then randomly select eight sets of matching pairs from the “inliers” to estimate the model by iteration, which can quickly compute the transform matrix. However, if one of the selected matches is an inaccurate match, the computed transform matrix will be incorrect. Hence, the Hamming and KNN algorithms are chosen to reject the most incorrect matches before RANSAC. Figure 4a is the matching result of raw image sequences without rejecting incorrect matches. Figure 4b is the final matching result by the RANSAC algorithm. All the incorrect matches were rejected, indicating that the proposed matching algorithm can greatly improve the matching rate.
3.3. Image Aligned and Registration
The alignment of raw images with camera shaking is a special challenge, so the homography matrix was adopted to warp the matched raw image sequences. This matrix was computed by the method of direct linear transform (DLT), as shown in Equation (4), which used to estimate the perspective transformation H matrix of the remaining matched feature pairs. For all feature points, the mapping error from the raw image to the reference image was calculated. The maximum inlier feature points set by the mapping error could be found, and the matrix H could be recalculated by the coordinates of the inlier feature points.
where (x1, y1) stands for the coordinates of keypoints in the reference image, (x2, y2) denotes the coordinates of keypoints in the raw image to be aligned, and H represents the transformation matrix with 3 × 3 size, as shown in Equation (5):
where hij (i, j = 1, 2, 3) can be any value.
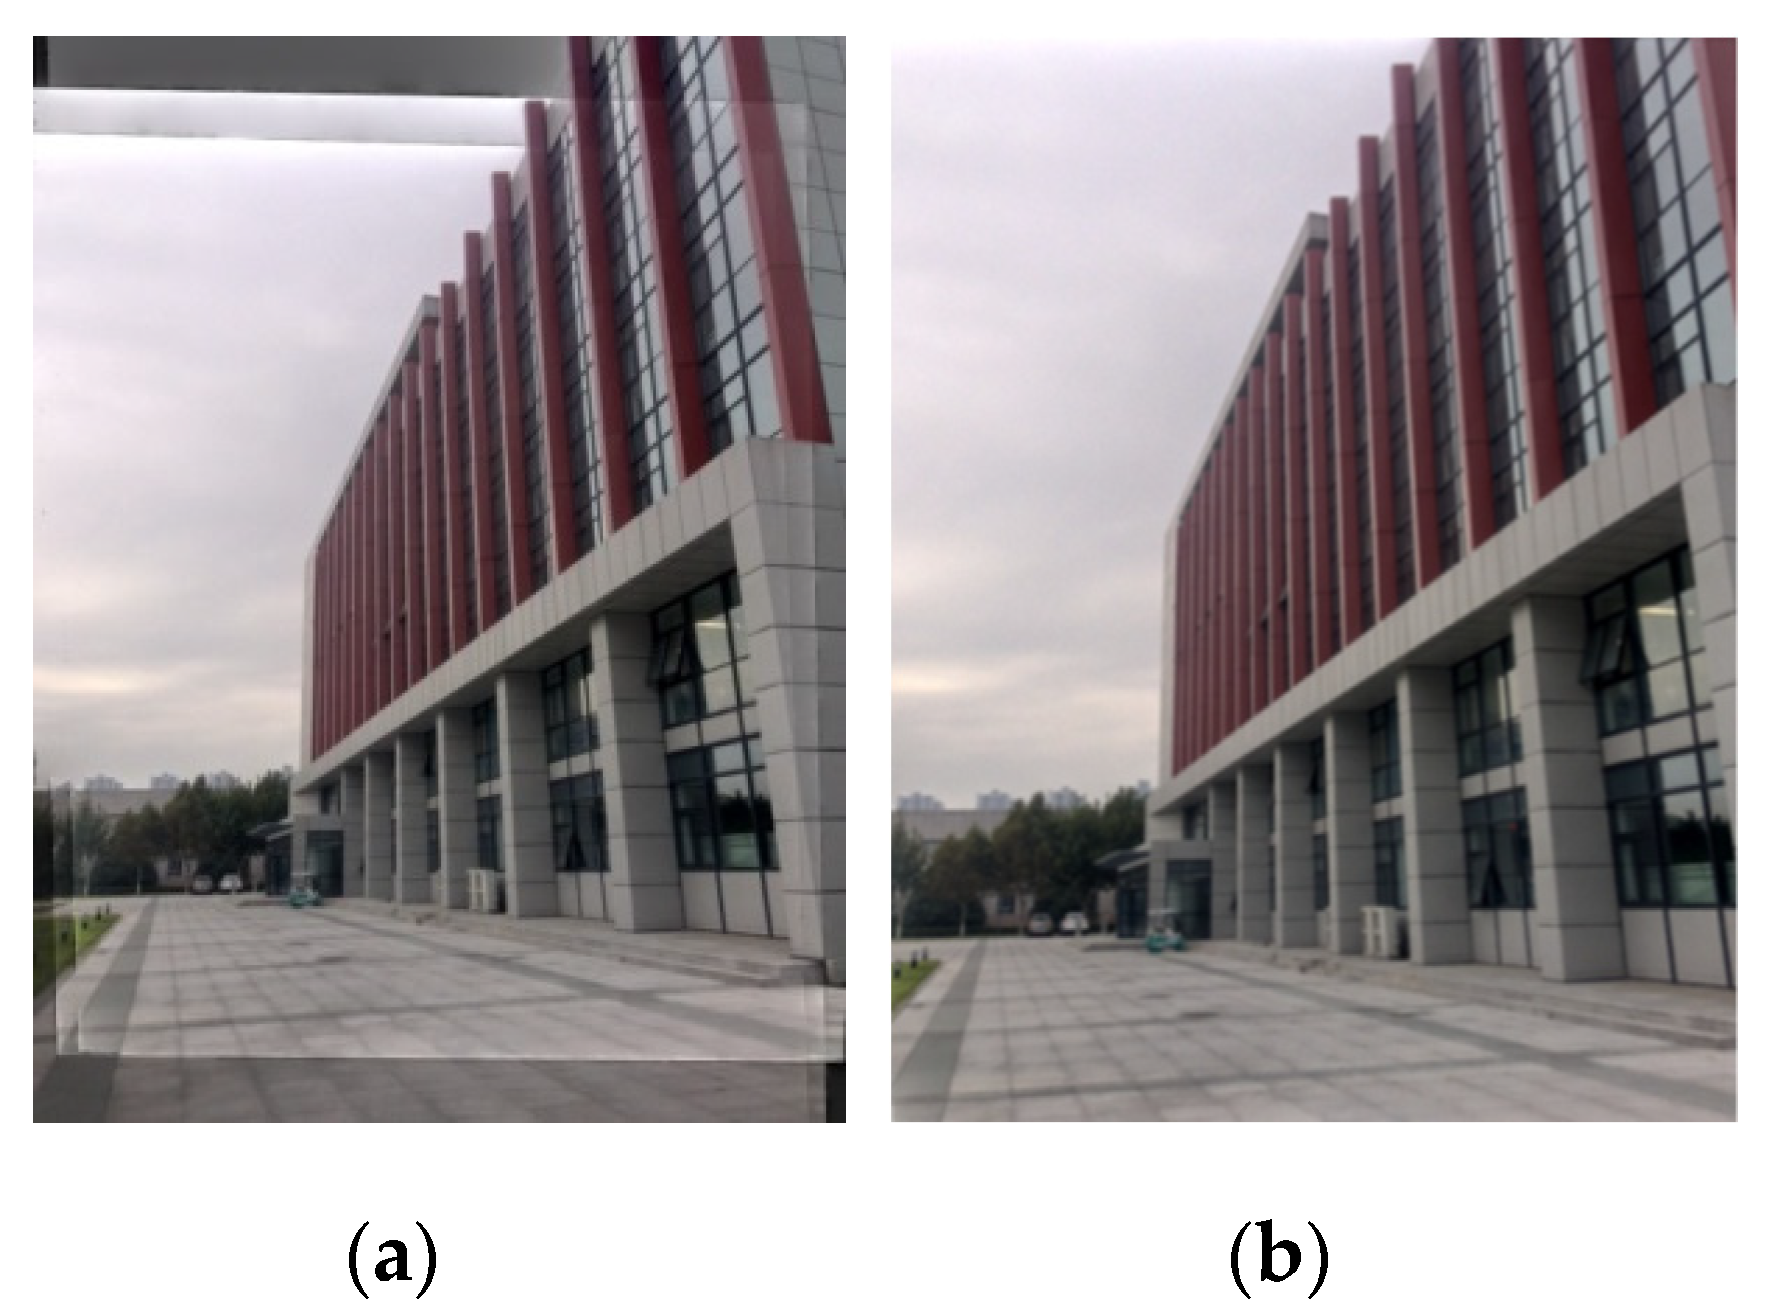
The registration results are described in Figure 5, in which the reference image is marked by the red box and the right four images are aligned images. It can be observed that the position offsets caused by camera shaking have been corrected and the coordinates of one pixel in different images are consistent.
3.4. Image Fusion
To improve the efficiency of the proposed algorithm, the simple Laplacian pyramid decomposition algorithm was used to fuse the registered raw image sequences, extracting the high-frequency information of the image and enriching the detailed information to achieve a better HDR fusion result. The calculation formula Gl (i, j) of the Gaussian pyramid layer l is shown in Equation (6):
where w (m, n) represents the 2-D low-pass filter, and N denotes the total number layer of the pyramid. Cl and Rl represent the height and width of the pyramid l-level image, respectively. Equation (6) was used to generate each layer of the Gaussian pyramid G1, G2, G3, ···, GN.
The function Expand () was used to expand each layer size of the Gaussian pyramid by interpolation, and the calculation formula is shown in Equation (7):
where Gl,k denotes the interpolation result of Gl. Gl,0 = Gl, and Gl,k = Expand(Gl,k-1)(0 ≤ k ≤ N). The Laplacian pyramid can be obtained by calculating the two different layers of the Gaussian pyramid:
The Gaussian pyramid is a set of low-pass filtered images, while the Laplacian pyramid is a set of band-pass filtered images. The image can be reconstructed by the Laplacian pyramid:
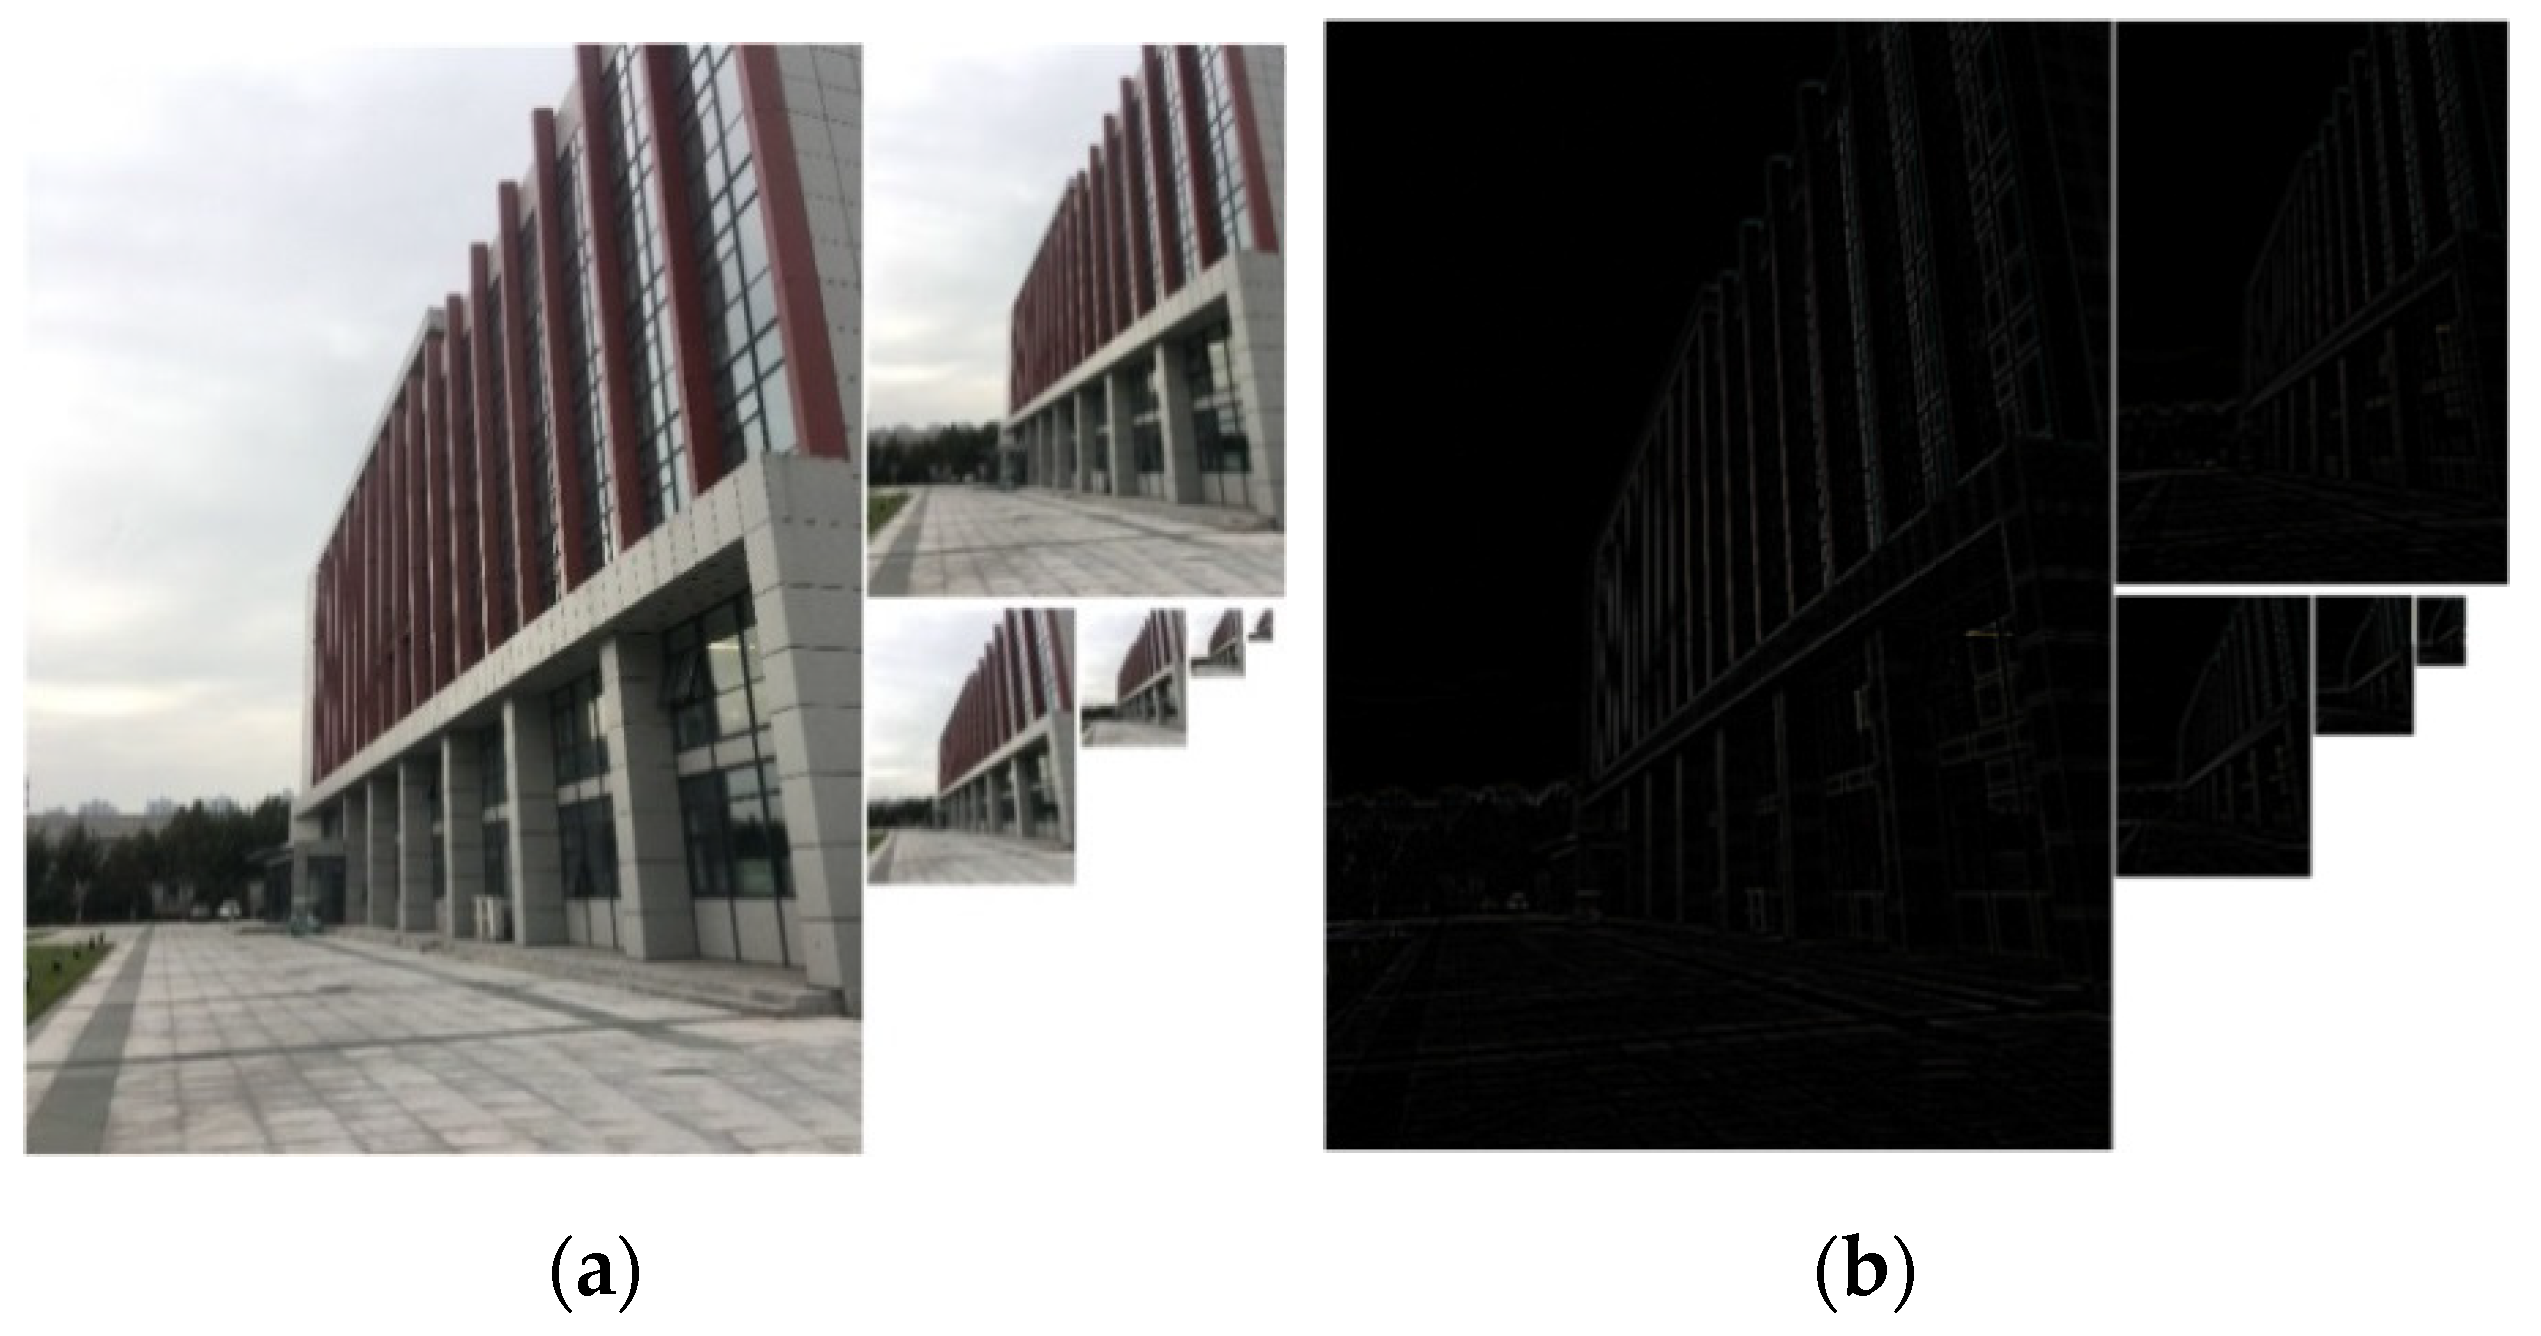
Equation (9) was used to reconstruct the image from the top to the bottom, and the bottom layer G0 is the reconstructed image. The Gaussian and Laplacian pyramids of raw images are shown in Figure 6.
The weighted average method was used for image fusion, and each exposure image was fused with the reference image by Equation (10).
where F is the fusion image of A and B, and A and B are the Laplacian components of the exposure image and reference image, respectively. Finally, for each exposure image sequence, the reference image was fused with each image of the exposure image sequence by the Laplacian pyramid method to generate the final HDR image, which could be displayed on the monitor directly without tone mapping.
4. Experiments and Results
4.1. Dataset
Camera shaking is inevitable in real shooting. Most of the existing multi-exposure image sequence datasets are in JPEG format with no camera shaking, and do not meet the requirements for real scenes. Considering the scarcity of large datasets for MEF in literature, a new dataset was collected for our experiment using the handheld iPhone6s plus smartphone, including 435 multi-exposure raw image sequences. Each image sequence consisted of 4–6 images with exposure values between −3EV and +3EV (inclusive), and the captured images had a resolution of 3024 × 4032 pixels. The scenes of the multi-exposure raw image dataset included buildings, cars, street lamps, scenery, benches, bridges, stones, etc., and each raw image had a corresponding JPEG format. The multi-exposure raw image sequences are shown in Figure 8.
4.2. Experiments
4.2.1. Experimental Results
Figure 9a shows the fusion result of a raw image sequence with the proposed method, and the fusion result of the corresponding JPEG image sequence can be observed in Figure 9b. The experiments were performed on a computer with an Intel Core i7-4790 CPU, 3.6 GHz processor and 8.0 GB RAM. JPEG images lose much image information in IPP, which results in the poor quality of the final HDR images. There is distinct ghosting in Figure 9b (red box), but the ghosting does not exist in Figure 9a, which indicates that the proposed method is superior to the traditional method based on JPEG images.
4.2.2. Comparison with Other Methods
Multi-method fusion for multi-exposure images. In this section, the proposed algorithm is compared with other traditional methods on multi-exposure raw image sequences. In Figure 10a–d, a multi-exposure raw image sequence is shown, and the fusion results are shown in Figure 10e–j. In Figure 10e–g the fusion results of three tone mapping methods [25,26,28] are provided, and appear to have distinct ghosting. Figure 10h represents the traditional direct fusion result using JPEG image sequences as inputs, the performance is extremely poor. Figure 10i depicts the fusion result of JPEG image sequences with our method and a significant improvement in image quality can be observed, but ghosting artifacts can be seen in the red box. Figure 10j shows the raw image sequence fusion result, which achieves a satisfactory performance. In conclusion, the anti-shake performance of the proposed algorithm is superior to other traditional methods based on multi-exposure JPEG image sequences.
Image quality evaluation. To further compare the performance of the proposed method with conventional methods, the quality of fusion results was evaluated using five evaluation criteria, including entropy, PSNR, average gradient, SSIM, and HDR-VDP-2.
- Entropy. The information entropy describes how much information is provided by the signal or image on average, as defined in Equation (1):
- PSNR. PSNR is the ratio between the maximum possible power of a signal and the power of corrupting noise that affects the fidelity. The larger the PSNR, the better the fusion result. The calculation formulae are shown in Equations (11)–(12):
- 3.
- Average gradient. The average gradient reflects the sharpness and texture of the image, as shown in Equation (13). When the average gradient is higher, the method is regarded as more effective.
- 4.
- SSIM. SSIM describes the similarity between two images. Equation (14) is used to calculate the similarity between the reference images and the fused HDR images. A larger value of SSIM indicates a smaller difference between the two images, and that the fusion result is of higher quality.
- 5.
- HDR-VDP-2. The HDR-VDP-2 [43] metric is based on the human visual perception model that can predict visibility and quality difference between two images. For quality differences, the metric produces a mean-opinion score (Q-score), which computes the quality degradation of the fused HDR images with respect to the reference images.
We randomly selected 150 exposure image sequences from the dataset to evaluate the fusion results by different methods. The sequence of exposed images and fusion results of the test are shown in Figure 11. In Figure 11a,b the exposure image sequence is shown, and the fusion results of different methods are shown in Figure 11e–j.
Table 2 reports the average evaluation scores of fusion results using different evaluation criteria and fusion methods. The fusion results of JPEG images have a higher information entropy value, but with a lower average gradient and serious blurring effects. The tone mapping methods of Drago, Durand, Reinhard, and Mantiuk have lower information entropy and fail to recover the lost details of over- or under-exposed regions. As shown in Table 2, the fusion results of the proposed method have a higher value than the other five methods in entropy, PSNR, and average gradient, indicating that the HDR images generated by the proposed method are clearer.
Moreover, the overall runtimes of the image-matching process of eight raw image sequences in Figure 8 were evaluated, as shown in Table 3, which report the average value of each image sequence of Figure 8a–h.
We can observe from Table 3 that most of the matching rates of raw images are higher than for JPEG images, and the runtimes for raw images are shorter than for JPEG images. There is little difference in runtime between raw and JPEG images, but the matching rates of raw images are higher than JPEG images, demonstrating that the proposed method can improve the matching rate with the same time consumption.
4.2.3. Image Fusion with the Extreme-Exposure Sequence
To test the robustness of the proposed method, we tested 100 sets of raw image pairs with extreme exposure, which contain very little image information owing to under- or over-exposure. The fusion results are demonstrated in Figure 12 and Figure 13. In Table 4 the fusion results are compared, and the average scores of the 100 extreme-exposure image pairs with entropy, PSNR, average gradient, SSIM, and HDR-VDP-2 are reported, confirming that the proposed method has strong robustness for extreme-exposure image pairs.
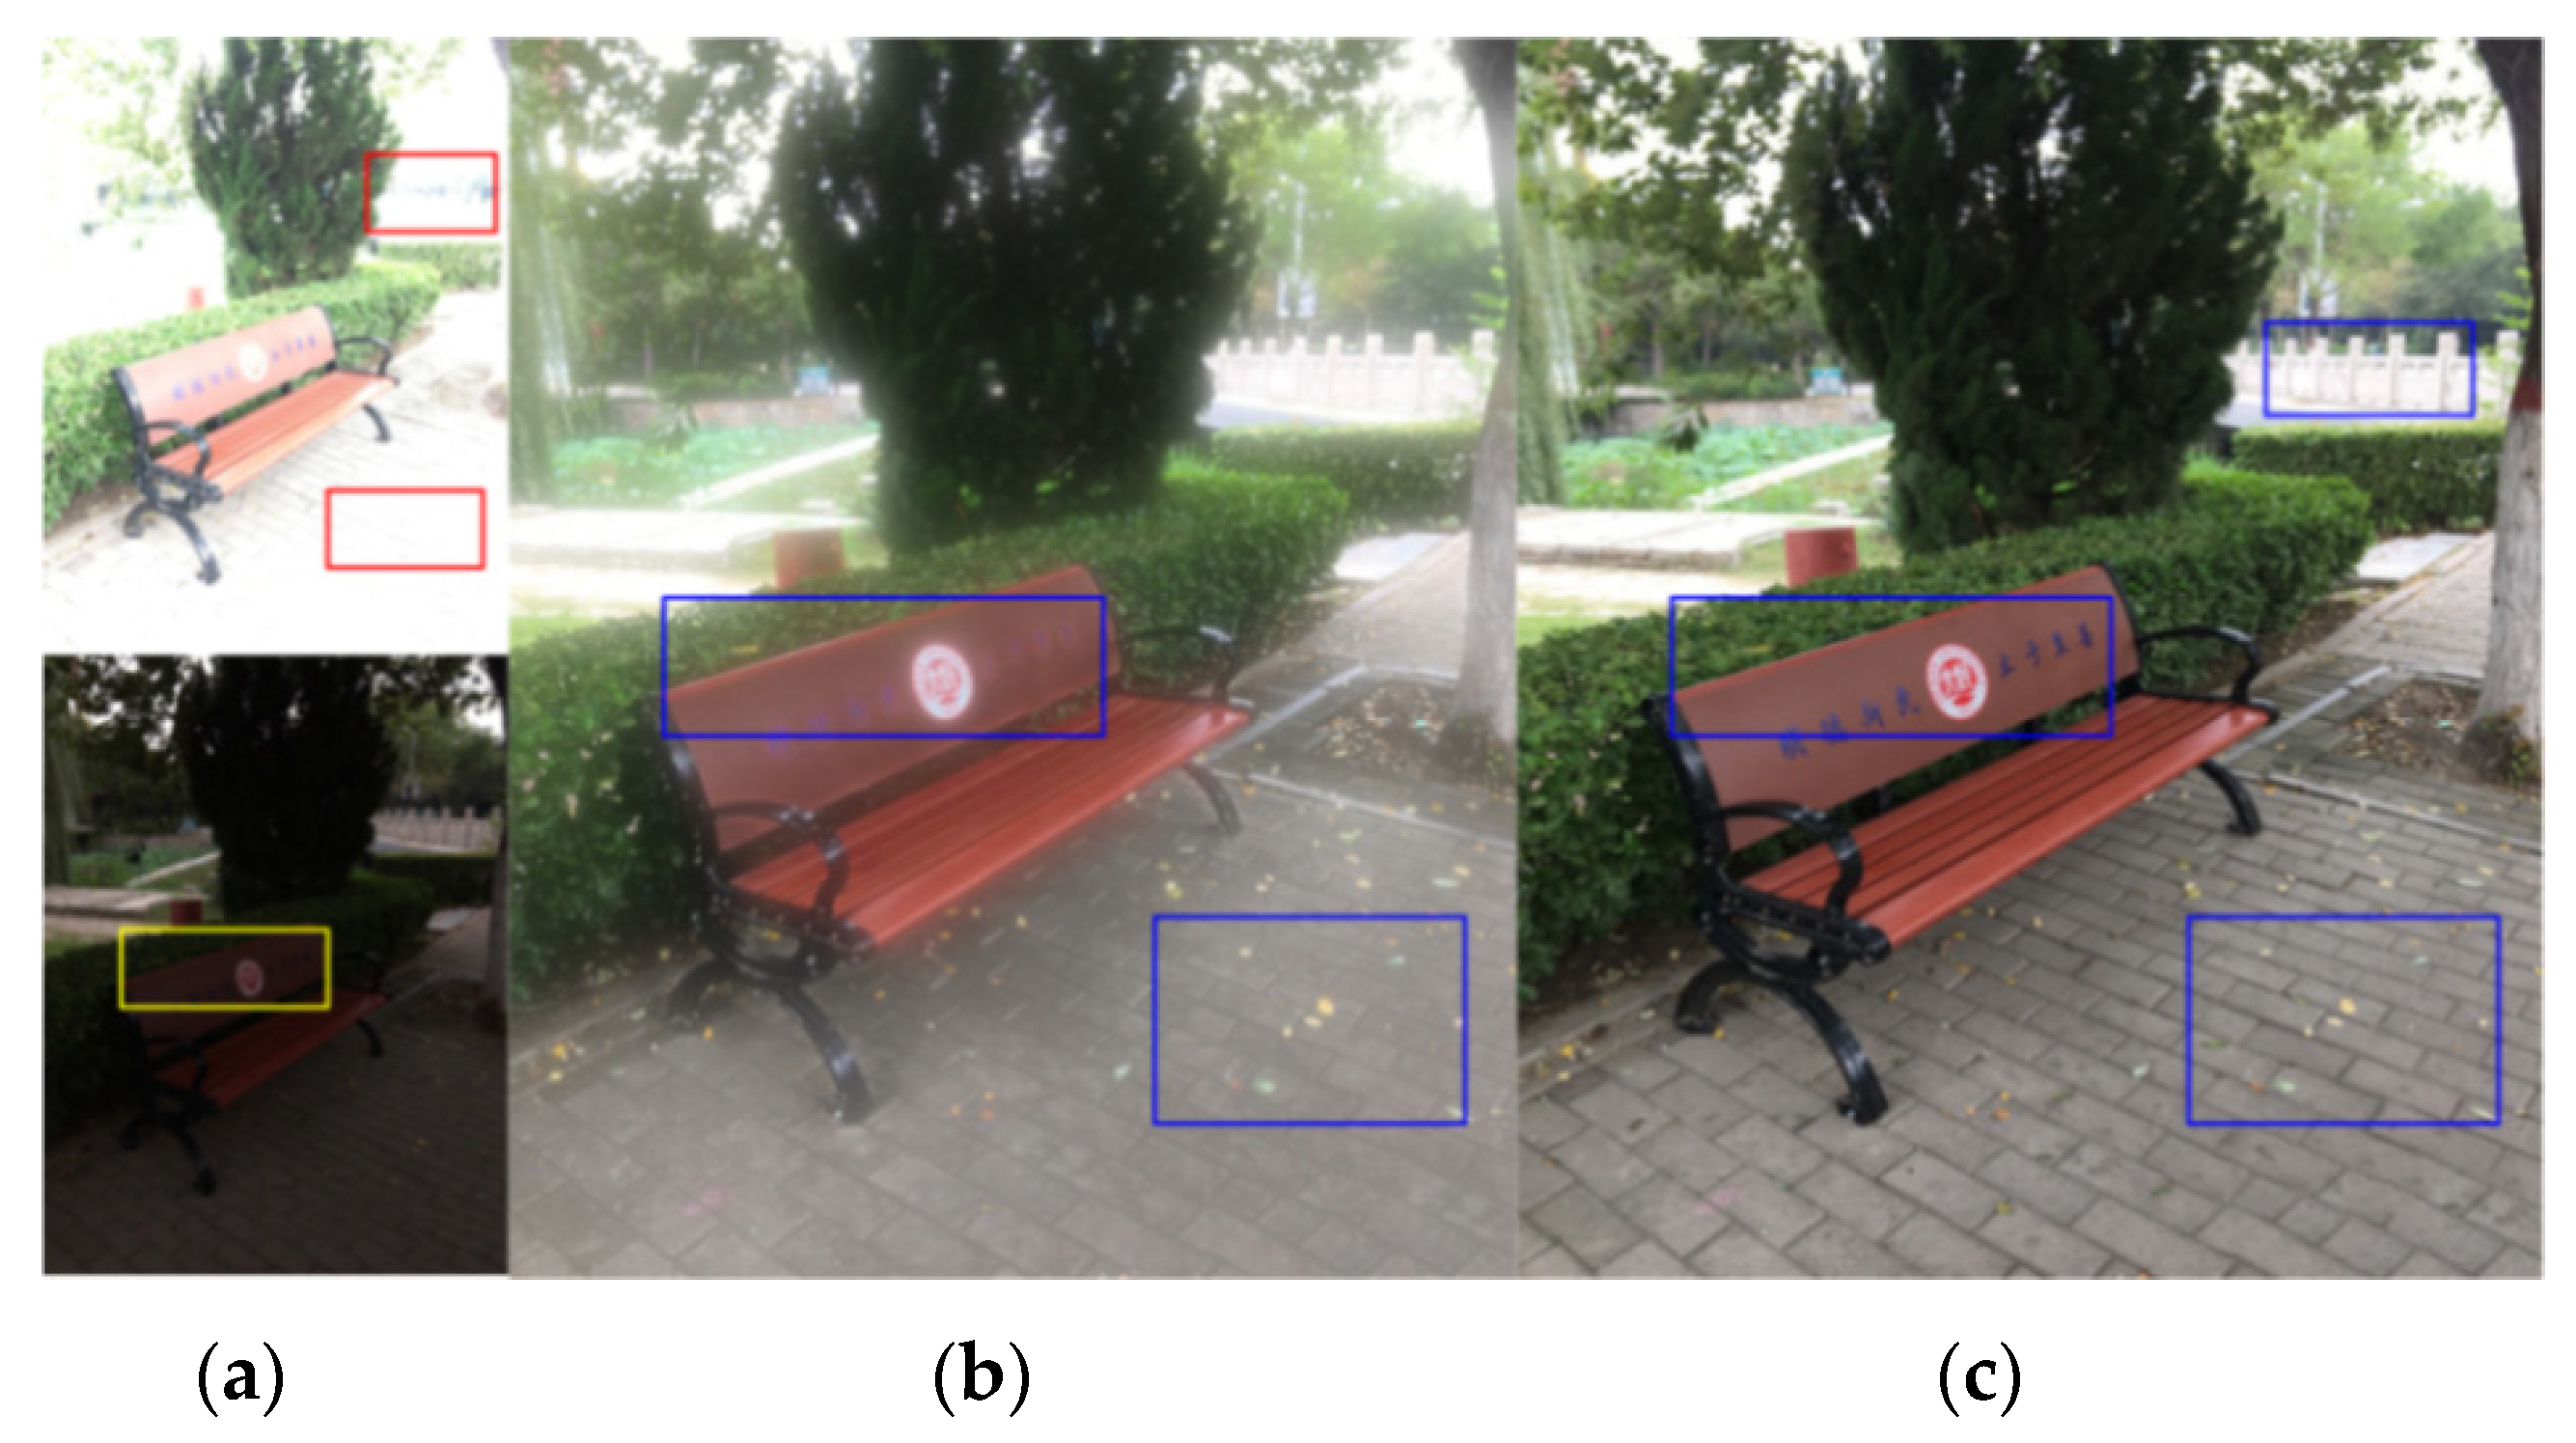
The red boxes in top of Figure 12a show the over-exposed regions which result in the loss of many image details, such as the outline of fence and the shape of bricks. Moreover, at the bottom of Figure 12a the lettering on the bench can barely be seen due to the lack of exposure in the yellow box. The blue boxes in Figure 12c show that the lost details generated by the proposed method have been recovered well. It can be seen that the fence, the blue writing on the bench, the rectangular bricks on the ground, and even the yellow leaves on the ground are demonstrated clearly. In contrast, the fusion results of compressed JPEG images are unsatisfactory; the words on the bench cannot be seen, and the shapes of the tiles are fuzzy (Figure 12b, blue boxes).
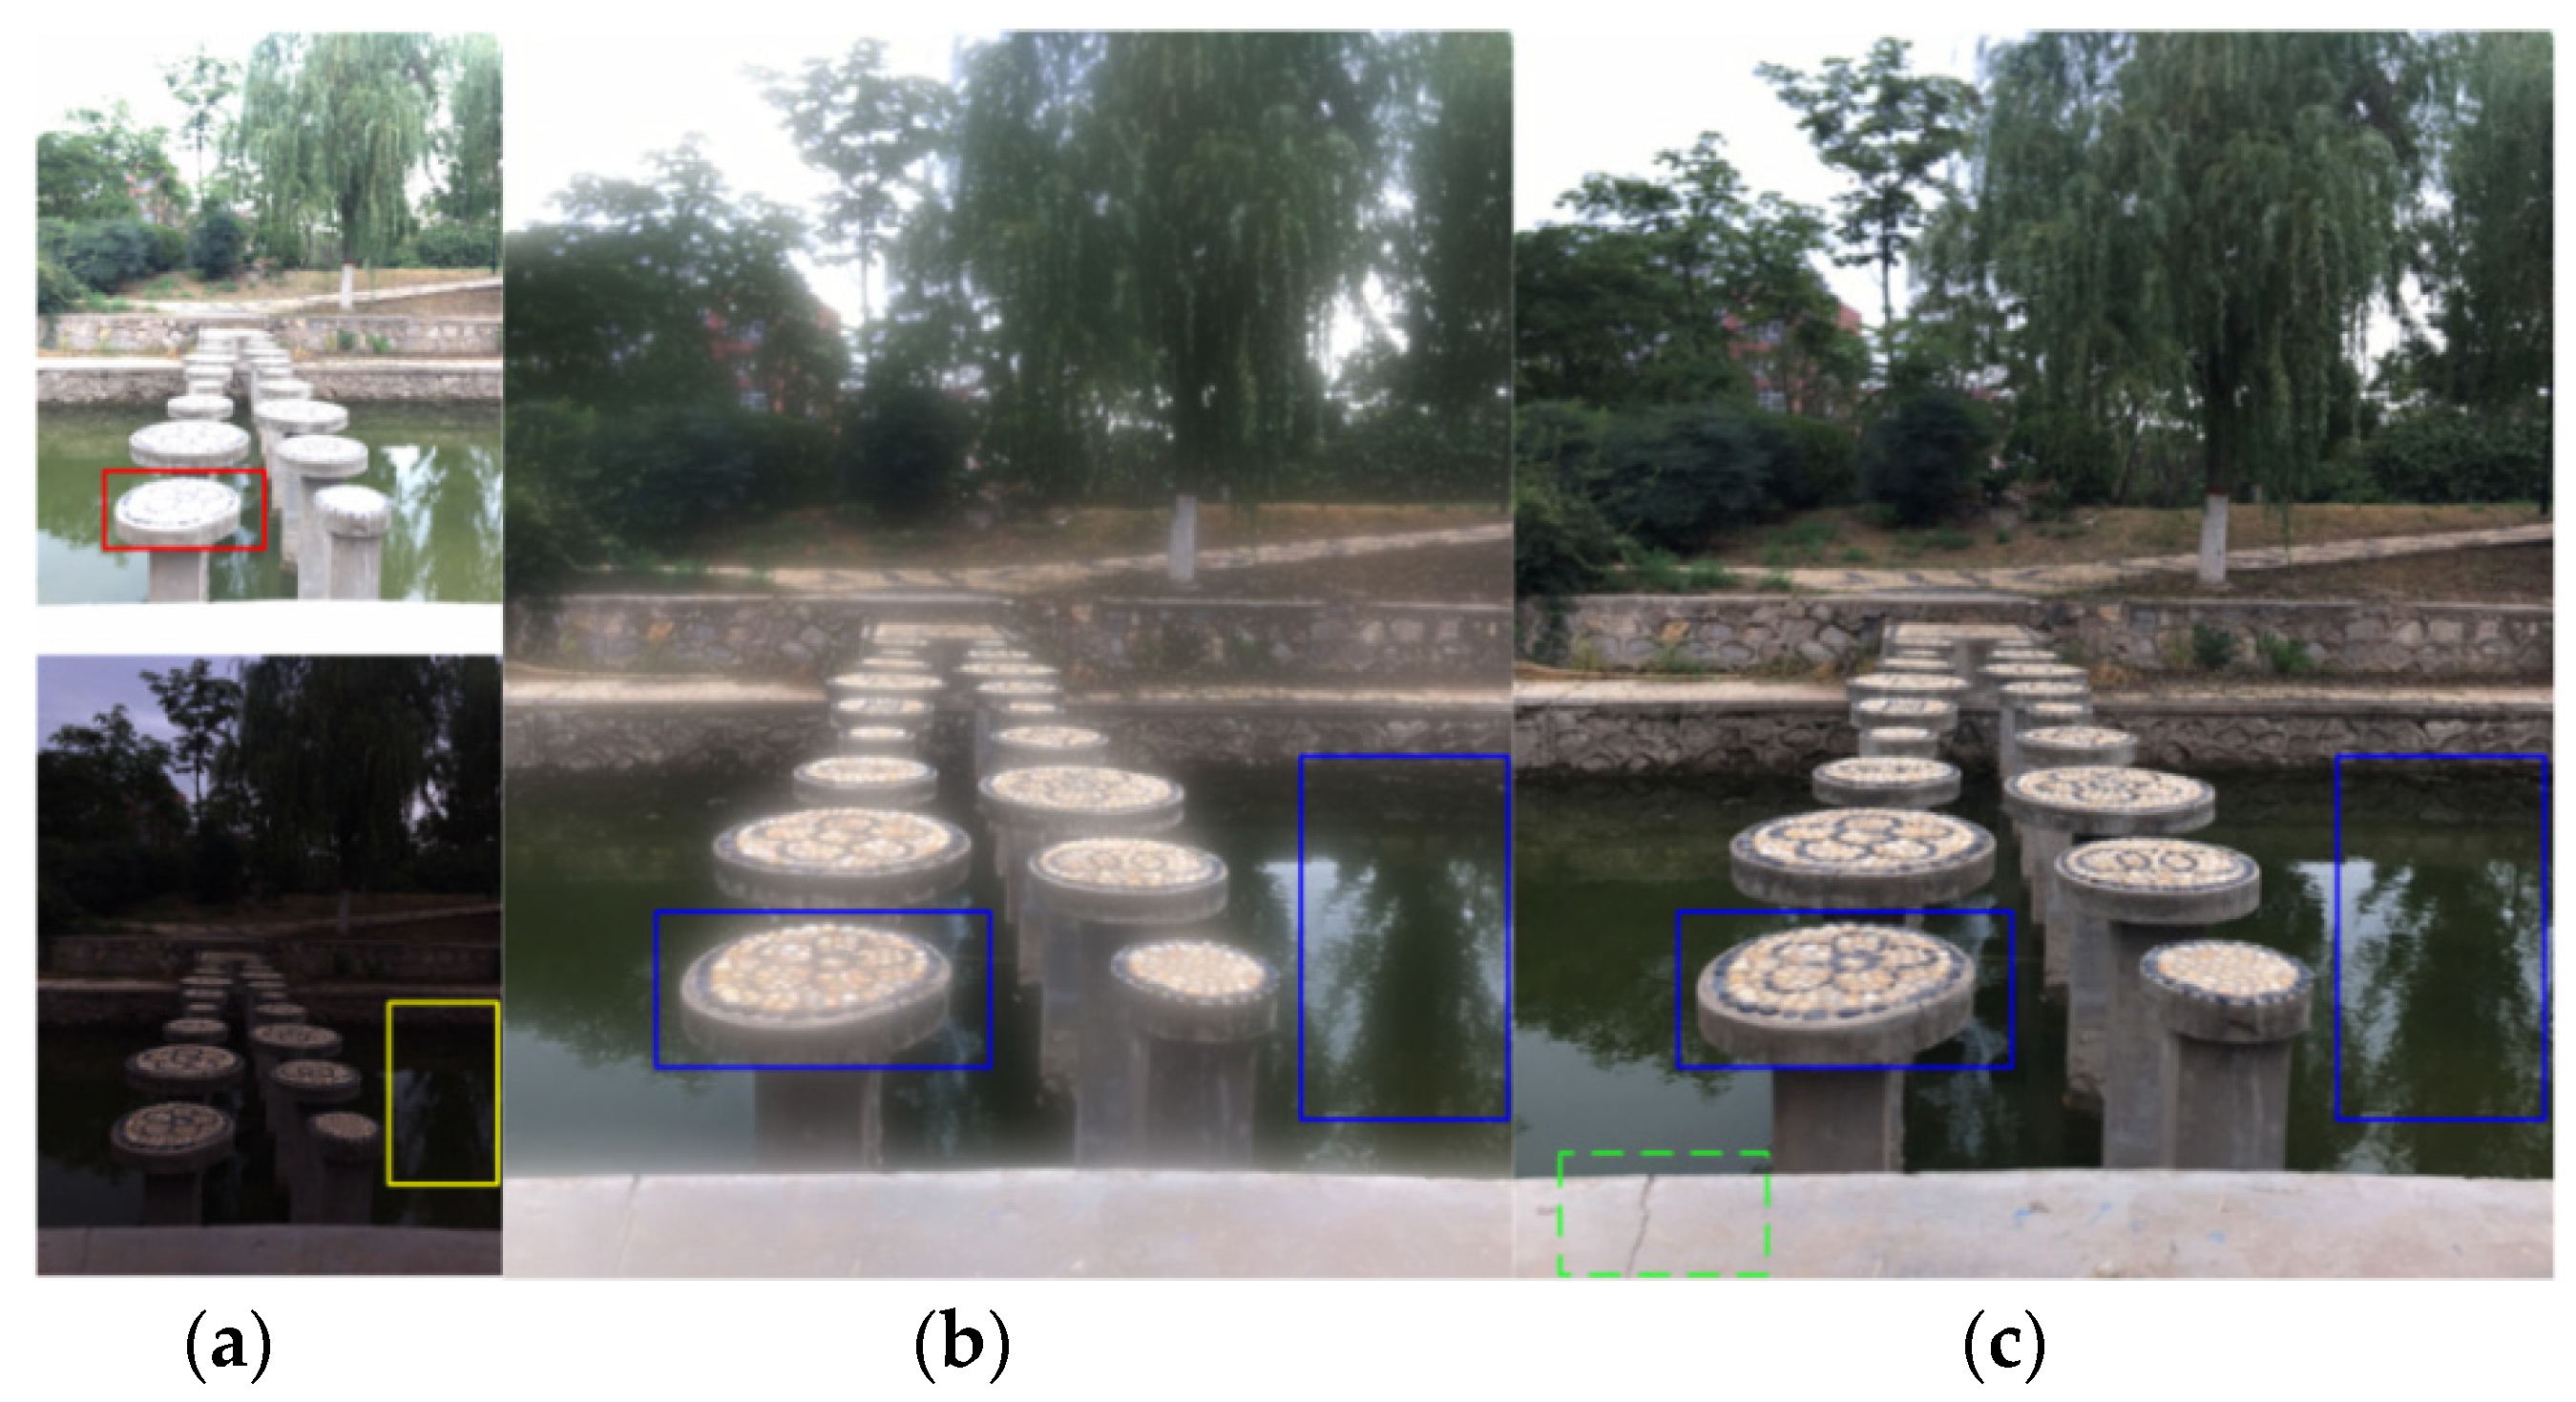
As shown in Figure 13a, the details of circular columns are lost due to over-exposure (region marked by red box), and there is no reflection in the water in the yellow box. The fusion results of JPEG images are shown in Figure 13b, where blurring of the stone in the circular columns can be seen. The blue boxes in Figure 13c show clear details and color fidelity, and the crack in the stone wall is also observed to be closer to the real-world scene. In summary, the experimental results show that our fusion method achieves an outstanding effect, even in extreme exposure conditions.
5. Conclusions
In this paper, an anti-shake HDR acquisition method based on raw camera data was presented, and a new raw image dataset of a real scene was created. Compared with traditional algorithms, the proposed method retained more HDR image details by using raw images as inputs, avoiding the artifacts caused by camera shaking and object movement. The performance of the proposed method was evaluated using extreme-exposure image pairs. A better HDR image result was found as compared to existing algorithms; hence, the proposed method can be used in binocular or multi-sensor vision systems. The proposed method also has a lower algorithm complexity than deep learning-based fusion methods and adapts more easily to real processing.
Author Contributions
Conceptualization, Y.L. and B.L.; methodology, Y.L. and B.L.; software, W.H.; formal analysis, Y.L.; investigation, B.J. and C.L.; resources, Y.L.; data curation, W.H.; writing—original draft preparation, Y.L. and C.L.; writing—review and editing, Y.L., B.L., W.H., B.J., and C.L.; visualization, B.J. All authors have read and agreed to the published version of the manuscript.
Funding
This research was funded by the National Natural Science Foundation of China, grant numbers 61605175, 61602423 and the Department of Science and Technology of Henan Province, China, grant numbers 192102210292, 182102110399.
Acknowledgments
In this section you can acknowledge any support given which is not covered by the author contribution or funding sections. This may include administrative and technical support, or donations in kind (e.g., materials used for experiments).
Conflicts of Interest
The authors declare no conflict of interest.
References
- Shafie, S.; Kawahito, S.; Itoh, S. A dynamic range expansion technique for CMOS image sensors with dual charge storage in a pixel and multiple sampling. Sensors 2008, 8, 1915–1926. [Google Scholar] [CrossRef] [PubMed] [Green Version]
- Shafie, S.; Kawahito, S.; Halin, I.A.; Hasan, W.Z.W. Non-linearity in wide dynamic range CMOS image sensors utilizing a partial charge transfer technique. Sensors 2009, 9, 9452–9467. [Google Scholar] [CrossRef] [PubMed]
- Martínez-Sánchez, A.; Fernández, C.; Navarro, P.J.; Iborra, A. A novel method to increase LinLog CMOS sensors’ performance in high dynamic range scenarios. Sensors 2011, 11, 8412–8429. [Google Scholar] [CrossRef] [PubMed] [Green Version]
- Agusanto, K.; Li, L.; Chuangui, Z.; Sing, N.W. Photorealistic rendering for augmented reality using environment illumination. In Proceedings of the Second IEEE and ACM International Symposium on Mixed and Augmented Reality, Tokyo, Japan, 10 October 2003; pp. 208–216. [Google Scholar]
- Quevedo, E.; Delory, E.; Callicó, G.; Tobajas, F.; Sarmiento, R. Underwater video enhancement using multi-camera super-resolution. Opt. Commun. 2017, 404, 94–102. [Google Scholar] [CrossRef]
- Ward, G.; Reinhard, E.; Debevec, P. High dynamic range imaging & image-based lighting. In ACM SIGGRAPH 2008 Classes; Association for Computing Machinery: New York, NY, USA, 2008; pp. 1–137. [Google Scholar]
- Debevec, P. Image-based lighting. In ACM SIGGRAPH 2006 Courses; Association for Computing Machinery: New York, NY, USA, 2006; p. 4. [Google Scholar]
- Debevec, P.; McMillan, L. Image-based modeling, rendering, and lighting. IEEE Comput. Graph. Appl. 2002, 22, 24–25. [Google Scholar] [CrossRef] [Green Version]
- Pece, F.; Kautz, J. Bitmap movement detection: HDR for dynamic scenes. In Proceedings of the 2010 Conference on Visual Media Production, London, UK, 17–18 November 2010; pp. 1–8. [Google Scholar]
- Dong, Y.; Pourazad, M.T.; Nasiopoulos, P. Human visual system-based saliency detection for high dynamic range content. IEEE Trans. Multimed. 2016, 18, 549–562. [Google Scholar] [CrossRef]
- Lin, Y.-T.; Wang, C.-M.; Chen, W.-S.; Lin, F.-P.; Lin, W. A novel data hiding algorithm for high dynamic range images. IEEE Trans. Multimed. 2016, 19, 196–211. [Google Scholar] [CrossRef]
- Ravuri, C.S.; Sureddi, R.; Dendi, S.V.R.; Raman, S.; Channappayya, S.S. Deep no-reference tone mapped image quality assessment. In Proceedings of the 2019 53rd Asilomar Conference on Signals, Systems, and Computers, Systems, and Computers, Pacific Grove, CA, USA, 3–6 November 2019; pp. 1906–1910. [Google Scholar]
- Hadizadeh, H.; Bajić, I.V. Full-reference objective quality assessment of tone-mapped images. IEEE Trans. Multimed. 2017, 20, 392–404. [Google Scholar] [CrossRef]
- Eden, A.; Uyttendaele, M.; Szeliski, R. Seamless image stitching of scenes with large motions and exposure differences. In Proceedings of the 2006 IEEE Computer Society Conference on Computer Vision and Pattern Recognition (CVPR‘06), New York, NY, USA, 17–22 June 2006; pp. 2498–2505. [Google Scholar]
- Endo, Y.; Kanamori, Y.; Mitani, J. Deep reverse tone mapping. Acm Trans. Graph. 2017, 36, 177. [Google Scholar] [CrossRef]
- Liu, Y.; Wang, Z. Dense SIFT for ghost-free multi-exposure fusion. J. Vis. Commun. Image Represent. 2015, 31, 208–224. [Google Scholar] [CrossRef]
- Li, Z.; Wei, Z.; Wen, C.; Zheng, J. Detail-enhanced multi-scale exposure fusion. IEEE Trans. Image Process. 2017, 26, 1243–1252. [Google Scholar] [CrossRef] [PubMed]
- Eilertsen, G.; Unger, J.; Mantiuk, R.K. Evaluation of tone mapping operators for HDR video. In High Dynamic Range Video; Academic Press: Cambridge, MA, USA, 2016; pp. 185–207. [Google Scholar]
- Shen, J.; Zhao, Y.; Yan, S.; Li, X. Exposure fusion using boosting Laplacian pyramid. IEEE Trans. Cybern. 2014, 44, 1579–1590. [Google Scholar] [CrossRef] [PubMed]
- Lee, D.-H.; Fan, M.; Kim, S.-W.; Kang, M.-C.; Ko, S.-J. High dynamic range image tone mapping based on asymmetric model of retinal adaptation. Signal Process. Image Commun. 2018, 68, 120–128. [Google Scholar] [CrossRef]
- Ma, K.; Yeganeh, H.; Zeng, K.; Wang, Z. High dynamic range image tone mapping by optimizing tone mapped image quality index. In Proceedings of the 2014 IEEE International Conference on Multimedia and Expo (ICME), Chengdu, China, 14–18 July 2014; pp. 1–6. [Google Scholar]
- Liu, Z.; Yin, H.; Fang, B.; Chai, Y. A novel fusion scheme for visible and infrared images based on compressive sensing. Opt. Commun. 2015, 335, 168–177. [Google Scholar] [CrossRef]
- Kinoshita, Y.; Yoshida, T.; Shiota, S.; Kiya, H. Pseudo multi-exposure fusion using a single image. In Proceedings of the 2017 Asia-Pacific Signal and Information Processing Association Annual Summit and Conference (APSIPA ASC), Kuala Lumpur, Malaysia, 12–15 December 2017; pp. 263–269. [Google Scholar]
- Huo, Y.; Zhang, X. Single image-based HDR imaging with CRF estimation. In Proceedings of the 2016 International Conference On Communication Problem-Solving (ICCP), Taipei, Taiwan, 7–9 September 2016; pp. 1–3. [Google Scholar]
- Reinhard, E.; Stark, M.; Shirley, P.; Ferwerda, J. Photographic tone reproduction for digital images. In Proceedings of the 29th Annual Conference on Computer Graphics and Interactive Techniques, San Antonio, TX, USA, 23–26 July 2002; pp. 267–276. [Google Scholar]
- Mantiuk, R.; Daly, S.; Kerofsky, L. Display adaptive tone mapping. In ACM SIGGRAPH 2008 Papers; Association for Computing Machinery: New York, NY, USA, 2008; pp. 1–10. [Google Scholar]
- Durand, F.; Dorsey, J. Fast bilateral filtering for the display of high-dynamic-range images. In Proceedings of the 29th Annual Conference on Computer Graphics and Interactive Techniques, San Antonio, TX, USA, 23–26 July 2002; pp. 257–266. [Google Scholar]
- Drago, F.; Myszkowski, K.; Annen, T.; Chiba, N. Adaptive logarithmic mapping for displaying high contrast scenes. In Computer Graphics Forum; Blackwell Publishing: Oxford, UK, 2003; pp. 419–426. [Google Scholar]
- Zhang, W.; Liu, X.; Wang, W.; Zeng, Y. Multi-exposure image fusion based on wavelet transform. Int. J. Adv. Robot. Syst. 2018, 15, 1729881418768939. [Google Scholar] [CrossRef] [Green Version]
- Vanmali, A.V.; Kelkar, S.G.; Gadre, V.M. Multi-exposure image fusion for dynamic scenes without ghost effect. In Proceedings of the 2015 Twenty First National Conference on Communications (NCC), Mumbai, India, 27 February–1 March 2015; pp. 1–6. [Google Scholar]
- Kinoshita, Y.; Shiota, S.; Kiya, H.; Yoshida, T. Multi-exposure image fusion based on exposure compensation. In Proceedings of the 2018 IEEE International Conference on Acoustics, Speech and Signal Processing (ICASSP), Calgary, AB, Canada, 15–20 April 2018; pp. 1388–1392. [Google Scholar]
- Sen, P.; Kalantari, N.K.; Yaesoubi, M.; Darabi, S.; Goldman, D.B.; Shechtman, E. Robust patch-based hdr reconstruction of dynamic scenes. Acm Trans. Graph. 2012, 31, 203:201–203:211. [Google Scholar] [CrossRef]
- Li, Z.; Zheng, J.; Zhu, Z.; Wu, S. Selectively detail-enhanced fusion of differently exposed images with moving objects. IEEE Trans. Image Process. 2014, 23, 4372–4382. [Google Scholar] [CrossRef]
- Ying, Z.; Li, G.; Ren, Y.; Wang, R.; Wang, W. A new image contrast enhancement algorithm using exposure fusion framework. In Proceedings of the International Conference on Computer Analysis of Images and Patterns, Ystad, Sweden, 22–24 August 2017; pp. 36–46. [Google Scholar]
- Chen, C.; Chen, Q.; Xu, J.; Koltun, V. Learning to see in the dark. In Proceedings of the IEEE Conference on Computer Vision and Pattern Recognition, Salt Lake City, UT, USA, 18–22 June 2018; pp. 3291–3300. [Google Scholar]
- Shen, L.; Yue, Z.; Feng, F.; Chen, Q.; Liu, S.; Ma, J. Msr-net: Low-light image enhancement using deep convolutional network. arXiv 2017, arXiv:1711.02488. [Google Scholar]
- Yang, B.; Zhong, J.; Li, Y.; Chen, Z. Multi-focus image fusion and super-resolution with convolutional neural network. Int. J. WaveletsMultiresolution Inf. Process. 2017, 15, 1750037. [Google Scholar] [CrossRef]
- Hasinoff, S.W.; Sharlet, D.; Geiss, R.; Adams, A.; Barron, J.T.; Kainz, F.; Chen, J.; Levoy, M. Burst photography for high dynamic range and low-light imaging on mobile cameras. Acm Trans. Graph. (Tog) 2016, 35, 1–12. [Google Scholar] [CrossRef]
- Brooks, T.; Mildenhall, B.; Xue, T.; Chen, J.; Sharlet, D.; Barron, J.T. Unprocessing images for learned raw denoising. In Proceedings of the IEEE Conference on Computer Vision and Pattern Recognition, San Francisco, CA, USA, 13–18 June 2019; pp. 11036–11045. [Google Scholar]
- Ihara, S. Information Theory for Continuous Systems; World Scientific: Hackensack, NJ, USA, 1993. [Google Scholar]
- Rublee, E.; Rabaud, V.; Konolige, K.; Bradski, G. ORB: An efficient alternative to SIFT or SURF. In Proceedings of the 2011 International Conference on Computer Vision, Barcelona, Spain, 6–13 November 2011; pp. 2564–2571. [Google Scholar]
- Fischler, M.A.; Bolles, R.C. Random sample consensus: A paradigm for model fitting with applications to image analysis and automated cartography. Commun. Acm 1981, 24, 381–395. [Google Scholar] [CrossRef]
- Narwaria, M.; Mantiuk, R.; Da Silva, M.P.; Le Callet, P. HDR-VDP-2.2: A calibrated method for objective quality prediction of high-dynamic range and standard images. J. Electron. Imaging 2015, 24, 010501. [Google Scholar] [CrossRef] [Green Version]
Figure 1.
Different image processing pipelines. (a) Traditional color image processing pipeline. (b) Traditional direct fusion pipeline for multi-exposure images. (c) Improved traditional multi-exposure image fusion pipeline. (d) The pipeline of the proposed algorithm.
Figure 1.
Different image processing pipelines. (a) Traditional color image processing pipeline. (b) Traditional direct fusion pipeline for multi-exposure images. (c) Improved traditional multi-exposure image fusion pipeline. (d) The pipeline of the proposed algorithm.


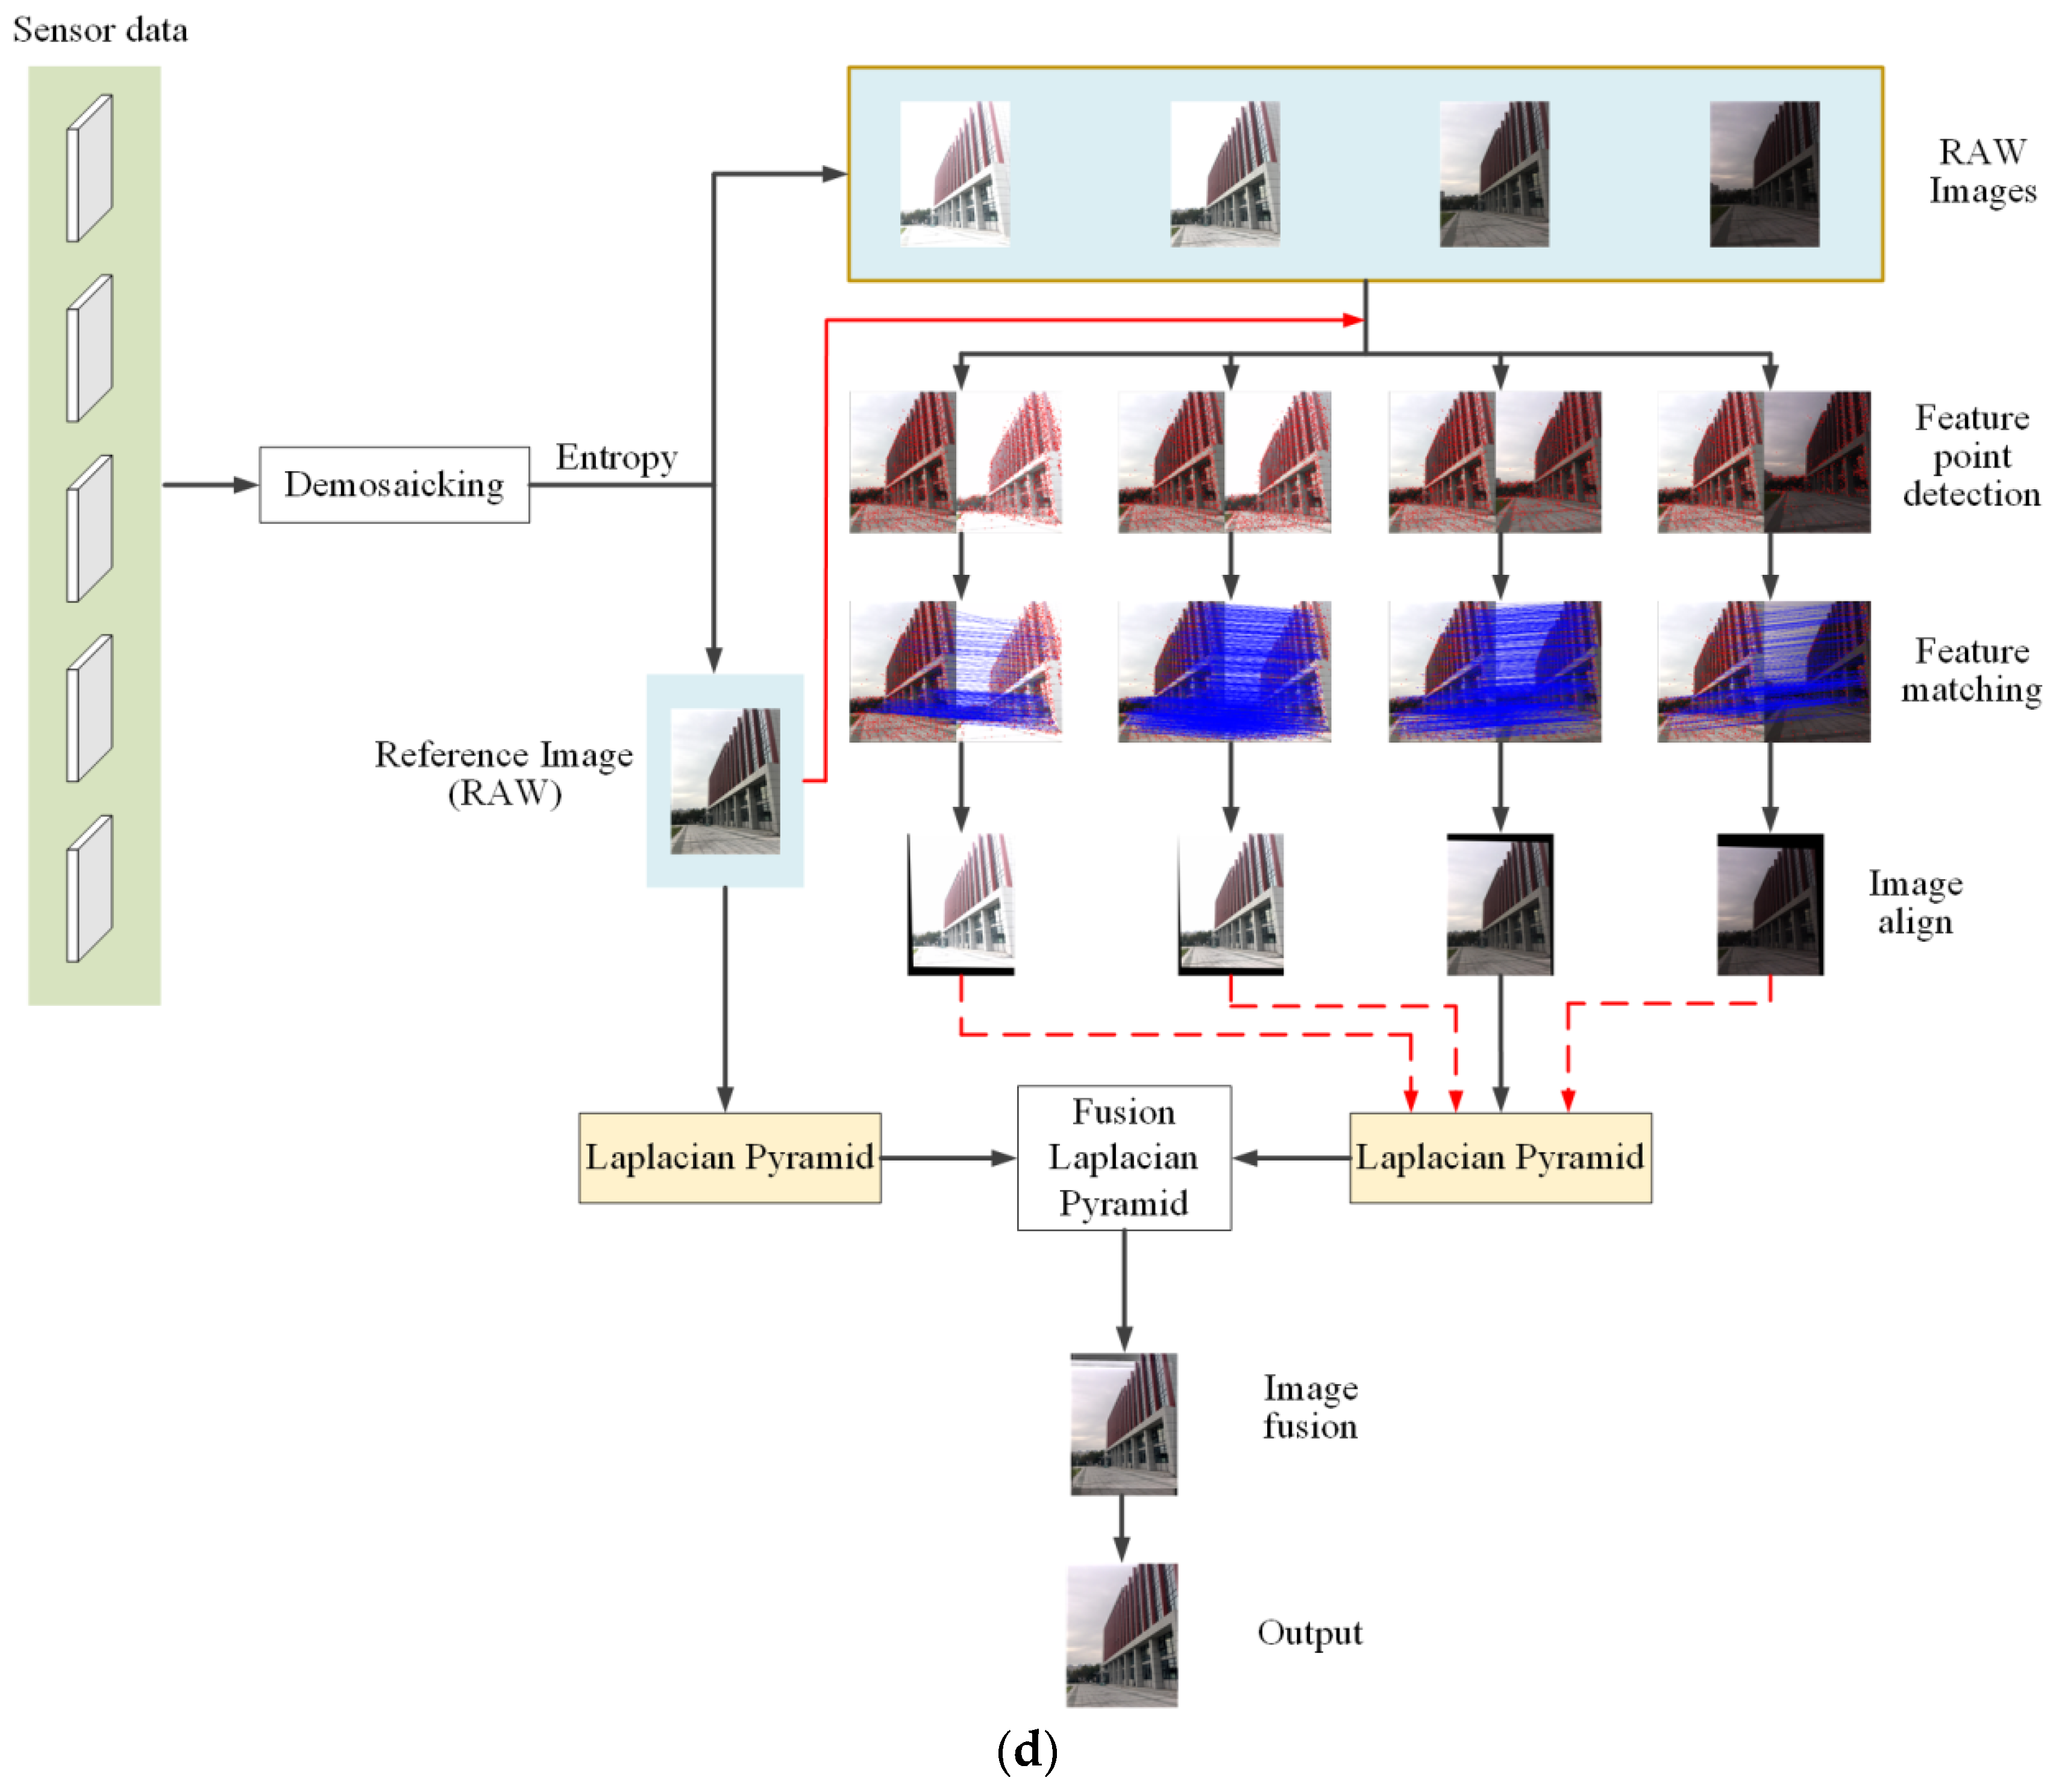
Figure 2.
Color filter array (CFA).

Figure 3.
Oriented FAST and Rotated BRIEF (ORB) detection results of the raw image with different levels of exposure.
Figure 3.
Oriented FAST and Rotated BRIEF (ORB) detection results of the raw image with different levels of exposure.

Figure 4.
The matching results of raw exposure sequence. (a) The results without rejecting incorrect matches. (b) The final matching results by the RANSAC algorithm.
Figure 4.
The matching results of raw exposure sequence. (a) The results without rejecting incorrect matches. (b) The final matching results by the RANSAC algorithm.

Figure 5.
The results of image registration.

Figure 6.
The Gaussian and Laplacian pyramid results of the raw image. (a) The result of the Gaussian pyramid; (b) The result of the Laplacian pyramid.
Figure 6.
The Gaussian and Laplacian pyramid results of the raw image. (a) The result of the Gaussian pyramid; (b) The result of the Laplacian pyramid.

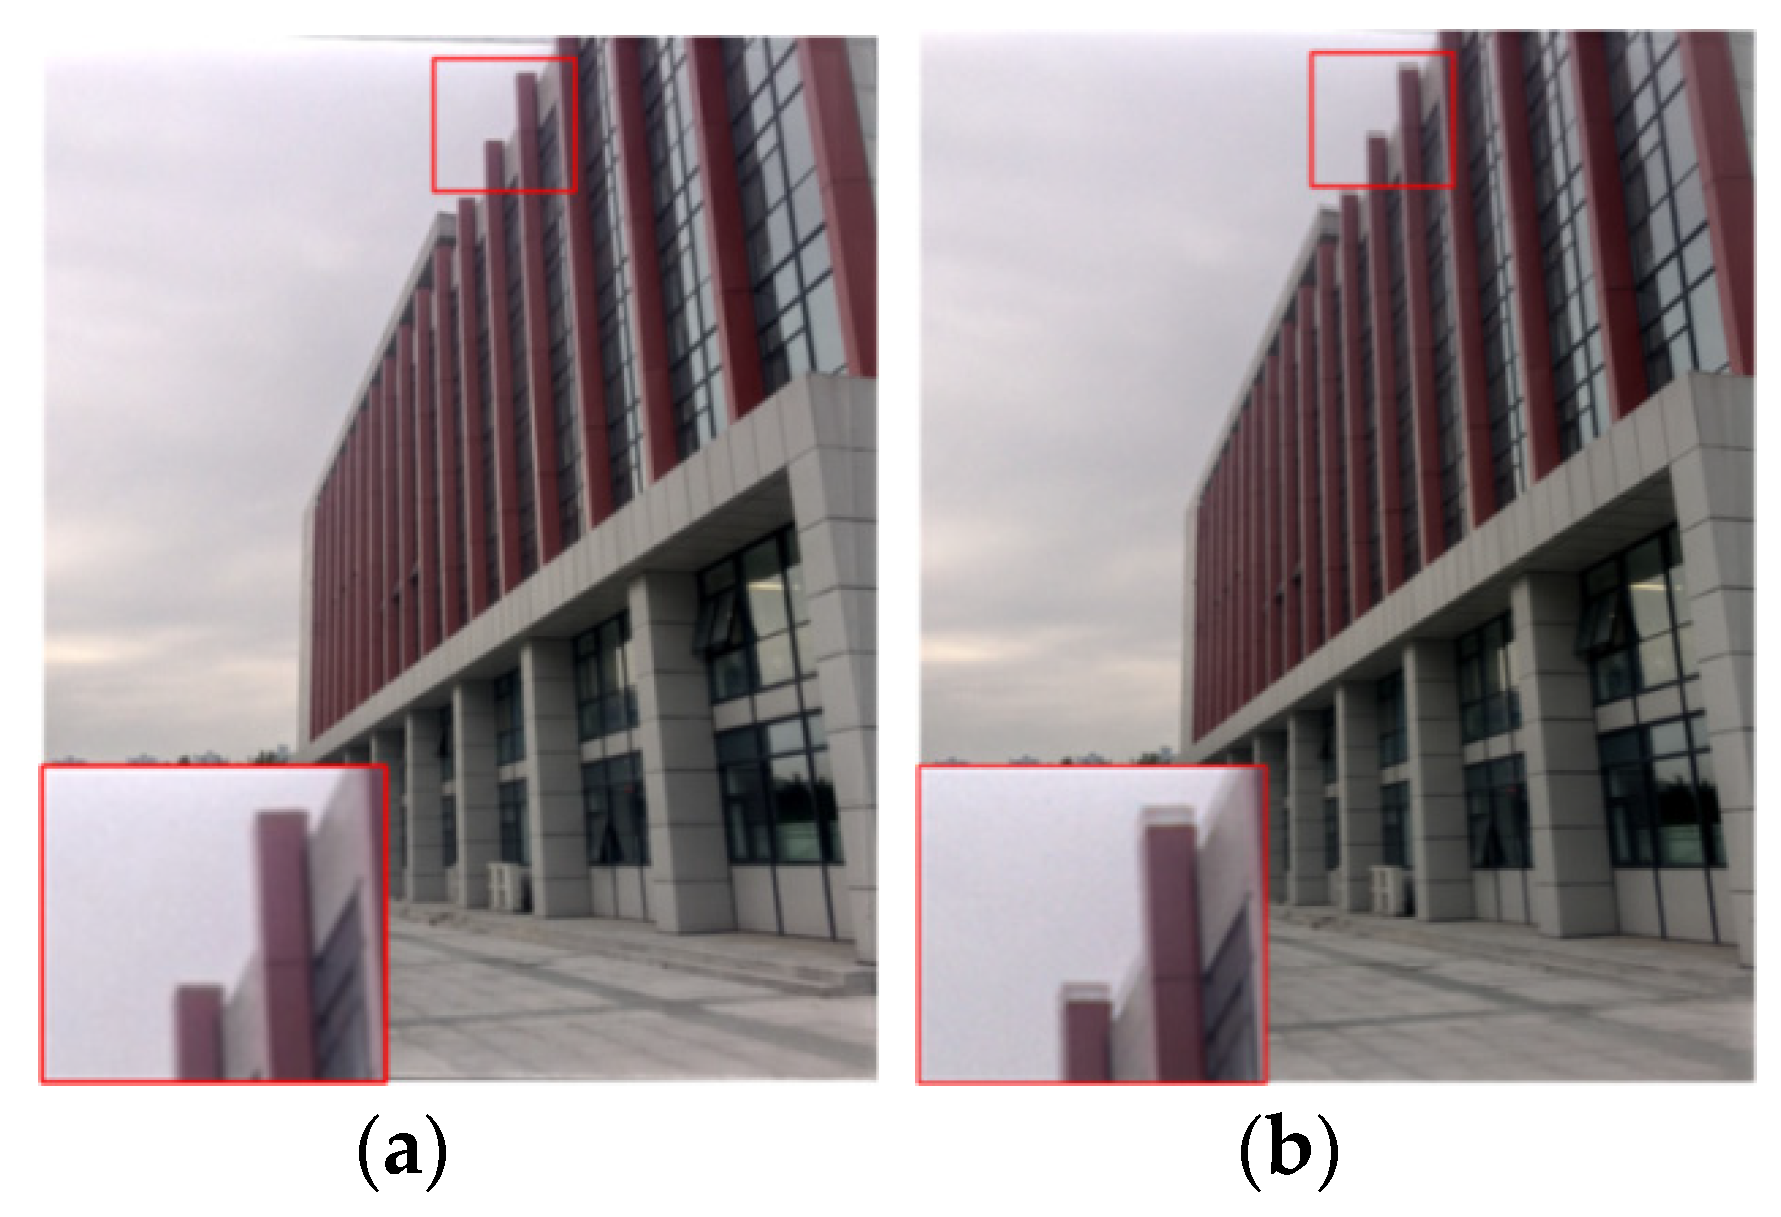
Figure 7.
High-dynamic-range (HDR) fusion results. (a) Fusion result; (b) clipped result.

Figure 8.
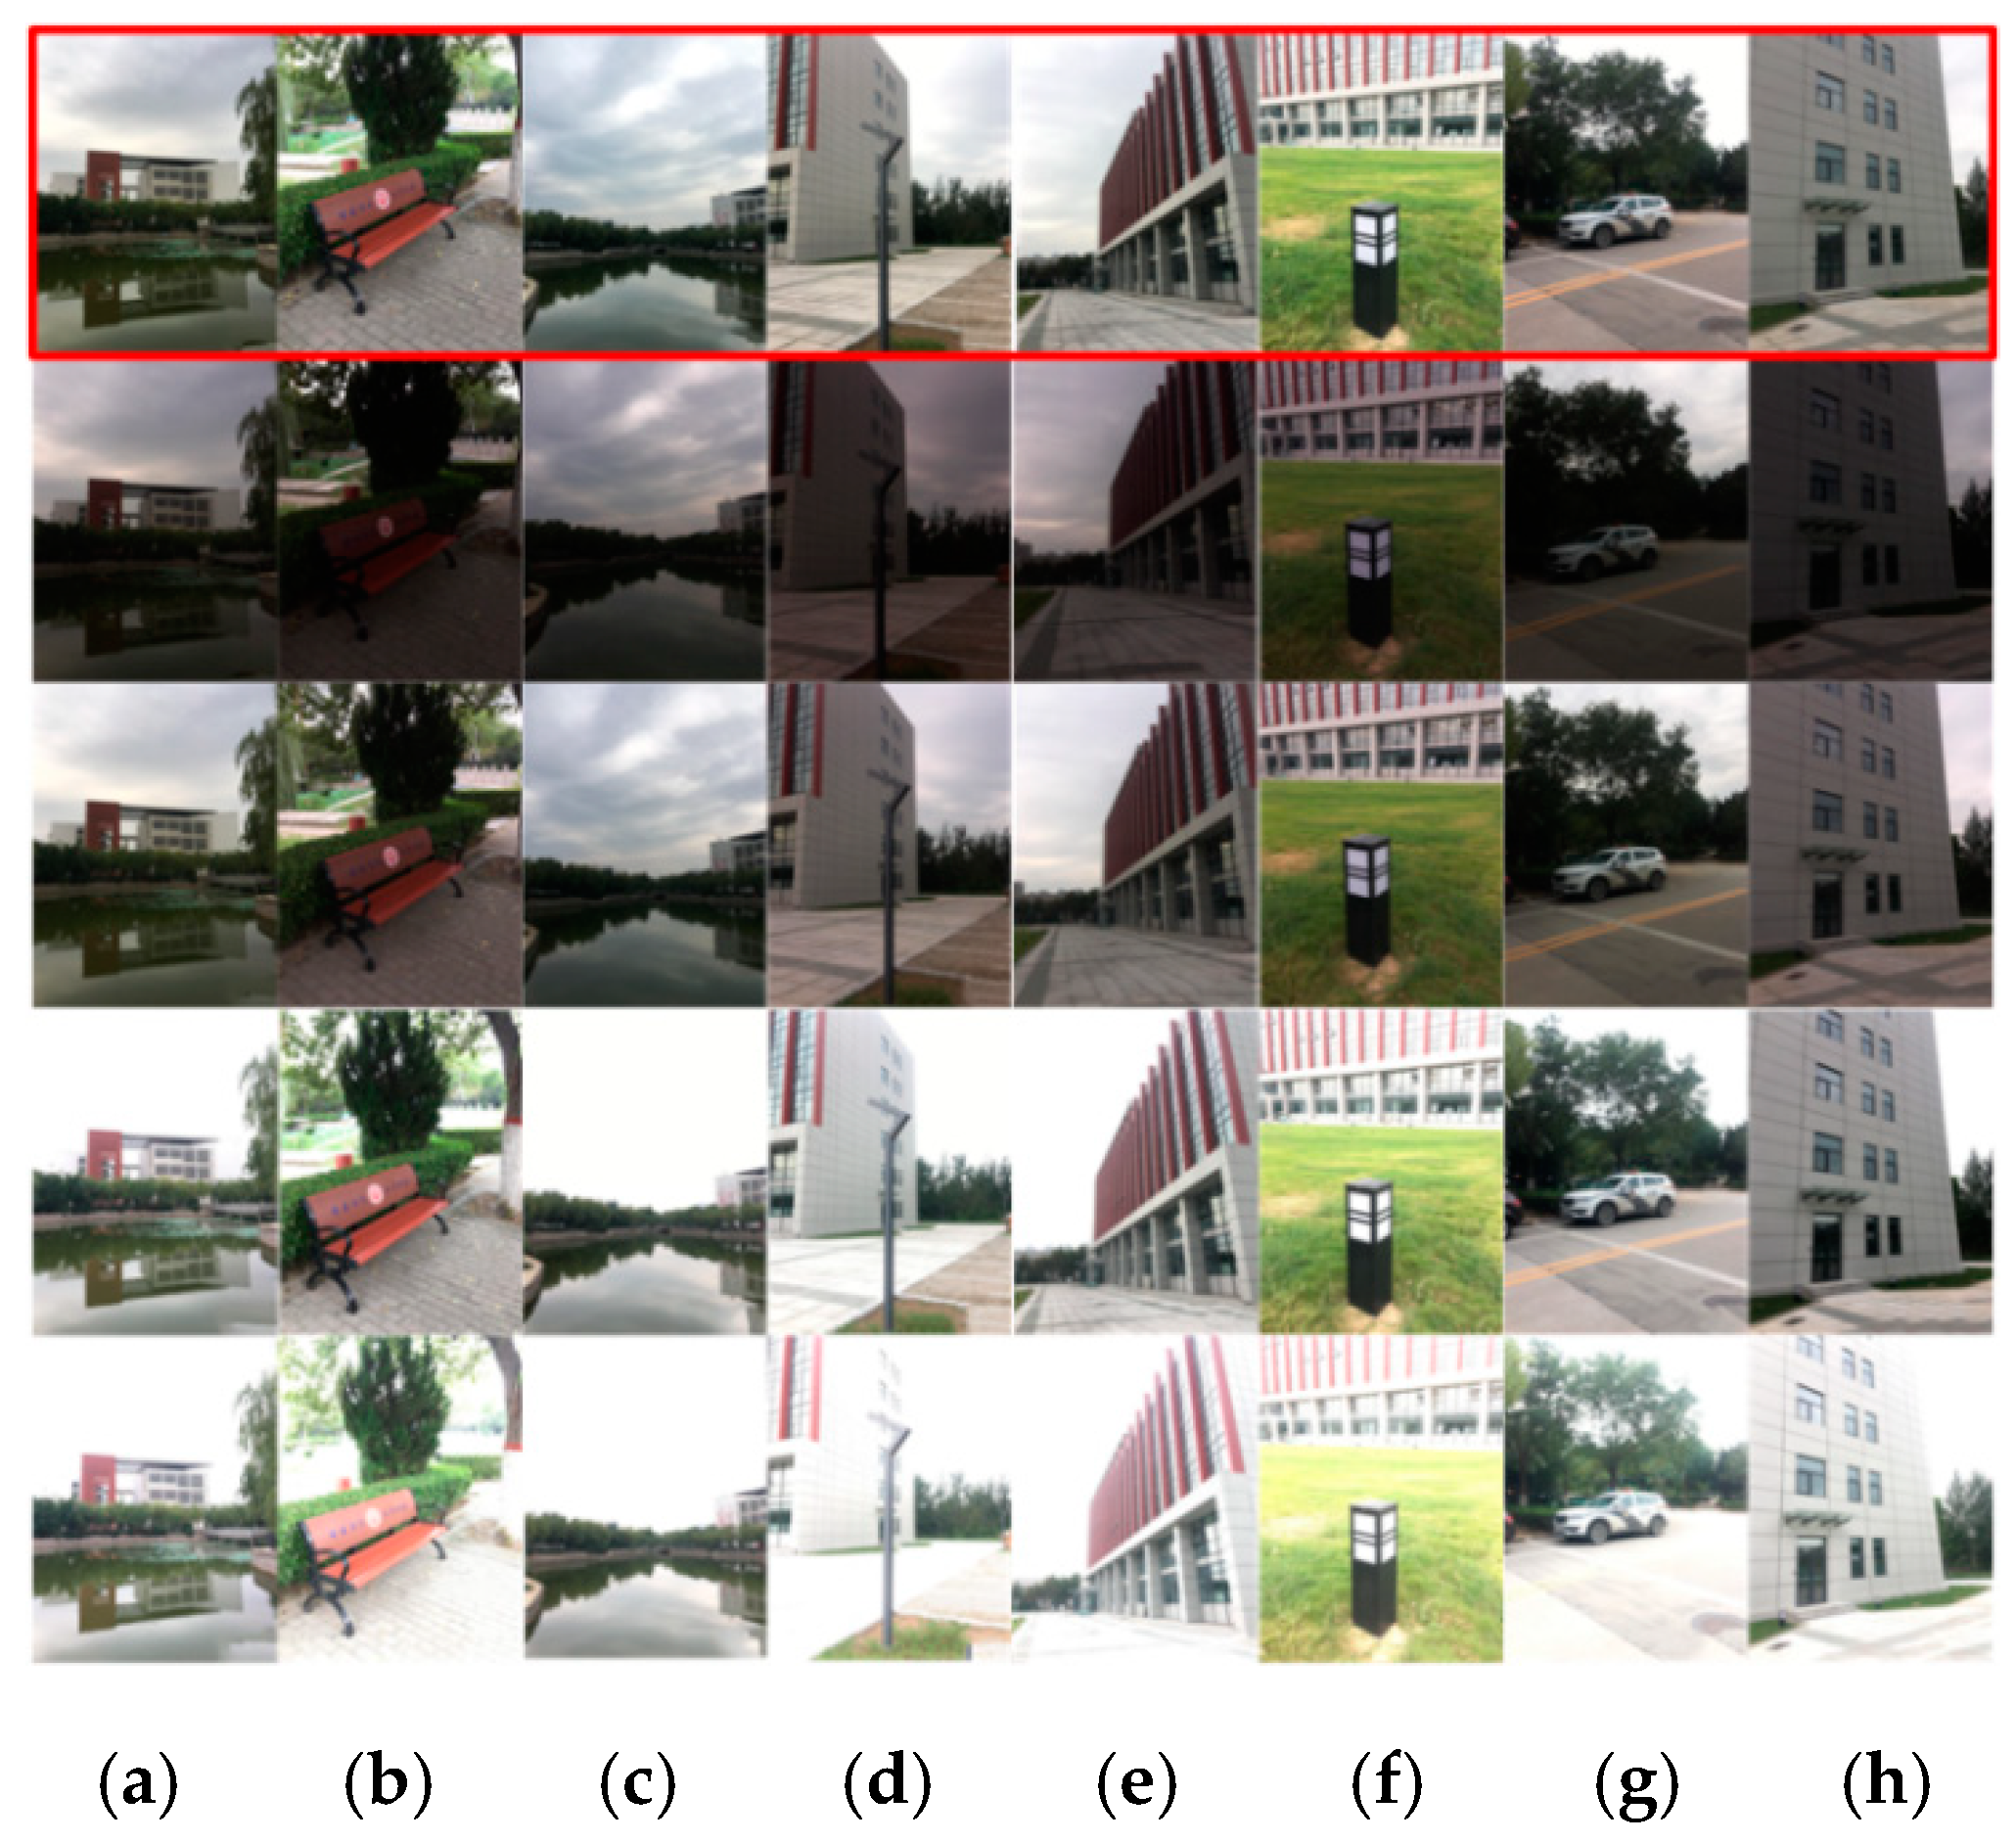
(a–h) are the sequences of a multi-exposure raw image. The top row is the selected reference image and the rest are the multi-exposure raw image sequences.
Figure 8.
(a–h) are the sequences of a multi-exposure raw image. The top row is the selected reference image and the rest are the multi-exposure raw image sequences.

Figure 9.
The comparison of image fusion results. (a) Fusion result of raw images; (b) Fusion result of JPEG images.
Figure 9.
The comparison of image fusion results. (a) Fusion result of raw images; (b) Fusion result of JPEG images.

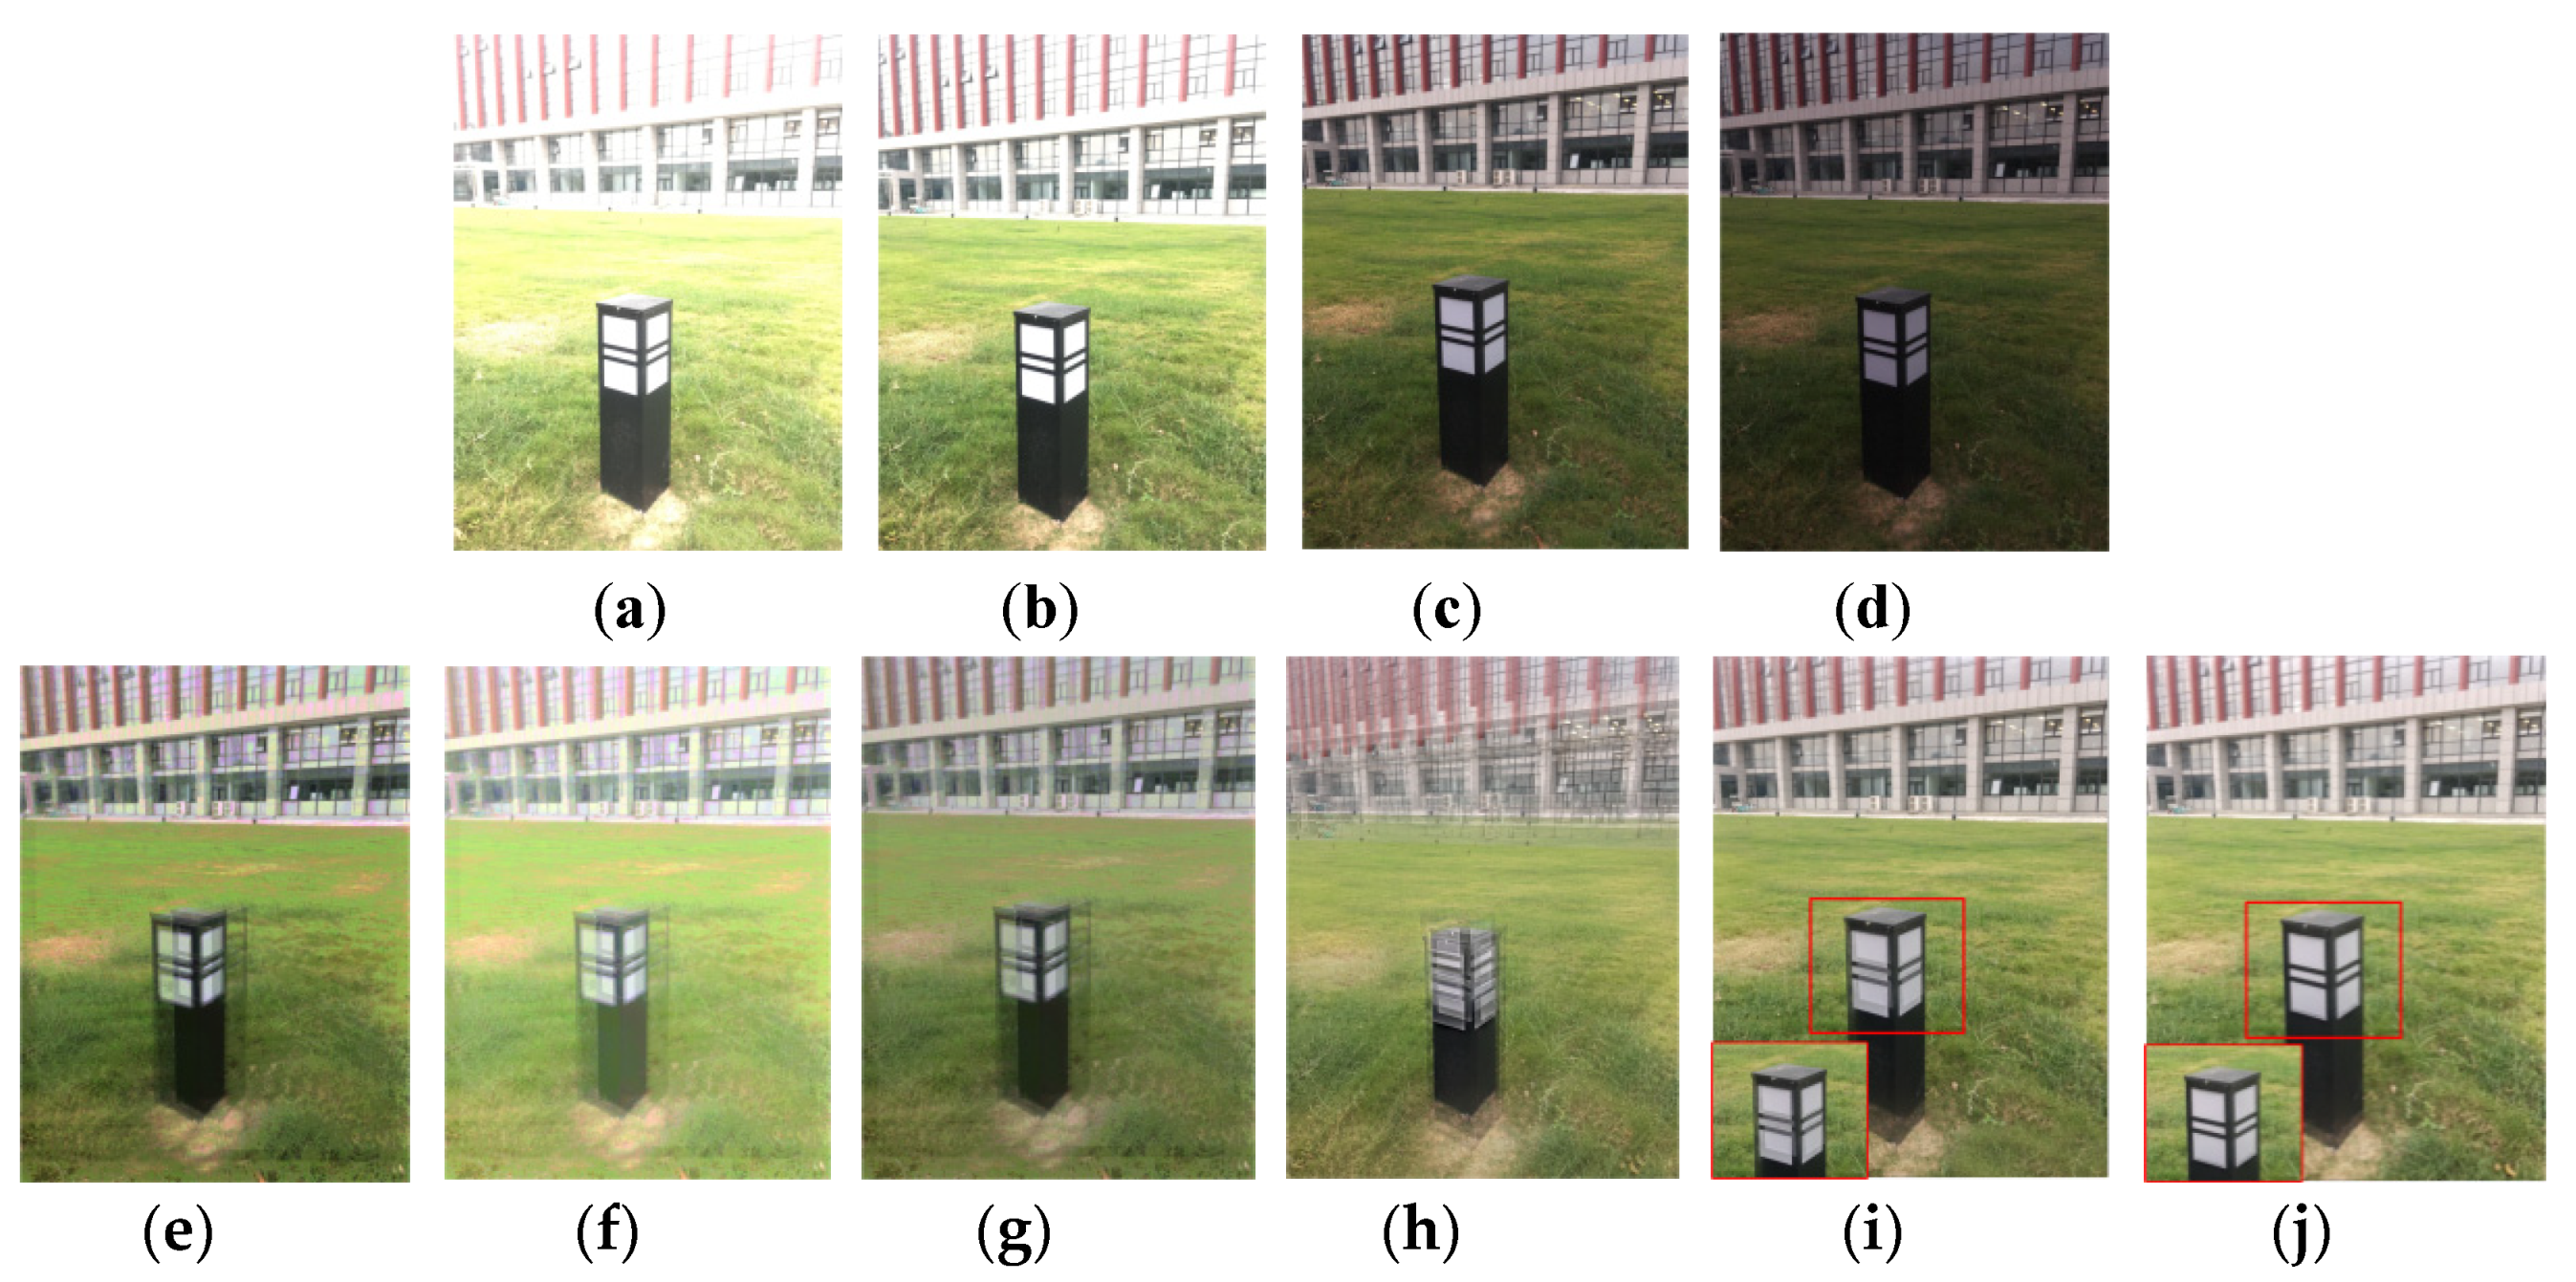
Figure 10.
Comparison with other methods. (a–d) The multi-exposure raw image sequence. (e) The result using the tone mapping method of Drago [28]. (f) The result using the tone mapping method of Mantiuk [26]. (g) The result using the tone mapping method of Reinhard [25]. (h) The traditional direct fusion result with JPEG. (i) The JPEG image fusion result using our method; (j) Our method with raw images.

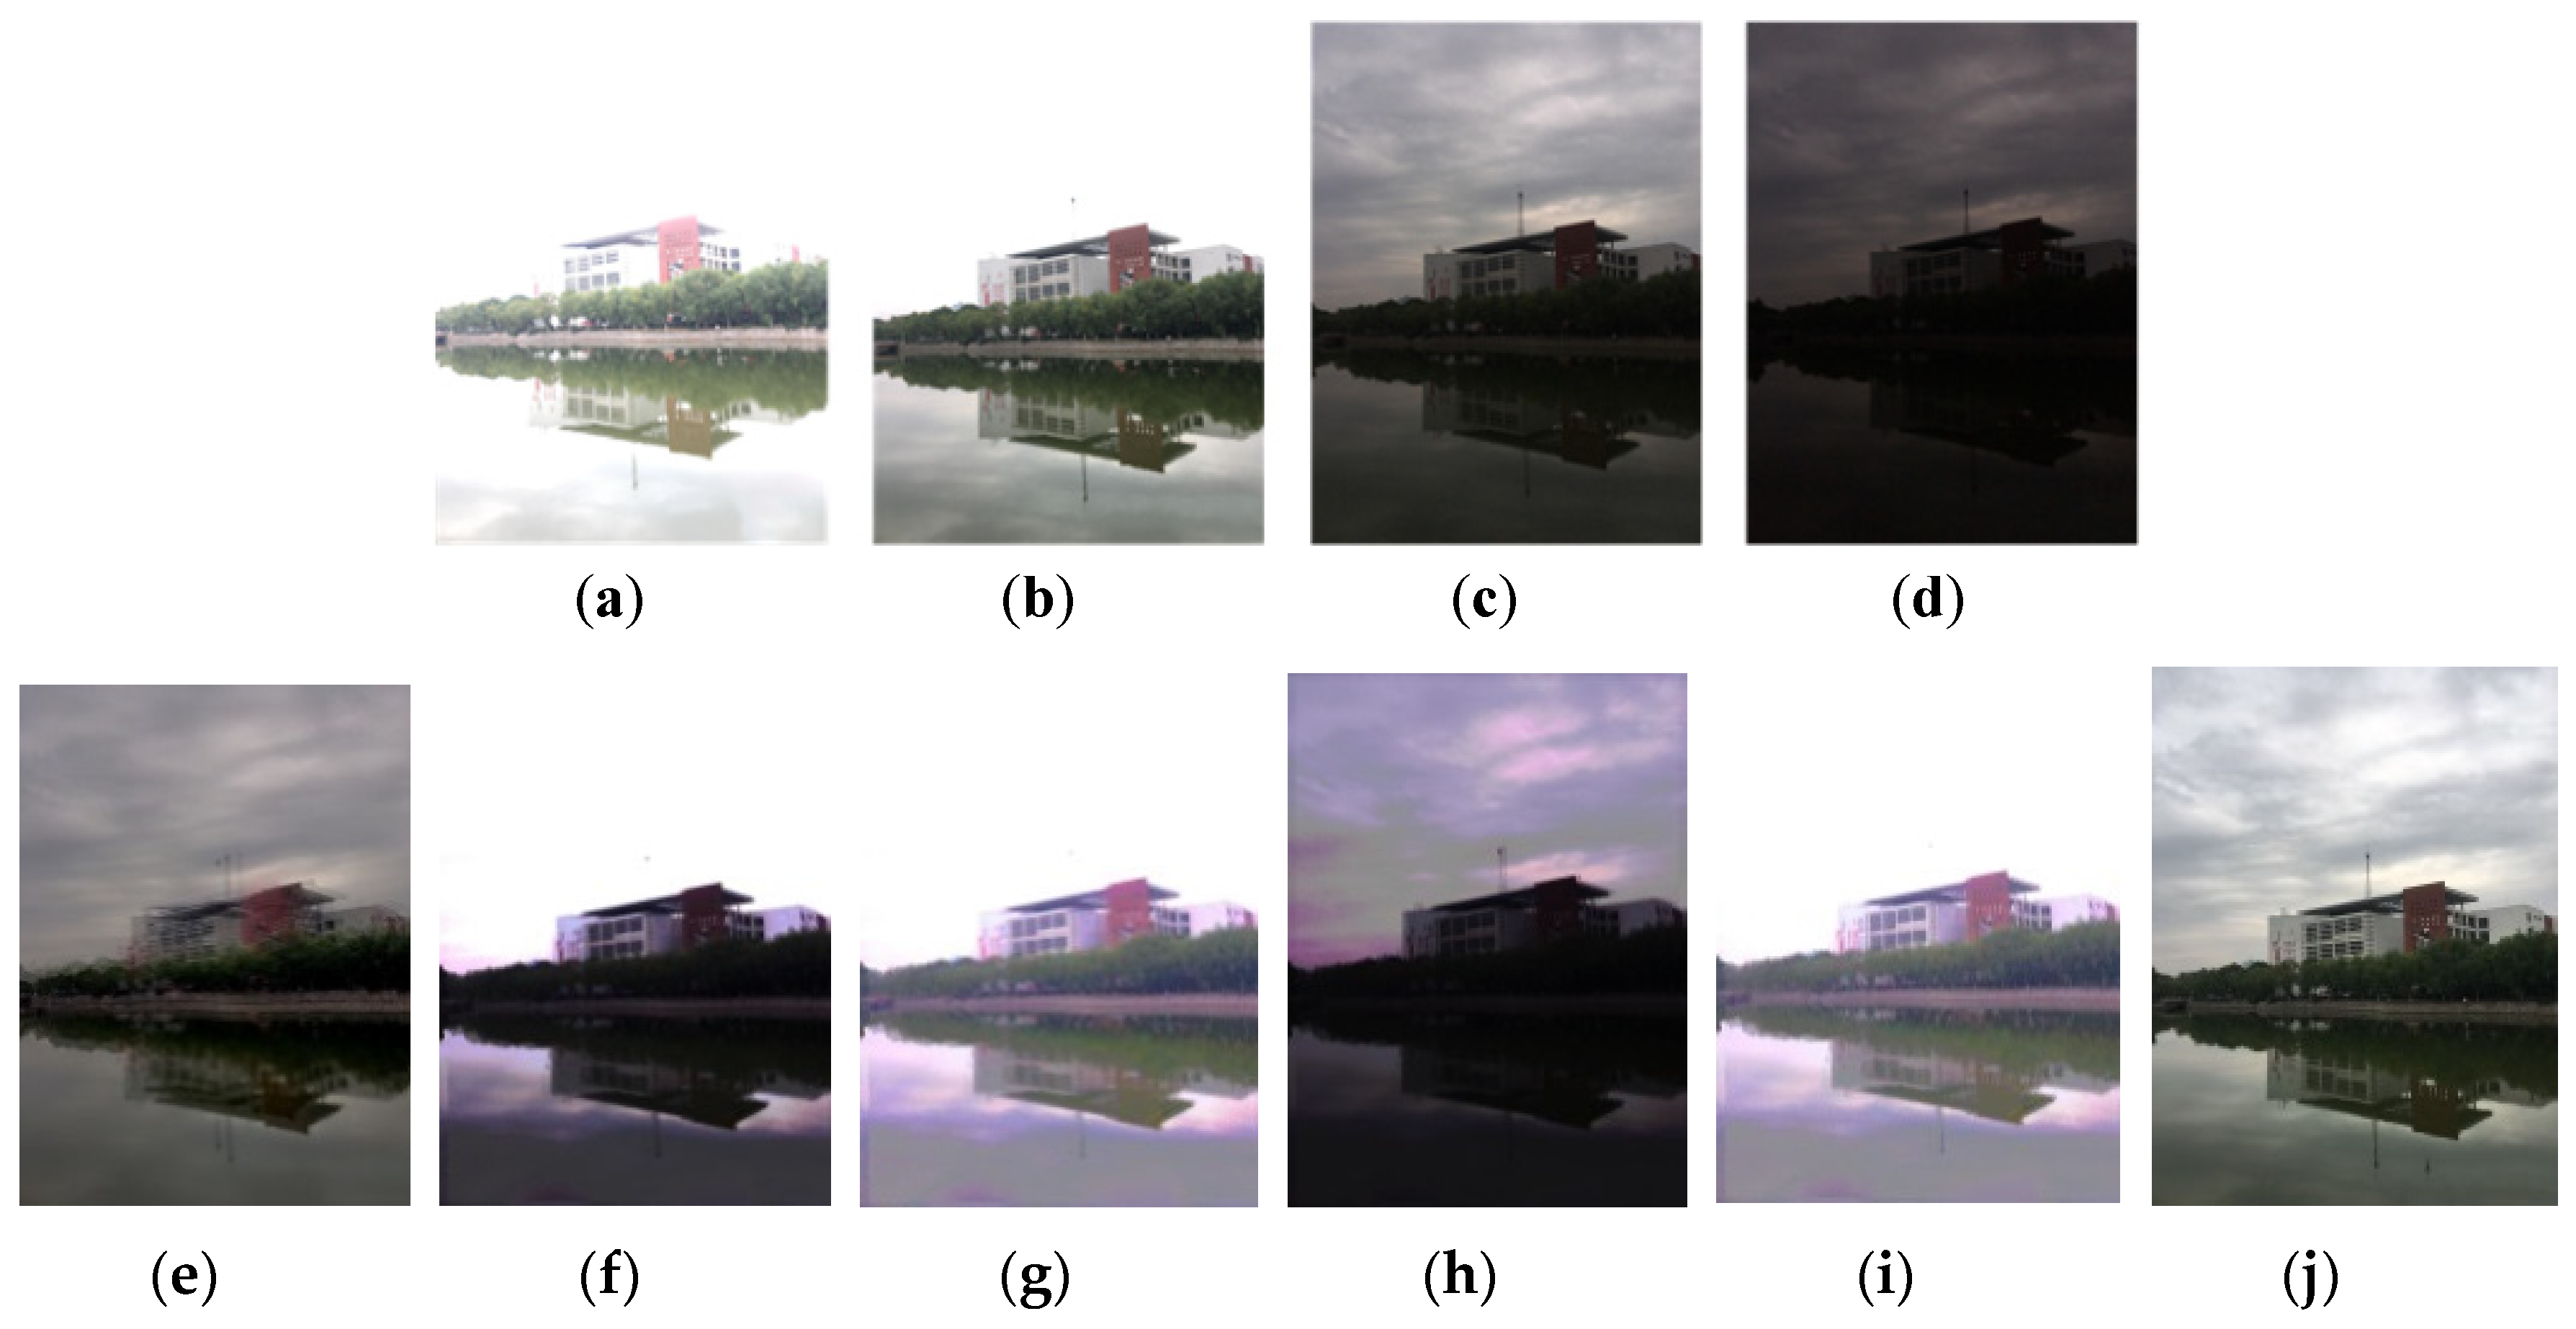
Figure 11.
The sequence of exposure for the image and fusion results of the test. (a–d) The image sequence. (e) Fused image by JPEG directly. (f) Fused image using the method of Drago [28]. (g) Fused image using the method of Durand [27]. (h) Fused image using the method of Reinhard [25]. (i) Fused image using the method of Mantiuk [26]. (j) Fused image using our proposed method.

Figure 12.
The fusion results of extreme-exposure pairs. (a) Over-and under-exposed raw image pairs. (b) JPEG fusion result using our method. (c) The result of the proposed method.
Figure 12.
The fusion results of extreme-exposure pairs. (a) Over-and under-exposed raw image pairs. (b) JPEG fusion result using our method. (c) The result of the proposed method.

Figure 13.
The fusion results of extreme-exposure image sequence. (a) The over- and under-exposed raw image sequence. (b) JPEG fusion result using our method. (c) Raw fusion result.
Figure 13.
The fusion results of extreme-exposure image sequence. (a) The over- and under-exposed raw image sequence. (b) JPEG fusion result using our method. (c) Raw fusion result.


Table 1.
The information entropy of the image sequence.
| Exposure Image Sequence |  |  |  |  |  |
|---|---|---|---|---|---|
| RAW | 4.80025180 | 6.02060459 | 7.64435717 | 7.36287806 | 6.95316271 |
| JPEG | 4.66945082 | 5.99022103 | 7.61556499 | 7.32166800 | 6.08631492 |
Table 2.
The analysis of the experimental comparative.
| Method/Metrics | Entropy | PSNR | Average Gradient | SSIM | Q-Score |
|---|---|---|---|---|---|
| JPEG | 7.24006583 | 20 dB | 0.0089 | 0.35 | 37.35 |
| Drago [28] | 4.73977225 | 28 dB | 0.0082 | 0.49 | 49.33 |
| Durand [27] | 4.86853024 | 36 dB | 0.0316 | 0.68 | 62.18 |
| Reinhard [25] | 6.48690328 | 33 dB | 0.0191 | 0.54 | 53.26 |
| Mantiuk [26] | 4.80421760 | 35 dB | 0.0239 | 0.78 | 64.07 |
| Our method | 7.71679023 | 41 dB | 0.0451 | 0.91 | 73.50 |
Table 3.
The comparative analysis of feature-matching time and matching rate.
| Figure 8 | The Number of Feature Points Detected (Nd) | The Number of Feature Points Rejected (Nr) | Matching Rate (Nd−Nr)/Nd | Time (ms) | ||||
|---|---|---|---|---|---|---|---|---|
| JPEG | RAW | JPEG | RAW | JPEG | RAW | JPEG | RAW | |
| (a) | 2893 | 3415 | 1367 | 1134 | 52.75% | 66.80% | 14.23 | 13.95 |
| (b) | 3135 | 3389 | 1945 | 1870 | 37.96% | 44.82% | 14.78 | 14.59 |
| (c) | 2520 | 2765 | 1937 | 2087 | 23.13% | 24.52% | 5.69 | 4.15 |
| (d) | 2693 | 2905 | 1263 | 1256 | 48.26% | 56.76% | 9.28 | 8.49 |
| (e) | 2960 | 3218 | 1458 | 1282 | 50.74% | 60.16% | 12.36 | 11.48 |
| (f) | 3045 | 3319 | 1363 | 1427 | 55.24% | 57.01% | 8.04 | 6.01 |
| (g) | 3157 | 3578 | 1950 | 2218 | 38.02% | 38.01% | 15.63 | 13.04 |
| (h) | 2875 | 3176 | 1469 | 1589 | 48.90% | 49.97% | 18.55 | 14.37 |
Table 4.
The results analysis of the extreme-exposure image.
| Images/Metrics | Entropy | PSNR | Average Gradient | SSIM | Q-Score |
|---|---|---|---|---|---|
| JPEG | 7.50736193 | 34 dB | 0.3967 | 0.74 | 63.75 |
| RAW | 7.70380035 | 40 dB | 0.0463 | 0.87 | 69.29 |
© 2020 by the authors. Licensee MDPI, Basel, Switzerland. This article is an open access article distributed under the terms and conditions of the Creative Commons Attribution (CC BY) license (http://creativecommons.org/licenses/by/4.0/).
Share and Cite
MDPI and ACS Style
Liu, Y.; Lv, B.; Huang, W.; Jin, B.; Li, C. Anti-Shake HDR Imaging Using RAW Image Data. Information 2020, 11, 213. https://0-doi-org.brum.beds.ac.uk/10.3390/info11040213
AMA Style
Liu Y, Lv B, Huang W, Jin B, Li C. Anti-Shake HDR Imaging Using RAW Image Data. Information. 2020; 11(4):213. https://0-doi-org.brum.beds.ac.uk/10.3390/info11040213
Chicago/Turabian StyleLiu, Yan, Bingxue Lv, Wei Huang, Baohua Jin, and Canlin Li. 2020. "Anti-Shake HDR Imaging Using RAW Image Data" Information 11, no. 4: 213. https://0-doi-org.brum.beds.ac.uk/10.3390/info11040213
Note that from the first issue of 2016, this journal uses article numbers instead of page numbers. See further details here.