The Usage of Smartphone and Mobile Applications from the Point of View of Customers in Poland

Faculty of Management, University of Warsaw, 00-927 Warsaw, Poland
Information 2020, 11(4), 220; https://0-doi-org.brum.beds.ac.uk/10.3390/info11040220
Submission received: 20 March 2020
/
Revised: 14 April 2020
/
Accepted: 15 April 2020
/
Published: 17 April 2020
(This article belongs to the Special Issue Knowledge Management, Trust and Communication in the Era of Social Media)
Abstract
:The main objective of this article was to identify the conditions for the use of smartphones and mobile applications in Poland in the second half of 2018. The scope of the present analysis was limited to a selected sample of more than 470 respondents, and it examined the group of the most active users of smartphones and mobile applications. The author adopted the CAWI (computer associated web interview) method, which was previously verified by a randomly selected pilot sample, in his study. The obtained results were compared with the findings of other studies. They indicated that users of smartphones and mobile applications in Poland do not differ in their assessments from users in Europe and around the world. In this context, the key implication for researchers is the identified level of development of the use of smartphones and mobile applications in Poland at the end of 2018. The main limitation of the research was the selection of the research sample, which consisted only of members of the academic community. The scope of this article aimed to fill a gap in terms of the quantitative and qualitative methods that are applied to examine the use of mobile devices and mobile software. At the same time, this study creates the foundations for further research on intercultural differences. It is important to note that the present research sample needs to be extended beyond the academic community for the research results to be fully generalized.
1. Introduction
The primary purpose of this article was to identify the conditions for the use of smartphones and mobile applications in Poland in the second half of 2018. The research, on the one hand, focused on technical issues, e.g., taking particular smartphone operating systems into consideration, and, on the other hand, it evaluated the use of smartphones in both everyday life and economics (mobile-commerce, m-banking, etc.). If we compare the present findings to the results of the study conducted in 2014 [1], the current analysis of the use of smartphones and mobile applications shows that we may observe a specific stability of particular trends, perhaps due to the lack of significant impulses for new products (fewer smartphones sold, extended use of “old” (already owned) items, and a slower increase in the number of new users). This development is not threatened by the specific “intermediate” forms between a personal computer and a smartphone (including foldable, flexible smartphones), nor their compact size, combined with specialisation (e.g., smartwatch, FitBit bands and other wearables). Nevertheless, it seems that quantitative development is slowly being replaced by the qualitative development related to both devices and the software supporting them. One should also pay attention to the impact of an increasing number of such devices, sometimes reaching even the level of billions of items, on the development of the infrastructure supporting them, e.g., fog computing, that enables their better, faster, and more selective use.
The term “smartphone” is used to represent a mobile (portable) multimedia device that possesses the functions of both a mobile phone and a fully portable computer (PDA—personal digital assistant), as well as an increasing number of functionalities of other devices such as electronic cameras, voice recorders, GPS navigation, notebooks, computer game consoles (smartphones supporting gaming), and health sensors controllers. In this case, a mobile application can be described as a type of software prepared to be used on smartphones and other mobile devices, including independent (without the need to access the internet) and specialised mobile services, client streaming services (access to the internet resources is available on demand), and computer games.
In order to carry out the above-mentioned purpose, this article adopts the following structure. After the introduction, in the Section 2, the author presents the literature background. In the Section 3, the author presents the methodology and the research sample examined in the study. The analysis of the results and their discussion are included in the Section 4 of the paper. The last part contains a comparison of the findings obtained in the research with the results of other studies. In the same section, the author also discusses the conclusions of the tests carried out, their limitations, and directions for further studies aimed at addressing the outlined research problem.
2. Literature Background
Studies concerning the use of smartphones mainly focus on identifying the quantitative correlations of smartphones in relation to specific user groups divided by gender, age, place of residence, countries, regions and time of use, the frequency of using the smartphones per day or week, rankings of manufacturers, etc. [2]. There have been relatively few attempts to combine the findings of quantitative and qualitative research, i.e., focused on their practical applications in the context of mobile electronic commerce (m-commerce), electronic mobile banking (m-banking), or international comparisons [3]. This article belongs to a group of quantitative and qualitative research and may be seen as a preparatory stage for the intercultural research of the use of this technology. Therefore, its main goal was to examine the situation four years after the previous research related to this topic was carried out by the author [1]. It has emerged that the main problem to be solved at present is to identify the specific circumstances of the use of smartphones among the selected respondents, i.e., the population that includes the most active internet users [4].
The existing limited literature has mostly relied upon actual data collected from either a limited number of individual internet users’ level information. There has been very little overall research, such as [5], based on, for example, utility functions. A completely different approach is represented by the research on the sociological effects of the use of smartphones (research customers’ sentiment or cultural determinants of applications [5,6]). In general, it can be said that the basic research gap in articles on this topic is to focus on technical, market, sociological, or specific problems, e.g., the user’s relationship to social media. Usually, there is no opinion on the possibilities of using m-commerce or m-banking for one purpose. This article is intended to fill this gap.
There are currently over 3.6 billion smartphones in the world, and their number increases by about 8% per year [7]. The two dominating operating systems in the market are Android and iOS [8,9]. It was estimated that at the end of 2018, there were almost 30 million smartphones in Poland [10]. The opinion polls from December 2018, published by the Polish Office of Electronic Communications (Urząd Komunikacji Elektronicznej), showed that 74.8% of the respondents used smartphones on a daily basis. Thus, it appears that the issue connected with the use of smartphones and relevant research on the topic is becoming more and more important on both a global and national scale. That is why the author decided to carry out a study whose primary purpose was to analyse market conditions for the use of mobile applications. The results presented in this article take the form of a summary report from the second phase of research.
3. Methods and the Research Sample
The research methodology adopted to analyse the issue of the use of mobile applications included the following steps:
- Formulating the purpose and scope of the study.
- Establishing the method and procedure to carry out the study.
- Based on the previously conducted research, building a pilot version of the survey, verifying the correctness and intelligibility of the survey following the evaluation of a group of users who volunteered to complete this task.
- Revising and improving the prototype of the survey and randomly selecting a group of respondents.
- Inviting respondents to complete a survey made available on the internet using the CAWI (computer associated web interview) method.
- Obtaining results, analysing the findings, and discussing these findings in comparison to the data collected in previous studies.
- Drawing conclusions and providing recommendations for future research.
The final form of the survey consisted of twenty-six substantive questions and four questions related to demographics (gender, age, place of origin, and education). The questions were divided into five groups:
- The technical characteristics of smartphones (considering the division into traditional phones and smartphones, the division into private and company phones, and the number of owned smartphones, as well as analyses according to operating systems, screen cross-sections, or producers).
- Smartphone properties (advantages, disadvantages, time of use, number of applications owned, frequency of use, and the frequency of installing new applications).
- Application characteristics (offer, the quality of the application, its purpose, and use of photos taken with the smartphone).
- Possibilities of obtaining applications (the convenience of using the application store, application purchases, their value over the last six months, and the use of subscription applications).
- Using a smartphone for shopping and e-banking (shopping frequency, product range, type of e-banking used to make a purchase, circumstances of its use, and operations performed as part of e-banking).
The research was conducted in the period of November–December 2018. The selection of the test sample was not accidental; it was a case of convenient sampling, supplemented with the elements related to the random selection of the respondents. The majority of survey participants belonged to the 18–25 age group (98% in 2018, 69% in 2014), i.e., the population that many studies [11] have identified as the most active in terms of the use of smartphones. In addition, it is a group characterised by innovation in terms of both the application and testing of the latest technologies. The research was carried out among students of the University of Warsaw. This solution ensured a higher response rate of the survey—university students manifest greater knowledge and research curiosity than other people from the same age group. The pilot group (32 people) was made up of individuals who accepted the invitation from the University of Warsaw’s Faculty of Management website to complete the first version of the survey questionnaire that included 52 questions. After the initial verification and modification, as well as the reduction of the survey to include only 26 questions, the authors sent invitations to complete the online survey to randomly selected student groups. It was a structured survey. The expected results of this sampling were, among others: a very high share of individuals who have had smartphones for a long time, a high frequency of their use, a small number of company smartphones, and a smaller number of paid applications in contrast to the high number of the applications that can be downloaded free of charge. On the other hand, focusing on this group of respondents ensured a higher response rate and reliability of information, as well as the use of broader application functionality than in the case of the remaining part of the society. It is important to note that the research conducted in this way also anticipated future trends related to using this technology in some areas. Additional section expression was used here in all questions where there was doubt as to whether the choices were completely filled. For example, in the question “Are photos taken with a smartphone you most often: sent by MMS, placed on Facebook, sent by e-mail, use in Instagram, other?” respondents supplemented with other options, e.g., I use Messenger, Snapchat, WhatsApp, Telegram, or not sharing.
In total, 584 people completed the survey. Despite its simplicity and preliminary testing on the pilot group, just over 81% of respondents, i.e., 473 people (314 people in 2014) filled in the survey questionnaire correctly. Among the respondents, 74% were women and 26% were men (63% women and 37% men in 2014). Nearly 39% of women, 4% more than men, had a smartphone with the iOS operating system. Almost all respondents—close to 98%—were from the 18–25 age group, which is typical for undergraduate and graduate students. It also appears that slightly more people in this age group had the iOS operating system. Over 97% of people declared having secondary education, and only 14 held a BA degree or declared having higher education. Over 30% of respondents came from villages (16% in 2014). Almost the same number of respondents declared coming from cities with 10,000–100,000 residents, over 25% declared coming from cities with over 500,000 inhabitants (44% in 2014), 9% of the sample declared coming from cities with 100–500 thousand inhabitants, and almost 6% declared coming from towns below 10,000 residents. Among the survey participants who came from cities with 100–500 thousand residents, almost 6% more respondents had smartphones with the iOS operating system. A similar tendency could be observed with regard to residents from cities with more than 500,000 inhabitants—the difference, in this case, amounted to 4%. The opposite situation appeared to take place in relation to rural residents—8% more respondents representing this group had a phone with the Android operating system. It is important to note that, this time, the majority of respondents filled in additional sections of the survey containing questions connected with the use of mobile devices and applications.
In summary, the study was conducted with the participation of a research sample representing a similar academic environment to one from four years ago, but the structure of this sample had different characteristics, e.g., almost 30% of the study participants were younger than the respondents examined three years earlier, and the population coming from large cities was 19% smaller than previously. The respondents living in the countryside completed only half of the previous number of questionnaires, but they were willing to provide additional comments to the questions included in the survey. It appears that the latter resulted from the random selection of groups invited to complete the survey.
4. Results and Discussion
In the first part of the survey, the respondents referred to the organisational and technical characteristics of their smartphones. This time, everyone already owned a smartphone (89% in 2014), with 1.27% additionally owning a “traditional” mobile phone. As might be expected, only 5.3% of respondents had company smartphones in addition to owning private ones (similarly in 2014), and only one person had a business smartphone and did not own a private device. Over 90% of respondents had one smartphone, over 9% had two, and less than 1% had more than three.
Subsequently, the survey questionnaire helped to identify the type of operating system used in the respondents’ smartphones. Simultaneously, this section of the survey enabled the authors to verify the accessibility of mobile applications associated with particular types of operating systems. The structure of the results obtained in the study was as follows: those using the Android system accounted for 62% of all users (almost twice as many as the share of survey participants using iOS (38%)), and only one person (which was only 0.2% of the sample in previous studies—a level of 14%) was using the Windows system (10 mobile). Due to such a small number of owners of smartphones with the Windows operating system, in further analyses, only selected responses of this particular user were quoted, and this case was omitted in the further calculation of the population shares. It is interesting to note that, in the present study, there were no representatives of individuals using other operating systems, such as BlackBerry OS, Bada, and Firefox OS, all of which accounted for 1.6% of all users in 2014. The next survey questions concerned the technical issues related to smartphones. In the Android operating system, the majority of users (55%) had a camera with a screen section of 5”–5.4” or 5.5”–5.9” (34%), and relatively few (6%) owned a smartphone with a section of 4”–4.9”. The opposite situation occurred in the group of smartphone owners using the iOS system. Most of them (60%) used smartphones with a screen size of 4”–4.9”.
Over 47% of respondents had used a smartphone for a period shorter than three years, and almost 28% used theirs for 5–10 years. Over 22% had their smartphones for three-to-five years, and only slightly more than 2% of the sample said that they started using it ten years ago. As previously, the data confirmed the opinion that the longer the time a smartphone is used, the higher the likelihood to buy new applications, i.e., those who had had it for the longest time declared purchasing applications most often. There was no gender diversity in this regard—the first group declaring using the smartphone for the maximum period of over three years included almost the same percentage of women as men.
Most of the respondents (a 41% share) had smartphones with a screen of 5”–5.4”, and they considered such a screen to be quite sufficient. On average, 27% of respondents preferred a smaller screen size of 4”–4.9” or a larger screen of 5.5”–5.9”. Slightly over 4% of study participants had a smartphone with a 6” screen or larger. Among owners of Android systems, over 55% had cameras with 5”–5.4” screen cross-sections, which was the most popular type of device in this group. The majority of the owners of smartphones with iOS (60%) preferred the screen with the cross-section of 4”–4.9”. Thus, it emerged that among the surveyed group owning smartphones with a 5”–5.4” screen, 83% worked on Android; among respondents with smartphones with a 4”–4.9” screen, 86% of the sample ran on iOS. This was probably due to the higher price of the iPhone, which appeared to be a key factor for selecting a particular device in the population examined as part of the study.
The largest share of research respondents (37%) used Apple smartphones (99% with the iOS system). Together with Samsung smartphones (26%), with 42% Android system, this accounted for almost two-thirds of all devices analysed in the study. In addition, Huawei smartphones (over 17%, with 27% being Android) and Xiaomi smartphones (almost 7%, with 11% being Android) took a significant position in the ranking created as part of the study. Moreover, LG, Sony and other smartphones, such as HTC, Motorola, and Asus, also occupied significant places in the evaluation. The diversification of brands supported by the Android system was therefore definitely higher than those that ran on iOS.
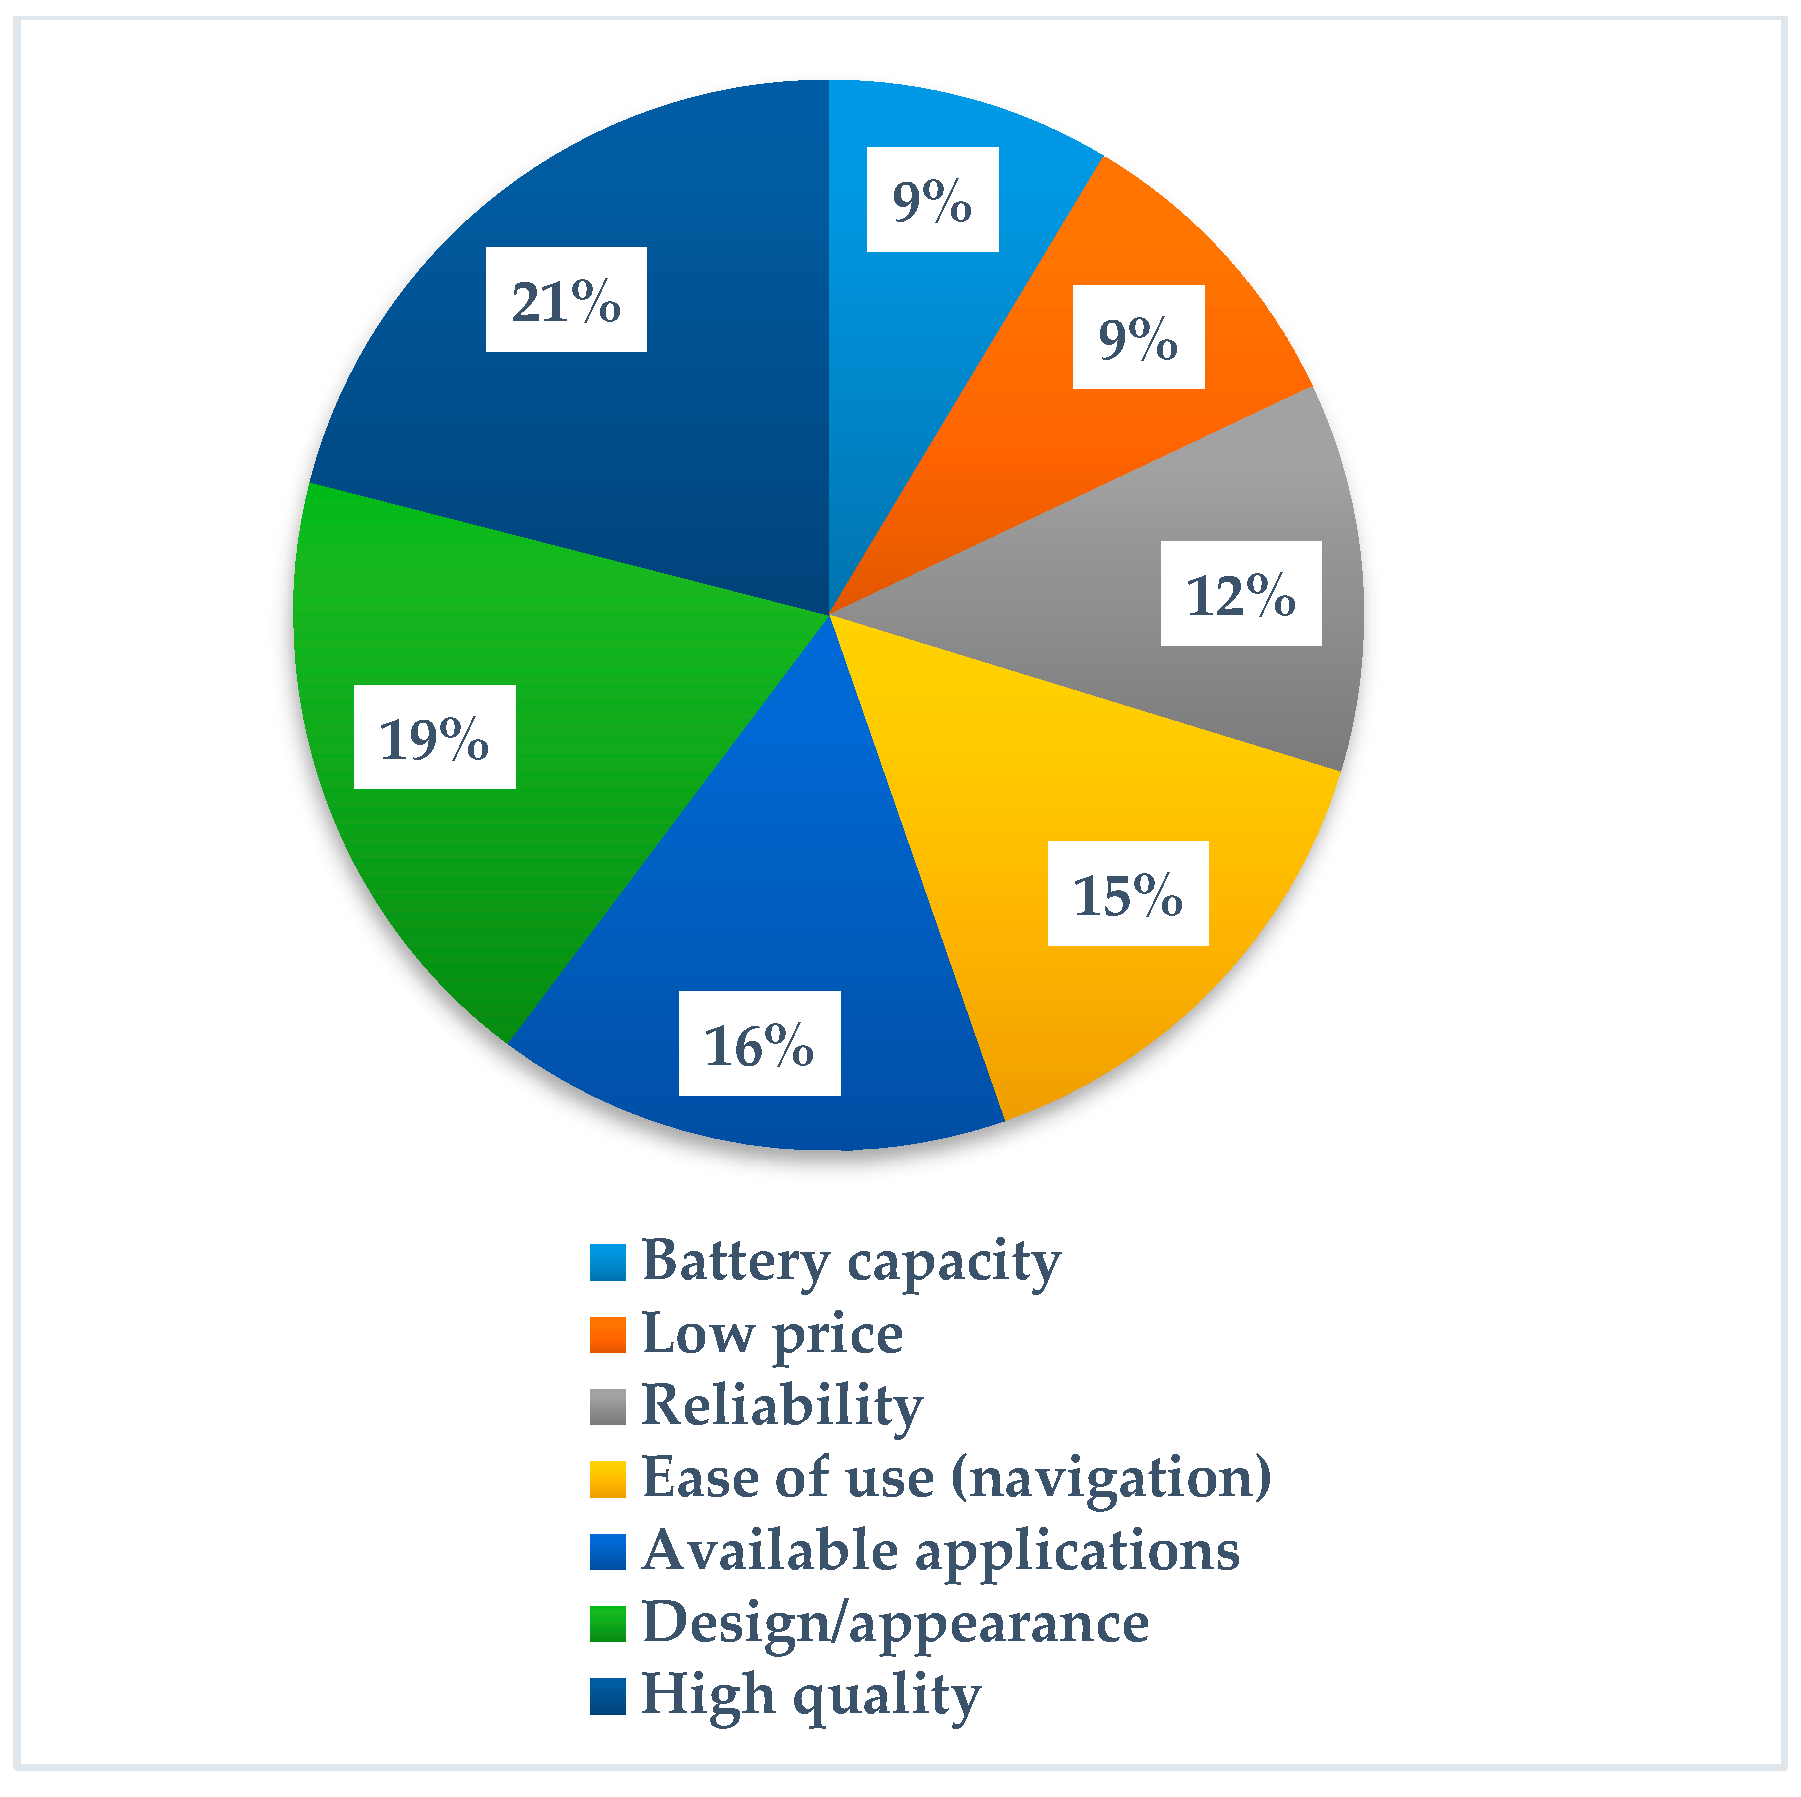
The questions contained in the second section of the survey concerned the specified properties of smartphones. Based on the findings, we may conclude that the group of most appreciated features, according to smartphone users, included high quality (21% men) and design/appearance (19% women). The further positions in the ranking were taken by the availability of applications (16%) and convenient use and reliability (from 12% to 16%). The users of smartphones with the Android operating system considered the availability of applications (17%) and high quality (17%) to be the main advantages of their devices. Smartphone users with the iOS operating system focused on high quality (27%) and design/external appearance (24%). The user of a smartphone with Windows primarily indicated low price, reliability, and ease of use. Among Android users, reliability was the least important, and iOS users did not regard the low price to be a considerable advantage (Figure 1).
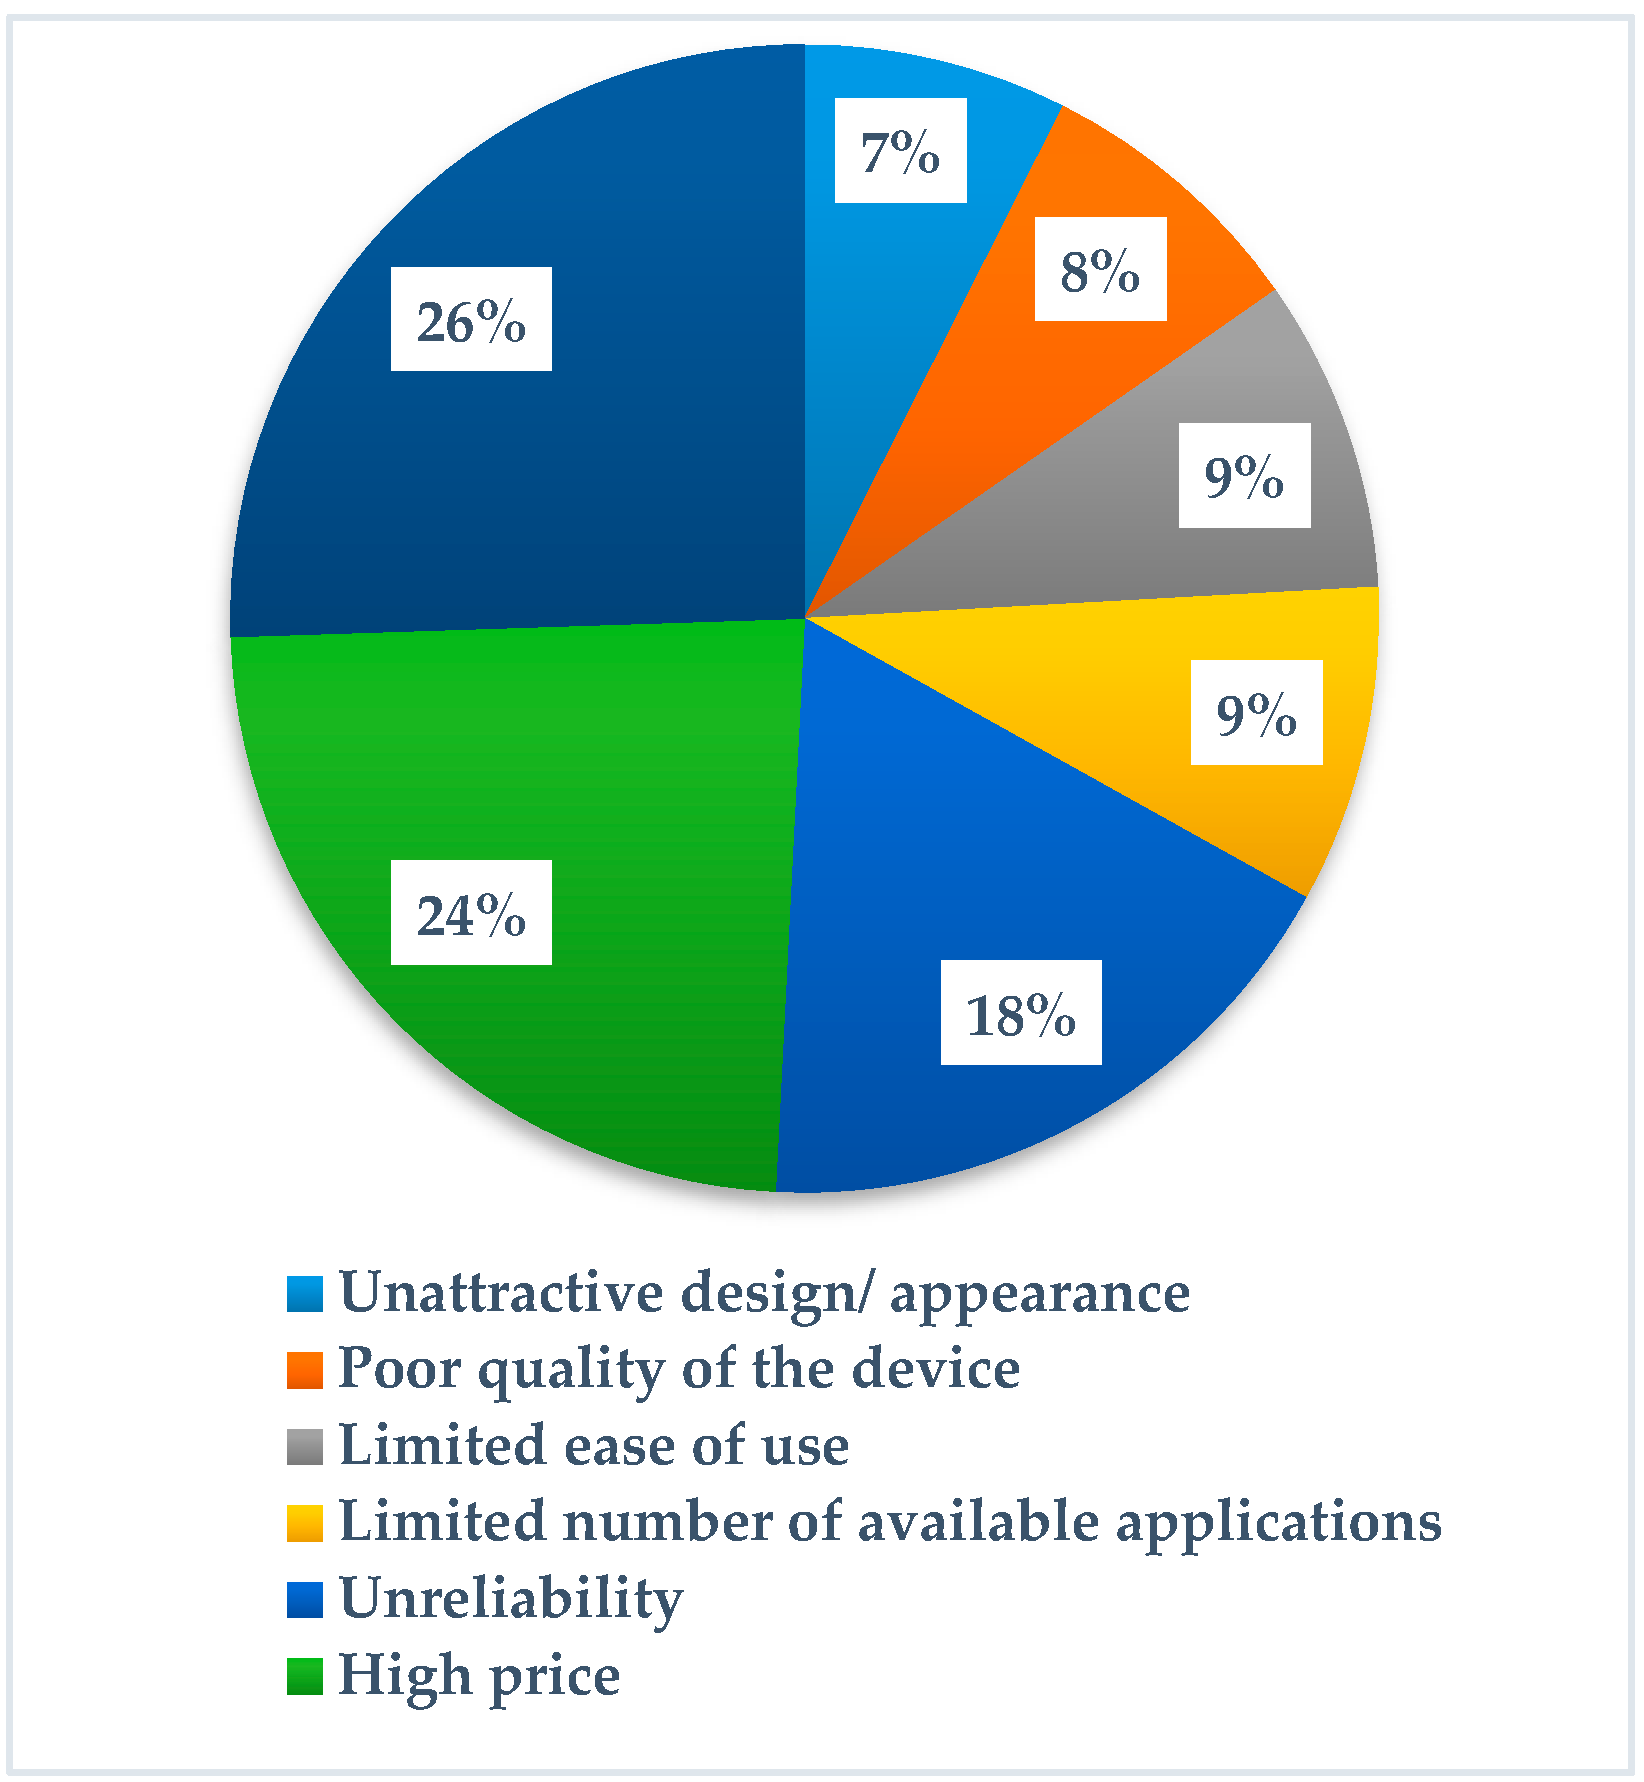
As the findings suggest, a low battery capacity (26% of respondents) and a high price (24% of respondents—especially among users of smartphones with iOS, as 33% of them thought so) seemed to be the most significant problems. The survey participants also paid attention to failure rate (18%) and a small number of available applications and with inconvenient use (almost 9% each). Android users showed more concern in terms the a possible failure of the device (a difference of 2%) or the inconvenience of use (a difference of 8%). They also indicated an additional factor related to a less attractive appearance or design (a difference of 8% in comparison to iOS users). The trends described above are shown in Figure 2.
Over 47% of respondents had used their smartphones for less than three years, over 28% had used their smartphones for 5–10 years, and 22% had used their smartphones for between three and five years. The smallest number of smartphone users indicated using them for more than ten years, which showed the context in which smartphones are fully used. The distribution of use over time for different operating systems was similar, with a slight advantage of the prolonged use of a smartphone with the iOS operating system. Compared to previous studies, the number of individuals who used their smartphones for a period of three-to-five years increased significantly, mainly at the expense of owning a relatively new smartphone (up to three years).
The intensity of using applications was defined as the number of continuously used applications, including those pre-loaded by the producer of the device and those uploaded by the producer and by the user himself/herself. In Table 1, the author presents the percentage shares of use of the number of applications broken down into two operating systems: Android and iOS. As previously indicated, the applications using the Windows operating system were omitted in the present study due to the negligible percentage of people using smartphones with this system in the examined sample. The most significant differences (at the level of 12%) between smartphones with different operating systems occurred in the case of more than ten applications uploaded in the device, where iOS played a dominant role (47%), as well as in the group of 7–10 applications (5%), where we may observe the dominant share of users with Android operating system (27%). In recent years, the average use of applications has changed, primarily in the group of more than ten applications (an increase of over 6%) and mainly at the expense of reducing the share in the groups with one-to-three applications and 7–10 applications. If we also consider applications uploaded in the smartphone by users, then their owners usually belonged to the group that declared having more than ten applications (74%). This constituted an increase of over 30%. In other groups, there occurred a significant reduction (amounting to 11%) in the number of applications that were owned and used (Table 1).
The frequency of using such applications as calendar, notebook, and voice recorder was another research question that provided further insight into the issue of using smartphones. The purpose of this enquiry was to establish whether using a smartphone goes beyond its standard functions (telephone or internet connection) and also includes certain “office” functions. The scale of response varied from among answers of “very often”, through “often”, “sometimes”, “rarely”, and “never”. The predominating answers were “sometimes” (36%) and “often” (31%). The “often” option was mainly indicated by users of the smartphone with the iOS operating system (38%), and “sometimes” was mainly indicated by those who had smartphones running the Android system (37%).
The frequency of installing additional applications on the smartphone was another critical factor considered in the research. In the case of this question, there were three choices available, namely “rarely”, “from time to time”, and “often”. Less than 12% chose the last option. Almost twice as many (22%) indicated “I never install additional applications”, and 66% declared the possibility of installing them from time to time. It is interesting that in 2014, the option related to installing the applications often was declared by a 25% share of users. Here, a question arises whether we are dealing with saturation related to the most popular applications.
The subjective assessment of the quality of the applications used on the smartphone was the next characteristic feature analysed in the study. The majority of respondents (almost 60%) perceived the quality of the application as good, although they also noticed a considerable number of worse quality programs. The second place with a score of 32% was taken by very good quality, which means that the respondents appreciated the high quality of software design. Other opinions were of marginal importance: the sole owner of the Windows smartphone evaluated the quality of the application as average. The owners of smartphones with the iOS operating system considered the quality of applications to be very good (47%), which represented a twofold increase in comparison to the score obtained in 2014, when such opinion was expressed by 27% of users of the same group. Nevertheless, 48% of smartphones users with iOS still believed that the quality of the application was only “good”. Similar opinions in the same category were shared by 67% of smartphone users with the Android operating system (23%—“very good” quality). However, this was still seen as a very good opinion, when also taking into account the conviction present in the literature that the desktop (PC) screen, at a glance, offers the user 39.18% chance of understanding the content, and a mobile screen only offers a 18.93% chance [12].
The respondents′ statements showed that smartphones were still mainly used (44%) to browse the internet, to have conversations with others (40%), or to send short messages (11%); 3% of the share declared using a smartphone to listen to music, and almost 1.5% indicated that they primarily used it to view messages. The wording “mainly” did not allow us, however, to capture such activities as taking photos and videos, which are very often carried out while using other smartphone functions. Therefore, the next question concerned using photos made with the smartphone. Most respondents (42%) used Instagram to distribute them, over 12% used messengers for this purpose, 12% sent photos directly via MMS, approximately 10% disseminated them via Facebook, and 4% did so using Snapchat. As many as 15% of respondents used them for their own purposes only and did not share them with others.
The fourth group of questions concerned the possibility of obtaining applications. In this group, respondents assessed the convenience of using online stores offering applications for their smartphones on a five-point scale (with the options of very convenient, convenient, rather comfortable, not very comfortable, and I do not use it). The highest rating (63%) was obtained in the category of the high convenience of using the shop, which was mainly determined based on the opinions of 66% of smartphone users with the Android operating system. The second position (26%) was taken by the option of “very comfortable”, obtained mainly thanks to 31% of iOS users’ opinions. Thus, 89% of users rated app stores very positively. In 2014, 77% of respondents assessed the shops in this way. The Windows user perceived the convenience of the store as average, similarly to 10% of users of smartphones with Android and iOS. The present results seemed to be related to the high level of the refinement of products available in the shops of the two competitive offers associated with Android and iOS operating systems, as well as the development of a specific market balance between them.
As far as payments charged for mobile applications were concerned, users of all operating systems mainly downloaded free applications on average (83%). We could observe a growing tendency in this regard, since, in 2014, this trend reached an average of 74%. At present, Android users did it 8% more often than in 2014, and a similar tendency could be observed in the case of iOS users. It is worth mentioning that the number of free applications downloaded on smartphones with Windows increased significantly. The second most popular option (on average 16%) was to buy applications. This result was mainly influenced by the 24% share of users of smartphones with iOS, the score of which was 3% higher than in the study conducted in 2014. For Android smartphones, only 12% of users were found to currently buy applications, though this was 5% more than three years earlier. The category “I do not download or buy applications for my smartphone” was reduced almost to zero.
It emerged that, regardless of the operating system used, over the last half of 2018, respondents (on average 84%) did not pay anything for downloaded applications, 10% paid below PLN 20, and in the case of a 4% sample share, the expense was estimated at the level of PLN 20–60. Only about 2% of smartphone users spent over PLN 60 on applications. At the same time, it appears that iPhone users were more willing to spend money on applications than smartphone users with the Android system. This was especially true in the cases of expenses in the range below PLN 20 and in the range of PLN 20–60, where the difference amounted to 4%, and in the range of PLN 60–120, where the authors of the study recorded a difference of 3%. However, there were 14% fewer smartphone users with the iOS operating system who paid nothing for downloading applications in comparison to users of smartphones with the Android operating system.
The use of subscription applications, e.g., websites of electronic content distributors, was another problem analysed in the study. Almost 58% of respondents declared using such an option, and over 31% on average did it often. Smartphone users with iOS used the subscription formula much more frequently than Android users (a difference of 17%), especially since over 50% of respondents who had smartphones with the Android operating system did not use this form of entertainment (20% more than in the case of iOS). Due to the fact that applications sent in exchange for a subscription fee are a specific compromise between free and paid applications, the number of subscribers had increased significantly (by 40%). This type of service has many advantages—the customer does not have to pay large amounts of money at one time and has constant access to the latest publications. From the point of view of the producer, updates can cover all customers at the same time, and they do not have to maintain older versions. The product/service providers make slightly smaller profits, but the money is seen as regular and continuous income, and, for this reason, the producers might be interested in such a business model.
The last group of the questions concerned the use of a smartphone for shopping and e-banking. This section appeared for the first time in a survey carried out in 2018 following the suggestions of respondents taking part in the earlier study.
Almost a quarter (24.31%) of smartphone users carried out shopping and financial operations often. However, most respondents (34.25%) indicated that they engaged in them sometimes or rarely (32.14%). On average, 9.30% of smartphone users never did it. The owners of iPhones made purchases over 11% more frequently than others, and a 5% larger share declared that they sometimes do it. We could also observe differences in the share of the Android smartphone owners declaring making purchases rarely (difference of 9%) or never (a difference of 6% more in relation to iOS smartphone users) (Table 2).
Another important question concerned the selection of purchases. In total, 375 people (i.e., 79% of the population) made purchases using a smartphone. Most smartphone users (42.92%) bought clothes and footwear; however, it is essential to note that the owners of smartphones with the iOS operating system spent 11% more on this group of items. Transport tickets came second in the ranking (average 20.72%), followed by tickets for events such as films or concerts. Over 10% of Android smartphone users were found to spend money on other products or services like cosmetics and taxis, which were not included in the list. Generally speaking, it appeared that smartphone owners primarily make low- and medium-value purchases. Higher-value transactions that require reflection or payment by a bank transfer or cash after delivery are made either using a laptop, desktop computer, or in person (Table 3).
As far as financial operations are concerned, 427 people (over 90% of the sample) used smartphones to carry out financial transactions. Most of them (68.71%) used m-banking applications for this purpose (14% more owners of smartphones with the iOS operating system than with the Android system). Over 21% of respondents used online banking via the browser and the bank’s website for these operations (over 9% more owners of smartphones with the Android operating system than with the iOS). Over 9% of smartphone users did not use financial banking services (Table 4).
Individuals who did not use banking services via a smartphone were asked about the circumstances in which they would be willing to use such services. The majority (47.83%) of people indicated that the issue was related to the lack of sufficient knowledge or awareness that could be supported with information from the media indicating the benefits of using mobile and online banking. The above-mentioned lack of awareness was pointed out by 12% more owners of iPhones. Almost 37% of respondents pointed to organisational problems, and, on average, 8.70% indicated the lack of proper training or instruction (16.67% owners of smartphones with the iOS operating system). Over 6% presented other reasons, such as insufficient transaction security, greater convenience in using transactions with a laptop, or simply no need to use this form of banking.
As far as e-banking and m-banking via a smartphone are concerned, on average, 48.24% of respondents usually only checked the account balance. Another popular operation was making a low-value transfer, which was reported by 31.85% of smartphone owners along with making low-value payments, which was declared by 11.71% of users. Checking a payment card balance or account history were less popular activities in this context. Among other operations performed via a smartphone, attention was paid to topping up the phone, making large-value transfers, withdrawing cash using Blik, and searching for banks and bank branches (Table 5).
5. Conclusions
The study was conducted with the participation of students, who are the most active users of smartphones and mobile applications. On the one hand, the study sampling constituted a specific limitation of the study as it is difficult to generalise the obtained results because the averages exceeded the findings obtained in surveys analysing the Polish population and the fact that the research mainly took the preferences of users aged 18–35 into account. Statistical sources have indicated, however, that over 90% of people in this group had their smartphones, and the level of ownership was estimated as 15–74% in the remaining age groups. On the other hand, taking into account this group’s receptive approach to innovation and globalisation tendencies, on the basis of the findings obtained in the research, it is possible to conclude future trends in the development of activities related to mobile devices and the use of mobile applications. It is also a group susceptible to international comparisons due to similar requirements regarding general trends on the internet. In the last three months of 2018, 40% of Poles made at least one purchase via the internet. Among Polish internet users, there were already over 23% of users who only did shopping via a smartphone (15% of buyers decided to finalise the transaction via smartphone) [10]. The obtained study results basically confirmed this tendency.
The most important differences and similarities between the results presented and the data appearing in other statistics, rankings, and studies are:
- All respondents owned at least one smartphone (on average, 10% more than in Poland).
- Respondents used 12% fewer smartphones with the Android operating system than the average share in Poland at the time, 2% fewer Android smartphones than the estimated average in Europe (in November 2018, the Android score in this regard fell to the level of 64.57%), and 14% less than the average in the world [13].
- A relatively large group (37%) used Apple phones (being considered more prestigious, which may be important in this environment), which, together with Samsung smartphones (26%, with using 42% with the Android system) constituted 63% of the all the equipment. The third position was taken by Huawei, followed by Xiaomi. Compared to the Polish market at that time, Samsung was seen as a market leader (42%), followed - after an intensive marketing campaign by Huawei (25%), Xiaomi (12%), and Apple, which took the fourth position [14].
- Among the advantages of used smartphones, respondents mainly valued high quality (hence the high share of iPhones), and, as in other studies, the availability of applications and design/appearance.
- Among the main disadvantages, the study participants listed the high price and low battery capacity (50% in total), as well as the high failure rate.
- Smartphones were used increasingly longer compared to data from 2014 [1], as the number of devices used for three-to-five years or more increased at the expense of the items that were used for less than three years. This is in line with the global trends that have shown a decrease in smartphone sales and an increase in the intensity of their use due to market saturation. As predicted in 2019, 2.5% fewer smartphones were sold worldwide, which was 2 million fewer in Europe [15,16].
- As a result, according to the examined users’ declarations, since 2014, the intensity of application usage in the group of more than 10 applications has increased by almost 6%.
- The opinion about the availability of applications improved (85% good and very good), and the quality rating also increased—in over 60%, it was rated as good, even though the users also took note of a number of worse quality applications.
- The use of smartphones to enable various types of functionality is difficult to apply in broader comparisons due to the fact that statistics have usually referred to it as the use of tablets and portable PCs; however, 40% of respondents emphasised the use of these devices mainly for conversations or other widely perceived internet activities (browsing news, social media, emails, etc.).
- In order to distribute photos taken with a smartphone, most users (40%) used the Instagram system, more than 12% used Messenger, the same share of respondents sent them as MMSs, 10% disseminated them via Facebook, and others decided not to publish them but rather use them for their own purposes.
- Almost 58% of users used subscription services, and their number increased by 40% in comparison to 2014.
- The rating of the convenience of using stores with mobile applications increased by 12% compared to 2014, and the same tendency could be observed in terms of the share of users downloading only free applications from the websites of electronic content providers—an increase by 9% (up to 83%). This was in line with trends occurring in Poland, although the rates of downloading free applications in this group were 8% higher than the average [10].
- Nearly 80% of smartphone owners made purchases via the internet, only 24% did it often, 34% did sometimes, and 32% indicated that they rarely engaged in online shopping.
- Purchases mainly included clothing and footwear at 43% (due to the possible return, exchange, etc. of goods guaranteed by legal provisions), transport tickets, or tickets for cultural events, cosmetics, food, etc. In general, these are still low-value expenses, and high-value online transactions are made using PCs [17].
- More than 90% of respondents carried out various financial operations via a smartphone. The respondents (69%) mainly used bank applications for this purpose, over 21% of them used the bank′s browser on the internet, and almost 10% did not use this option at all; 15% more smartphone users with iOS system tended to use banking applications (compare with [18]).
Smartphone owners mainly used passive banking operations, e.g., checking the account balance (48%), and 43% of respondents used active operations—making low-value transfers and low-value payments for goods or services (including the Blik system). As the analysis presented above indicates, when we compare the present findings with the results of other studies, the quantitative data appeared to be in line with national and international trends. In terms of qualitative data, certain specified differences resulting from the adopted methodology and the sampling procedure emerged, similarly to the case of the previously conducted research. The above considerations point to one definite conclusion, i.e., the mobile application market will continue to rapidly grow. Even if the dynamics of this growth has recently decreased [19], one needs to consider the following circumstances:
- The highest dynamics can be achieved if we start from scratch.
- Due to the increasing quality of both the technical characteristics of smartphones and mobile applications, the length of their use increases.
- If the process of technological “ageing” is slowing down, users are not interested in replacing their smartphone with a new one, and they only replace it when their device breaks down or stops working as well as before.
- Possibilities related to the replacement or repair of the items are not limited by law or technical solutions.
- Increasing the speed of data transfer to fifth-generation mobile technologies, which will probably make smartphone replacement necessary.
- Introduction of the technology of the so-called folded or broadcast smartphone screens, which will be an important technical novelty and may induce users to buy new devices.
- We may observe a growing tendency to diversify the sales structure (multiple sectors).
It is important to note that the demand for smartphones and mobile applications is currently driven by countries such as India, China, and Brazil, as well as African countries, whose inhabitants are buying an increasing number of smartphones and are also expected to use mobile application shops more and more. The pace at which new, improved applications are created is also increasing, together with the emergence of new technologies that will be entering new markets.
The presented research constitutes the second stage of research that will be completed with the use of a comparative analysis including also cultural aspects of smartphones and mobile applications in selected countries.
Funding
This research received no external funding.
Conflicts of Interest
The author declares no conflict of interest.
References
- Chmielarz, W. Study of smartphones usage from the customer’s point of view. Procedia Comput. Sci. 2015, 65, 1085–1094. [Google Scholar] [CrossRef] [Green Version]
- Kemp, S. Digital 2019: Global Internet Use Accelerate, Special Report. Available online: https://wearesocial.com/blog/2019/01/digital-2019-global-internet-use-accelerates (accessed on 10 April 2020).
- Nielsen, J.; Budiu, R. Mobile Usability; New Riders Press: Berkeley CA, USA, 2013. [Google Scholar]
- Chmielarz, W.; Zborowski, M.; Atasever, M. Aspects of Mobility of e-Marketing from Customer Perspective. In Proceedings of the Federated Conference on Computer Science and Information Systems, Leipzig, Germany, 1–4 September 2019; pp. 529–533. [Google Scholar] [CrossRef]
- Perera, U. Characteristic Analysis of Android Smartphone Applications Based on Usage Patterns; University of Tsukuba: Tsukuba, Japan, 2017; Available online: https://core.ac.uk/download/pdf/87202735.pdf (accessed on 15 December 2019).
- NewZoo. Global Mobile Market Report. Available online: https://newzoo.com/insights/trend-reports/newzoo-global-mobile-market-report-2019-light-version/ (accessed on 12 December 2019).
- Fandrejewska, A. Understanding consumers’ sentiments as a key to creating superior customer value. Handel Wewnętrzny 2017, 368, 275–286. [Google Scholar]
- Fandrejewska, A. The Cultural and Socialcontext in an Analysis of Contemporary Consumer Behaviour, Konsumpcja i Rozwój. 2017. Available online: Yadda.icm.edu.pl (accessed on 10 December 2019).
- IDG Report. Available online: https://www.idc.com/promo/smartphone-market-share/os (accessed on 15 January 2020).
- Mobirank. Available online: https://mobirank.pl/2019/11/18/32-mld-użytkownikow-korzysta-z-36-mld-smartfonow-na-swiecie/ (accessed on 10 January 2020).
- Polska Jest MOBI, Raport. Available online: https://businessinsider.com.pl/technologie/raport-mobi-2018-polacy-sa-coraz-bardziej-mobilni/chpkm38 (accessed on 12 December 2019).
- Batorski, D.; Płoszaj, A.; Jasiewicz, J.; Czerniawska, D.; Peszat, K. Raport: Diagnoza i Rekomendacje w Obszarze Kompetencji Cyfrowych Społeczeństwa i Przeciwdziałania Wykluczeniu Cyfrowemu w Kontekście Zaprogramowania Wsparcia w Latach 2014–2020 (Report: Diagnosis and Recommendations in the Area of Digital Competences of the Society and Counteracting Digital Exclusion in the Context of Programming Support in 2014–2020); Ministerstwo Rozwoju Regionalnego: Warsaw, Poland, 2012.
- Singh, R.I.; Summeth, M.; Miller, J. Evaluating the Reliability of Privacy Policies in Mobile Environment. Int. J. Mob. Hum. Comput. Interact. 2011, 3, 53–78. [Google Scholar] [CrossRef] [Green Version]
- Tur, H. iPhone vs. Android—Kto Rządzi na Rynkach (iPhone vs. Android—Who Rules the Markets?). Available online: https://www.pcworld.pl/news/iPhone-vs-Android-kto-rzadzi-na-rynkach,412131.html (accessed on 12 December 2019).
- Kulas, T. Sprzedaż Smartfonów Maleje., Rynek się Nasycił. Co Robić w Takiej Sytuacji? (Smartphones Sales Decrease, Market Is Filled. What to Do in the Situation?). Available online: https://mitsmr.pl/innowacje/strategia-innowacyjnosci/sprzedaz-smartfonow-maleje-rynek-sie-nasycil-co-robic-w-takiej-sytuacji/ (accessed on 29 September 2019).
- Gartner Says Worldwide Smartphone Sales Will Decline 2.5% in 2019. Available online: https://www.gartner.com/en/newsroom/press-releases/2019-08-01-gartner-says-worldwide-smartphone-sales-will-decline (accessed on 30 September 2019).
- Vulnerabilities and Threads in Mobile Applications. Available online: https://www.ptsecurity.com/ww-en/analytics/mobile-application-security-threats-and-vulnerabilities-2019/ (accessed on 25 January 2020).
- Sarma, A.; Krishna, K.; Kumar, S. Analyzing the purchase intentions of Smartphone: A Descriptive Study. J. Mech. Contin. Mech. Sci. 2019, 14, 651–662. [Google Scholar] [CrossRef]
- Kupujemy Coraz Mniej Smartfonów, PAP (Polska Agencja Prasowa—Polish Press Agency). Available online: https://businessinsider.com.pl/firmy/sprzedaz/rynek-smartfonow-na-swiecie-ile-kupuje-sie-telefonow/k17q25v (accessed on 20 January 2020).
Figure 1.
Advantages of smartphones used by the respondents. Source: own work.

Figure 2.
Disadvantages of smartphones used by the respondents. Source: own work.


Table 1.
The intensity of smartphone use (the number of regularly used applications).
| Labels/Operating System of the Smartphone | Android | iOS (iPhone) | Average for 2018 | Average for 2014 |
|---|---|---|---|---|
| 1–3 | 8.53% | 4.47% | 6.50% | 10.57% |
| 4–6 | 29.01% | 26.26% | 27.63% | 26.60% |
| 7–10 | 27.30% | 22.35% | 24.83% | 28.10% |
| More than 10 | 35.15% | 46.93% | 41.04% | 34.73% |
Table 2.
Frequency of purchases made by respondents.
| Frequency/The Operating System of the Smartphone | Android | iOS (iPhone) | Average |
|---|---|---|---|
| Sometimes | 32.42% | 37.43% | 34.25% |
| Rarely | 35.49% | 26.26% | 32.14% |
| Often | 20.14% | 31.28% | 24.31% |
| Never | 11.95% | 5.03% | 9.30% |
Table 3.
A selection of products and services purchased via a smartphone.
| Product/Operating System | Android | iOS (iPhone) | Average |
|---|---|---|---|
| Clothing/footwear | 38.57% | 49.72% | 42.92% |
| Transport tickets (plane, train, etc.) | 22.53% | 17.88% | 20.72% |
| Cinema and concert tickets | 15.02% | 16.76% | 15.64% |
| Other | 10.58% | 4.47% | 8.25% |
| Food | 5.12% | 6.15% | 5.50% |
| Entertainment (books, films, music, games) | 5.46% | 3.91% | 4.86% |
| Information | 1.37% | 0.00% | 0.85% |
| Financial services | 0.68% | 0.56% | 0.63% |
| Household appliance/Home electronics | 0.68% | 0.00% | 0.42% |
| IT products and services | 0.00% | 0.56% | 0.21% |
Table 4.
Types of banking used in banking operations.
| Types of Banking/Operating System | Android | iOS (iPhone) | Average |
|---|---|---|---|
| e-Banking mobile application | 63.48% | 77.65% | 68.71% |
| Online banking using the browser and the bank’s website | 24.91% | 15.64% | 21.56% |
| I don’t use it at all | 11.60% | 6.70% | 9.73% |
Table 5.
Types of operations performed as part of e-banking.
| Labels/Operation System | Android | iOS (iPhone) | Average |
|---|---|---|---|
| I check account balance | 49.03% | 47.31% | 48.24% |
| I make low-value transactions | 31.27% | 32.34% | 31.85% |
| I make low-value payments for goods/services | 11.58% | 11.98% | 11.71% |
| I check payment card balances | 2.70% | 4.19% | 3.28% |
| Other | 2.70% | 2.99% | 2.81% |
| I check account history | 2.70% | 1.20% | 2.11% |
© 2020 by the author. Licensee MDPI, Basel, Switzerland. This article is an open access article distributed under the terms and conditions of the Creative Commons Attribution (CC BY) license (http://creativecommons.org/licenses/by/4.0/).
Share and Cite
MDPI and ACS Style
Chmielarz, W. The Usage of Smartphone and Mobile Applications from the Point of View of Customers in Poland. Information 2020, 11, 220. https://0-doi-org.brum.beds.ac.uk/10.3390/info11040220
AMA Style
Chmielarz W. The Usage of Smartphone and Mobile Applications from the Point of View of Customers in Poland. Information. 2020; 11(4):220. https://0-doi-org.brum.beds.ac.uk/10.3390/info11040220
Chicago/Turabian StyleChmielarz, Witold. 2020. "The Usage of Smartphone and Mobile Applications from the Point of View of Customers in Poland" Information 11, no. 4: 220. https://0-doi-org.brum.beds.ac.uk/10.3390/info11040220
Note that from the first issue of 2016, this journal uses article numbers instead of page numbers. See further details here.