Studying the Influences of Bus Stop Type and Specifications on Bicycle Flow and Capacity for Better Bicycle Efficiency


Abstract
:1. Introduction
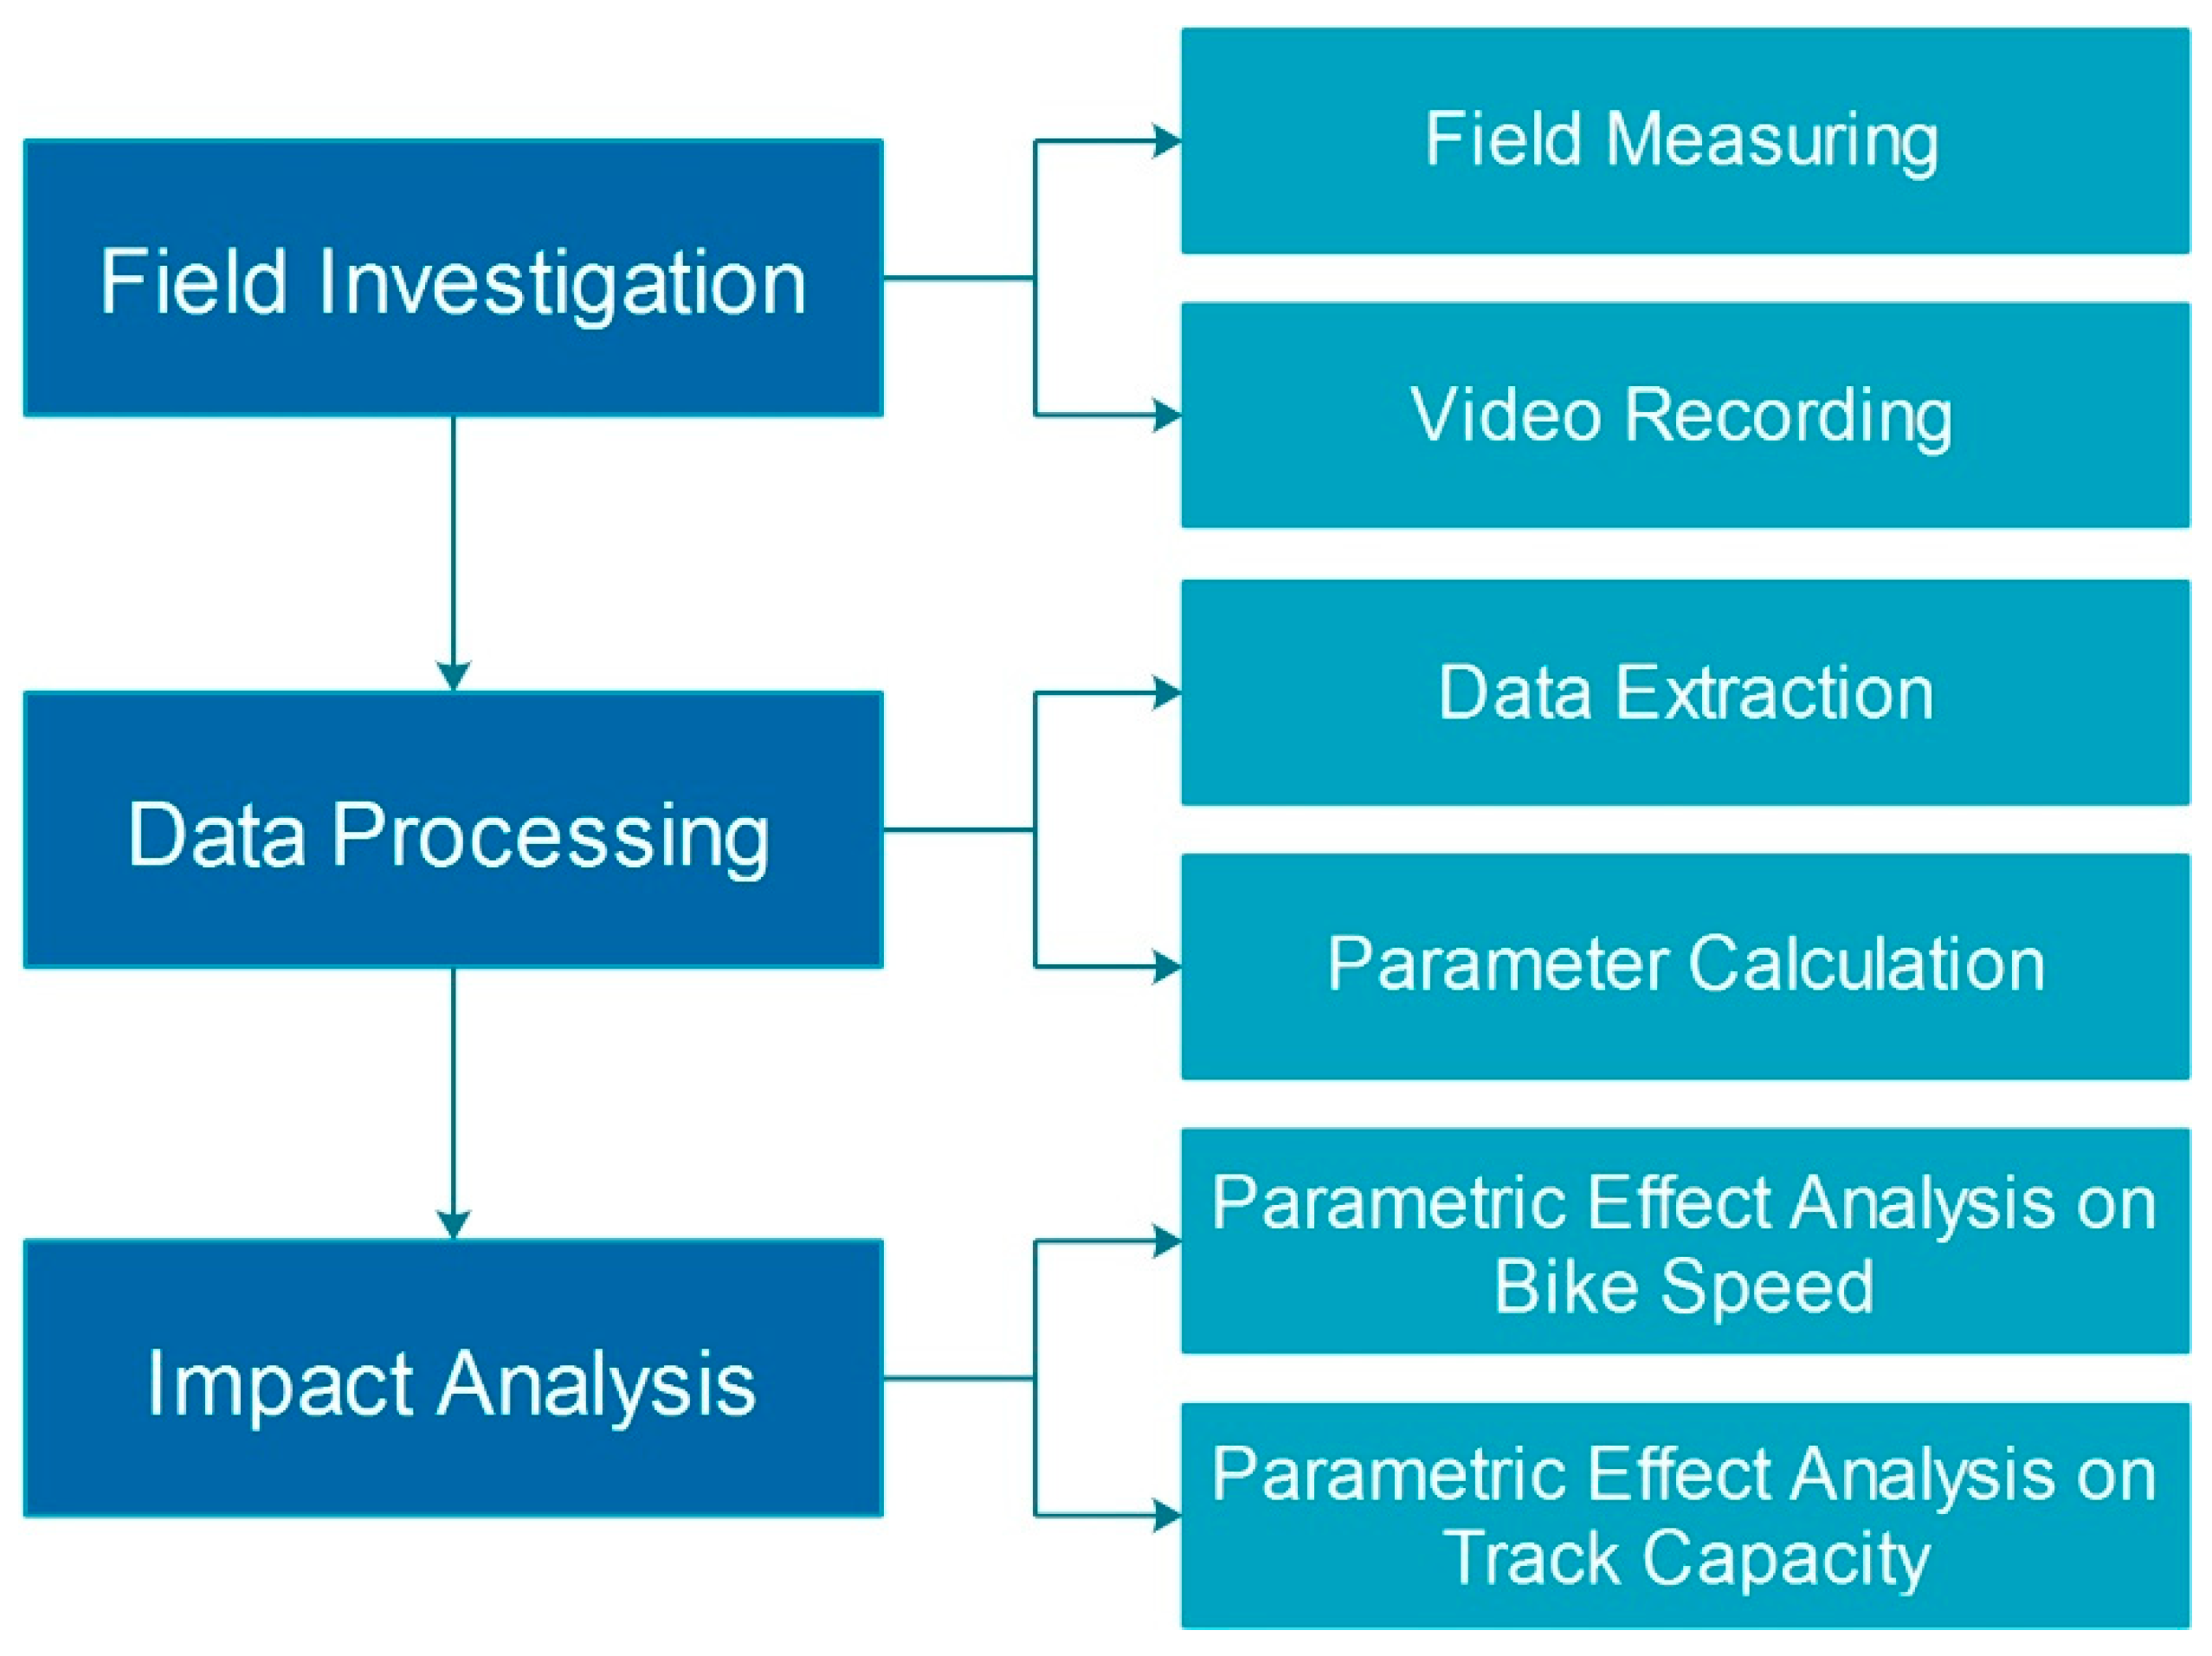
2. Methodology
2.1. Data Collection
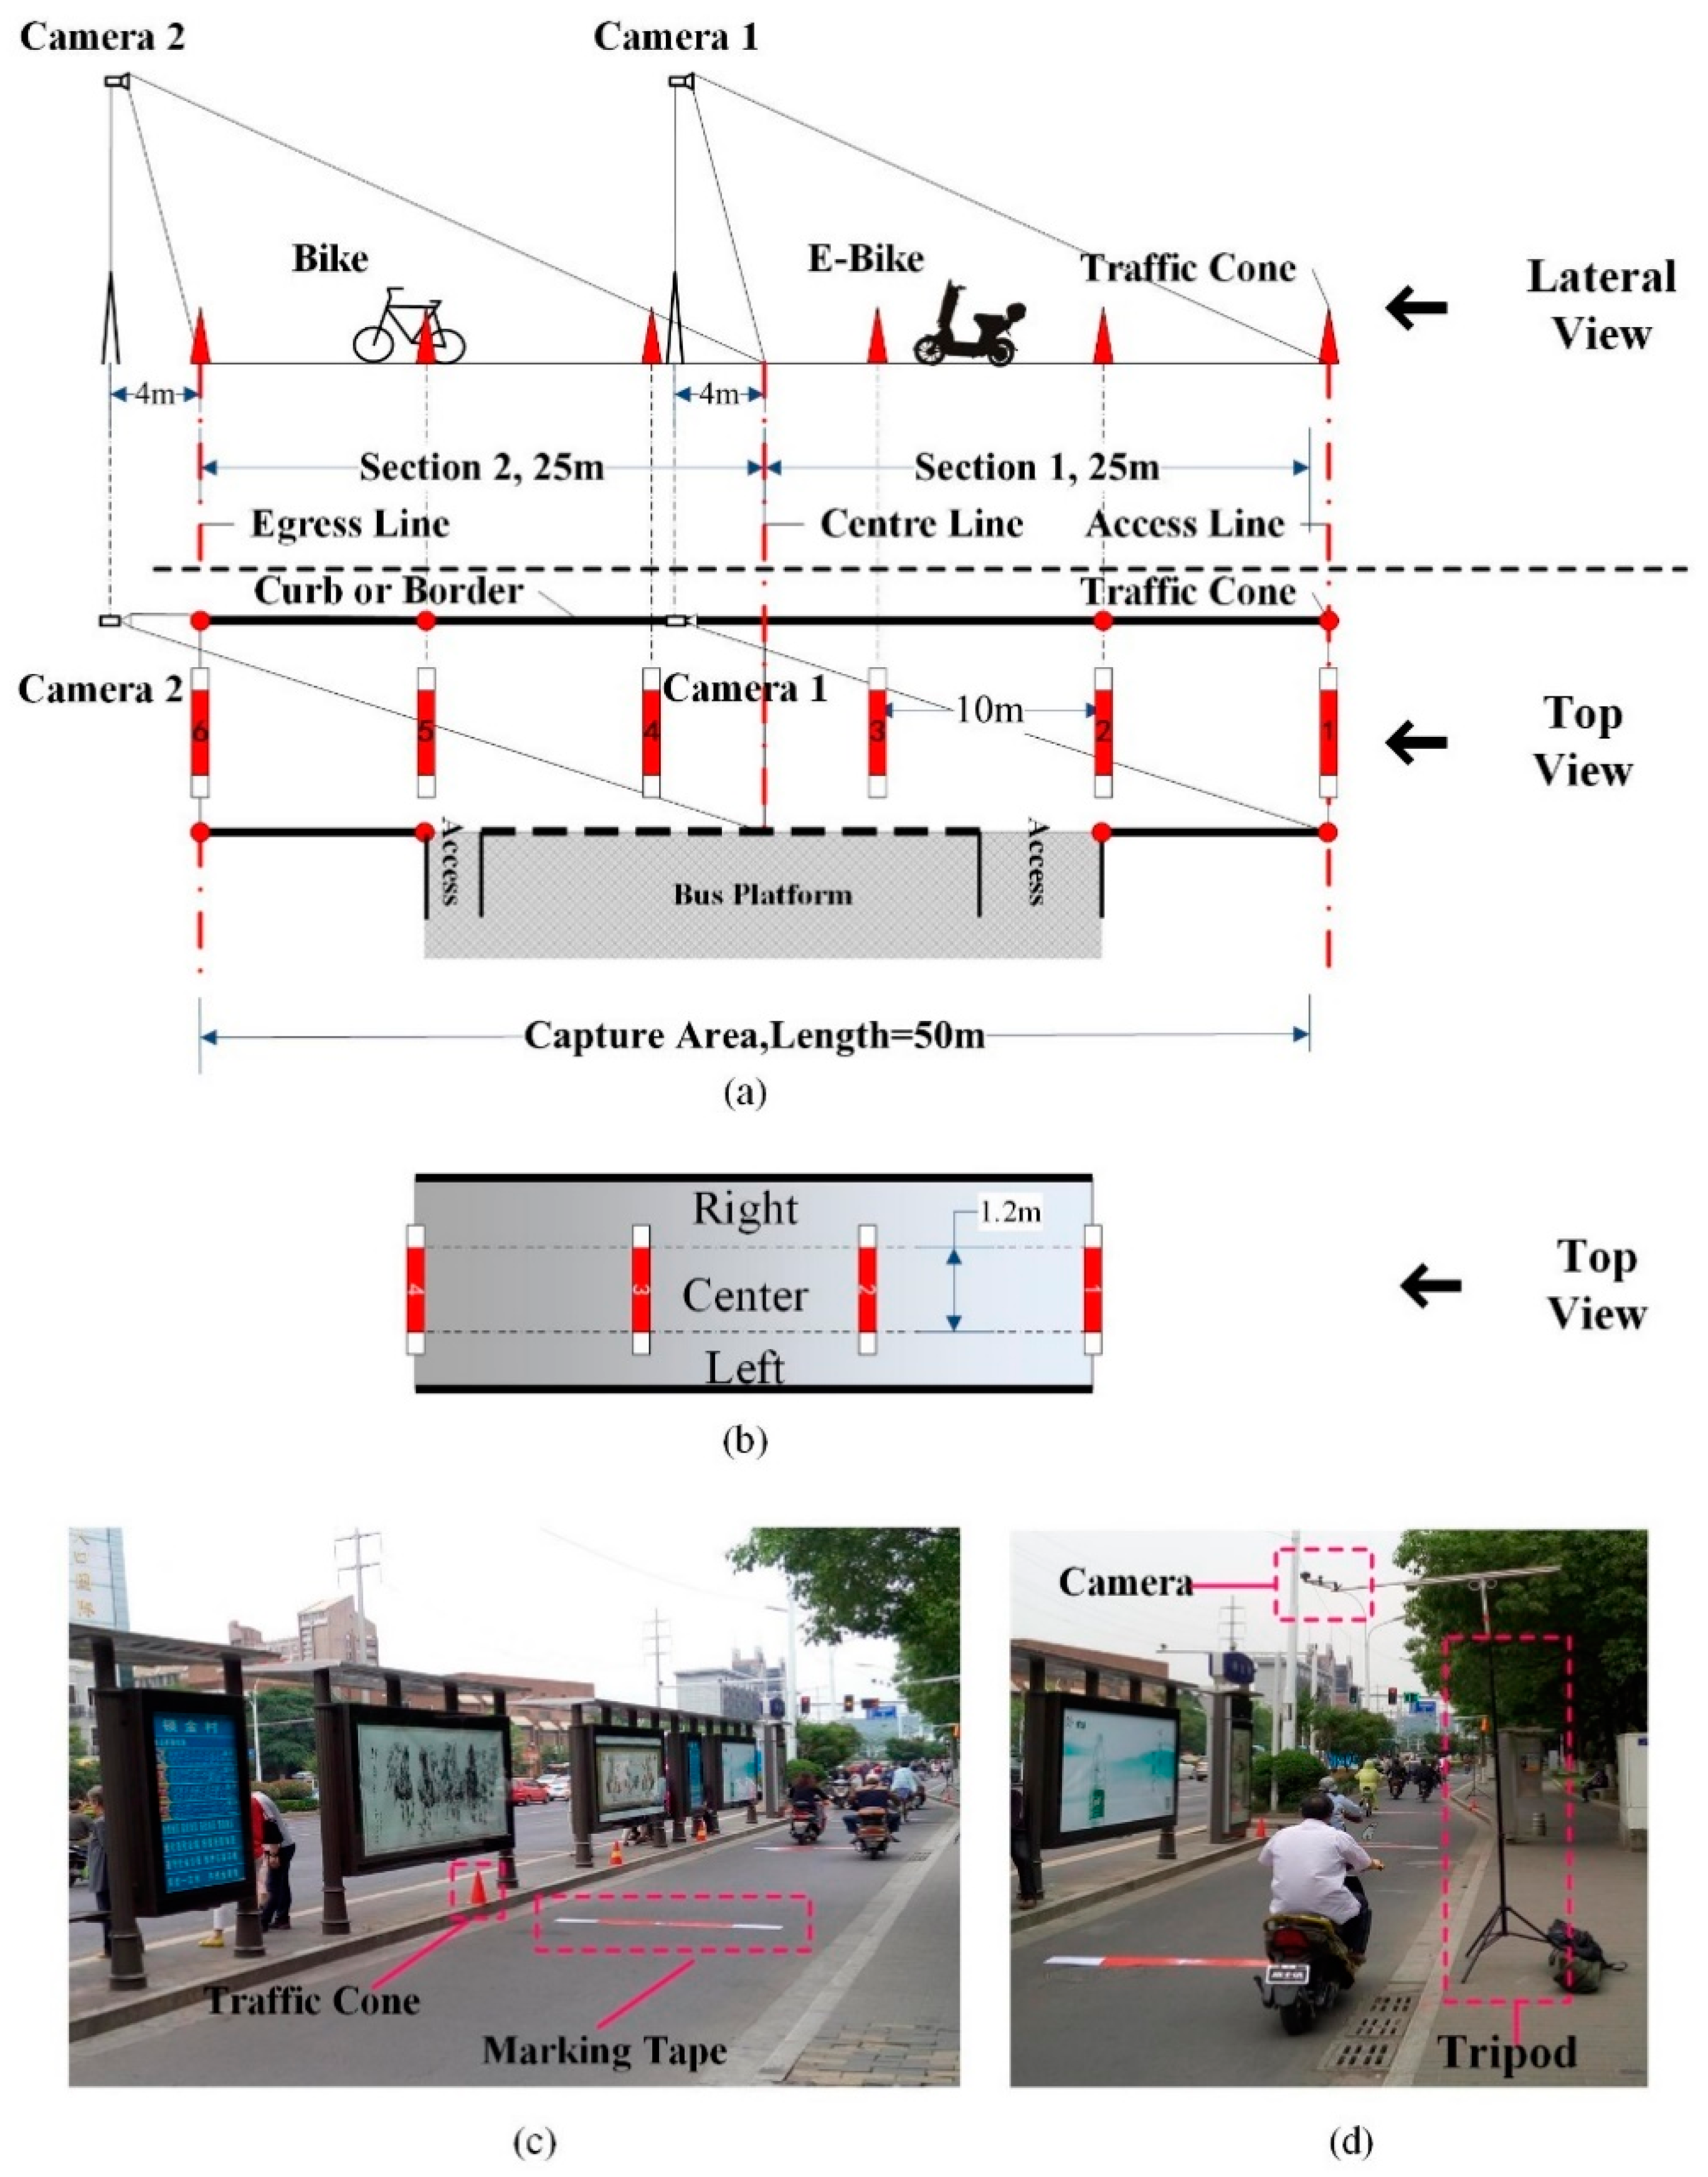
2.1.1. Field Survey
- (1)
- differences in bicycle track width;
- (2)
- paved level terrain, good sight;
- (3)
- far from intersections, block accesses and bus stations;
- (4)
- differences in type of bus stop;
- (5)
- the compared basic segments located far from the bus stops;
- (6)
- suitable space for installing cameras;
2.1.2. Data Extraction
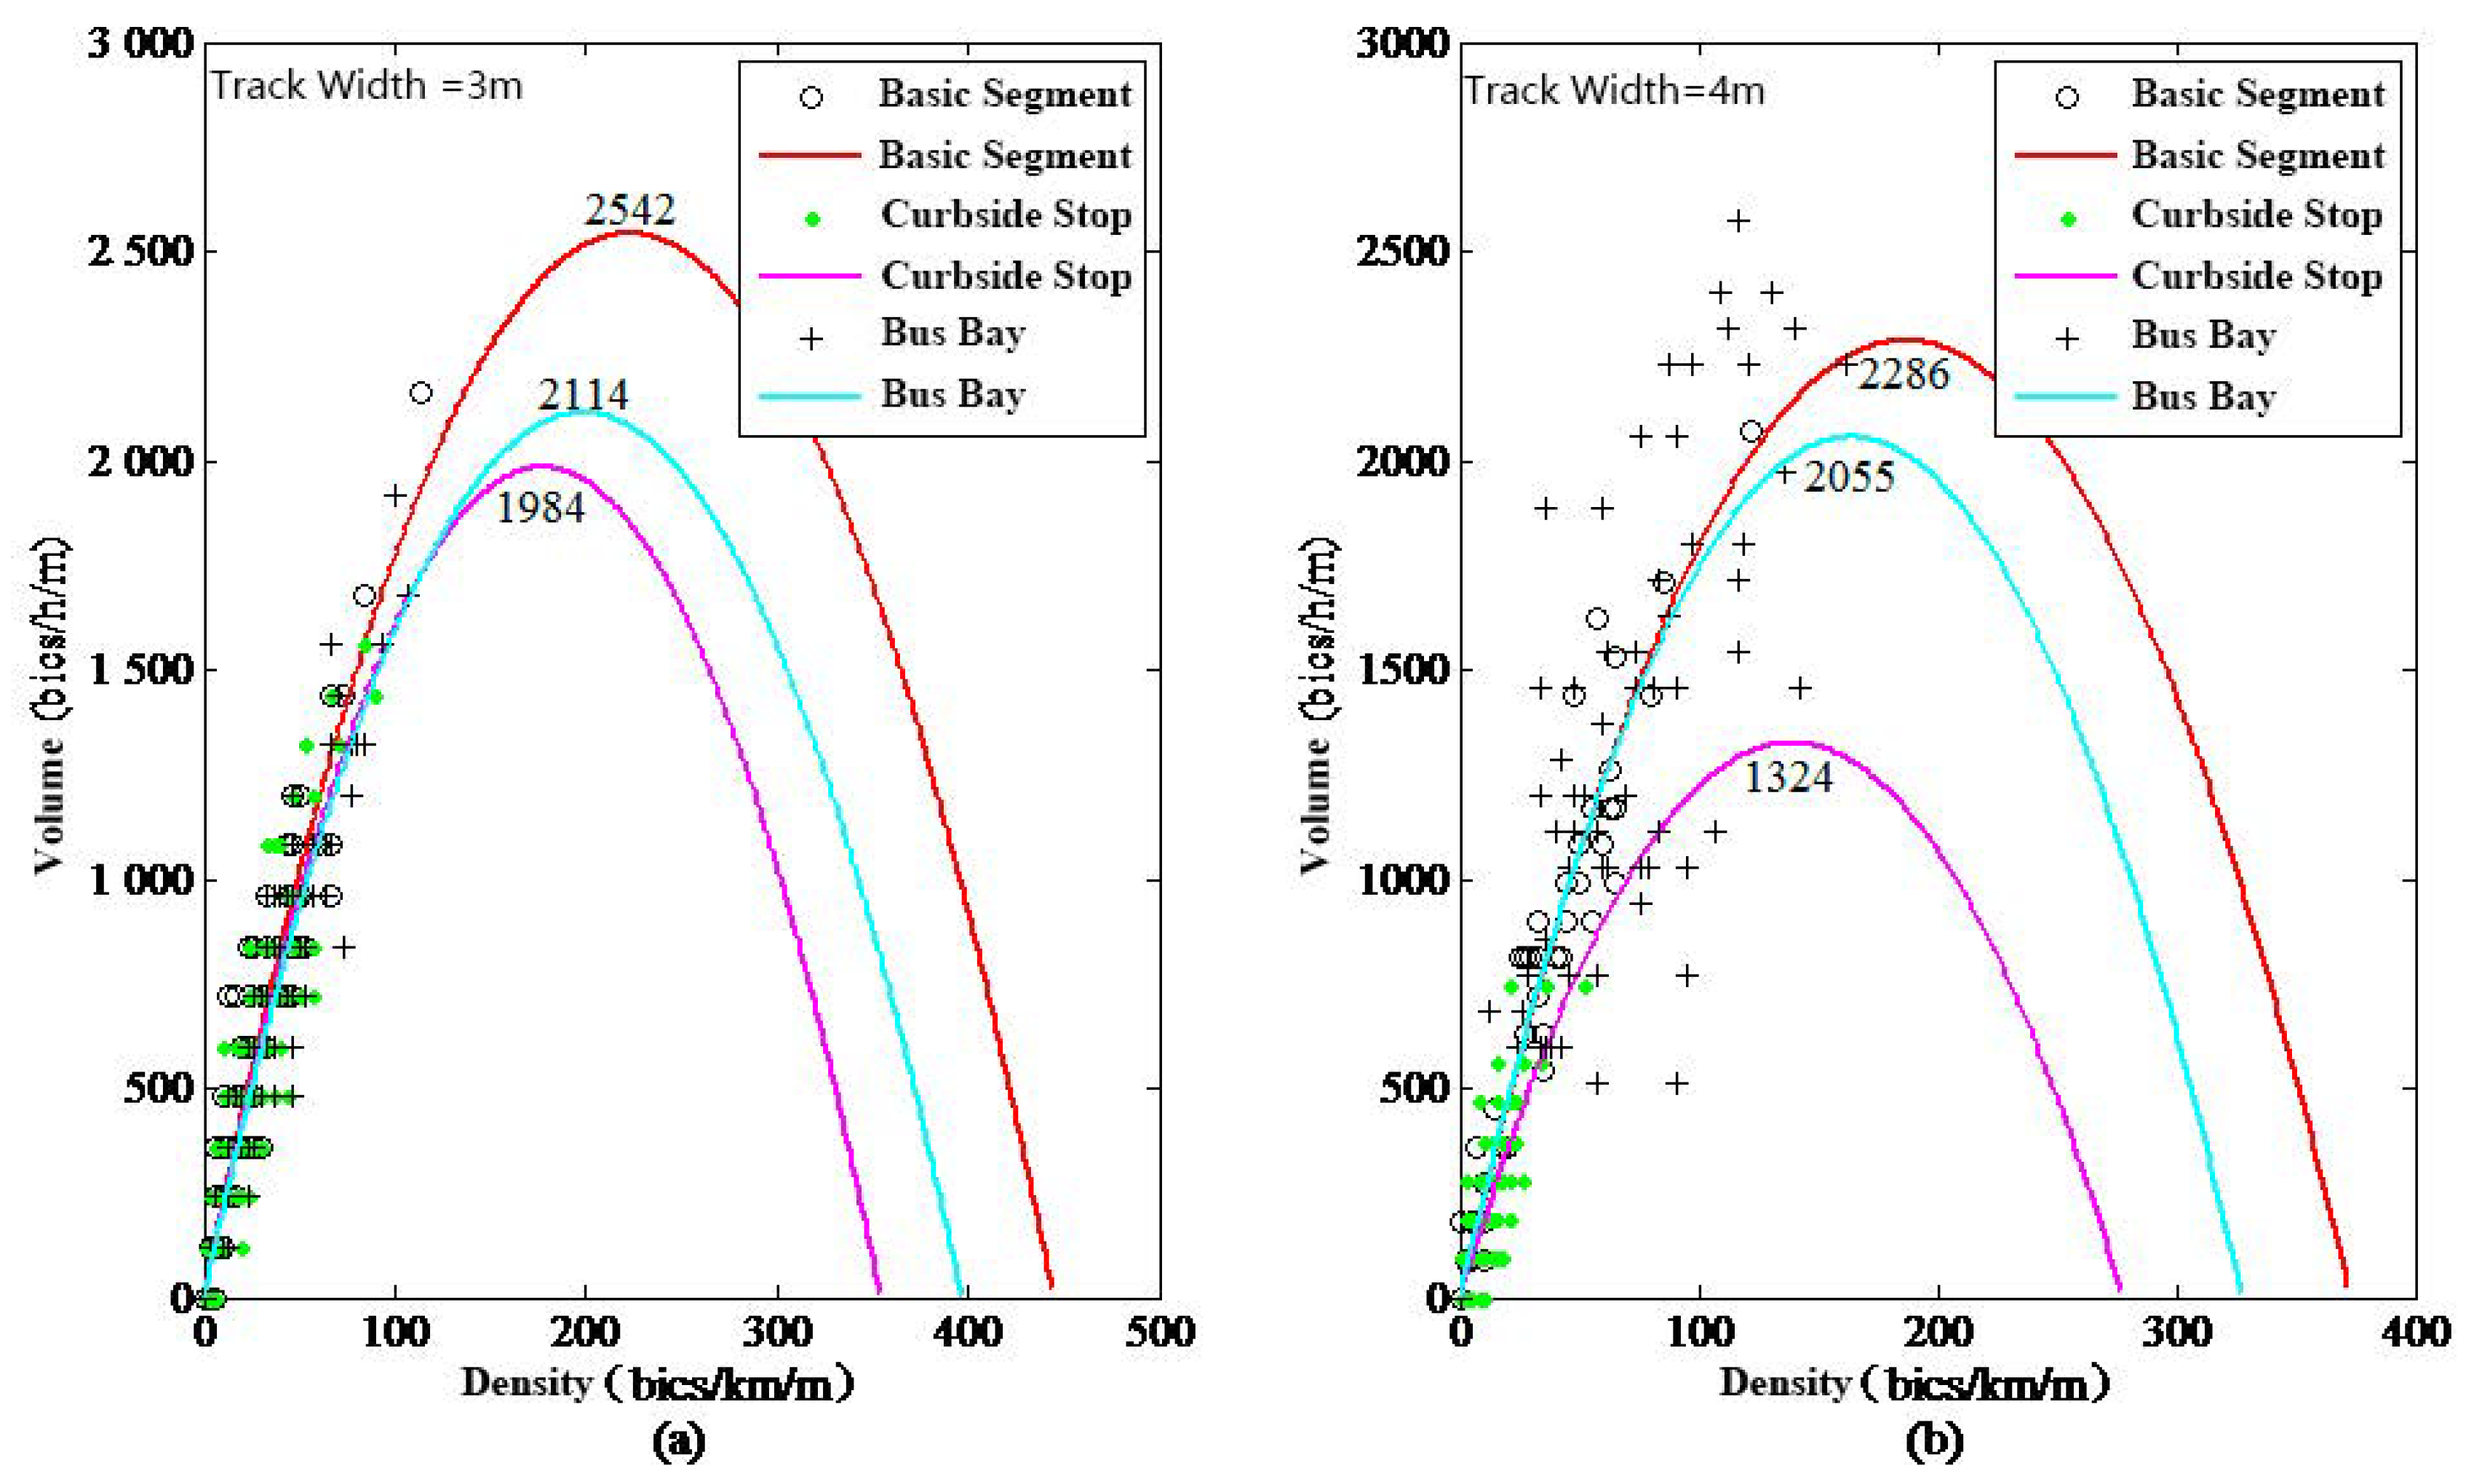
- q = flow (bics/h/m)
- A, B = constants
- k = density (bics/km/m).
2.1.3. Results and Descriptive Analysis
2.2. Testing Speed Differences
2.3. Analyzing the Relationships Between Stop Specifications and Bicycle Speed, Track Capacity
3. Impact of Bus Stop Type and Specifications on Bicycle Speed
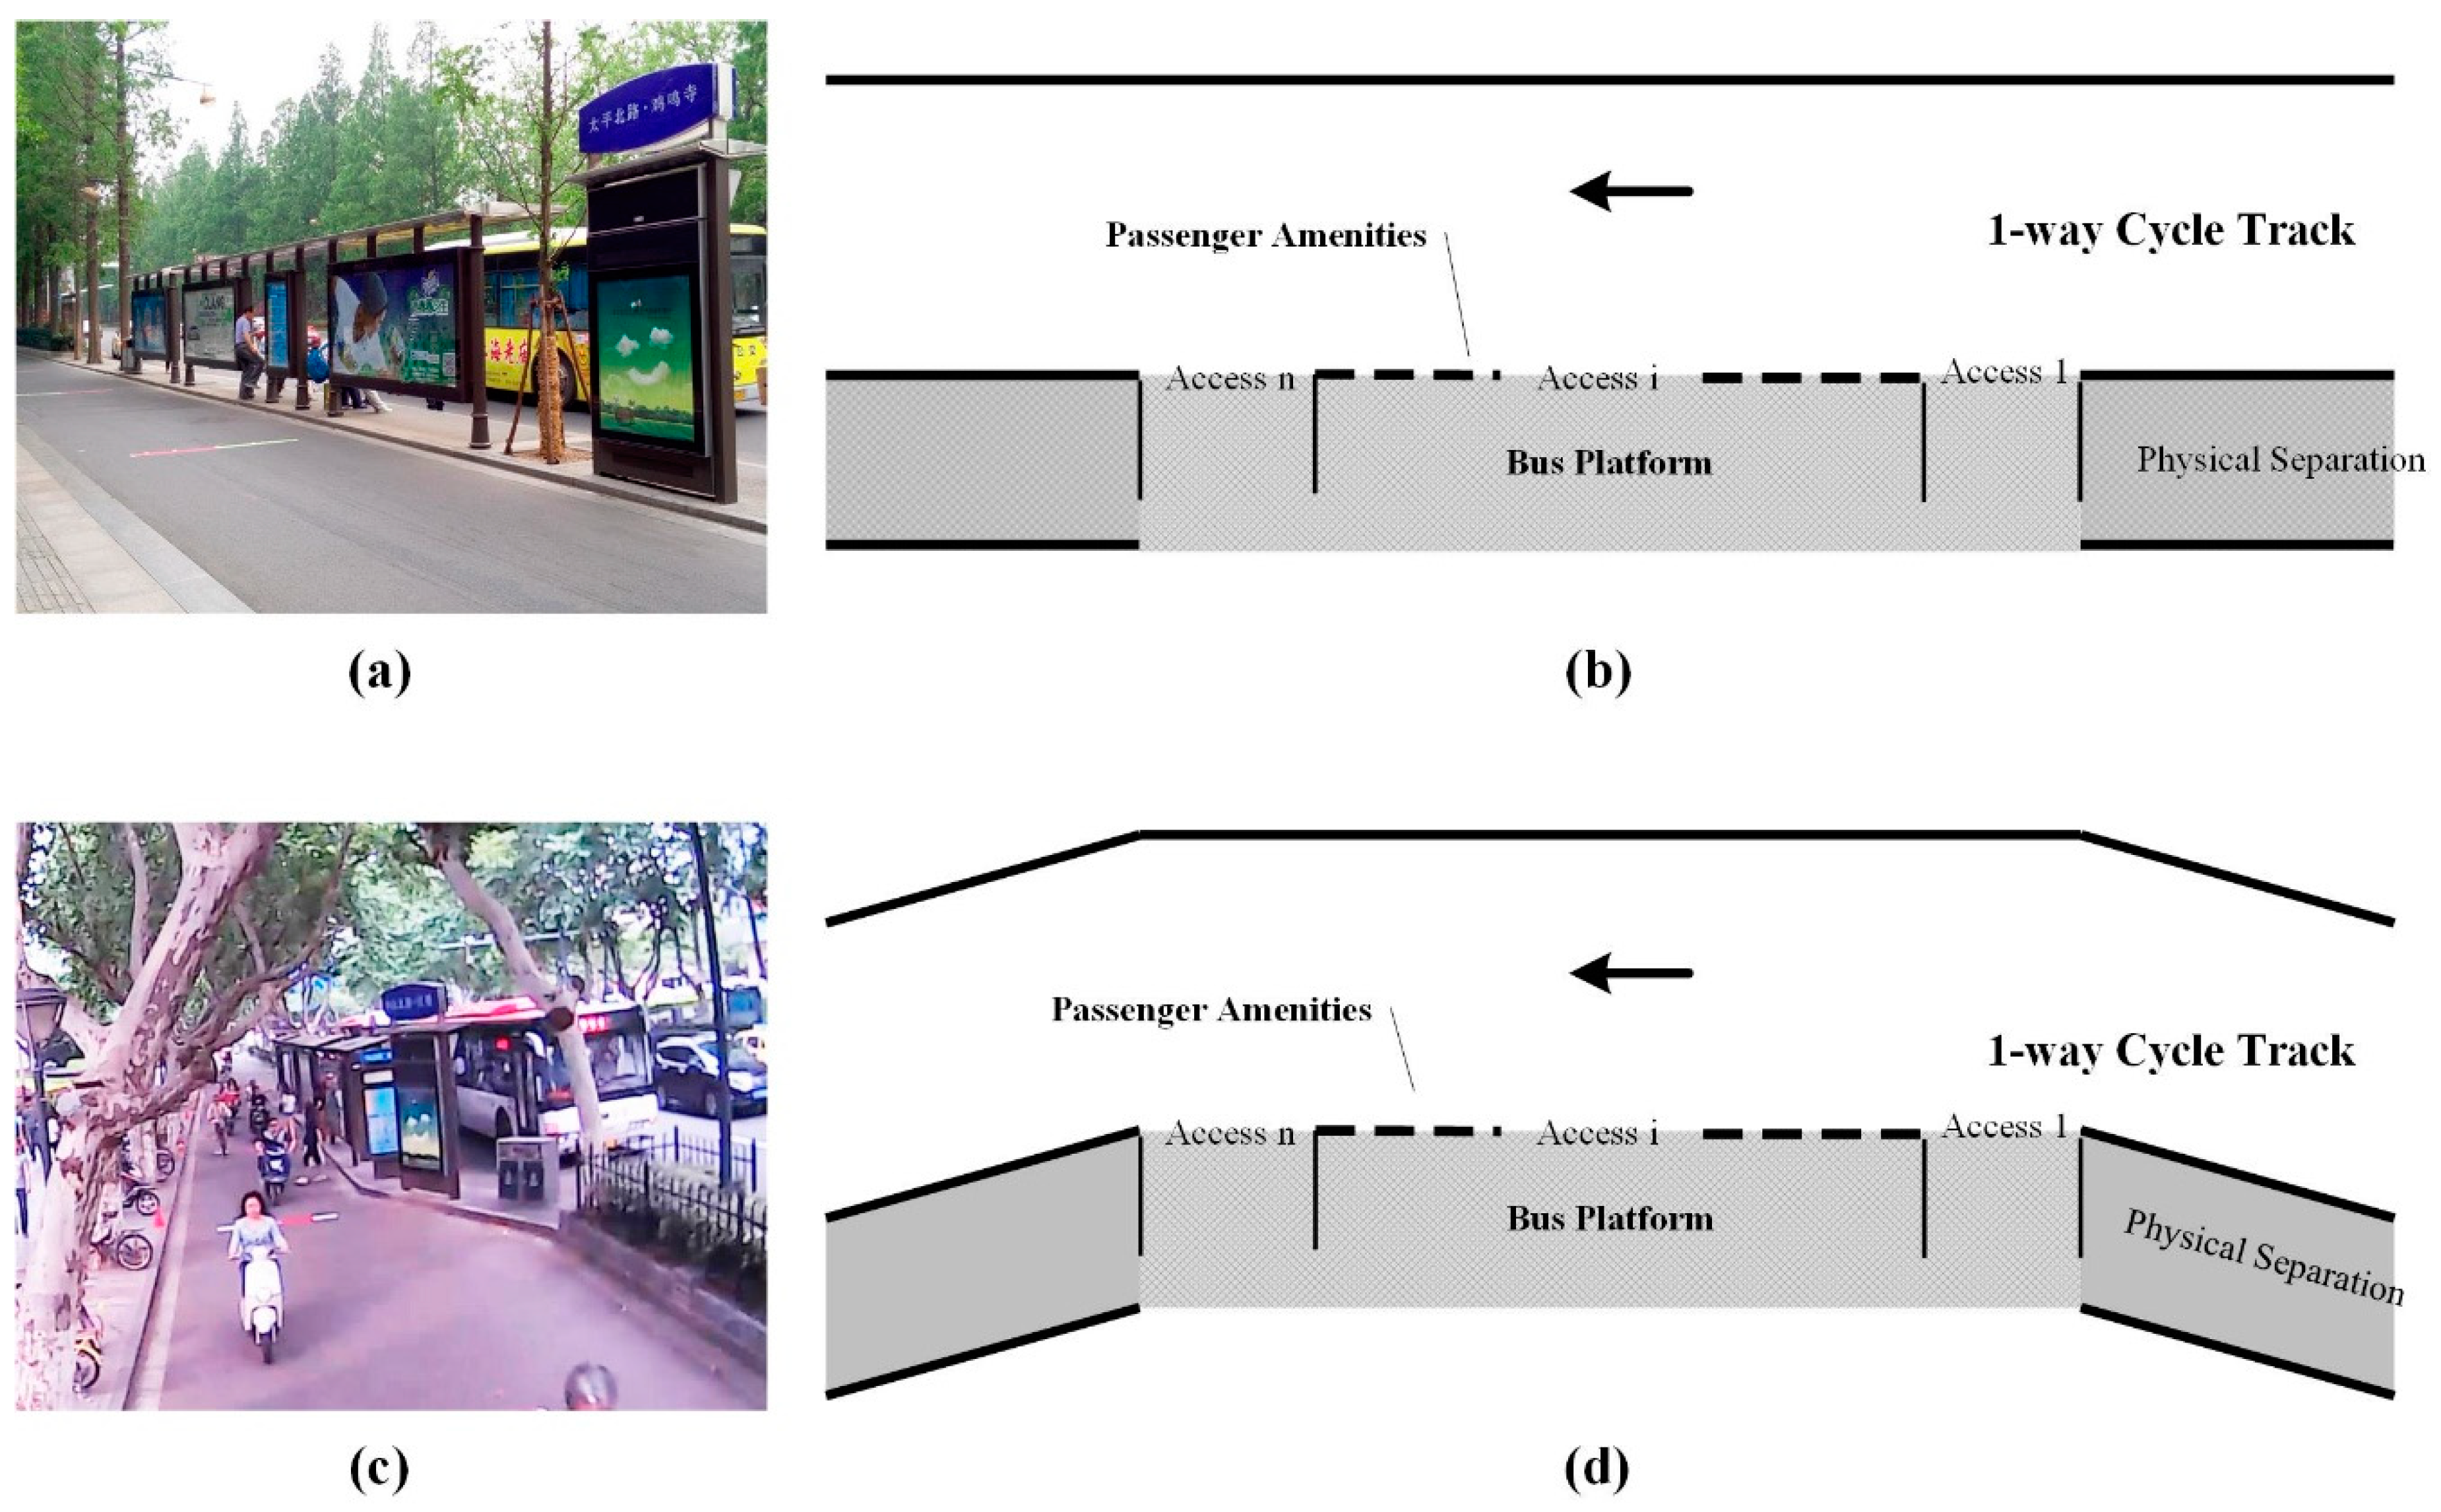
3.1. Stop Type
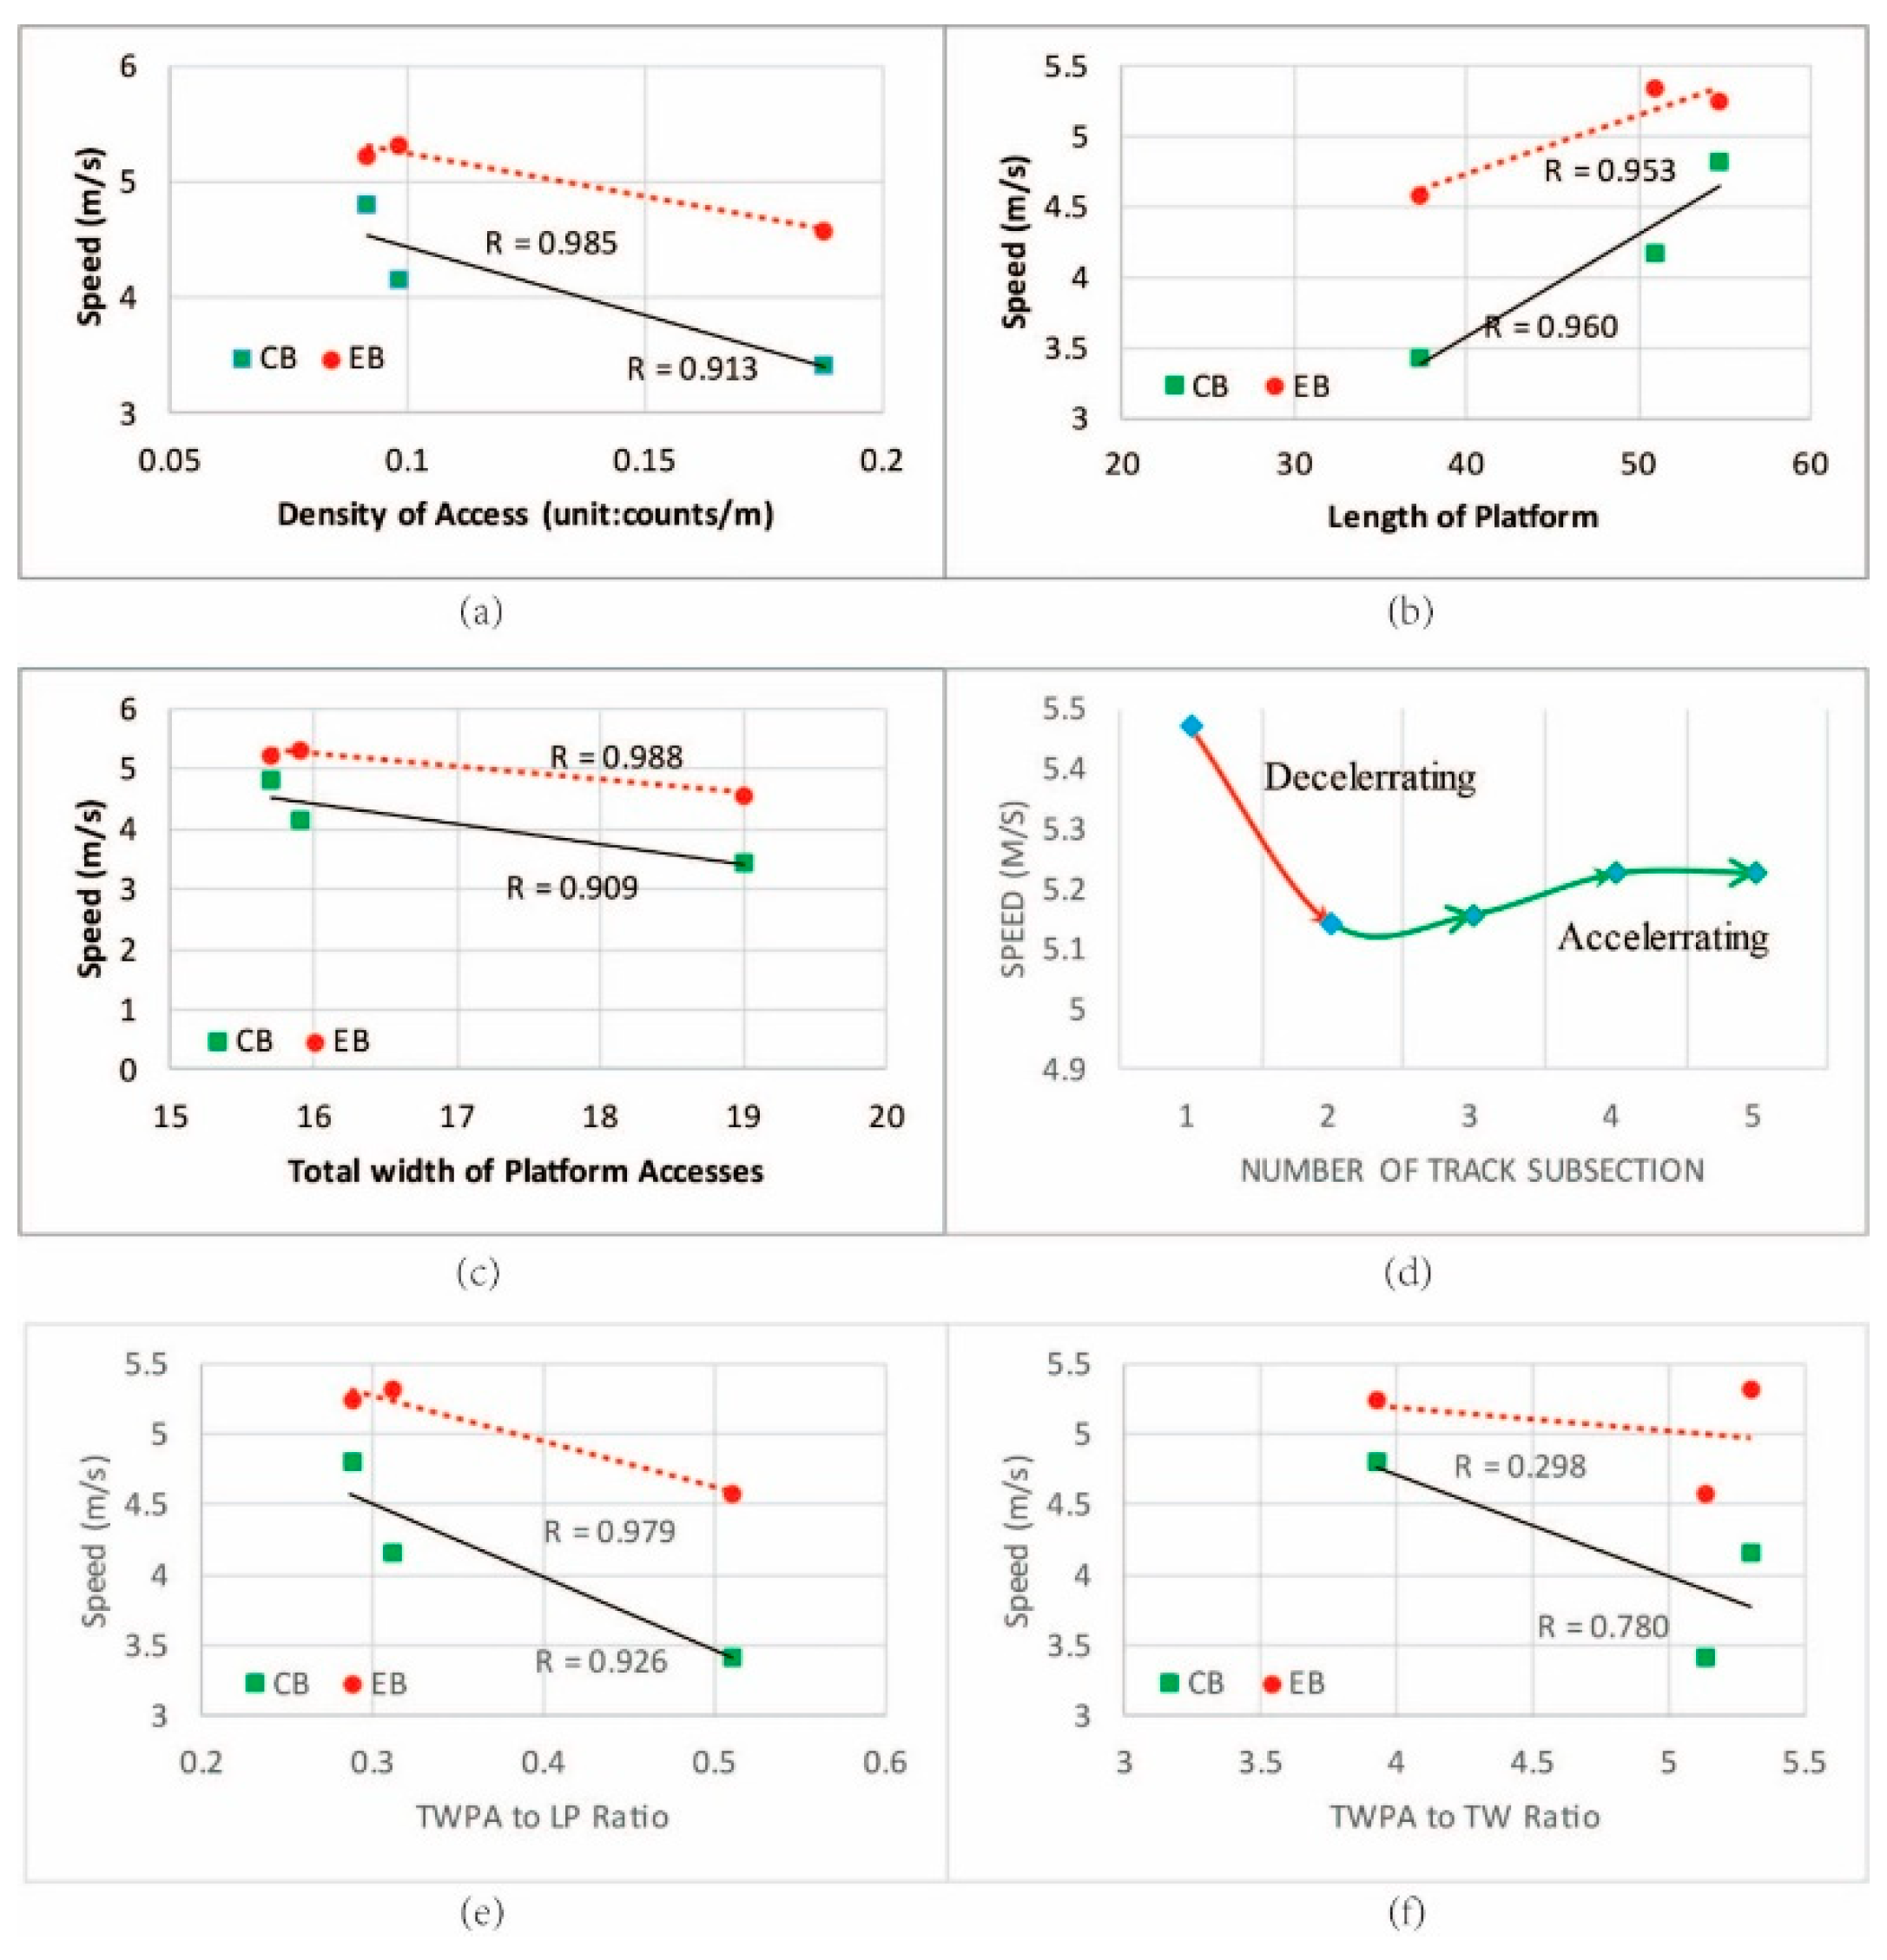
3.2. Number, Location, and Density of Bus Platform Accesses
3.3. Platform Length and TWPA
3.4. TWPA to PL Ratio and TWPA to TW Ratio
4. Impact of Bus Stop Type and Specifications on Track Capacity
4.1. Stop Type
- (1)
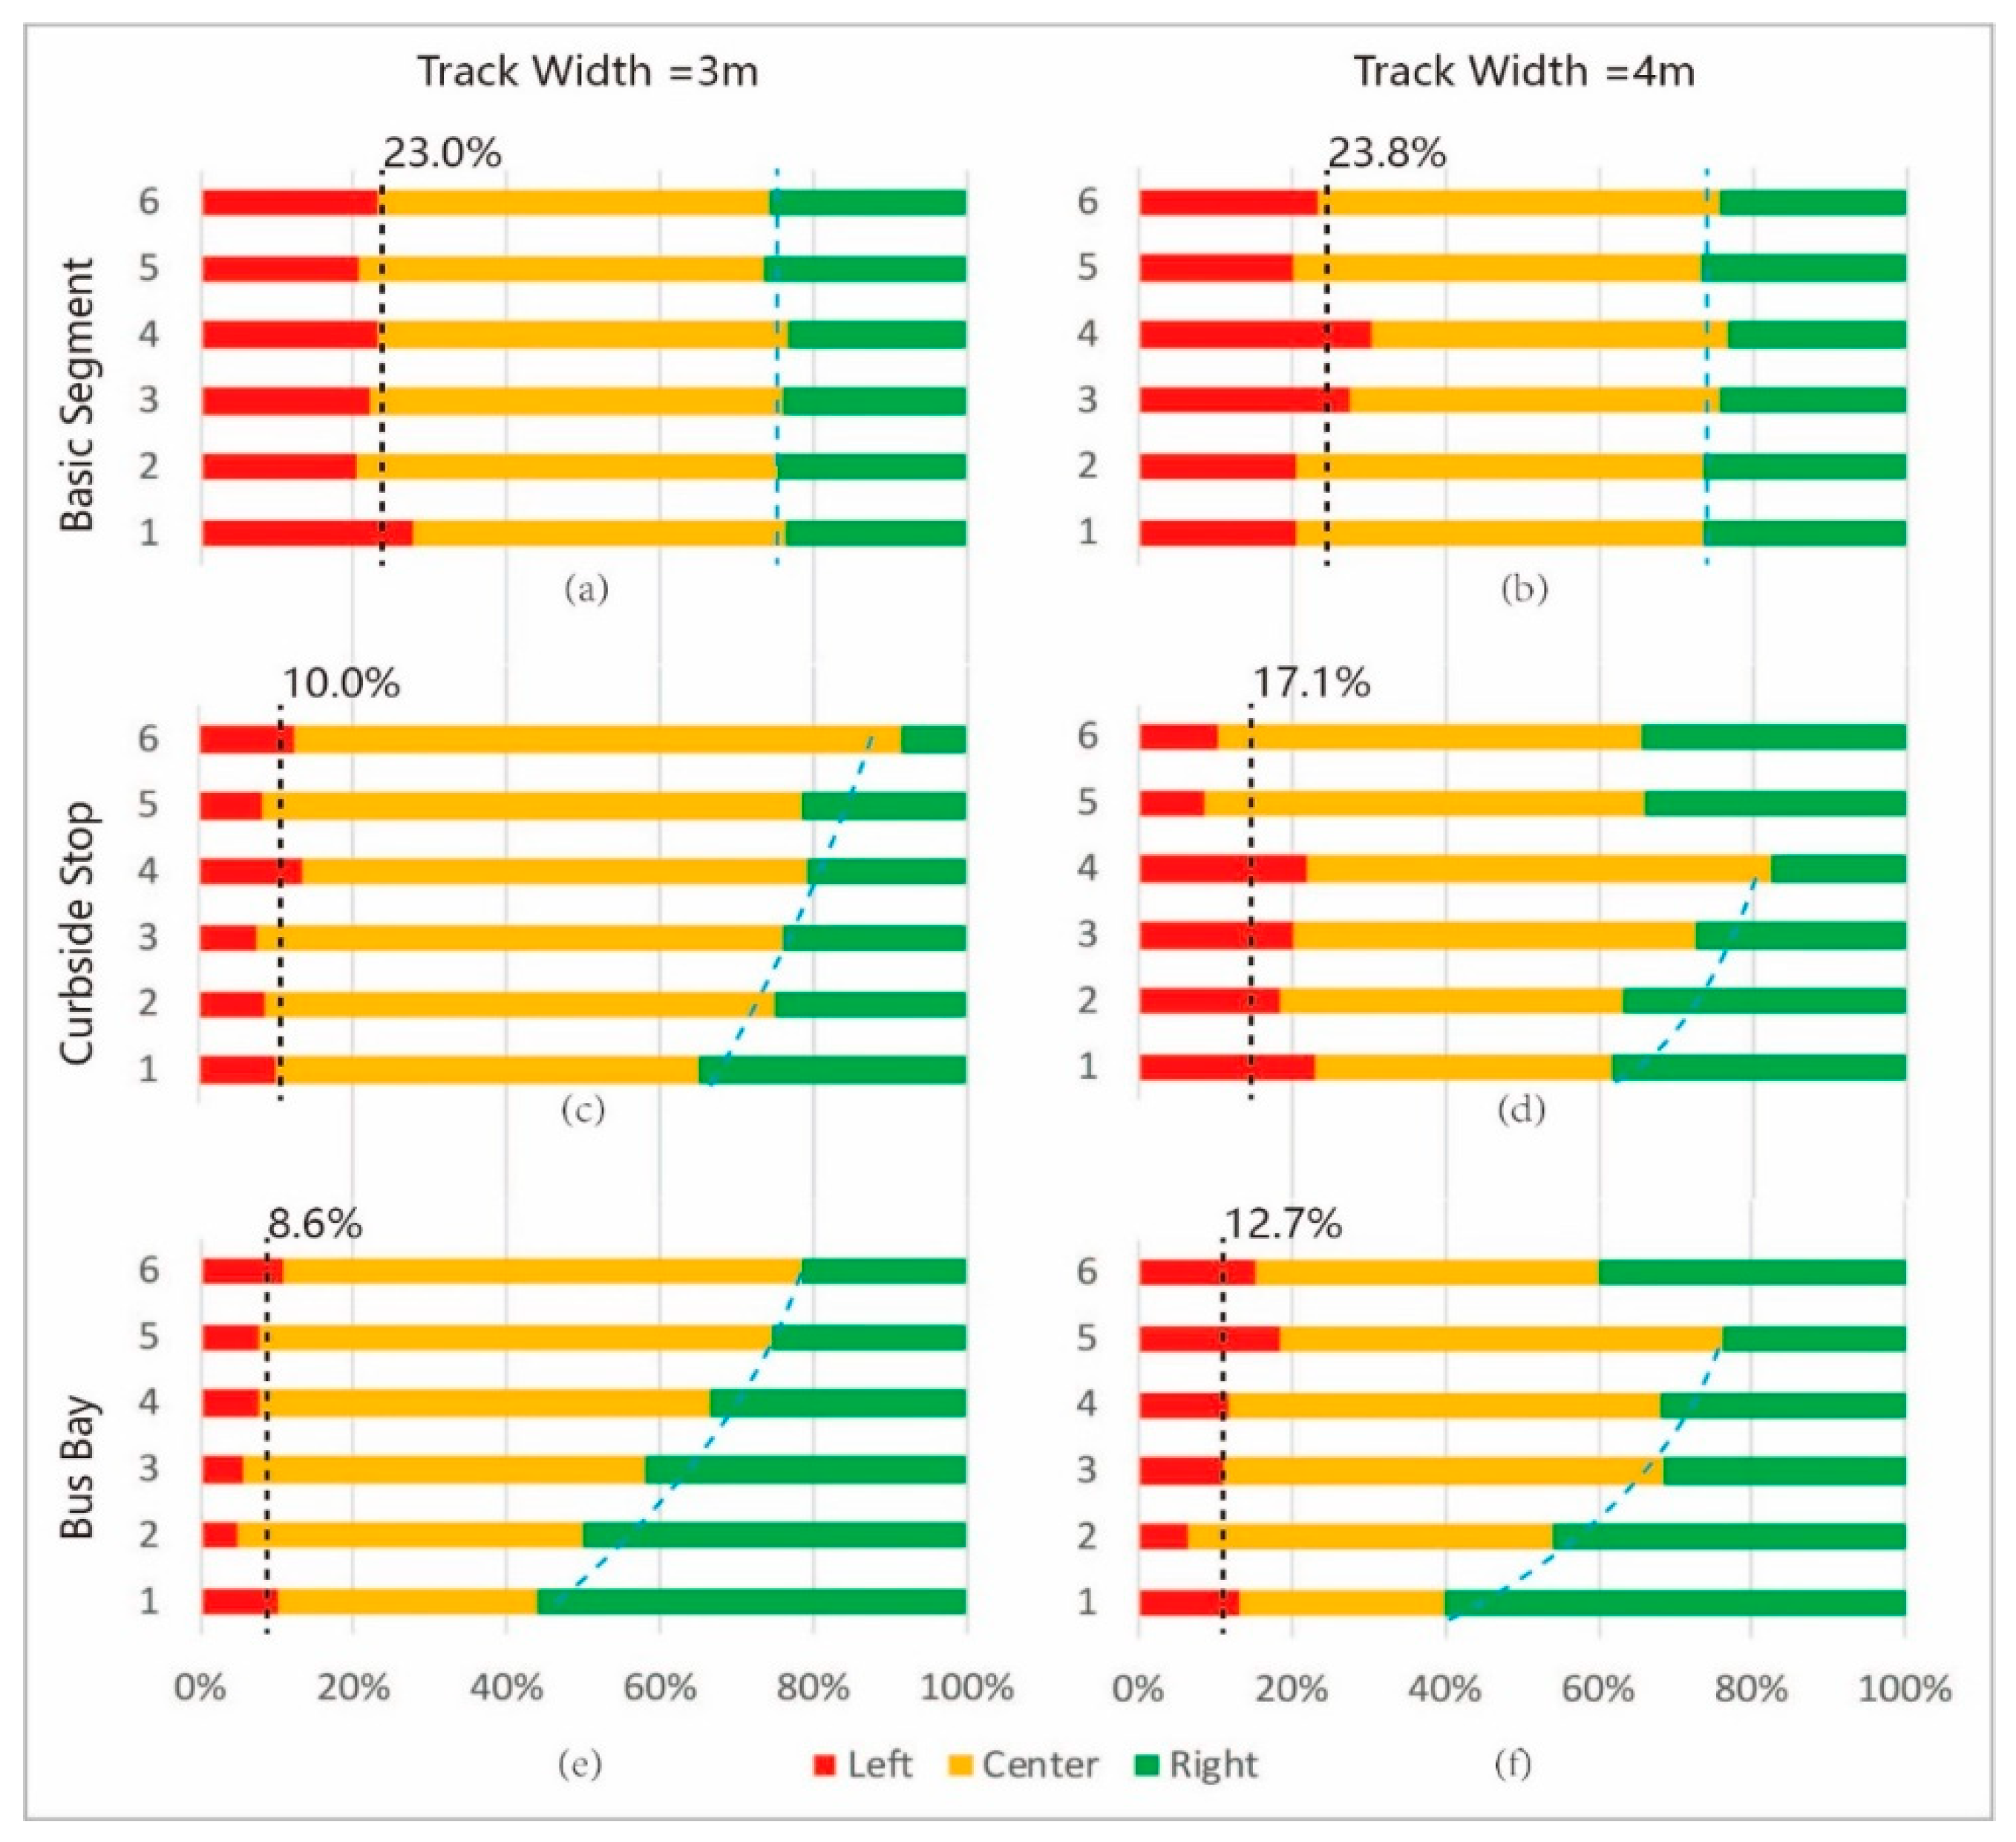
- From Figure 6a,b, on basic segments of cycle tracks, the occupancy rates of left, center, and right part are about 23%, 52%, and 25%. Although there are little fluctuations in the process of moving forward, these rates keep basically stable.
- (2)
- Figure 6c–f show that the occupancies of the left side of cycle tracks decrease to less than 20%, which is also the most significant difference between the two types of bus stops and basic segments. This reveals that the decrease of the capacity of cycle track is closely related to the variation of the bicycle flow on the left side of cycle tracks.
- (3)
- In order to avoid the potential impact of platform, cyclists ride more to the right side of cycle tracks, especially at the first marking line (highest in occupancy rate).
- (4)
- Examining the variations in occupancy rates of the center and right of tracks (see blue dashed curves in Figure 6c–f), bicycles gradually ride back to the center at the downstream marking lines with an occupancy similar to basic segments’ finally.
- (5)
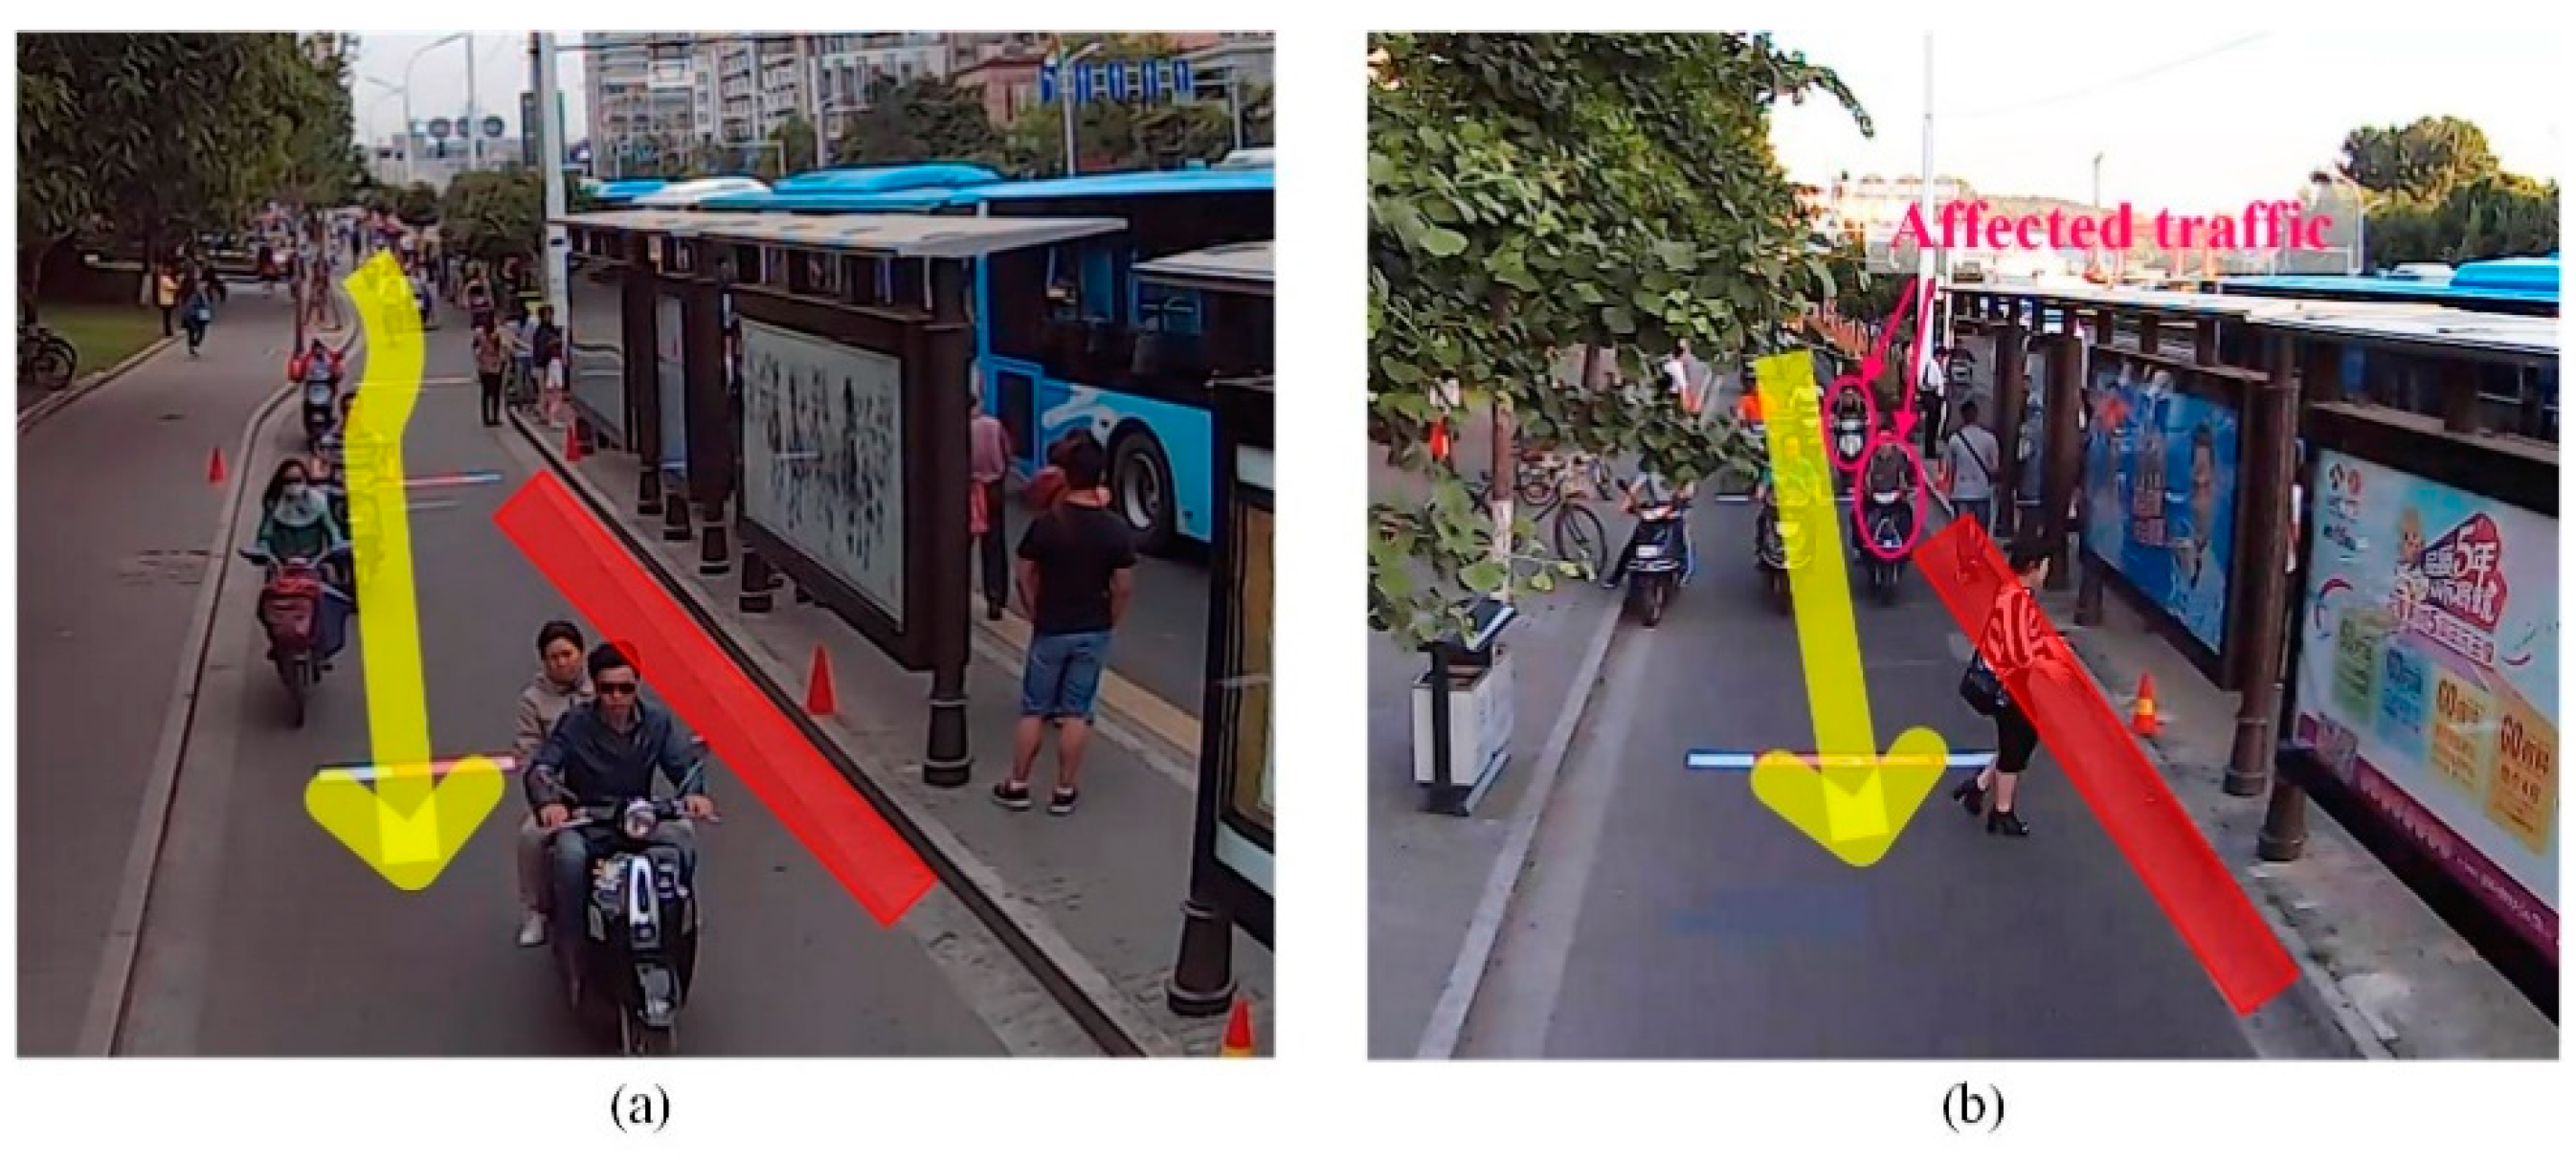
- By comparing the occupancies of the left side of tracks in Figure 6c,d with those in Figure 6e,f, curbside stops have higher level in this data (10% vs 8.6% for 3m of track, 17.1% vs 12.7% for 4 m of track). Obviously, the bicycle traffic on the left side of tracks are most affected by the platform. More bicycles travel on the left, which means that a larger proportion of bicycles passing by are impacted (indicated clearly by operating case comparison in Figure 7), so the capacity of cycle track per meter decreases more at curbside stops.
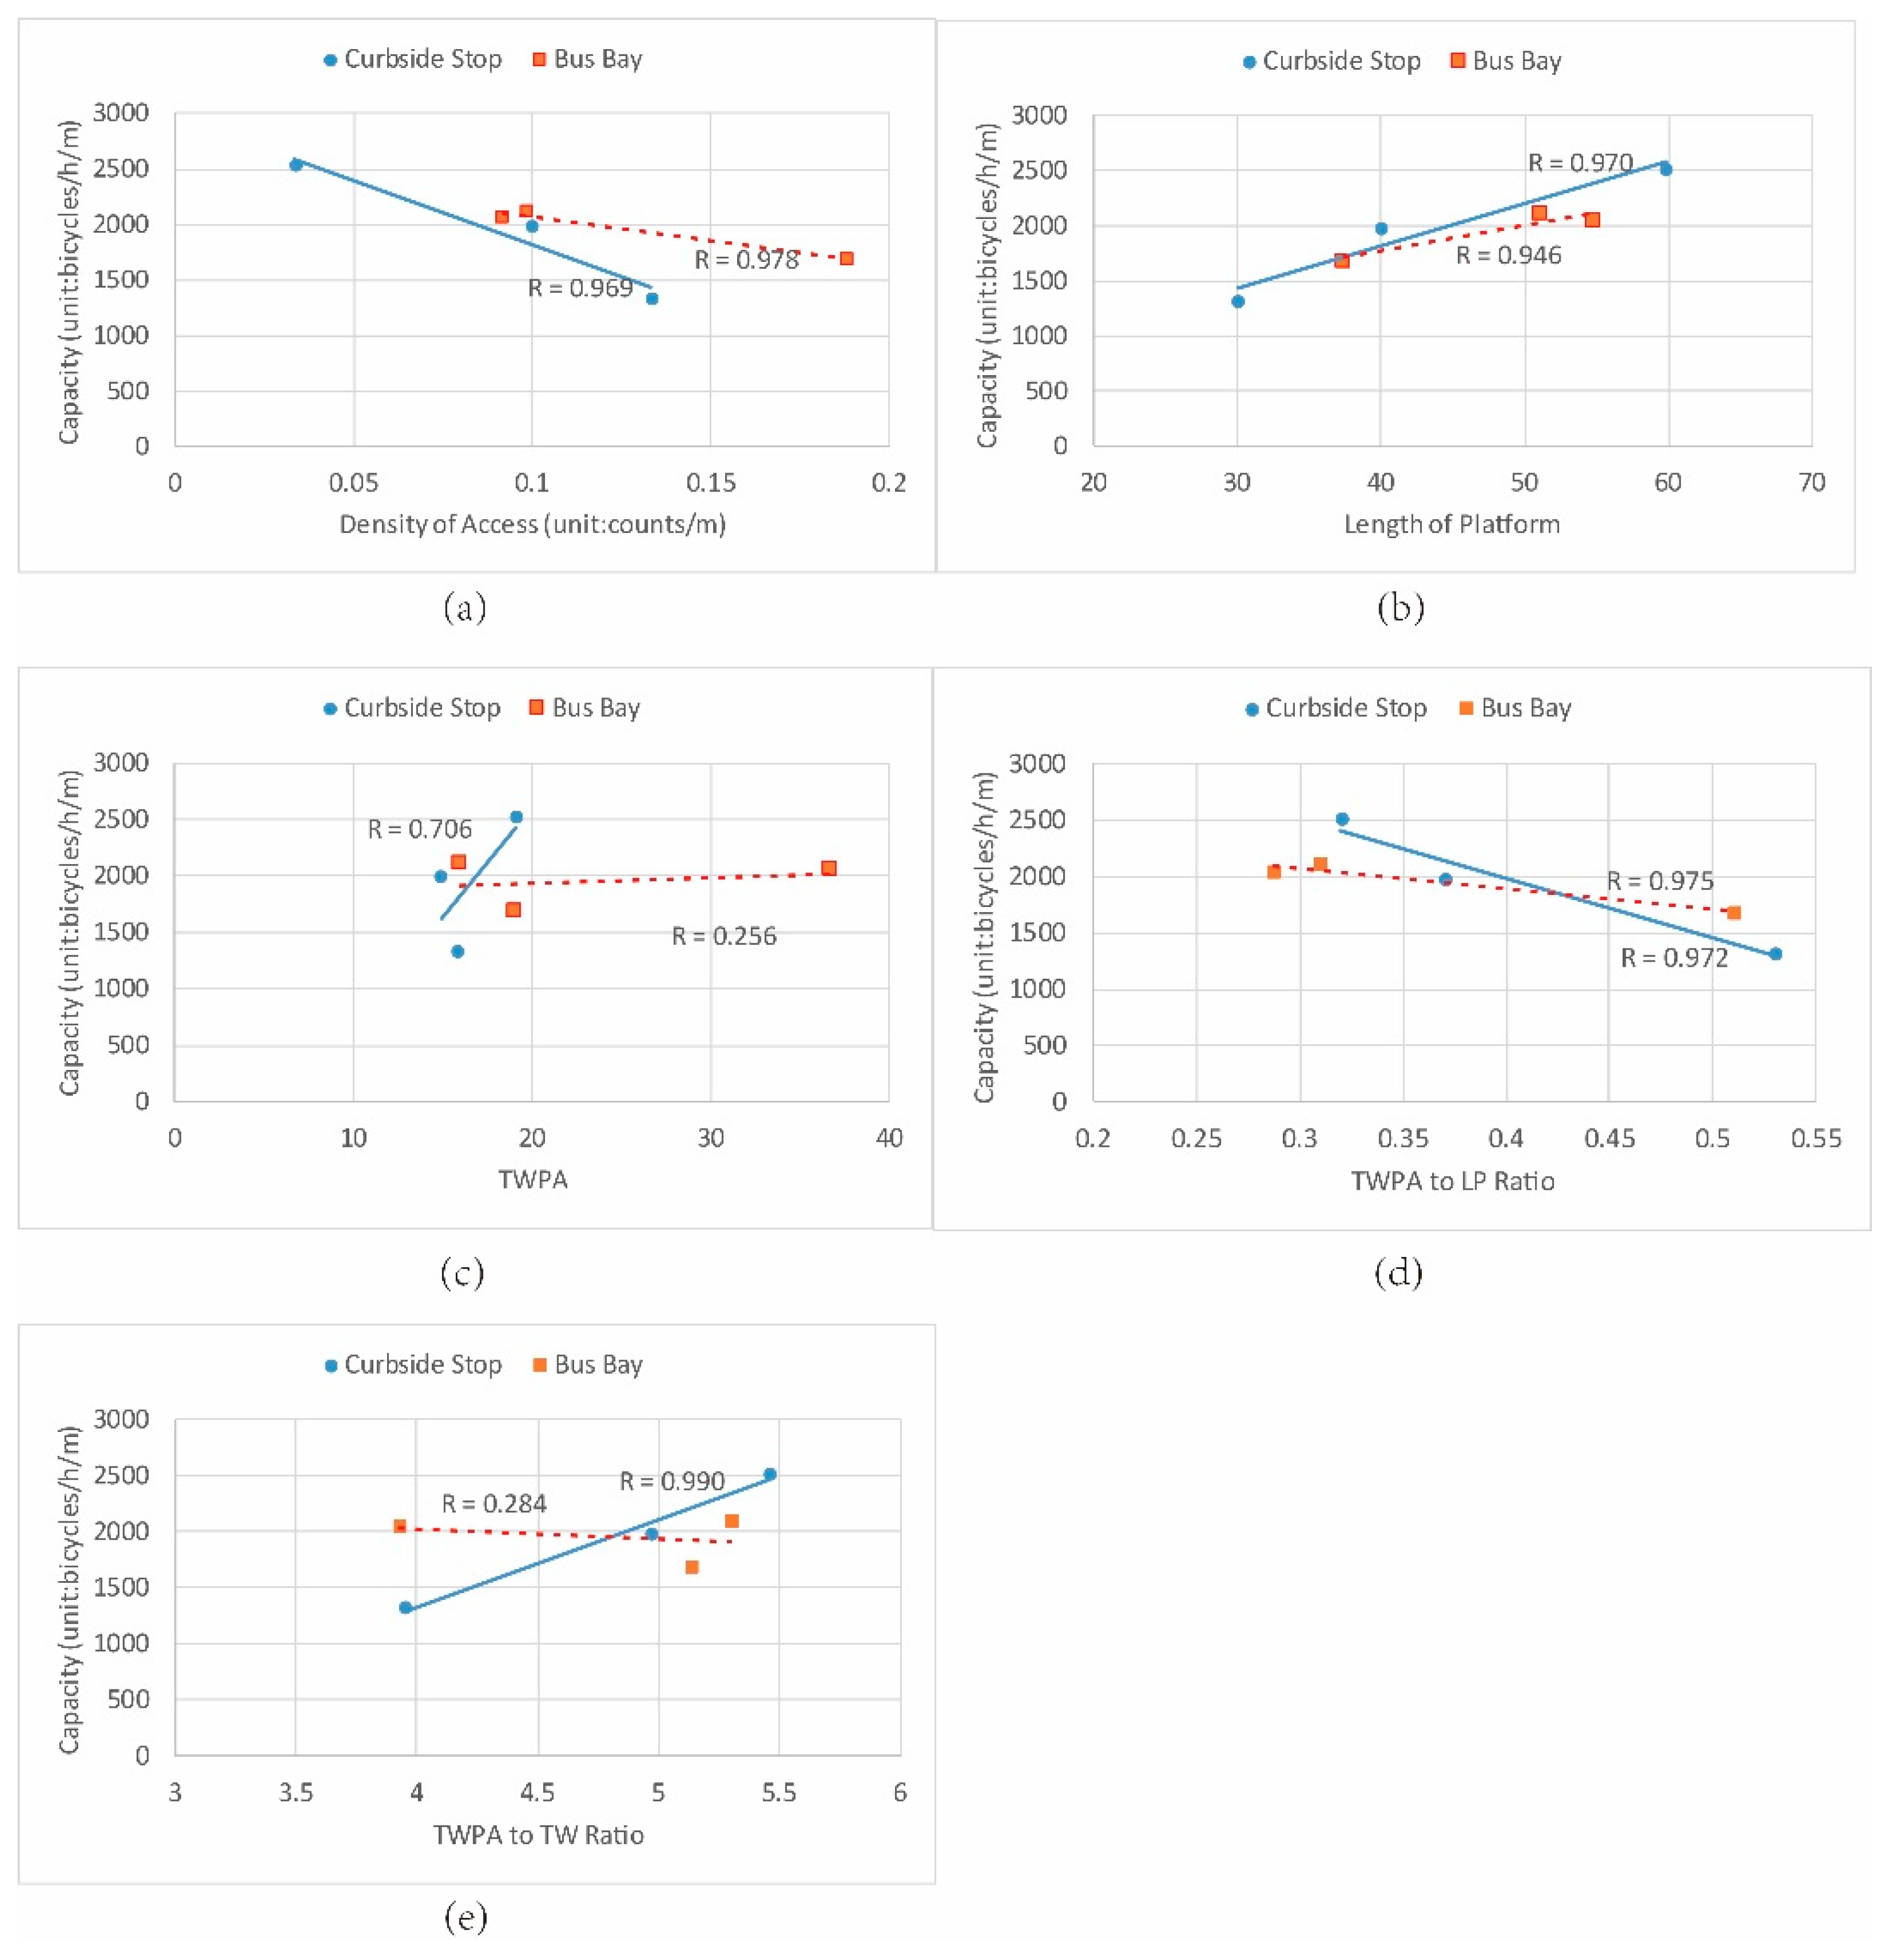
4.2. Number, Location, and Density of Bus Platform Accesses
4.3. Platform Length and TWPA
4.4. TWPA to PL Ratio and TWPA to TW Ratio
5. Suggestions for Bus Stop Configuration
- (1)
- How to select the type of the stop. According to our results, bus bays effectively slow bicycle flow, while they impose less impact on track capacity. Thus, bus bays better meets the specifying requirements of lower bike speed and larger capacity, which are also supported and recommended by reference [18].
- (2)
- How to determine the length of the stop. The analysis results shows that a longer platform impact less on both bicycle speed and capacity. So, we recommend setting a bigger stop length to suit the number of bus lines and berths needed.
- (3)
- How to set the number and positions of the stop accesses. Bicycle speed and track capacity are negatively impacted by dense platform accesses and fewer accesses are suggested.
- (4)
- How to specify the width of each access. Due to the different influence on the two stop types, wider accesses are more suitable for curbside stops, while the opposite recommendation is proposed for bus bays.
6. Conclusions
- Without passengers crossing, bus bays have significant impact on bicycle speed, while it is not for curbside stops;
- except platform length, there are strong negative relationships between bicycle speed and density of platform access, TWPA, TWPA to PL ratio, TWPA to TW ratio;
- curbside stop and bus bay reduce track capacities by 32% and 13.5% on average, respectively;
- in contrast to bus bays, curbside stops have more significant impact on capacity of track, which also presents in the influence of the setting parameters of stops; and
- bus bays are recommended in selecting the type of a stop. In respect to stop specifications, a longer platform and few accesses are suggested, while wider and narrower accesses suit curbside stops and bus bays well, respectively.
Author Contributions
Funding
Acknowledgments
Conflicts of Interest
References
- Moreno Gonzalez, E.; Romana, M.G.; Martinez Alvaro, O. Bus Dwell-Time Model of Main Urban Route Stops Case Study in Madrid, Spain. Transp. Res. Rec. 2012, 126–134. [Google Scholar] [CrossRef]
- Bordagaray, M.; dell’Olio, L.; Ibeas, A.; Cecin, P. Modelling user perception of bus transit quality considering user and service heterogeneity. Transp. A Transp. Sci. 2014, 10, 705–721. [Google Scholar] [CrossRef]
- Buehler, R.; Pucher, J. Walking and cycling in Western Europe and the United States: Trends, policies, and lessons. TR News 2012, 280, 34–42. [Google Scholar]
- Buehler, R.; Pucher, J. Cycling to work in 90 large American cities: New evidence on the role of bike paths and lanes. Transportation 2012, 39, 409–432. [Google Scholar] [CrossRef]
- Min, H. Public-Private partnerships for improving the regional mass transit system: A case study of the Toledo Area Regional Transit Authority. Int. J. Logist. Syst. Manag. 2014, 17, 160–179. [Google Scholar] [CrossRef]
- Zhang, H.; Shaheen, S.A.; Chen, X. Bicycle evolution in China: From the 1900s to the present. Int. J. Sustain. Transp. 2014, 8, 317–335. [Google Scholar] [CrossRef]
- Koshy, R.Z.; Arasan, V.T. Influence of bus stops on flow characteristics of mixed traffic. J. Transp. Eng. 2005, 131, 640–643. [Google Scholar] [CrossRef]
- Zhao, X.-M.; Jia, B.; Gao, Z.-Y.; Jiang, R. Traffic interactions between motorized vehicles and nonmotorized vehicles near a bus stop. J. Transp. Eng. 2009, 135, 894–906. [Google Scholar] [CrossRef]
- Sun, D.; Elefteriadou, L. Research and implementation of lane-changing model based on driver behavior. Transp. Res. Rec. 2010, 2161, 1–10. [Google Scholar] [CrossRef]
- Zhao, D.; Wang, W.; Zheng, Y.; Ji, Y.; Wang, W.; Hu, X. Evaluation of interactions between buses and bicycles at stops. Transp. Res. Rec. 2014, 2468, 11–18. [Google Scholar] [CrossRef]
- Zhang, F.; Li, Z.; Zhao, D.G.; Wang, Y.; Wang, W.; Li, J. Influences of Various Types of Bus Stops on Traffic Operations of Bicycles, Vehicles, and Buses. In Proceedings of the 94th Transportation Research Board (TRB) Annual Meeting, Washington, DC, USA, 11–15 January 2015. [Google Scholar]
- Wang, C.; Ye, Z.; Xu, Y.; Feng, J. Effect of Dwelling Buses on the Traffic Operations of Nonmotor Vehicles at Bus Stops. J. Transp. Eng. Part A Syst. 2018, 144. [Google Scholar] [CrossRef]
- Luo, Q.; Zheng, T.; Wu, W.; Jia, H.; Li, J. Modeling the effect of bus stops on capacity of curb lane. Int. J. Mod. Phys. C 2018, 29. [Google Scholar] [CrossRef]
- Pan, Y.; Chen, S.; Li, T.; Niu, S.; Tang, K. Exploring spatial variation of the bus stop influence zone with multi-source data: A case study in Zhenjiang, China. J. Transp. Geogr. 2019, 76, 166–177. [Google Scholar] [CrossRef]
- Liu, Z.; Li, K.; Ni, Y. Optimization of bus stops layout under the conditions of coordinated control. Transp. Res. Procedia 2017, 25, 1585–1596. [Google Scholar] [CrossRef]
- Tirachini, A. The economics and engineering of bus stops: Spacing, design and congestion. Transp. Res. Part A Policy Pract. 2014, 59, 37–57. [Google Scholar] [CrossRef]
- Jiang, X.; Wang, H.; Guo, X. Analyzing Service Quality Evaluation Indexes of Rural Last Mile Delivery Using FCE and ISM Approach. Information 2020, 11, 327. [Google Scholar] [CrossRef]
- Transportation Research Board National Research Council. Guidelines for the Location and Design of Bus. Stops; Transportation Research Board: Washington, DC, USA, 1996. [Google Scholar]
- Trimet. Bus Stops Guidelines; Trimet: Portland, OR, USA, 2010.
- SEPTA. Bus Stop Design Guidelines; SEPTA: Philadelphia, PA, USA, 2012. [Google Scholar]
- Transfort. Bus Stop Design Standards & Guidelines; Transfort: Fort Collins, CO, USA, 2015. [Google Scholar]
- Transport For London. Accessible Bus Stop Design Guidance; Transport For London: London, UK, 2017.


| Number | Stop | Stop Type | TW (m) | PL (m) | * Na | Access Position | DA | TWPA | TWPA to PL Ratio | TWPA to TW Ratio |
|---|---|---|---|---|---|---|---|---|---|---|
| 1 | Gangzicun | curbside | 3 | 40 | 4 | two ends and center | 0.10 | 14.9 | 0.37 | 4.97 |
| 2 | Zhongyangmennan | curbside | 3.5 | 59.8 | 7 | two ends | 0.03 | 19.1 | 0.32 | 5.46 |
| 3 | Jimingsi | curbside | 4 | 30 | 4 | two ends and center | 0.13 | 15.8 | 0.53 | 3.95 |
| 4 | Suojincun | bus bay | 3 | 51 | 5 | two ends and center | 0.10 | 15.9 | 0.31 | 5.30 |
| 5 | Gulou | bus bay | 3.5 | 37.3 | 2 | irregular | 0.19 | 19 | 0.51 | 5.14 |
| 6 | Zhongyangmenbei | bus bay | 4 | 54.7 | 5 | two ends and center | 0.09 | 15.7 | 0.29 | 3.93 |
| Number | Bicycle Type | Sample Size | Minimum (m/s) | Maximum (m/s) | Mean (m/s) | Median (m/s) | SD (m/s) | Capacity (bics/m/h) |
|---|---|---|---|---|---|---|---|---|
| 1 | EB | 598 | 3.59 | 10.95 | 6.33 | 6.28 | 1.13 | 1984 |
| CB | 81 | 2.71 | 7.46 | 4.7 | 4.75 | 1.10 | ||
| overall | 679 | 2.71 | 10.95 | 6.14 | 6.15 | 1.24 | ||
| 2 | EB | 591 | 1.98 | 8.49 | 5.58 | 4.50 | 1.00 | 2523 |
| CB | 158 | 1.84 | 5.46 | 4.19 | 3.35 | 0.63 | ||
| overall | 749 | 1.84 | 8.49 | 5.29 | 4.27 | 1.05 | ||
| 3 | EB | 317 | 2.82 | 10.53 | 6.12 | 6.14 | 1.52 | 1324 |
| CB | 67 | 2.55 | 9.67 | 4.39 | 4.17 | 1.38 | ||
| overall | 384 | 2.55 | 10.53 | 5.82 | 5.78 | 1.65 | ||
| 4 | EB | 667 | 2.65 | 9.42 | 5.33 | 5.32 | 1.02 | 2114 |
| CB | 73 | 2.81 | 6.51 | 4.17 | 4.22 | 0.87 | ||
| overall | 740 | 2.65 | 9.42 | 5.22 | 5.24 | 1.07 | ||
| 5 | EB | 1007 | 3.21 | 11.88 | 4.58 | 5.18 | 0.99 | 1688 |
| CB | 194 | 2.41 | 7.34 | 3.43 | 4.81 | 0.89 | ||
| overall | 1201 | 2.41 | 11.88 | 4.39 | 5.12 | 0.99 | ||
| 6 | EB | 858 | 2.80 | 9.65 | 5.24 | 5.90 | 1.07 | 2055 |
| CB | 154 | 2.36 | 7.91 | 4.81 | 4.38 | 0.95 | ||
| overall | 1012 | 2.36 | 9.65 | 5.17 | 5.68 | 1.19 |
| Strength of Association | Coefficient, r | |
|---|---|---|
| Positive | Negative | |
| Small | 0.1 to 0.3 | −0.1 to −0.3 |
| Medium | 0.3 to 0.5 | −0.3 to −0.5 |
| Large | 0.5 to 1.0 | −0.5 to −1.0 |
| Track Width | Basic Segment vs. Curbside Stop | Basic Segment vs. Bus Bay | Curbside Stop vs. Bus Bay |
|---|---|---|---|
| 3 m | 0.742 (No) | 0.000 (Yes) | 0.001 (Yes) |
| 4 m | 0.913 (No) | 0.001 (Yes) | 0.003 (Yes) |
| Problem | Research Result | Specifying Requirement | Suggestions |
|---|---|---|---|
| how to select the type of the stop | In contrast to curbside stop, bus bay can slow the bicycles significantly, while imposing a little impact on track capacity. | Lower bicycle speed, larger capacity of track at stops, reducing the impact of bus dwelling on cars | When the land of road is enough, bus bays are highly recommended. |
| how to determine the length of the stop | A longer stop platform can reduce the influence on bicycle speed and capacity of track. | reducing the impact of stops on bicycle speed; larger capacity of track at stops | According to the number of bus lines and berths needed, a longer stop will provide a better riding circumstances for cyclists. |
| how to set the number and positions of the stop accesses | A higher density of platform access has a strong negative impact on bicycle speed and track capacity | reduce bicycle-pedestrian conflicts; larger capacity of track at stops | Accesses of bus platform should be set as few as possible and the positions need be regular. |
| how to specify the width of each access |
| Lower bicycle speed, larger capacity of track at stops | Curbside stops need wider accesses, while keeping TWPA to PL ratio within a suitable limit; for bus bays, smaller access widths are recommended. |
© 2020 by the authors. Licensee MDPI, Basel, Switzerland. This article is an open access article distributed under the terms and conditions of the Creative Commons Attribution (CC BY) license (http://creativecommons.org/licenses/by/4.0/).
Share and Cite
Yan, X.; Chen, J.; Ye, X.; Wang, T.; Yang, Z.; Bai, H. Studying the Influences of Bus Stop Type and Specifications on Bicycle Flow and Capacity for Better Bicycle Efficiency. Information 2020, 11, 370. https://0-doi-org.brum.beds.ac.uk/10.3390/info11080370
Yan X, Chen J, Ye X, Wang T, Yang Z, Bai H. Studying the Influences of Bus Stop Type and Specifications on Bicycle Flow and Capacity for Better Bicycle Efficiency. Information. 2020; 11(8):370. https://0-doi-org.brum.beds.ac.uk/10.3390/info11080370
Chicago/Turabian StyleYan, Xingchen, Jun Chen, Xiaofei Ye, Tao Wang, Zhen Yang, and Hua Bai. 2020. "Studying the Influences of Bus Stop Type and Specifications on Bicycle Flow and Capacity for Better Bicycle Efficiency" Information 11, no. 8: 370. https://0-doi-org.brum.beds.ac.uk/10.3390/info11080370