Evaluating Machine Learning Methods for Predicting Diabetes among Female Patients in Bangladesh

 ,
,  ,
,  , , and
Abstract
:1. Introduction
- Type 1 diabetes [7] occurs mostly to children and adolescents. In this case, the body produces very little or no insulin at all. As a result, daily insulin injections are needed to keep glucose levels under control. Frequent urination, sudden weight loss, abnormal thirst, constant hunger, blurred vision, and tiredness are common symptoms of this kind of diabetes. This can be treated with the help of insulin therapy.
- Type 2 diabetes [8] is more prevalent in adults (90% cases). The body does not fully respond to insulin resulting in higher glucose levels. Obesity, unhealthy diet, high blood pressure, and physical inactivity are considered to be major risk factors that lead to type 2 diabetes. Insulin injections are required when oral medication is not sufficient enough to control blood sugar levels.
- Gestational Diabetes Mellitus (GDM), or simply gestational diabetes consists of high blood pressure during pregnancy and can cause health complications to both mother and children. It usually disappears during the pregnancy stage but the affected ones along with their children have a risk of developing Type 2 diabetes in their later life. According to a survey in 2017 [9], approximately 204 million women suffers from GDM. About 21.3 million live births had some form of hyperglycemia in pregnancy, among which about 85.1% occurred due to gestational diabetes. GDM typically affects around one out of seven births.
1.1. Diabetes in Bangladesh
1.2. Applicability of Machine Learning in Detecting Diabetes
1.3. Research Goal
2. Related Work
2.1. Research on PIMA Dataset
2.2. Research Based on Image Analysis
2.3. Research Based on PPI Prediction
2.4. Research Based on Dataset from Bangladesh
3. Data
3.1. Data Acquisition and Description
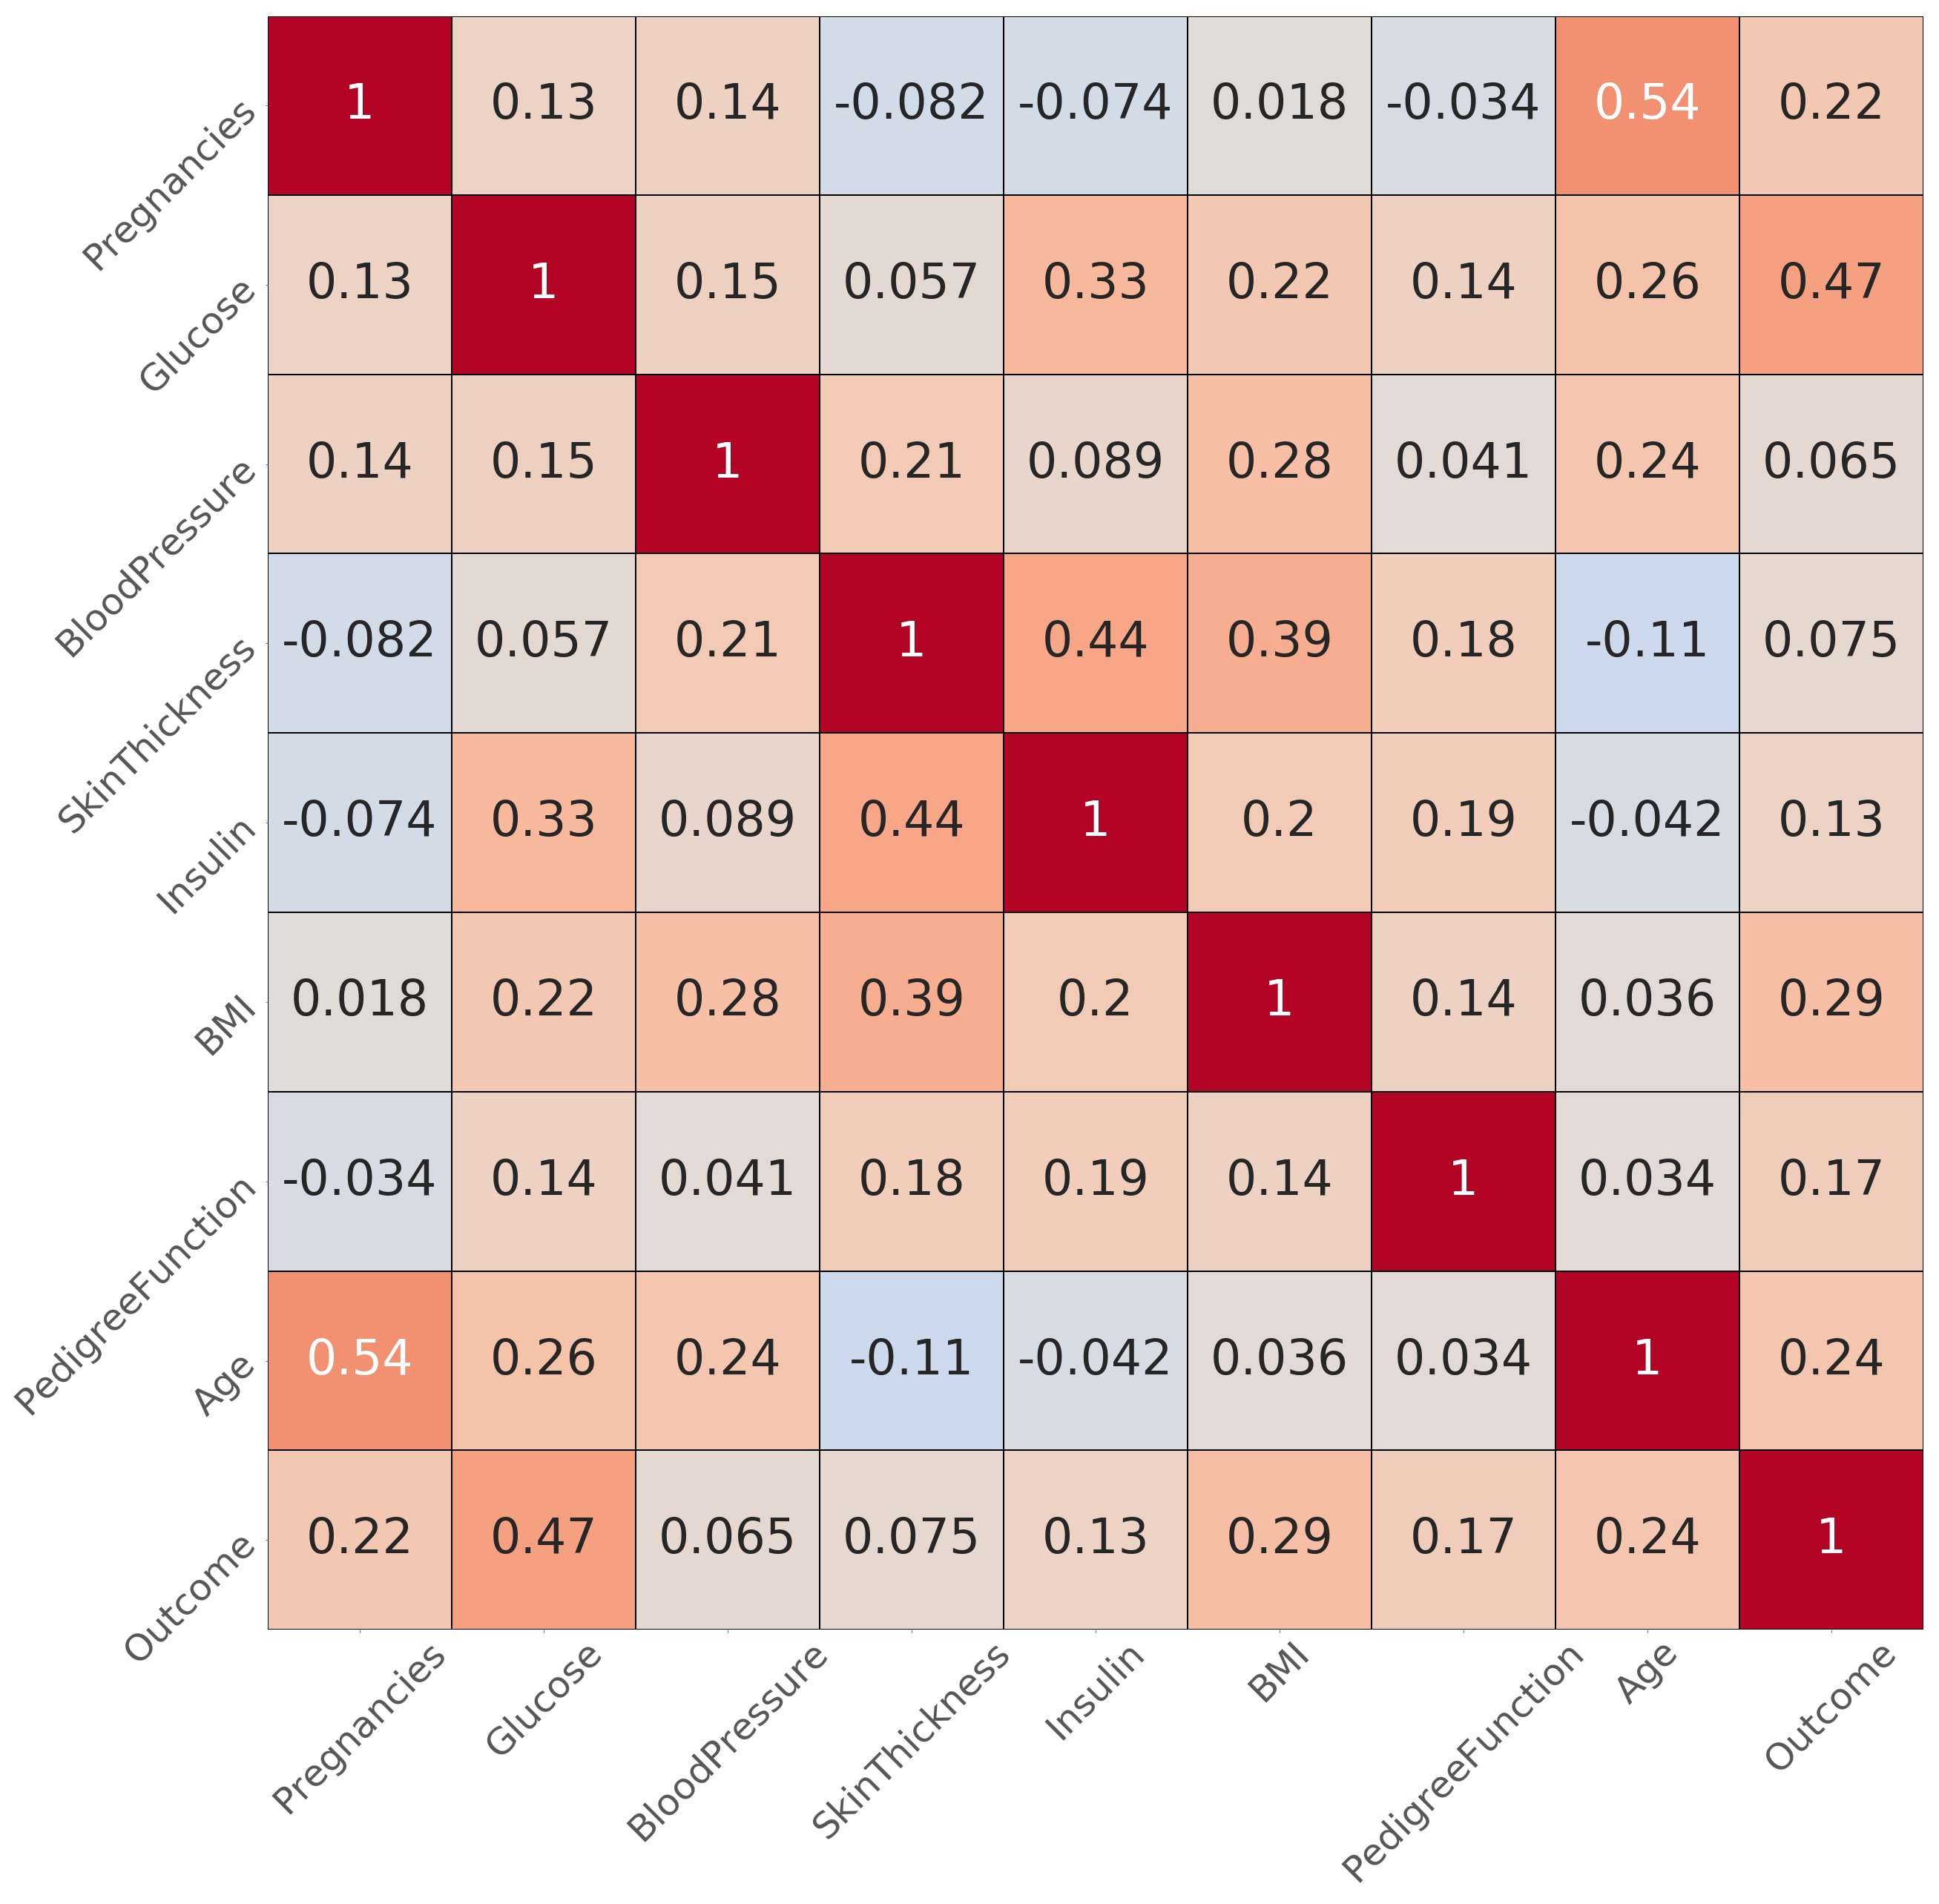
3.2. Data Analysis and Feature Selection
- Number of times the patient got pregnant,
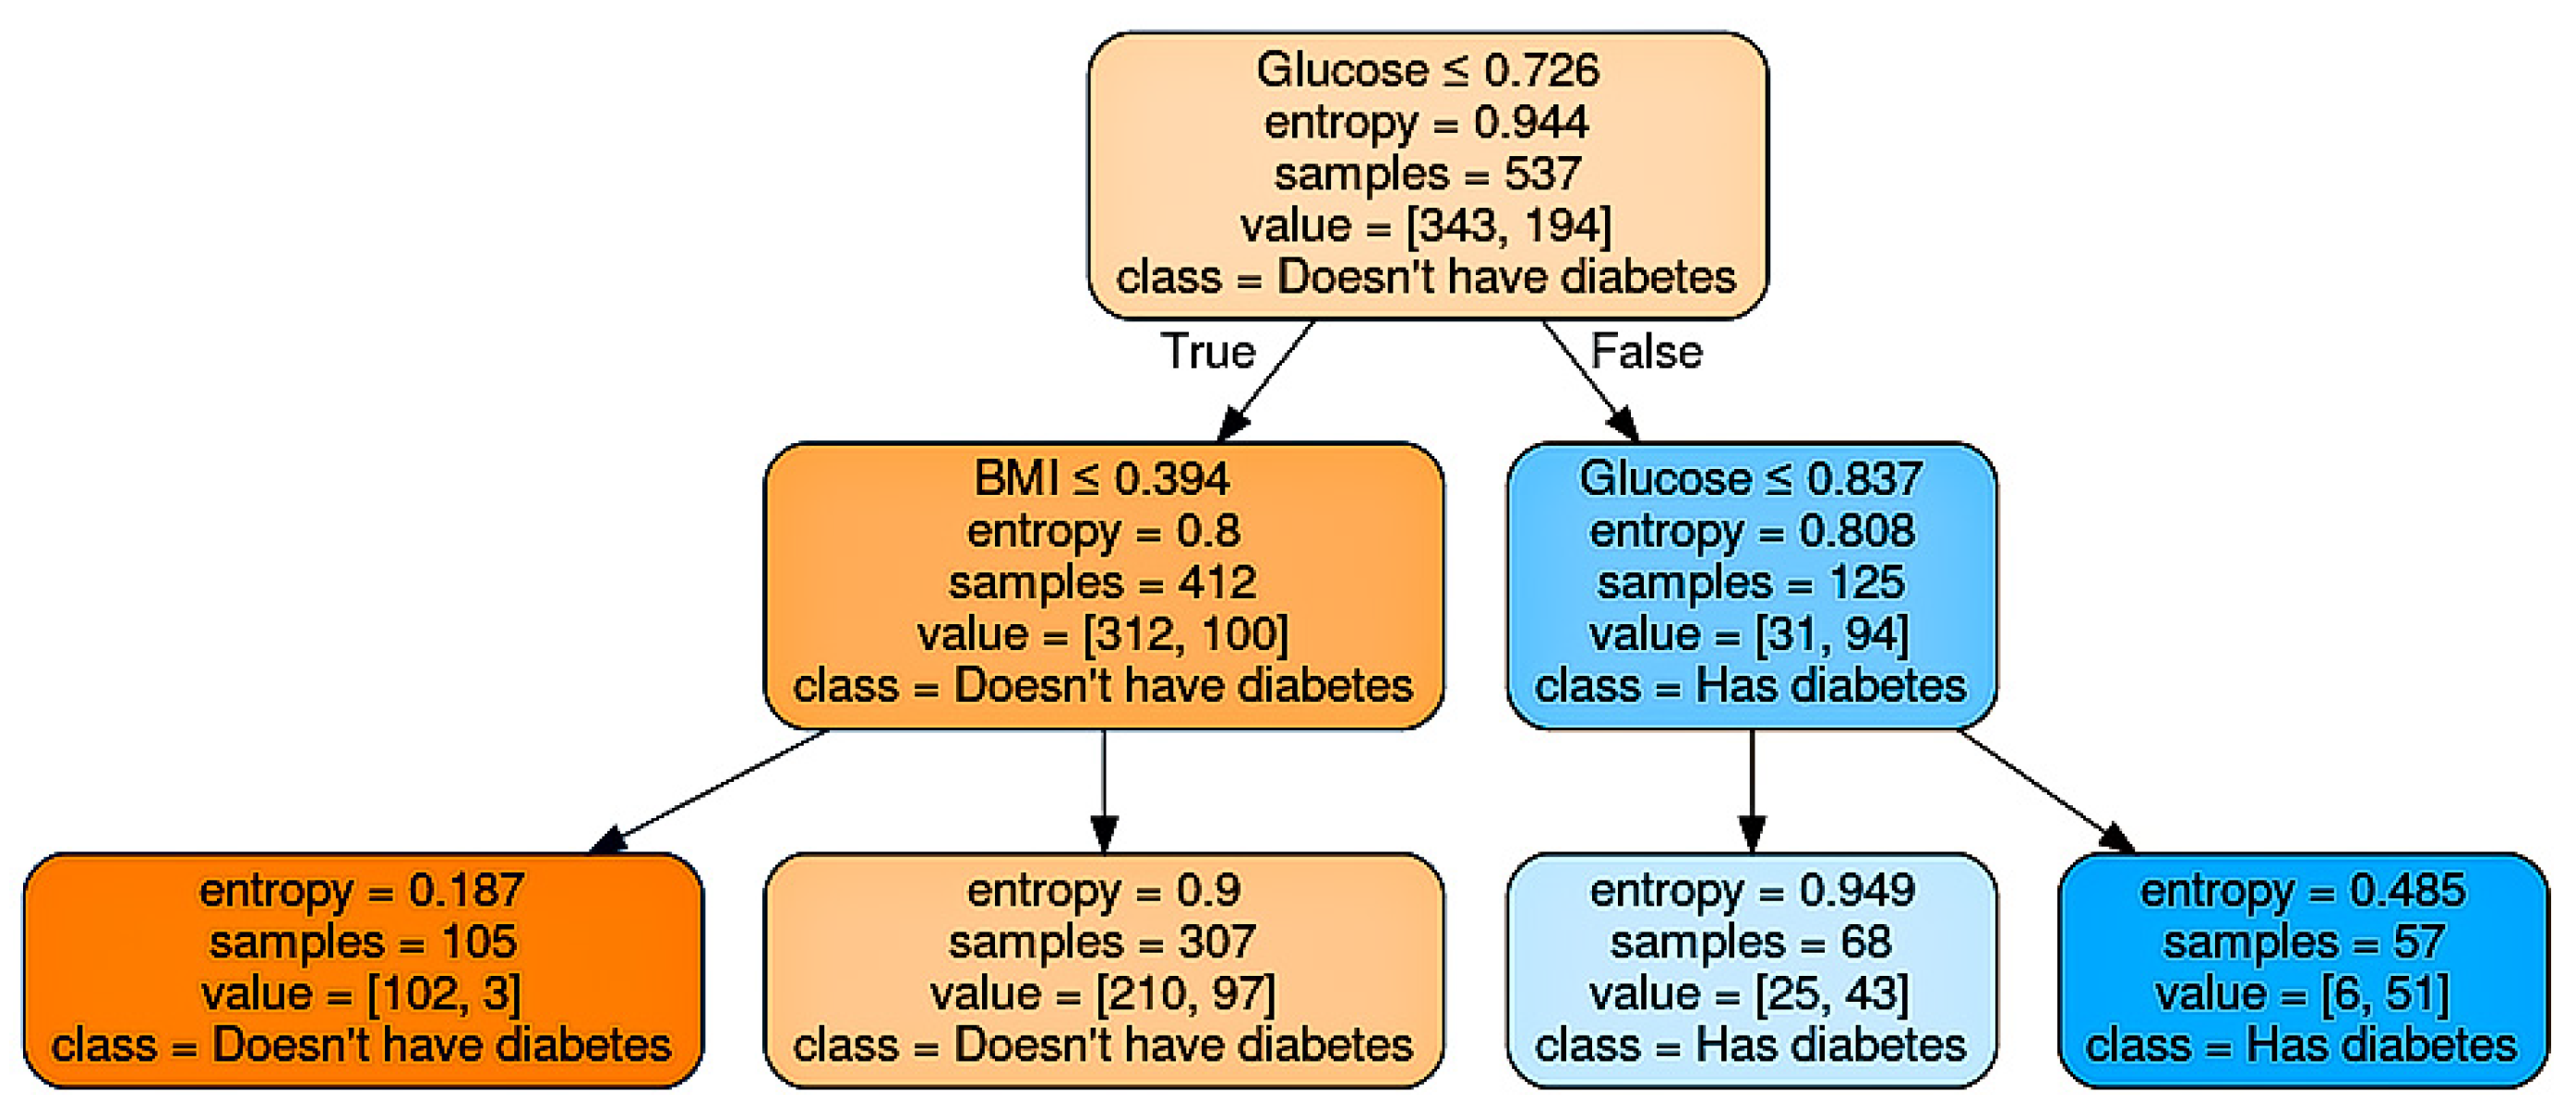
- Blood sugar or glucose,
- Body mass index (BMI) and
- Age of the patient.
4. Methodology
4.1. Data Pre-Processing
4.2. Machine Learning Model Implementation
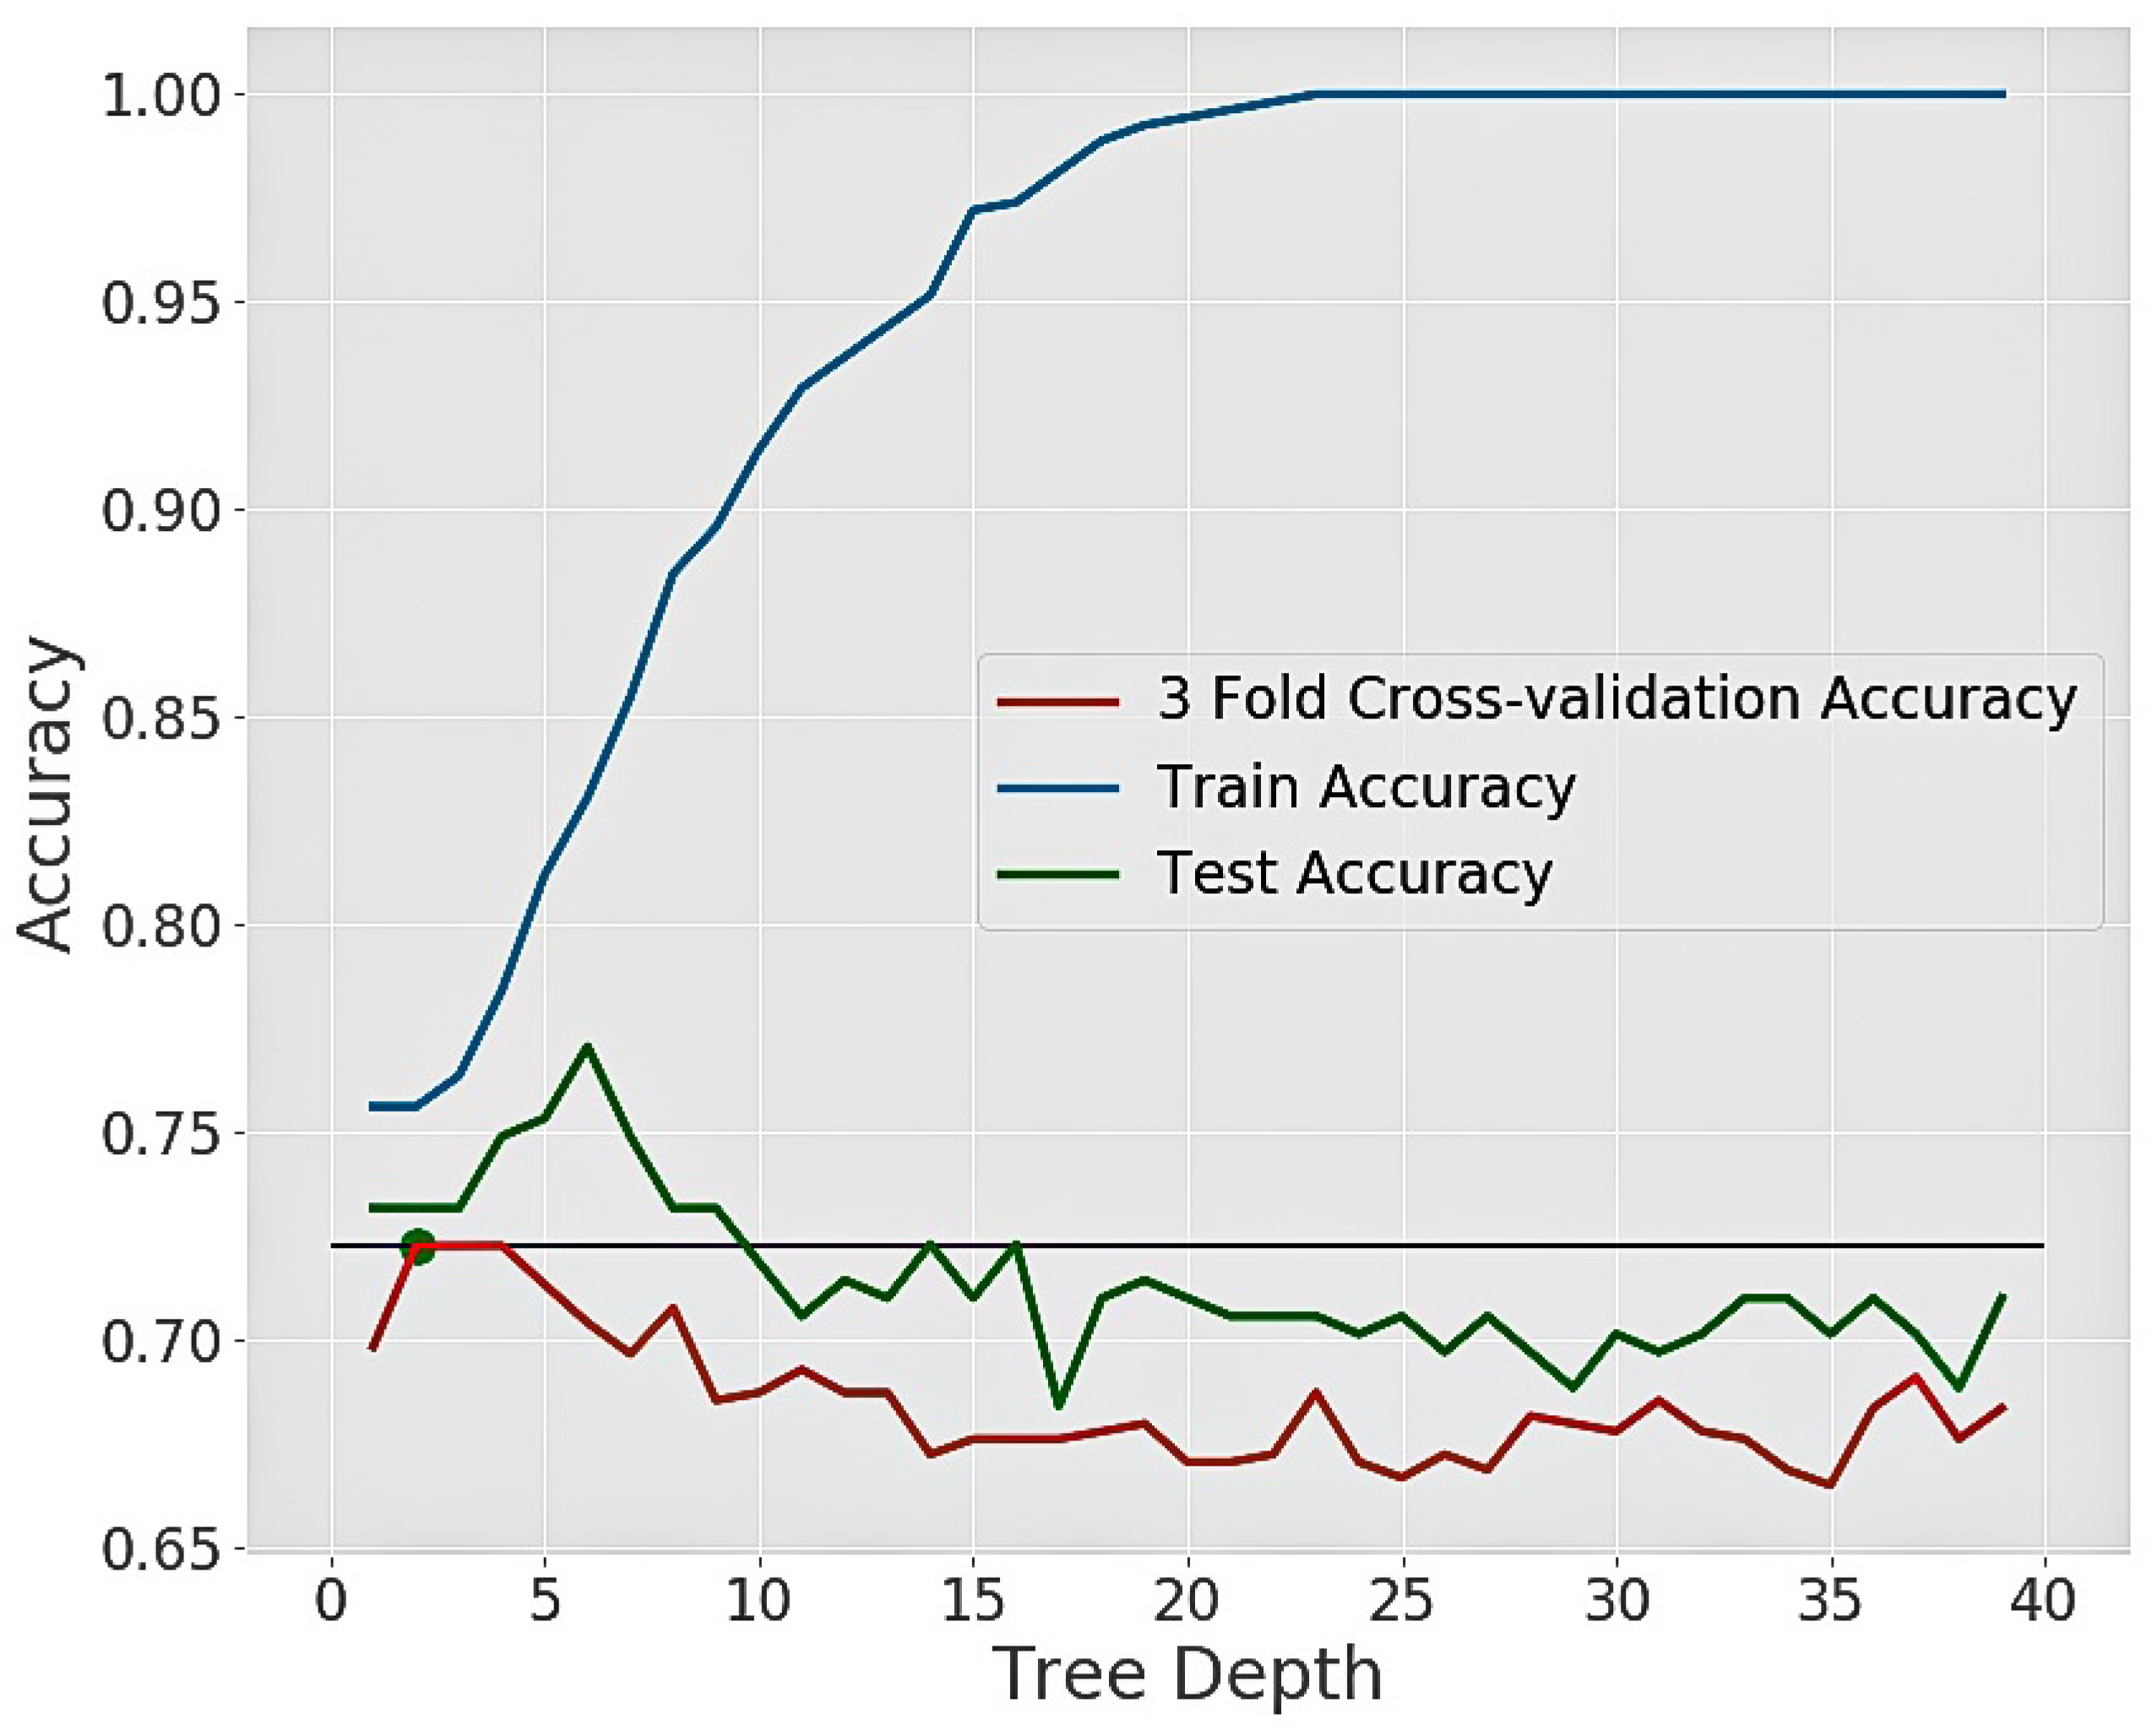
4.3. Algorithms and Their Hyperparameter Tuning
| Algorithm 1: Algorithm for hyperparameter tuning |
 |
4.3.1. Decision Tree
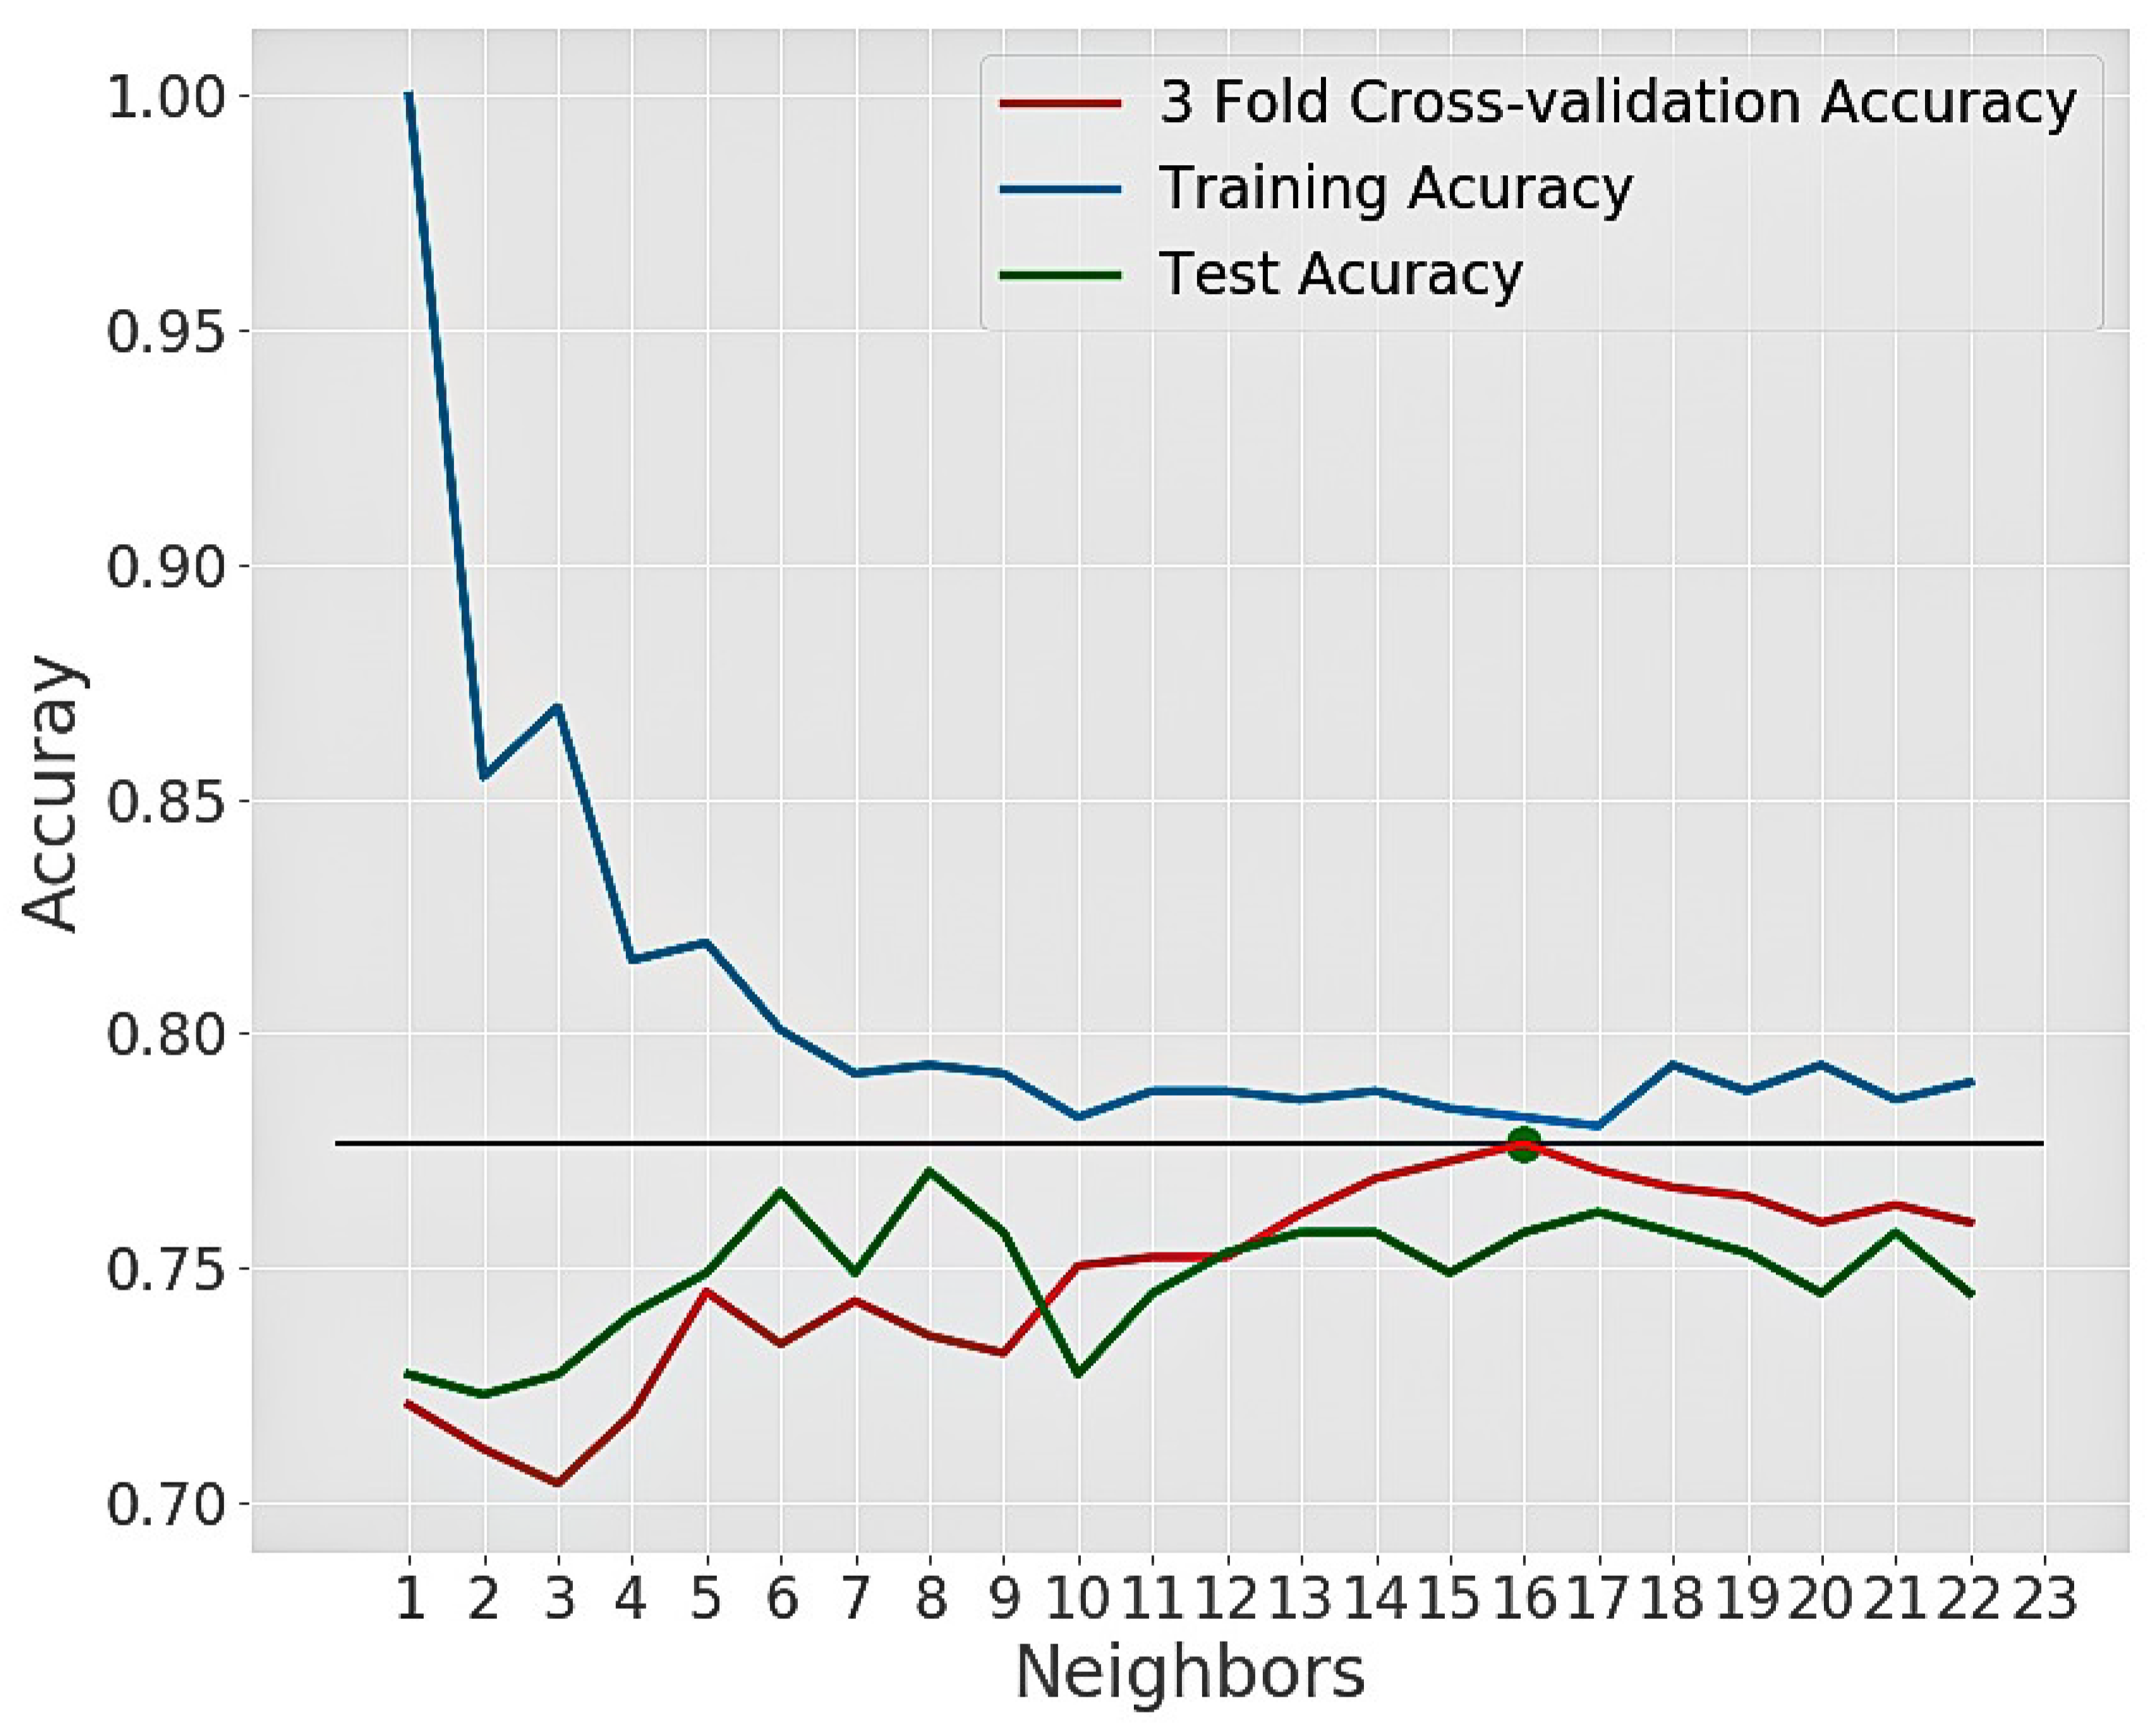
4.3.2. K-Nearest Neighbor
4.3.3. Random Forest
| Algorithm 2: Algorithm for building random forest |
 |
4.3.4. Naïve Bayes
5. Results and Discussions
6. Conclusions
Author Contributions
Funding
Conflicts of Interest
References
- Defronzo, R.; Ferrannini, E.; Zimmet, P.; Alberti, K. International Textbook of Diabetes Mellitus, 4th ed.; Wiley-Blackwell: Hoboken, NJ, USA, 2015. [Google Scholar]
- Callaghan, B.C.; Gallagher, G.; Fridman, V.; Feldman, E.L. Diabetic neuropathy: What does the future hold? Diabetologia 2020, 63, 891–897. [Google Scholar] [CrossRef] [PubMed]
- Wilkinson, C.; Ferris, F.L., III; Klein, R.E.; Lee, P.P.; Agardh, C.D.; Davis, M.; Dills, D.; Kampik, A.; Pararajasegaram, R.; Verdaguer, J.T.; et al. Proposed international clinical diabetic retinopathy and diabetic macular edema disease severity scales. Ophthalmology 2003, 110, 1677–1682. [Google Scholar] [CrossRef]
- Gross, J.L.; De Azevedo, M.J.; Silveiro, S.P.; Canani, L.H.; Caramori, M.L.; Zelmanovitz, T. Diabetic nephropathy: Diagnosis, prevention, and treatment. Diabetes Care 2005, 28, 164–176. [Google Scholar] [CrossRef] [PubMed] [Green Version]
- Barrett-Connor, E. Diabetes and heart disease. Diabetes Care 2003, 26, 2947–2958. [Google Scholar] [CrossRef] [Green Version]
- MedicalNewsToday. Effects of Diabetes on the Body and Organs. Available online: https://www.medicalnewstoday.com/articles/317483 (accessed on 17 May 2017).
- IDF. Type 1 Diabetes. Available online: https://www.idf.org/aboutdiabetes/type-1-diabetes.html (accessed on 20 January 2020).
- IDF Diabetes Atlas, A.D. Type 2 Diabetes. Available online: https://www.idf.org/aboutdiabetes/type-2-diabetes.html (accessed on 20 March 2020).
- IDF. Gestational Diabetes. Available online: https://www.idf.org/our-activities/care-prevention/gdm.html (accessed on 1 June 2020).
- MedicalNewsToday. What to Know about PCOS and Diabetes. Available online: https://www.medicalnewstoday.com/articles/326185 (accessed on 23 July 2020).
- IDF. Worldwide Toll of Diabetes. Available online: https://www.diabetesatlas.org/en/sections/worldwide-toll-of-diabetes.html (accessed on 1 June 2020).
- WHO. Global Report on Diabetes. Available online: https://apps.who.int/iris/handle/10665/204871 (accessed on 1 June 2020).
- WHO. Diabetes. Available online: https://www.who.int/news-room/fact-sheets/detail/diabetes (accessed on 1 June 2020).
- Worldometer. Bangladesh Population Live. Available online: https://www.worldometers.info/world-population/bangladesh-population/ (accessed on 1 June 2020).
- Ahmed, S.; Ahmed, T.; Sharmin, T.; Quddus, S.M.R. Impact of type 2 Diabetes Mellitus for developing severe health complications in Bangladeshi population. Asian J. Med. Biol. Res. 2017, 3, 152–157. [Google Scholar] [CrossRef]
- Khan, M.M.H.; Krämer, A.; Khandoker, A.; Prüfer-Krämer, L.; Islam, A. Trends in sociodemographic and health-related indicators in Bangladesh, 1993–2007: Will inequities persist? Bull. World Health Organ. 2011, 89, 583–593. [Google Scholar] [CrossRef]
- Star, T.D. A Worrying Picture of Diabetes in Bangladesh. Available online: https://www.thedailystar.net/supplements/world-diabetes-day-2018/news/worrying-picture-diabetes-bangladesh-1659979 (accessed on 23 July 2020).
- Mohiuddin, A. Diabetes fact: Bangladesh perspective. Commun. Public Health Nurs. 2019, 2, 39. [Google Scholar]
- WHO. Bangladesh Diabetes Country Profile. Available online: https://www.who.int/diabetes/country-profiles/bgd_en.pdf?ua=1 (accessed on 1 June 2020).
- Government, V.S. Diabetes-Long-Term Effects. Available online: https://www.betterhealth.vic.gov.au/health/conditionsandtreatments/diabetes-long-term-effects (accessed on 1 June 2020).
- Amin, M.S.; Chiam, Y.K.; Varathan, K.D. Identification of significant features and data mining techniques in predicting heart disease. Telemat. Inf. 2019, 36, 82–93. [Google Scholar] [CrossRef]
- Bonow, R.O.; Mann, D.L.; Zipes, D.P.; Libby, P. Braunwald’s hEart Disease E-Book: A Textbook of Cardiovascular Medicine; Elsevier Health Sciences: Amsterdam, The Netherlands, 2011. [Google Scholar]
- Dahiwade, D.; Patle, G.; Meshram, E. Designing Disease Prediction Model Using Machine Learning Approach. In Proceedings of the 2019 3rd International Conference on Computing Methodologies and Communication (ICCMC), Erode, India, 27–29 March 2019; pp. 1211–1215. [Google Scholar]
- Uddin, S.; Khan, A.; Hossain, M.E.; Moni, M.A. Comparing different supervised machine learning algorithms for disease prediction. BMC Med. Inf. Decis. Making 2019, 19, 1–16. [Google Scholar] [CrossRef]
- Joloudari, J.H.; Hassannataj Joloudari, E.; Saadatfar, H.; GhasemiGol, M.; Razavi, S.M.; Mosavi, A.; Nabipour, N.; Shamshirband, S.; Nadai, L. Coronary artery disease diagnosis; ranking the significant features using a random trees model. Int. J. Environ. Res. Public Health 2020, 17, 731. [Google Scholar] [CrossRef] [Green Version]
- Fuhad, K.; Tuba, J.F.; Sarker, M.; Ali, R.; Momen, S.; Mohammed, N.; Rahman, T. Deep Learning Based Automatic Malaria Parasite Detection from Blood Smear and Its Smartphone Based Application. Diagnostics 2020, 10, 329. [Google Scholar] [CrossRef] [PubMed]
- Rahman, M.S.; Akter, S.; Abe, S.K.; Islam, M.R.; Mondal, M.N.I.; Rahman, J.S.; Rahman, M.M. Awareness, treatment, and control of diabetes in Bangladesh: A nationwide population-based study. PLoS ONE 2015, 10, e0118365. [Google Scholar] [CrossRef] [Green Version]
- UCI, M.L.R. Center for Machine Learning and Intelligent System. Available online: https://archive.ics.uci.edu/ml/index.php (accessed on 1 June 2020).
- PIMA. University of California, Irvine Learning Repository. Available online: https://www.kaggle.com/uciml/pima-indians-diabetes-database (accessed on 23 July 2020).
- Islam, M.A.; Jahan, N. Prediction of Onset Diabetes using Machine Learning Techniques. Int. J. Comput. Appl. 2017, 180, 7–11. [Google Scholar]
- Ravi Sanakal, S.T.J. Prognosis of Diabetes Using Data mining Approach-Fuzzy C Means Clustering and Support Vector Machine. Int. J. Comput. Trends Technol. 2014, 11, 94–98. [Google Scholar] [CrossRef]
- Varma, K.M.; Panda, D.B.S. Comparative analysis of Predicting Diabetes Using Machine Learning Techniques. J. Emerg. Technol. Innov. Res. 2019, 6, 522–530. [Google Scholar]
- Gujral, S.; Rathore, A.; Chauhan, S. Detecting and Predicting Diabetes Using Supervised Learning: An Approach towards Better Healthcare for Women. Int. J. Adv. Res. Comput. Sci. 2017, 8, 1192–1194. [Google Scholar]
- Radja, M.; Emanuel, A.W.R. Performance Evaluation of Supervised Machine Learning Algorithms Using Different Data Set Sizes for Diabetes Prediction. In Proceedings of the 2019 5th International Conference on Science in Information Technology (ICSITech), Jogjakarta, Indonesia, 23–24 October 2019; pp. 252–258. [Google Scholar]
- Gujral, S. Early diabetes detection using machine learning: A review. Int. J. Innov. Res. Sci. Technol. 2017, 3, 57–62. [Google Scholar]
- Kadhm, M.S.; Ghindawi, I.W.; Mhawi, D.E. An accurate diabetes prediction system based on K-means clustering and proposed classification approach. Int. J. Appl. Eng. Res. 2018, 13, 4038–4041. [Google Scholar]
- Aminah, R.; Saputro, A.H. Diabetes Prediction System Based on Iridology Using Machine Learning. In Proceedings of the 2019 6th International Conference on Information Technology, Computer and Electrical Engineering (ICITACEE), Semarang, Indonesia, 26–27 September 2019; IEEE: Piscataway, NJ, USA, 2019. [Google Scholar]
- Zulfikar, A.A.; Kusuma, W.A. Modeling and Predicting Protein-Protein Interactions of Type 2 Diabetes Mellitus Using Feedforward Neural Networks. In Proceedings of the 2019 International Conference on Advanced Computer Science and information Systems (ICACSIS), Bali, Indonesia, 12–13 October 2019; IEEE: Piscataway, NJ, US, 2019; pp. 163–168. [Google Scholar]
- Howlader, K.; Chandra, S.M.S.; Barua, A.; Moni, M.A. Mining Significant Features of Diabetes Mellitus Applying Decision Trees: A Case Study In Bangladesh. bioRxiv 2018, 481944. [Google Scholar] [CrossRef]
- Géron, A. Hands-On Machine Learning with Scikit-Learn, Keras, and TensorFlow: Concepts, Tools, and Techniques to Build Intelligent Systems, 2nd ed.; O’Reilly Media: Sebastopol, CA, USA, 2019. [Google Scholar]
- Pedregosa, F.; Varoquaux, G.; Gramfort, A.; Michel, V.; Thirion, B.; Grisel, O.; Blondel, M.; Prettenhofer, P.; Weiss, R.; Dubourg, V.; et al. Scikit-learn: Machine Learning in Python. J. Mach. Learning Res. 2011, 12, 2825–2830. [Google Scholar]
- Hunter, J.D. Matplotlib: A 2D graphics environment. Comput. Sci. Eng. 2007, 9, 90–95. [Google Scholar] [CrossRef]
- Waskom, M.; Botvinnik, O.; Ostblom, J.; Gelbart, M.; Lukauskas, S.; Hobson, P.; Gemperline, D.C.; Augspurger, T.; Halchenko, Y.; Cole, J.B.; et al. Mwaskom/Seaborn: V0.10.1; Zenodo: Geneve, Switzerland, 2020. [Google Scholar] [CrossRef]
- Machta, J. Entropy, information, and computation. Am. J. Phys. 1999, 67, 1074–1077. [Google Scholar] [CrossRef] [Green Version]
- Steinberg, D. CART: Classification and regression trees. In The Top Ten Algorithms in Data Mining; Chapman and Hall/CRC: Boca Raton, FL, USA, 2009; pp. 193–216. [Google Scholar]


| Dataset | Number of Instances | Number of Features | Positive | Negative |
|---|---|---|---|---|
| PIMA | 768 | 8 | 268 | 500 |
| Kurmitola Hospital | 181 | 4 | 50 | 131 |
| SL | Feature Name | Description | Min val | Max val | Mean |
|---|---|---|---|---|---|
| 1 | Number of pregnancy | Number of times pregnant | 0 | 17 | 3.85 |
| 2 | Glucose concentration | 2-h oral glucose test (mg/dL) | 0 | 199 | 120.89 |
| 3 | Blood Pressure | Diastolic blood pressure (mm Hg) | 0 | 122 | 69.11 |
| 4 | Skin thickness | Triceps skin fold thickness (mm) | 0 | 99 | 20.54 |
| 5 | Serum Insulin | 2-H serum insulin (mu U/mL) | 0 | 846 | 79.80 |
| 6 | BMI | Body mass index (kg/m) | 0 | 67.10 | 31.99 |
| 7 | Diabetes Pedigree Function | Diabetes in family history | 0.08 | 2.42 | 0.47 |
| 8 | Age | Age in Years | 21 | 81 | 33.42 |
| SL | Feature Name | Description | Min val | Max val | Mean |
|---|---|---|---|---|---|
| 1 | Number of pregnancy | Number of times pregnant | 1 | 5 | 1.97 |
| 2 | Glucose concentration | 2-h oral glucose test (mg/dL) | 82.80 | 160.20 | 113.79 |
| 3 | BMI | Body mass index (kg/m) | 19.10 | 37.20 | 28.46 |
| 4 | Age | Age in Years | 17 | 58 | 26.76 |
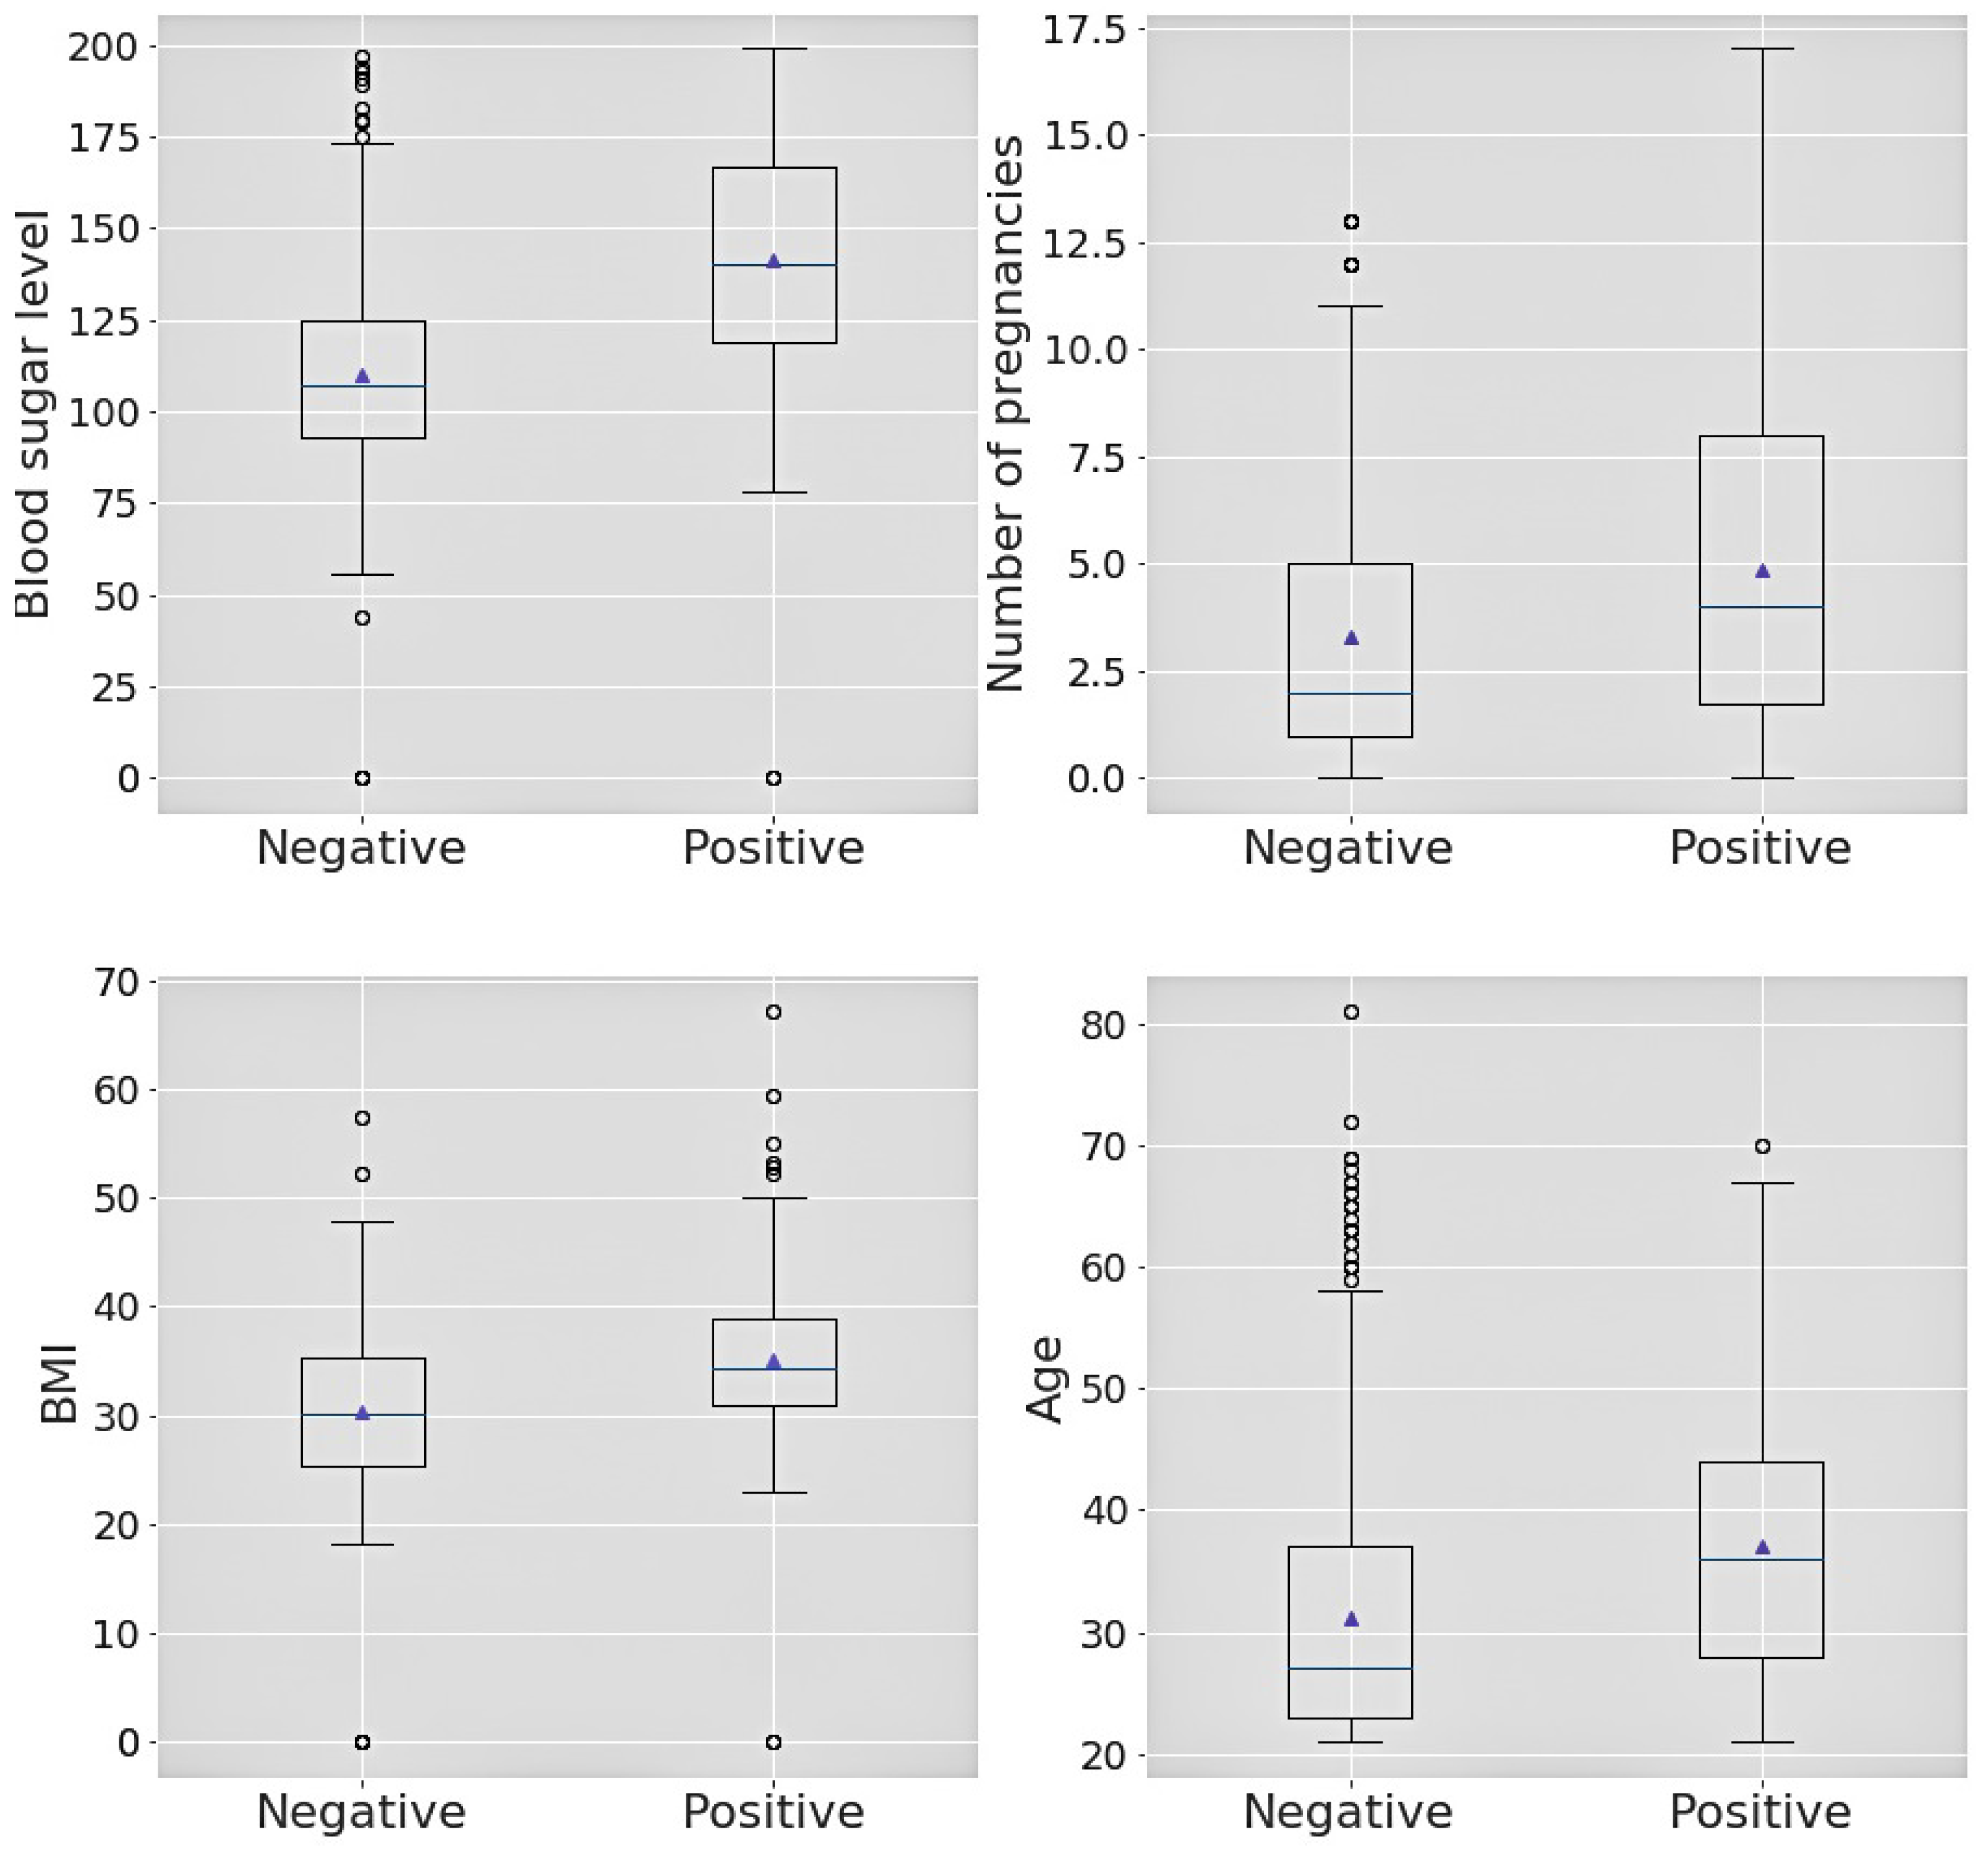
| SL | Box-plot Attribute | Outcome | Min. | 1st Quartile | Median | 3rd Quartile | Max. |
|---|---|---|---|---|---|---|---|
| 1 | Sugar level | Positive | 0 | 119.0 | 140.0 | 167.0 | 199.0 |
| 2 | Sugar level | Negative | 0 | 93.0 | 107.0 | 125.0 | 197.0 |
| 3 | No. of pregnancies | Positive | 0 | 1.75 | 4.0 | 8.0 | 17.0 |
| 4 | No. of pregnancies | Negative | 0 | 1.0 | 2.0 | 5.0 | 13.0 |
| 5 | BMI | Positive | 0 | 30.8 | 34.25 | 38.78 | 67.1 |
| 6 | BMI | Negative | 0 | 25.4 | 30.05 | 35.3 | 57.3 |
| 7 | Age | Positive | 21.0 | 28.0 | 36.0 | 44.0 | 70.0 |
| 8 | Age | Negative | 21.0 | 23.0 | 27.0 | 37.0 | 81.0 |
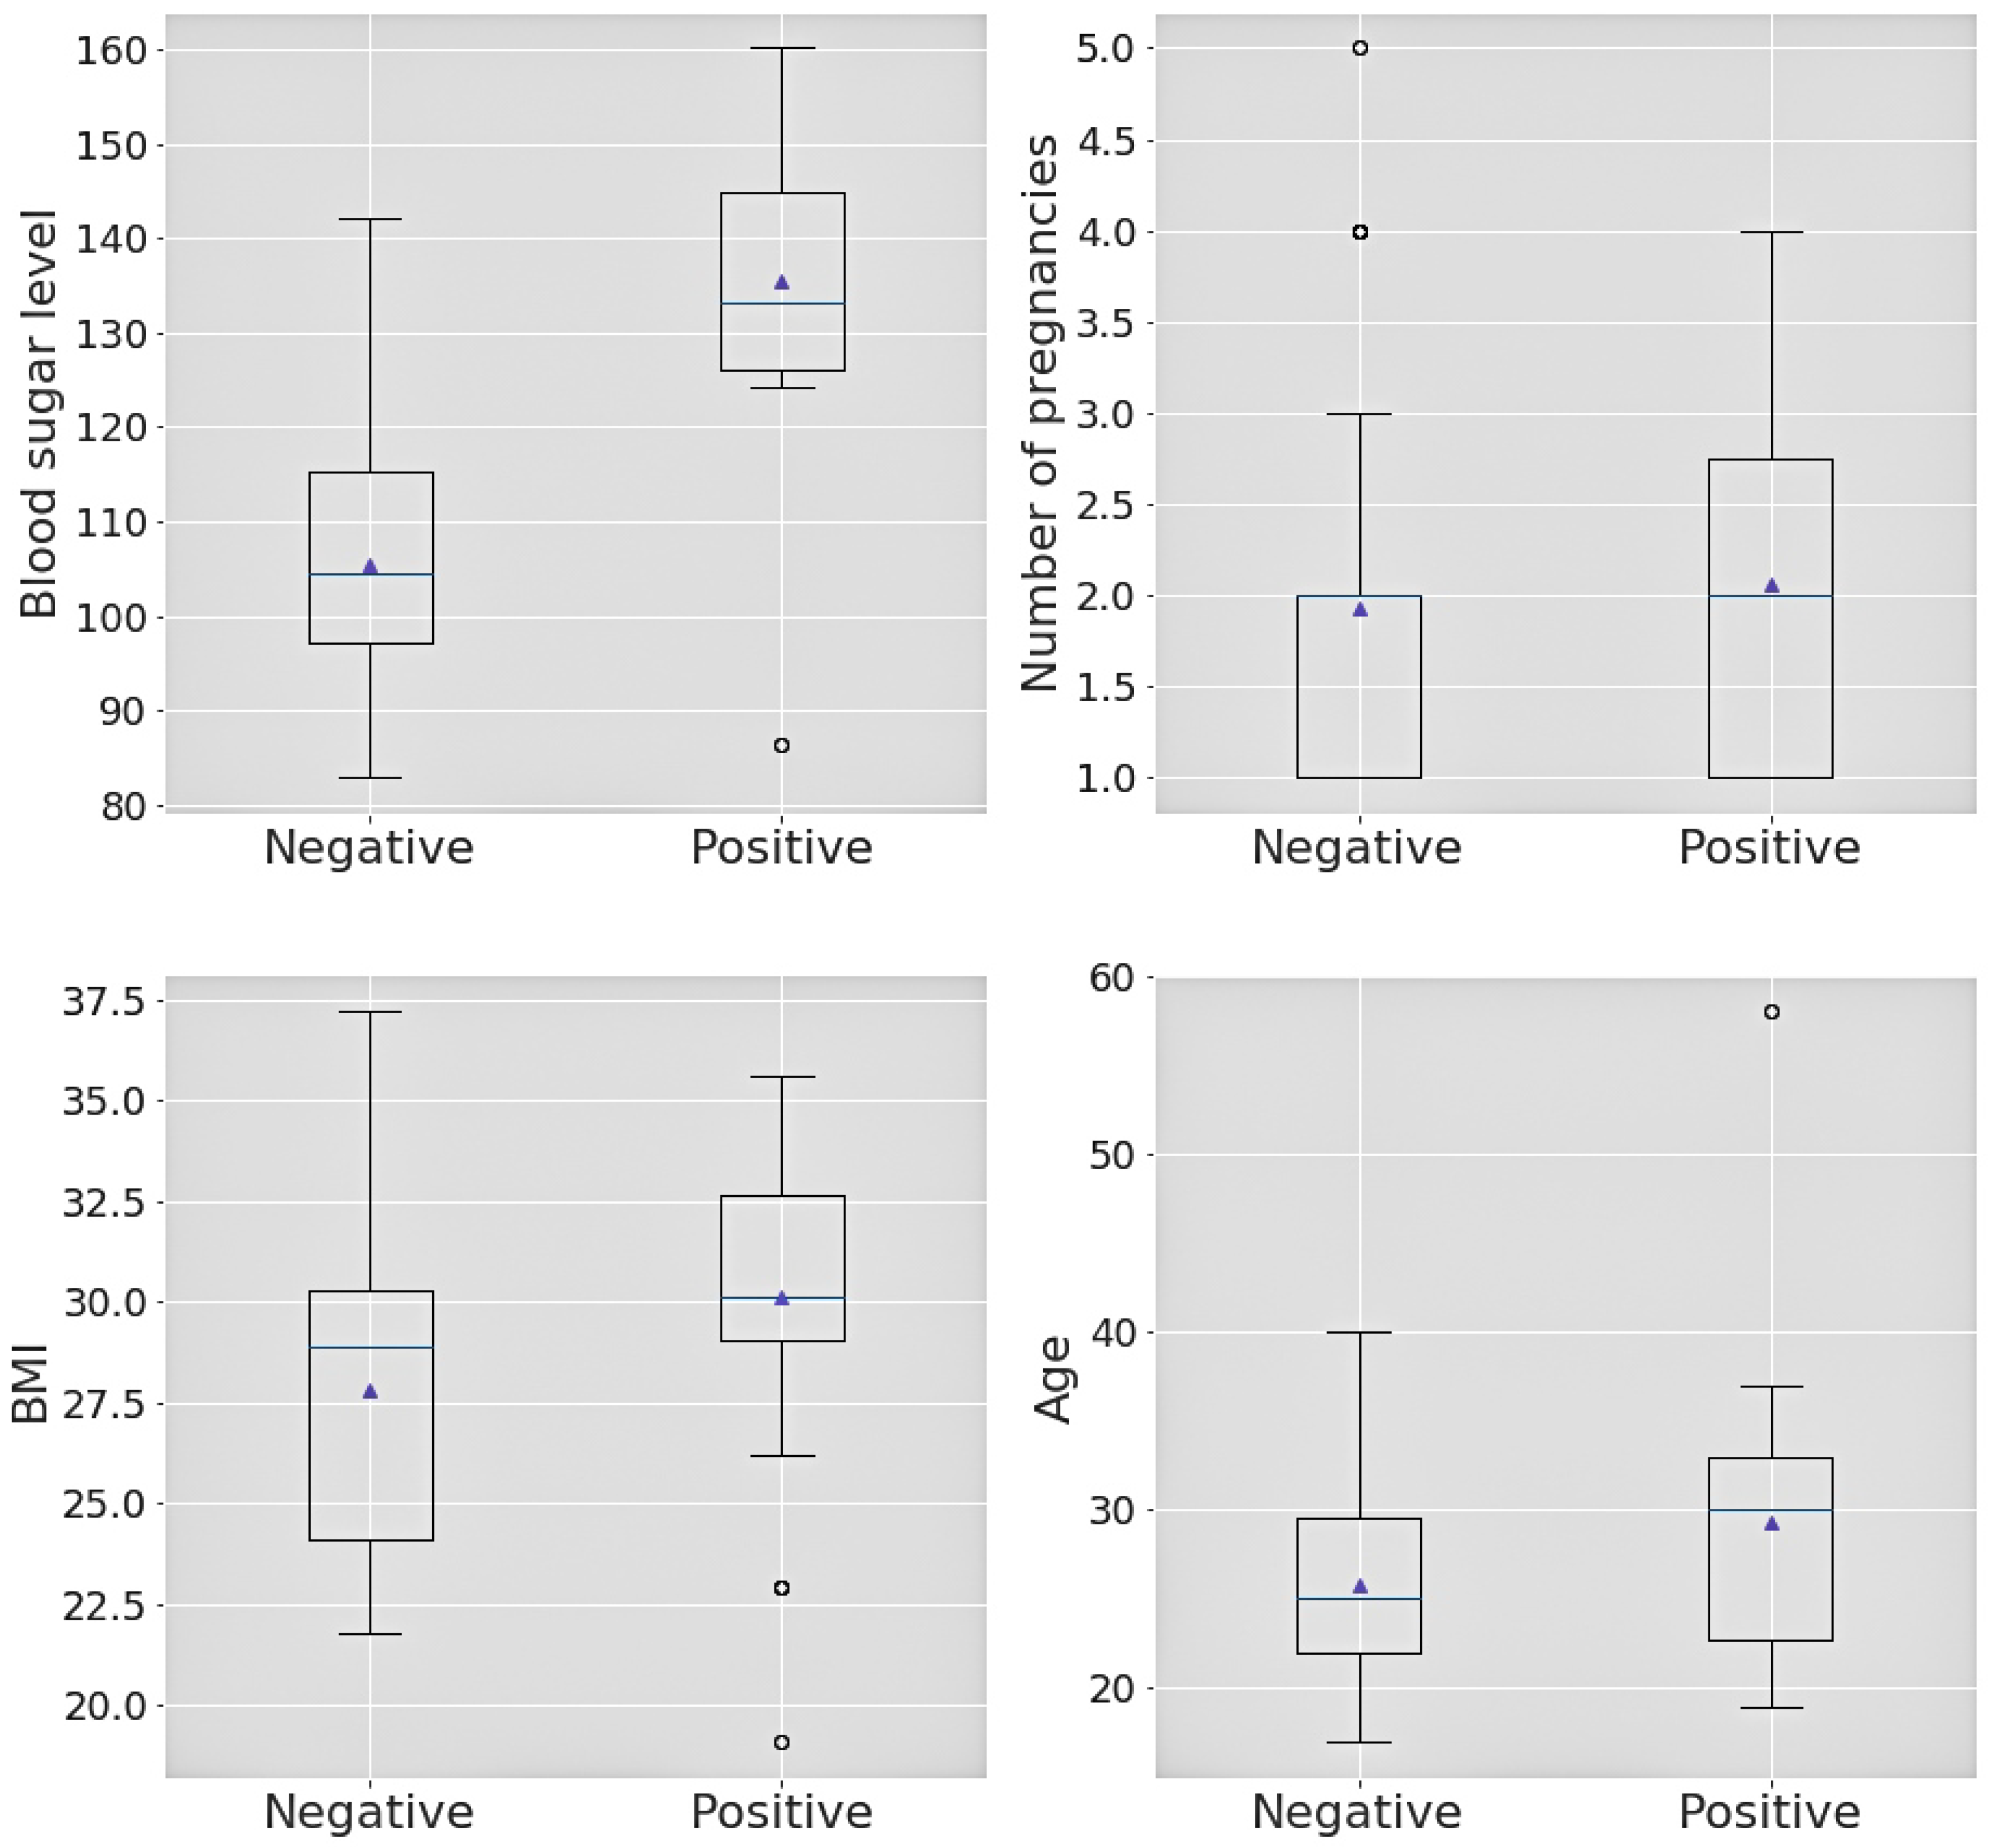
| SL | Box-plot Attribute | Outcome | Min. | 1st Quartile | Median | 3rd Quartile | Max. |
|---|---|---|---|---|---|---|---|
| 1 | Sugar level | Positive | 86.4 | 126.0 | 133.2 | 144.9 | 160.2 |
| 2 | Sugar level | Negative | 82.8 | 97.2 | 104.4 | 115.2 | 142.2 |
| 3 | No. of pregnancies | Positive | 1 | 1 | 2 | 2.75 | 4 |
| 4 | No. of pregnancies | Negative | 1 | 1 | 2 | 2.75 | 5 |
| 5 | BMI | Positive | 19.1 | 29.0 | 30.1 | 32.7 | 35.6 |
| 6 | BMI | Negative | 21.8 | 24.1 | 28.9 | 30.3 | 37.2 |
| 7 | Age | Positive | 19 | 22.75 | 30.0 | 33.0 | 58 |
| 8 | Age | Negative | 17 | 22.0 | 25.0 | 29.5 | 40 |
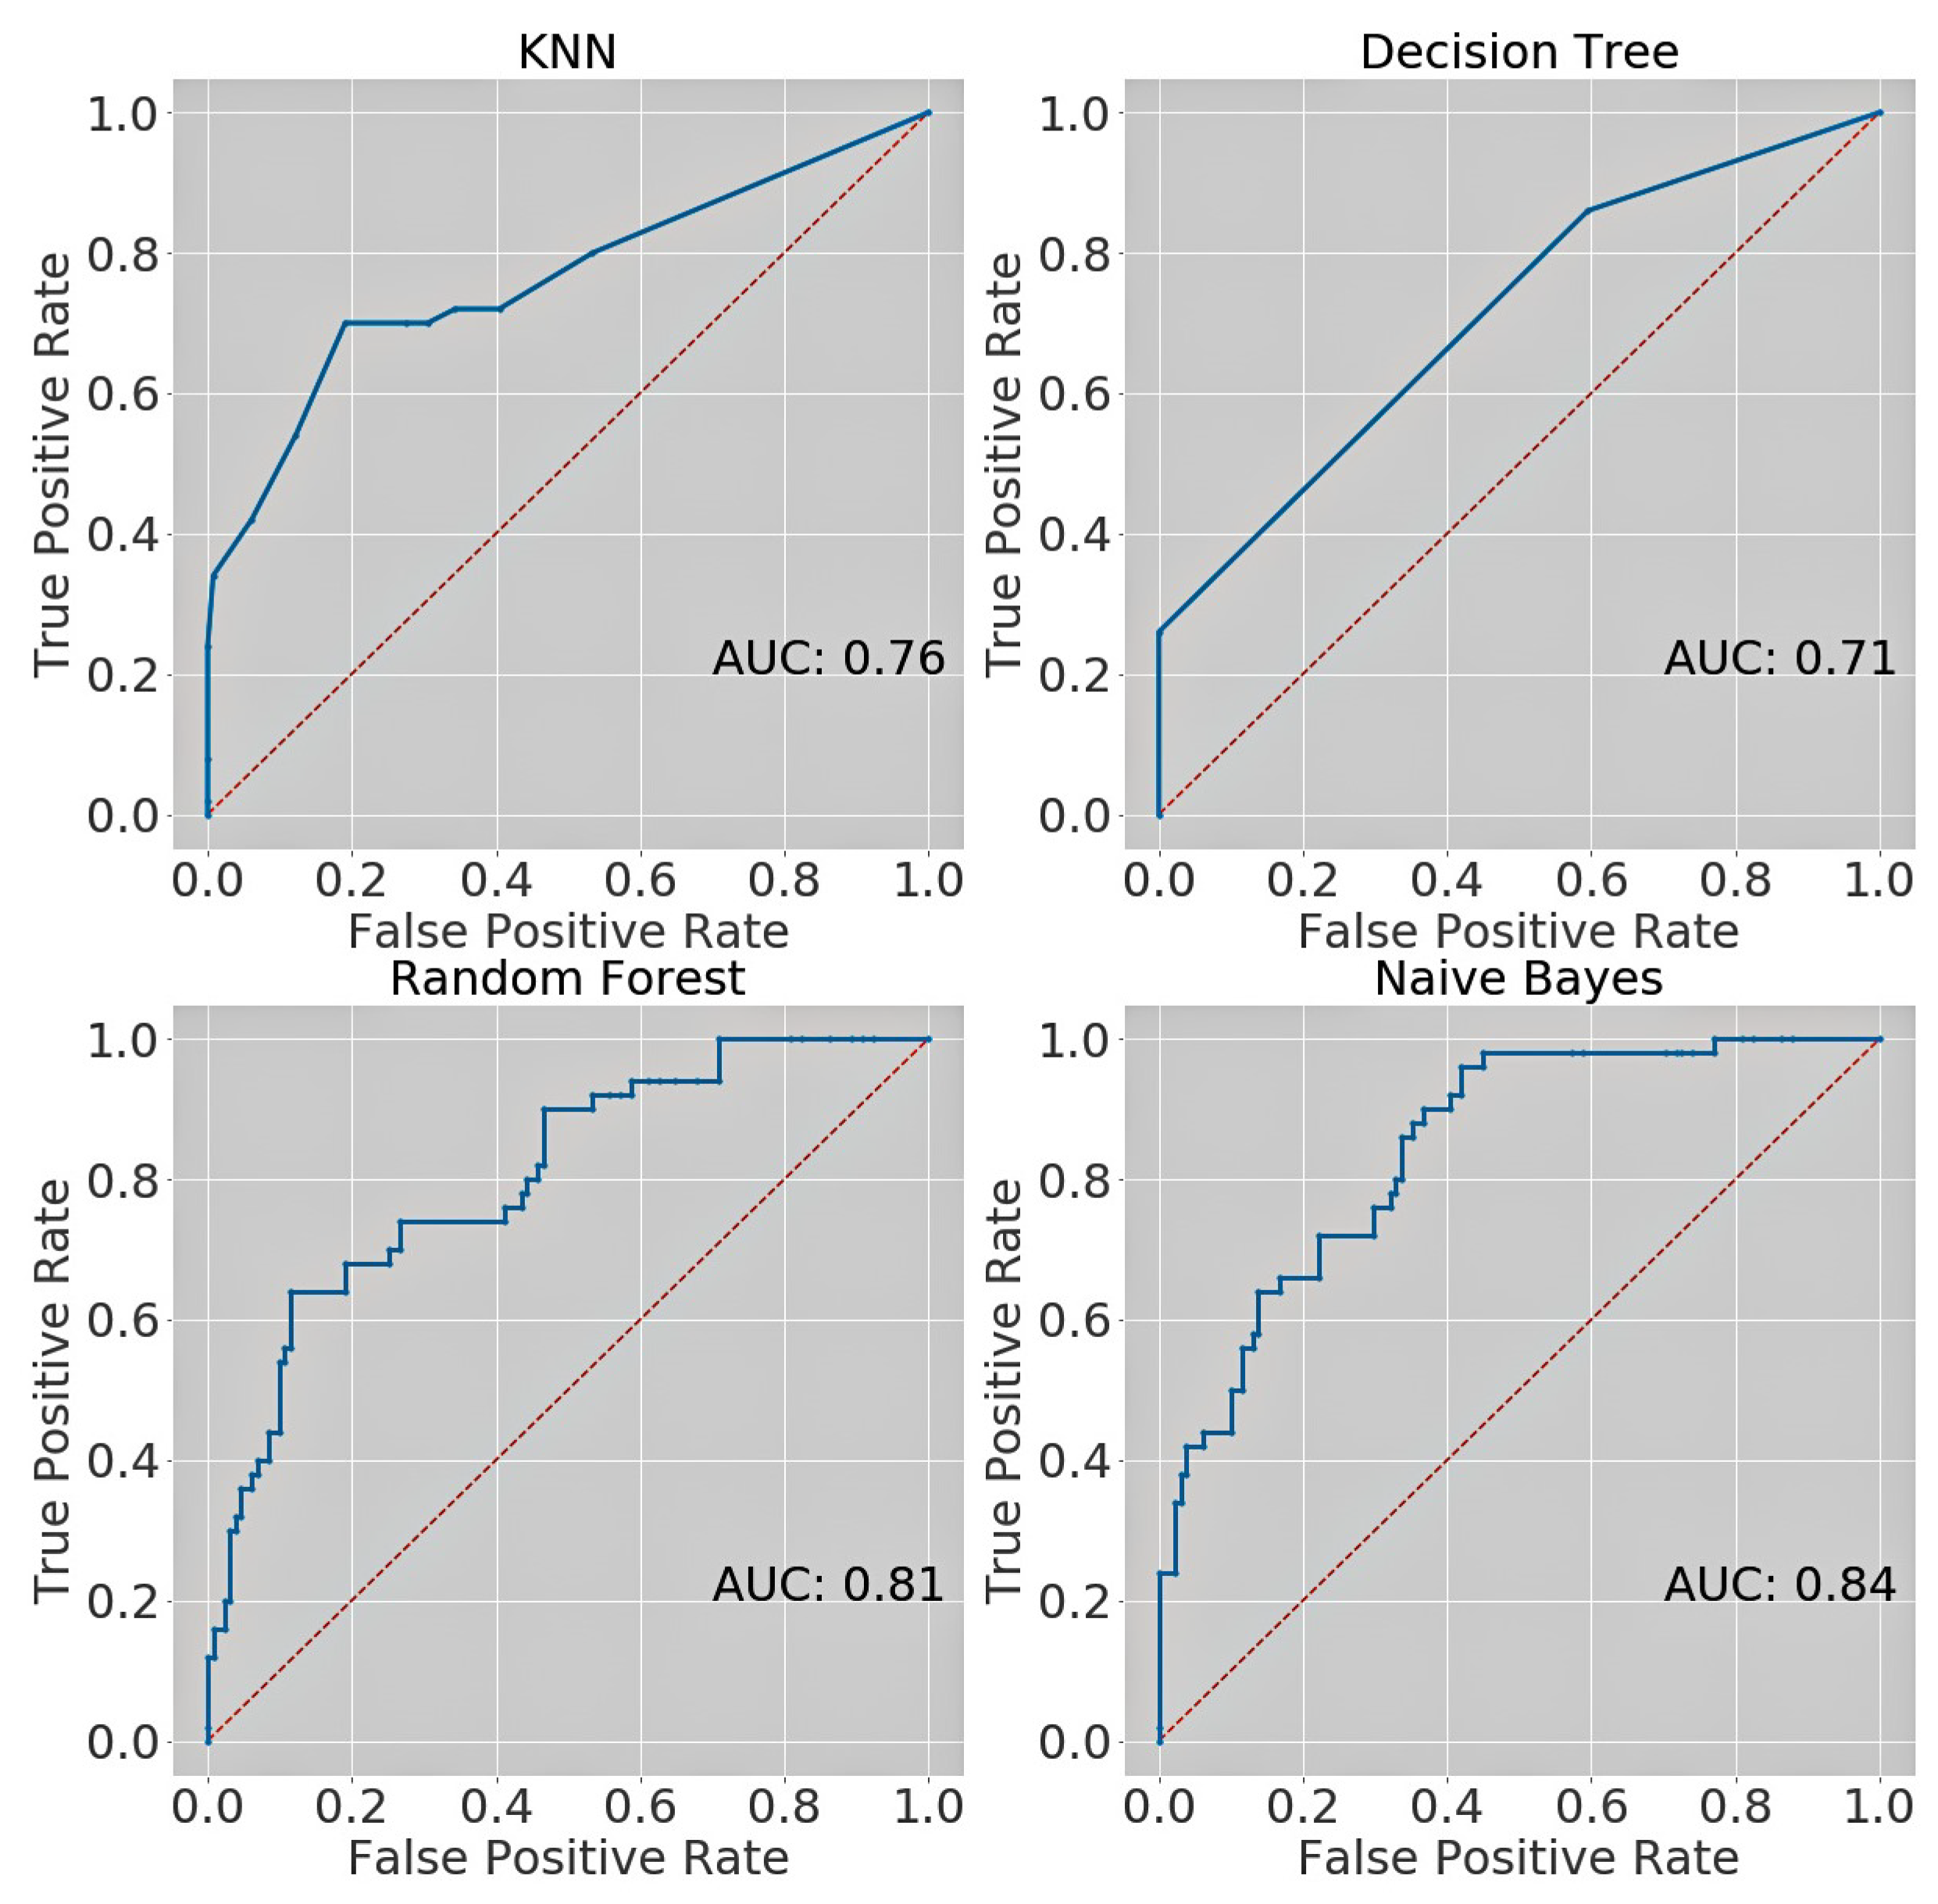
| Dataset | Classifier Name | Accuracy | Precision | Recall | F1-score | AUC |
|---|---|---|---|---|---|---|
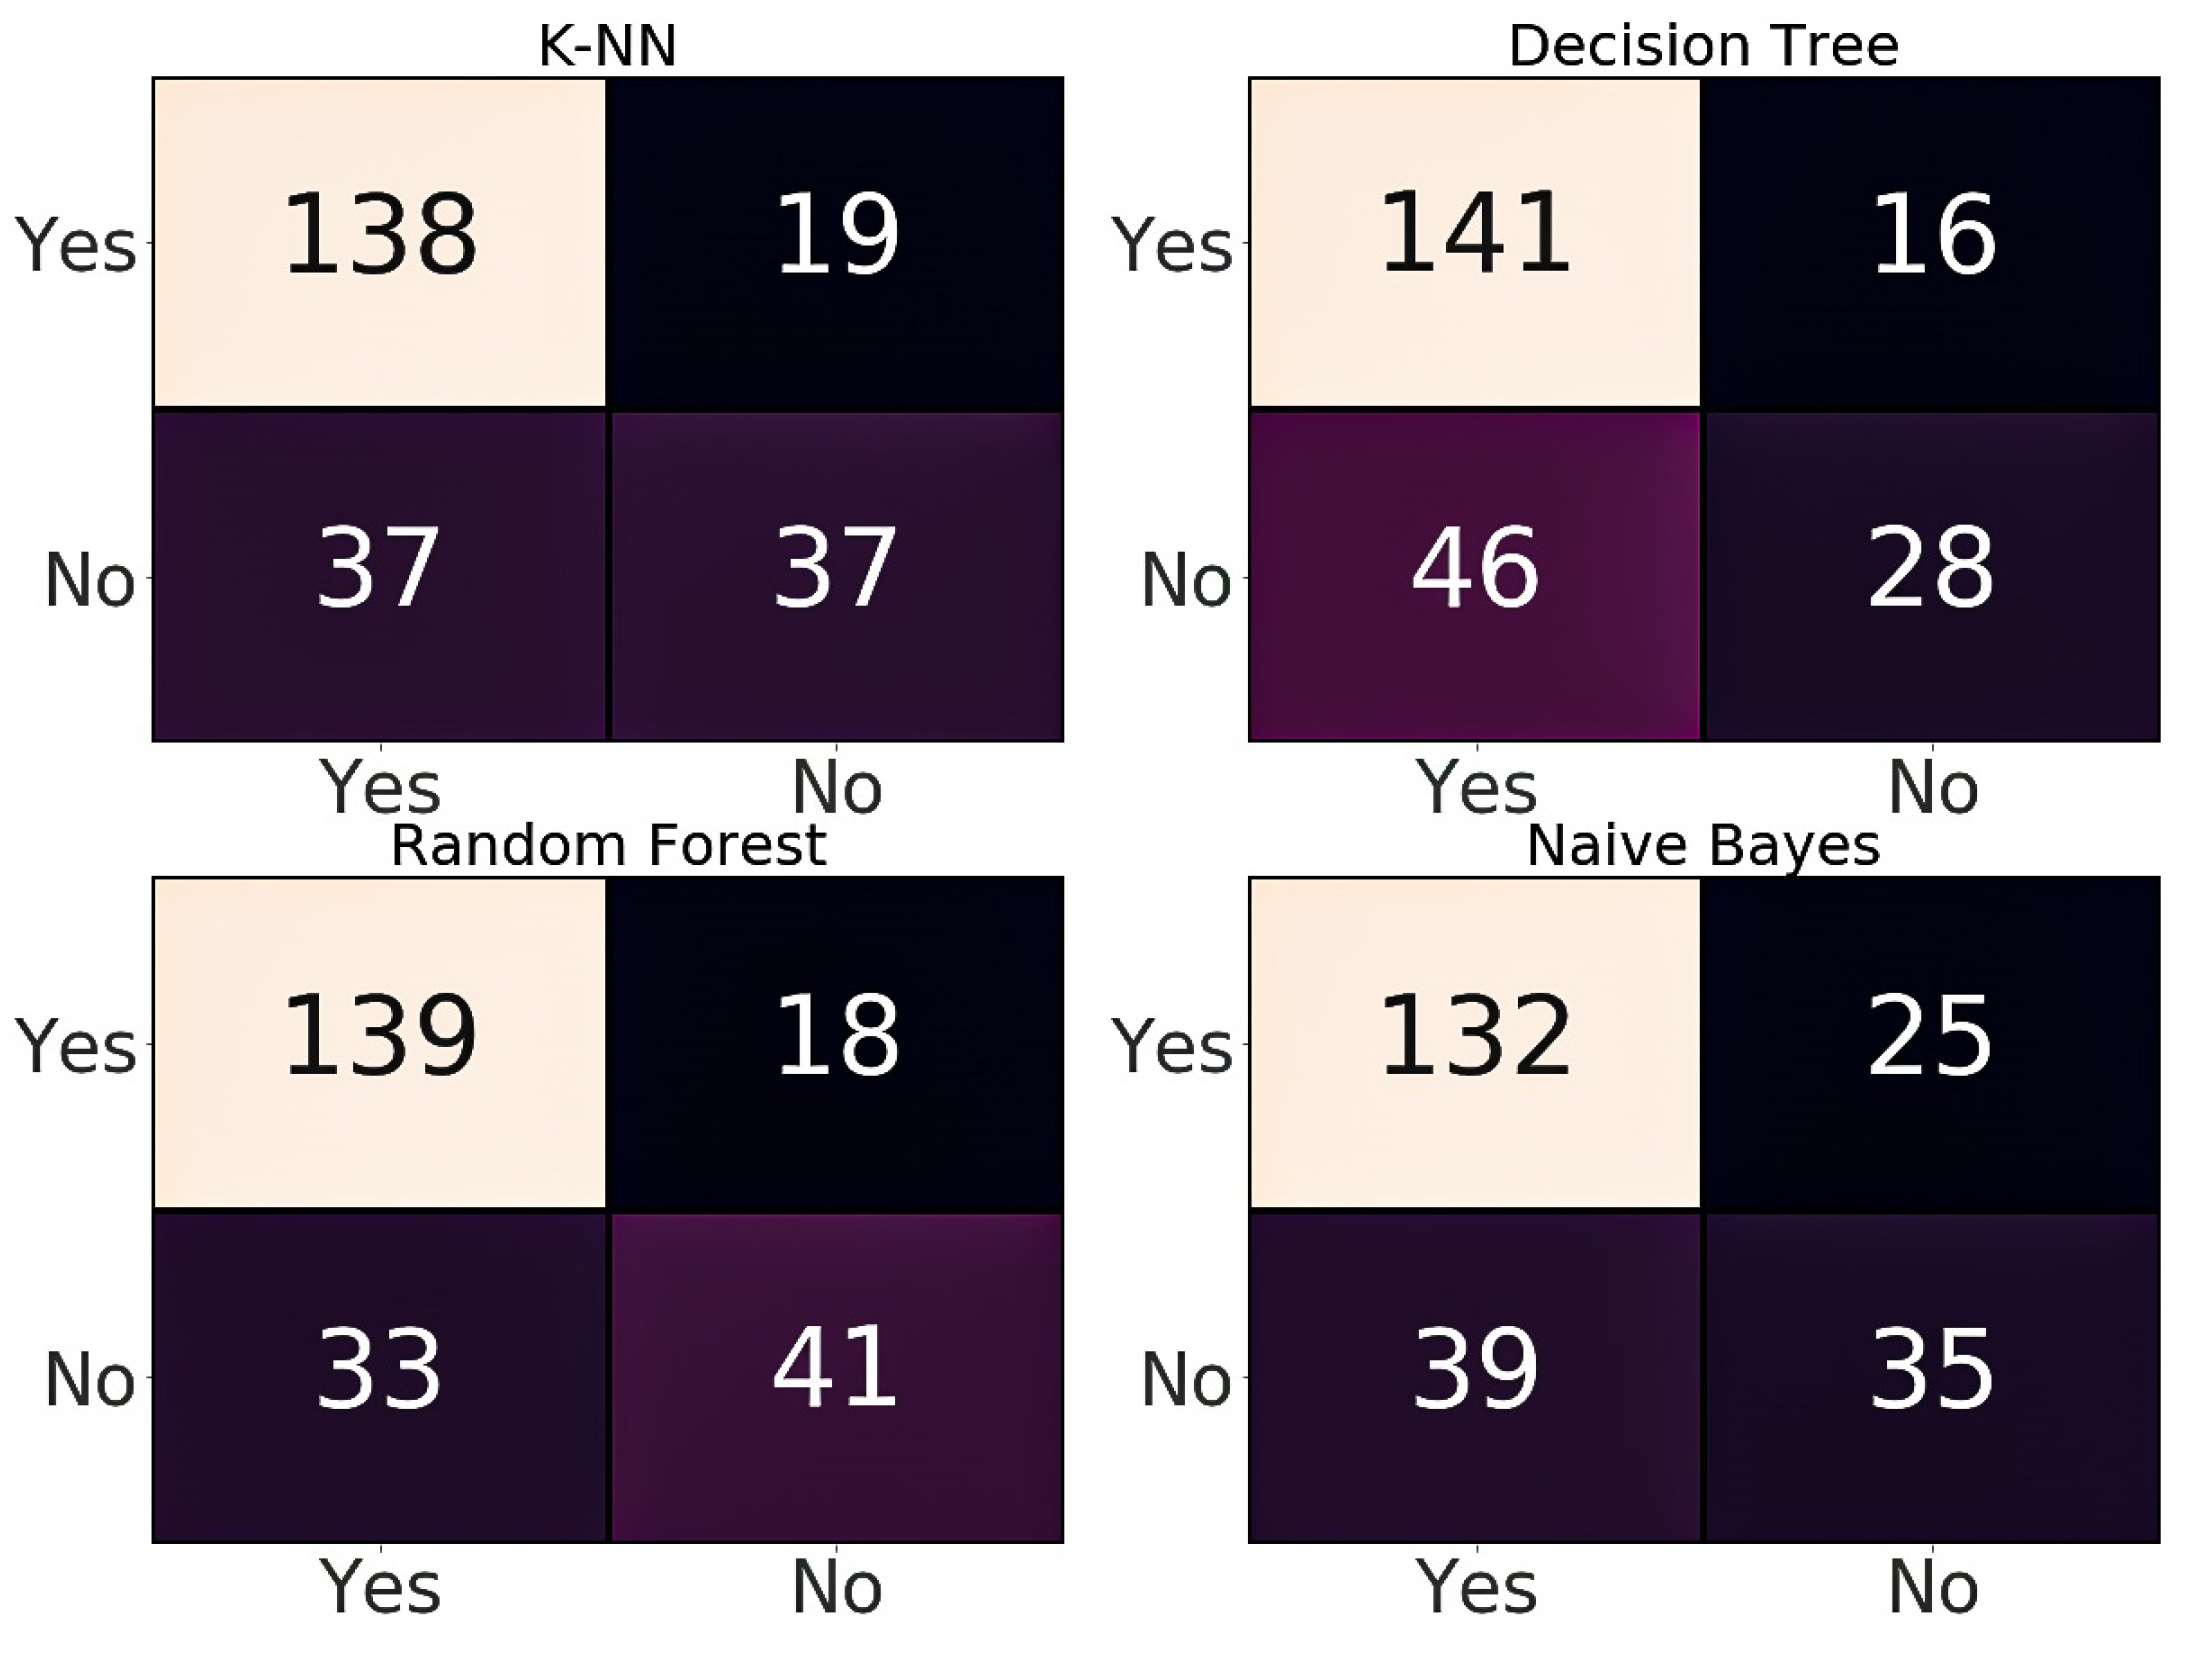
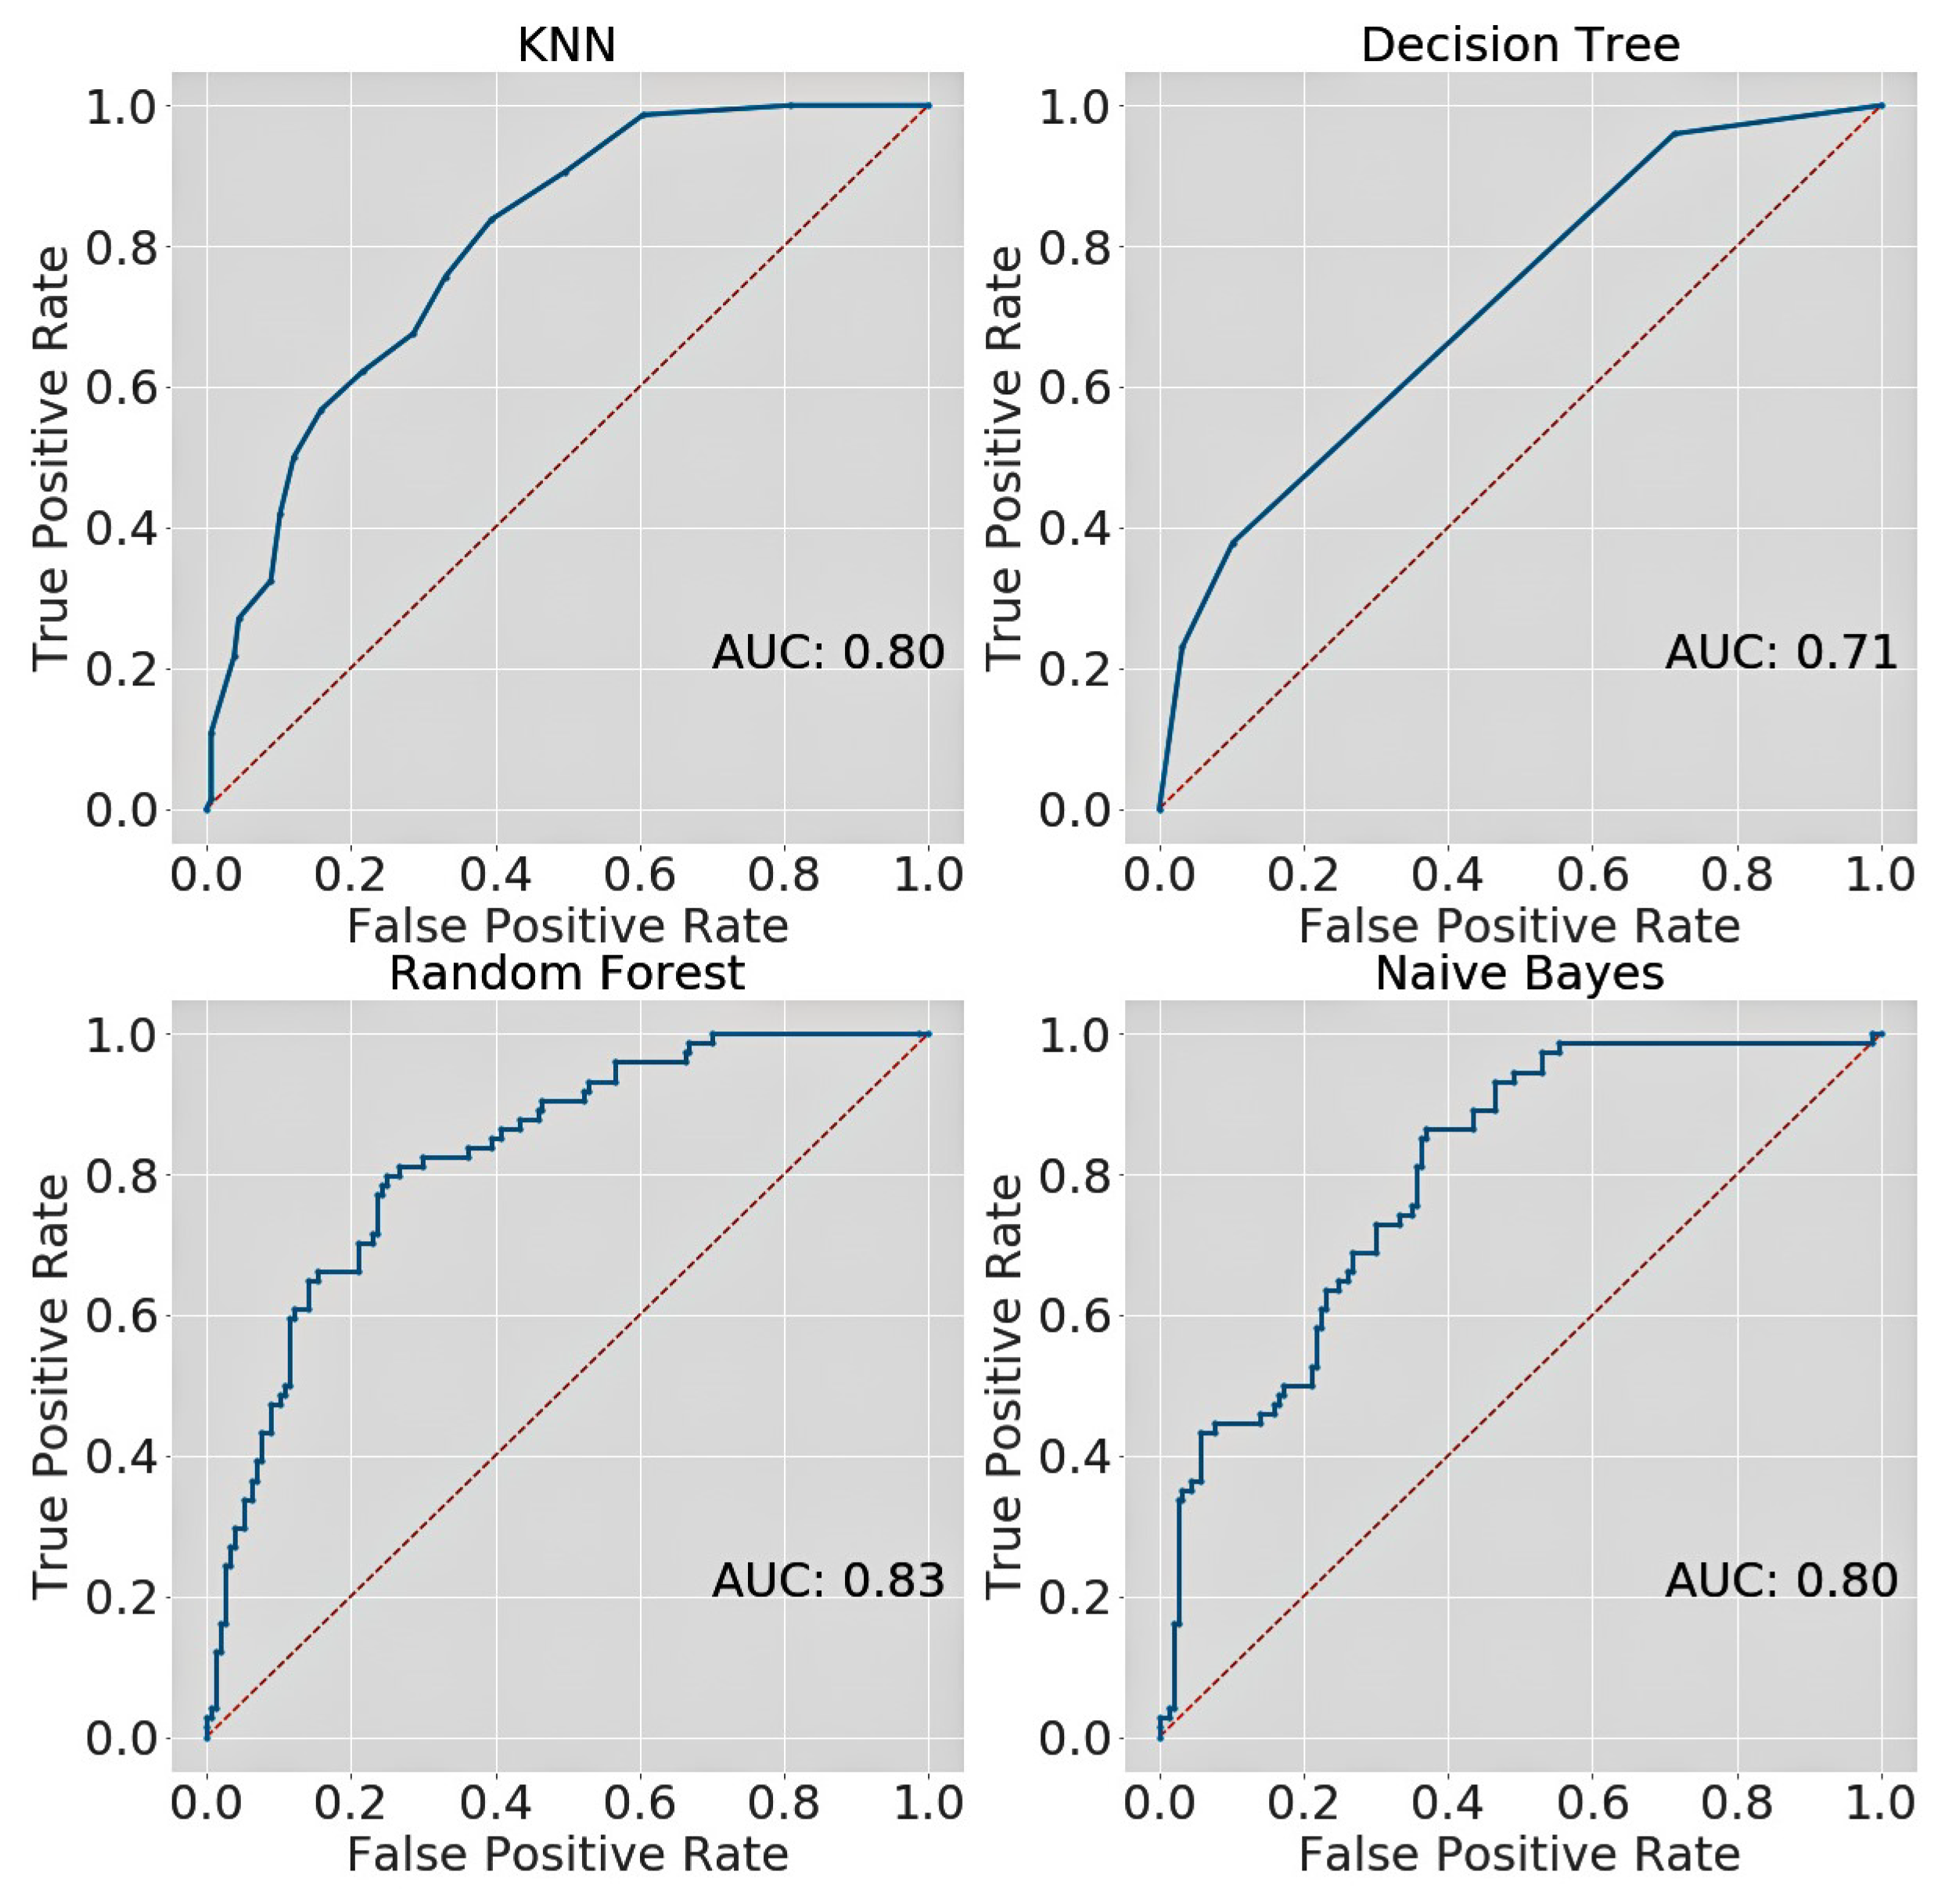
| PIMA test set | KNN | 0.757 | 0.79 | 0.88 | 0.83 | 0.80 |
| Decision Tree | 0.731 | 0.75 | 0.90 | 0.82 | 0.71 | |
| Random Forest | 0.779 | 0.81 | 0.89 | 0.84 | 0.83 | |
| Naïve Bayes | 0.722 | 0.77 | 0.84 | 0.80 | 0.80 | |
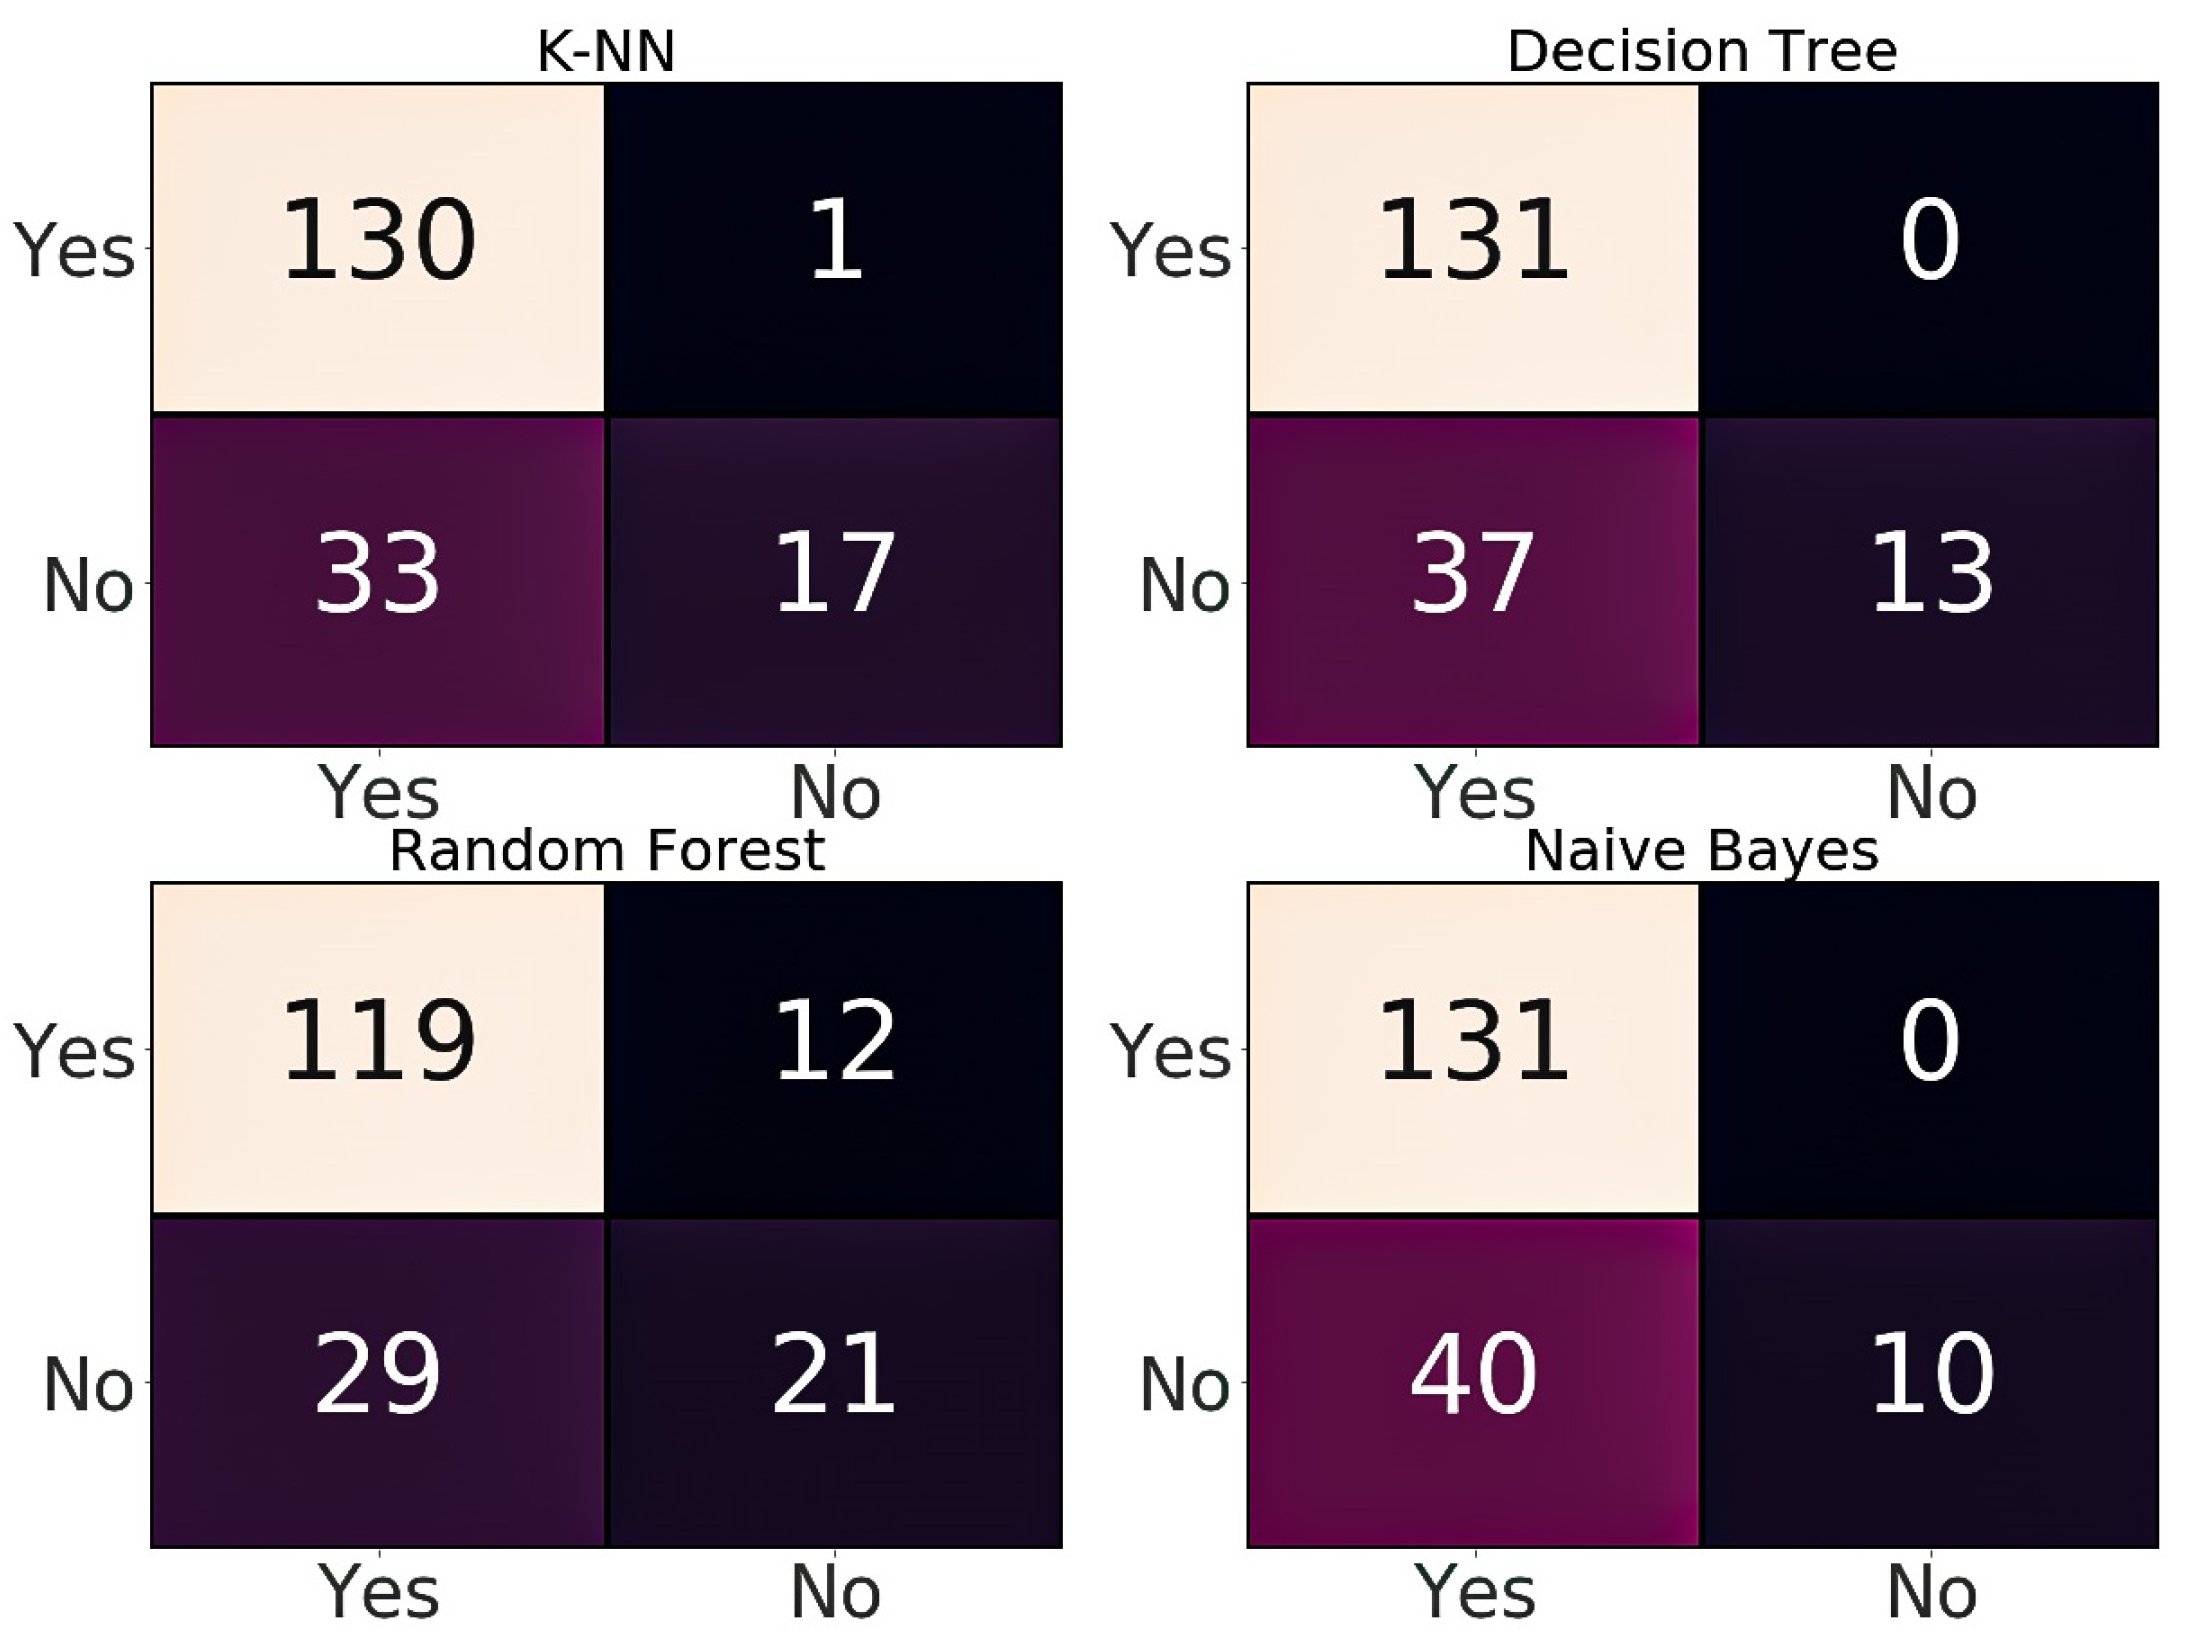
| Kurmitola Hospital | KNN | 0.812 | 0.80 | 0.99 | 0.88 | 0.76 |
| Decision Tree | 0.795 | 0.78 | 1.00 | 0.88 | 0.71 | |
| Random Forest | 0.773 | 0.80 | 0.91 | 0.85 | 0.81 | |
| Naïve Bayes | 0.779 | 0.77 | 1.00 | 0.87 | 0.84 |
| SL | Dataset | Authors | Accuracy | Precision | Recall | F1-score | AUC |
|---|---|---|---|---|---|---|---|
| 01. | PIMA Indian | Islam et al. [30] | 0.78 | 0.89 | 0.80 | — | 0.83 |
| 02. | Varma et al. [32] | 0.74 | — | — | — | — | |
| 03. | Gujral et al. [33] | 0.82 | — | — | — | — | |
| 04. | Radja et al. [34] | 0.77 | 0.79 | 0.90 | 0.76 | — | |
| 06. | Proposed work | 0.78 | 0.81 | 0.89 | 0.84 | 0.83 |
© 2020 by the authors. Licensee MDPI, Basel, Switzerland. This article is an open access article distributed under the terms and conditions of the Creative Commons Attribution (CC BY) license (http://creativecommons.org/licenses/by/4.0/).
Share and Cite
Pranto, B.; Mehnaz, S.M.; Mahid, E.B.; Sadman, I.M.; Rahman, A.; Momen, S. Evaluating Machine Learning Methods for Predicting Diabetes among Female Patients in Bangladesh. Information 2020, 11, 374. https://0-doi-org.brum.beds.ac.uk/10.3390/info11080374
Pranto B, Mehnaz SM, Mahid EB, Sadman IM, Rahman A, Momen S. Evaluating Machine Learning Methods for Predicting Diabetes among Female Patients in Bangladesh. Information. 2020; 11(8):374. https://0-doi-org.brum.beds.ac.uk/10.3390/info11080374
Chicago/Turabian StylePranto, Badiuzzaman, Sk. Maliha Mehnaz, Esha Bintee Mahid, Imran Mahmud Sadman, Ahsanur Rahman, and Sifat Momen. 2020. "Evaluating Machine Learning Methods for Predicting Diabetes among Female Patients in Bangladesh" Information 11, no. 8: 374. https://0-doi-org.brum.beds.ac.uk/10.3390/info11080374