Measuring Drivers’ Physiological Response to Different Vehicle Controllers in Highly Automated Driving (HAD): Opportunities for Establishing Real-Time Values of Driver Discomfort

 , and
, and
Abstract
:1. Introduction
Current Study
- How is driver discomfort, as measured by changes in physiological state (i.e., HRV and EDA), affected by the various controllers, and manual driving?
- Do drivers’ discomfort levels change, based on the behaviour of the different controllers, in the different road environments (rural and urban)?
- Does the change in drivers’ physiological state reflect their self-reported level of perceived discomfort during HAD?
2. Materials and Methods
2.1. Participants
2.2. Aparatus
2.3. Study Design
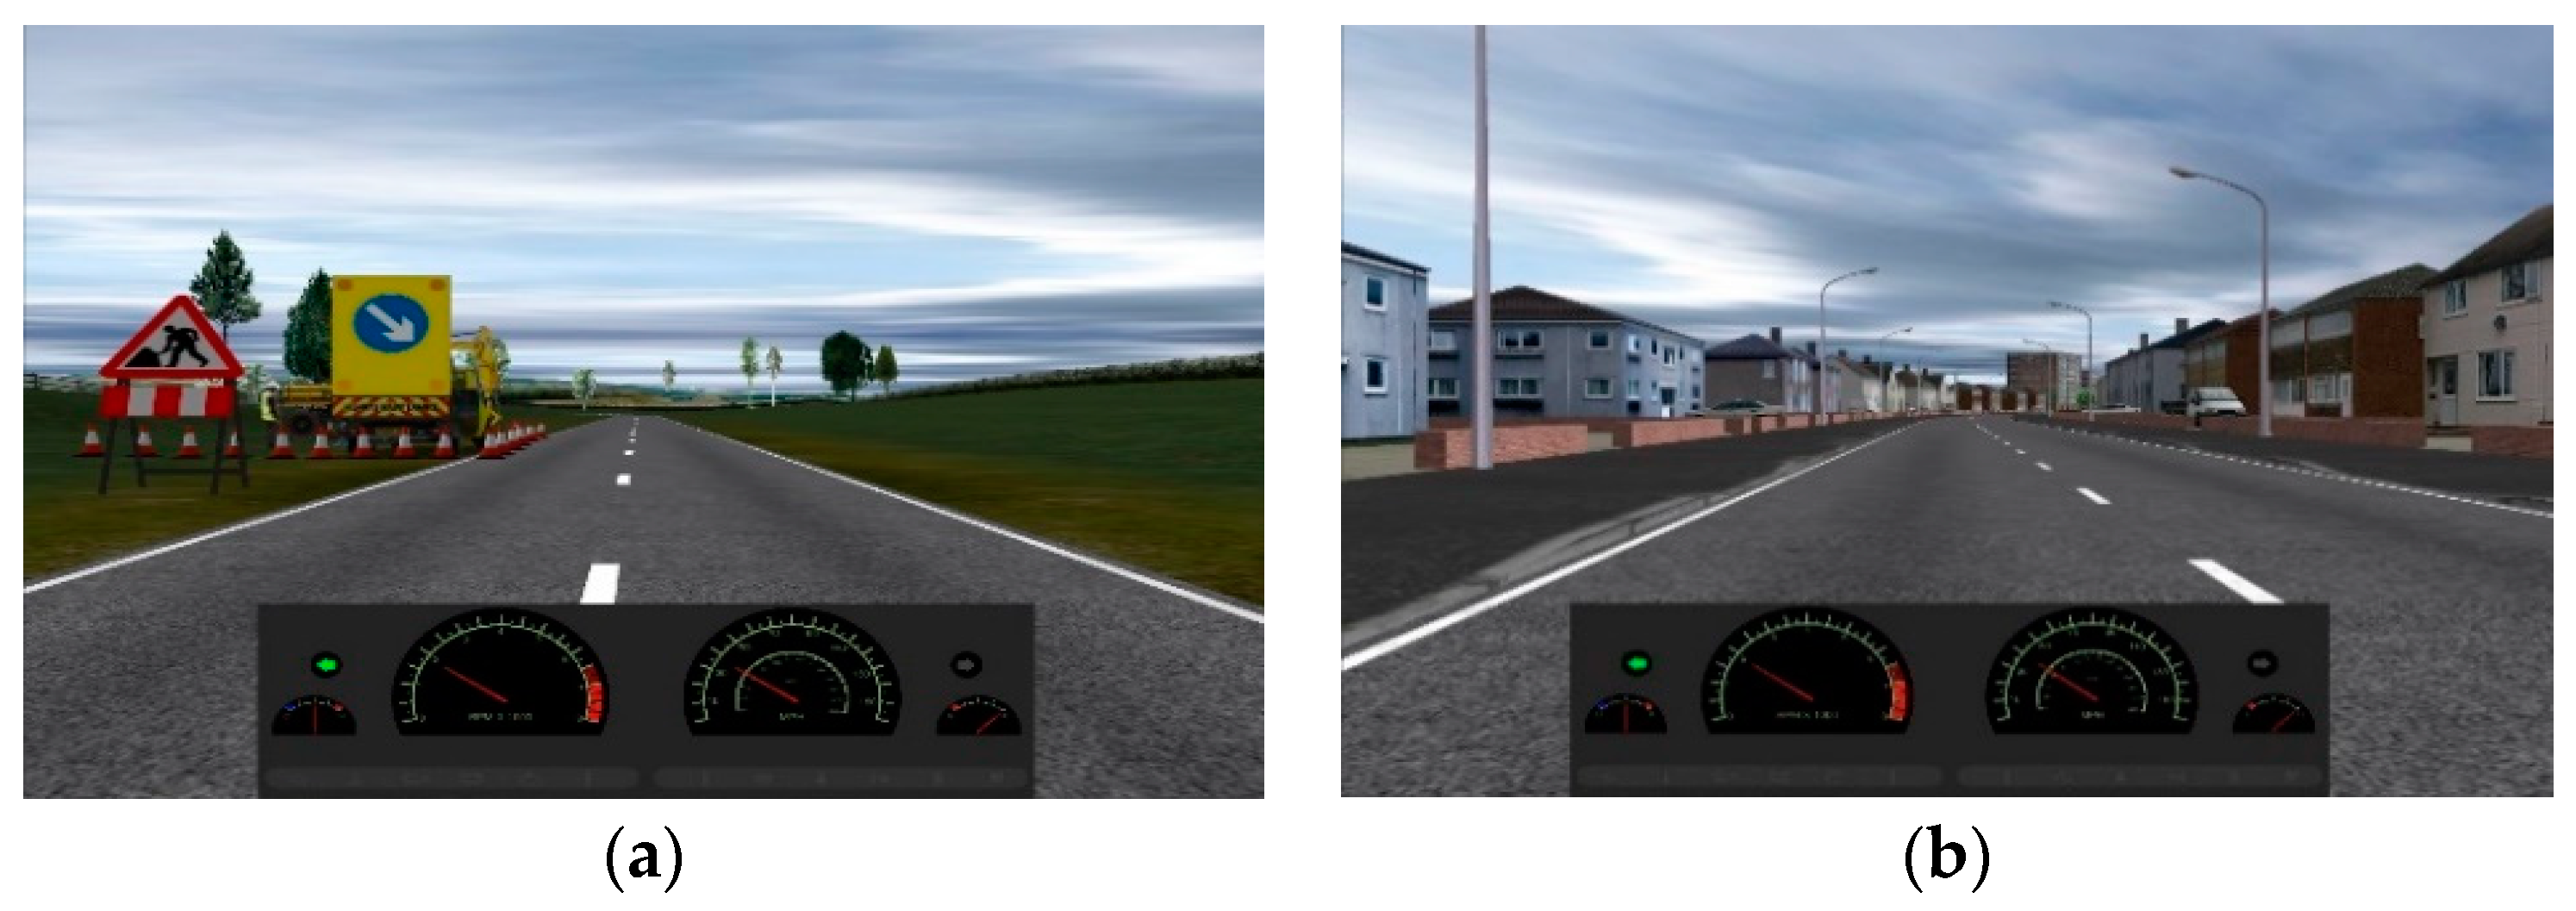
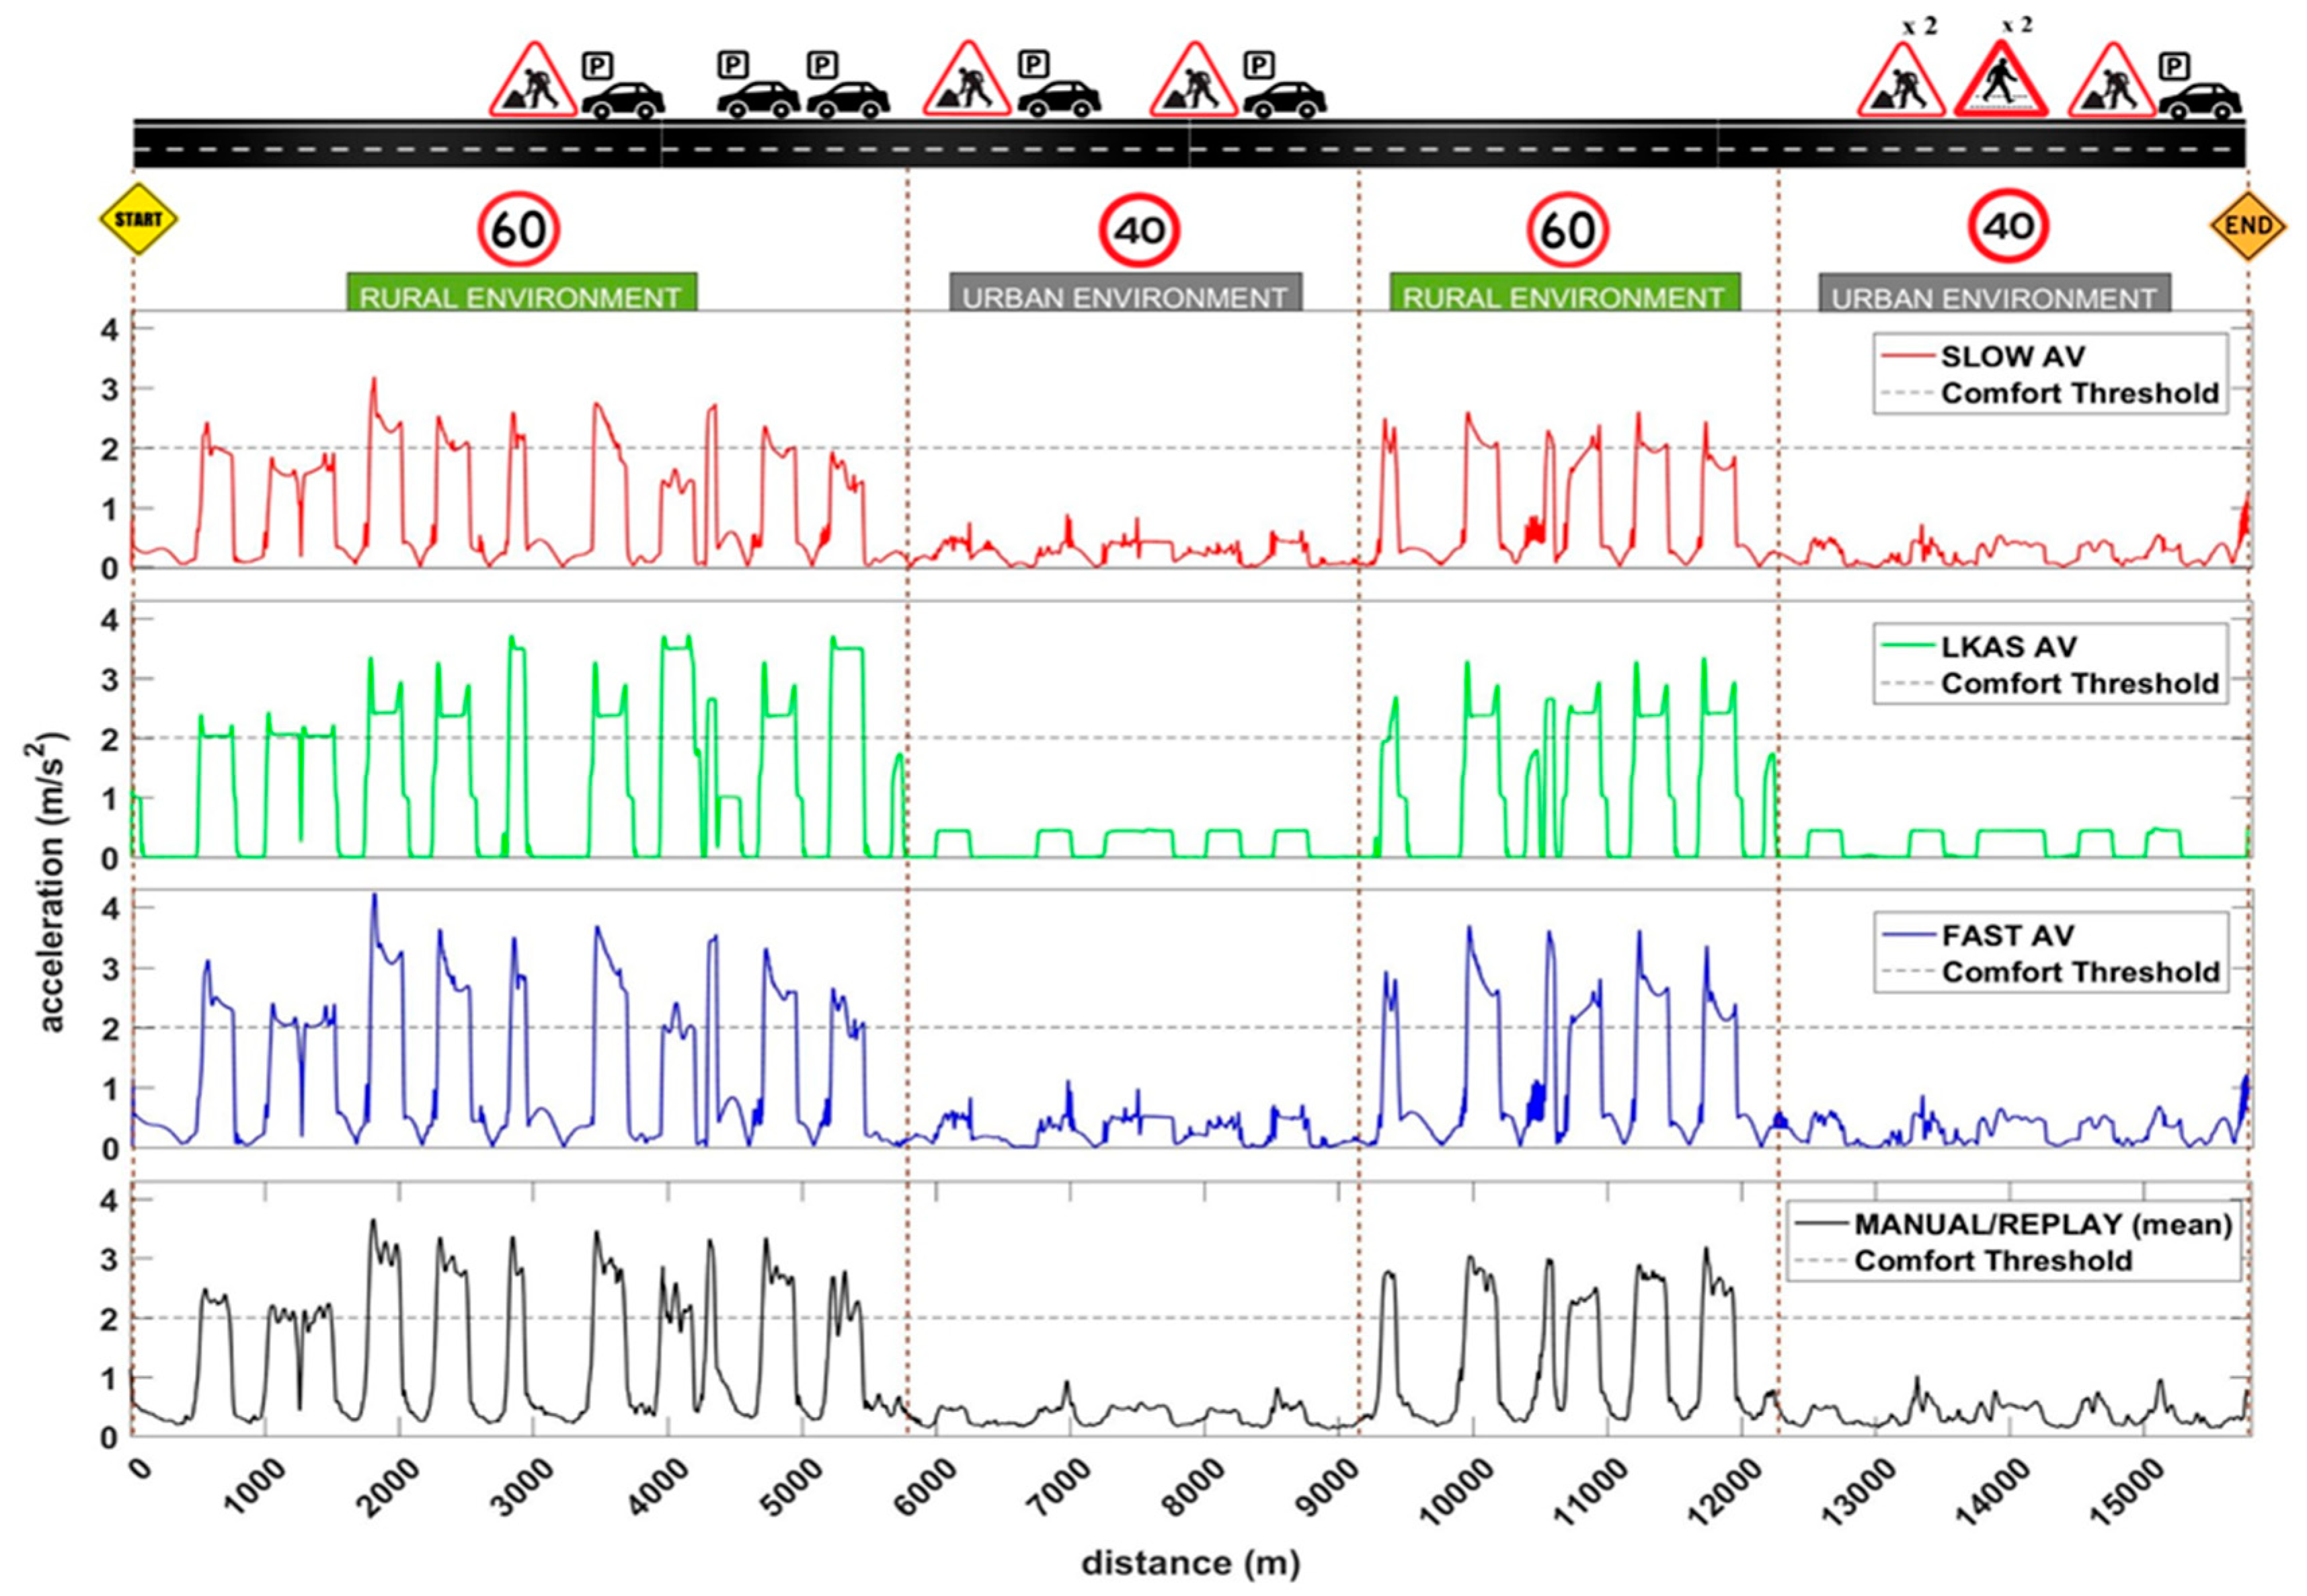
2.3.1. Road Design
2.3.2. Experimental Design
2.4. Subjective Discomfort Rating (Button Presses)
2.5. Procedure
2.6. Data Analysis Tools
2.7. Statistical Analysis
3. Results
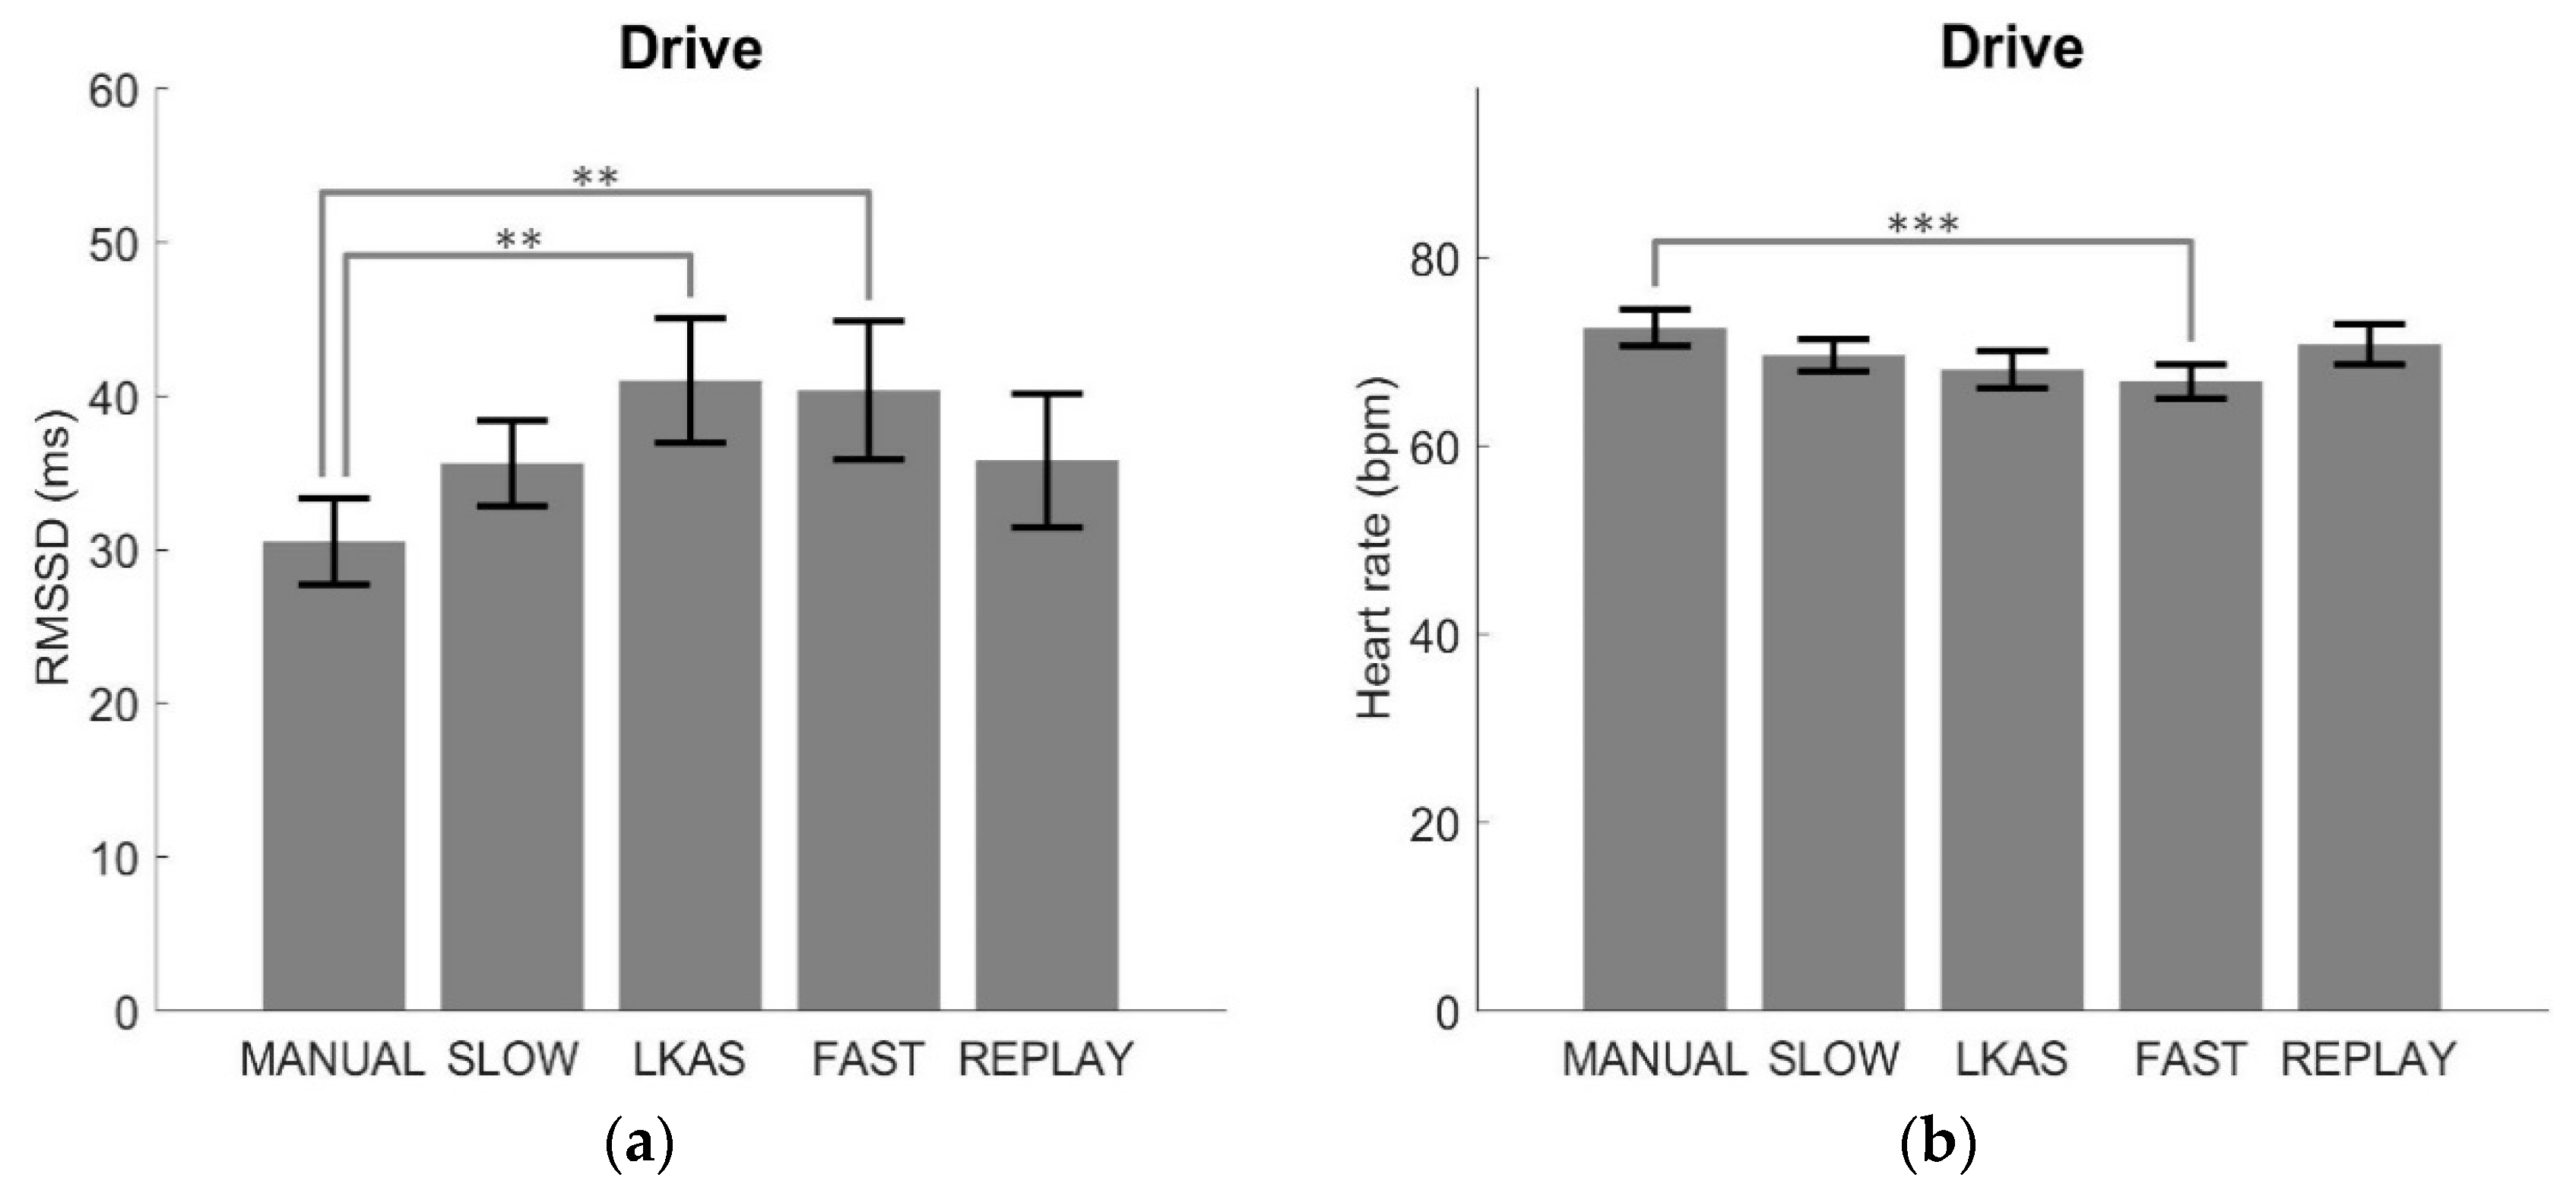
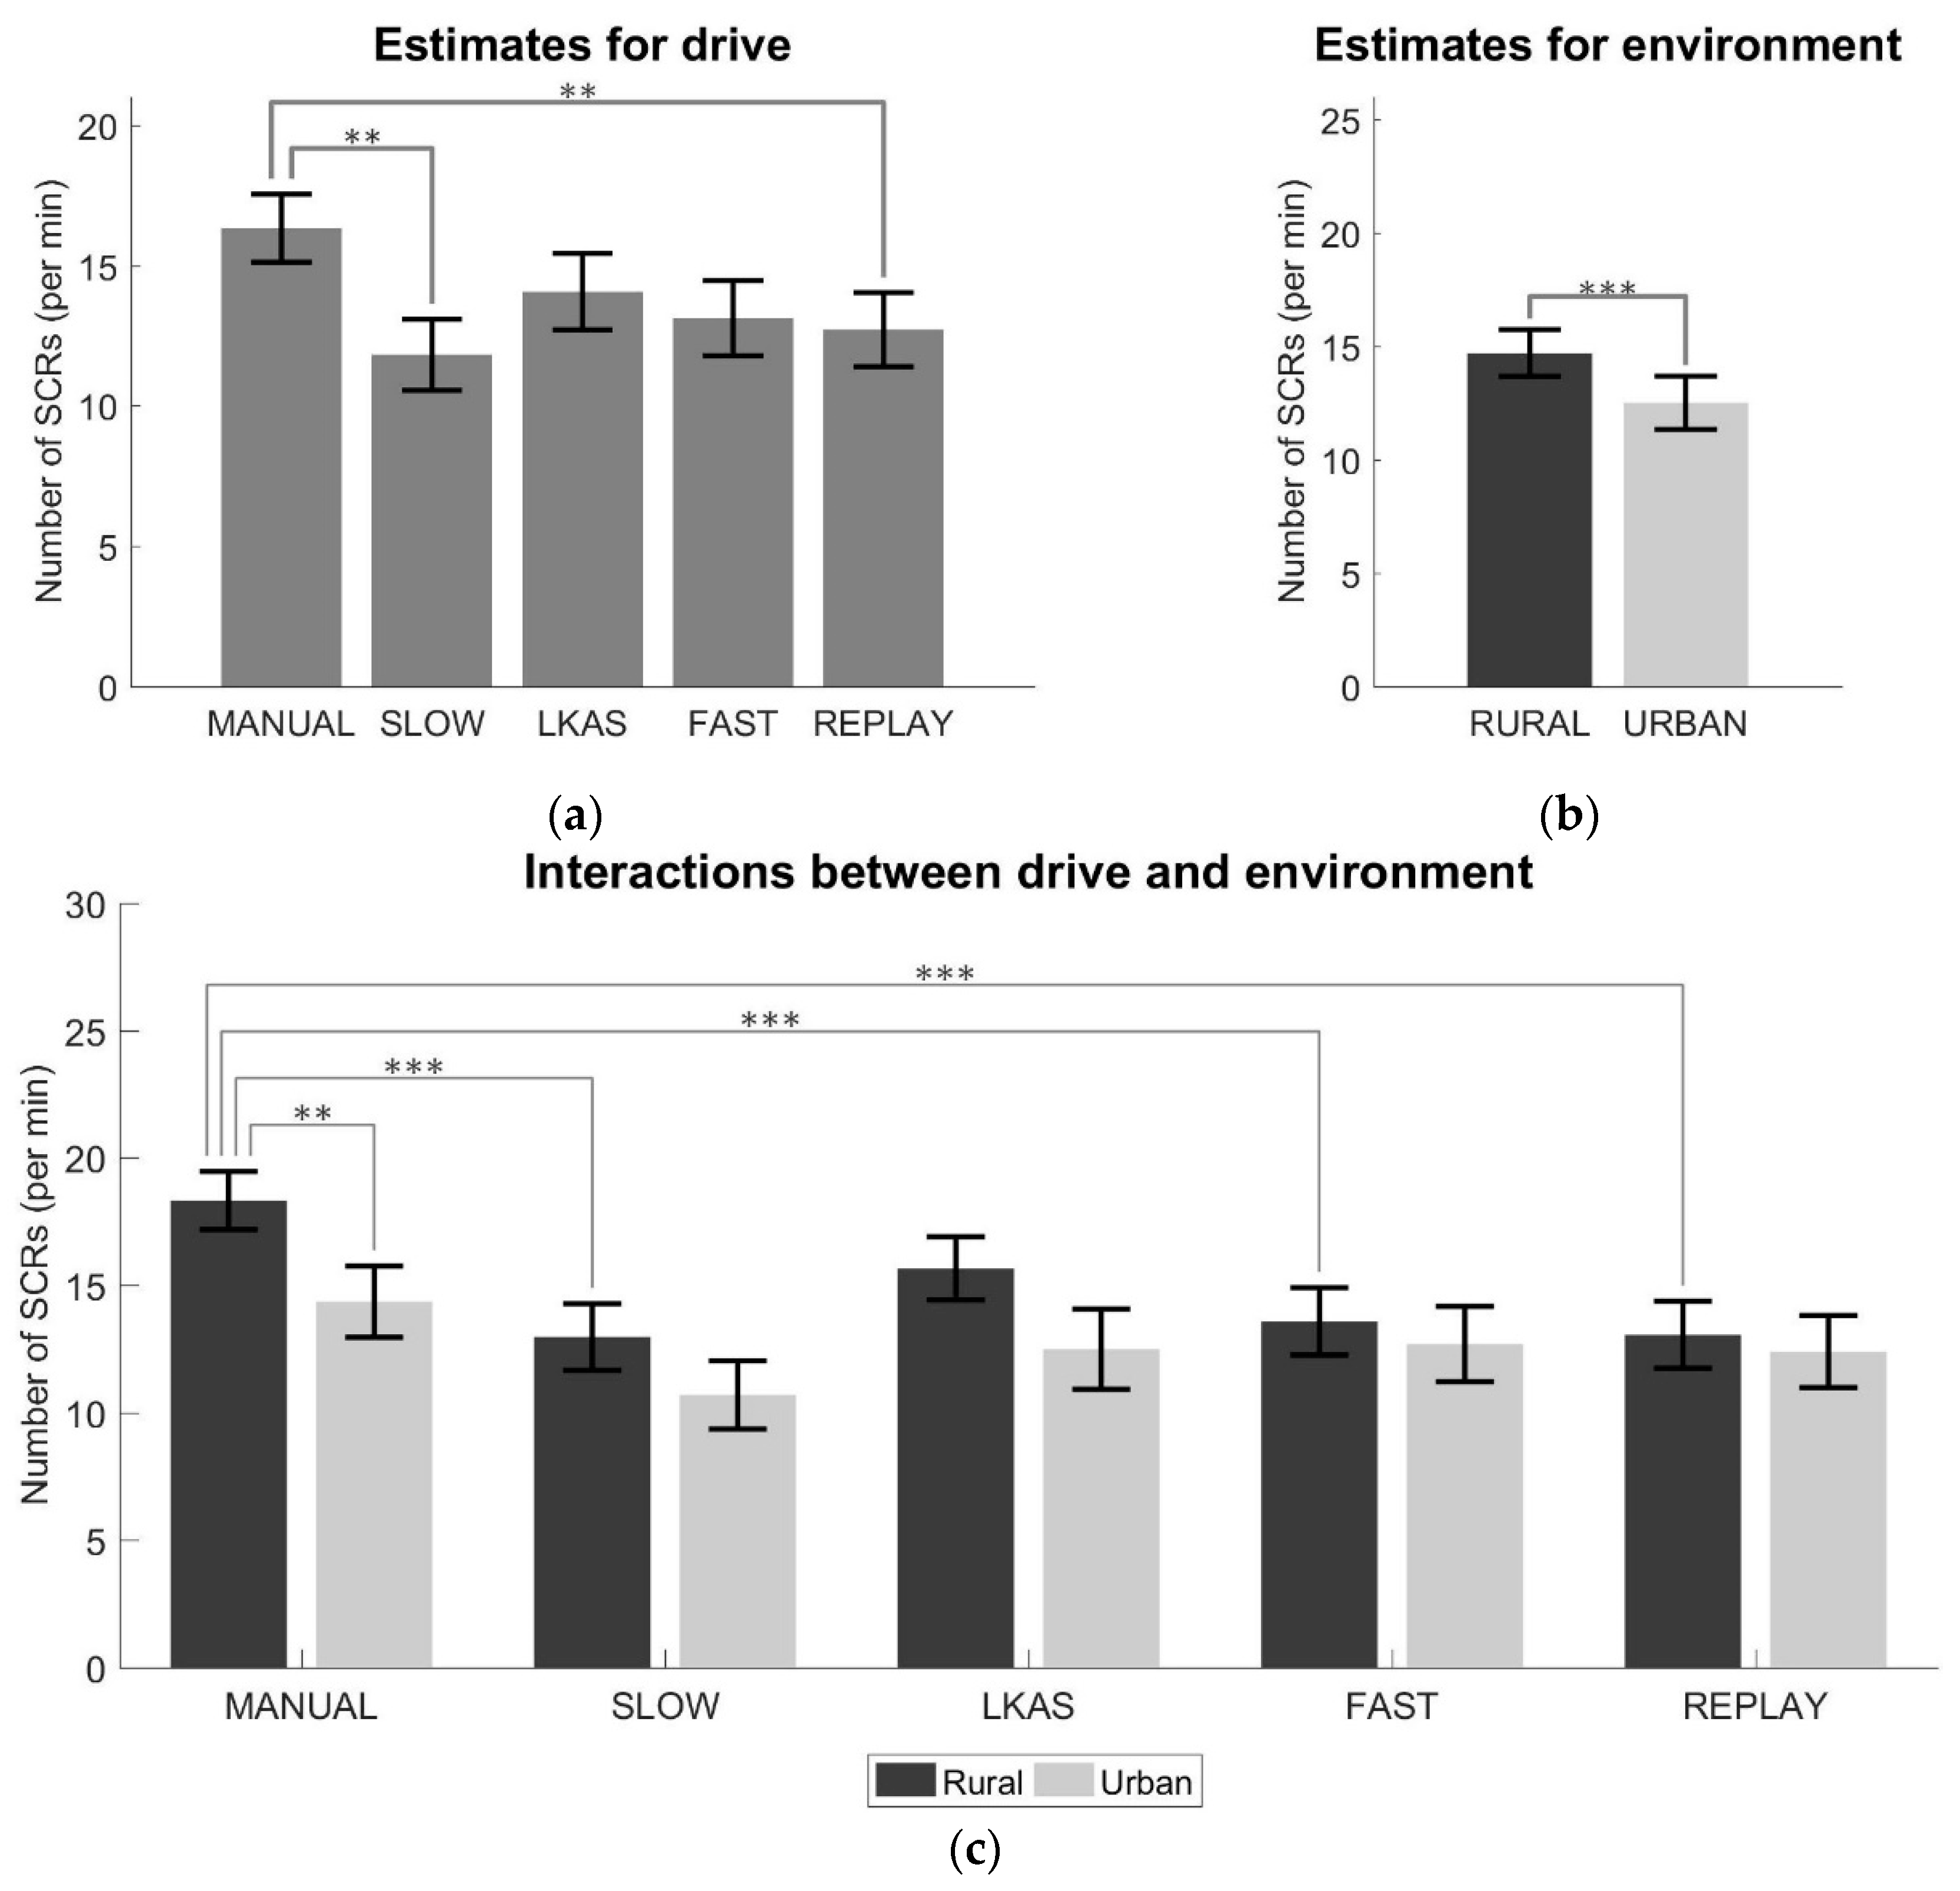
3.1. Physiological Metrics
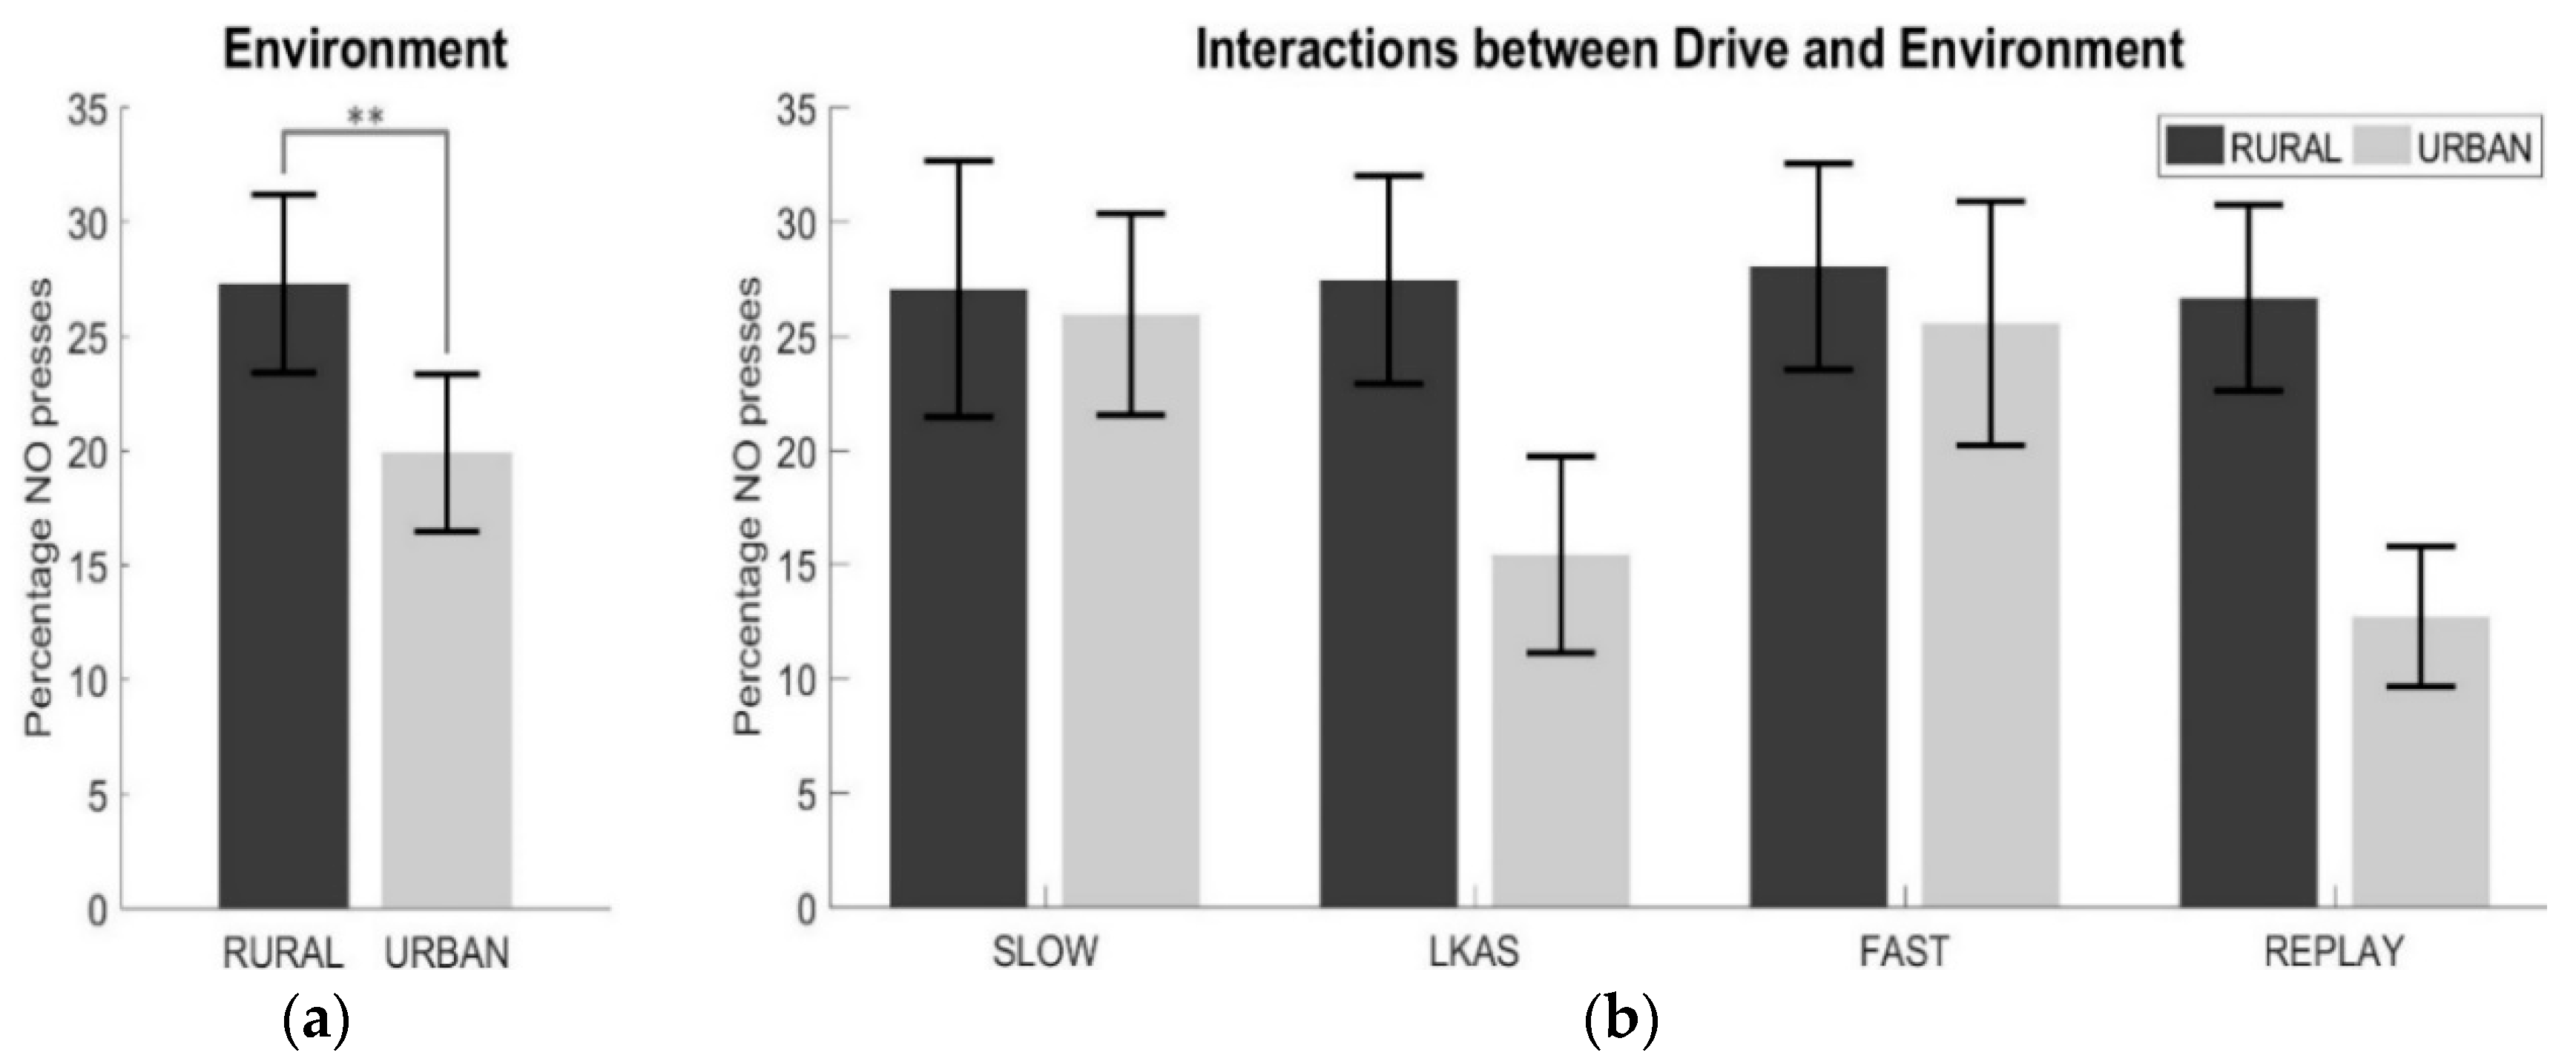
3.2. Subjective Discomfort Ratings (Button Presses)
4. Discussion and Conclusions
Author Contributions
Funding
Acknowledgments
Conflicts of Interest
References
- Taxonomy and Definitions for Terms Related to Driving Automation Systems for On-Road Motor Vehicles; SAE International: Warrendale, PA, USA, 2018; p. J3016.
- ERTRAC. Automated Driving Roadmap; European Road Transport Research Advisory Council: Brussels, Belgium, 2017. [Google Scholar]
- Carsten, O.; Martens, M.H. How can humans understand their automated cars? HMI principles, problems and solutions. Cogn. Technol. Work 2019, 21, 3–20. [Google Scholar] [CrossRef] [Green Version]
- Siebert, F.W.; Oehl, M.; Höger, R.; Pfister, H.R. Discomfort in Automated Driving—The Disco-Scale. In HCI International 2013—Posters’ Extended Abstracts; Stephanidis, C., Ed.; Communications in Computer and Information Science; Springer: Berlin/Heidelberg, Germany, 2013; Volume 374, ISBN 978-3-642-39476-8. [Google Scholar]
- Beggiato, M.; Hartwich, F.; Krems, J. Using Smartbands, Pupillometry and Body Motion to Detect Discomfort in Automated Driving. Front. Hum. Neurosci. 2018, 12, 338. [Google Scholar] [CrossRef] [PubMed]
- Slater, K. The assessment of comfort. J. Text. Inst. 1986, 77, 157–171. [Google Scholar] [CrossRef]
- Beggiato, M.; Hartwich, F.; Krems, J. Physiological correlates of discomfort in automated driving. Transp. Res. Part F Traffic Psychol. Behav. 2019, 66, 445–458. [Google Scholar] [CrossRef]
- Summala, H. Modelling driver behaviour in automotive environments. In Modelling Driver Behaviour in Automotive Environments: Critical Issues in Driver Interactions with Intelligent Transport Systems; Cacciabue, P.C., Ed.; Springer: London, UK, 2007; pp. 189–207. ISBN 978-1-84628-618-6. [Google Scholar]
- Cahour, B. Discomfort, affects and coping strategies in driving activity. In Proceedings of the ECCE 2008 (European Conference on Cognitive Ergonomics), Madeira, Portugal, 16–19 September 2008; pp. 45–53. [Google Scholar]
- Healey, J.A.; Picard, R.W. Detecting stress during real-world driving tasks using physiological sensors. IEEE Trans. Intell. Transp. Syst. 2005, 6, 156–166. [Google Scholar] [CrossRef] [Green Version]
- Wertheim, A.H.; Hogema, J.H. Thresholds, Comfort and Maximum Acceptability of Horizontal Accelerations Associated with Car Driving; TNO report TM-97-C003; TNO: Soesterberg, The Netherlands, 1997. [Google Scholar]
- Beard, G.F.; Griffin, M.J. Discomfort caused by low-frequency lateral oscillation, roll oscillation and roll-compensated lateral oscillation. Ergonomics 2013, 56, 103–114. [Google Scholar] [CrossRef] [Green Version]
- Martin, D.; Litwhiler, D. An investigation of acceleration and jerk profiles of public transportation vehicles. In Proceedings of the ASEE Annual Conference and Exposition, Pittsburgh, PA, USA, 22 June 2008. [Google Scholar]
- Vogel, H.; Kohlhaas, R.; von Baumgarten, R.J. Dependence of motion sickness in automobiles on the direction of linear acceleration. Eur. J. Appl. Physiol. Occup. Physiol. 1982, 48, 399–405. [Google Scholar] [CrossRef]
- Moon, S.; Yi, K. Human driving data-based design of a vehicle adaptive cruise control algorithm. Veh. Syst. Dynam. 2008, 46, 661–690. [Google Scholar] [CrossRef]
- Bae, I.; Moon, J.; Seo, J. Toward a comfortable driving experience for a self-driving shuttle bus. Electronics 2019, 8, 943. [Google Scholar] [CrossRef] [Green Version]
- Bosetti, P.; Da Lio, M.; Saroldi, A. On the human control of vehicles: An experimental study of acceleration. Eur. Transp. Res. Rev. 2014, 6, 157–170. [Google Scholar] [CrossRef] [Green Version]
- Levison, W.H.; Campbell, J.L.; Kludt, K.; Bittner, A.; Harwood, D.W.; Hutton, J.; Gilmore, D.; Howe, J.G.; Chrstos, J.P.; Allen, R.W.; et al. Development of a Driver Vehicle Module for the Interactive Highway Safety Design Model; FHWA report FHWA-HRT-08-019; Federal Highway Administration: McLean, VA, USA, 2007. [Google Scholar]
- Powell, J.P.; Palacín, R. Passenger Stability Within Moving Railway Vehicles: Limits on Maximum Longitudinal Acceleration. Urban Rail Transit 2015, 1, 95–103. [Google Scholar] [CrossRef] [Green Version]
- Eriksson, J.; Svensson, L. Tuning for Ride Quality in Autonomous Vehicle Application to Linear Quadratic Path Planning Algorithm; Uppsala University: Uppsala, Sweden, 2015. [Google Scholar]
- Thakurta, K.; Koester, D.; Bush, N.; Bachle, S. Evaluating Short and Long Term Seating Comfort; SAE Technical Paper 950144; SAE International: Warrendale, PA, USA, 1995. [Google Scholar]
- Myers, A.M.; Paradis, J.A.; Blanchard, R.A. Conceptualizing and Measuring Confidence in Older Drivers: Development of the Day and Night Driving Comfort Scales. Arch. Phys. Med. Rehabil. 2008, 89, 630–640. [Google Scholar] [CrossRef] [PubMed]
- Mehler, B.; Reimer, B.; Coughlin, J.; Dusek, J. Impact of Incremental Increases in Cognitive Workload on Physiological Arousal and Performance in Young Adult Drivers. Transp. Res. Rec. J. Transp. Res. Board 2009, 2138, 6–12. [Google Scholar] [CrossRef]
- Lal, S.K.L.; Craig, A. Driver fatigue: Electroencephalography and psychological assessment. Psychophysiology 2002, 39, 313–321. [Google Scholar] [CrossRef] [PubMed]
- McCarthy, C.; Pradhan, N.; Redpath, C.; Adler, A. Validation of the Empatica E4 wristband. In Proceedings of the 2016 IEEE EMBS International Student Conference (ISC), Ottawa, ON, Canada, 29–31 May 2016; Institute of Electrical and Electronics Engineers Inc.: Piscataway, NJ, USA, 2016; pp. 1–4. [Google Scholar] [CrossRef]
- Kranjec, J.; Beguš, S.; Geršak, G.; Drnovšek, J. Non-contact heart rate and heart rate variability measurements: A review. Biomed. Signal Process. Control 2014, 13, 102–112. [Google Scholar] [CrossRef]
- Mehler, B.; Reimer, B.; Wang, Y. A comparison of heart rate and heart rate variability indices in distinguishing single-task driving and driving under secondary cognitive workload. In Proceedings of the Proceedings of the Sixth International Driving Symposium on Human Factors in Driver Assessment, Training and Vehicle Design, Olympic Valley, CA, USA, 27–30 July 2011; Public Policy Center, University of Iowa: Iowa City, IA, USA, 2011; pp. 590–597. [Google Scholar]
- Orsila, R.; Virtanen, M.; Luukkaala, T.; Tarvainen, M.; Karjalainen, P.; Viik, J.; Savinainen, M. Perceived mental stress and reactions in heart rate variability—A pilot study among employees of an electronics company. Int. J. Occup. Saf. Ergon. 2008, 14, 275–283. [Google Scholar] [CrossRef]
- Cinaz, B.L.; Marca, R.; Arnrich, B.; Tröster, G. Monitoring of mental workload levels during an everyday life office-work scenario. Personal and Ubiquitous Computing 2013, 17, 229–239. [Google Scholar] [CrossRef]
- Braithwaite, J.J.; Watson, D.G.; Jones, R.; Rowe, M. A Guide for Analysing Electrodermal Activity & Skin Conductance Responses (SCRs) for Psychophysiological Experiments; Behavioural Brain Sciences Centre, University of Birmingham: Birmingham, UK, 2015. [Google Scholar]
- Dawson, M.E.; Schell, A.M.; Filion, D.L. The Electrodermal System. In Handbook of Psychophysiology, 4th ed.; Cacioppo, J.T., Tassinary, L.G., Berntson, G.G., Eds.; Cambridge University Press: Cambridge, UK, 2016; pp. 159–181. ISBN 9781107415782. [Google Scholar]
- Foy, H.J.; Chapman, P. Mental workload is reflected in driver behaviour, physiology, eye movements and prefrontal cortex activation. Appl. Ergon. 2018, 73, 90–99. [Google Scholar] [CrossRef]
- Hajiseyedjavadi, F.; Merat, N.; Romano, R.; Paschalidis, E.; Boer, E. Effect of Environmental and Individual Differences on Subjective Evaluation of Human-Like and Conventional Automated Vehicle Controllers. 2020; Unpublished work. [Google Scholar]
- Louw, T.; Hajiseyedjavadi, F.H.; Jamson, H.; Romano, R.; Boer, E.; Merat, N. The Relationship between Sensation Seeking and Speed Choice in Road Environments with Different Levels of Risk. In Proceedings of the Tenth International Driving Symposium on Human Factors in Driver Assessment, Training and Vehicle Design, Santa Fe, NM, USA, 24–27 June 2019; pp. 29–35. [Google Scholar]
- Boer, E.R. Satisficing Curve Negotiation: Explaining Drivers’ Situated Lateral Position Variability. IFAC-PapersOnLine 2016, 49, 183–188. [Google Scholar] [CrossRef]
- Laborde, S.; Mosley, E.; Thayer, J.F. Heart rate variability and cardiac vagal tone in psychophysiological research—Recommendations for experiment planning, data analysis, and data reporting. Front. Psychol. 2017, 8, 213. [Google Scholar] [CrossRef] [Green Version]
- Tarvainen, M.P.; Niskanen, J.P.; Lipponen, J.A.; Ranta-aho, P.O.; Karjalainen, P.A. Kubios HRV—Heart rate variability analysis software. Comput. Methods Prog. Biomed. 2014, 113, 210–220. [Google Scholar] [CrossRef] [PubMed]
- Kikhia, B.; Stavropoulos, T.G.; Andreadis, S.; Karvonen, N.; Kompatsiaris, I.; Sävenstedt, S.; Pijl, M.; Melander, C. Utilizing a wristband sensor to measure the stress level for people with dementia. Sensors 2016, 16, 1989. [Google Scholar] [CrossRef] [PubMed] [Green Version]
- Benedek, M.; Kaernbach, C. A continuous measure of phasic electrodermal activity. J. Neurosci. Methods 2010, 190, 80–91. [Google Scholar] [CrossRef] [PubMed] [Green Version]
- Blanca, M.J.; Alarcón, R.; Arnau, J.; Bono, R.; Bendayan, R. Datos no normales: ¿es el ANOVA una opción válida? Psicothema 2017, 29, 552–557. [Google Scholar] [CrossRef]
- Mourant, R.R.; Thattacherry, T.R. Simulator sickness in a virtual environments driving simulator. In Proceedings of the XIVth Triennial Congress of the International Ergonomics Association and 44th Annual Meeting of the Human Factors and Ergonomics Association, Ergonomics for the New Millennium, San Diego, CA, USA, 29 July 2000; SAGE Publications: Los Angeles, CA, USA, 2000; pp. 534–537. [Google Scholar]
- Johnson, M.J.; Chahal, T.; Stinchcombe, A.; Mullen, N.; Weaver, B.; Bédard, M. Physiological responses to simulated and on-road driving. Int. J. Psychophysiol. 2011, 81, 203–208. [Google Scholar] [CrossRef]
- Ekanayake, H.B.; Backlund, P.; Ziemke, T.; Ramberg, R.; Hewagamage, K.P.; Lebram, M. Comparing Expert Driving Behavior in Real World and Simulator Contexts. Int. J. Comput. Games Technol. 2013, 2013. [Google Scholar] [CrossRef] [Green Version]


| Segment | Obstacles | Environment | Speed Limit (mph) | Road Width (m) | Radius and Number of Curves 100 m 170 m 252 m 750 m | |||
|---|---|---|---|---|---|---|---|---|
| Segment 1 | - | rural | 60 | 7.3 | - | 2 | 3 | - |
| Segment 2 | 4 | rural | 60 | 5.8 | 1 | 4 | - | - |
| Segment 3 | 4 | urban | 40 | 7.3 | - | - | - | 5 |
| Segment 4 | - | rural | 60 | 5.8 | 1 | 4 | - | - |
| Segment 5 | 6 | urban | 40 | 7.3 | - | - | - | 5 |
| MANUAL | SLOW | LKAS | FAST | REPLAY | |
|---|---|---|---|---|---|
| Rural | 3.42 | 2.34 | 3.48 | 3.20 | 3.42 |
| Urban | 0.74 | 0.47 | 0.45 | 0.57 | 0.74 |
| MANUAL | SLOW | LKAS | FAST | REPLAY | |
|---|---|---|---|---|---|
| Rural | 2.27 | 1.38 | 1.71 | 2.13 | 2.27 |
| Urban | 0.66 | 0.83 | 0.19 | 0.83 | 0.66 |
© 2020 by the authors. Licensee MDPI, Basel, Switzerland. This article is an open access article distributed under the terms and conditions of the Creative Commons Attribution (CC BY) license (http://creativecommons.org/licenses/by/4.0/).
Share and Cite
Radhakrishnan, V.; Merat, N.; Louw, T.; Lenné, M.G.; Romano, R.; Paschalidis, E.; Hajiseyedjavadi, F.; Wei, C.; Boer, E.R. Measuring Drivers’ Physiological Response to Different Vehicle Controllers in Highly Automated Driving (HAD): Opportunities for Establishing Real-Time Values of Driver Discomfort. Information 2020, 11, 390. https://0-doi-org.brum.beds.ac.uk/10.3390/info11080390
Radhakrishnan V, Merat N, Louw T, Lenné MG, Romano R, Paschalidis E, Hajiseyedjavadi F, Wei C, Boer ER. Measuring Drivers’ Physiological Response to Different Vehicle Controllers in Highly Automated Driving (HAD): Opportunities for Establishing Real-Time Values of Driver Discomfort. Information. 2020; 11(8):390. https://0-doi-org.brum.beds.ac.uk/10.3390/info11080390
Chicago/Turabian StyleRadhakrishnan, Vishnu, Natasha Merat, Tyron Louw, Michael G. Lenné, Richard Romano, Evangelos Paschalidis, Foroogh Hajiseyedjavadi, Chongfeng Wei, and Erwin R. Boer. 2020. "Measuring Drivers’ Physiological Response to Different Vehicle Controllers in Highly Automated Driving (HAD): Opportunities for Establishing Real-Time Values of Driver Discomfort" Information 11, no. 8: 390. https://0-doi-org.brum.beds.ac.uk/10.3390/info11080390