A Study of Consumer Repurchase Behaviors of Smartphones Using Artificial Neural Network

Department of Industrial and Management, Kyonggi University, Suwon, Gyeonggi 443760, Korea
Information 2020, 11(9), 400; https://0-doi-org.brum.beds.ac.uk/10.3390/info11090400
Submission received: 6 August 2020
/
Revised: 17 August 2020
/
Accepted: 18 August 2020
/
Published: 19 August 2020
(This article belongs to the Special Issue Data Analytics and Consumer Behavior)
Abstract
:This study analyzed consumer intention to repurchase a smartphone, using an analysis of previous research and suggesting this as a research model. To this end, factors influencing “intention to repurchase” the smartphone were derived as social influence, consumer satisfaction, emotional loyalty, and habit. In addition, statistical analysis was conducted to investigate consumer repurchase intentions and the causal relationships. It is also possible to investigate whether consumer habits are linked to repurchases by analyzing their psychological inclinations; therefore, in this study, 390 people who repurchased a smartphone over the past two years were surveyed, and data were collected. This study analyzed the causal relationships among the factors using SPSS 24.0. Moreover, the causal relationship analysis was enhanced using the artificial neural network (ANN) algorithm. With multiple regression analysis and the ANN algorithm, consumer satisfaction (0.71), emotional loyalty (0.108), and social influence (0.062) were determined to affect the intention to repurchase. This means that the ANN algorithm can be used over multiple regression analysis and improve the results of the analysis. In addition, this study also provided practitioners with a way to improve their understanding of consumer behavior intention to repurchase smartphones.
1. Introduction
1.1. The Business Phenomenon
Google Insight and the global market research firm CCS predicted that 1.6 billion smartphones would be sold in 2016, with an increase to two billion sold by 2019. South Korea has the highest smartphone penetration rate at 92%, followed by Japan (64%), Germany (75%), the United States of America (USA) (78%), and the United Kingdom (UK) (77%).
With the penetration rate of smartphones being so high in the Korean market, it is more effective to motivate existing consumers to repurchase rather than to focus on new consumers and markets. According to Table 1 [1], smartphones (especially Samsung) have a very high market share, but consumers prefer to repurchase Apple’s iPhone over Samsung’s Galaxy.
Companies often pay large amounts of money to increase customer loyalty and lure customers away from their competitors. Verizon, a leading United States (US) telecommunications service provider, launched an unlimited plan as an aggressive marketing strategy to secure customers from competitors [2]. Other providers in the same industry, including T-Mobile, AT&T, and Sprint, offer smartphone installment plans and early termination fees to customers who switch from competitors to their services instead. Beyond that, many smartphone manufacturers offer marketing promotions that greatly reduce the purchase price of smartphones when customers sign up for more than two years of service through alliances with mobile communication service providers. In that way, each company actively implements marketing strategies in mature markets to protect their customers and attract those of competitors. After all, companies know that retaining existing customers is more profitable than finding new ones. Added to that, companies’ repurchase strategies often revolve around event promotion. Although all of those strategies can temporarily increase sales, there is a limit to maintaining sustainability. Therefore, companies conduct research on the capacity of various marketing strategies to prompt repurchases among existing customers. With advanced technology, consumers can easily find the products and services they want; however, from a business standpoint, differentiation is becoming more challenging. It is very difficult to create and provide products or services that are superior to competitors and that cannot be imitated in the actual business market. As a result, many companies must compete fiercely within the same market for consumers. In a saturated market, marketing costs often focus on retaining existing consumers rather than new ones; therefore, many companies recently adopted marketing strategies to secure their brand loyalty. It is very important to maintain consumer loyalty in order to increase profits in such a competitive market situation; research shows that, if the service industry reduces its consumer bounce rate by 5%, profits will increase by 25–85% [3]. In other words, from a marketing standpoint, research indicates that managing relationships with existing consumers is more efficient than attracting new consumers and that consumer loyalty is positively related to corporate profit [4,5].
Smartphones have a faster repurchase cycle than other electronic devices; consumer-friendly smart devices (like smartphones) have a lifecycle of only 2.77 years [6]. Because smartphones are used more frequently and consumed more quickly than other electronic devices, it is very important to analyze the factors affecting repurchase intention of this product with a short repurchase cycle. Thus, this study analyzes factors affecting the repurchase of smartphones by South Korean consumers, using the artificial neural network algorithm.
1.2. Research Questions
The research began with the following questions: “Why do consumers repurchase smartphones?” and “What factors affect consumer behaviors of smartphone repurchase?” Thus, this study examined the repurchase factors that influence consumers when they repurchase a smartphone, through the following questions:
- What are the factors that affect smartphone repurchase?
- How does consumer recognition of smartphone brand relate to consumer satisfaction and purchasing habits (continuous intention to use)?
- What do the quality and ease of use, as perceived by consumers, have to do with consumer satisfaction and purchasing habits?
2. Theoretical Background
2.1. Theory of Reasoned Action (TRA)
One of the most important areas of consumer psychology and behavior research is the relationship between consumer attitudes and behaviors. One theory explaining consumer attitudes and intentions to use a product is the theory of reasoned action (TRA). The TRA suggests that consumers carefully consider the consequences of various behaviors before acting [7]. In other words, consumer behavior is under voluntary control; thus, consumer behaviors can be predicted via their intentions [7]. In addition, the TRA considers subjective norms, in comparison with other models that explain consumer attitudes. Consumers consider the costs of performing their actions and the benefits that may arise as a result of the action before choosing the action that is the most beneficial/least costly [8,9].
2.2. Heuristics Theory
Heuristic thinking refers to intuitive thinking through experience, rather than analyzing conclusions based on rational thinking [10]; in other words, it involves bias. A heuristic involves satisfaction with “bounded rationality” rather than pursuit of an impossible real rationality [11]. According to heuristics theory, many consumers make decisions based on habits, beliefs, or by following others’ decisions, as these approaches are simpler and avoid complications.
This study adopted the heuristics theory as a basis from which to study consumer habit.
2.3. Artificial Neural Network (ANN)
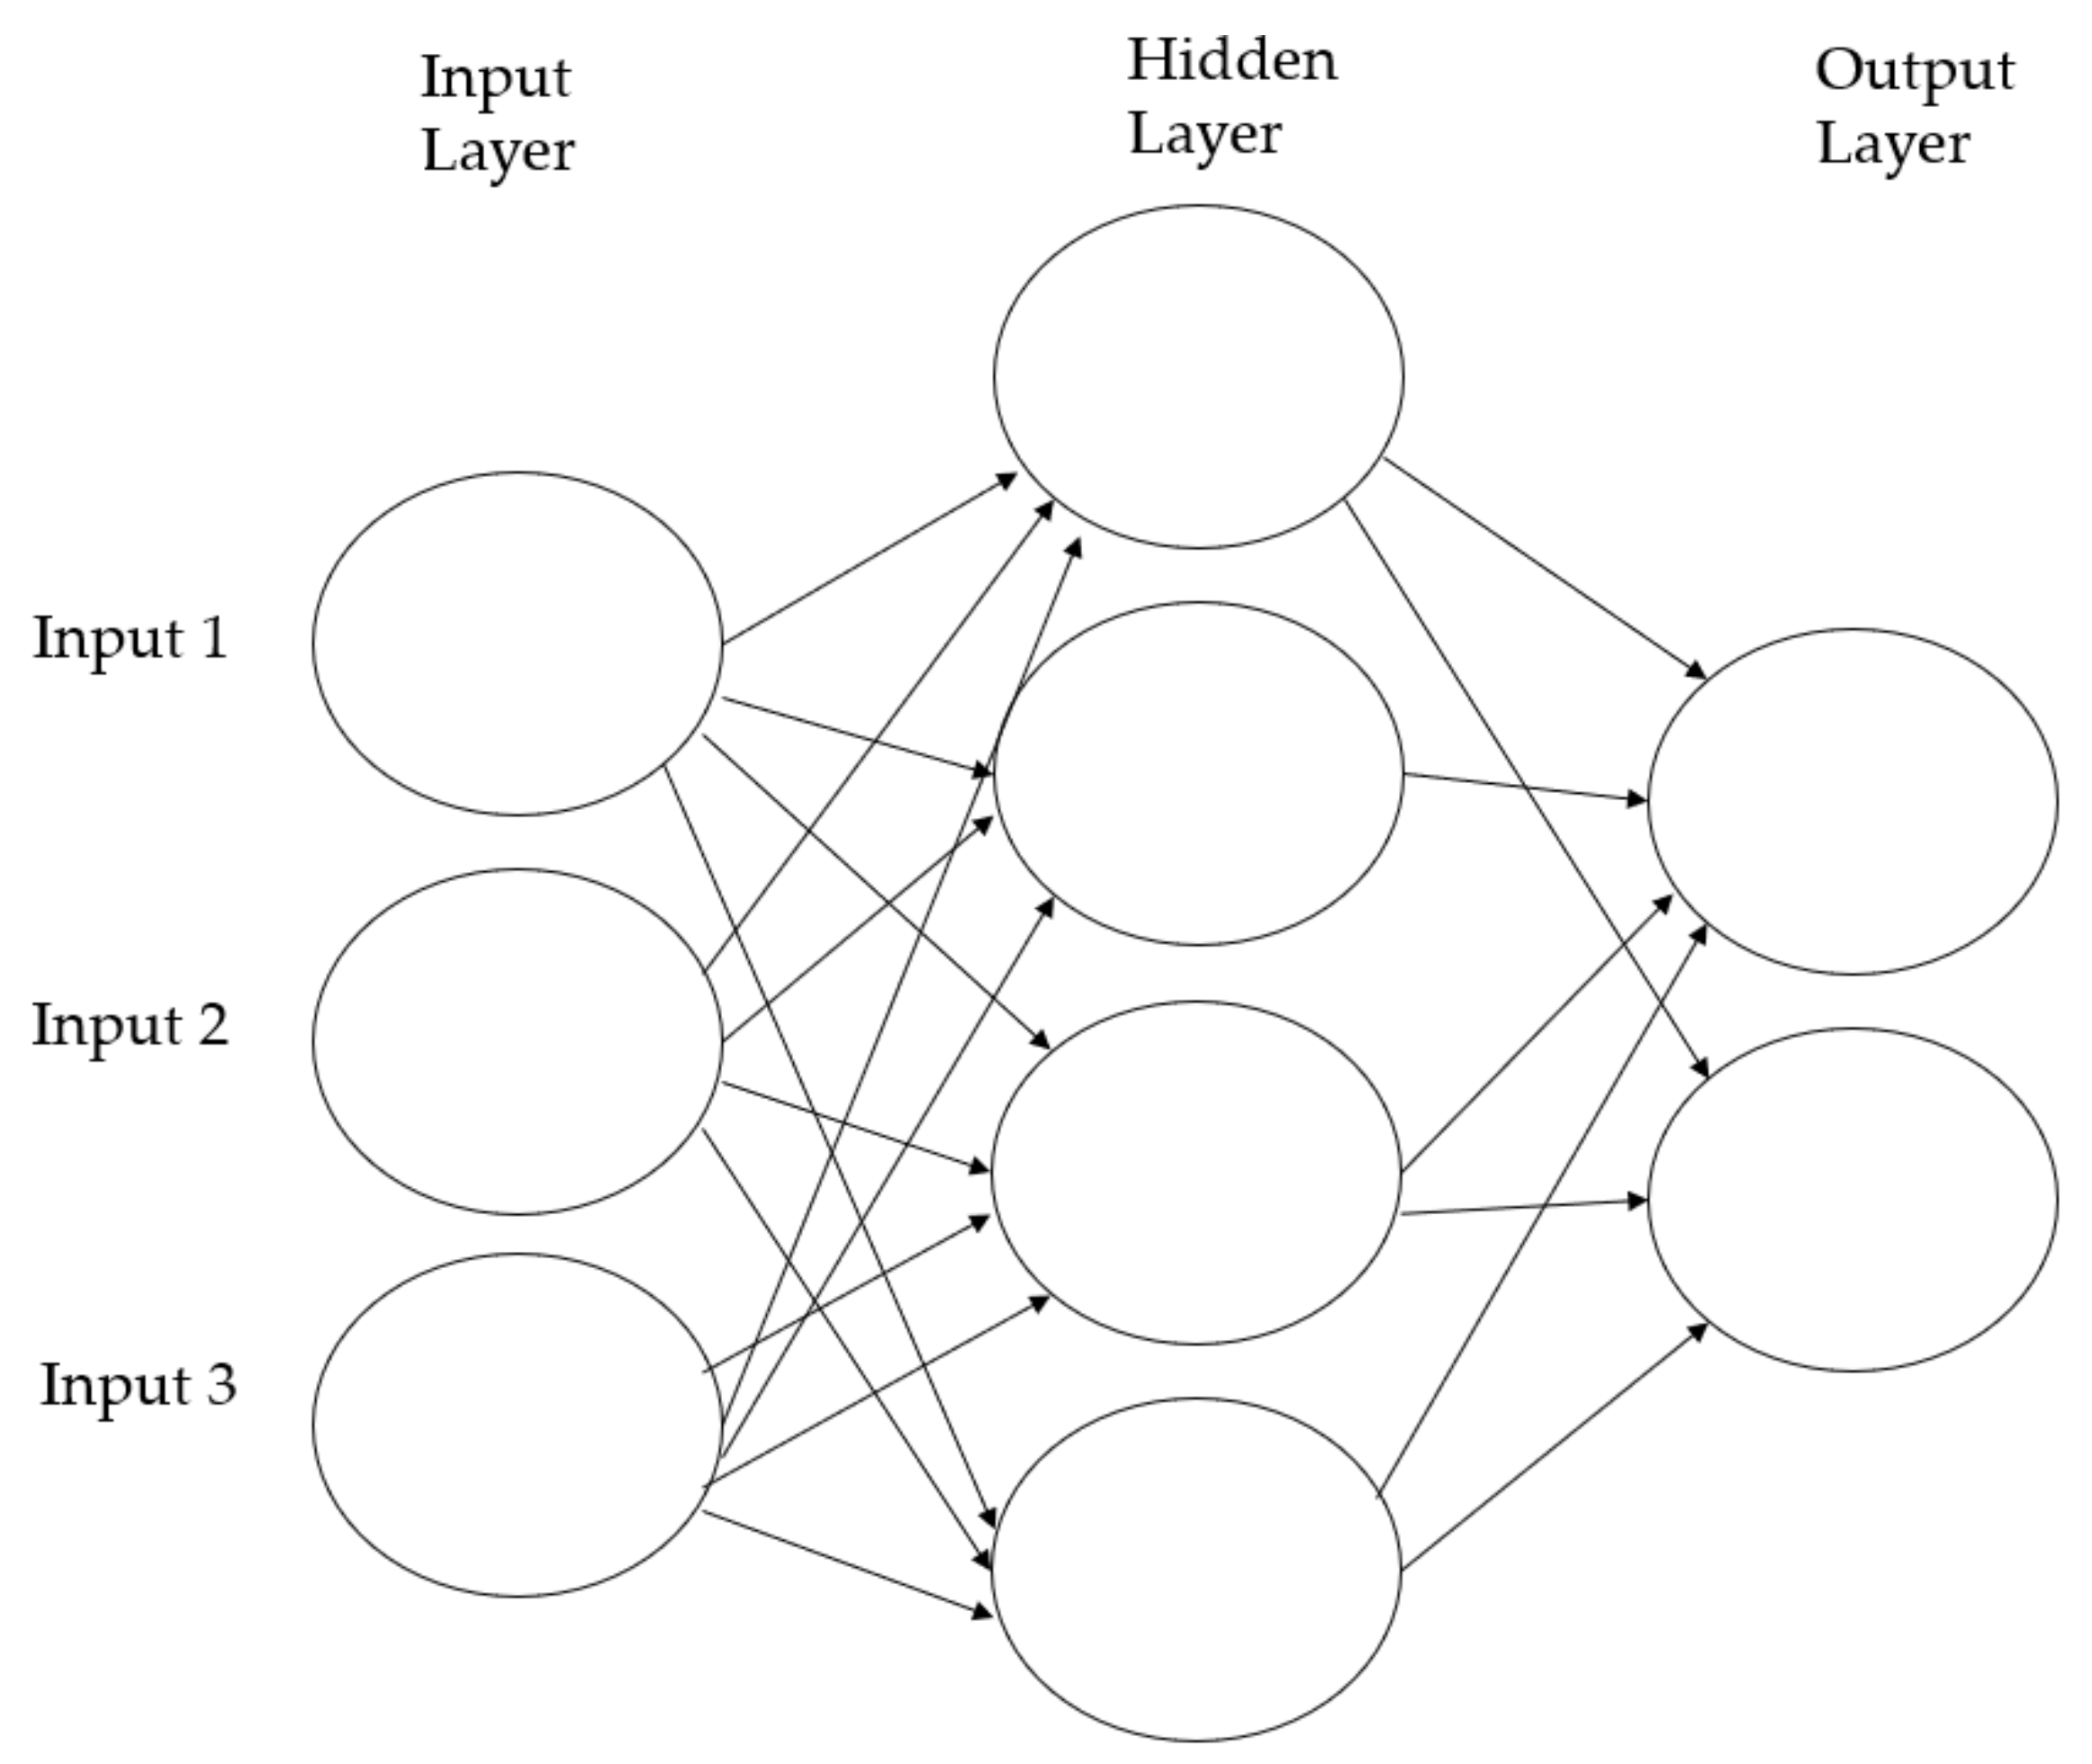
An artificial neural network (ANN) can be defined as an array of highly connected basic processors called neurons. As shown in Figure 1, the multilayer perceptron (MLP) has the same hierarchical structure as a neural network, with at least one intermediate layer between the input layer and the output layer. The MLP has a structure similar to a single-layer perceptron, but it improves the network ability by nonlinearizing the input and output characteristics of the intermediate layer and of each unit, thus overcoming the various disadvantages of the single-layer perceptron. In other words, as the number of layers increases, the properties of the MLP are more enhanced [12].
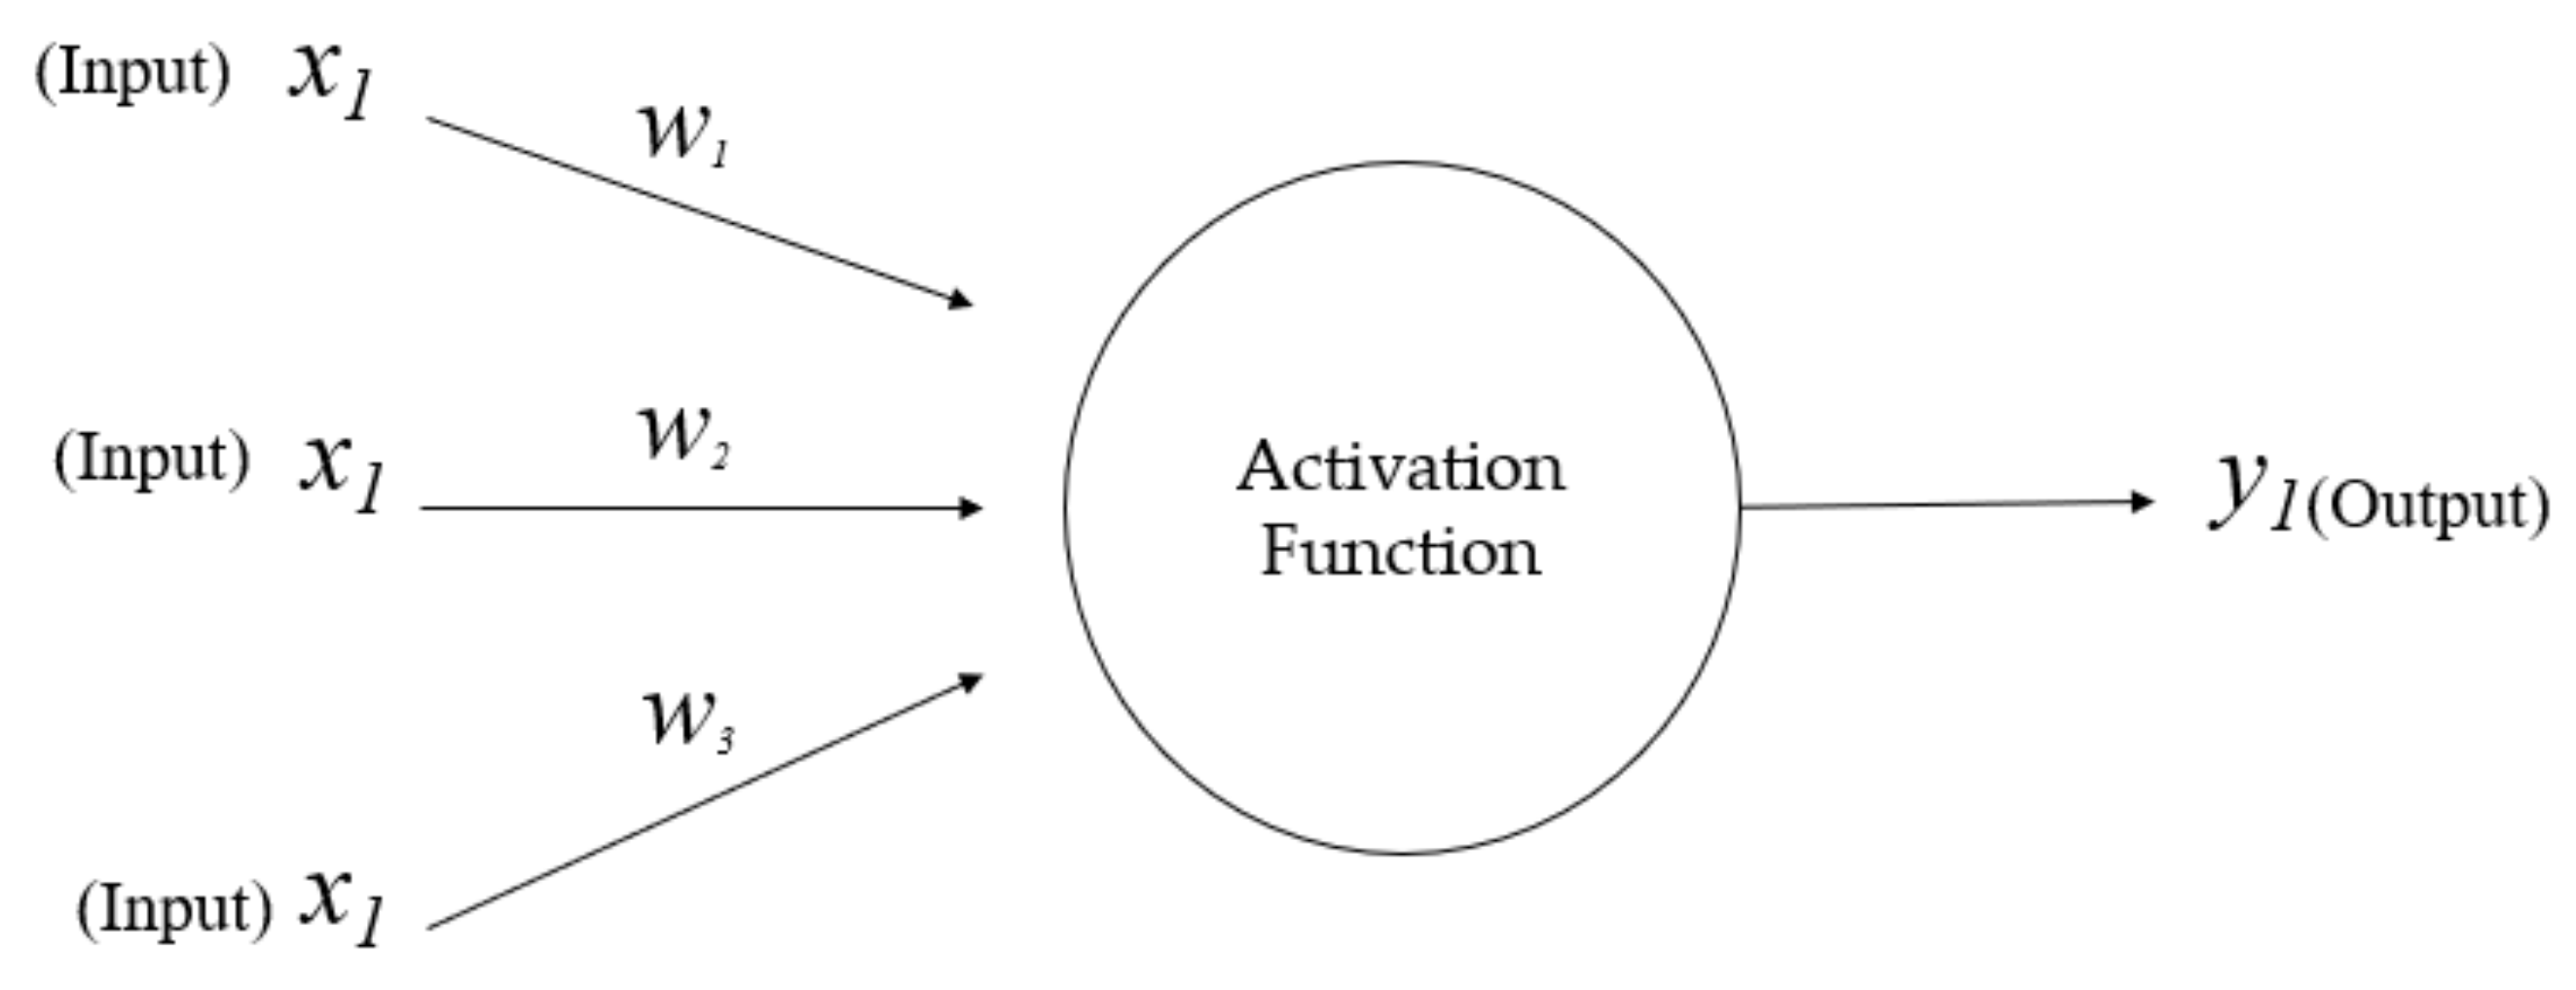
X1, X2, and X3 have weights W1, W2, and W3 associated with these inputs. The output Y of the neuron is calculated as shown in Figure 2. The function f is nonlinear and is called the activation function. The purpose of the activation function is to introduce nonlinearity into the output of a neuron, which is important because most real-world data are nonlinear [12].
3. Literature Review
3.1. Intention to Repurchase
Researchers give a great deal of attention to consumer intentions to repurchase. Henkel et al. (2006) concluded that satisfied consumers have increased service usage levels and increased intentions of future usage [13]; moreover, while examining the importance of satisfaction, Cronin, Brady, and Hult (2000) discovered that consumer satisfaction and repurchase intentions can be increased by offering added value and quality services [14]. Repurchasing and the factors that influence it were investigated by many scholars [15,16,17,18,19,20]. Repurchasing behavior is defined as a consumer’s actual behavior of purchasing the same product or service on more than one occasion. The majority of consumer purchases are repeat purchases [21]. Consumers often repeatedly buy similar products from similar sellers, and most purchases represent a series of events rather than a single isolated event. Retention is another common term for repurchase [22,23,24], which is considered to be one of the most important variables in relationship marketing [25]. Repurchase is the actual behavior of the consumer; however, intention to repurchase is defined as the consumer’s decision to participate in future activities [26].
3.2. Factors Assumed to Affect the Intention to Repurchase
It can be inferred that keeping existing consumers is more important than attracting new consumers in a competitive environment such as the smartphone market. Most marketing research focuses on consumer satisfaction and consumer intention to use products and services, with the assumption that consumer satisfaction indicates repurchase. However, it is essential to study a variety of consumer behaviors in order to more comprehensively understand consumer repurchase behaviors; therefore, it is necessary to examine factors that deviate from consumer satisfaction-centered repurchasing research. Thus, this study analyzes other factors affecting intention to repurchase.
3.3. Consumer Satisfaction
Oliver (1997) found that consumer satisfaction differs from the joy experienced when purchasing products or services [27], and their expectations were anticipated to be better than their experiences. In addition, the study found that consumer satisfaction is reflected in the evaluation of one’s emotions about a product or service. Rust, Zahorik, and Keiningham (1995) showed that consumer satisfaction (a consumer’s willingness to revisit or recommend) has a strong impact on loyalty [28]. They also found that consumer satisfaction is influenced by various aspects (product, service quality, store attributes, and corporate marketing activities). Wen et al. (2011) suggested that satisfaction positively affects online repurchase intention [29].
3.4. Social Influence
Social influence is regarded as a critical element in decision-making by people in sociology and in behavioral science. In this study, social influence refers to the extent to which people’s social networks influence their behaviors [30]—i.e., the ways in which a person’s beliefs, attitudes, thoughts, and actions change as a result of their social interactions [31]. This definition is rooted in social influence theory.
The TRA [7,9] suggests that a person’s behavioral intentions depend on their attitude toward the behavior, along with other subjective norms. A subjective norm is the influence had by the people in one’s social environment on one’s behavioral intentions (i.e., the perception of whether people who are important to them think that they should perform the behavior in question). The concept of subjective norms greatly influenced the formation of the measures of social influence in these two models, as well as many other studies. Venkatesh and Davis (2000) believed that, in voluntary settings, social influences are more likely to operate indirectly through utilitarian outcomes [32].
Currently, word of mouth—a form of social influence—as a marketing communication strategy is famous and globally characterized as a cost-effective and persuasive promotional tool [33].
3.5. Emotional Loyalty
Law, Hui, and Zhao (2004) [18] used Oliver’s definition of loyalty as “a deeply held commitment to rebuy or repatronize a preferred product/service consistently in the future, thereby causing repetitive same-brand or same-brand-set purchasing, despite situational influences and marketing efforts having the potential to cause switching behavior”. In other words, they viewed loyalty as a consumer attitude rather than a consumer behavior. Behavioral loyalty is solely viewed as a repurchase of the product or service. Dixon et al. (2005) found that loyal consumers are expected to consistently repurchase despite competitive efforts [34]. Emotional loyalty is the ultimate type of loyalty, in which consumers choose a particular brand because they have a personal connection with the brand, regardless of price, convenience, or other external factors. Attractive looks, novel materials, and atypical design technology bring positive emotions to consumers, thereby providing emotional value to them.
Arruda-Filho et al. (2010) recruited iPhone users for interviews and conducted a netnographic analysis that showed consumers may experience social value due to the possession and use of smartphones [35]. They found that consumers may think of iPhone ownership as a symbol of luxury and high social status [35]. In addition, sharing the experience of using smartphones also helps consumer interpersonal relationships. When consumers perceive higher social value from a product/brand, they show greater brand loyalty behaviors, such as disseminating positive information and paying premium prices [36]. Pihlström and Brush (2008) revealed that, when consumers perceive greater emotional value in a product/brand, they show more brand loyalty—as measured by repurchase intentions, willingness to pay, and positive word of mouth [37].
3.6. Habit
Because repetition is a central feature of everyday life, habit research is important for understanding consumer behaviors. Approximately 45% of people’s behaviors are repeated almost daily, usually in the same context [38]. Chiu et al. (2012) and Limayem and Cheung (2007) found that consumers tend to purchase products habitually [39,40].
Studies by Anderson and Sullivan (1993) and Jones and Sasser (1995) emphasized the need for extensive research on repurchase intentions [5,41]. In particular, research on consumer psychology actively seeks to secure long-term competitive advantages through favorable relationships between companies and consumers. In a number of previous studies, researchers suggested that, when consumer satisfaction (consumer empirical performance) increases with superior quality of products and services, consumers are more willing to return for purchase. Therefore, companies can expect to increase their sales and establish a sound consumer base by getting consumers to repurchase. Despite the importance of the intention to repurchase, most research focuses on consumer satisfaction, only one factor of that intent.
4. Research Hypotheses and Research Model
4.1. Research Hypotheses
Early studies of consumer behavior explored the relationship between repurchase and satisfaction; however, this relationship is not straightforward. Fornell (1992) studied positive correlations between consumer satisfaction and consumer retention [42]. Wen et al. (2011) found that satisfaction had a positive effect on online intention to repurchase [29]. Tsai, Huang, Jaw, and Chen (2006) discovered that satisfied consumers were more likely to continue their relationship with a particular organization than dissatisfied consumers [43]. This view is supported by many researchers [19,22,41,44,45,46,47,48,49,50]. However, Mittal and Kamakura (2001) found that the satisfaction–repurchase relationship could be disrupted due to three main reasons [19]. Additionally, Olson (2002) revealed that, despite the general view that satisfaction is associated with repurchase, few empirical studies associated satisfaction with actual repurchase behavior [51].
Kamakura (2001) pointed out that establishing a direct link between satisfaction assessment and repurchase behavior is not easy for many organizations [19]. In addition, the satisfaction–repurchase relationship can be influenced by various characteristics of the consumers. Despite equal ratings given on satisfaction, repurchase behavior differed significantly, which was attributed to differences in consumer age, education, marital status, sex, and residential area [19]. Many factors complicate satisfaction–repurchase relationships. The problem is that researchers do not consistently define the relationship across studies, which can be operationalized as behavior, attitude, or complex [52].
Consumer satisfaction can occur during different stages of the shopping process (before, during, and after), during the purchase of different types of goods (convenience, shopping, and specialty) [53], and in a traditional or online setting. In addition, different types of consumers exist [54], and they all have varying levels of knowledge about the product [55], which affects their level of satisfaction.
Understanding the importance of a comprehensive review, the study attempts to summarize previously reported findings in order to explain the complex relationship between satisfaction and repurchase. Knowledge of consumer satisfaction and their repurchase behavior will improve companies’ ability to develop more effective marketing strategies in the future [56]. Previous studies demonstrated that overall consumer satisfaction with services is strongly related to behavioral intent to reuse the same service provider [57]. Therefore, in this study, the following research hypothesis is established:
Hypothesis 1 (H1).
Consumer Satisfaction Positively Impacts Intention to Repurchase.
This work also studies the importance of social influence on repurchase intentions [58]. Social influence refers to actions, feelings, thoughts, attitudes, or behaviors related to individual change through interaction with other individuals or groups. In social psychology, it is often associated with the impact of social norms on changes in personal behavior and attitudes [59]. Purchase decisions are related to the need to be respected, and social value is derived by acquiring desirable social status [60]. Some observations were made that consumers do not shop alone. Peers, families, and other groups strongly influence individual purchasing decisions. These reference groups do word-of-mouth marketing and can play an active role in influencing the opinions of others. That influence is sometimes negative or positive in terms of the interests of certain organizations [61].
Hypothesis 2 (H2).
Social Influence Positively Impacts Intention to Repurchase.
Emotional loyalty is behaviorally expressed by retention [59]. Furthermore, customer loyalty is well recognized as a significant driver of repurchase intention in the online marketing literature [62].
This emotional and affective connection influences consumer behavior (retention, brand repurchase, positive word of mouth) [63]. Brand loyalty is expressed as a tendency to continuously purchase the same brand [64].
Repurchase intentions are mostly tied with brand commitment, but there is an important difference between them. Brand commitment refers to the connection a consumer establishes with a brand, whereas repeat purchase is the purchase of a brand because it is relatively cheaper [65].
Loyal customers are the faithful consumers of a brand who perform repeat purchases and recommend the brand to those around. Firms want their customers to be attached to their brands by strong feelings. Customer satisfaction must be fulfilled for this kind of loyalty. When customers are satisfied, they show commitment to continually buy the same brand and become loyal [66].
Consumers who are committed to the brand become loyal consumers and show consistent repurchase behavior [67]. Therefore, loyalty may affect consumer repurchase behaviors [68]. Repurchase intentions are usually identified through brand commitment, but there are significant differences between the two concepts. Brand commitment means a similar relationship to the attachment that consumers develop for the brand. Therefore, in this study, the following research hypothesis is established based on previous studies:
Hypothesis 3 (H3).
Emotional Loyalty Positively Impacts Intention to Repurchase.
Research on habits is important for consumer behavior because repetition is a central feature of daily life. About 45% of people’s behavior is repeated almost daily and usually in the same context [69,70].
Prior research comparing TRA and related theories with habit as an antecedent of behavioral intentions showed that habit directly affects behavioral intentions [71,72,73]. Gefen (2000) noted that habitual previous preference to use an online shopping website directly and strongly increased user intentions to continue using the same online shopping website again [74]. Support for the role of habit in repeat purchase intention was provided by Gefen (2000) and Rauyruen and Miller (2009) [74,75].
Habitual behavior exhibits that repurchase is motivated by habit or routines that are facilitated in the decision-making process [76].
Khare and Inman (2006) realized that consumers either purchase the same brand repeatedly or only try new product types within the same brand, depending on the situation [77]. Research also found various types of habitual purchase patterns, such as purchasing various trademarks habitually according to one’s values [77]. Consumers tend to buy the same brands of products across different shopping experiences (e.g., Seetharaman, 2004) [78], purchase the same amounts at a given retail store across repeat visits [79], and eat similar types of foods at a meal each day (e.g., Khare & Inman, 2006) [77]. Thus, repetition—and, more specifically, habits—may characterize a significant segment of consumer behavior that can be linked to important marketing outcomes [38].
Anshari et al. (2016) examined the effect of habit on smartphone usage [80]. They found that there is a strong relationship between habit and smartphone usage. As there is a positive effect of habit on consumption behavior and smartphone usage, we think that there may also be a similar one between brand loyalty and re-purchase intention. Therefore, in this study, the following research hypothesis is established based on previous studies:
Hypothesis 4 (H4).
Consumer Habit Positively Impacts Intention to Repurchase.
4.2. Research Model
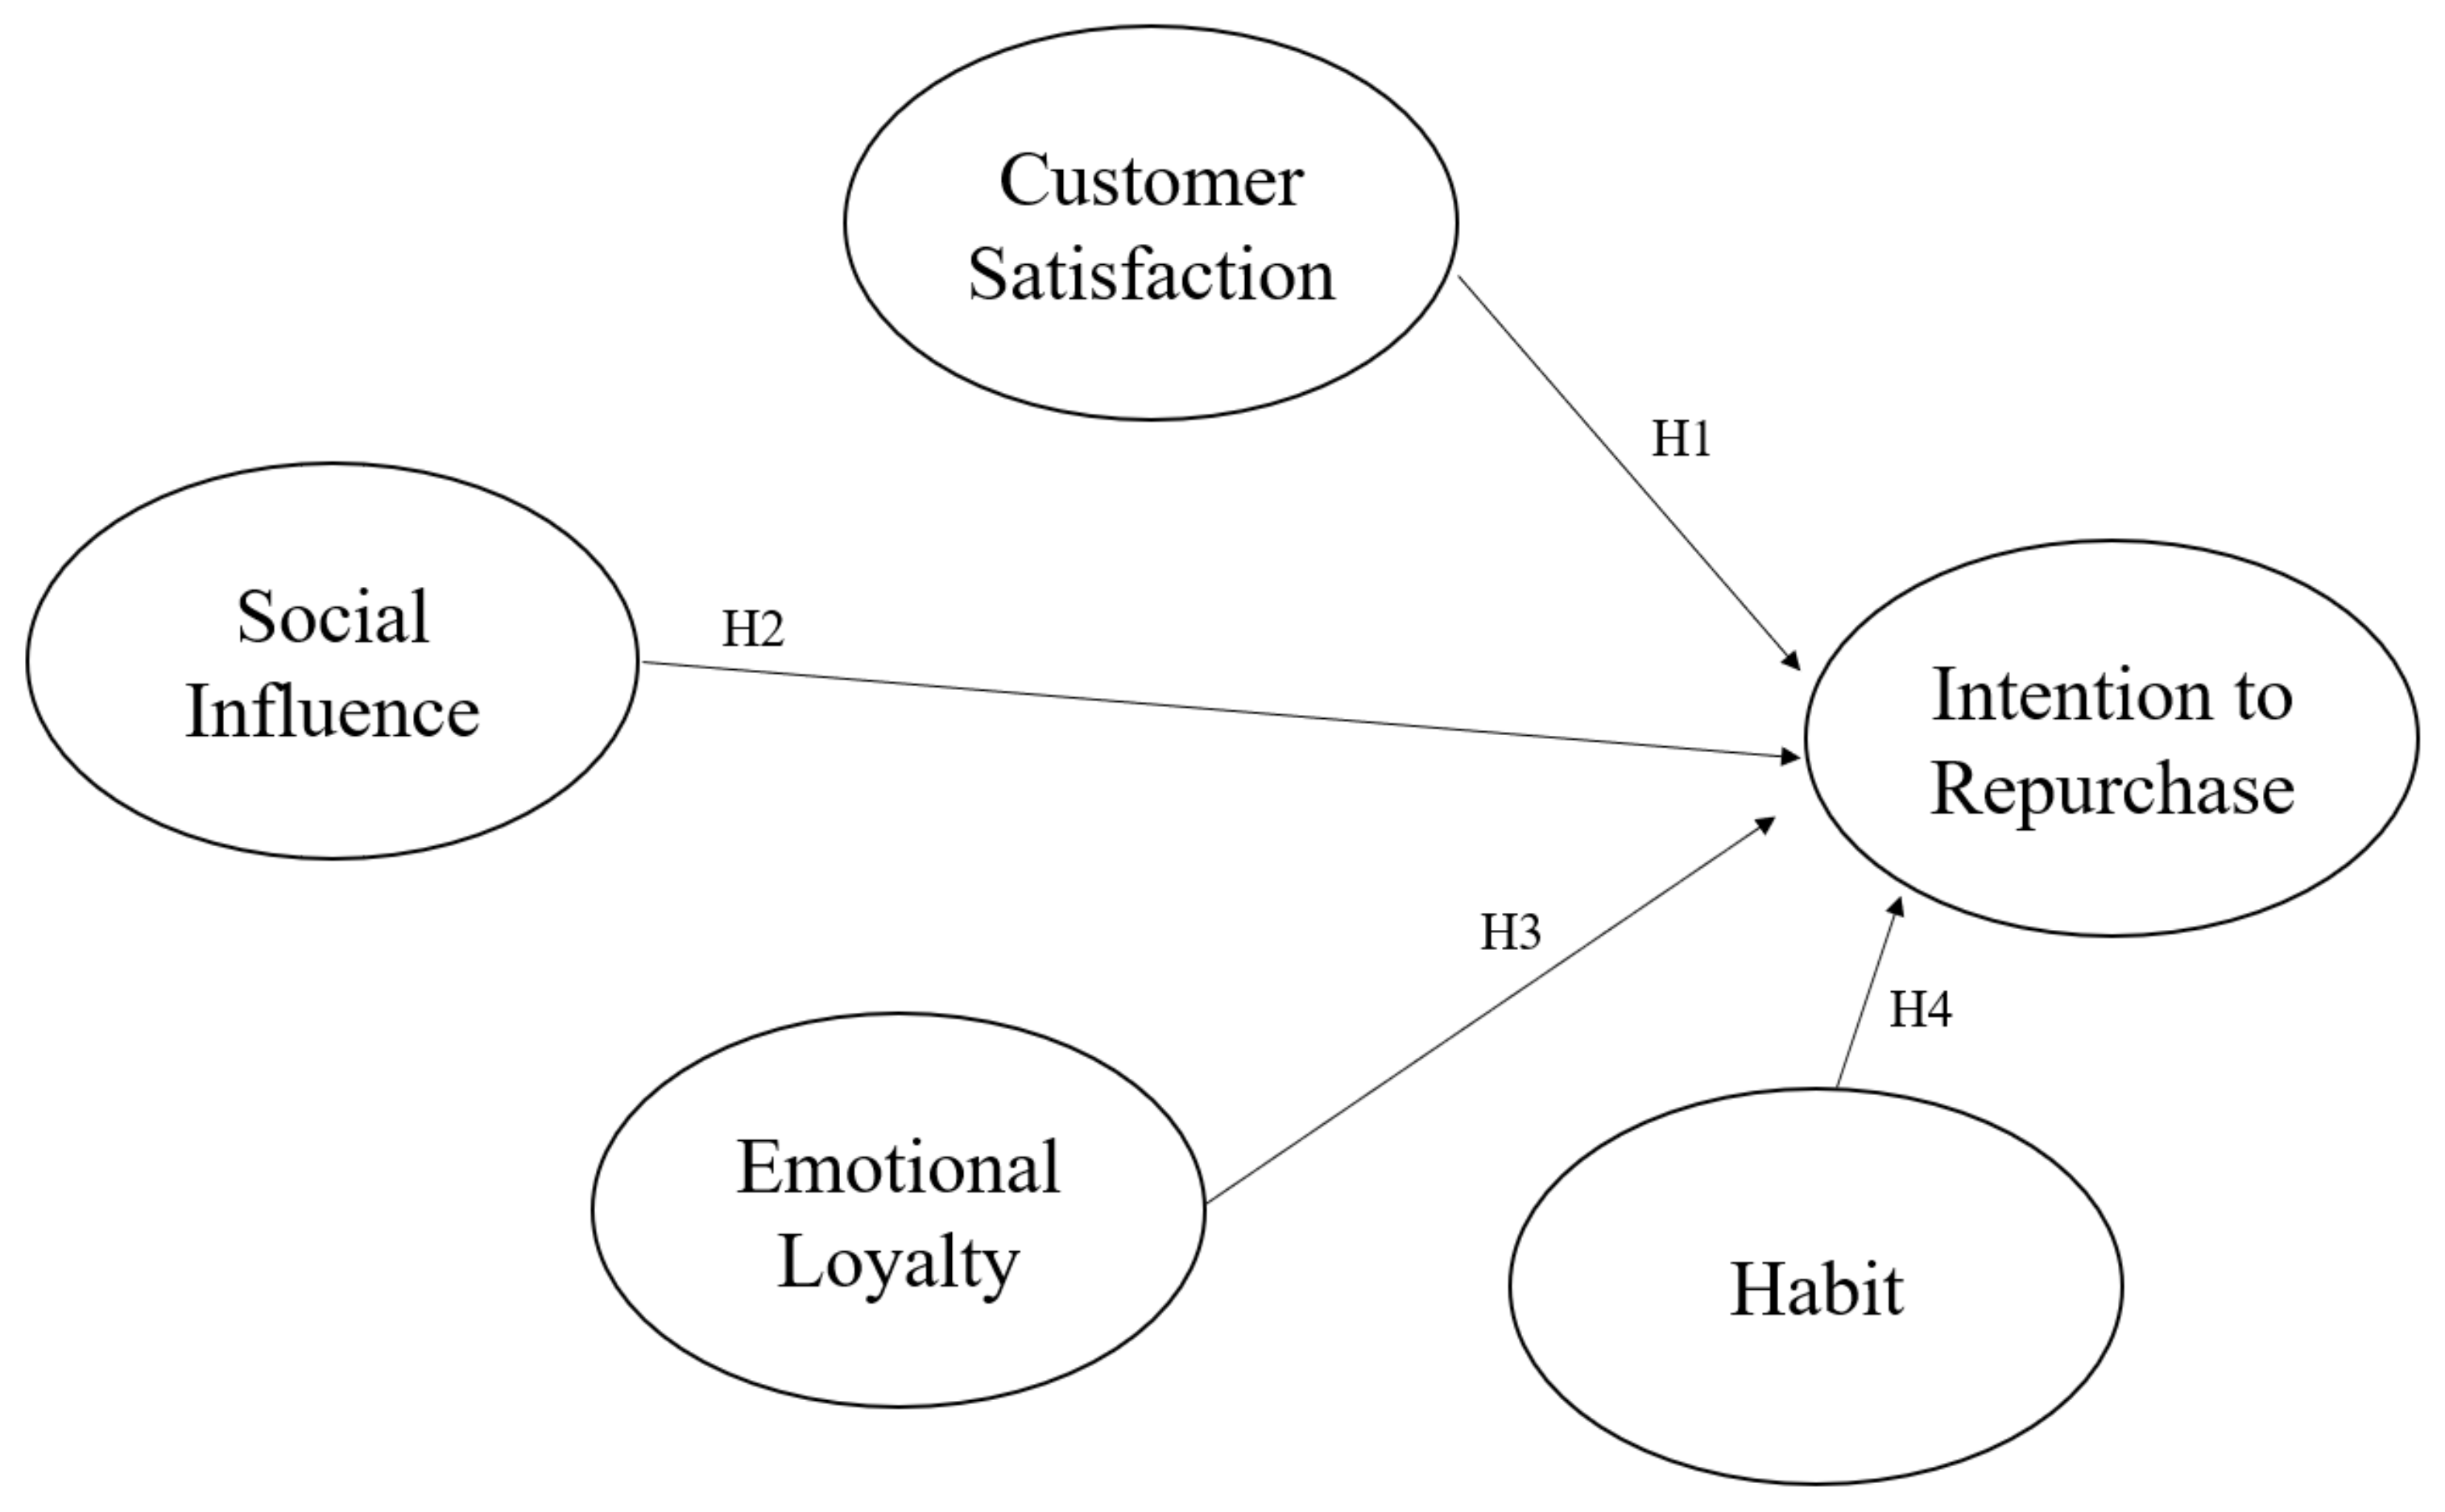
Previous research analyses suggested the research model and its components shown in Figure 3. To examine the experiences of consumers using the same brand of smartphone, the research model was developed based on five factors (consumer satisfaction, social influence, emotional loyalty, habit, and intention to repurchase). Relying on the research model, the analysis examined the effects of social influence, consumer satisfaction, emotional loyalty, and habits on the intention to repurchase smartphones.
5. Methodology for Data Collection, Data Analysis, and Measurement
5.1. Data Collection and Sample Size
To analyze the research model, this study collected data on intention to repurchase through surveys for consumers living in South Korea. According to the Pew Research Center (2018), a global market research organization, the country with the highest smartphone penetration rate is South Korea, with 94% of the population using smartphones [81]. Therefore, South Korea is a good market in which to analyze the characteristics of consumers who repurchase smartphones.
Although questionnaires were distributed to 1200 customers, only 390 responses were received and analyzed in order to test the hypotheses, as now mentioned in Section 5.1. Three hundred ninety consumers (n = 390) who repurchased smartphones within two years were included in this investigation. The study tested the research hypotheses and attempted to answer the research questions by developing a questionnaire as its research instrument. The items of each construct were adopted from previous literature. All of the items were measured on a five-point Likert scale, where 1 = strongly disagree and 5 = strongly agree. This study calculated the appropriate sample size for the analysis within the level statistical significance; in consideration of the current total population of South Korea, the smartphone penetration rate, the confidence level (95%), and the margin of error (5%), the appropriate sample size could be calculated as 385 people. Therefore, the sample (n = 390) in this study is an appropriate size for data analysis.
5.2. Measurement
This study analyzed the behavior of consumers; for this, the research used verified measurement items found in an analysis of previous research. And the results were summarized in Table 2.
In this study, 33 items were developed for the questionnaire to address the characteristics of the consumers. The final questionnaire had 17 questions, developed through a pilot test of 78 consumers.
5.3. Analysis
The descriptive statistics of the survey were analyzed using SPSS 24.0 to determine the means and standard deviations of the responses. A factor analysis and a reliability analysis (Cronbach’s α test) were conducted to analyze the validity and the reliability of the research variables. To analyze the causal relationship between the variables, the regression analysis model was enhanced by artificial neural network algorithms.
6. Data Analysis
6.1. Descriptive Statistics
In this study, the results of the descriptive statistics of the survey are presented in Table 3.
Table 4 presents the results that explain the characteristics of the respondents who participated in the survey. Male (49.5%) and female (50.5%) respondents participated in this survey in an equal ratio, and consumers who repurchased smartphones 2–5 times in the last two years accounted for more than 80% of all respondents.
6.2. Factor Analysis
In this study, factor analysis was based on the collected data. For factor analysis, maximum likelihood was used as the factor extraction method, and oblimin with Kaiser normalization was used as a factor rotation method [89,90]. In addition, factor analysis indicated that 17 observed variables could be clustered into five latent variables. The results of the factor analysis in this study were validated through the Kaiser–Meyer–Olkin (KMO) test and Bartlett’s test. The result of the KMO test was 0.889, which suggests that the factor analysis was appropriate (Table 5).
Based on consumer data, the results of factor analysis included survey results grouped into five factors, and the reliability of the elements that form each factor was determined to be excellent. The results appear in Table 6.
6.3. Correlation Analysis
This study analyzed the directionality of the factors through correlation analysis between the derived factors, as shown in Table 7.
6.4. Regression Analysis
Regression analysis was performed to analyze the linear causality between several independent and dependent variables in this study. The results are shown in Table 8, Table 9 and Table 10. The analysis was based on the stepwise method and was analyzed using SPSS 24.0.
According to the results in Table 9, the second research model was analyzed to be highly complete, and the regression analysis results of this model are presented in Table 9.
Table 10 shows the results of analyzing the coefficients of the regression analysis model variables.
6.5. Analysis of Research Model Using ANN (Relative 7:3, Number of Hidden Layers (One))
This study enhanced the analysis of the research model by using the ANN algorithm. To this end, with one hidden layer, two cases were analyzed separately. Table 11, Table 12, Table 13, Table 14 and Table 15 are the results of analyzing the research model assuming one hidden layer. With the ANN algorithm, this study advanced the analysis of the research model.
Table 12 presents material that explains the method of analyzing research models with ANN. In the study presented here, a research model consisting of four independent variables and one dependent variable was subjected to multiple regression analysis. In addition, the sigmoid function, which combines the node and weight of the hidden layer when transmitted from raw data to the hidden layer, was used as an active function in ANN. Beyond that, the softmax function was selected as an activation function for calculating the results from the hidden layer to the output layer.
In this research, when the number of hidden layers was set as one under the ANN algorithm, the third research model was found to be the most complete model.
Model 3 (Table 16) determined that consumer satisfaction (0.621), emotional loyalty (0.125), and social influence (0.063) influenced intention to repurchase, unlike the other models. In addition, it determined that consumer satisfaction had the greatest influence on intention to repurchase.
6.6. Analysis of Research Model Using ANN (Relative 7:3, Number of Hidden Layers (Two))
Table 17, Table 18, Table 19, Table 20, Table 21 and Table 22 are the results of analyzing the research model by assuming two hidden layers in the ANN algorithm.
The analysis results of Table 21 show that the third research model was the most complete when the number of hidden layers was set to two under the ANN algorithm.
Model 3 (Table 22) determined that consumer satisfaction (0.710), emotional loyalty (0.108), and social influence (0.062) influenced repurchase intention, unlike the other models. In addition, it determined that consumer satisfaction had the greatest influence on repurchase intention.
7. Research Results
This study found that consumer satisfaction positively affects intention to repurchase. In addition, it was determined that emotional loyalty affects intention to repurchase. According to the multiple regression analysis, only customer satisfaction and emotional loyalty affect intention to repurchase. In the original analysis, social influence did not affect intention to repurchase. This is due to the limit of this study, in that it did not consider the relationship between each independent variable. Therefore, the stepwise analysis of variables was limited. To address these limitations, this study more clearly analyzed the causal relationship between variables using the ANN algorithm.
This paper analyzed the validity and validity of the research hypotheses through statistical analysis. The results of the analysis are summarized in Table 23. In this study, the research model in Figure 3 was analyzed by using regression analysis and the ANN algorithm, as summarized in Table 24. The results of this approach showed that the analysis model (root-mean-square error (RMSE) (0.313)) was most complete with two hidden layers in the ANN algorithm—that is, the third model in Table 24 was the research model with the highest completeness. In other words, the research hypotheses (H1, H2, and H3) were accepted in this study when analyzed using the ANN algorithm. In this model, the coefficients of consumer satisfaction, emotional loyalty, and social influence were improved compared to the first and second research models. This paper analyzed the validity and validity of the research hypotheses through statistical analysis. The results of the analysis are summarized in Table 23.
8. Research Implication
8.1. Theoretical Implication
This study introduced the TRA (Theory of Reasoned Action) and Heuristic theory, which are effective theories to explain consumer behavior. The results of this study seem to be very simple; however, this approach studied consumer behavior from a different perspective than other studies. The result of this study was a deviation from the rational aspect of consumer behavior research on the premise of reason to the irrational aspect based on emotion, highlighting the necessity of expanding consumer behavior research. In other words, this is a novel exploration not found in previous studies and is a meaningful research result that can expand the scope of research with differentiation from existing studies. However, it was not found that the heuristic variable, a variable of irrational concept, plays an important role among the variables of TRA. On the other hand, social influence was found to affect consumer purchasing behavior. The concept of TRA is based on rational reason, but the results of this study explain that the TRA should be expanded. In other words, when social influence was added to the existing TRA variables, it was found that a more explanatory research model was completed through the ANN algorithm. This is the result of the study that suggested the possibility of overcoming the theoretical limitations of the TRA’s lack of explanation ability by measuring social influence variables as important variables among the TRA’s variables. In other words, this is an analysis result that can infer the necessity of expanding the premise of rational reason as an additional test result that effectively explains consumer choice behavior.
8.2. Managerial Implication
So far, companies only introduce a fragmented customer strategy, such as purchasing products at discounted prices, when they repurchase the same brand products as those used to date, to encourage customers to repurchase. Today, however, customer tendencies and characteristics are more diverse. Therefore, intention to repurchase should also be studied from various perspectives.
This paper found that consumer satisfaction, emotional loyalty, and social influence have a direct impact on consumer intentions to repurchase a smartphone. However, the effect of social influence on intention to repurchase was found to be insignificant.
If the product is expensive (like a smartphone), analysis showed that the consumer uses the product and repurchases the product if satisfied. Therefore, in order to motivate consumers to repurchase smartphones, companies should provide consumers with positive information about any new features and the utilization value of the smartphone. This information can enhance the consumer’s usability of the product, which positively affects satisfaction with the product. Therefore, companies need to consider a number of strategies to increase consumer intentions to repurchase smartphones. Primarily, consumer satisfaction needs to be improved by demonstrating differentiated functions of smartphones and the convenience and services they provide. Information that can improve the usability of the product, as well as information about its superior quality, affects the satisfaction of consumers. This has a positive effect on repurchase.
Therefore, companies need to consider several strategies to enhance customer intention to repurchase smartphones. Firstly, they might improve customer satisfaction by enhancing the functions of smartphones and the convenience and services that they provide. Secondly, it is necessary for them to provide positive information to customers through social influence such as word of mouth.
8.3. Differentiation from Previous Research
Previous studies focused on models of repurchase intention using customer loyalty and customer satisfaction as independent variables. Moreover, several researchers identified satisfaction and attitude as major antecedents of customer repurchase intention [91,92]. According to such research, satisfaction is the overall level of a customer’s pleasure and contentment resulting from experience with the service. However, the precise relationship between customers’ learned dispositions and preferences for perceived alternatives remains unclear [93].
This paper discussed consumer repurchase intention by considering social influence, customer satisfaction, emotional loyalty, and customer habit. Differences between past research and this paper include the following:
- This study examined whether customer habits directly affect their repurchase intention;
- Marketing strategies for repurchase customers can differ from those for other competitors;
- This study involved analyzing factors of social influence that directly affect repurchase intention.
9. Research Limitation and Further Study
This study analyzed the research hypotheses by collecting survey data from consumers in South Korea. However, bias in consumer analysis can cause problems when data are only collected from consumers in certain countries, which can limit the objectivity of the research model. Therefore, in the future, it will be necessary to further analyze the research hypotheses by expanding the survey to consumers living in the US and elsewhere.
In addition, it is necessary to study the first-time smartphone purchase intention of consumers (not repurchase) and compare those results with the results of this study. In addition, it is necessary to deeply analyze and study all factors that affect consumer satisfaction with regard to smartphones.
Funding
This work was supported by a Kyonggi University Research Grant 2019.
Conflicts of Interest
The author declares no conflict of interest.
References
- Gallup Korea Daily Opinion. Available online: https://www.gallup.co.kr/gallupdb/reportContent.asp?seqN=1041 (accessed on 31 July 2020).
- Malara, N.; Dang, S. Verizon Earnings Beat Estimatesas Cheaper Plans Attract Customers. Available online: https://www.reuters.com/article/us-verizon-results/verizon-earnings-beat-estimates-as-cheaper-plans-attract-customers-idUSKBN1X41D5 (accessed on 25 October 2019).
- Reichheld, F.F.; Sasser, J.W. Zero defections: Quality comes to services. Harv. Bus. Rev. 1990, 68, 105–111. [Google Scholar] [PubMed]
- DeSouza, G. Designing a customer retention plan. J. Bus. Strategy 1992, 13, 24–28. [Google Scholar] [CrossRef] [PubMed]
- Jones, T.O.; Sasser, W.E. Why satisfied customers defect. Harv. Bus. Rev. 1995, 73, 88–99. [Google Scholar] [CrossRef]
- Average Lifespan (Replacement Cycle Length) of Smartphones in the United States from 2013 to 2022. Available online: https://0-www-statista-com.brum.beds.ac.uk/statistics/619788/average-smartphone-life (accessed on 31 July 2020).
- Ajzen, I.; Fishbein, M. Understanding Attitudes and Predicting Social Behavior; Prentice-Hall: Englewood Cliffs, NJ, USA, 1980. [Google Scholar]
- Bagozzi, R.P.; Baumgartner, H.; Yi, Y. State versus action orientation and the theory of reasoned action: An application to coupon usage. J. Consum. Res. 1992, 18, 505–518. [Google Scholar] [CrossRef]
- Fishbein, M.; Ajzen, I. Belief, Attitude, Intention and Behavior: An Introduction to Theory and Research; Addison-Wesley: Boston, MA, USA, 1975. [Google Scholar]
- Kahneman, D.; Slovic, S.P.; Slovic, P.; Tversky, A. Judgment under Uncertainty: Heuristics and Biases; Cambridge University Press: Cambridge, UK, 1982. [Google Scholar]
- Simon, H.; Egidi, M.; Viale, R.; Marris, R. Economics, Bounded Rationality and the Cognitive Revolution; Edward Elgar: Aldershot, UK, 1992. [Google Scholar]
- Chen, C.; Li, K.; Duan, M.; Li, K. Chapter 6—Extreme learning machine and its applications in big data processing. In Intelligent Data-Centric Systems; Hsu, H.-H., Chang, C.-Y., Hsu, C.-H., Eds.; Academic Press: Cambridge, MA, USA, 2017. [Google Scholar]
- Henkel, D.; Houchaime, N.; Locatelli, N.; Singh, S.; Zeithaml, V.A.; Bittner, M.J. The impact of emerging WLANs on incumbent cellular service providers in the U.S. In M.J. Services Marketing; McGraw-Hill: Singapore, 2006. [Google Scholar]
- Cronin, J.J.; Brady, M.K.; Hult, G.T.M. Assessing the effects of quality, value, and customer satisfaction on consumer behavioural intentions in service environments. J. Retail. 2000, 76, 193–218. [Google Scholar] [CrossRef]
- Dick, A.S.; Basu, K. Customer loyalty: Toward an integrated conceptual framework. J. Acad. Mark. Sci. 1994, 22, 99–113. [Google Scholar] [CrossRef]
- Ehrenberg, A.S.; Goodhardt, G.J. A comparison of American and British repeat-buying habits. J. Mark. Res. 1968, 5, 29–33. [Google Scholar] [CrossRef]
- Jacoby, J.; Kyner, D.B. Brand loyalty vs. repeat purchasing behavior. J. Mark. Res. 1973, 10, 1–9. [Google Scholar] [CrossRef]
- Law, A.K.; Hui, Y.V.; Zhao, X. Modeling repurchase frequency and customer satisfaction for fast food outlets. Int. J. Qual. Reliab. Manag. 2004, 21, 545–563. [Google Scholar] [CrossRef]
- Mittal, V.; Kamakura, W.A. Satisfaction, repurchase intent, and repurchase behavior: Investigating the moderating effect of customer characteristics. J. Mark. Res. 2001, 38, 131–142. [Google Scholar] [CrossRef]
- Seiders, K.; Voss, G.B.; Grewal, D.; Godfrey, A.L. Do satisfied customers buy more? Examining moderating influences in a retailing context. J. Mark. 2005, 69, 26–43. [Google Scholar] [CrossRef]
- Peyrot, M.; Van Doren, D. Effect of a class action suit on consumer repurchase intentions. J. Consum. Aff. 1994, 28, 361–379. [Google Scholar] [CrossRef]
- Hennig-Thurau, T. Customer orientation of service employees: Its impact on customer satisfaction, commitment, and retention. Int. J. Serv. Ind. Manag. 2004, 15, 460–478. [Google Scholar] [CrossRef]
- Narayandas, D. Measuring and managing the benefits of customer retention: An empirical investigation. J. Serv. Res. 1998, 1, 108–128. [Google Scholar] [CrossRef]
- Zineldin, M. The royalty of loyalty: CRM, quality and retention. J. Consum. Mark. 2006, 23, 430–437. [Google Scholar] [CrossRef]
- Morgan, R.M.; Hunt, S.D. The commitment-trust theory of relationship marketing. J. Mark. 1994, 58, 20–38. [Google Scholar] [CrossRef]
- Hume, M.; Mort, G.S.; Winzar, H. Exploring repurchase intention in a performing arts context: Who comes? and why do they come back? Int. J. Nonprofit Volunt. Sect. Mark. 2007, 12, 135–148. [Google Scholar] [CrossRef]
- Oliver, R.L. Satisfaction: A Behavioral Perspective on the Consumer; Routledge: New York, NY, USA, 2010. [Google Scholar]
- Rust, R.; Zahorik, A.; Keiningham, T. Return on Quality (ROQ): Making service quality financially accountable. J. Mark. 1995, 59, 58–70. [Google Scholar] [CrossRef]
- Wen, C.; Prybutok, V.R.; Xu, C. An integrated model for customer online repurchase intention. J. Comput. Inf. Syst. 2011, 52, 14–23. [Google Scholar]
- Rice, R.E.; Grant, A.E.; Schmitz, J.; Torobin, J. Individual and network influences on the adoption and perceived outcomes of electronic messaging. Soc. Netw. 1990, 12, 27–55. [Google Scholar] [CrossRef]
- Friedkin, N.E. A Structural Theory of Social Influence; Cambridge University Press: Cambridge, UK, 2006. [Google Scholar]
- Venkatesh, V.; Davis, F.D. A theoretical extension of the technology acceptance model: Four longitudinal field studies. Manag. Sci. 2000, 46, 186–204. [Google Scholar] [CrossRef] [Green Version]
- Maisam, S.; Mahsa, R.D. Positive word of mouth marketing: Explaining the roles of value congruity and brand love. J. Compet. 2016, 8, 19–37. [Google Scholar]
- Dixon, J.; Bridson, K.; Evans, J.; Morrison, M. An alternative perspective on relationships, loyalty and future store choice. Int. Rev. Retail. Distrib. Consum. Res. 2005, 15, 351–374. [Google Scholar] [CrossRef] [Green Version]
- Arruda-Filho, E.J.; Cabusas, J.A.; Dholakia, N. Social behavior and brand devotion among iPhone innovators. Int. J. Inf. Manag. 2010, 30, 475–480. [Google Scholar] [CrossRef]
- Liao, C.H.; Hsieh, I.Y. Determinants of consumer’s willingness to purchase gray-market smartphones. J. Bus. Ethics 2013, 114, 409–424. [Google Scholar] [CrossRef]
- Pihlström, M.; Brush, G.J. Comparing the perceived value of information and entertainment mobile services. Psychol. Mark. 2008, 25, 732–755. [Google Scholar] [CrossRef]
- Neal, D.T.; Wood, W.; Quinn, J.M. Habits—A repeat performance. Curr. Dir. Psychol. Sci. 2006, 15, 198–202. [Google Scholar] [CrossRef]
- Chiu, C.M.; Hsu, M.H.; Lai, H.; Chang, C.M. Re-examining the influence of trust on online repeat purchase intention: The moderating role of habit and its antecedents. Decis. Support Syst. 2012, 53, 835–845. [Google Scholar] [CrossRef]
- Limayem, M.; Hirt, S.G.; Cheung, C.M. How habit limits the predictive power of intention: The case of information systems continuance. MIS Q. 2007, 31, 705–737. [Google Scholar] [CrossRef] [Green Version]
- Anderson, E.W.; Sullivan, M.W. The antecedents and consequences of customer satisfaction for firms. Mark. Sci. 1993, 12, 125–143. [Google Scholar] [CrossRef]
- Fornell, C. A national customer satisfaction barometer: The Swedish experience. J. Mark. 1992, 56, 6–21. [Google Scholar] [CrossRef]
- Tsai, H.T.; Huang, H.C.; Jaw, Y.L.; Chen, W.K. Why on-line customers remain with a particular e-retailer: An integrative model and empirical evidence. Psychol. Mark. 2006, 23, 447–464. [Google Scholar] [CrossRef]
- Davidon, M. Have you heard the word? The effect of word of mouth on perceived justice, satisfaction and repurchase intentions following complaint handling. J. Consum. Satisf. Dissatisfaction Complain. Behav. 2003, 16, 67–79. [Google Scholar]
- Durvasula, S.; Lysonski, S.; Mehta, S.C.; Tang, B.P. Forging relationships with services: The antecedents that have an impact on behavioural outcomes in the life insurance industry. J. Financ. Serv. Mark. 2004, 8, 314–326. [Google Scholar] [CrossRef]
- Eggert, A.; Ulaga, W. Customer perceived value: A substitute for satisfaction in business markets? J. Bus. Ind. Mark. 2002, 17, 107–118. [Google Scholar] [CrossRef]
- Harris, L.C.; Goode, M.M. The four levels of loyalty and the pivotal role of trust: A study of online service dynamics. J. Retail. 2004, 80, 139–158. [Google Scholar] [CrossRef]
- Jones, M.A.; Mothersbaugh, D.L.; Beatty, S.E. Switching barrier sand repurchase intentions in services. J. Retail. 2000, 76, 259–274. [Google Scholar] [CrossRef]
- Preis, M.W. The impact of interpersonal satisfaction on repurchase decisions. J. Supply Chain. Manag. 2003, 39, 30–38. [Google Scholar] [CrossRef]
- Szymanski, D.M.; Henard, D.H. Customer satisfaction: A meta-analysis of the empirical evidence. J. Acad. Mark. Sci. 2001, 29, 16–35. [Google Scholar] [CrossRef]
- Olsen, S.O. Comparative evaluation and the relationship between quality, satisfaction, and repurchase loyalty. J. Acad. Mark. Sci. 2002, 30, 240–249. [Google Scholar] [CrossRef]
- Taylor, S.A.; Hunter, G.L.; Longfellow, T.A. Testing an expanded attitude model of goal-directed behavior in a loyalty context. J. Consum. Satisf. Dissatisfaction Complain. Behav. 2006, 19, 18–39. [Google Scholar]
- Bassi, F.; Guido, G. Measuring customer satisfaction: From product performance to consumption experience. J. Consum. Satisf. Dissatisfaction Complain. Behav. 2006, 19, 76–88. [Google Scholar]
- Halstead, D.; Jones, M.A.; Cox, A.N. Satisfaction theory and the disadvantaged consumer. J. Consum. Satisf. Dissatisfaction Complain. Behav. 2007, 20, 15–35. [Google Scholar]
- Hicks, J.M.; Behe, B.K.; Page, T.J.; Dennis, J.H.; Fernandez, R.T. Delighted Consumers Buy Again. HortScience 2005, 40, 1063E–1064. [Google Scholar] [CrossRef] [Green Version]
- Leingpibul, T.; Thomas, S.; Allen Broyles, S.; Ross, R.H. Loyalty’s influence on the consumer satisfaction and (re) purchase behavior relationship. J. Consum. Satisf. Dissatisfaction Complain. Behav. 2009, 22, 36–53. [Google Scholar]
- Hellier, P.K.; Geursen, G.M.; Carr, R.A.; Rickard, J.A. Customer repurchase intention: A general structural equation model. Eur. J. Mark. 2003, 37, 1762–1800. [Google Scholar] [CrossRef] [Green Version]
- Butcher, K.; Sparks, B.; O’Callaghan, F. Effect of social influence on repurchase intentions. J. Serv. Mark. 2002, 16, 503–514. [Google Scholar] [CrossRef]
- White, K.M.; Smith, J.R.; Terry, D.J.; Greenslade, J.H.; McKimmie, B.M. Social influence in the theory of planned behaviour: The role of descriptive, injunctive, and in-group norms. Br. J. Soc. Psychol. 2009, 48, 135–158. [Google Scholar] [CrossRef] [Green Version]
- Delre, S.A.; Broekhuizen, T.L.; Jager, W. The effect of social influence on market inequalities in the motion picture industry. Adv. Complex Syst. 2008, 11, 273–287. [Google Scholar] [CrossRef]
- Rana, S.S.; Osman, A.; Othman, Y.H. Factors affecting purchase intention of customers to shop at hypermarkets. Mediterr. J. Soc. Sci. 2015, 6, 429. [Google Scholar] [CrossRef] [Green Version]
- Chauke, X.D.; Dhurup, M. A generation X cohort analysis of E-shoppers: Satisfaction, loyalty and repurchase intentions in a developing country. J. Soc. Sci. 2017, 52, 145–154. [Google Scholar] [CrossRef]
- Bansal, H.S.; Taylor, S.F. The service provider switching model (spsm) a model of consumer switching behavior in the services industry. J. Serv. Res. 1999, 2, 200–218. [Google Scholar] [CrossRef]
- Albert, N.; Merunka, D. The role of brand love in consumer-brand relationships. J. Consum. Mark. 2013, 30, 258–266. [Google Scholar] [CrossRef]
- Çalık, N. Markaya Yönelik Tüketici Davranişi. Anadolu Üniv. İktisadi İdari Bilimler Fakültesi Derg. 1992, 10, 293–306. Available online: https://dergipark.org.tr/tr/pub/anadoluibfd/issue/48366/614041 (accessed on 31 July 2020).
- Ballantyne, R.; Warren, A.; Nobbs, K. The evolution of brand choice. J. Brand Manag. 2006, 13, 339–352. [Google Scholar] [CrossRef]
- Baldinger, A.L.; Rubinson, J. Brand loyalty: The link between attitude and behavior. J. Advert. Res. 1996, 36, 22–35. [Google Scholar]
- Zheng, X.; Lee, M.; Cheung, C.M. Examining e-loyalty towards online shopping platforms. Internet Res. 2017, 27, 709–726. [Google Scholar] [CrossRef]
- Quinn, J.M.; Wood, W. Habits across the Lifespan; Duke University: Durham, NC, USA, 2005; in press. [Google Scholar]
- Wood, W.; Quinn, J.; Kashy, D. Habits in everyday life: Thought, emotion, and action. J. Personal. Soc. Psychol. 2002, 83, 1281–1297. [Google Scholar] [CrossRef]
- Leone, L.; Perugini, M.; Ercolani, A.P. A comparison of three models of attitude—behavior relationships in the studying behavior domain. Eur. J. Soc. Psychol. 1999, 29, 161–189. [Google Scholar] [CrossRef]
- Trafimow, D. Habit as both a direct cause of intention to use a condom and as a moderator of the attitude-intention and subjective norm-intention relations. Psychol. Health 2000, 15, 383–393. [Google Scholar] [CrossRef]
- Verplanken, V. Beyond frequency: Habit as mental construct. Br. J. Soc. Psychol. 2006, 45, 639–656. [Google Scholar] [CrossRef] [PubMed]
- Gefen, D. E-commerce: The role of familiarity and trust. Omega 2000, 28, 725–738. [Google Scholar] [CrossRef] [Green Version]
- Rauyruen, P.; Miller, K.E.; Groth, M. B2B services: Linking service loyalty and brand equity. J. Serv. Mark. 2009, 23, 175–186. [Google Scholar] [CrossRef]
- Lin, M.Y.; Chang, L.H. Determinants of habitual behaviour for national and leading brands in China. J. Prod. Brand Manag. 2003, 12, 94–107. [Google Scholar] [CrossRef]
- Khare, A.; Inman, J. Habitual behavior in American eating patterns: The role of meal occasions. J. Consum. Res. 2006, 32, 567–575. [Google Scholar] [CrossRef]
- Seetharaman, P.B. Modeling multiple sources of state dependence in random utility models: A distributed lag approach. Mark. Sci. 2004, 23, 263–271. [Google Scholar] [CrossRef] [Green Version]
- Vogel, V.; Evanschitzky, H.; Ramaseshan, B. Customer equity drivers and future sales. J. Mark. 2008, 72, 98–108. [Google Scholar] [CrossRef] [Green Version]
- Anshari, M.; Alas, Y.; Guan, L.S. Developing online learning resources: Big data, social networks, and cloud computing to support pervasive knowledge. Educ. Inf. Technol. 2016, 21, 1663–1677. [Google Scholar] [CrossRef]
- Pew Research Center. Available online: https://www.pewglobal.org/2018/06/19/global-technology-use-appendix-d-detailed-tables/pg_2018-06-19_global-tech_5-01/ (accessed on 31 July 2020).
- Yang, J.; He, X.; Lee, H. Social reference group influence on mobile phone purchasing behavior: A cross-nation comparative study. Int. J. Mob. Commun. 2007, 5, 319–338. [Google Scholar] [CrossRef]
- Kulviwat, S.; Bruner, G.C., II; Al-Shuridah, O. The role of social influence on adoption of high tech innovations: The moderating effect of public/private consumption. J. Bus. Res. 2009, 62, 706–712. [Google Scholar] [CrossRef]
- Bhattacherjee, A. Acceptance of e-commerce services: The case of electronic brokerages. IEEE Trans. Syst. Man Cybern. Part A Syst. Hum. 2000, 30, 411–420. [Google Scholar] [CrossRef] [Green Version]
- Lin, C.S.; Wu, S.; Tsai, R.J. Integrating perceived playfulness into expectation-confirmation model for web portal context. Inf. Manag. 2005, 42, 683–693. [Google Scholar] [CrossRef]
- Hsu, M.H.; Yen, C.H.; Chiu, C.M.; Chang, C.M. A longitudinal investigation of continued online shopping behavior: An extension of the theory of planned behavior. Int. J. Hum. Comput. Stud. 2006, 64, 889–904. [Google Scholar] [CrossRef]
- Kim, H.Y.; Lee, M.Y. Emotional loyalty and share of wallet: A contingency approach. J. Retail. Consum. Serv. 2010, 17, 333–339. [Google Scholar] [CrossRef]
- Ersche, K.D.; Lim, T.V.; Ward, L.H.; Robbins, T.W.; Stochl, J. Creature of habit: A self-report measure of habitual routines and automatic tendencies in everyday life. Personal. Individ. Differ. 2017, 116, 73–85. [Google Scholar] [CrossRef]
- Jolliffe, I. Principal Component Analysis; Springer: Berlin/Heidelberg, Germany, 2011; pp. 1094–1096. [Google Scholar]
- Field, A. Discovering Statistics Using IBM SPSS Statistics; Sage: Thousand Oaks, CA, USA, 2013. [Google Scholar]
- Bearden, W.O.; Teel, J.E. Selected determinants of consumer satisfaction and complaint reports. J. Mark. Res. 1983, 20, 21–28. [Google Scholar] [CrossRef]
- Roest, H.; Pieters, R. The nomological net of perceived service quality. Int. J. Serv. Ind. Manag. 1997, 8, 336–351. [Google Scholar] [CrossRef]
- Ratneshwar, S.; Chaiken, S. Comprehension’s role in persuasion: The case of its moderating effect on the persuasive impact of source cues. J. Consum. Res. 1991, 18, 52–62. [Google Scholar] [CrossRef] [Green Version]
Figure 1.
Multilayer perceptron structure.

Figure 2.
Single neuron.

Figure 3.
Research model.


Table 1.
Intention to repurchase by smartphone brand [1].
Table 1.
Intention to repurchase by smartphone brand [1].
| Case | Intention to Repurchase by Smartphone Brand | |||||||
|---|---|---|---|---|---|---|---|---|
| Samsung Galaxy | Apple IPhone | LG G/V/X | Other | Answer Refusal | ||||
| S/A/J | Note | |||||||
| Currently Used Smartphone Brand | Samsung Galaxy S/A/J | 423 | 61% | 4% | 4% | 7% | 1% | 24% |
| Galaxy Note | 137 | 6% | 67% | 6% | 5% | 1% | 15% | |
| Apple iPhone | 161 | 9% | 3% | 77% | 4% | 8% | ||
| LGG/V/X | 153 | 11% | 4% | 3% | 47% | 0% | 34% | |
Table 2.
Measurement items.
| Construct | Measurement Items | Related Studies |
|---|---|---|
| Social Influence |
| [82,83] |
| Consumer Satisfaction |
| [84,85,86] |
| Emotional Loyalty |
| [87] |
| Habit |
| [88] |
| Intention to Repurchase |
| [84,85,86] |
Table 3.
Descriptive statistics.
| n | Minimum | Maximum | Mean | Standard Deviation | Variance | ||
|---|---|---|---|---|---|---|---|
| Statistic | Standard Error | ||||||
| Q4 | 390 | 1 | 5 | 3.22 | 0.056 | 1.039 | 1.079 |
| Q5 | 390 | 1 | 5 | 3.10 | 0.060 | 1.114 | 1.240 |
| Q6 | 390 | 1 | 5 | 3.09 | 0.060 | 1.110 | 1.233 |
| Q8 | 390 | 1 | 5 | 3.82 | 0.042 | 0.786 | 0.617 |
| Q9 | 390 | 1 | 5 | 3.55 | 0.045 | 0.842 | 0.710 |
| Q10 | 390 | 1 | 5 | 3.68 | 0.043 | 0.808 | 0.652 |
| Q11 | 390 | 1 | 5 | 3.64 | 0.042 | 0.783 | 0.613 |
| Q13 | 390 | 1 | 5 | 3.66 | 0.042 | 0.790 | 0.624 |
| Q14 | 390 | 1 | 5 | 3.56 | 0.042 | 0.792 | 0.627 |
| Q15 | 390 | 1 | 5 | 3.65 | 0.042 | 0.783 | 0.614 |
| Q18 | 390 | 1 | 5 | 3.15 | 0.048 | 0.893 | 0.798 |
| Q19 | 390 | 1 | 5 | 2.65 | 0.050 | 0.934 | 0.873 |
| Q20 | 390 | 1 | 5 | 2.57 | 0.052 | 0.965 | 0.931 |
| Q25 | 390 | 1 | 5 | 3.03 | 0.054 | 1.001 | 1.002 |
| Q28 | 390 | 1 | 5 | 2.98 | 0.054 | 1.003 | 1.005 |
| Q29 | 390 | 1 | 5 | 3.18 | 0.052 | 0.972 | 0.944 |
| Q33 | 390 | 1 | 5 | 3.35 | 0.043 | 0.799 | 0.638 |
Table 4.
Analysis of survey respondents.
| Gender | ||||
| Frequency | Percentage | Valid Percentage | Cumulative Percentage | |
| Man | 193 | 49.5 | 49.5 | 49.5 |
| Woman | 197 | 50.5 | 50.5 | 100.0 |
| Total | 390 | 100.0 | 100.0 | |
| Age | ||||
| Frequency | Percentage | Valid Percentage | Cumulative Percentage | |
| 20 s | 112 | 28.7 | 28.7 | 28.7 |
| 30 s | 177 | 45.4 | 45.4 | 74.1 |
| 40 s | 52 | 13.3 | 13.3 | 87.4 |
| 50 s | 49 | 12.6 | 12.6 | 100.0 |
| Total | 390 | 100.0 | 100.0 | |
| Number of Smartphone Repurchases | ||||
| Number of smartphone repurchases | Frequency | Percentage | Valid Percentage | Cumulative Percentage |
| 2 | 29 | 7.5 | 7.5 | 7.5 |
| 3 | 91 | 23.3 | 23.3 | 30.7 |
| 4 | 90 | 23.0 | 23.0 | 53.7 |
| 5 | 105 | 27.0 | 27.0 | 80.7 |
| 6 | 33 | 8.3 | 8.3 | 89.1 |
| 7 | 9 | 2.3 | 2.3 | 91.4 |
| 8 | 6 | 1.4 | 1.4 | 92.8 |
| 9 | 1 | 0.3 | 0.3 | 93.1 |
| 10 | 20 | 5.2 | 5.2 | 98.3 |
| 12 | 1 | 0.3 | 0.3 | 98.6 |
| 15 | 3 | 0.9 | 0.9 | 99.4 |
| 16 | 1 | 0.3 | 0.3 | 99.7 |
| 17 | 1 | 0.3 | 0.3 | 100.0 |
| Total | 390 | 100.0 | 100.0 | |
Table 5.
Kaiser–Meyer–Olkin (KMO) and Bartlett’s tests.
| Kaiser–Meyer–Olkin Measure of Sampling Adequacy | 0.889 | |
| Bartlett’s Test of Sphericity | Approximate chi-square | 5406.133 |
| df | 528 | |
| Sig. | 0.000 | |
Table 6.
Factor analysis.
| Factor | Cronbach’s Alpha | ||||||
|---|---|---|---|---|---|---|---|
| 1 | 2 | 3 | 4 | 6 | |||
| Customer Satisfaction | Q11 | 0.905 | 0.896 | ||||
| Q10 | 0.883 | ||||||
| Q9 | 0.831 | ||||||
| Q8 | 0.689 | ||||||
| Social Influence | Q6 | 0.871 | 0.784 | ||||
| Q5 | 0.716 | ||||||
| Q4 | 0.618 | ||||||
| Habit | Q29 | 0.709 | 0.708 | ||||
| Q28 | 0.661 | ||||||
| Q25 | 0.612 | ||||||
| Emotional Loyalty | Q20 | 0.817 | 0.8 | ||||
| Q19 | 0.745 | ||||||
| Q18 | 0.670 | ||||||
| Intention to Repurchase | Q14 | 0.808 | 0.848 | ||||
| Q15 | 0.773 | ||||||
| Q13 | 0.715 | ||||||
| Q33 | 0.604 | ||||||
Table 7.
Correlation analysis.
| Social Influence | Emotional Loyalty | Intention to Repurchase | Customer Satisfaction | ||
|---|---|---|---|---|---|
| Social Influence | Pearson correlation | 1 | 0.327 ** | 0.196 ** | 0.182 ** |
| Sig. (2-tailed) | 0.000 | 0.002 | 0.001 | ||
| n | 390 | 390 | 390 | 390 | |
| Emotional Loyalty | Pearson correlation | 0.327 ** | 1 | 0.515 ** | 0.397 ** |
| Sig. (2-tailed) | 0.000 | 0.000 | 0.000 | ||
| n | 390 | 390 | 390 | 390 | |
| Intention to Repurchase | Pearson correlation | 0.169 ** | 0.467 ** | 1 | 0.728 ** |
| Sig. (2-tailed) | 0.002 | 0.000 | 0.000 | ||
| n | 390 | 390 | 390 | 390 | |
| Customer Satisfaction | Pearson correlation | 0.182 ** | 0.397 ** | 0.728 ** | 1 |
| Sig. (2-tailed) | 0.001 | 0.000 | 0.000 | ||
| n | 390 | 390 | 390 | 390 | |
** p-value < 0.01, n respondents number.
Table 8.
Regression analysis.
| Model | Variables Entered | Variables Removed | Method |
|---|---|---|---|
| 1 | Customer satisfaction | Stepwise (criteria: probability of F to enter ≤ 0.050, probability of F to remove ≥ 0.100). | |
| 2 | Emotional loyalty |
Dependent variable: intention to repurchase.
Table 9.
Model summary.
| Model | R | R Square | Adjusted R Square | Standard Error of the Estimate | Change Statistics | Durbin–Watson | ||||
|---|---|---|---|---|---|---|---|---|---|---|
| R Square Change | F Change | df1 | df2 | Sig. F Change | ||||||
| 1 | 0.728 a | 0.530 | 0.529 | 0.47442 | 0.530 | 390.500 | 1 | 346 | 0.000 | |
| 2 | 0.753 b | 0.568 | 0.565 | 0.45575 | 0.038 | 29.934 | 1 | 345 | 0.000 | 1.869 |
a Predictors: (constant), customer satisfaction; b predictors: (constant), customer satisfaction, emotional loyalty.
Table 10.
Coefficients a.
| Model | Unstandardized Coefficients | Standardized Coefficients | t | Sig. | ||
|---|---|---|---|---|---|---|
| B | Standard Error | Beta | ||||
| 1 | (Constant) | 0.996 | 0.135 | 7.360 | 0.000 | |
| Customer satisfaction | 0.716 | 0.036 | 0.728 | 19.761 | 0.000 | |
| 2 | (Constant) | 0.780 | 0.136 | 5.743 | 0.000 | |
| Customer satisfaction | 0.634 | 0.038 | 0.645 | 16.715 | 0.000 | |
| Emotional loyalty | 0.185 | 0.034 | 0.211 | 5.471 | 0.000 | |
a Dependent variable: intention to repurchase.
Table 11.
Case processing summary.
| n | Percentage | ||
|---|---|---|---|
| Sample | Training | 283 | 72.75% |
| Testing | 106 | 27.25% | |
| Valid | 389 | 100.0% | |
| Excluded | 1 | ||
| Total | 390 | ||
Table 12.
Network information. MLP—multilayer perceptron.
| Input Layer | Factors | 1 | Customer satisfaction |
| 2 | Habit | ||
| 3 | Social influence | ||
| 4 | Emotional loyalty | ||
| Number of units | 51 | ||
| Hidden Layer(s) | Number of hidden layers | 1 | |
| Number of units in hidden layer 1a | 8 | ||
| Activation function | Sigmoid | ||
| Output Layer(s) | Dependent variables | 1 | Predicted value for MLP predicted value |
| Number of units | 6 | ||
| Activation function | Softmax | ||
| Error function | Cross-entropy | ||
Table 13.
Model summary a.
| Training | Cross-entropy error | 13.233 |
| Percentage incorrect predictions | 0.0% | |
| Stopping rule used | 1 consecutive step(s) with no decrease in error a | |
| Testing | Cross-entropy error | 50.596 |
| Percentage incorrect predictions | 7.4% |
Dependent variable: predicted value for intention to repurchase; a error computations are based on the testing sample.
Table 14.
Regression analysis.
| Model | Variables Entered | Variables Removed | Method |
|---|---|---|---|
| 1 | Customer satisfaction | Stepwise (criteria: probability of F to enter ≤ 0.050, probability of F to remove ≥ 0.100). | |
| 2 | Emotional loyalty | ||
| 3 | Social influence |
Dependent variable: predicted value for intention to repurchase.
Table 15.
Model summary.
| Model | R | R Square | Adjusted R Square | Standard Error of the Estimate | Change Statistics | Durbin–Watson | ||||
|---|---|---|---|---|---|---|---|---|---|---|
| R Square Change | F Change | df1 | df2 | Sig. F Change | ||||||
| 1 | 0.814 a | 0.663 | 0.663 | 0.34972 | 0.663 | 1429.476 | 1 | 726 | 0.000 | |
| 2 | 0.831 b | 0.690 | 0.690 | 0.33463 | 0.028 | 65.913 | 1 | 725 | 0.000 | |
| 3 | 0.835 c | 0.696 | 0.696 | 0.33155 | 0.006 | 14.557 | 1 | 724 | 0.000 | 1.869 |
a Predictors: (constant), customer satisfaction; b predictors: (constant), customer satisfaction, emotional loyalty; c predictors: (constant), customer satisfaction, emotional loyalty, social influence.
Table 16.
Coefficients a.
| Model | Unstandardized Coefficients | Standardized Coefficients | t | Sig. | Variance Inflation Factors (VIF) | ||
|---|---|---|---|---|---|---|---|
| B | Standard Error | Beta | |||||
| 1 | (Constant) | 1.128 | 0.070 | 16.190 | 0.000 | ||
| Customer satisfaction | 0.698 | 0.018 | 0.814 | 37.808 | 0.000 | 1.000 | |
| 2 | (Constant) | 0.892 | 0.073 | 12.260 | 0.000 | ||
| Customer satisfaction | 0.636 | 0.019 | 0.742 | 32.982 | 0.000 | 1.188 | |
| Emotional loyalty | 0.145 | 0.018 | 0.183 | 8.119 | 0.000 | 1.188 | |
| 3 | (Constant) | 0.805 | 0.076 | 10.646 | 0.000 | ||
| Customer satisfaction | 0.621 | 0.020 | 0.724 | 31.832 | 0.000 | 1.238 | |
| Emotional loyalty | 0.125 | 0.018 | 0.158 | 6.785 | 0.000 | 1.290 | |
| Social influence | 0.063 | 0.017 | 0.086 | 3.815 | 0.000 | 1.211 | |
a Dependent variable: predicted value for intention to repurchase.
Table 17.
Case processing summary.
| n | Percentage | ||
|---|---|---|---|
| Sample | Training | 283 | 72.75% |
| Testing | 106 | 27.25% | |
| Valid | 369 | 389 | |
| Excluded | 1 | 1 | |
| Total | 370 | 390 | |
Table 18.
Network information.
| Input Layer | Factors | 1 | Customer satisfaction |
| 2 | Habit | ||
| 3 | Social influence | ||
| 4 | Emotional loyalty | ||
| Number of units | 48 | ||
| Hidden Layer(s) | Number of hidden layers | 2 | |
| Number of units in hidden layer 1 a | 9 | ||
| Number of units in hidden layer 2 a | 7 | ||
| Activation function | Sigmoid | ||
| Output Layer(s) | Dependent variables | 1 | Predicted value for MLP predicted value |
| Number of units | 5 | ||
| Activation function | Softmax | ||
| Error function | Cross-entropy | ||
a Excluding the bias unit.
Table 19.
Model summary.
| Training | Cross-entropy error | 13.272 |
| Percentage incorrect predictions | 0.0% | |
| Stopping rule used | 1 consecutive step(s) with no decrease in error a | |
| Testing | Cross-entropy error | 30.578 |
| Percentage incorrect predictions | 6.8% |
Dependent variable: predicted value for intention to repurchase; a error computations are based on the testing sample.
Table 20.
Regression analysis.
| Model | Variables Entered | Variables Removed | Method |
|---|---|---|---|
| 1 | Customer satisfaction | Stepwise (criteria: probability of F to enter ≤ 0.050, probability of F to remove ≥ 0.100). | |
| 2 | Emotional loyalty | ||
| 3 | Social influence |
Dependent variable: predicted value for intention to repurchase.
Table 21.
Model summary.
| Model | R | R Square | Adjusted R Square | Standard Error of the Estimate | Change Statistics | Durbin–Watson | ||||
|---|---|---|---|---|---|---|---|---|---|---|
| R Square Change | F Change | df1 | df2 | Sig. F Change | ||||||
| 1 | 0.843 a | 0.710 | 0.710 | 0.32800 | 0.710 | 1754.999 | 1 | 726 | 0.000 | |
| 2 | 0.855 b | 0.731 | 0.731 | 0.31626 | 0.021 | 55.218 | 1 | 725 | 0.000 | |
| 3 | 0.859 c | 0.737 | 0.737 | 0.31310 | 0.006 | 15.515 | 1 | 724 | 0.000 | 1.869 |
a Predictors: (constant), customer satisfaction; b predictors: (constant), customer satisfaction, emotional loyalty; c predictors: (constant), satisfaction, emotional loyalty, social influence.
Table 22.
Coefficients a.
| Model | Unstandardized Coefficients | Standardized Coefficients | t | Sig. | ||
|---|---|---|---|---|---|---|
| B | Standard Error | Beta | ||||
| 1 | (Constant) | 0.836 | 0.071 | 11.801 | 0.000 | |
| Customer satisfaction | 0.783 | 0.019 | 0.843 | 41.893 | 0.000 | |
| 2 | (Constant) | 0.646 | 0.073 | 8.868 | 0.000 | |
| Customer satisfaction | 0.724 | 0.020 | 0.779 | 36.741 | 0.000 | |
| Emotional loyalty | 0.128 | 0.017 | 0.158 | 7.431 | 0.000 | |
| 3 | (Constant) | 0.558 | 0.076 | 7.380 | 0.000 | |
| Customer satisfaction | 0.710 | 0.020 | 0.764 | 35.834 | 0.000 | |
| Emotional loyalty | 0.108 | 0.018 | 0.133 | 6.070 | 0.000 | |
| Social influence | 0.062 | 0.016 | 0.083 | 3.939 | 0.000 | |
a Dependent variable: predicted value for intention to repurchase.
Table 23.
Analysis and comparison of research models.
| Research Hypothesis | Research Model No. (1) | Research Model No. (2) | Research Model No. (3) |
|---|---|---|---|
| Consumer satisfaction positively impacts intention to repurchase (H1) | Accept | Accept | Accept |
| Social influence positively impacts intention to repurchase (H2) | Reject | Accept | Accept |
| Emotional loyalty positively impacts intention to repurchase (H3) | Accept | Accept | Accept |
| Consumer habit positively impacts intention to repurchase (H4) | Reject | Reject | Reject |
Table 24.
Analysis and comparison of research models. RMSE—root-mean-square error.
| Research Model No. | 1 | 2 | 3 |
|---|---|---|---|
| Analysis method | Regression analysis | Regression analysis (number of hidden layers (one)) | Regression analysis (number of hidden layers (two)) |
| R Square (0.568) | R Square (0.696) | R Square (0.736) | |
| RMSE (0.456) | RMSE (0.332) | RMSE (0.313) | |
| (Constant) | 0.780 | 0.805 | 0.558 |
| Satisfaction | 0.634 | 0.621 | 0.710 |
| Emotional loyalty | 0.185 | 0.125 | 0.108 |
| Social influence | - | 0.063 | 0.062 |
© 2020 by the author. Licensee MDPI, Basel, Switzerland. This article is an open access article distributed under the terms and conditions of the Creative Commons Attribution (CC BY) license (http://creativecommons.org/licenses/by/4.0/).
Share and Cite
MDPI and ACS Style
Lee, H.J. A Study of Consumer Repurchase Behaviors of Smartphones Using Artificial Neural Network. Information 2020, 11, 400. https://0-doi-org.brum.beds.ac.uk/10.3390/info11090400
AMA Style
Lee HJ. A Study of Consumer Repurchase Behaviors of Smartphones Using Artificial Neural Network. Information. 2020; 11(9):400. https://0-doi-org.brum.beds.ac.uk/10.3390/info11090400
Chicago/Turabian StyleLee, Hong Joo. 2020. "A Study of Consumer Repurchase Behaviors of Smartphones Using Artificial Neural Network" Information 11, no. 9: 400. https://0-doi-org.brum.beds.ac.uk/10.3390/info11090400
Note that from the first issue of 2016, this journal uses article numbers instead of page numbers. See further details here.