Impact of Sudden Global Events on Cross-Field Research Cooperation


1
Information Security Center, State Key Laboratory of Networking and Switching Technology, Beijing University of Posts and Telecommunications, Beijing 100876, China
2
National Engineering Laboratory for Disaster Backup and Recovery, Beijing University of Posts and Telecommunications, Beijing 100876, China
*
Author to whom correspondence should be addressed.
†
Current address: School of Cyberspace Security, Beijing University of Posts and Telecommunications, Haidian District, Beijing 100876, China.
‡
These authors contributed equally to this work.
Information 2021, 12(1), 26; https://0-doi-org.brum.beds.ac.uk/10.3390/info12010026
Submission received: 13 December 2020
/
Revised: 3 January 2021
/
Accepted: 6 January 2021
/
Published: 10 January 2021
Abstract
:Since the outbreak of COVID-19, in addition to the continuous increment in the number of infected patients, the number of COVID-19-related papers has also increased significantly. According to the statistics, its number even exceeds the research of some research fields over many years. Similar to COVID-19, the related research on COVID-19 also seems highly infectious. What causes this situation? By crawling the data of COVID-19-related papers from web of Sciences this year, we found that there are three mechanisms to promote the rapid growth of the number of COVID-19 papers: incentive mechanism, cross-field collaboration mechanism, and potential impact mechanism of writing papers. To understand the impact of COVID-19 on cross-domain paper network further, we proposed a new construction method of multi-field paper association structure network based on COVID-19. The paper association mechanism and the wall breaking principle between multiple research fields were found through the experiments. Then, combined with the constructed network, we gave the knowledge dissemination model of the new discoveries in multiple fields and obtained some relevant new findings.
1. Introduction
Since the outbreak of COVID-19, people have done a lot of research related to it [1,2,3]. As of 1 June 2020, 42,700 academic articles have been published around COVID-19 from the statistics of Digital Science [4]. This number even exceeds the sum of research in many research fields. The articles related to COVID-19 cover fields including physics, biology, computer science, medicine, meteorology, geography, etc. [5,6,7,8]. What drives researchers to devote themselves to COVID-19-related research is a very interesting question.
In recent years, there has been a lot of research on citation network and scientific cooperation network. For example, Abbasi et al. studied the evolutionary dynamics of scientific collaboration networks from multi-levels and cross-time analysis [9]. Ramasco et al. studied a minimal model of evolving, self-organizing collaboration networks [10]. Chirita et al. proposed the search strategies for scientific collaboration networks [11]. Pan et al. presented a systematic analysis of citation and collaboration networks between cities and countries [12]. Zhou et al. identified important scholars via directed scientific collaboration networks [13]. Previous studies have laid a solid foundation for research in this field. However, in the process of this pandemic, the number of papers related to the pandemic has also increased greatly [4]. Currently, there are no relevant studies giving a specific explanation for this phenomenon. Therefore, the study of this phenomenon is necessary.
Analogous to the propagation of infectious diseases in the population, compared with the scientific studies in other research fields, COVID-19-related research can also be called an “infectious disease”. Combined with the propagation situation of the disease, we consider that the “infection” of COVID-19-related research may be affected by many factors, such as the influence of a large number of COVID-19 researchers, the excitation for published papers, the network structure of scientific collaborators, etc. To clarify the above problems, we crawled the relevant data of this year’s COVID-19 papers from the Web of Science, combined with the existing COVID-19 research results, and discussed three mechanisms that affect the number of COVID-19 research papers: incentive mechanisms, cross-field collaboration mechanism, and potential impact mechanism of writing papers. Recently, scholars have done a lot of research based on Web of Science. For example, Chadegani et al. made a comparison between two main academic literature collections, Web of Science and Scopus Databases, and they found Web of Science has stronger coverage [14]. Susan et al. studied the retraction penalty based on Web of Science, and they found that scientific articles are retracted at increasing rates, with the highest rates among top journals [15]. Paul-Hus et al. analyzed the presence and distribution of funding acknowledgement data covered in Web of Science [16]. Based on the data generated by COVID-19 in Web of Science, this paper makes a small supplement to the previous studies.
In the process of studying the characteristics of the scientist cooperation network and the paper citation network, it is essential to construct the network. For example, in the scientist cooperation network, the network node represents the author. If two authors co-authored one or more articles, they are connected by an edge [17,18]. Similarly, in the paper citation network, the network node represents the paper, and the links between papers are the citations [19]. In previous studies, based on the above two types of networks, scholars have studied many interesting characteristics of academia. For example, Newman studied a variety of nonlocal statistics for these networks, such as typical distances between scientists through the network, and measures of centrality, such as closeness and betweenness [20]. Liu et al. studied the attack resilience of the evolving scientific collaboration network [21]. Zhao et al. studied the benefit distribution mechanism in the team members’ scientific research collaboration network [22].
However, if we want to analyze the scientific research in each field separately during the pandemic, it would be relatively difficult to use the author cooperation network or the paper citation network directly because authors and papers mentioned are mixed in various fields during the pandemic. To analyze the scientific research related to COVID-19 and the research in other fields during the pandemic, we need to build a network of multi-field cooperation based on COVID-19. At present, there also exist some studies from the perspective of the relationship between different fields based on scientific collaboration network. Shi et al. studied the diversity of social ties in scientific collaboration networks [23]. Ferligoj et al. studied the scientific collaboration dynamics in a national scientific system [24]. Li et al. studied important institutions of inter-institutional scientific collaboration networks in materials science [25]. Ke et al. studied the tie strength distribution in scientific collaboration networks [26]. The related studies have provided great help to our research.
Based on the above analyses, we use a community structure network topology in this article, in which different domains are analogous to different communities. Combined with the d three mechanisms discussed above, we constructed a multi-field paper association structure network based on COVID-19. Based on the impact of the sudden global events COVID-19, we conducted a study on the cross domain research cooperation. The main work and contributions of this paper are as follows:
- (i)
- According to the data of published papers related to COVID-19 during the COVID-19 pandemic period, three mechanisms leading to a large increase in the number of COVID-19 papers were analyzed.
- (ii)
- The multi-field paper association structure network based on COVID-19 was constructed. The changes of cooperation between different fields were analyzed based on the influence of COVID-19.
- (iii)
- From the perspective of knowledge dissemination, the different factors that affect the dissemination of new discoveries in a certain field were studied.
The rest of our paper is organized as follows. In Section 2, we review the published literature on scientific collaboration networks and the propagation dynamics of complex networks. In Section 3, we introduce the method used in this paper in detail, including the three mechanisms leading to a large number of COVID-19-related articles, the construction of multi-field paper association structure network based on COVID-19, and the paper association mechanism and the wall breaking principle between multiple research fields during the COVID-19 pandemic. In Section 4, the knowledge dissemination model of the new discoveries in the multiple fields is proposed, and the relevant new findings of the model are analyzed through theoretical derivation and experimental verification. Finally, the conclusions are given in Section 5.
2. Related Work
2.1. Scientific Collaboration
Since 1960s, scientific collaboration has been studied systematically. Scientific collaboration is defined as “the interaction between two or more scientists in a social context, which helps to share meaning and accomplish tasks on the shared goals”, and these collaborations often appear in social networks and continue through them [27]. With the rapid development of social networks, scholars have studied scientific collaboration from various perspectives. For example, Hara et al. discussed the types of collaboration and the factors that affect collaboration [28]. These factors include compatibility, work connections, incentives, and socio-technical infrastructure. Katz et al. studied the influence of geographical distance on research collaboration [29]. Kretschmer et al. studied the geodesic distance of highly productive scientists [30]. The existing achievements have laid a solid foundation for the future research in this field. In the past related research, scholars’ research has usually been based on the datasets of papers in different fields accumulated for a long time. There are few studies on short-term collaboration in emergencies. At present, the outbreak of COVID-19 has caused great suffering to people. It is urgent to overcome the COVID-19 pandemic and protect the lives and property of the people. Since the outbreak of COVID-19, scholars in various fields have carried out research rapidly and established cooperative research relations with experts and scholars in different fields, and they have made a lot of achievements in a short period of time. Compared with the conventional scientific cooperation network, the short-term collaboration network under sudden global events has different characteristics. Therefore, based on this kind of short-term sudden global events, this paper studies the change of collaboration relationship among scholars in the paper collaboration network.
2.2. Evolution of the Study of Scientific Collaboration Networks over Time
In the research process of scientific collaboration, different qualitative and quantitative methods are used for research, including interviews, surveys, bibliometric analysis, social network analysis, etc. [24]. Among them, scientific collaboration network and citation network are commonly used tools to study scientific collaboration, and both of them have a positive impact on the research of scientific productivity. There has been a lot of research based on scientific collaboration network. For example, Barabási et al. studied two co-author networks with hundreds of thousands of nodes in mathematics and neuroscience and analyzed their dynamics and topology from 1991 to 1998 [31]. Kim et al. studied the evolution of collaborative networks over time [32]. Wagner et al. reviewed interdisciplinary research evaluation indicators based on co-author networks [33]. This paper makes a further supplement on the basis of previous research. We studied the interdisciplinary scientific collaboration network during sudden global events and analyzed the impact of COVID-19 on interdisciplinary scientific collaboration network.
2.3. The Propagation Dynamics of Complex Network
A complex network is a network composed of nodes and edges with some or all properties of self-similarity, self-organization, attractor, small world, and scale-free [34]. A complex network is an abstraction of the real network, such as telephone network, electric power network, transportation network, and biological network [35]. Although they abandon some specific details of the real network, these networks are composed of independent components or construction, and they are connected by certain connection methods. Network structure and specific connection mode have an important impact on the overall behavior of the system. It helps us to have a better understanding of the world. In recent years, with the rapid development of complex network research, the research on its related problems has also attracted the attention of many scholars. Usually, scholars analyze and study the propagation of different types of information based on the propagation dynamics of complex network. For example, Duyckaerts et al. studied the disease propagation model [36], while Zhu et al. proposed the rumor propagation model [37]. However, there is little research on knowledge dissemination in the existing studies. Therefore, based on the influence of COVID-19 on the interdisciplinary collaboration network, this paper analyzes the factors that influence the propagation of new discoveries in the field of COVID-19. It can provide ideas to promote the dissemination of important new discoveries and help researchers to know about important new discoveries in time.
3. Methods
Based on Web of Science, we used Python to crawl the data of published papers related to COVID-19 from the beginning of January to 27 September in 2020 (including paper title, author, publication time, author institution, etc.). According to the data obtained, three mechanisms leading to the large increase of the number of COVID-19 papers were analyzed. Then, the relevance between articles in different fields in the paper cooperation network was studied. Based on the construction method of traditional community network, combined with the three mechanisms we obtained, we constructed a multi-field paper association structure network based on COVID-19 and analyzed the topological characteristics of the network. Referring to the traditional virus propagation model, the dynamic mean field method was used to construct the knowledge dissemination model of the new discoveries in multiple fields. The basic reproduction number of the model was obtained by the next generation matrix method. Finally, we used Monte Carlo simulation to verify the theoretical results.
3.1. Three Mechanisms Leading to a Large Number of COVID-19 Related Articles
As of 9 October 2020, there have been 36,002,827 confirmed cases of new coronavirus pneumonia worldwide according to the WHO statistics [38]. In fact, the World Health Organization raised the global risk level of COVID-19 to the highest level as early as 28 February [39], and people take a lot of preventive measures against it [40,41,42]. However, until now, the disease is still spreading in most countries around the world, and the long-term sustained transmission has caused great losses to people’s lives. At the same time, many scientific researchers also have done a lot of work on COVID-19 from many aspects. Aimed at COVID-19, as of the 1st of June, there have been 3105 clinical trials, 422 datasets, 272 patents, 757 policy documents, and 156 grants reported [4]. Horbach stated that the time between submission and publication has decreased on average by 49% for the coronavirus-related articles since the outbreak of the pandemic [43]. The above work has provided tremendous help to scientific researchers studying COVID-19, and it has also greatly mobilized the enthusiasm of scientific researchers—the incentive mechanism.
To understand more specifically what factors affected the large increase in COVID-19 papers during the pandemic, we studied the multi-field paper association structure network during the pandemic period. Based on the keyword COVID-19, we crawled the published papers data related to COVID-19 from the Web of Science from the beginning of January to 27 September in 2020 (including paper title, author, publication time, author institution, etc.). According to the data statistics, in total, 29,369 articles were crawled.
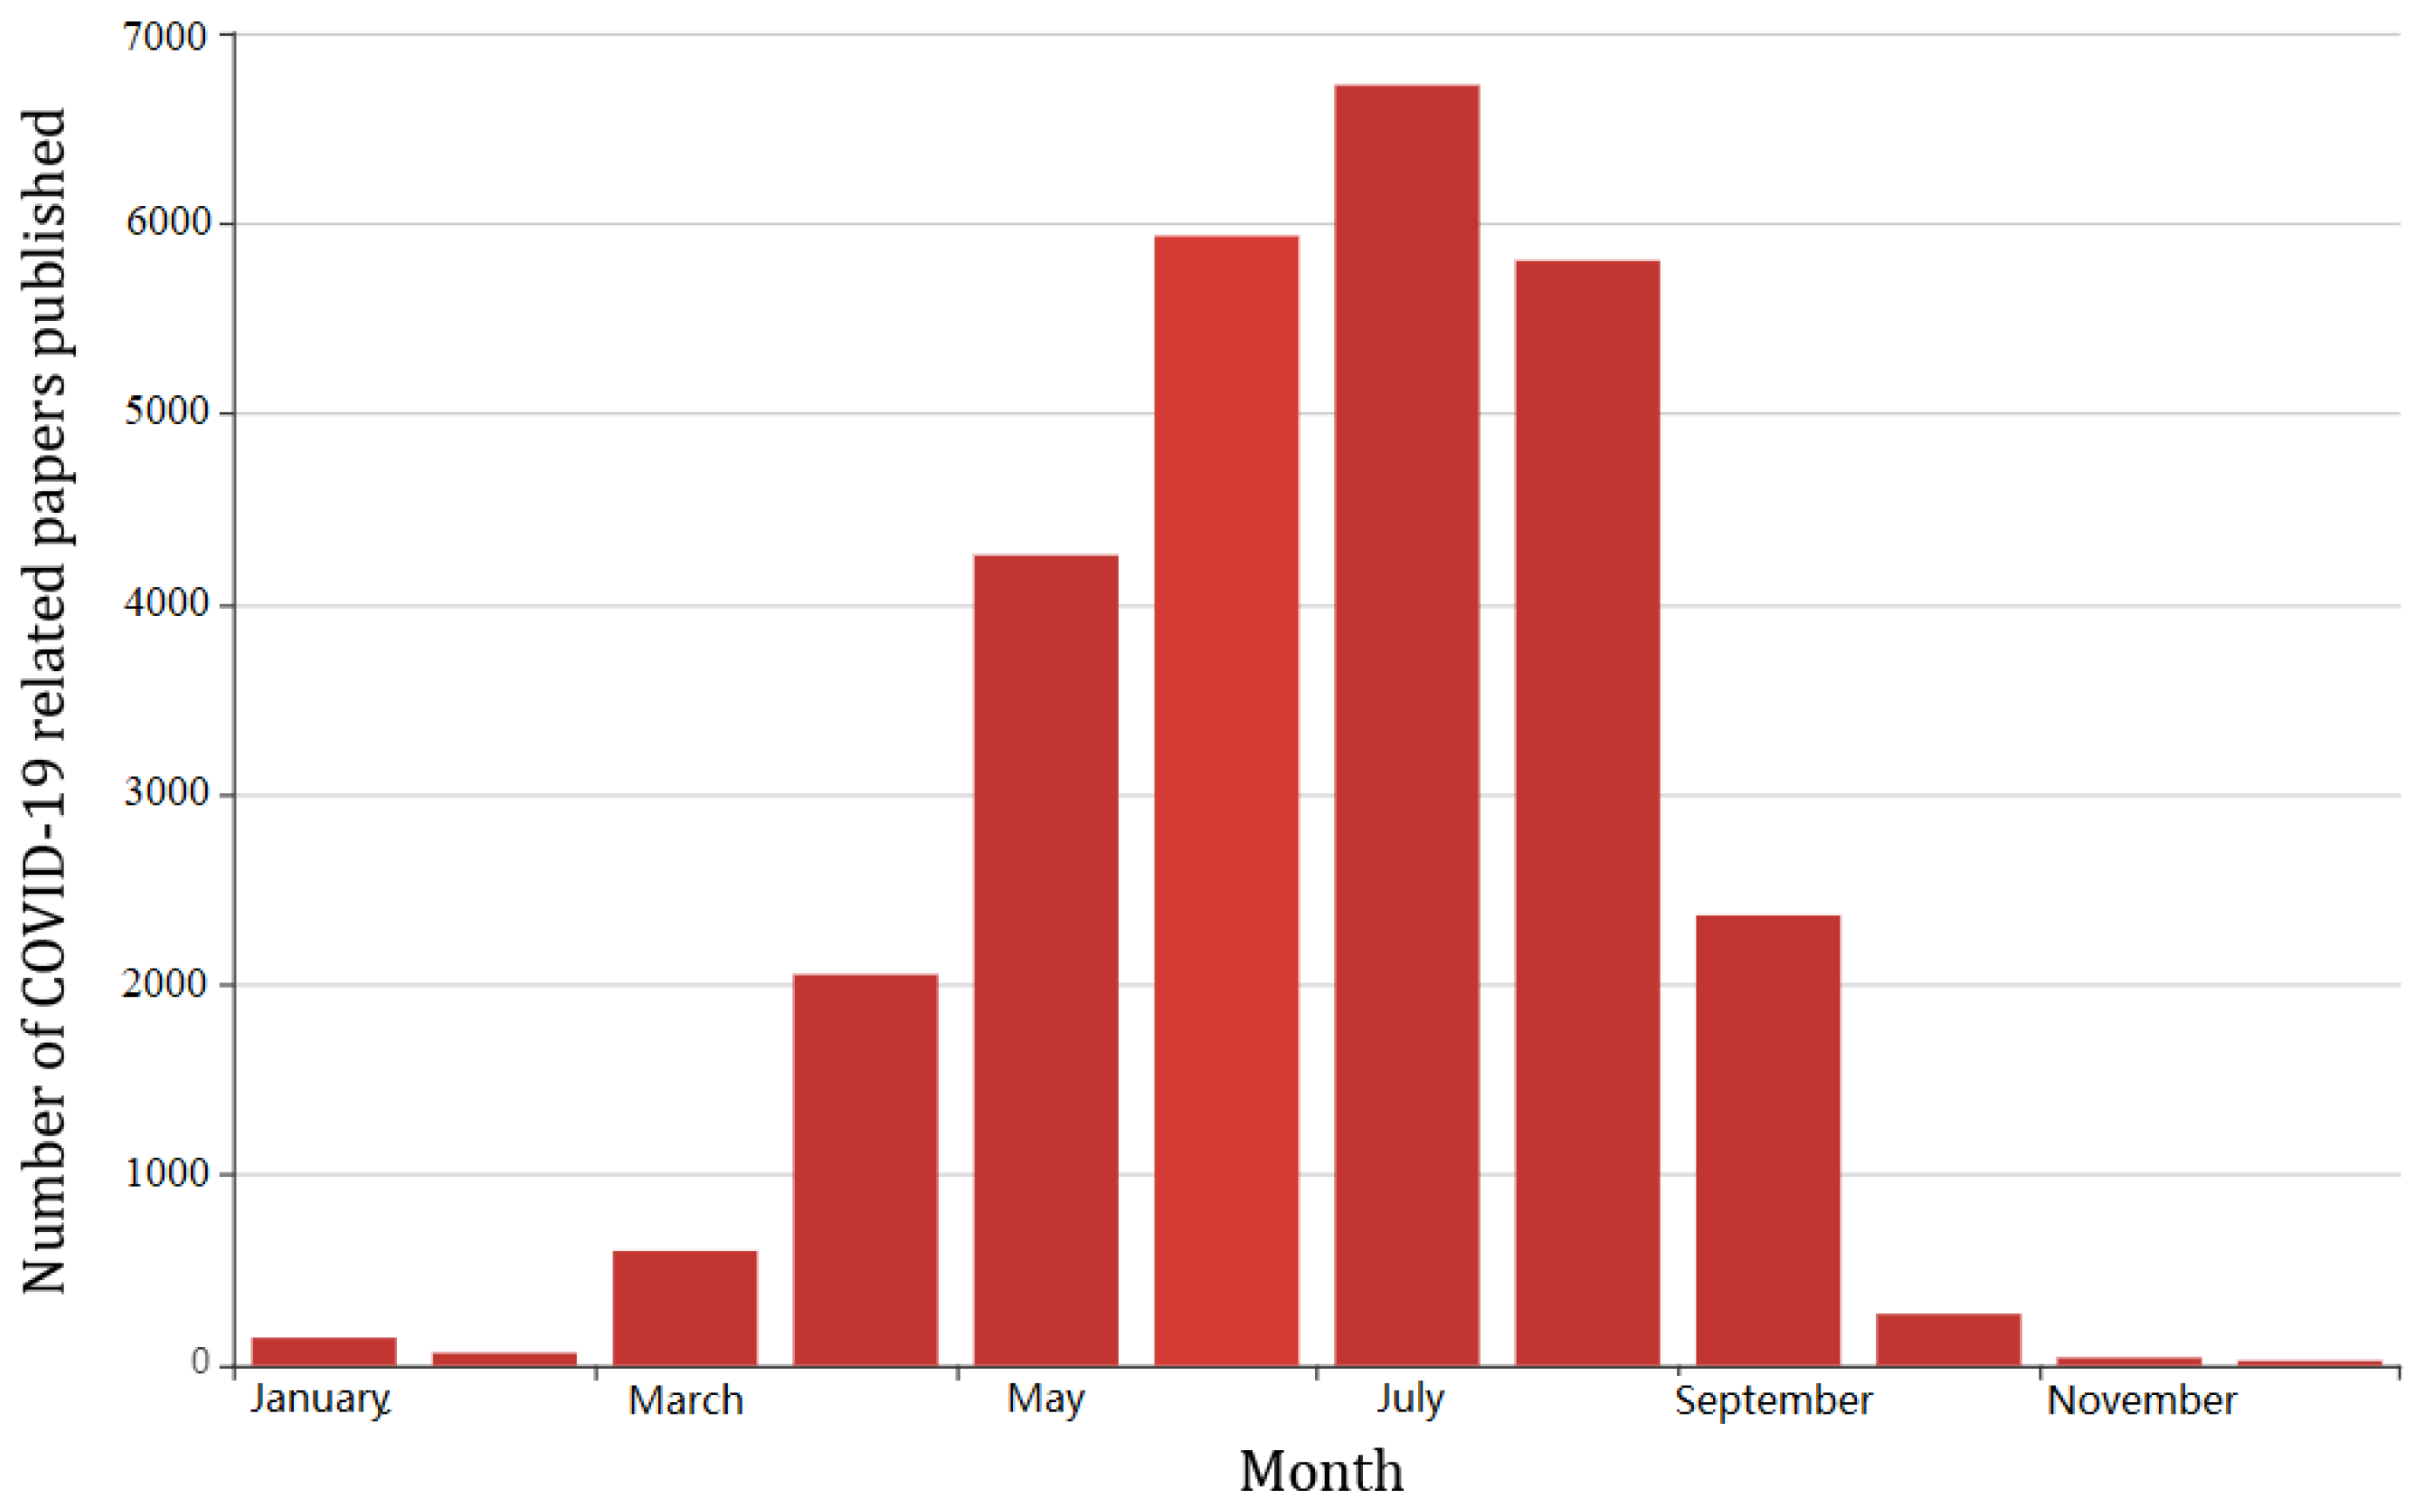
Based on the data of 29,369 articles, to analyze the change in the number of papers published each month as the pandemic continued, we deleted the data of articles without accurate months (e.g., the article only displaying the publication year 2020, or the publication date is displayed similar to “spring of 2020” or “autumn of 2020”). Finally, 28,292 data remained. In response to the data of 28,292 articles, we compiled data on COVID-19-related papers published every month. We found that the number of papers published increases first and then decreases from month to month, as shown in Figure 1. In the early stages of the pandemic, people conducted research on COVID-19 from various aspects, and we analyzed that this phenomenon led to a large increase in the number of COVID-19 articles. As the pandemic continues, the threshold for collecting COVID-19 papers on some websites has increased and the research on COVID-19 was becoming more saturated, which led to a decline in the number of COVID-19 papers published. Thus, we can conclude that the incentives for scientific researchers to publish COVID-19-related papers also increased first and then decreased as the pandemic continues.
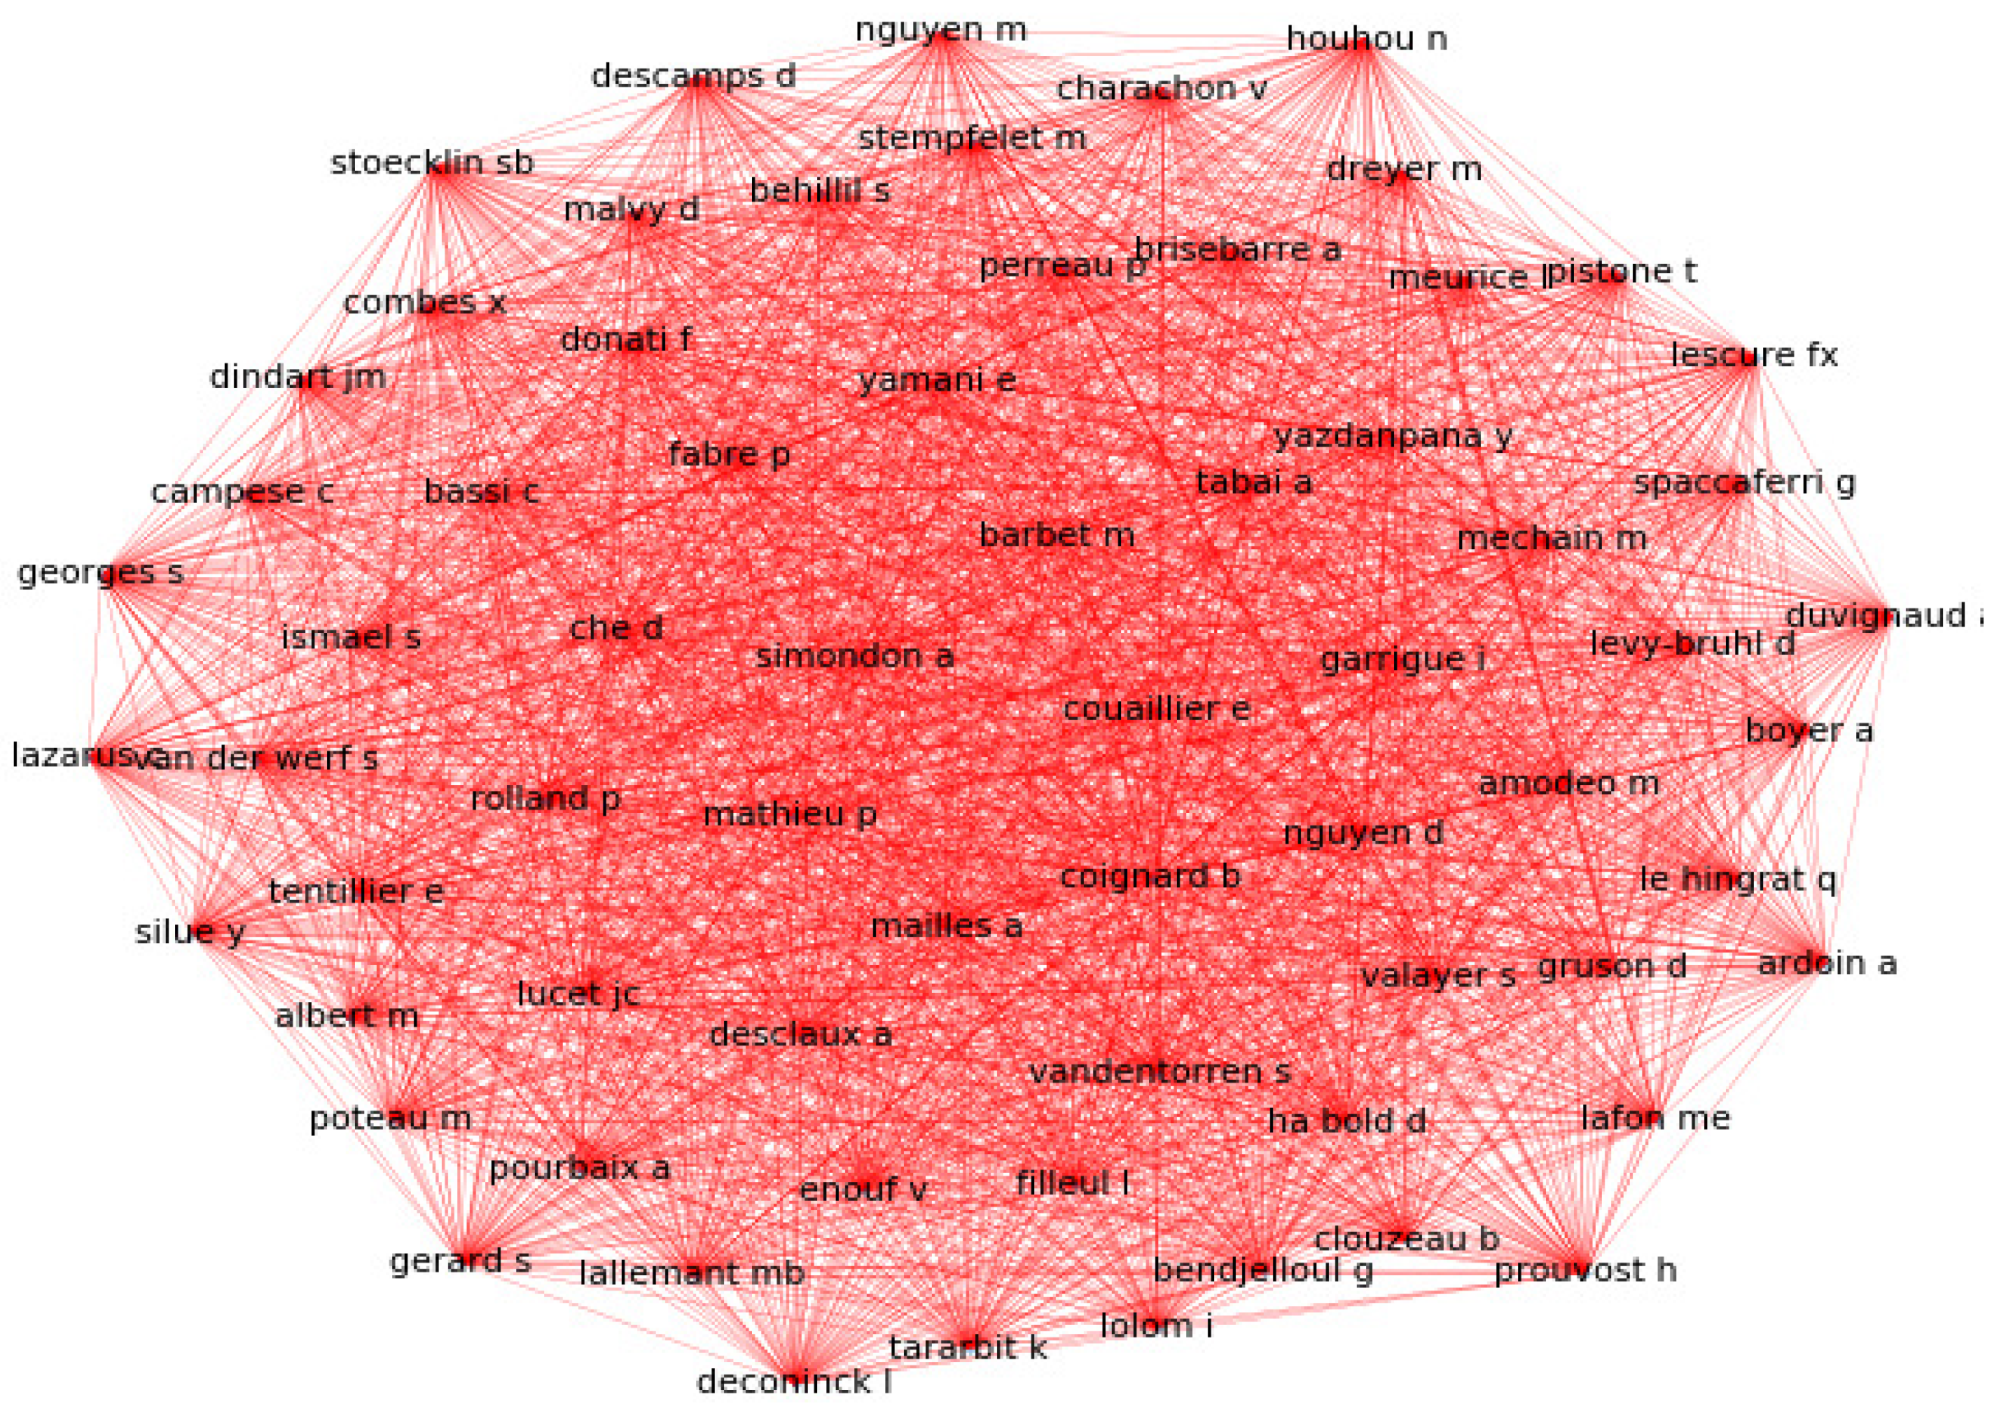
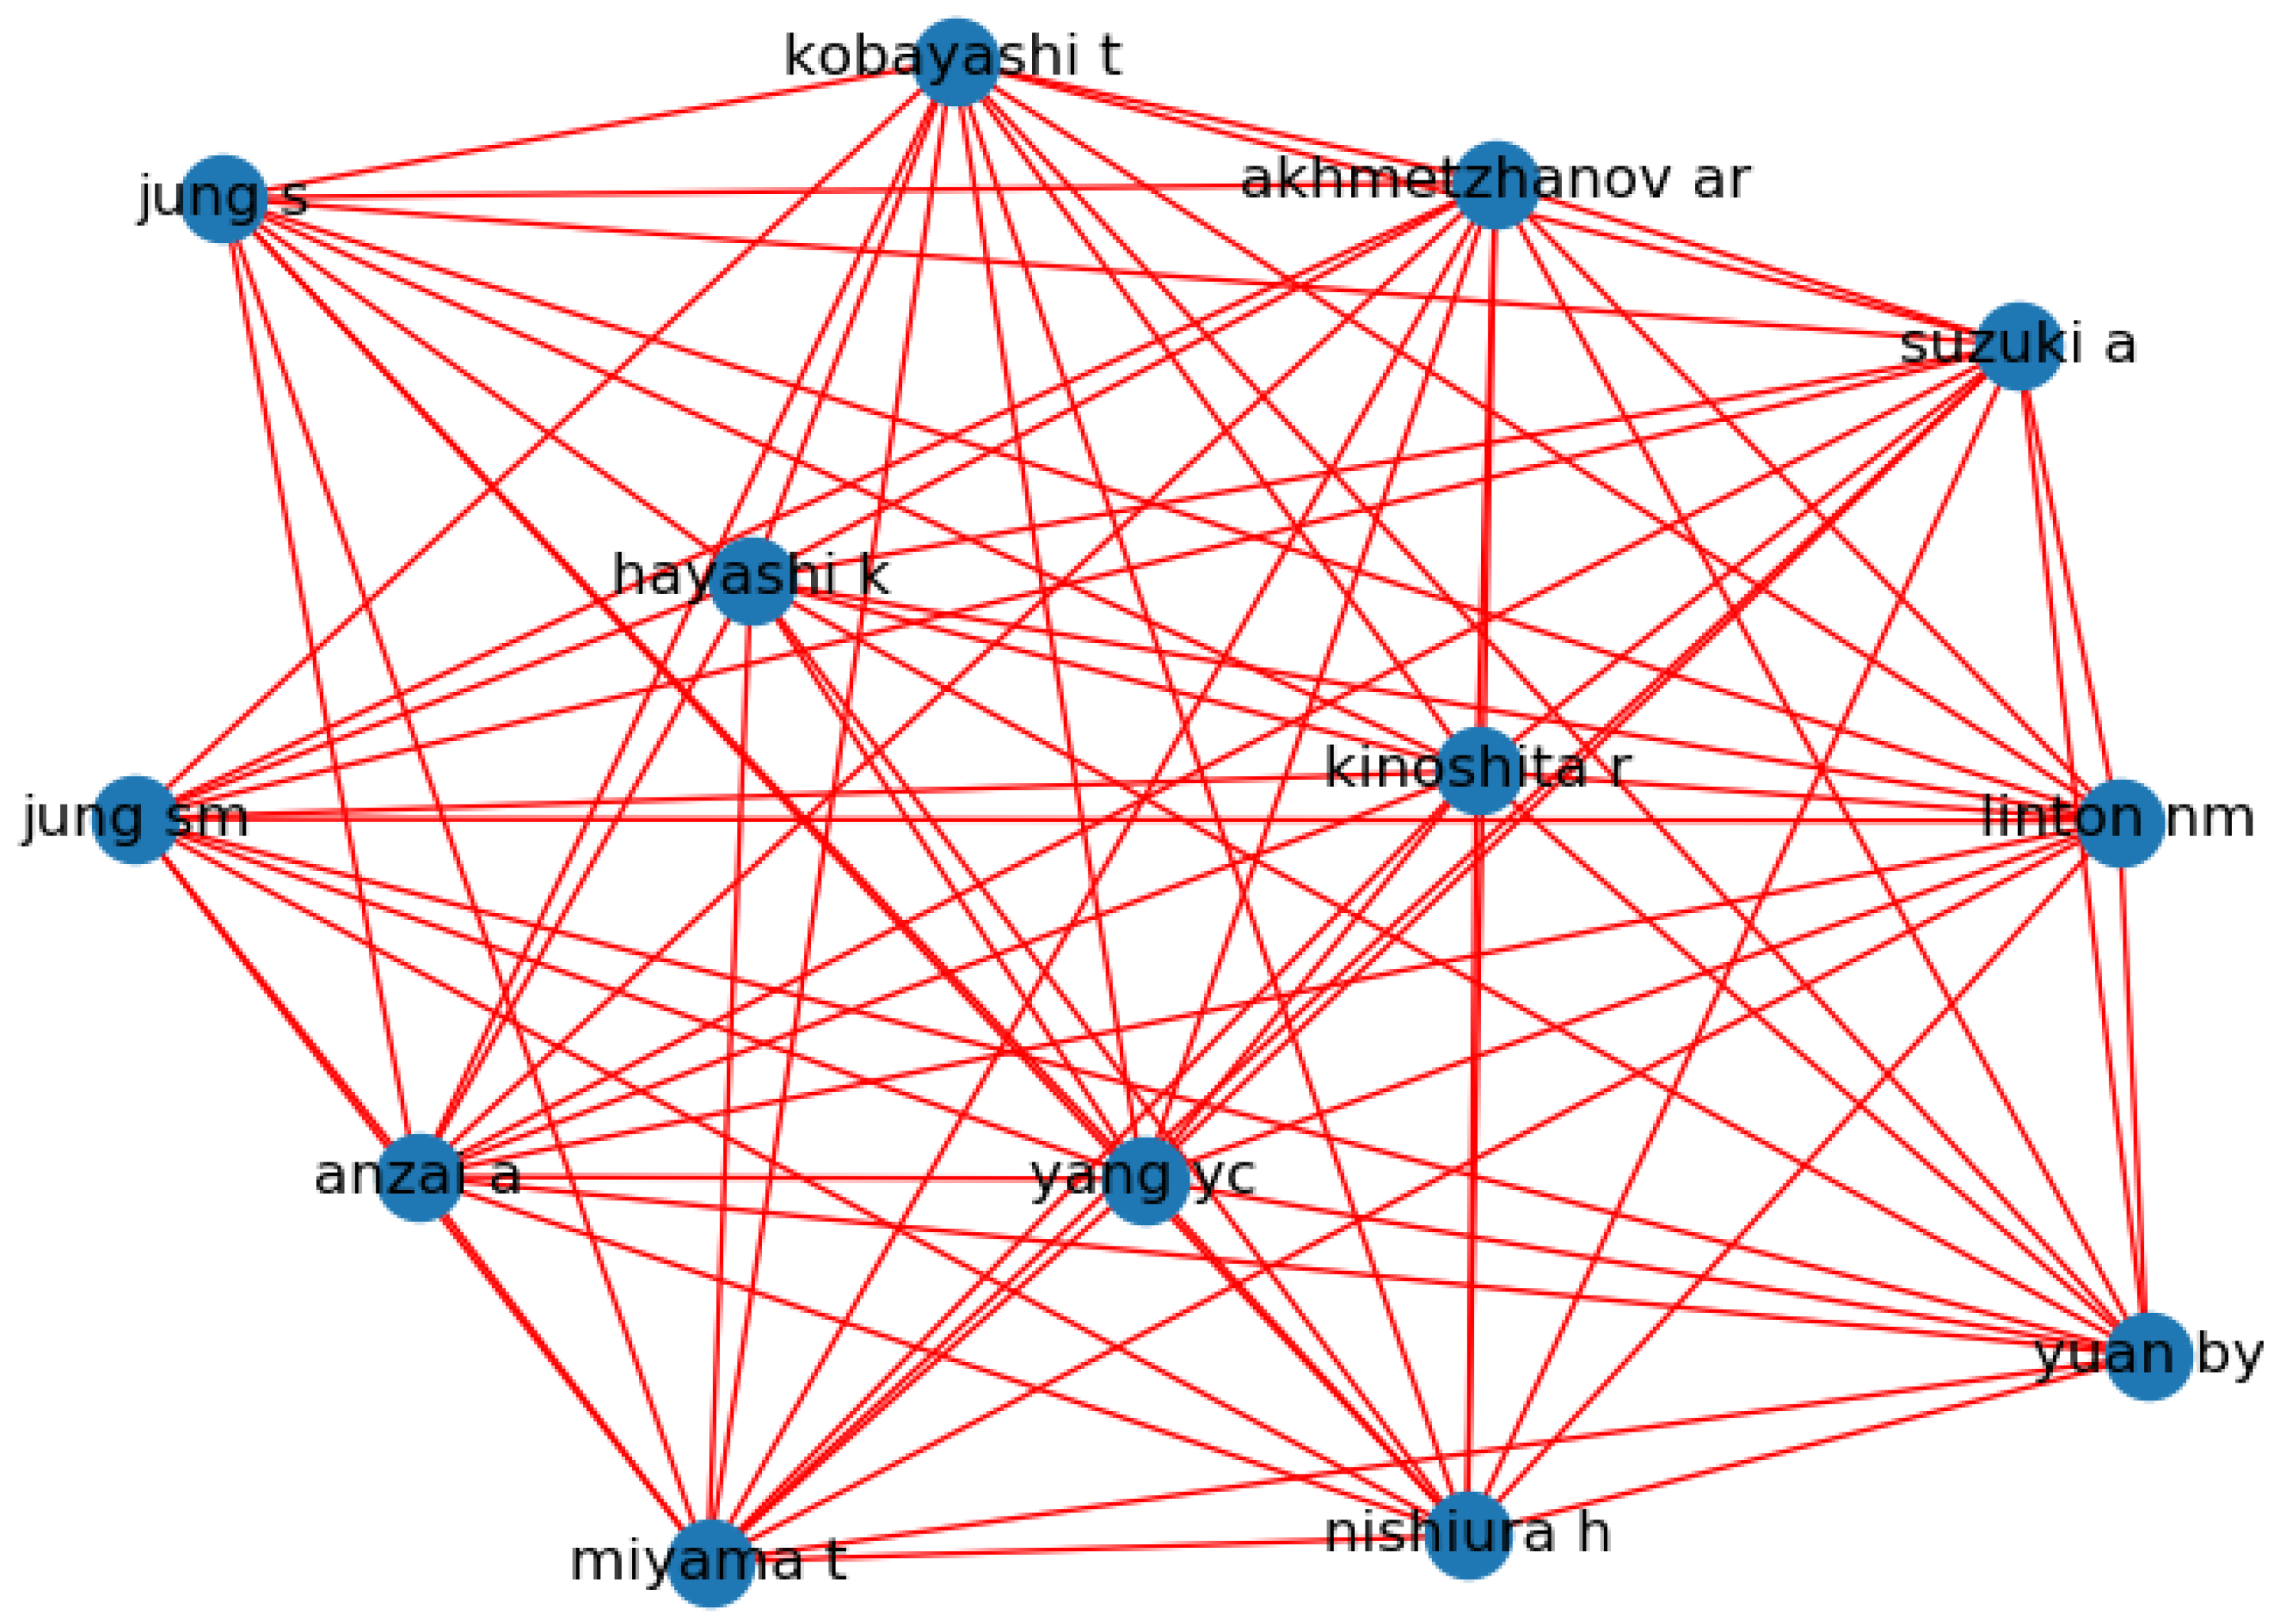
According to the crawled data of 29,369 COVID-19-related papers in 2020, we counted as many as 220 fields covered by the papers. Figure 2 shows that multiple fields are involved in COVID-19-related papers. We can conclude that scientific researchers have conducted research on COVID-19 in multiple research fields—the cross-field collaboration mechanism. Researchers usually represent the authors as the nodes in the network in the research process of the scientist cooperation network. If two authors have co-authored one or more papers, a link is constructed between them. In the same way, based on the crawled data of 29,369 COVID-19-related papers in 2020, we interconnected the authors in each article. After interconnecting the authors of all articles in February, 47 communities appeared. Figure 3 shows the most complex and tightly connected community in February, a community with 67 authors in total. As shown in Figure 3, each author posted only one article. In February, the authors with the most articles appeared in the community, as shown in Figure 4. However, in March, we found that the community did not expand significantly (Figure 4), and the article number of the authors in the enlarged community did not increase significantly. As shown in Figure 3, this community expanded into a particularly huge community in March because the largest number of authors was in it. We found that the authors who published a large number of articles in March appeared in the expanded community shown in Figure 3, and the number of articles in the expanded community shown in Figure 3 also increased significantly. Therefore, we can conclude that there is a potential impact mechanism of writing papers in the article relationship network, that is, the more authors in an article, the more this article will promote the expansion of its field, and the number of articles produced will be more in this field.
3.2. Construction of Multi-Field Paper Association Structure Network Based on COVID-19
To better understand the changes in papers of various fields during the COVID-19 pandemic, we built a multi-field paper association structure network based on the three mechanisms mentioned above. The construction method is as follows.
In the constructed network, we assumed that there are three interrelated research fields a, b, and c, as well as a field d which is not related to the three research fields. There are a total of m authors in the network, and the proportion of authors in each field is ::: in the network. Then, we determine which field each author belongs to.
(i) Build an initial network of three related fields a, b, and c.
Assume that there are initially papers in the fields a, b, and c. Because the number of authors of each paper published is not fixed, we assume that the maximum number of authors in each paper is n.
(1) Set the number of authors of each paper to be a random value based on the maximum number of authors. Assume that the number of authors of an article is , and then, for this paper, authors are randomly selected from all authors in three fields of a, b, and c. (2) Based on the fields of all authors in each article, determine which field the article belongs to (if a certain field is in the majority). (3) The method loops times to obtain the status of each paper in these three fields a, b, and c. Then, obtain the papers of each author in these three fields of a, b, and c and the authors’ common co-authors.
Based on the above, for each paper in these three fields of a, b, and c, such as paper H, according to the papers published in various fields by each author of paper H, we find which papers in these three fields are related to paper H. For example, if the paper belongs to field a, but one of its authors has published many papers in field b, then paper H may be related to some papers in field b.
Finally, we consider that the papers in a certain field are more closely connected to the papers in this field, and they are relatively poorly connected with the papers in other fields. In the network, we assume that an article is connected to papers in its field and connected to papers in other fields, where . As a result, three initial association networks of a, b, and c are built.
(ii) Construct the initial network of field d that is not related to the three fields of .
Because field d is not related to the first three fields and c, we assume that the authors and the papers involved in field d are independent of those of the first three fields. We assume that there are articles in the field d. Similar to the above method, assuming that the maximum number of the authors of each paper in field d is n, a random value is obtained for the number of the authors in each paper in field d based on the maximum number of authors. The method loops times to obtain the status of each paper in field d. Then, the papers of each author in field d are obtained, as well as the authors’ common co-authors. Subsequently, for each article in field d, such as article B, we find which article in field d is related to article B based on the authors of article B. Finally, we assume that each article in field d is connected to papers in its field. As a result, the initial network of field d is built.
(iii) Construct a multi-field paper association structure network affected by COVID-19.
After the emergence of the COVID-19 pandemic, the number of authors will not change a lot in the paper association network, but new papers will continue to enter the network. We assume that new articles will enter into the network.
(1) First, count the initial number of papers in each field according to the initial network of fields a, b, c, and d, respectively. It is assumed that the initial number of papers in the four fields of a, b, c, and d are , , , and , respectively. It can be judged that new papers are more likely belong to which field according to /(+++), where . For example, we suppose the probability of one new article belonging to field a is higher. However, due to the influence of the incentive mechanism during the COVID-19 pandemic, if this article is motivated with probability j when it was created, then this article belongs to the field of COVID-19 research. If it is not motivated, then this article belongs to field a. (2) In the previous process of crawling COVID-19 papers, we found that there is a potential impact mechanism of writing papers, that is, if there are many authors in an article of a certain field, this kind of author group will promote the publication of papers in this field. Based on the above analyses, we apply this mechanism to construct the networks and introduce the probability z. If a new article is affected by this mechanism, we need to look for articles with a large number of authors based on the field of new article. Then, we select authors from these articles with large number of authors and select their common collaborators; thus, we regard these selected authors as the authors of the new article. (3) The method loops times to obtain the status of the newly-incoming articles in the five fields of a, b, c, d, and COVID-19. Then, we obtain the papers of each author in the five fields of a, b, c, d, and COVID-19, as well as the authors’ common co-authors.
Subsequently, we look for the newly added articles that are related to which articles in various fields. For the new articles in the fields of a, b, c and d, the previous linking method is adopted. However, for the articles in the field of COVID-19, we find that the articles in COVID-19 are related to many fields based on the crawling data and there exist strong and weak correlations, thus we suppos that the correlations between the three fields a, b, and c and the COVID-19 field are , , and , respectively. That is, the articles in the COVID-19 field are connected with articles in fields a, b, and c based on different relevance. Because field d is not particularly related to the COVID-19 field, but some articles field d and the COVID-19 field are connected due to the impact of the COVID-19 pandemic, we introduce the probability q. As for other linking methods, it is similar to the way of building the network above.
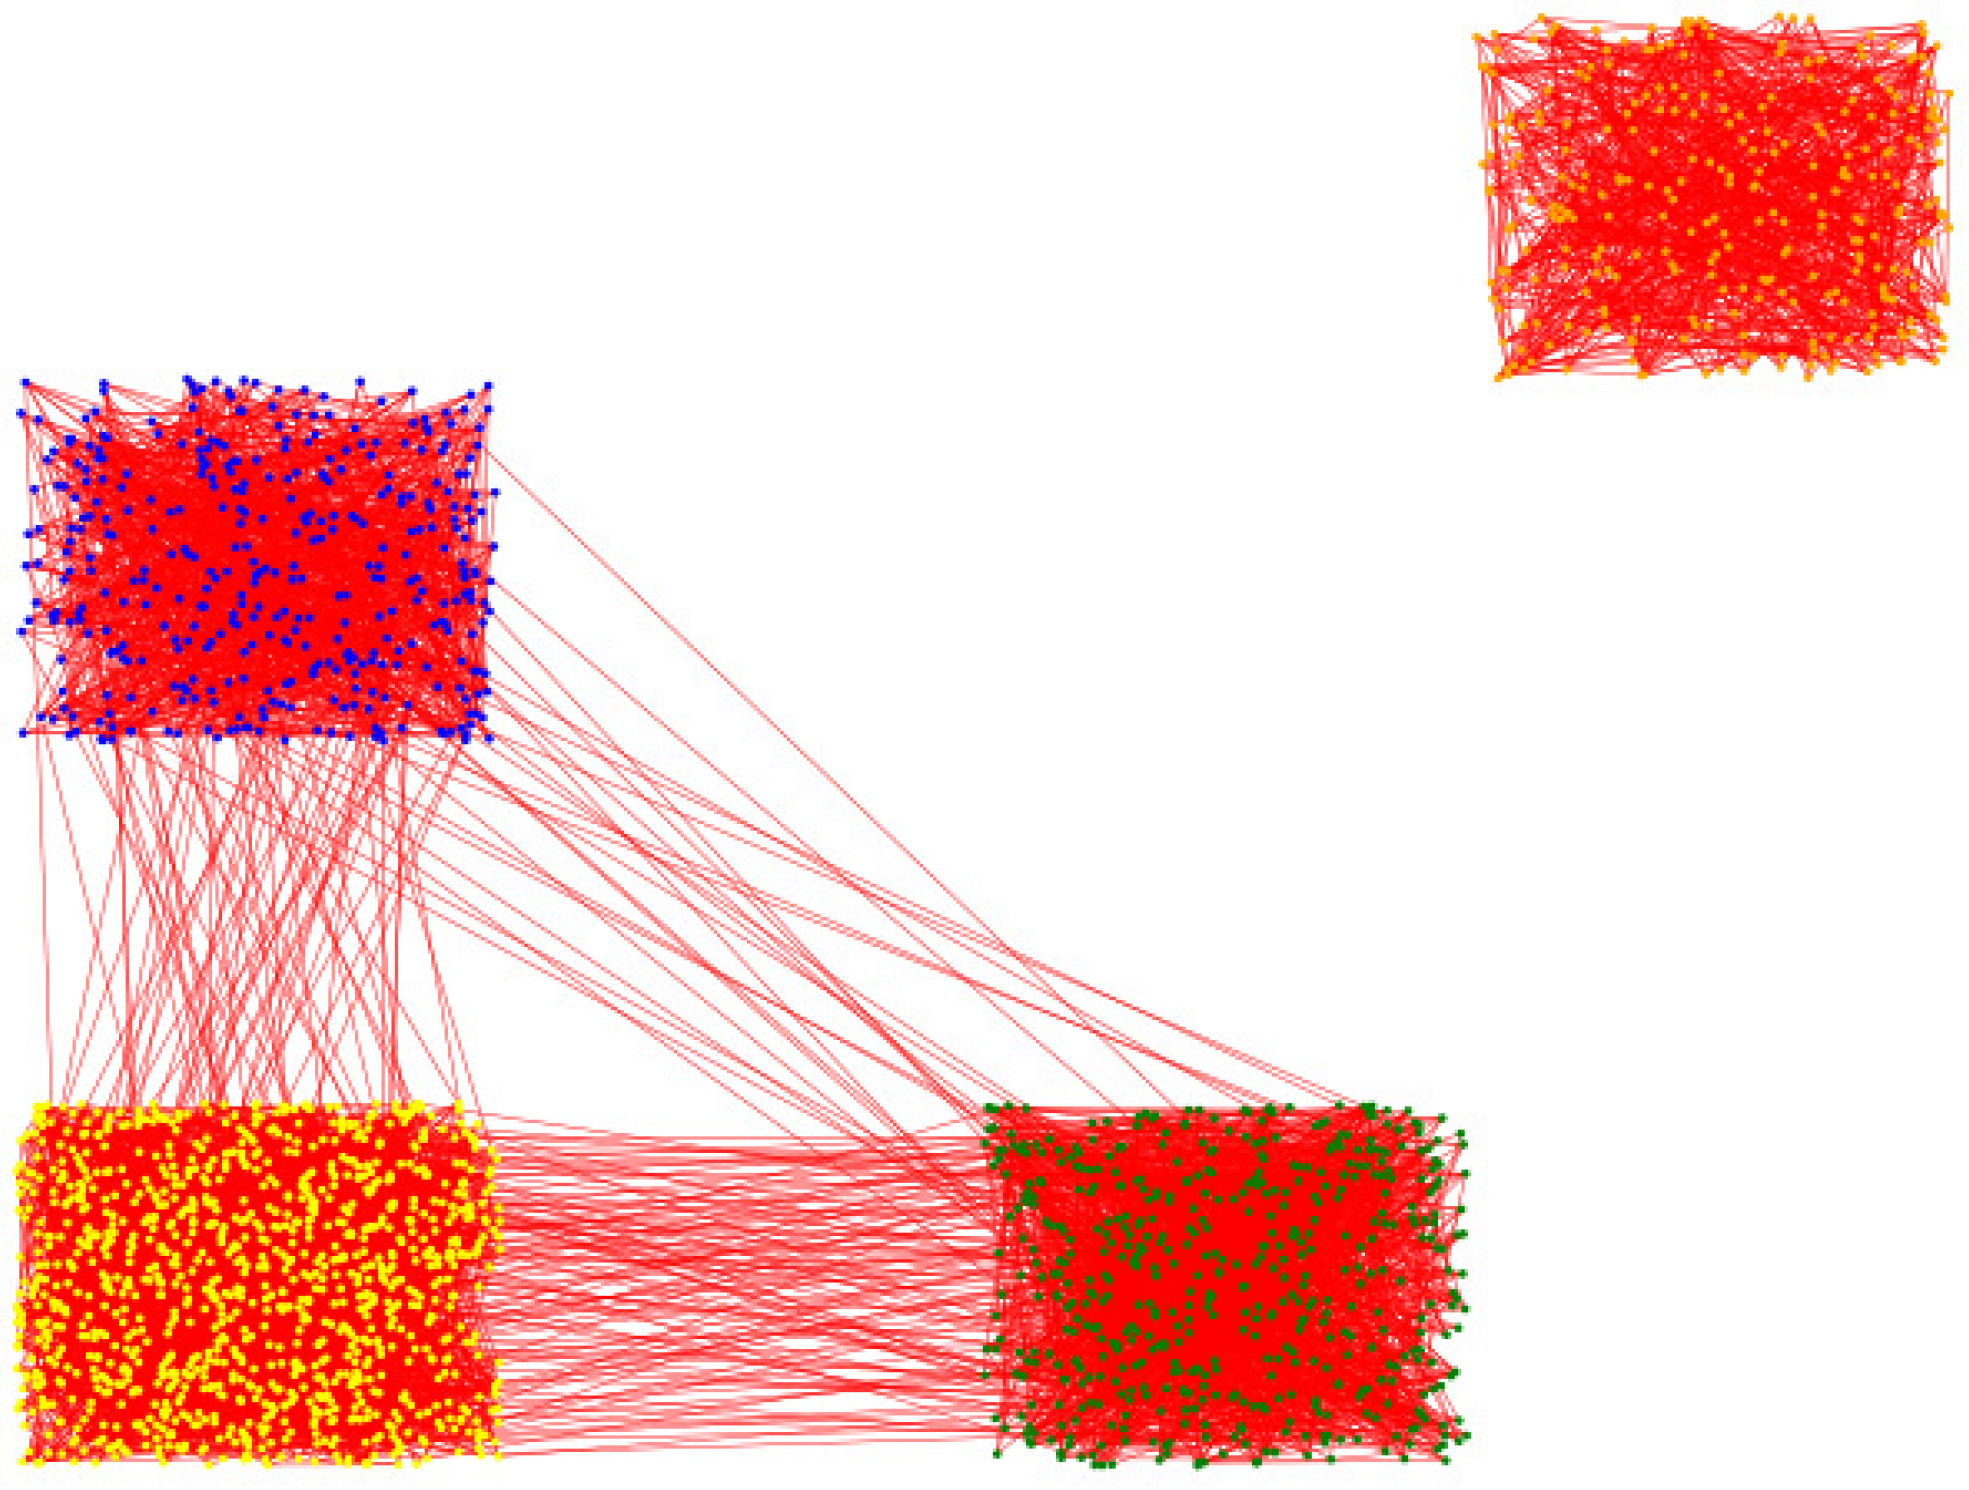
Based on the above, we construct the network according to the construction method of the multi-field paper association structure network. The parameters values are set as , ::: = 10:6:4:5, = 2000, = 300, = 500, n = 10, = 3, = 1, j = 0.8, z = 0.8, :: = 5:3:2, and q = 0.1. Figure 5 shows the initial paper research network in the four fields of a, b, c, and d, while Figure 6 shows the newly formed network after the COVID-19 field is added.
3.3. Paper Association Mechanism and Wall Breaking Principle between Multiple Research Fields during the COVID-19 Epidemic
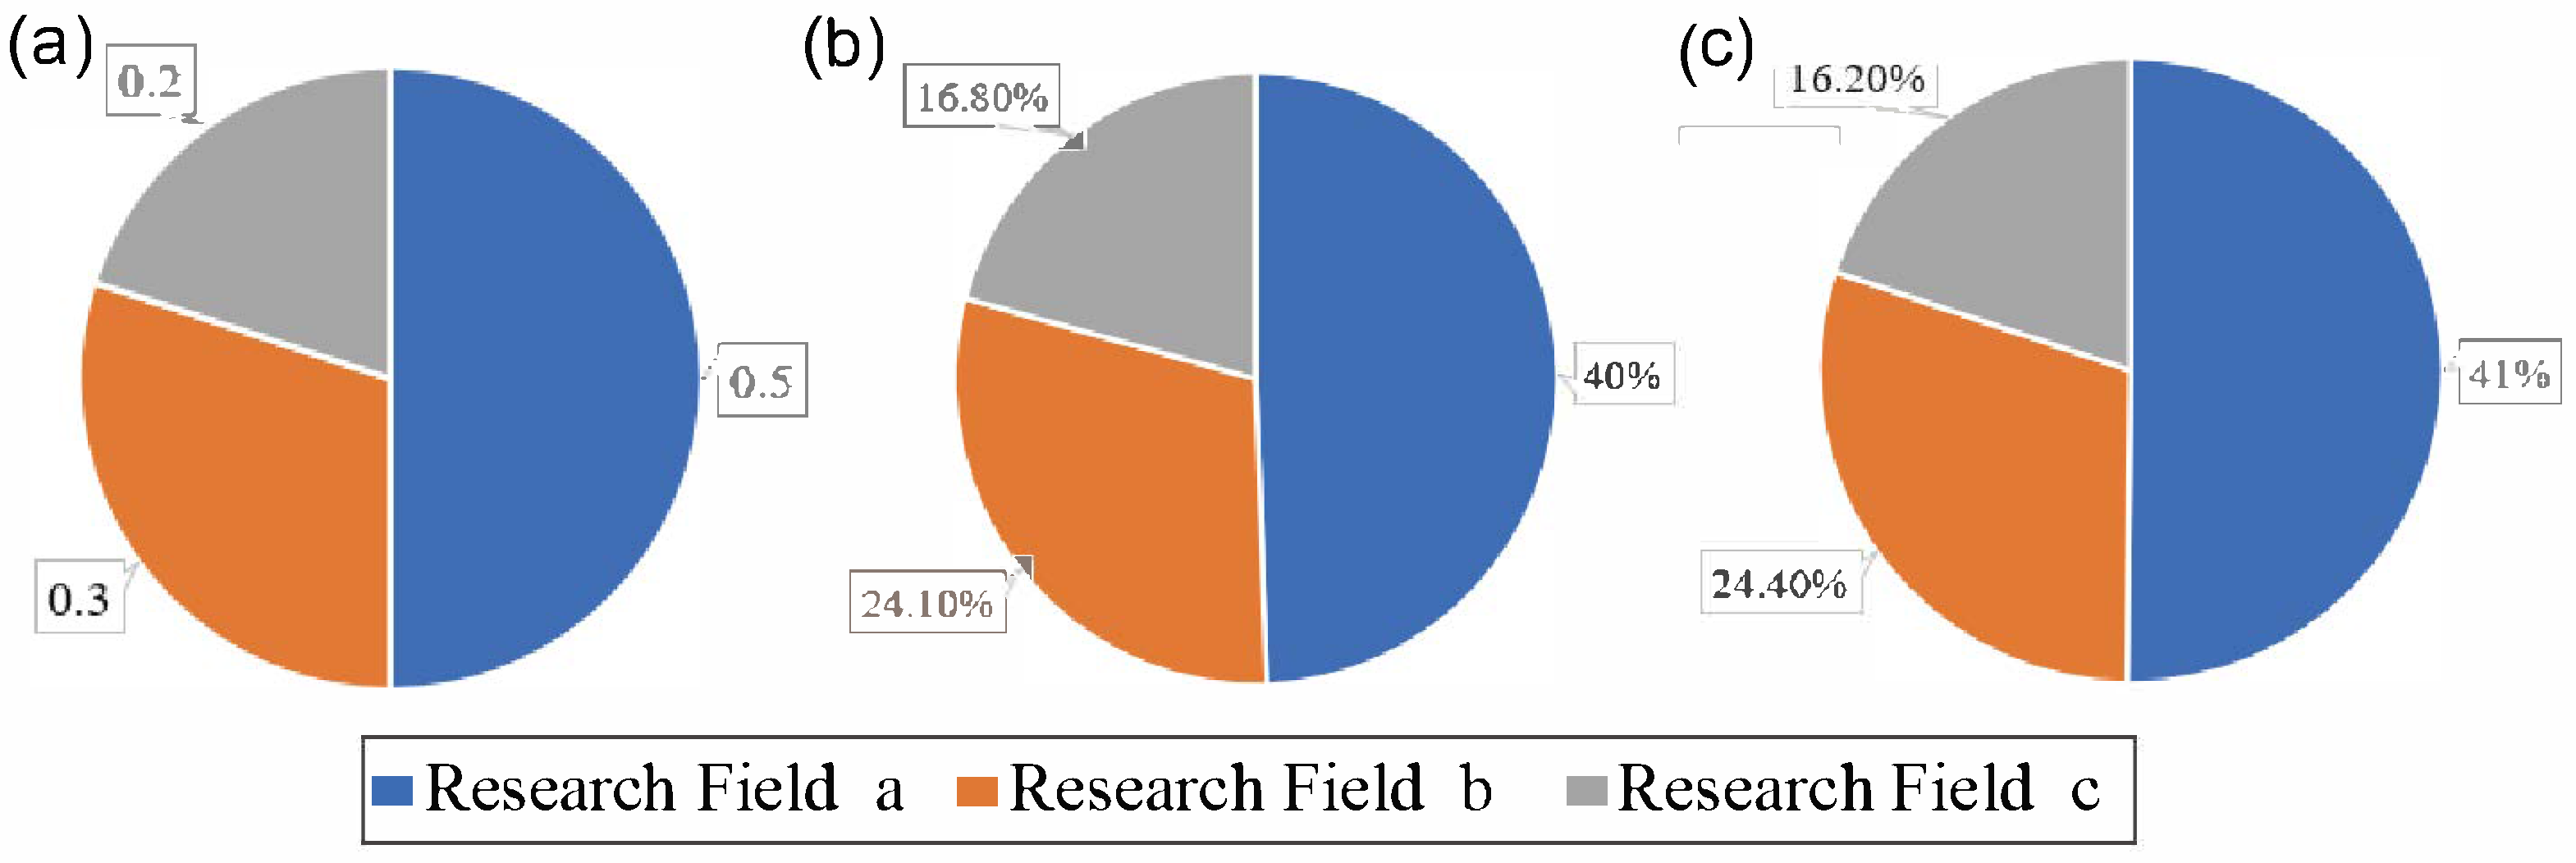
According to Figure 5 and Figure 6, before the outbreak of COVID-19, we can see that the initial a–b–c three-field paper association network and the initial d field paper network are not related and there is no edges between them. However, because of the emergence of COVID-19, many COVID-19-related papers have linked two kind of unrelated fields. To understand the impact of the large number of COVID-19 papers further, we conducted the related experiments. After the construction of the entire network was completed, we conducted a statistical analysis of articles with high connectivity degrees in the COVID-19 field. (In the experiment, we found all the authors in the articles with the top 5 largest connectivity degrees and all the authors in the articles with the top 6 largest connectivity degrees, respectively.) We found that. among all the authors of these articles produced during the COVID-19 pandemic, the number of authors in field a accounted for the most, followed by field b, and field c the least. As shown in Figure 7, among all the authors in the articles with the top 5 largest connectivity degrees, the ratio of the number of authors in the three fields of a, b, and c is 0.40:0.241:0.168, respectively. Among all the authors in the articles with the top 6 largest connectivity degrees, the ratio of the number of authors in the three fields of a, b, and c is 0.409:0.244:0.162, respectively. Because the papers with the larger connectivity degree are relatively important in the paper network, we can conclude that, in this special period of the COVID-19 pandemic, the higher is the correlation between the scholars’ research field and COVID-19, the more likely they are to produce important articles.
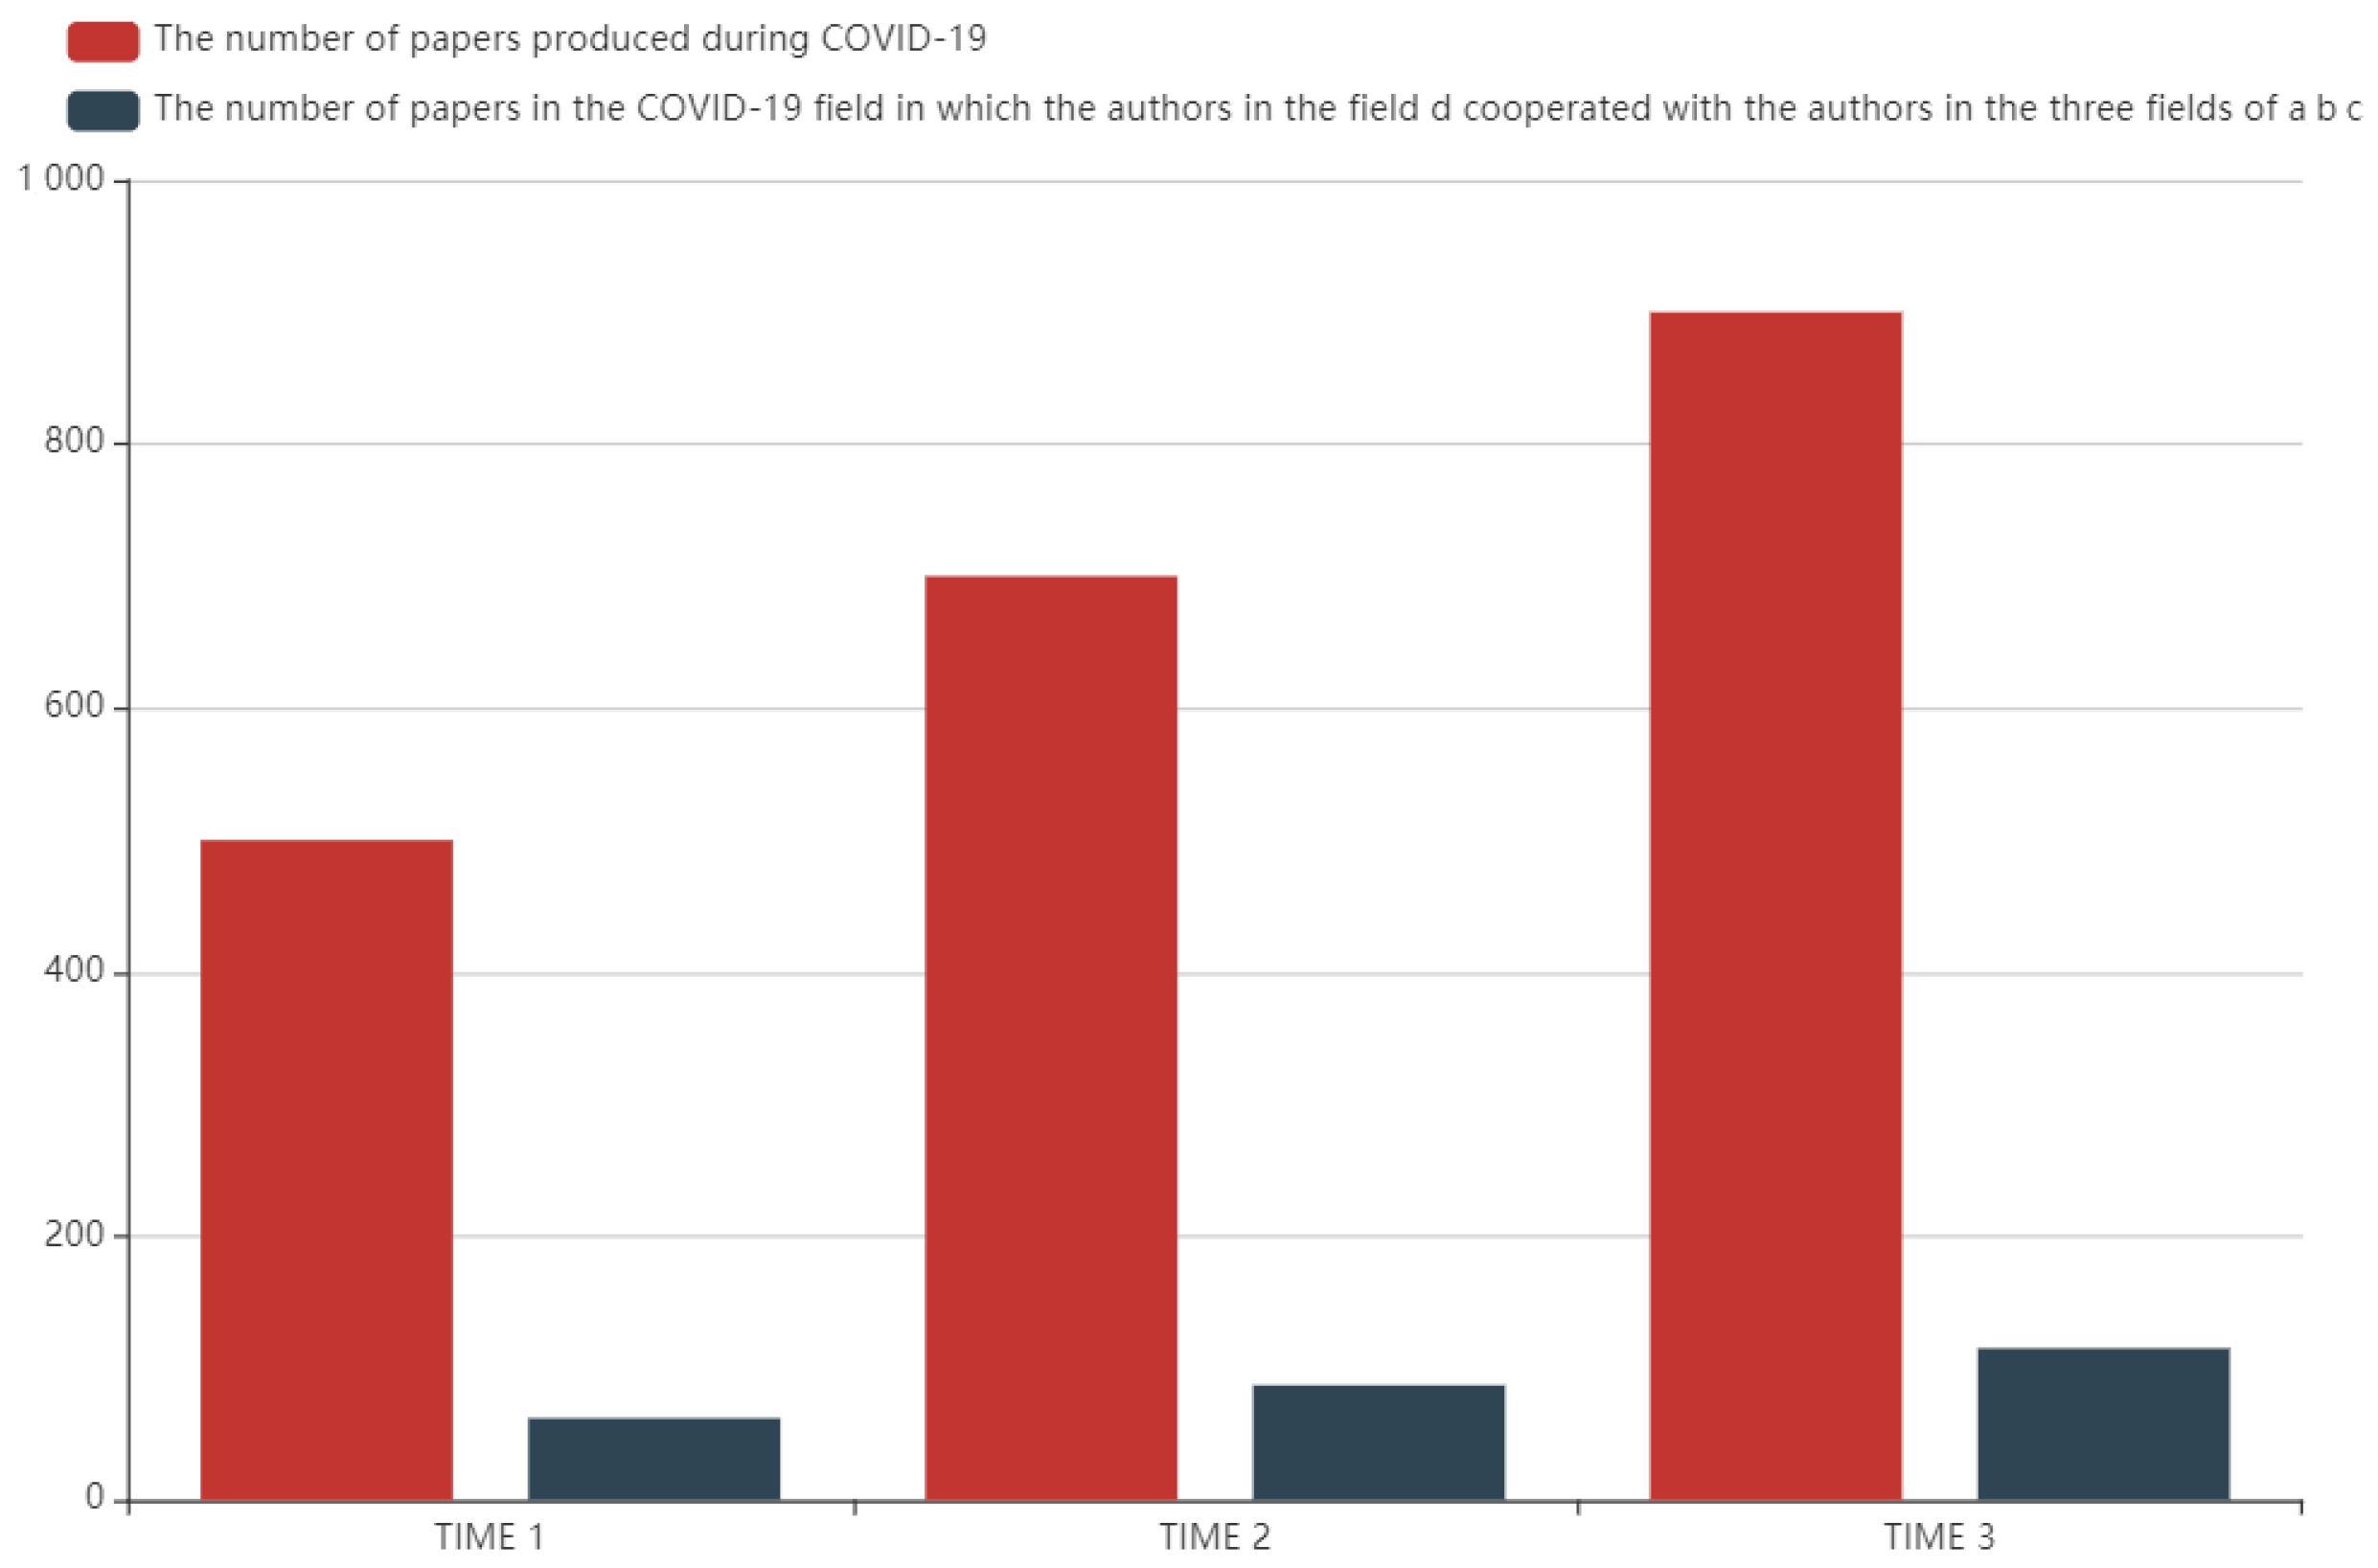
The initial fields a, b, and c are three related research fields and field d is not related to the previous three fields. The articles and the authors in the initial field d are independent of the first three fields. When the multi-field paper association structure network was constructed, we conducted a statistical analysis of all articles in the COVID-19 field. We found that many articles were created by authors in field d and the authors in the first three fields. As shown in Figure 8, when 500, 700, and 900 articles were generated during COVID-19, respectively, we found that 62, 87, and 115 articles in the COVID-19 field were co-authored by authors in field d and fields and c, respectively. Then, we considered the shortest path length of multi-field paper association structure network. Before the outbreak of COVID-19, the network constructed was as shown in Figure 5 ( = 0). The network in Figure 5 has no shortest path length because the network is not a connected network. With the propagation of COVID-19 virus, a large number of COVID-19 papers appeared in the paper association structure network and the constructed network was as shown in Figure 6. We counted the shortest path length of the network when = 500 and = 700, respectively, as shown in Table 1. This result showed that the distances between the papers in d field and papers in fields a, b, and c were narrowed. Thus, we concluded that the emergence of COVID-19 promoted the cooperation between the fields and c and field d, and it broke the barriers that existed before.
4. Model and Simulation
4.1. Knowledge Dissemination Model of the New Discoveries in the Multiple Fields
In the process of scientific research, for an important research area, some new articles will be produced in each period. At the same time, there are some articles that are not of great value or their views will not be spread in this field, and we can regard these articles as abandoned. In the propagation process of the COVID-19 disease, COVID-19 can be regarded as an important research field. Based on the construction of the above network, we use e to indicate that the number of new articles which enter into the COVID-19 field each time, to indicate that the number of newly articles which enter into field i at each time (), and u to indicate the abandoned articles density of each group in the COVID-19 fields, respectively.
In the process of the propagation of COVID-19, researchers have made a lot of important contributions, and they put forward many new ideas and findings. With the emergence of some new articles in this field, some new discoveries were also produced. When a new discovery is produced, it will spread among researchers in the field, and researchers will explore whether their articles can be combined with this discovery. When the new discovery is spread in the paper association network, we can regard it as a new knowledge dissemination in the network. Based on the previously constructed multi-field paper association structure network, we analyzed the propagation of a new discovery related to COVID-19 in multiple fields, especially in the COVID-19 field. In the COVID-19 field, for a new discovery related to COVID-19, we assume that represents the article was not aware of the discovery when the article came into being, represents that the article was aware of the discovery and applied it to its own article when the article came into being, and represents that the article was aware of the discovery but the discovery was not useful for its article or the discovery was out of date as time wnt by, thus lost interest and was not applied. Similarly, in field i (), we assume that represents the article was not aware of the discovery when the article came into being, represents that the article was aware of the discovery and applied it to its own article when the article came into being, and represents that the article was aware of the discovery but did not apply it. Inside the COVID-19 field, we set the propagation probability of new discoveries to be and the probability of losing interest as r. When the discovery of COVID-19 is spread to other fields from the COVID-19 field, we set the propagation probability of new discoveries to be . Inside fields , we set the propagation probability of the new discovery (related to COVID-19) to be and the probability of losing interest as .
Based on the above, we constructed the knowledge dissemination model of the new discoveries in multiple fields. Equation (1) represents that the knowledge dissemination model of the new discovery (related to COVID-19) in the COVID-19 field. Equation (2) represents that the knowledge dissemination model of the new discovery (related to COVID-19) in the other fields ( and d).
where denotes the inner-connection probability of papers in the COVID-19 field under the influence of incentive mechanism and potential impact mechanism, with j the incentive probability and z the the potential impact probability of writing papers. represents the inter-connection probability of papers between COVID-19 field and other fields under the influence of cross-field association mechanism, where represents the correlations between the other fields i and the COVID-19 field (). i stands for the other fields different from COVID-19.
4.2. The Basic Reproduction Number
From Equation (1), we can see that the propagation-free equilibrium =(,0,0). At this time, = exists. In Equation (1), we suppose that accepting the discoveries is called a new “infection” when the new discoveries spread. Based on the theory of basic reproduction number from Driesschea and Watmough [44], we regard and as the target population. In the propagation process of new discoveries, the added share matrix of these two groups of people due to the new discoveries’s “infection” can be shown as follows:
The added share matrix of these two groups of people due to other means besides the new discoveries’s “infection” is named . The reduced share matrix of these two groups of people due to the crowd removal from the two groups is named , and . Thus, we can get:
At the propagation-free equilibrium point, F and V take the first-order partial derivative of (, ), respectively, and we can obtain the following partial differential matrix.
Thus, we can get the and name it as the next generation matrix.
Thus, we can get the basic reproduction number in the COVID-19 field according to the spectral radius of . The basic reproduction number is:
4.3. Relevant New Findings
According to the expression of , when < 1, the new discovery will not propagate in the COVID-19 field. When > 1, the new discovery will be widely spread. We call it a major discovery if a new discovery can be widely spread. Therefore, according to the expression of , we can got the following conclusions:
- (i)
- When a new discovery comes into being in the COVID-19 field, the greater is the number of articles in the COVID-19 field at the moment, the higher is the possibility that this new discovery will be spread widely in the COVID-19 field.
- (ii)
- If the incentive mechanism and the potential mechanism of this field are stronger, the new discovery is more likely to spread widely.
- (iii)
- If a new discovery is not easy to make scholars lose interest, then it is more likely that this new discovery will be widely spread.
4.4. Simulation Results
According to the knowledge dissemination model of the new discovery in multiple fields, we present the simulations results to analyze the propagation characteristics of a new discovery related to COVID-19 in the multi-field paper association structure network. In the following experiments, the parameter values used to construct the network are consistent with those in Section 3.2. It is assumed that m new articles will be generated in the whole network each round, . Initially, articles are randomly selected as the articles with a new discovery (related to COVID-19) from the m new articles generated in the first round. We performed this simulation 20 times, 40 rounds per experiment iteration, and averaged the resulting propagation values.
In Figure 9a, we can see that the new discovery can be widely spread in the COVID-19 field when the spread probability of a new discovery is large enough and its application value is great. On the contrary, the new discovery will not be widely spread, as shown in Figure 9b. In Figure 9a, the curve shows a trend of increasing at first and then decreasing because this discovery was widely welcomed at first, but it will then be replaced by newer discoveries as time goes on (or if the discovery is out of date). Thus, the curve shows a trend of attenuation in the later stage. According to the curve, we can also see that more and more articles appear (these articles know about the first round of new discovery but do not apply it).
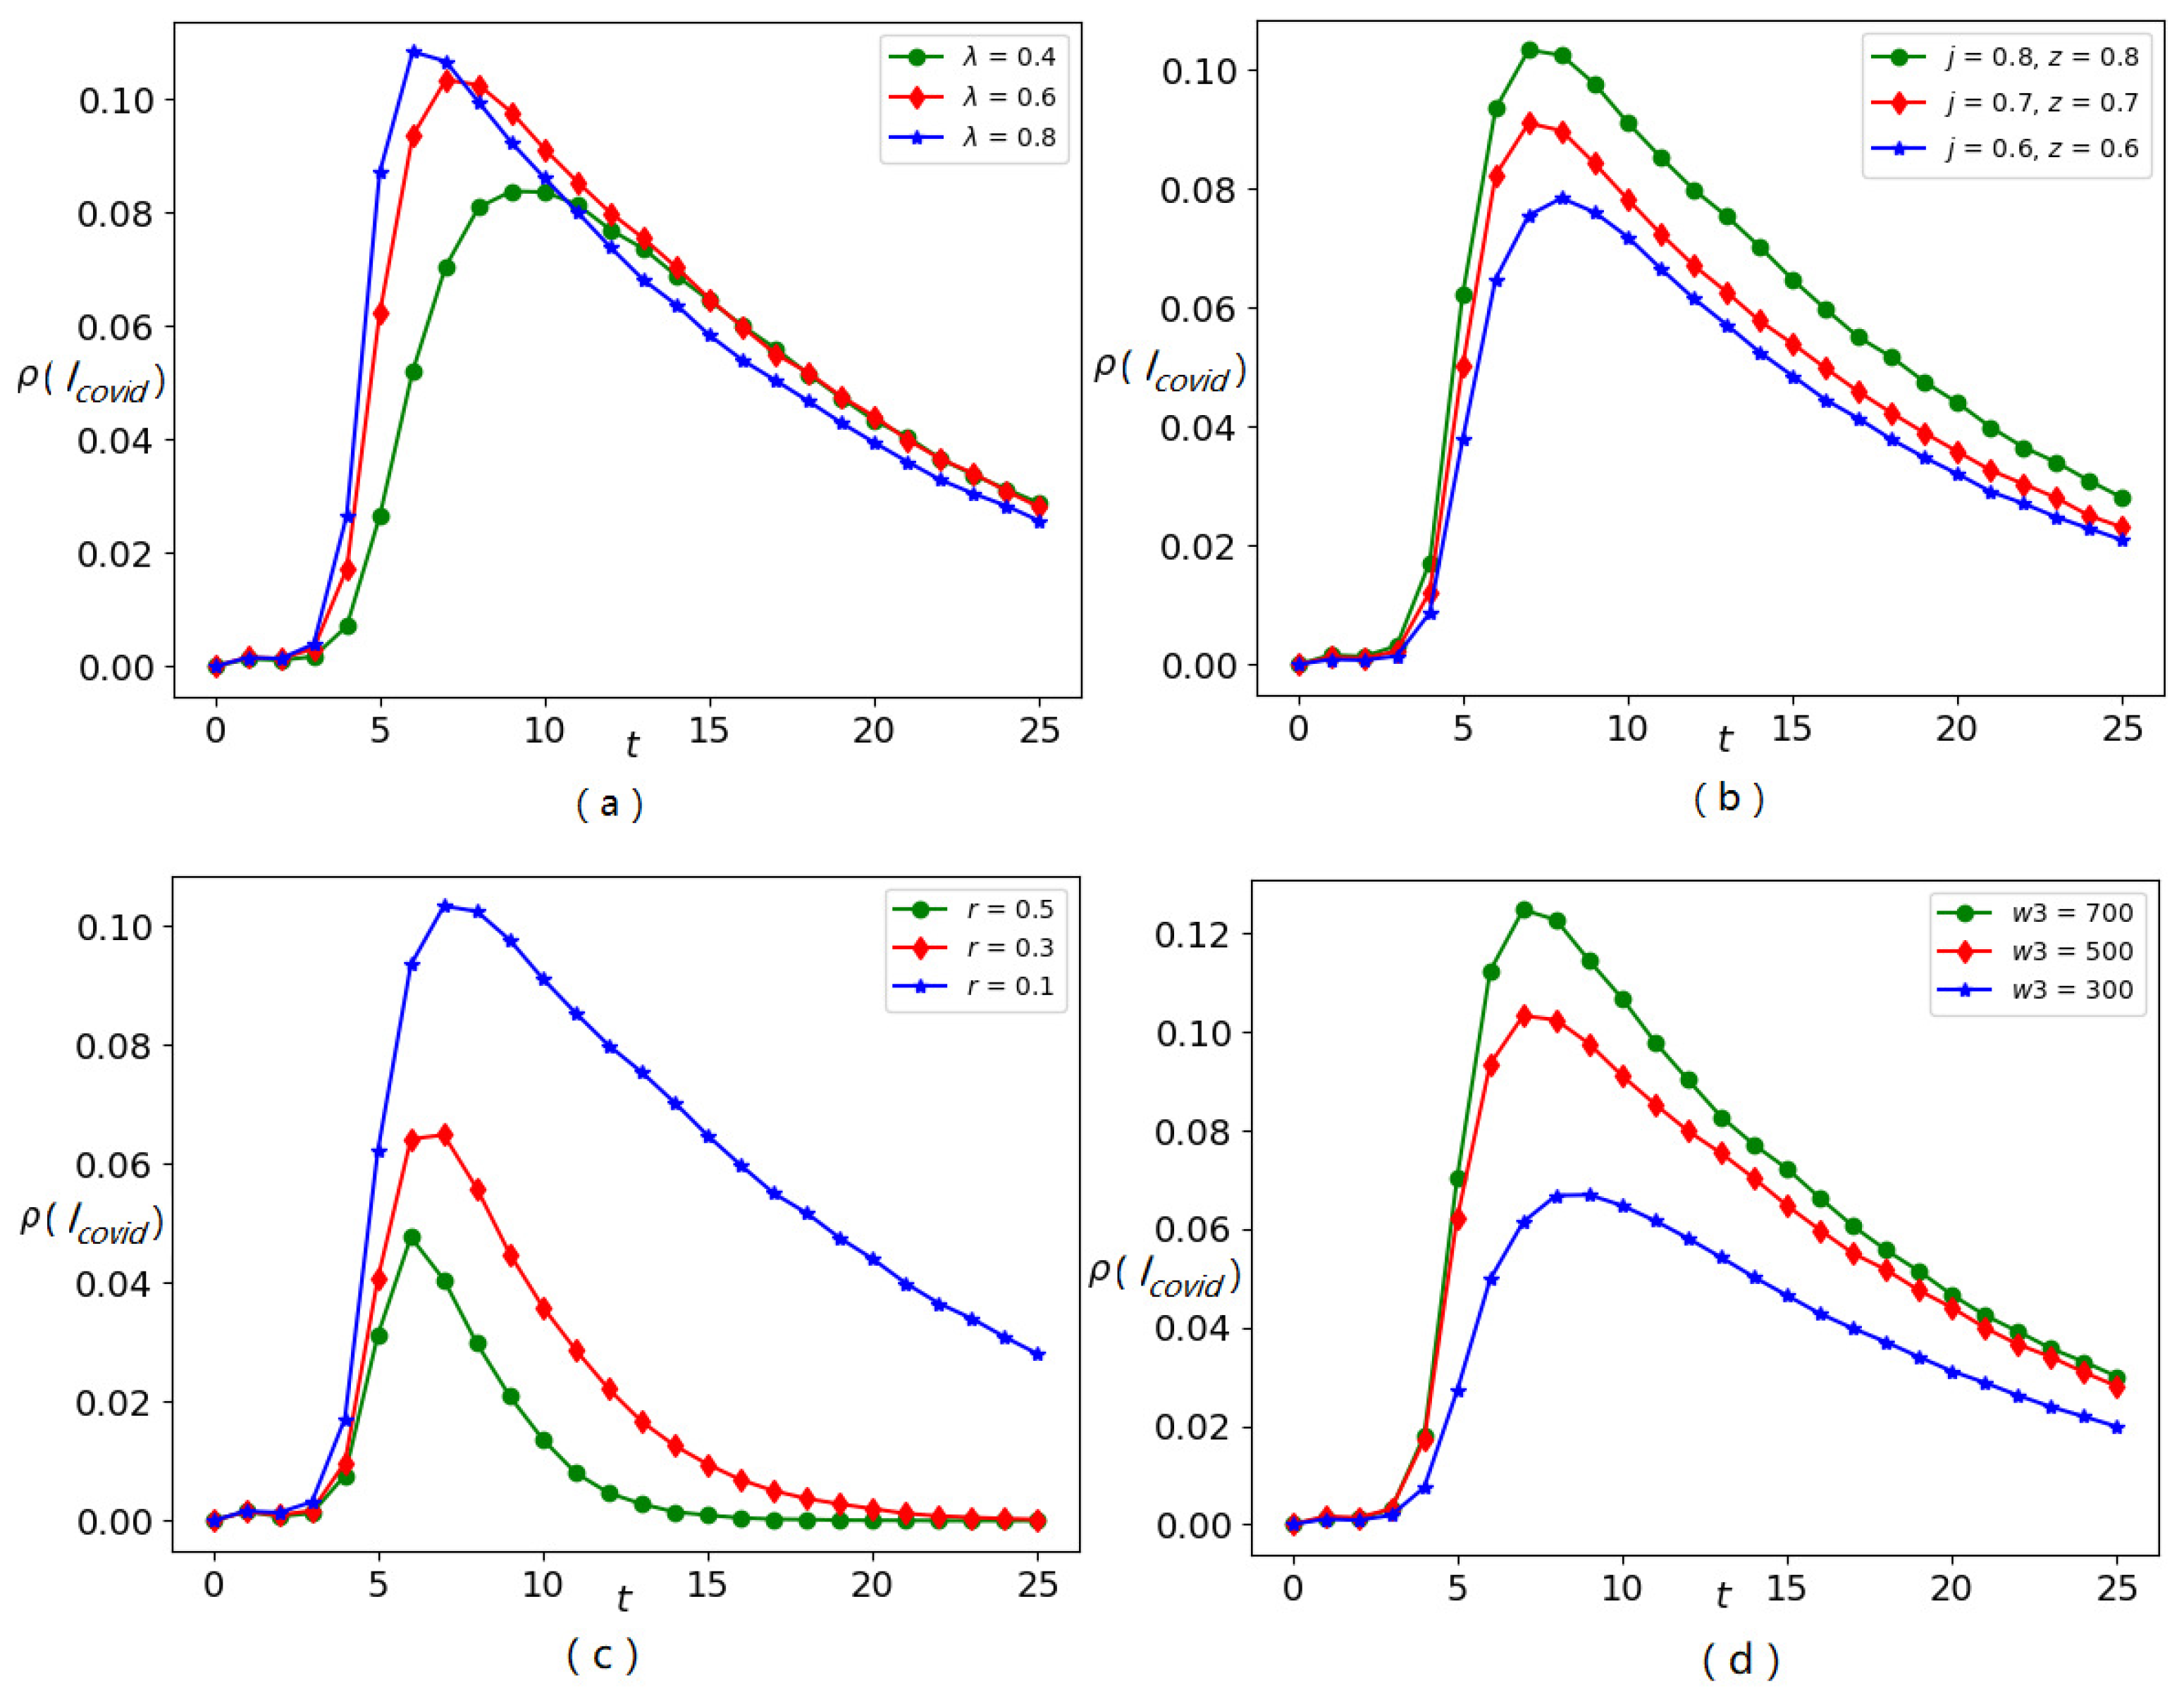
Figure 10 shows the impact of different factors on the propagation of a new discovery in the COVID-19 field. Figure 10a,b shows that transmission rate , incentive mechanism j, and potential impact probability z all play a role in promoting the propagation of the new discovery. As shown Figure 10c, if the probability of losing interest r in the new discovery is smaller, then the new discovery will be spread more widely. If there are more articles in the COVID-19 field when a new discovery was produced in the COVID-19 field, then there will be a stronger promotion to the propagation of this new discovery, as shown in Figure 10d. The above experimental results were consistent with those in Stages – of Section 4.3.
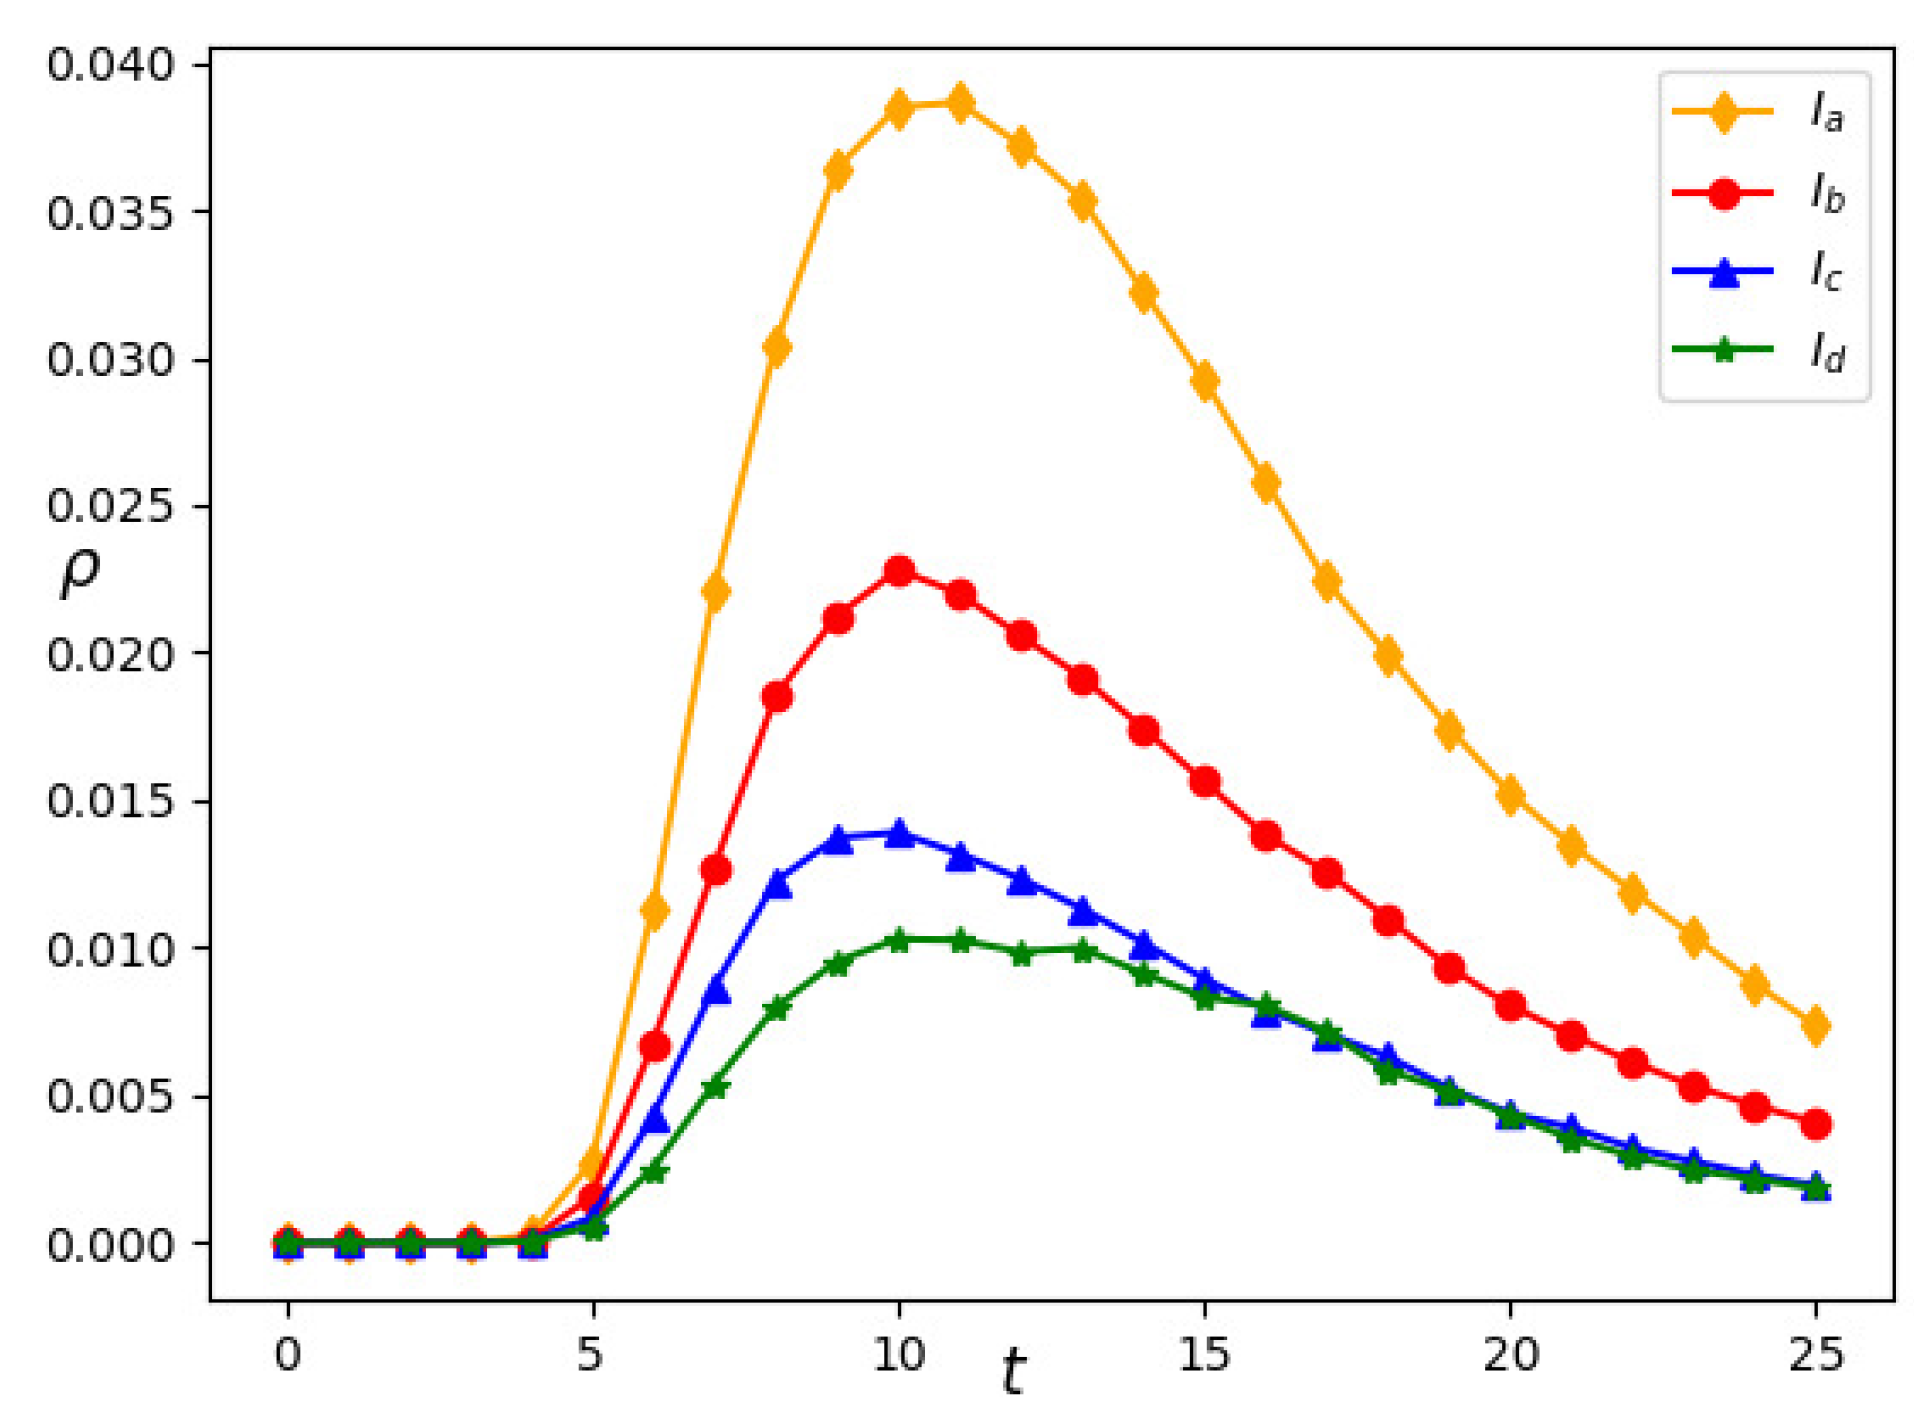
According to Figure 11, we can see that, if the value of a new discovery in the COVID-19 field is particularly high, then the new discovery will spread to the other adjacent fields. However, the number of articles applying this new discovery in other fields is smaller. The more relevant the field is to COVID-19, the greater is the number of articles that apply this new discovery in that field, as can be seen from the curve change of , , and in Figure 11. Similarly, we assume that, if a new discovery is produced in field d and the transmission rate of this new discovery is extremely high, then its application is extremely high. According to the network topology in Figure 6, we consider that the new discovery in field d is likely to spread to fields a, b, and c, thus it also proves that the barriers among fields a, b, c, and d will break down.
5. Conclusions
In recent years, there has been a lot of research in the paper citation network and scientific cooperation network [45,46,47]. Based on the data generated by COVID-19, this paper makes a small supplement to the previous studies and finds three mechanisms that affect the growth of COVID-19 papers: incentive mechanisms, cross-field collaboration mechanism, and potential impact mechanism of writing papers. According to the traditional construction method of the community network, combined with these three mechanisms, we built a multi-field paper association structure network. Through experiments, we found that the production of many COVID-19-related papers breaks the barriers between unrelated fields and further promotes the integration of multiple fields. At the same time, we can conclude that the more relevant the research field of scholars is to COVID-19 during the outbreak of COVID-19 (the special period), the easier it is to produce more important articles in the COVID-19 field. Finally, based on the propagation characteristics of new discoveries related to COVID-19, we constructed the knowledge dissemination model of the new discoveries in multiple fields. We found that the incentive mechanism and potential impact mechanism can promote the dissemination of the new findings in the field of COVID-19. Through the construction of the model, it can provide ideas to promote the dissemination of important new discoveries and help researchers know about important new discoveries in time.
At present, SARS-CoV-2 is still spreading everywhere in many countries. The rapid spread of important new discoveries related to COVID-19 can help people find solutions to control the virus more quickly. However, there are few related studies. In the following work, to realize the rapid dissemination of important new discoveries in the COVID-19 field, we will study and propose a specific scheme based on the scientific collaboration network.
Author Contributions
Conceptualization, Z.D.; data curation, J.Z.; formal analysis, Z.D. and J.Z.; funding acquisition, L.L. and H.P.; investigation, H.P.; methodology, Z.D. and L.L.; resources, H.P.; software, Z.D.; supervision, H.P.; validation, J.Z.; writing—original draft, Z.D. and L.L.; writing—review & editing, J.Z. All authors have read and agreed to the published version of the manuscript.
Funding
This research received no external funding.
Acknowledgments
The authors would like to thank the editor and the reviewers. This paper was partly supported by the National Natural Science Foundation of China [grant numbers 62032002, 61972051]; and the BUPT Excellent Ph.D Students Foundation [grant number CX2019116].
Conflicts of Interest
The authors declare no conflict of interest.
References
- Cao, X.T. COVID-19: Immunopathology and its implications for therapy. Nat. Rev. Immunol. 2020, 20, 269–270. [Google Scholar] [CrossRef] [PubMed] [Green Version]
- Yang, L.; Liu, S.; Liu, J.; Zhang, Z.; Wan, X.; Huang, B.; Chen, Y.; Zhang, Y. COVID-19: Immunopathogenesis and Immunotherapeutics. Signal Transduct. Target. Ther. 2020, 5, 1–8. [Google Scholar] [CrossRef] [PubMed]
- Jeyanathan, M.; Afkhami, S.; Smaill, F.; Miller, M.S.; Lichty, B.D.; Xing, Z. Immunological considerations for COVID-19 vaccine strategies. Nat. Rev. Immunol. 2020, 20, 615–632. [Google Scholar] [CrossRef] [PubMed]
- Porter, S.J.; Hook, D.W. How COVID-19 is Changing Research Culture; Digital Science: London, UK, 2020. [Google Scholar]
- Bertuzzo, E.; Mari, L.; Pasetto, D.; Miccoli, S.; Casagr, R.; Gatto, M.; Rinaldo, A. The geography of COVID-19 spread in Italy and implications for the relaxation of confinement measures. Nat. Commun. 2020, 11. [Google Scholar] [CrossRef] [PubMed]
- Lasisi, T.T.; Eluwole, K.K. Is the weather-induced COVID-19 spread hypothesis a myth or reality? Evidence from the Russian Federation. Environ. Sci. Pollut. Res. 2020, 1–5. [Google Scholar] [CrossRef]
- Mahmud, T.; Rahman, M.A.; Fattah, S.A. CovXNet: A multi-dilation convolutional neural network for automatic COVID-19 and other pneumonia detection from chest X-ray images with transferable multi-receptive feature optimization. Comput. Biol. Med. 2020, 122, 103869. [Google Scholar] [CrossRef]
- Oni, T.; Micklesfield, L.K.; Wadende, P.; Obonyo, C.O.; Woodcock, J.; Mogo, E.R.I.; Odunitan-Wayas, F.A.; Assah, F.; Tatah, L.; Foley, L.; et al. Implications of COVID-19 control measures for diet and physical activity, and lessons for addressing other pandemics facing rapidly urbanising countries. Glob. Health Action 2020, 13, 1810415. [Google Scholar] [CrossRef]
- Abbasi, A.; Hossain, L.; Uddin, S.; Rasmussen, K.J. Evolutionary dynamics of scientific collaboration networks: Multi-levels and cross-time analysis. Scientometrics 2011, 89, 687–710. [Google Scholar] [CrossRef] [Green Version]
- Ramasco, J.J.; Dorogovtsev, S.N.; Pastor-Satorras, R. Self-organization of collaboration networks. Phys. Rev. E 2004, 70, 036106. [Google Scholar] [CrossRef] [Green Version]
- Chirita, P.A.; Damian, A.; Nejdl, W.; Siberski, W. Search strategies for scientific collaboration networks. In Proceedings of the 2005 ACM Workshop on Information Retrieval in Peer-to-Peer Networks, Bremen, Germany, 4 November 2005; pp. 33–40. [Google Scholar]
- Pan, P.K.; Kaski, K.; Fortunato, S. World citation and collaboration networks: Uncovering the role of geography in science. Sci. Rep. 2012, 2, 902. [Google Scholar] [CrossRef] [Green Version]
- Zhou, J.; Zeng, A.; Fan, Y.; Di, Z. Identifying important scholars via directed scientific collaboration networks. Scientometrics 2018, 114, 1327–1343. [Google Scholar] [CrossRef]
- Chadegani, A.A.; Salehi, H.; Yunus, M.; Farhadi, H.; Fooladi, M.; Farhadi, M.; Ebrahim, N.A. A comparison between two main academic literature collections: Web of Science and Scopus databases. Asian Soc. Sci. 2013, 9, 18–26. [Google Scholar] [CrossRef] [Green Version]
- Lu, S.F.; Jin, G.Z.; Uzzi, B.; Jones, B. The retraction penalty: Evidence from the Web of Science. Sci. Rep. 2013, 3, 1–5. [Google Scholar] [CrossRef]
- Paul-Hus, A.; Desrochers, N.; Costas, R. Characterization, description, and considerations for the use of funding acknowledgement data in Web of Science. Scientometrics 2016, 108, 167–182. [Google Scholar] [CrossRef] [Green Version]
- Newman, M.E.J. Scientific collaboration networks. I. Network construction and fundamental results. Phys. Rev. E 2001, 64, 016131. [Google Scholar] [CrossRef] [PubMed] [Green Version]
- Newman, M.E.J. The structure of scientific collaboration networks. Proc. Natl. Acad. Sci. USA 2001, 98, 404–409. [Google Scholar] [CrossRef] [PubMed]
- Newman, M.E.J. Coauthorship networks and patterns of scientific collaboration. Proc. Natl. Acad. Sci. USA 2004, 101, 5200–5205. [Google Scholar] [CrossRef] [Green Version]
- Newman, M.E.J. Scientific collaboration networks. II. Shortest paths, weighted networks, and centrality. Phys. Rev. E 2001, 64, 016132. [Google Scholar] [CrossRef] [Green Version]
- Liu, X.F.; Xu, X.K.; Small, M.; Chi, K.T. Attack resilience of the evolving scientific collaboration network. PLoS ONE 2011, 6, e26271. [Google Scholar] [CrossRef] [Green Version]
- Zhao, L.; Zhang, Q.; Wang, L. Benefit distribution mechanism in the team members’ scientific research collaboration network. Scientometrics 2014, 100, 363–389. [Google Scholar] [CrossRef]
- Shi, Q.; Xu, B.; Xu, X.; Xiao, Y.; Wang, W.; Wang, H. Diversity of social ties in scientific collaboration networks. Phys. A Stat. Mech. Appl. 2011, 390, 4627–4635. [Google Scholar] [CrossRef]
- Ferligoj, A.; Kronegger, L.; Mali, F.; Snijders, T.A.; Doreian, P. Scientific collaboration dynamics in a national scientific system. Scientometrics. 2015, 104, 985–1012. [Google Scholar] [CrossRef] [PubMed] [Green Version]
- Li, Y.; Li, H.; Liu, N.; Liu, X. Important institutions of interinstitutional scientific collaboration networks in materials science. Scientometrics 2018, 117, 85–103. [Google Scholar] [CrossRef]
- Ke, Q.; Ahn, Y.Y. Tie strength distribution in scientific collaboration networks. Phys. Rev. E 2014, 90, 032804. [Google Scholar] [CrossRef] [PubMed] [Green Version]
- Sonnenwald, D.H. Scientific collaboration: A synthesis of challenges and strategies. Annu. Rev. Inf. Sci. Technol. 2007, 41, 643–681. [Google Scholar] [CrossRef]
- Hara, N.; Solomon, P.; Kim, S.L.; Sonnenwald, D.H. An emerging view of scientific collaboration: Scientists’ perspectives on collaboration and factors that impact collaboration. J. Am. Soc. Inf. Sci. Technol. 2003, 54, 952–965. [Google Scholar] [CrossRef]
- Katz, J. Geographical proximity and scientific collaboration. Scientometrics 1994, 31, 31–43. [Google Scholar] [CrossRef]
- Kretschmer, H. Author productivity and geodesic distance in bibliographic co-authorship networks, and visibility on the Web. Scientometrics 2004, 60, 409–420. [Google Scholar] [CrossRef]
- Barabâsi, A.L.; Jeong, H.; Néda, Z.; Ravasz, E.; Schubert, A.; Vicsek, T. Evolution of the social network of scientific collaborations. Phys. A Stat. Mech. Its Appl. 2002, 311, 590–614. [Google Scholar] [CrossRef] [Green Version]
- Kim, J.; Diesner, J. The effect of data pre-processing on understanding the evolution of collaboration networks. J. Inf. 2015, 9, 226–236. [Google Scholar] [CrossRef]
- Wagner, C.S.; Roessner, J.D.; Bobb, K.; Klein, J.T.; Boyack, K.W.; Keyton, J.; Rafols, I.; Bornerf, K. Approaches to understanding and measuring interdisciplinary scientific research (IDR): A review of the literature. J. Inf. 2011, 5, 14–26. [Google Scholar] [CrossRef]
- Boman, J.H., IV; Mowen, T.J. Same feathers, different flocks: Breaking down the meaning of ‘behavioral Homophily’in the etiology of crime. J. Crim. Justice. 2018, 54, 30–40. [Google Scholar] [CrossRef] [PubMed]
- Ruan, Z.; Hui, P.; Lin, H.; Liu, Z. Risks of an epidemic in a two-layered railway-local area traveling network. Eur. Phys. J. B 2013, 86, 13. [Google Scholar] [CrossRef] [PubMed]
- Duyckaerts, C.; Clavaguera, F.; Potier, M.C. The prion-like propagation hypothesis in Alzheimer’s and Parkinson’s disease. Curr. Opin. Neurol. 2019, 32, 266–271. [Google Scholar] [CrossRef] [PubMed]
- Zhu, L.; Zhao, H.; Wang, H. Stability and spatial patterns of an epidemic-like rumor propagation model with diffusions. Phys. Scr. 2019, 94, 085007. [Google Scholar] [CrossRef]
- WHO: A Total of 36002827 New Crown Cases Were Confirmed in the World. Available online: http://www.xinhuanet.com/2020-10/09/c_1126583044.htm (accessed on 9 October 2020).
- The Director General of the World Health Organization, Tedros Adhanom Ghebreyesus Announced That the Novel Coronavirus Pneumonia Risk Level Would Be Raised to “Very High” from the Previous “High” Level. Available online: http://www.xinhuanet.com/world/2020-02/28/c_1125641349.htm (accessed on 28 February 2020).
- Gasmi, A.; Noor, S.; Tippairote, T.; Dadar, M.; Menzel, A.; Bjorklund, G. Individual risk management strategy and potential therapeutic options for the COVID-19 pandemic. Clin. Immunol. 2020, 215, 108409. [Google Scholar] [CrossRef]
- Fiorino, G.; Colombo, M.; Natale, C.; Azzolini, E.; Lagioia, M.; Danese, S. Clinician Education and Adoption of Preventive Measures for COVID-19: A Survey of a Convenience Sample of General Practitioners in Lombardy, Italy. Ann. Intern. Med. 2020. [Google Scholar] [CrossRef]
- Guner, H.R.; Hasanoglu, İ.; Aktas, F. COVID-19: Prevention and control measures in community. Turk. J. Med Sci. 2020, 50, 571–577. [Google Scholar] [CrossRef]
- Horbach, S.P.J.M. Pandemic Publishing: Medical journals strongly speed up their publication process for Covid-19. Quant. Sci. Stud. 2020, 1, 1056–1067. [Google Scholar] [CrossRef]
- Moreno, Y.; Pastor-Satorras, R.; Vespignani, A. Epidemic outbreaks in complex heterogeneous networks. Eur. Phys. J. B-Condens. Matter Complex Syst. 2002, 26, 521–529. [Google Scholar] [CrossRef]
- Hummon, N.P.; Dereian, P. Connectivity in a citation network: The development of DNA theory. Soc. Netw. 1989, 11, 39–63. [Google Scholar] [CrossRef]
- Dawson, S.; Gašević, D.; Siemens, G.; Joksimovic, S. Current state and future trends: A citation network analysis of the learning analytics field. In Proceedings of the Fourth International Conference on Learning Analytics and Knowledge, Indianapolis, IN, USA, 24–28 March 2014; pp. 231–240. [Google Scholar]
- Kajikawa, Y.; Ohno, J.; Takeda, Y.; Matsushima, K.; Komiyama, H. Creating an academic landscape of sustainability science: An analysis of the citation network. Sustain. Sci. 2007, 2, 221. [Google Scholar] [CrossRef] [Green Version]
Figure 1.
Number of COVID-19-related papers published monthly from the beginning of January to 27 September in 2020.
Figure 1.
Number of COVID-19-related papers published monthly from the beginning of January to 27 September in 2020.

Figure 2.
The areas covered in the COVID-19 articles; there are more than 220 areas in this figure.

Figure 3.
The most closely connected author community chart when the authors of all the articles in February are interconnected. The actual author’s name is marked on each point, and the red edge is used to connect the points in the network.
Figure 3.
The most closely connected author community chart when the authors of all the articles in February are interconnected. The actual author’s name is marked on each point, and the red edge is used to connect the points in the network.

Figure 4.
The author community with the largest number of published articles when the authors of all articles in February are interconnected. The actual author’s name is marked on each point, and the red edge is used to connect the points in the network.
Figure 4.
The author community with the largest number of published articles when the authors of all articles in February are interconnected. The actual author’s name is marked on each point, and the red edge is used to connect the points in the network.

Figure 5.
The initial paper research network in the four fields of a, b, c, and d. The yellow dot represents the articles in field a, the green dot represents the article in field b, the blue dot represents the article in field c, and the orange dot represents the article in field d. Points in the network are connected by red edges.

Figure 6.
The newly formed network after the COVID-19 field is added. The yellow dot represents the articles in field a, the green dot represents the article in field b, the blue dot represents the article in field c, the orange dot represents the article in field d, and the black dot represents the article in the COVID-19 field. Points in the network are connected by red edges.

Figure 7.
The authors proportion of the fields a, b, and c covered by important articles in the COVID-19 field is compared with the correlation strength between the fields a, b, c, and the COVID-19 field. (a) The correlation strength of fields a, b, and c with COVID-19, respectively. (b) The authors proportion of the fields a, b, and c covered by the articles with the top 5 largest connectivity degrees in the COVID-19 field. (c) The authors proportion of the fields a, b, and c covered by the articles with the top 6 largest connectivity degrees in the COVID-19 field.

Figure 8.
When 500, 700, and 900 articles were generated during the COVID-19 period, respectively, the number of articles in the COVID-19 field in which the authors in the field d cooperated with the authors in the first three fields are shown. Three parts (TIME1, TIME2, and TIME3) are shown in this figure.

Figure 9.
(a) The density change curve of , , and with time through simulating the knowledge dissemination model when a new discovery is widely spread in the COVID-19 field. Here, m = 50, = 0.6, = 0.3, = 0.05, r = 0.1, = 0.15, j = 0.8, z = 0.8, and u = 0.05. (b) The density change curve of with time when a new discovery is not widely disseminated or is of little value in the COVID-19 field. Here, m = 50, = 0.01, = 0.01, r = 0.3, = 0.15, j = 0.8, z = 0.8, and u = 0.05. The ordinate of Figure 9a,b represents the proportion of , , and in the COVID-19 field to all articles in the network.

Figure 10.
The influence of different factors on the spread of the new discovery when a new discovery is spread in the COVID-19 field. (a) The density change curve of with time when is different and the other parameters remain unchanged as m = 50, = 0.3, r = 0.1, = 0.05, = 0.15, j = 0.8, z = 0.8, and u = 0.05, = 500. (b) The density change curve of with time when j and z are different and the other parameters remain unchanged as m = 50, = 0.6, = 0.3, r = 0.1, = 0.05, = 0.15, u = 0.05, and = 500. (c) The density change curve of with time when r is different and the other parameters remain unchanged as m = 50, = 0.6, = 0.3, = 0.05, = 0.15, j = 0.8, z = 0.8, u = 0.05, and = 500. (d) The density change curve of with time when is different and the other parameters remain unchanged as m = 50, = 0.6, = 0.3, r = 0.1, = 0.05, = 0.15, j = 0.8, z = 0.8, and u = 0.05. The ordinate in (a–d) represents the proportion of articles containing this new discovery in the COVID-19 field to all articles in the network.

Figure 11.
The spread situation of the new discovery in other fields when a new discovery in COVID-19 field is spread to other fields, with m = 50, = 0.6, = 0.3, r = 0.1, = 0.05, = 0.15, j = 0.8, z = 0.8, and u = 0.05. The ordinate represents the proportion of articles containing this new discovery in fields and d to all articles in the network, respectively.


Table 1.
The change of average shortest path length with in the network.
| The Value of | Average Shortest Path Length |
|---|---|
| 0 | NULL |
| 500 | 5.497 |
| 700 | 5.37 |
Publisher’s Note: MDPI stays neutral with regard to jurisdictional claims in published maps and institutional affiliations. |
© 2021 by the authors. Licensee MDPI, Basel, Switzerland. This article is an open access article distributed under the terms and conditions of the Creative Commons Attribution (CC BY) license (http://creativecommons.org/licenses/by/4.0/).
Share and Cite
MDPI and ACS Style
Dang, Z.; Li, L.; Peng, H.; Zhang, J. Impact of Sudden Global Events on Cross-Field Research Cooperation. Information 2021, 12, 26. https://0-doi-org.brum.beds.ac.uk/10.3390/info12010026
AMA Style
Dang Z, Li L, Peng H, Zhang J. Impact of Sudden Global Events on Cross-Field Research Cooperation. Information. 2021; 12(1):26. https://0-doi-org.brum.beds.ac.uk/10.3390/info12010026
Chicago/Turabian StyleDang, Zhongkai, Lixiang Li, Haipeng Peng, and Jiaxuan Zhang. 2021. "Impact of Sudden Global Events on Cross-Field Research Cooperation" Information 12, no. 1: 26. https://0-doi-org.brum.beds.ac.uk/10.3390/info12010026
Note that from the first issue of 2016, this journal uses article numbers instead of page numbers. See further details here.