Article

An Advanced Abnormal Behavior Detection Engine Embedding Autoencoders for the Investigation of Financial Transactions

by
Konstantinos Demestichas
*,
Nikolaos Peppes
,
Theodoros Alexakis
and
Evgenia Adamopoulou
Institute of Communication and Computer Systems, Zografou, 15773 Athens, Greece
*
Author to whom correspondence should be addressed.
Submission received: 17 December 2020 / Revised: 7 January 2021 / Accepted: 13 January 2021 / Published: 16 January 2021
(This article belongs to the Special Issue Predictive Analytics and Illicit Activities)

Abstract

:
Nowadays, (cyber)criminals demonstrate an ever-increasing resolve to exploit new technologies so as to achieve their unlawful purposes. Therefore, Law Enforcement Agencies (LEAs) should keep one step ahead by engaging tools and technology that address existing challenges and enhance policing and crime prevention practices. The framework presented in this paper combines algorithms and tools that are used to correlate different pieces of data leading to the discovery and recording of forensic evidence. The collected data are, then, combined to handle inconsistencies, whereas machine learning techniques are applied to detect trends and outliers. In this light, the authors of this paper present, in detail, an innovative Abnormal Behavior Detection Engine, which also encompasses a knowledge base visualization functionality focusing on financial transactions investigation.

1. Introduction

The rapid growth of Information and Communication Technology (ICT), unfortunately, underpins new types of criminal activities. Crime-related data are becoming more and more complex, and so is their analysis, in order to reveal hidden patterns and relationships. Law Enforcement Agencies (LEAs) and security practitioners need to adapt to this ever-changing reality in order to be able to both prevent and fight crime. In this direction, there is an increasing need for LEAs to combine, prioritize and analyze heterogeneous massive data streams. Thus, LEAs must engage and integrate future-proof solutions and tools which will empower them with powerful analytical and predictive capabilities against Organized Crime Groups (OCGs) and law-breaking individuals. These future-proof tools must support abnormal behavior and outlier detection in various kinds of datasets like surveillance (image/video) datasets, financial datasets, telecommunications datasets, and other types of open-source intelligence. Furthermore, the visualization of asserted knowledge as well as of any mined or inferred knowledge that can be derived is of critical importance for LEAs and security practitioners in order to maintain adequate awareness of the situations they are monitoring. In this light, this paper proposes and presents a platform that provides advanced near-real-time analytical support and outlier detection for multiple Big Data streams, e.g., from the open web, the Darknet, CCTV and video surveillance systems, traffic and financial data sources, and more. Subsequently, the outliers are semantically integrated into dynamic and self-learning knowledge graphs that capture the structure, interrelations and trends of cybercriminal organizations and organized crime groups, offering an enhanced situational awareness in these fields.
The remainder of this paper is organized as follows: Section 2 features a presentation of the high-level architecture of the platform; Section 3 describes the outlier detection algorithms employed in previous related works; in Section 4, an evaluation of the studied algorithms is featured; Section 5 includes a detailed description of the outlier engine and visualization tool integration into the aforementioned platform; finally, Section 6 concludes the paper.

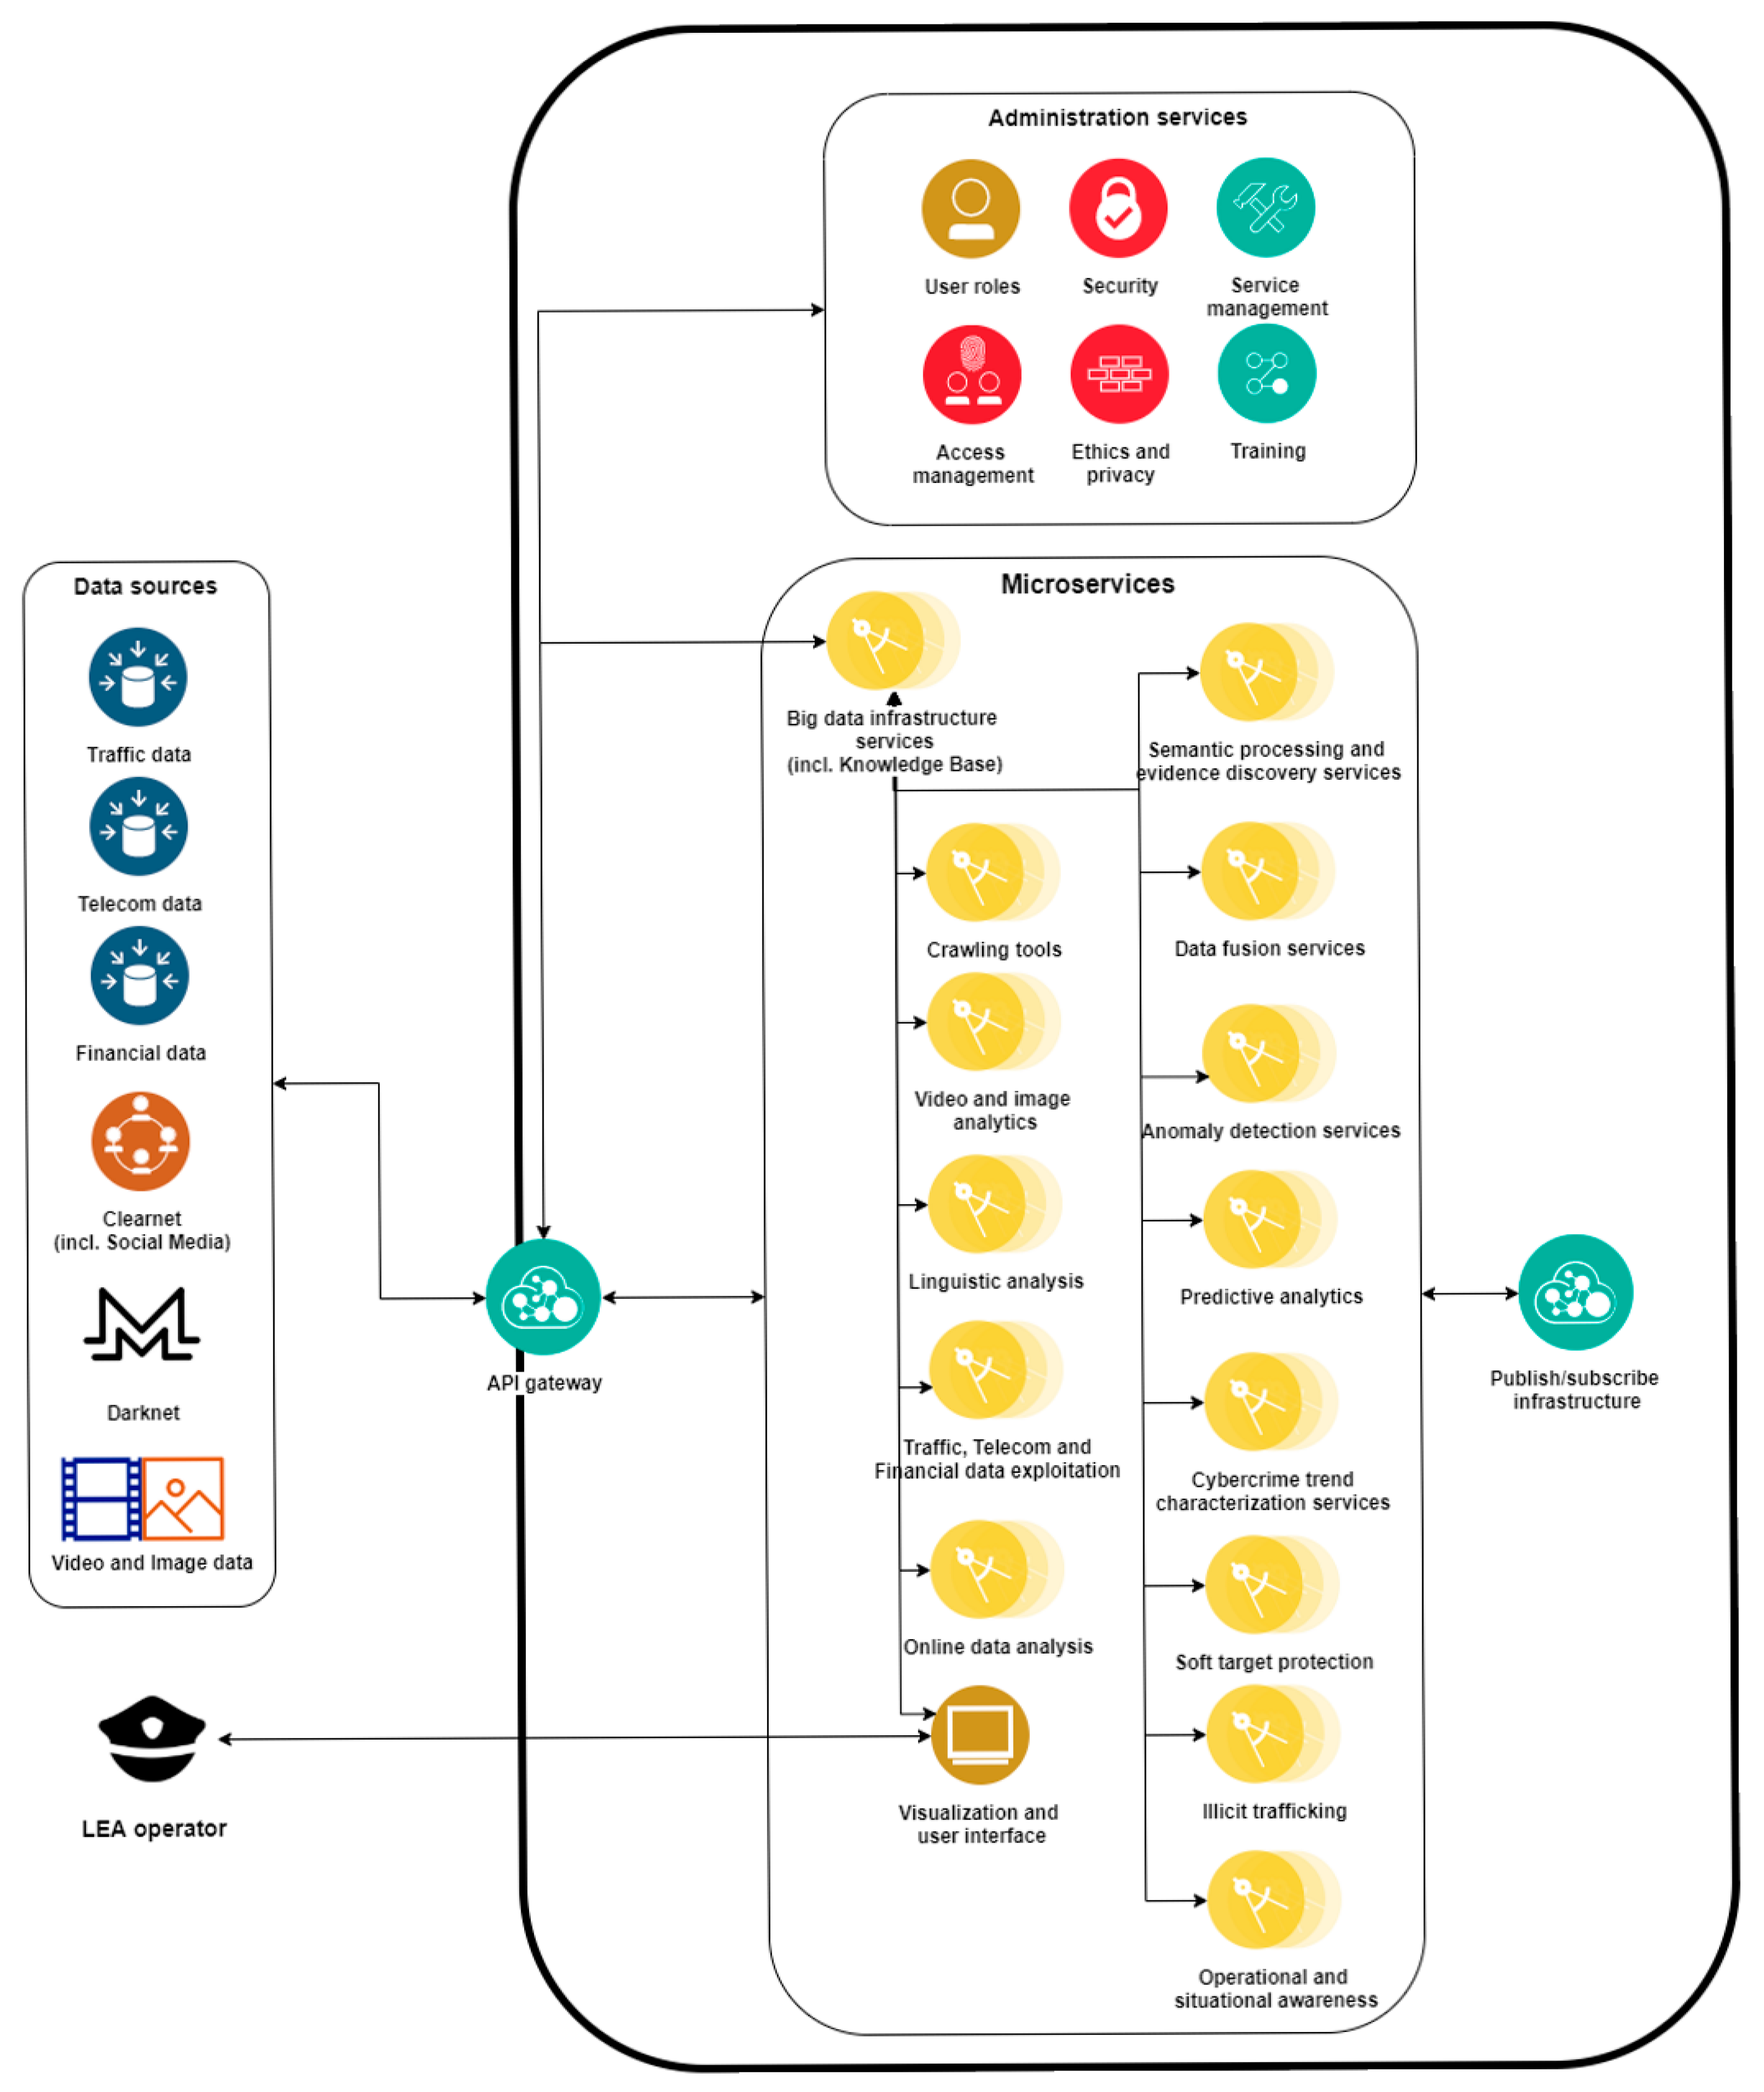
2. High Level Platform Architecture

The high-level platform architecture presented herein provides the required methods for LEAs to accelerate their investigations and remain aware of significant (cyber)criminal threats by successfully integrating massive data streams. The system architecture is especially designed in order to meet performance and resiliency requirements at scale.
The inputs to the framework are the various data sources, ranging from geospatial data, traffic data sources, telecom and financial data, as well as Darknet and Clearnet sources. These data are processed by the corresponding tools of the framework, which are able to handle such heterogeneous data streams. Figure 1 presents the high-level architecture, which contains the modules described in the next paragraphs, as well as the information flow inside the platform.
Visual Intelligence Module: This module is implemented by using face and object detection and recognition algorithms (You Only Look Once—YOLO [1], Single Stage Headless—SSH [2], etc.) so as to achieve the identification of suspicious activities, persons and objects contained in footage from static or moving cameras.
More specifically, this module consists of four discrete tools which are: (i) Abnormal Behavior Detection (ABD); (ii) Face Detection and Recognition (FDR); (iii) Person and Vehicle Identification (PVI) and (iv) Crisis Event Detection (CED). The ABD tool is capable of processing and analyzing continuously generated visual content (video streams) and extracting the detected activities. The FDR tool is responsible for processing visual content in order to detect persons and, subsequently, run recognition algorithms on detected faces. The PVI tool detects persons and vehicles from video streams and recognizes them by performing a comparison with stored data. The CED tool performs dynamic texture analysis in order to firstly detect, and subsequently identify, the type of crisis event (e.g., fire, flood, etc.).
Data Mining Module for Crime Prevention and Investigation: Data mining methods are used to extract valuable information from the existing data for analysis purposes. The data are exported from multiple sources and stored into a common format, in order to be accessible by the data analysis modules. A scalable data crawler infrastructure is employed in order to gather the necessary data from various sources, both from the DarkWeb and the ClearWeb. Then, the collected data are curated into appropriate datasets that can be further used by LEA officials for search and analysis purposes.
Semantic Information Representation and Fusion Module: This module is dedicated to data and information fusion and works on the heterogeneous data that are gathered from the data mining module. The use of appropriate semantic technologies and information fusion models, then, transforms the gathered information into valuable knowledge.
Specifically, through logical [3] and probabilistic [4] reasoning as well as data fusion algorithms and methods, focused on (i) data association, (ii) state estimation, and (iii) decision fusion [5], the module is able to uncover inferred facts that are not expressed in the knowledge base explicitly, as well as discover new relationships between different objects, persons and events.
Trends Detection and Probability Prediction Module for Organized Terrorism and Criminal Activities: Big Data analytics techniques are applied over the gathered data so as to identify hidden trends inside the datasets. The deployment of Big Data analytics alongside the predictive models constitute the link between the analytic and the decision-making process.
In this light, this module implements services that provide LEA officers with capabilities for automated detection of behavior changes, abnormality as well as weak signals and early changes that may be indications of new trends. For this purpose, machine-learning techniques are applied to the collected data in order to perform multivariate behavioral analysis, which leads to robust trend and pattern detection.
Anomaly and Cyber-Criminal Activities Detection Module: This module is responsible for applying advanced Big Data analytics techniques, based on machine learning, to the collected data [6]. The main purpose of this module is the identification of anomalies and behavioral indicators, as well as the revelation of unknown associations and rules that are linked with cyber-criminal activities. This module hosts the real-time abnormal behavior detection engine, presented in detail in the following chapters. The anomaly and cyber-criminal activities detection module enables advanced data mining operations in order to support the LEAs’ officers in the task of outlier analysis. Outlier analysis enhances LEAs’ capabilities in the identification of abnormal behavior, i.e., behavior not expected based on the data available until the present moment.
Situation Awareness and Human–Machine Interaction Module: Innovative tools for data visualization and knowledge representation are implemented in order to increase the situation awareness of the decision makers. The module hosts three main visualization and situational awareness tools: (i) the Web-based Human–Machine Interface (HMI), a modular component in which users, alongside other functionalities, can access the advanced visualization tool for knowledge graphs described in detail in Section 5 of this paper; (ii) the Web-based Geographic Information System (GIS) and haptic feedback service, dedicated to the visualization of geospatial resources coming from different services, and also allowing users to interact via a haptic device which offers a more direct and intuitive way of controlling and navigating information; and (iii) the Virtual Reality (VR) visualization tool, which constitutes a natural environment for the visualization of 3D graphs that improves the general understanding of users by allowing them to navigate and interact more intuitively with complex data structures.

3. An Overview of Outlier Detection Algorithms and Machine Learning Methods

3.1. Oultiers Detection Theory and Z-score for Data Labelling

Outliers are defined as significantly different values that diverge from an overall pattern of other observations on a data sample [7,8,9]. These unusual characteristics may indicate an irregularity or variability in the data, an experimental measurement error, records performed under exceptional circumstances or may just belong to another population [10,11]. Outliers are also referred to as deviants, anomalies, discordants or abnormalities in the domain of the statistics and data mining literature [9].
There are two basic categories of outliers based on the provided input dataset: univariate and multivariate. Univariate outliers can be identified when looking at an extended distribution of values in a single feature space. In other words, they constitute extreme data values (points) on the existing dataset [12]. On the other hand, multivariate outliers can be located into an n-dimensional space, as a combination of unusual scores, at least between two distinct variables [12]. Due to the difficulty of the human brain to analyze and find patterns at distributions in n-dimensional spaces, the technique of model training becomes relevant [10].
In addition to the aforementioned types, outliers can also be categorized, depending on their environment, into: point (or global) outliers, contextual (or conditional) outliers and collective outliers [12,13]. Point outliers are considered as the single data points that are located far away from the rest of the distribution. Contextual outliers are considered as the data points whose values are significantly deviating from the rest of the datapoints, such as noise in data (e.g., punctuation symbols when realizing text analysis or background noise signal when performing speech recognition). Collective outliers are the data points whose values diverge from the entire dataset, such as subsets of novelties in data (e.g., signals that may indicate the discovery of new phenomena) [10,12].
From the perspective of the analysis process, an issue of high importance is the interpretability of an outlier detection model [9]. The foregoing process is usually referred to as the “dis-description of the intentional knowledge about outliers” or as “the outlier description and detection”. In order to achieve a higher level of interpretability and select a specific outlier analysis method, models with less transformation processes on the data (e.g., principal analysis) are more suitable, since the contrast between the outliers and the real data is increased in an opposite way, also based on the original attributes [9,10].
Some of the major and most popular methods for the execution of the outlier detection process are the following [9,10]:
  • Z-score or Extreme Value Analysis (parametric);
  • Probabilistic and Statistical Modelling (parametric);
  • Linear Regression Models (PCA, LMS);
  • Proximity Based Models (non-parametric);
  • Information Theory Models;
  • High Dimensional Outlier Detection Methods (high dimensional sparse data).
In fact, an outlier can provide important information and insights concerning abnormal characteristics on entities with major impacts during the datasets’ creation process and the entire system as well [9,10]. Actually, outlier detection is associated with many tasks in real life such as [9]:
  • Credit-card fraud, where hidden patterns of possible fraudulent or unauthorized activity and/or use of sensitive credit-card number information, as well as transaction data, can be recognized with greater ease.
  • Intrusion detection systems, where abnormal or malicious activity of different data types (e.g., network traffic) in various computer systems can be detected and analyzed.
  • Law enforcement, by generating specific patterns of financial frauds, insurance claims or trading activity under the action of criminal behaviors.
  • Medical diagnosis, based on data collected from various sources (e.g., Magnetic Resonance Imaging - MRI, Positron Emission Tomography - PET or electrocardiogram - ECG scans) which reveal possible disease issues.
  • Sensor events, since a massive amount of sensing devices (e.g., location parameters) can provide new insights or events at new domains of interest.
  • Earth science, where spatiotemporal data (e.g., weather signs or climate change patterns) provide new environmental or climate trends regarding human activity or alternative hidden causes.
In the present paper, the extreme-value analysis or Z-score [14] serves as the starting point during the development process of the outlier detection toolset and is initially implemented in order to label an unlabeled dataset of financial transactions, which will serve as the training dataset for machine learning algorithms, as described in Section 3.2.
The Z-score consists the major outlier detection algorithm on one-dimensional data analysis and is a suitable method for distributions in a low dimensional feature space [9]. The normal distribution is the easiest approach to perform outlier detection by means of direct interpretation in terms of probabilities of significance [9]. The Z-score is a parametric method where extreme or diverge values are treated as outliers due to their location placement outside of the normal distribution curve. Nonetheless, in cases of lack of statistic interpretations, this model also provides a good heuristic approach to the outliers’ outcomes, even in arbitrary distributions. In addition, even though the Z-score (or extreme-value) analysis was normally designed for one-dimensional (univariate) data, it can also be extended to multivariate data by applying distance or depth based methods [9].
Z-score modelling is one of the most important outlier modelling algorithms used in these types of detection processes as it quantifies the deviations of the data points from the normal pattern, returning a numerical score. The calculation formula that returns the Z-score metrics of any data point on the provided data sample includes the mean μ and standard deviation σ of this set of values, and standardizes the data to zero mean and unit variance [10], according to the below expression (1):
Zi = (xi − μ)/σ
where:
  • Zi = Z-score for the specific data point;
  • xi = individual measurement for a distinct data point;
  • μ = the mean of the measurements;
  • σ = the standard deviation of the measurements.
During the computation process of the Z-score for each data point of the dataset, the definition of a threshold is essential [10] for the efficiency of the applied outlier detection algorithm. By tagging or removing the data points that lay beyond the aforementioned specified threshold, the classification of a data point, as an outlier or not, is performed (2):
If |Z-score| > threshold ⇒ data point ∈ outlier
The selection of the threshold is important in terms of the conversion of the extracted Z-score result into an outlier label. In case the selection of the threshold is too limited so as to minimize the amount of the acknowledged outliers, the process will probably result in missing real outlier data points (false negatives). In the opposite direction, when the threshold is expanded, it will lead to a high number of false positives [9]. Some frequently defined thresholds are: 2.5, 3 and 3.5 standard deviation(s).
In the present paper, the algorithm developed adopts a probabilistic approach for threshold selection based on a Bayesian risk model which minimizes the overall risk in combination with a cost function [15]. The main Bayes decision rule for a given observation x results into the determination of w1 based on (3):
21 − λ11)P(w1|x)> (λ12 − λ22) P(w2|x)
where:
  • x: the given observation data point;
  • w1: class 1 (as the equation refers into a two-class problem);
  • w2: class 2;
  • λ: the cost between the two classes of the problem;
  • P: the posterior probability that observation x is an outlier.
The appropriate outlier threshold can be estimated once the cost functions are known, based on the following equation (4):
P(w2|x) = 1 − P(w1|x)
The threshold value utilized in our model is |3|. Thus, the Z-score implementation labelled all the data points of this specific dataset as outliers (value 1) when their Z-score was above this threshold (Z-score < −3 or Z-score > 3), and as inliers (value 0) when their Z-score was below this threshold. The main reason for the Z-score implementation in the engine described in this paper is to create labelled datasets so as to be able to use supervised machine learning algorithms and compare them in order to find the most efficient one concerning this specific type of data.

3.2. Outlier Detection Algorithms and Related Work

The selection of the most efficient algorithm for the proposed Abnormal Behaviour Detection engine was performed after the testing and evaluation of several machine learning algorithms. The algorithms tested fall into five main categories: (i) Proximity-based algorithms; (ii) Linear models; (iii) Vector-based methods; (iv) Outlier ensembled algorithms and (v) Neural networks.
From the Proximity-based category, we implemented and applied different algorithms in this specific dataset in order to detect the outliers. Proximity-based algorithms, according to [16], define a data point as an outlier if its locality is sparsely populated. The proximity of each data point can be defined in several different ways, and, for the purposes of this study, the following four were selected: Local Outlier Factor (LOF), Cluster-Based Local Outlier Factor (CBLOF), Histogram-Based Outliers (HBOS) and K-Nearest Neighbor (KNN). The LOF algorithm is an anomaly detection algorithm which computes the local density deviation of a data entry from its neighbors [16]. The LOF value for inliers is very close to 1 and for outliers is much higher because they are computed in terms of ratios to the average neighbor distances [16,17]. An interesting study was conducted by Tang et al. in which the authors present the LOF algorithm alongside the connectivity-based outlier factor (COF) for large datasets and proceed with comparing their results [18]. Similarly, the authors of [19] used the LOF as base and proposed some enhancements of this particular algorithm. An evolution of the LOF algorithm, used for comparison purposes in this study, is the CBLOF algorithm, which is supplementary to the local density value that also takes into account the cluster size of each data point [20]. A very useful study which engages the CBLOF for money laundering detection purposes based on outliers was made by Gao in [21]. The HBOS models univariate feature densities using histograms in order to detect outliers. HBOS is a very computational efficient algorithm but it performs well only regarding global anomaly detection and not for local or isolated outliers [22]. The KNN algorithm is one of the most cited and used algorithms on proximity-based approaches for outlier detection. The KNN algorithm firstly identifies the clusters where similar objects are within the same cluster. After obtaining the clusters, the algorithm calculates the nearest neighbors of each data entry so to detect outliers [23]. An indicative study of using the KNN graph for outlier detection for both synthetic and real datasets was introduced by Hautamaki et al. in [24]. In this direction, and considering the rapid growth of electronic financial transactions, there are further relevant studies which engage the KNN algorithm for outlier detection in financial datasets. Indicative of them are the studies by Orair et al. in 2010 that examined financial data from government auctions [25], Ratnam in 2012 that utilized an anti-KNN algorithm for credit card fraud detection [26] and Malini and Pushpa in 2017 who also examined credit card data for fraud detection by using the KNN outlier detection method [27].
Another interesting method for outlier detection consists of the linear models. These models, as inferred by their name, utilize the linear correlations between the data. The aim of these models is to find the optimal line which passes through the data points. In most cases, this line is calculated through regression analysis. The least-squares fit is used to define the best hyperplane and then the distance of each data point from this hyperplane is used to detect the outliers [9]. In this study, we tested and evaluated the Minimum Covariance Determinant and the Principal Component Analysis linear models for outlier detection. The Minimum Covariance Determinant (MCD), introduced by Rousseeuw in 1984 [28], is a very useful tool for outlier detection, especially when it comes to multivariate data. The MCD algorithm provides an estimation of the multivariate mean and covariance values by searching the subset of data points in a dataset with the minimum determinant of the covariance matrix [29,30]. The MCD technique has been studied in several different applications including ones in the financial and econometric domain. Two of the most cited studies of the MCD application in financial data are the studies from Zaman et al. [31] and Welsch and Zhou [32]. In addition to the MCD, the Principal Components Analysis (PCA) method is a widely used machine learning technique for dimensionality reduction and outlier detection. As already mentioned, linear models utilize the least-square fit to define the best hyperplane for the given data. PCA analysis provides a lower-dimensionality sub-space which features the least reconstruction error. On the other hand, the outlier’s reconstruction error is large. Thus, this measurement can be used as a score for outlier detection [9,33]. A very detailed study was performed by Xu et al. who introduced an improved approach of the PCA, namely robust PCA, which can be used successfully for outlier detection in various kinds of data including financial datasets [34]. In this light, Stanimirova et al. presented a relevant study [35] where they described in detail how to deal with missing values and outliers by using robust PCA analysis in highly contaminated data. In [36], the authors used PCA analysis for outlier detection for both a simulated and a real financial dataset.
Most of the modern problems demanding outlier detection involve high-dimensional datasets which call for the application of different methods. These methods can be either vector-based or ensembled methods. Vector-based methods, as inferred by their name, not only calculate the distance between data points but also their direction or angles. The main idea behind these types of algorithms is to determine the direction angle between distance vectors and compare these angles between pairs of distance vectors to other points [37]. This helps to discern between inliers and outliers. Vector-based algorithms are very efficient to high-dimensional data because the detection of outliers does not rely solely on distance. The Angle-based Outlier Detection (ABOD) algorithm is a vector-based method which retrieves a point and the reason that this is considered to be an outlier. The difference vector to the most similar object in the nearest group of points provides the divergence quantitatively for each attribute and, thus, explains why the point is an outlier [37,38]. As far as the ensemble methods are concerned, two different types are met, the sequential ensembles and the independent ensembles. The main concept idea for both of the ensembles is that they use more than one algorithm/method in order to detect outliers for the same data [9]. The isolation-forest (i-forest) algorithm or i-Forest, as it is widely known, belongs to the ensemble category for outlier detection. An isolation forest is constructed from multiple isolation trees. The score of each data point calculates the depth required to isolate a point in a single node of the tree. The I-Forest algorithm detects/isolates outlying points and does not profile the normal ones. The outliers are detected as the points which have shorter average path lengths to iTrees [9,39]. The i-forest method has been widely used for financial outlier detection. More specifically, the authors of [40] conducted an analysis for outlier detection using data originating from credit card transactions and compared the i-forest algorithm with LOF. In the same direction, and by also utilizing i-forest and LOF, the authors of [41] compare the efficiency of these methods for outlier detection in ATM transactions. As an extension to the i-forest method, Buschjäger et al. introduced the generalized isolation forest (GIF) algorithm for outlier detection in financial data in their latest study [42].
Neural networks are artificial intelligence models which aim to replicate the human brain’s function and learning process. They consist of neurons and nodes with every node connected through a neuron with another node. These connections between nodes (neurons) carry a numerical value which is commonly called a weight (wij). Every neural network receives a set of inputs and, through its training process, adjusts the weight values so as to produce the desired output(s) [43,44,45]. Outliers affect neural networks significantly and decrease their efficiency and accuracy [45]; however, there are certain methods and techniques, based on artificial neural networks, that can be very useful for outlier detection. Auto-encoder is a special type of neural network which consists of multiple layers and mainly performs a dimensionality reduction of the input data. In the most common case of an auto-encoder, the input and output have the same dimensions. The goal of such algorithms is to train the output to reconstruct the input by reducing the dimensionality. Thus, auto-encoder algorithms can discover outliers because, during the reconstruction process, it is much more difficult to represent outliers than normal points. Outliers will have a much larger error after the reconstruction so it becomes easy to score datapoints and categorize them as outliers or not [46,47].
It is worth mentioning that the present study was based mainly on the algorithms and studies presented above and focuses on supervised learning, as indicated in the results evaluation featured in Section 4. However, certain other methods for outlier detection, especially in financial data, which focus on unsupervised algorithms, also exist, such as clustering methods, regression, neural networks and distance based algorithms [48,49]. Unsupervised techniques are frequently used for outlier detection because unlabeled data are in abundance in the real world. However, in this study, we proposed an approach which employs Z-score to label the data, and then, via supervised learning, the most efficient algorithm for outlier detection in the examined dataset can be identified and applied. Supervised methods offer more precise and accurate metrics considering their performance compared to unsupervised learning. Thus, this study is focused on supervised learning in order to present more concrete and accurate evaluation of the tested algorithms for the same dataset.
In addition to supervised and unsupervised methods for outlier detection, there are also some other approaches worth mentioning. The rule-based models, for example, are basically a set of rules which define whether a data record consists an outlier or not. Kanhere and Khanuja proposed a rule-based algorithm which examines audit logs from a central database and, through specific rules, classifies a record as an outlier or not [50]. Moreover, model-based methods are sometimes used, according to which a model is built through the transaction history of an instance (e.g., individual, company, etc.). Thus, new transactions are compared with the given transaction history (model) and, if there is any deviation, then this is characterized as an outlier [51]. Zhu used the model-based approach and introduced a new cross outlier detection model based on distance definition incorporated with the financial transaction data features [52]. In addition, the authors of [53] proposed a two-stage model which firstly obtains user behavior according to historic transactions based on categorical or numerical attributes, and secondly, compares every new transaction against the corresponding user model, in order to determine if this transaction is suspicious or not.

4. Evaluation and Comparison of Different Methods for Outlier Detection

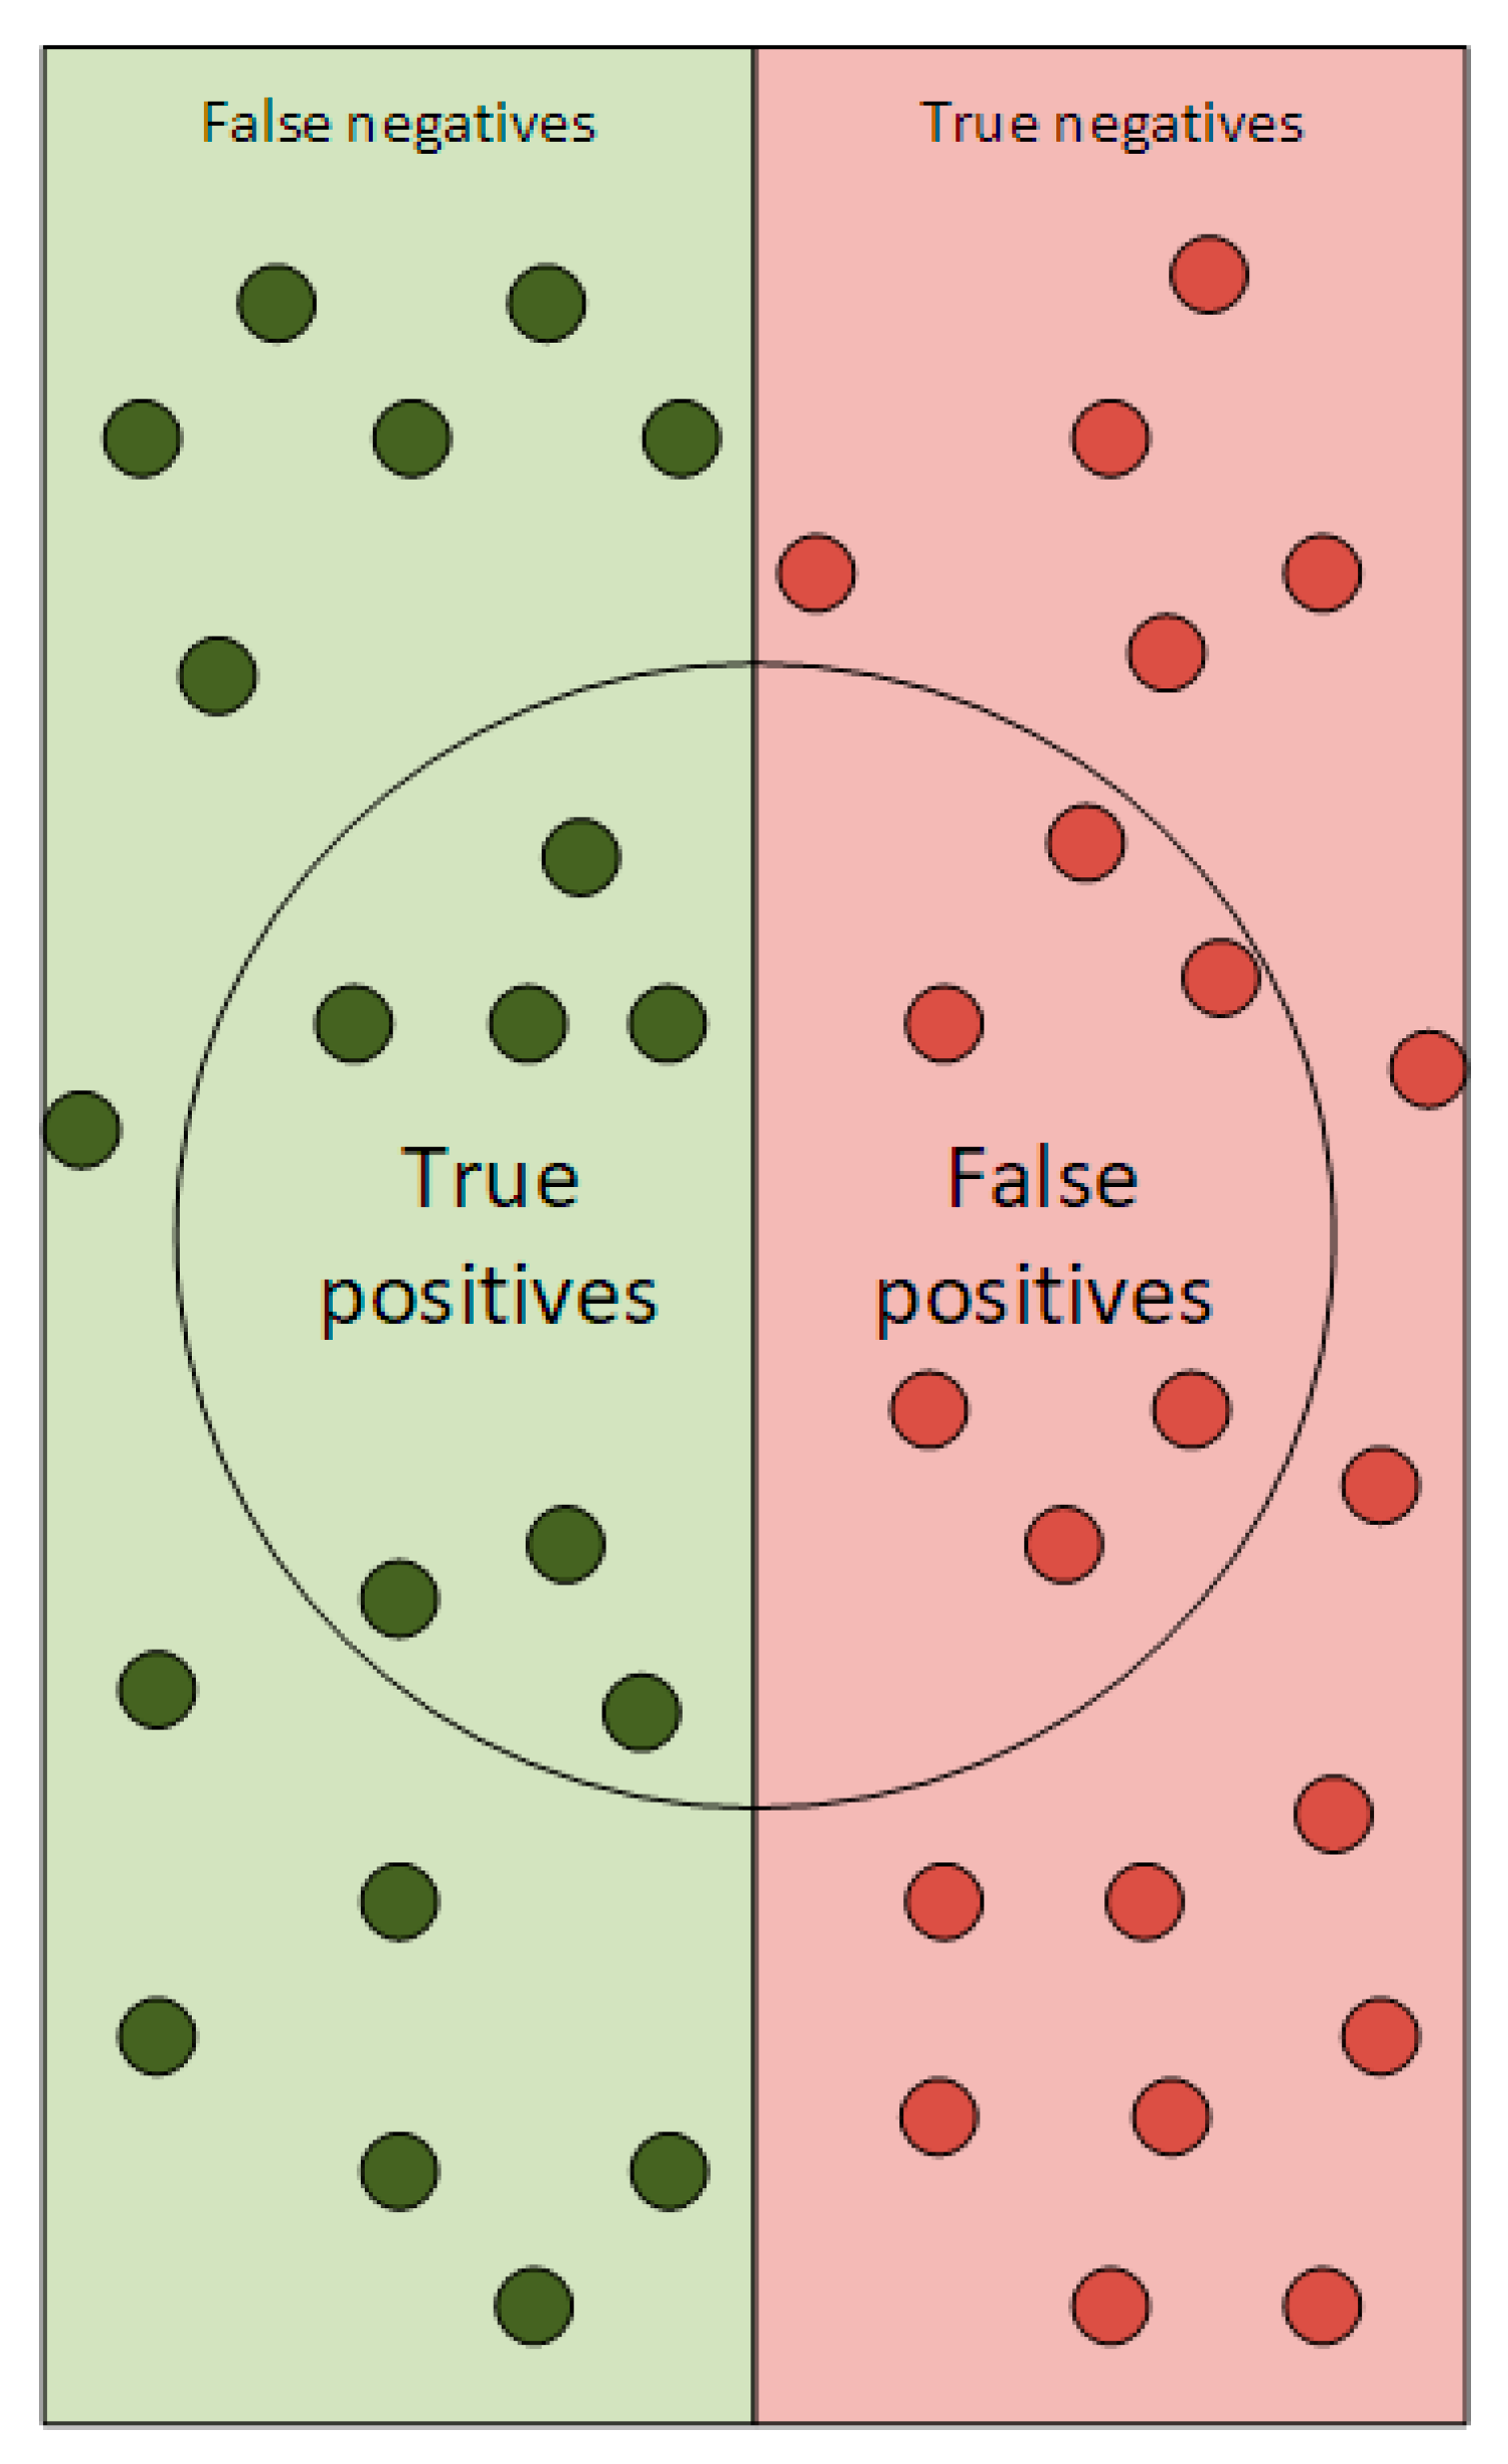
4.1. Evaluation of Results

The aforementioned methods of Section 3.2 were evaluated by using the Receiver Operating Characteristics (ROC) graph and, specifically, the Area Under the ROC (AUC) metric as well as precision for all of them, both for training and test data. The algorithms were developed in Python language using the PyOD Toolbox [54]. The testbed for our results was a system running Arch Linux OS with an i9 CPU, 2080ti GPU and 32 GB of ram with a 500 GB SSD drive.
The Receiver Operating Characteristics (ROC) graph is used from the early stages of Machine Learning in order to evaluate and compare algorithms as demonstrated by Spackman in [55]. ROC graphs are two-dimensional graphs, which on the y-axis have true positive (TP) rate (Equation (5)) and false positive (FP) rate (Equation (6)) on their x-axis. Every ROC graph depicts the tradeoff between benefit and cost (TP vs FP). In order to compare different methods using the ROC curve the metric usually used is the AUC as mentioned by Hanley et al. in [56]. The value of the AUC is between. 0 to 1 because it is a portion area into a unit square. The higher the value of the AUC the better the classifier is. So, when a classifier has an AUC equal to 1 then its predictions would be certainly correct because it will predict with probability 1 the true or 1s values and the false or 0s values. Generally, AUC performs quite well as a measure of predictiveness [57]. Considering the engine proposed in this study, AUC is a metric which can provide an evaluation of the methods used to classify a data point as an outlier or as an inlier.
TP_rate = positives correctly classified/total positives
FP_rate = negatives incorrectly classified/total negatives
In binary classification and prediction problems, the precision metric is of utmost importance because it demonstrates how well the classifier predicts a label for each data point. Precision is the fraction of positively predicted points that are actually positive [58], or for the instance of this study the predicted outliers that are actually outliers. Thus, precision in the case of outlier detection measures how well the tested algorithm identifies only the anomalies in the dataset. The precision is calculated by Equation (7) as presented below:
Precision(t)= |S(t)⋂G|)/|S(t)|
where:
  • t: the defined threshold;
  • S(t): the declared outlier;
  • G: the true set of outliers in the data set.
Precision, as can be seen in Equation (7) is a number between 0 and 1 and can also be expressed as a percentage. An illustrative way to understand the meaning of the true positives (TP), false positives (FP), true negative (TN), false positives (FN) and false negatives terms is in Figure 2.
Due to the lack of publicly available datasets related to mobile financial transactions, as well as due to their sensitive nature, we proceeded, in the present study, to the synthetic generation of a custom-made, non-publicly available dataset, based on real, private financial datasets. In order to execute the training and evaluation processes using the proposed abnormal detection engine, this generated, synthetic dataset was composed of both credible money transactions (inliers) as well as malicious/fraudulent transactions (outliers). The dataset generation is actually based on the PaySim simulator which is a mobile money payment simulator [59]. PaySim, as indicated by its name, simulates financial data that are not precisely normal due to the possible existence of asymmetries, discreteness, and boundedness of the observable data, as it happens in the real world. Subsequently, the proposed engine uses α generated synthetic dataset of 6,362,620 samples (entries) containing (fraudulent and not fraudulent) activities that are not-normally distributed. A percentage of 0.4% from all data entries are labelled as outliers using the Z-score algorithm as presented in Section 3.1. Table 1 summarizes the results for the AUC metric and Precision for each of the tested algorithms (namely LOF, CBLOF, HBOS, KNN, MCD, PCA, ABOD, I-FOREST and AUTO-ENCODER).
As can be seen from Table 1, the auto-encoder algorithm features the best results for both AUC and precision metrics in the context of the application and dataset developed for this study. It is worth mentioning that the i-forest algorithm has, also, very promising results that cannot be neglected. The KNN and PCA have very good results considering the AUC but not so promising considering the precision metric. The MCD and CBLOF have similar results for the training and test sets but not as promising compared to the auto-encoder and i-forest algorithms. The rest of the algorithms have very disappointing results considering in terms of both AUC and precision metrics. More specifically, the LOF algorithm demonstrates a very low precision for both the training and test sets and cannot be used. HBOS, as far as precision is concerned, is at adequate level but for AUC the results are very low compared to the other methods.
These results were produced using a specific type of financial dataset. It is worth mentioning that every dataset provided to this tool must be preprocessed in order to be suitable for analysis. Also, we should underline that at this stage of development of this specific tool the main goal is just to detect outliers and not combine different types of analysis such as pattern recognition or semantic analysis.

4.2. Comparison of Different Algorithms, Datasets and Results

In Section 3.2, a literature review on the methods used for this study, alongside those of past studies on financial datasets that used some of the same methods, was presented. As discussed in [42], the AUC metric for a credit card fraud transaction dataset in Table 2 are: (i) LOF 0.584; (ii) KNN 0.961 and i-Forest 0.951. In addition, in [40] there is a direct comparison between the LOF algorithm and the i-forest one using a financial dataset, which is different from the dataset used in our study. So, according to the authors of [40], the LOF method for outlier values features 0.28 precision and the i-forest method 0.02. In order to be fair, a direct comparison of our results with the aforementioned studies as well as any other study it is neither just nor indicative because the dataset used in this study is not similar to the datasets used in other studies in terms of type or volume. However, Table 1 shows a direct comparison between different algorithms for the same dataset used in this study.
The algorithms engaged for the purposes of this study in order to prove their effectiveness on the financial dataset used are widely known and have been applied in several different kinds of datasets. For the purposes of this study, the PyOD Toolbox [54] was utlized. PyOD has been employed for several different datasets with various results both for the AUC (ROC Performance) and Precision metrics, as can be seen in its benchmarking page (https://pyod.readthedocs.io/en/latest/benchmark.html). In Table 2 and Table 3, a selection of results considering these two metrics in different kinds of datasets is presented.
Studying the Table 2 and Table 3, it is obvious that the performance of each algorithm is directly dependent on the type of the dataset. These indicative results show that the evaluation results are closely relevant to the type and the diversity of the applied dataset. In any case, differently constructed synthetic datasets could actually affect the evaluation results and efficiency of the selected algorithm.

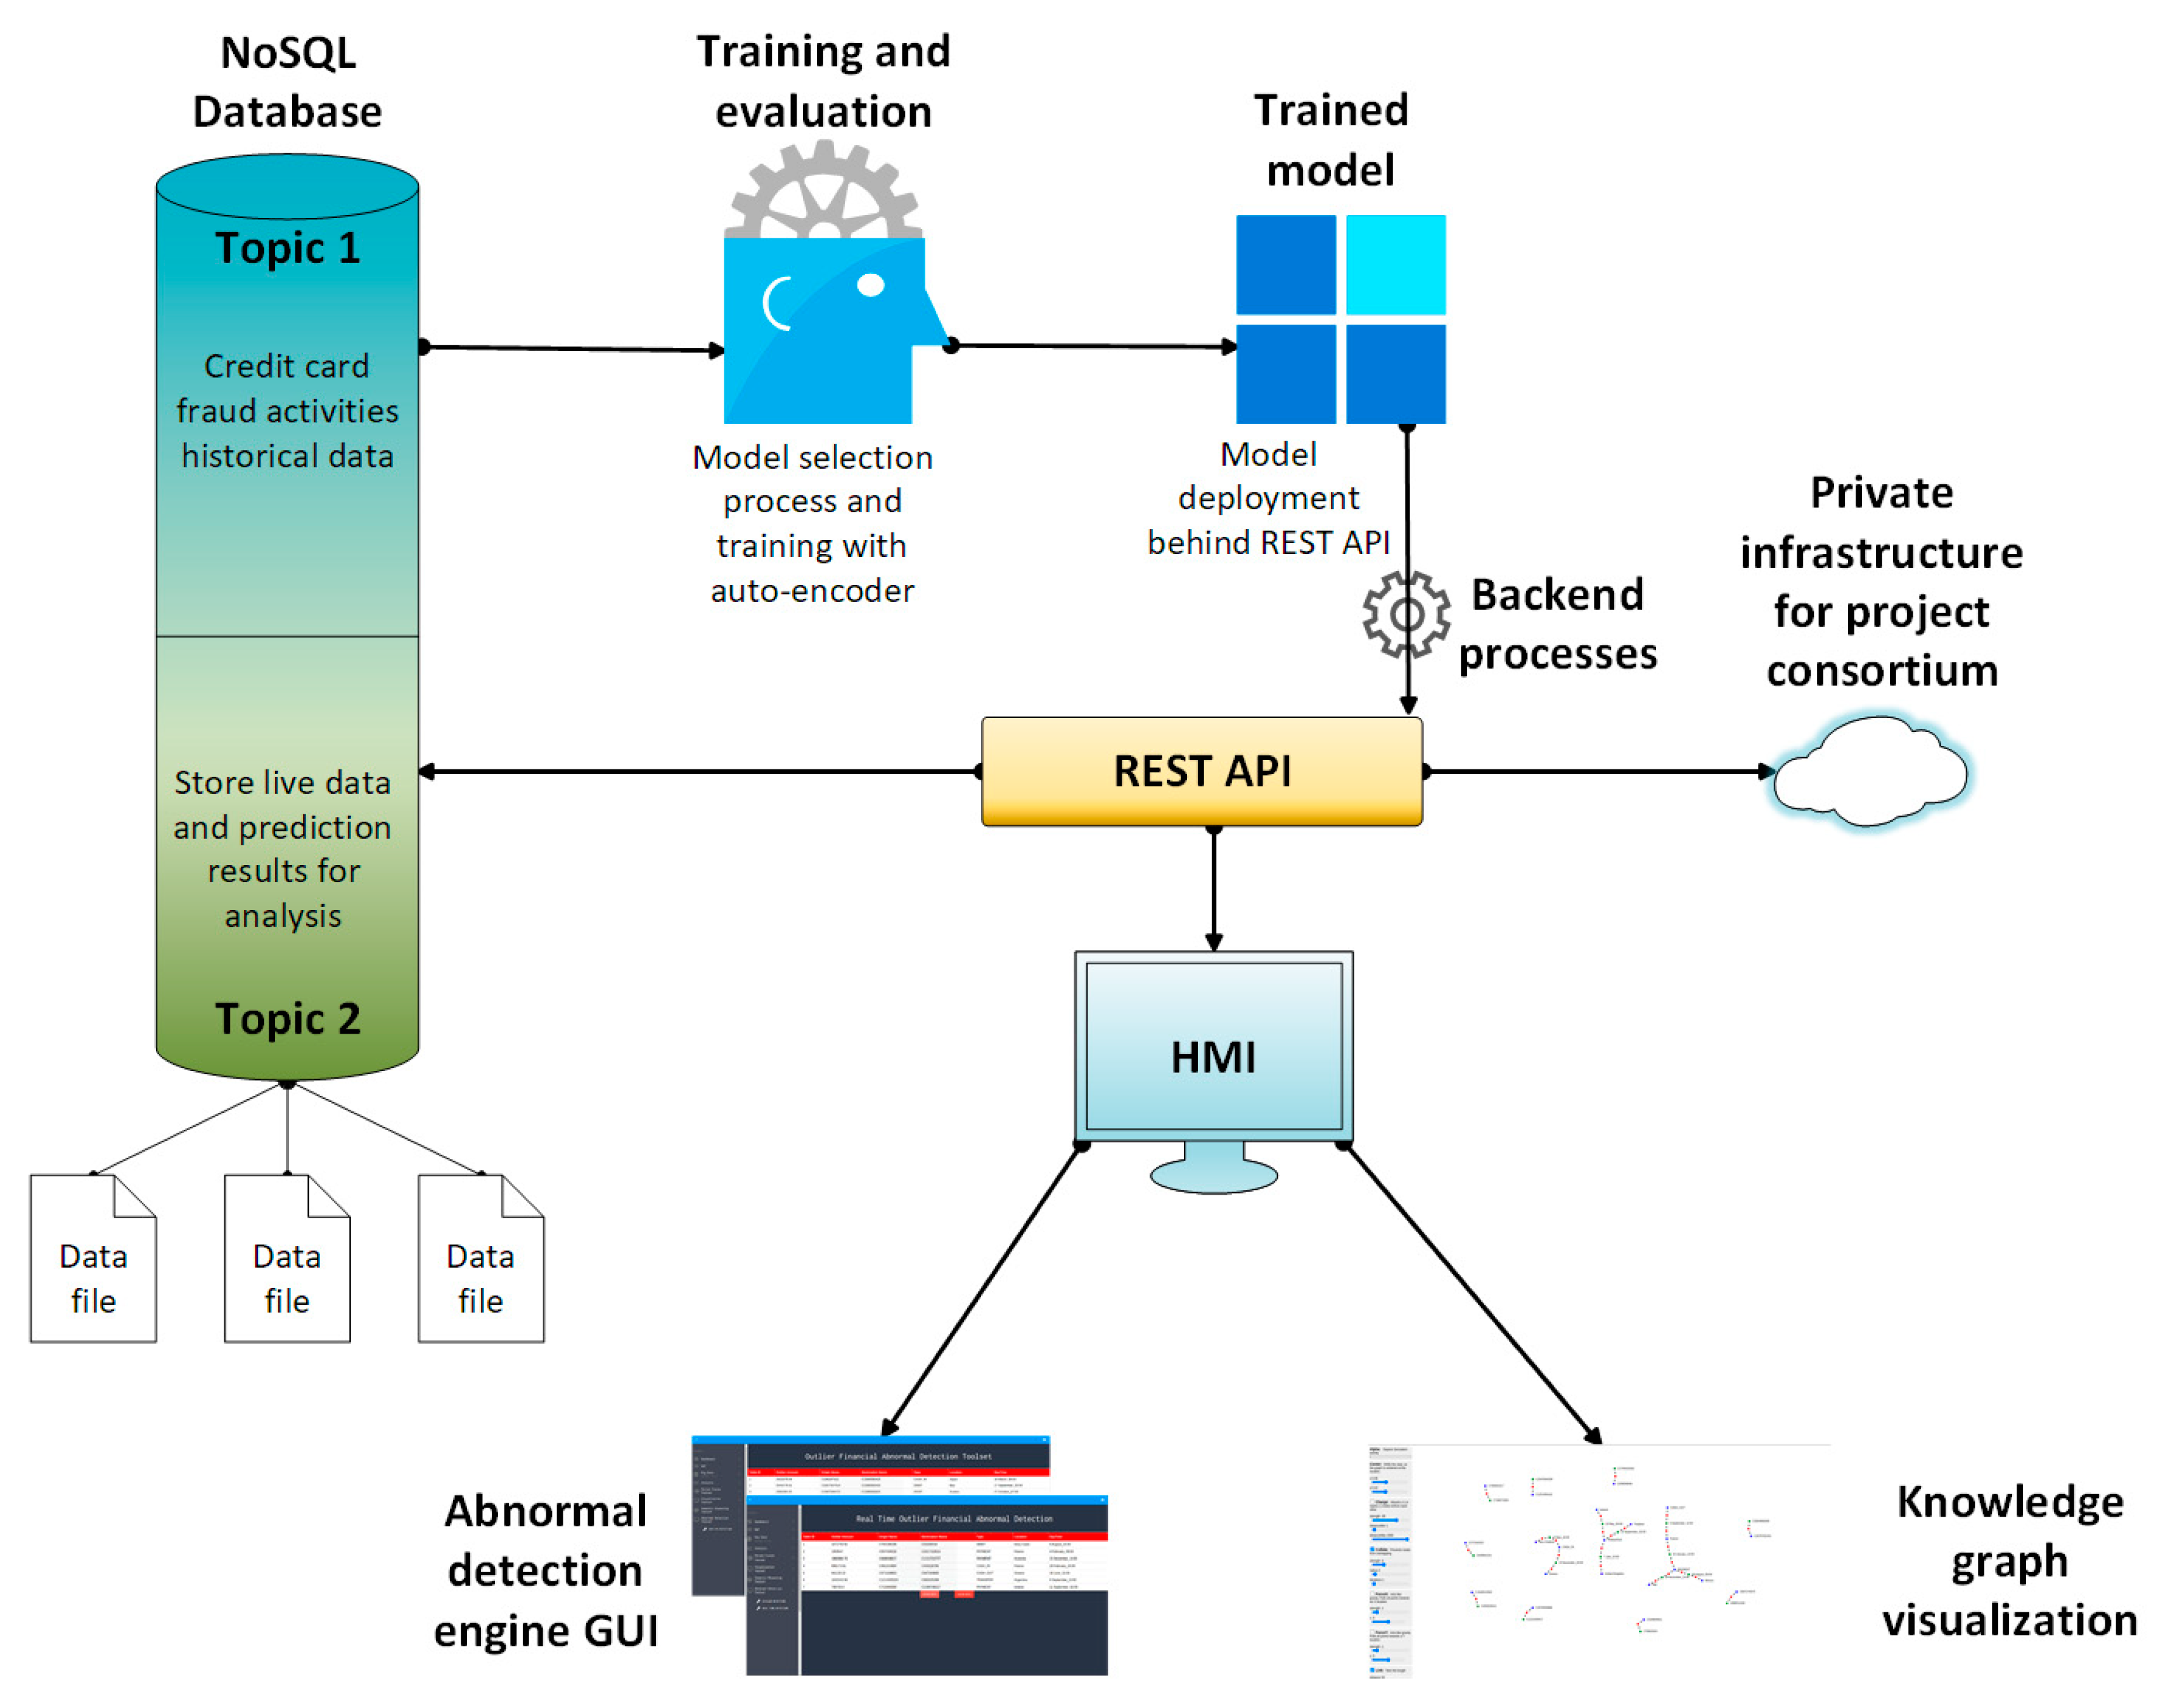
5. Real-Time Abnormal Behavior Detection Engine and Knowledge Base Visualization Tool

In Section 2, we provided a brief presentation about the high-level architecture of the platform, which contains the real-time abnormal behavior detection engine and the knowledge base visualization tool. Figure 1 depicts the concept of high-level architecture and, in Figure 3, a more detailed representation of abnormal detection engine information flow is depicted.

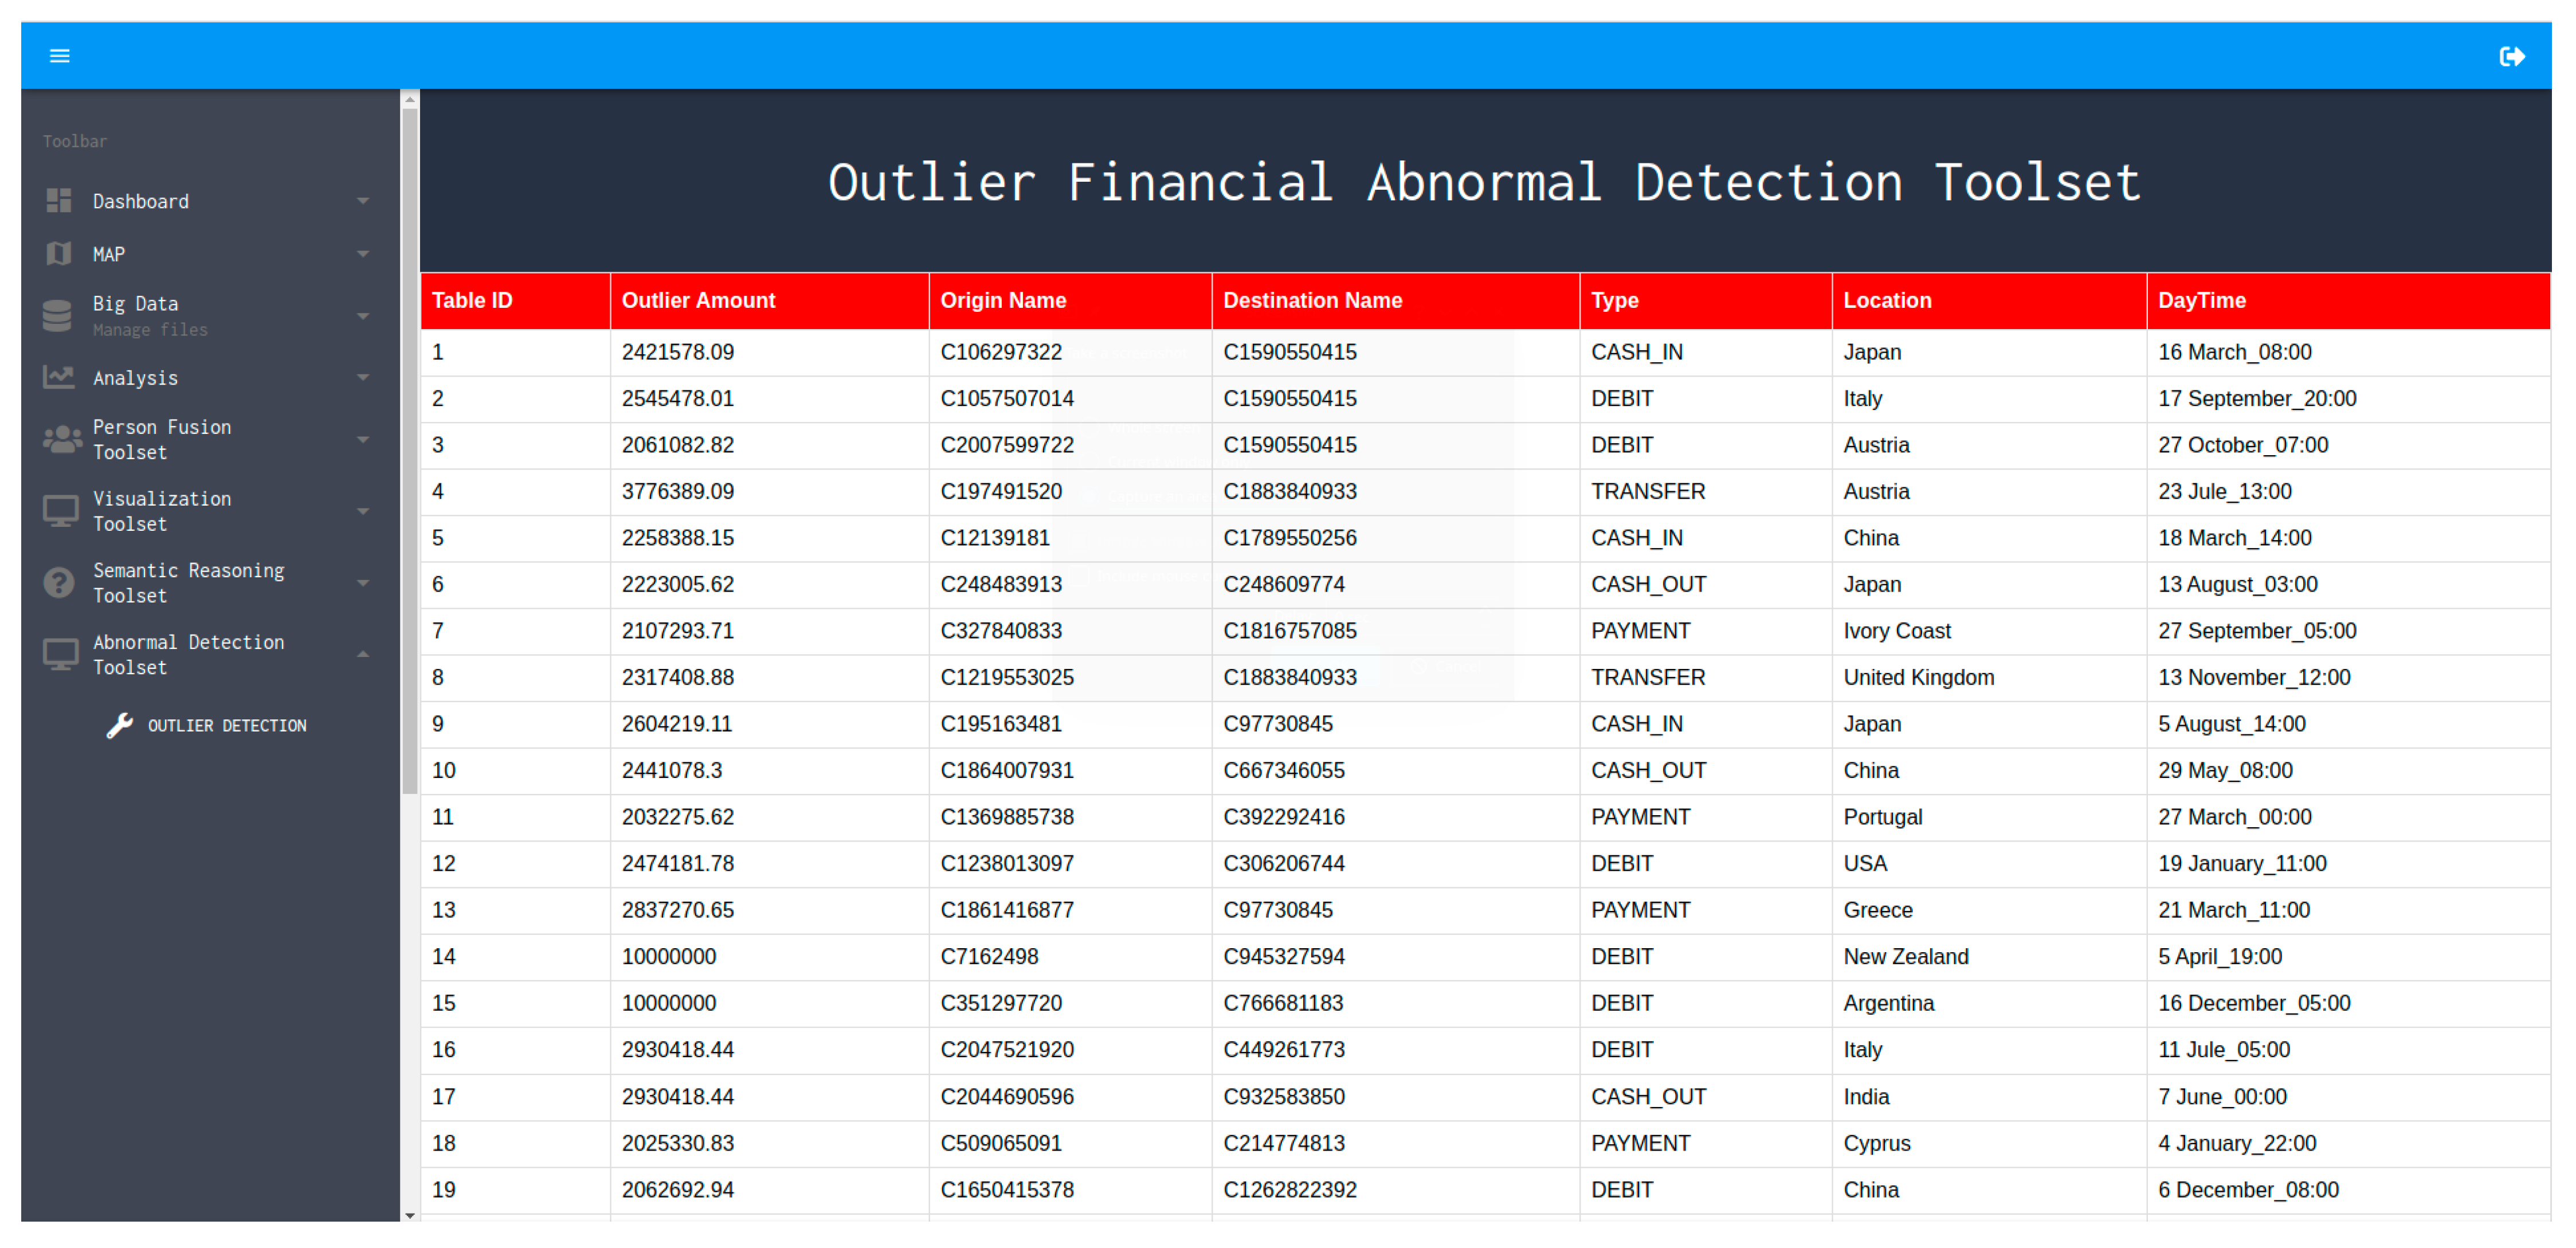
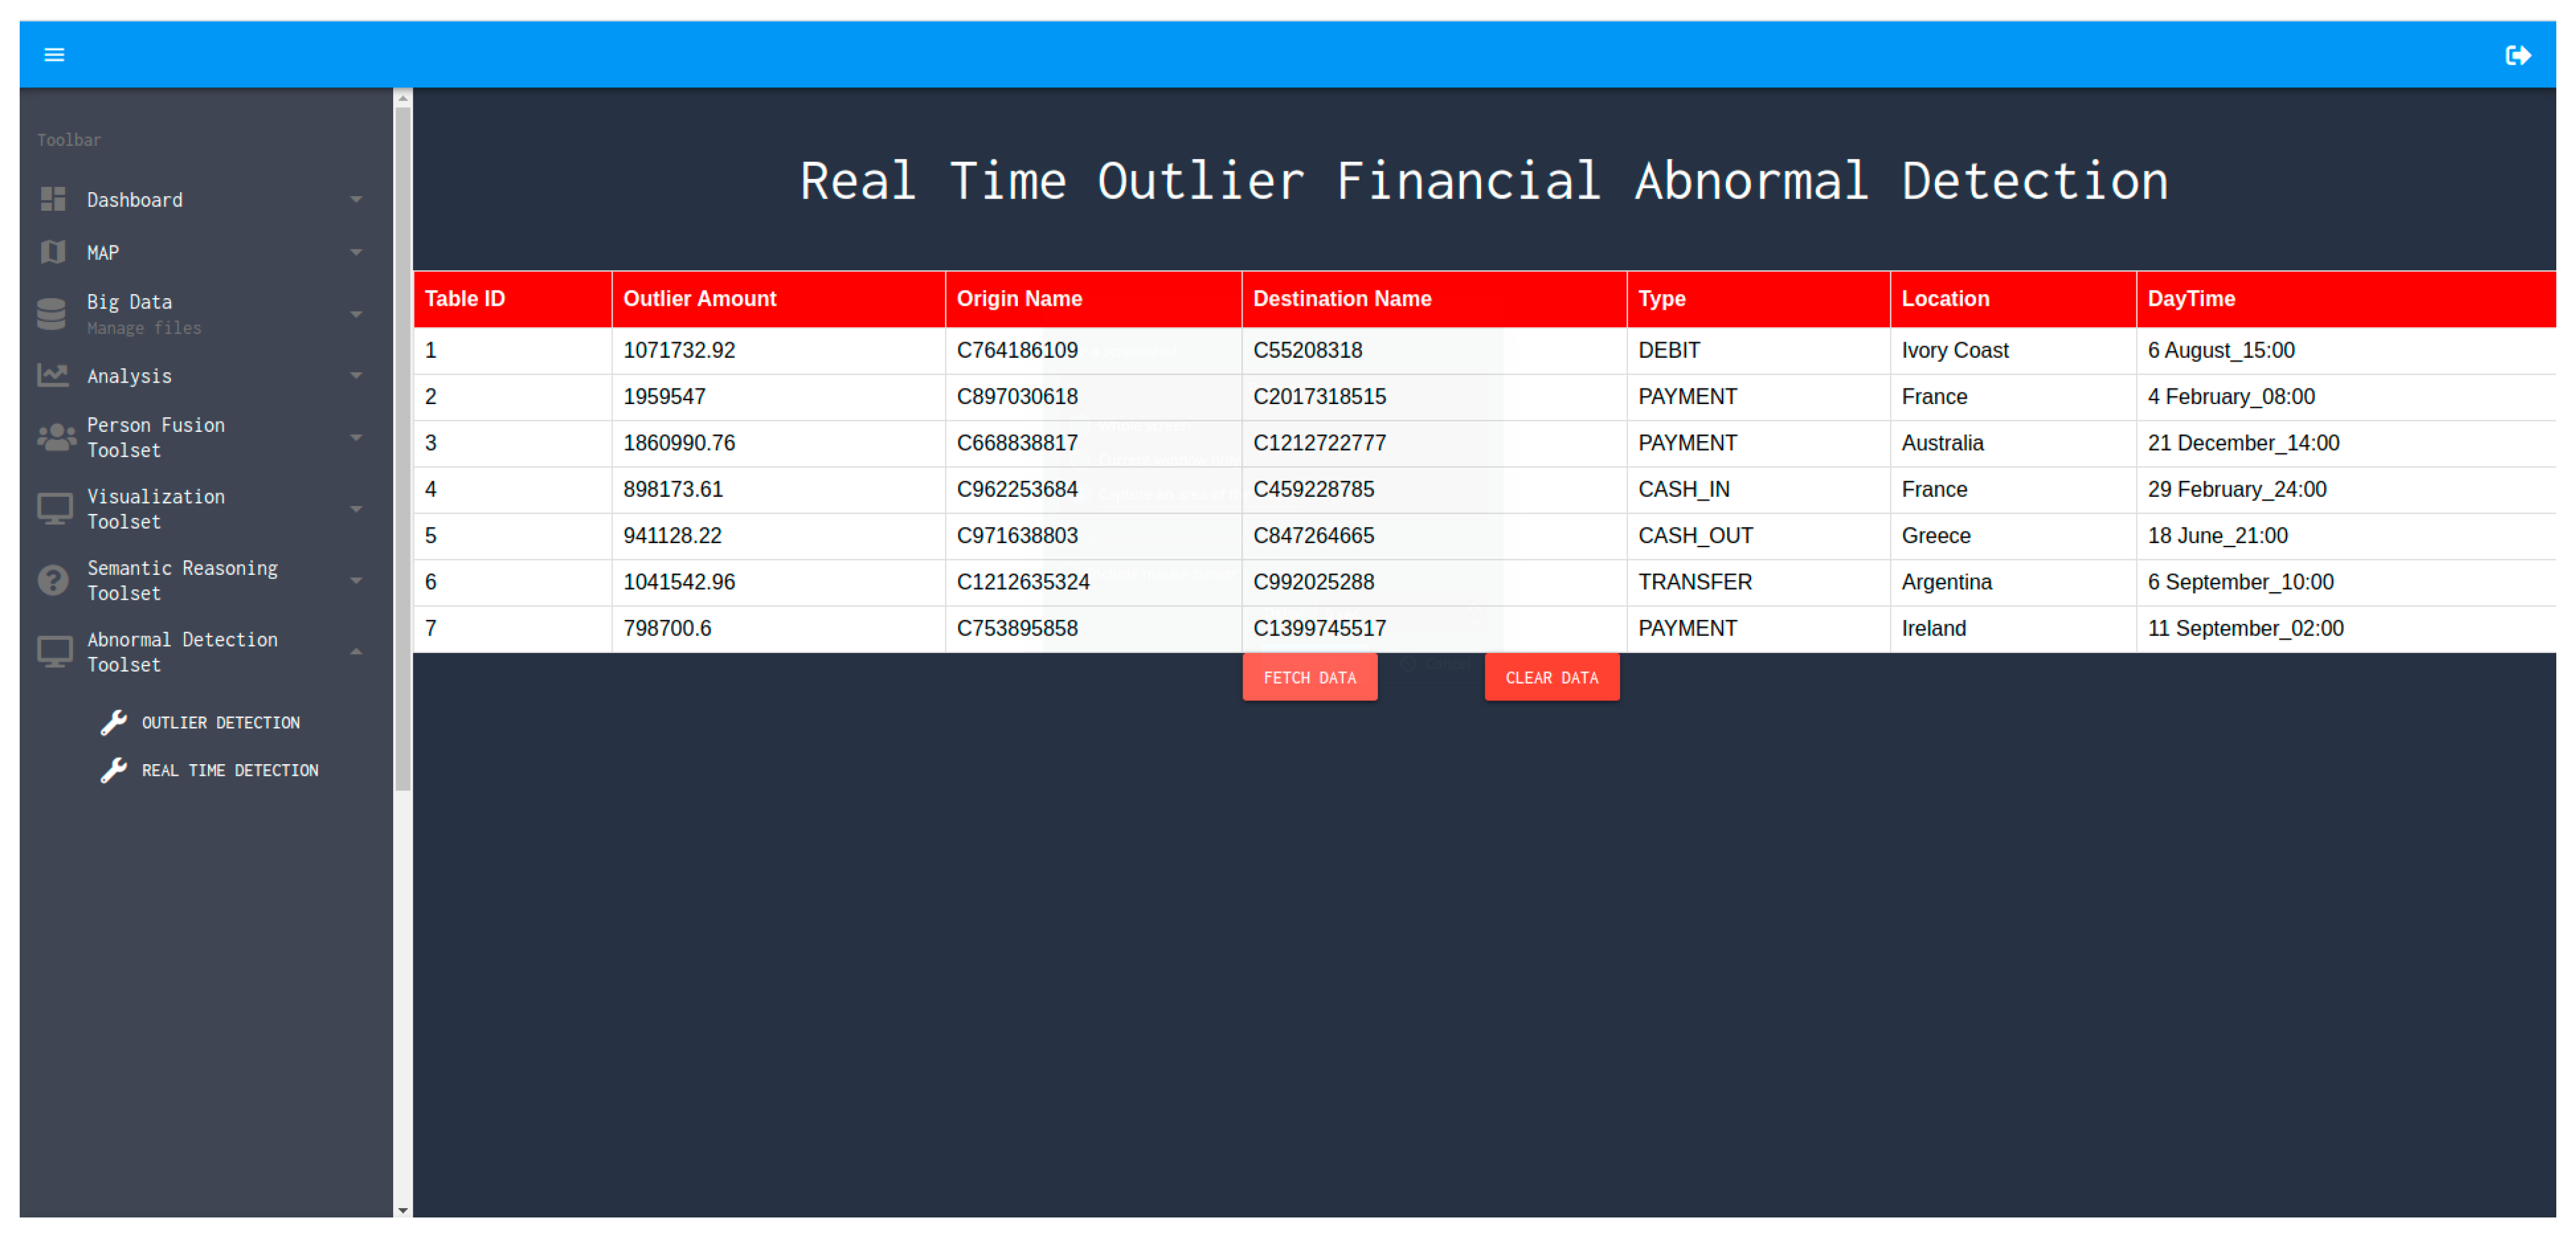
5.1. Real-Time Abnormal Behavior Detection Engine Interface

The aforementioned outlier detection method was developed and integrated in a real-time abnormal behavior detection engine which contains a bundle of tools providing a certain number of functionalities concerning the recognition and prediction of abnormal and deviant financial behavior activities, based on the outlier algorithm previously presented in Section 3.
Specifically, the core functionality of the integrated tools enables trends’ and abnormal behavior detection, regarding financial fraud, such as in the emerging mobile money transactions. The following features of the dataset mentioned in Section 4 are included in the graphical user interface (GUI) of the presented functional tool:
  • The amount of money transferred in the mobile financial transaction;
  • The source name of the transaction;
  • The destination name of the transaction;
  • The execution type of the transaction (includes Cash-in, Cash-out, Debit, Payment, Transfer);
  • Location name of the destination endpoint of the executed transaction;
  • Date and time of the executed transaction.
The abnormal behavior detection engine is accessible through a GUI. As shown in Figure 4, the outcome of the algorithm execution is retrieved and provided in a table structure, which is populated after selecting the relevant process. The algorithm receives as input the financial dataset, and using the auto-encoders algorithm, as described in Section 3, provides the outliers for the given input. The backend executes the computations required for the classification and the population of the table (Figure 4 and Figure 5) of the detected transactions that are characterized as “anomalous” transactions or possible “abnormal behaviors”. The populated table returns the actual amount of the abnormal transaction(s), the source and destination name of the transaction(s), the location name of the destination endpoint, the type as well as the date/time of the executed transaction(s), in order to provide sufficient visibility and awareness regarding possible fraudulent transactions during specific financial services. After the end of the execution, the results are stored back into a knowledge base (type of database) for future reference or re-use.
In order to ensure real-time functionality of the abnormal behavior detection engine, the abovementioned calculation procedures are performed dynamically every time a new data point or dataset is received or inserted in the connected database, triggering the recalculation of the aforementioned variables and re-population of the results table. Figure 5 depicts one of the developed functionalities of the engine, where a new table is populated in a dynamic way, thus providing results in real-time.
The aforementioned functionalities are coupled with the use of a knowledge base visualization toolset, which is described in Section 5.2 and provides the ability to visualize and understand the outputs of the engine in a graph format, offering a more a user-friendly experience.

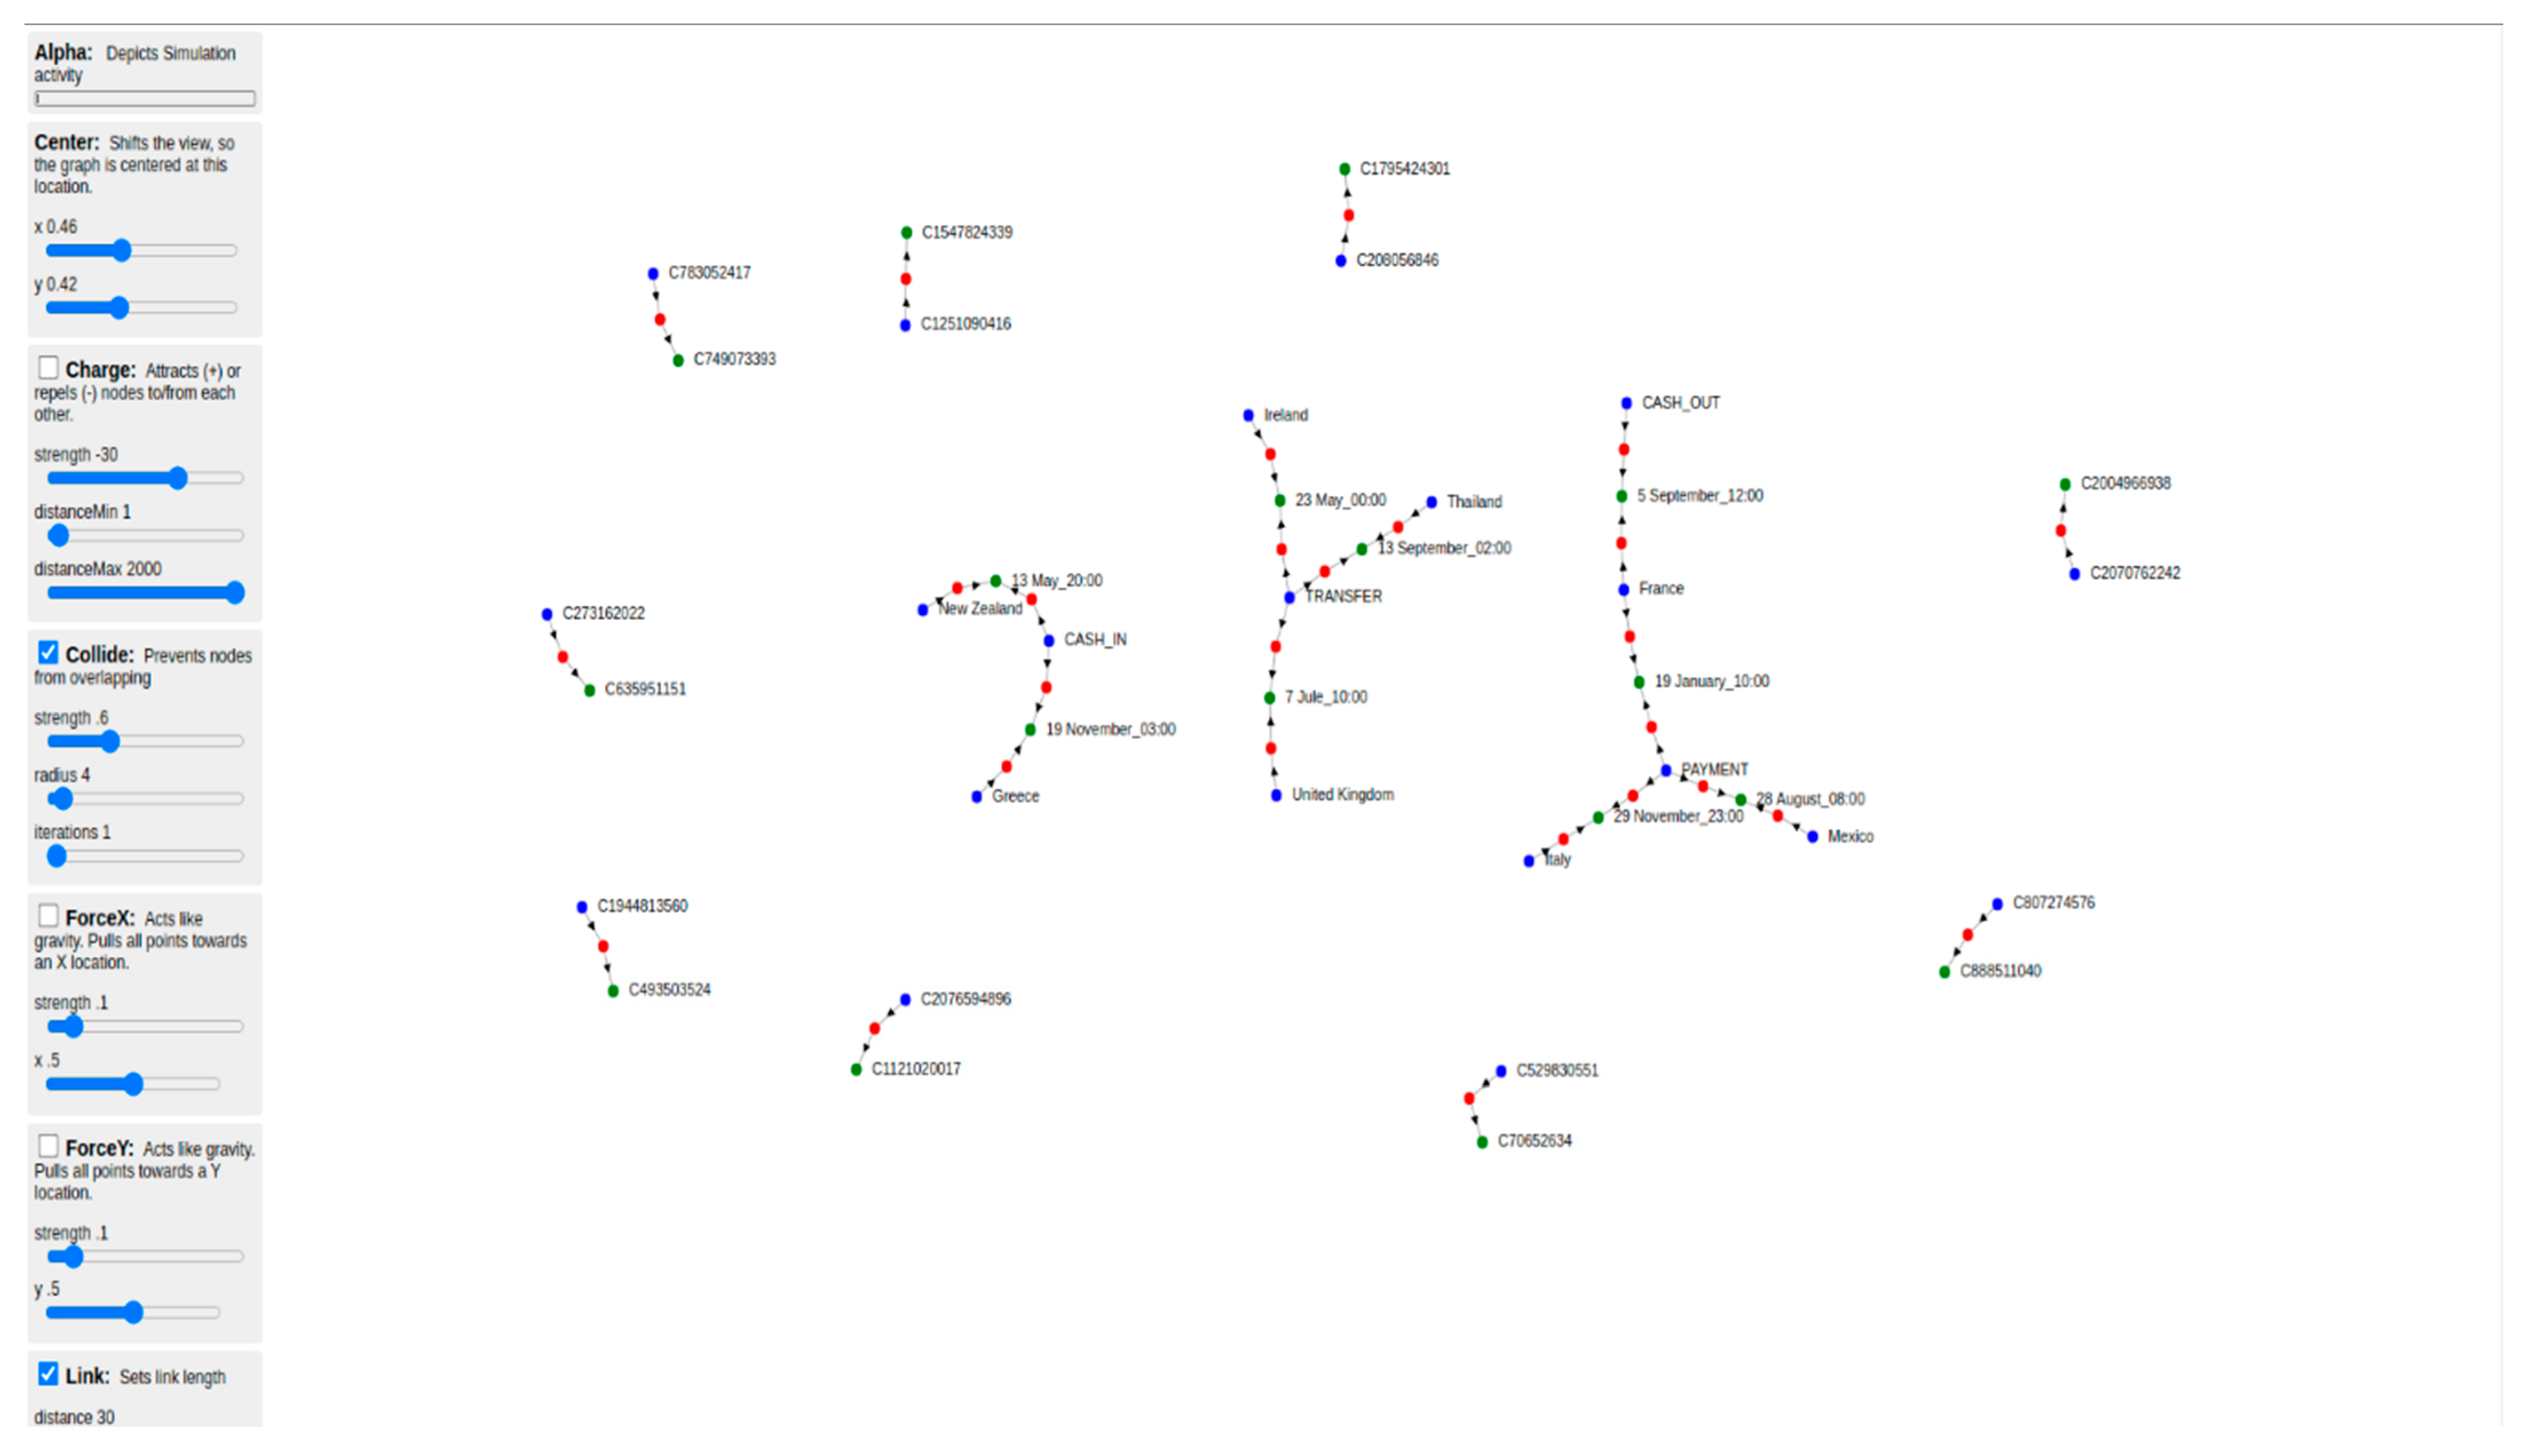
5.2. Knowledge Graph Visualization Tool

The knowledge graph visualization tool is a responsive web application that has been developed in order to perform the visualization which will facilitate the correlation between the different data instances of knowledge graphs stored as triplets. This tool is part of the Web-based HMI, as defined in Section 2. The large volume of data does not only render data management more difficult but also, and most importantly, hinders the process of analyzing and understanding them. Thus, an important issue that the current tool addresses is to communicate and present the relevant information in an efficient and clear way in order to improve the overall user experience and awareness.
The development basis of the tool is the D3 JavaScript library, a framework that is suitable for document object manipulation based on data (e.g., ontology files visualization). The visualization tool enables advanced capabilities for visual exploration and customization of the data instances using advanced interaction techniques which enhance the analytical capabilities of crime investigators and security officers. The tool’s execution requires a list of JSON data objects to display them as a graph composed of data nodes and links (which represent the relations between the nodes). The data nodes are displayed as colored circles and their links are illustrated as arrow lines between the nodes. Figure 6 demonstrates the overview of the tool’s GUI.
The implementation of the knowledge graphs visualization is carried out using different and independent operational modes and features which can be enabled or disabled via mouse interactions according to user needs and preferences. Moreover, each depicted graph presents all the asserted and inferred connections between the entire data properties of the specific dataset. The appended nodes, links and labels feature, in a comprehensive way, all of the identified data relations and correlations.
Regarding the customization of the tool, several visualization options are available, such as “filtering” using a specific degree of collapsing; “charging”, which is responsible for attracting or repelling nodes to and from each other, respectively; “zoom handling” for adding zoom functionality onto the graph; as well as “centering” for shifting the view of the graph into different points on the screen. Figure 5 is an indicative screen of entities and their interrelations, using predefined node colors. Red color is used to show the amount of the possible fraud transaction detected by the engine described in Section 4.1; blue color nodes show the source ids and types of each transaction and green color nodes depict the destination ids, the destination location and the timestamp of the transaction. The aforementioned color code is customizable depending on the dataset. Specifically, for this study, the colors are declared in an instantiated knowledge graph, which is populated with possible fraud or anomalous transactions after the execution of the abnormal behavior detection engine functionalities. The plethora of available customization options provides the users with the ability to focus their attention accordingly when exploring the populated knowledge, in order to reveal hidden patterns and relations between the depicted amount of possibly fraudulent transaction(s), names of the origin as well as the destination, types, places and dates/times of the transaction(s) in the current use-case analysis dataset.

6. Conclusions and Future Directions

This paper presented a study of outlier detection methods and algorithms using advanced machine learning techniques. In the context of this study, several machine learning algorithms were presented, tested and evaluated in order to decide which is the best alternative for the development of an abnormal behaviour detection engine for financial data. The auto-encoder algorithm demonstrated remarkable results based on the metrics of AUC and precision, for both the training and testing datasets. The exhaustive testing processes performed in the context of this study, as well as the tools developed for the integrated platform presented in Section 2, validate the conclusion that through the right choice of algorithm used for outlier detection, real-time detection is feasible.
The two innovative tools presented in the Section 5 are integrated in a common framework. The Abnormal Behavior Detection Engine, which effectively reads and analyzes individual data flows, allows the detection of outliers among massive datasets. Moreover, the outlier detection algorithm enhances security practitioners’ capabilities and, alongside other tools of the discussed framework, supports the performance of trends analysis and multivariate behavior anomaly detection. Thus, a robust system is formed, which operates in near real-time, in order to be increasingly knowledgeable of fraudulent activities of (cyber)crime groups.
Moreover, through its knowledge graphs visualization tool, the presented framework offers users multiple and easily customizable data views, as well as supreme HMI capabilities, in order to enhance awareness of monitored situations and increase the likelihood of revealing and depicting hidden correlations between data instances that are useful for security practitioners. Last but not least, the framework as well as the tools presented in this paper offer a future-proof solution that is open to the deployment of additional tools and algorithms at a future time.
All the aforementioned tools presented in this study focus on financial data and outlier detection but, through further development and study of semantic analysis algorithms as well as specific use cases, these tools can be expanded to other domains as well. For example, a further step to this expansion would be to examine different kinds of datasets such as network traffic data, telecom data, social media data and more. In addition, it would be very helpful for the end-users to incorporate different types of analysis alongside outlier detection so as to gain broader insights into the analyzed data. In this direction, Call Detail Records (CDR) analysis combined with Complex Event Processing (CEP) would offer advanced analysis capabilities to end-users and would assist them in gaining detailed insights in the considered use cases. Moreover, the outlier detection tool could also be used for other frameworks aside from the one presented in this study and in entirely different domains such as product quality assurance, call logs, cybersecurity, device functionality and many more. Thus, an outlier detection tool which can host many different methods for detection, as presented in this study, can be very useful for many different datasets and use cases. A universal outlier detection engine which would be data agnostic and could facilitate every kind of input data would be a very interesting approach in this direction because it could be used without restrictions in any domain and application.

Author Contributions

Conceptualization, E.A. and K.D.; Data curation, N.P.; Formal analysis, T.A.; Investigation, T.A.; Methodology, E.A. and K.D.; Resources, N.P.; Software, N.P.; Supervision, K.D.; Validation, E.A. and K.D.; Visualization, N.P. and T.A.; Writing—original draft, K.D., N.P., T.A. and E.A.; Writing—review & editing, E.A. All authors have read and agreed to the published version of the manuscript.

Funding

This work has been performed in the context of the PREVISION project, which has received funding from the European Union’s Horizon 2020 research and innovation programme under grant agreement No 833115. The paper reflects only the authors’ views and the Commission is not responsible for any use that may be made of the information it contains.

Institutional Review Board Statement

Not applicable.

Informed Consent Statement

Not applicable.

Data Availability Statement

The data presented in this study are available on request from the corresponding author. The data are not publicly available due to the policy of the PREVISION project.

Conflicts of Interest

The authors declare no conflict of interest.

References

  1. Redmon, J.; Divvala, S.K.; Girshick, R.B.; Farhadi, A. You Only Look Once: Unified, Real-Time Object Detection. arXiv 2015, arXiv:1506.02640. [Google Scholar]
  2. Najibi, M.; Samangouei, P.; Chellappa, R.; Davis, L.S. SSH: Single Stage Headless Face Detector. arXiv 2017, arXiv:1708.03979v3. [Google Scholar]
  3. Reichertz, J. Induction, Deduction, Abduction. In The SAGE Handbook of Qualitative Data Analysis; SAGE Publications Ltd.: London, UK, 2020. [Google Scholar]
  4. Puppe, F. (Ed.) Probabilistic Reasoning. In Systematic Introduction to Expert Systems: Knowledge Representations and Problem-Solving Methods; Springer: Berlin/Heidelberg, Germany, 1993; pp. 57–70. ISBN 978-3-642-77971-8. [Google Scholar]
  5. Castanedo, F. A Review of Data Fusion Techniques. Sci. World J. 2013, 2013, 704504. [Google Scholar] [CrossRef] [PubMed]
  6. Muhammed, M.; Obidallah, W.; Bijan, R. Applying Deep Learning Techniques for Big Data Analytics: A Systematic Literature Review. Arch. Inf. Sci. Tech. 2018, 1. [Google Scholar] [CrossRef]
  7. Hawkins, D.M. Identification of Outliers; Monographs on Applied Probability and Statistics; Chapman and Hall: London, UK; New York, NY, USA, 1980; ISBN 0-412-21900-X. [Google Scholar]
  8. Barnett, V.; Lewis, T. Outliers in Statistical Data; Wiley Series in Probability and Statistics; Elsevier: Amsterdam, The Netherlands, 1984; ISBN 978-0-471-93094-5. [Google Scholar]
  9. Aggarwal, C.C. (Ed.) Outlier Analysis; Springer International Publishing: Cham, Switzerlands, 2017; ISBN 978-3-319-47577-6. [Google Scholar]
  10. Santoyo, S. A Brief Overview of Outlier Detection Techniques. Available online: https://towardsdatascience.com/a-brief-overview-of-outlier-detection-techniques-1e0b2c19e561 (accessed on 30 November 2020).
  11. Rousseeuw, P.; Hubert, M. Robust Statistics for Outlier Detection. Wiley Interdisc. Rew. Data Min. Knowl. Discov. 2011, 1, 73–79. [Google Scholar] [CrossRef]
  12. Cohen, I. Outliers Analysis: A Quick Guide to the Different Types of Outliers. Available online: https://towardsdatascience.com/outliers-analysis-a-quick-guide-to-the-different-types-of-outliers-e41de37e6bf6 (accessed on 1 December 2020).
  13. Wilcox, R.R. Fundamentals of Modern Statistical Methods, 2nd ed.; Springer: New York, NY, USA, 2010; ISBN 978-1-4419-5525-8. [Google Scholar]
  14. HACH Quality Corner: Determining Outliers. Available online: https://support.hach.com/ci/okcsFattach/get/1008007_4 (accessed on 1 December 2020).
  15. Gao, J.; Tan, P. Converting Output Scores from Outlier Detection Algorithms into Probability Estimates. In Proceedings of the Sixth International Conference on Data Mining (ICDM’06), Hong Kong, China, 18–22 December 2006; pp. 212–221. [Google Scholar]
  16. Aggarwal, C.C. (Ed.) Proximity-Based Outlier Detection. In Outlier Analysis; Springer: New York, NY, USA, 2013; pp. 101–133. ISBN 978-1-4614-6396-2. [Google Scholar]
  17. Breunig, M.; Kriegel, H.-P.; Ng, R.; Sander, J. LOF: Identifying Density-Based Local Outliers. In Proceedings of the ACM Sigmod Record, Dallas, TX, USA, 16–18 May 2000; Volume 29, pp. 93–104. [Google Scholar]
  18. Tang, J.; Chen, Z.; Fu, A.W.; Cheung, D. A Robust Outlier Detection Scheme for Large Data Sets. In Proceedings of the 6th Pacific-Asia Conference on Knowledge Discovery and Data Mining, Hong Kong, China, 16–18 April 2001; pp. 6–8. [Google Scholar]
  19. Chiu, A.L.M. Ada Wai-chee Fu Enhancements on Local Outlier Detection. In Proceedings of the Seventh International Database Engineering and Applications Symposium, Hong Kong, China, 16–18 July 2003; pp. 298–307. [Google Scholar]
  20. He, Z.; Xu, X.; Deng, S. Discovering Cluster-Based Local Outliers. Pattern Recognit. Lett. 2003, 24, 1641–1650. [Google Scholar] [CrossRef]
  21. Gao, Z. Application of Cluster-Based Local Outlier Factor Algorithm in Anti-Money Laundering. In Proceedings of the 2009 International Conference on Management and Service Science, Wuhan, China, 20–22 September 2009; pp. 1–4. [Google Scholar]
  22. Goldstein, M.; Dengel, A. Histogram-Based Outlier Score (HBOS): A Fast Unsupervised Anomaly Detection Algorithm. In Proceedings of the Poster and Demo Track of the 35th German Conference on Artificial Intelligence (KI-2012), Saarbrucken, Germany, 24–27 September 2012; pp. 59–63. [Google Scholar]
  23. Yang, P.; Huang, B. KNN Based Outlier Detection Algorithm in Large Dataset. In Proceedings of the 2008 International Workshop on Education Technology and Training 2008 International Workshop on Geoscience and Remote Sensing, Shanghai, China, 21–22 December 2008; Volume 1, pp. 611–613. [Google Scholar]
  24. Hautamaki, V.; Karkkainen, I.; Franti, P. Outlier Detection Using K-Nearest Neighbour Graph. In Proceedings of the 17th International Conference on Pattern Recognition (ICPR 2004), Cambridge, UK, 26 August 2004; Volume 3, pp. 430–433. [Google Scholar]
  25. Orair, G.H.; Teixeira, C.H.C.; Meira, W.; Wang, Y.; Parthasarathy, S. Distance-Based Outlier Detection: Consolidation and Renewed Bearing. Proc. VLDB Endow. 2010, 3, 1469–1480. [Google Scholar] [CrossRef]
  26. Ratnam, V. Credit Card Fraud Detection Using Anti K-Nearest Algorithm. IJCSE 2012, 4, 1035. [Google Scholar]
  27. Malini, N.; Pushpa, M. Analysis on Credit Card Fraud Identification Techniques Based on KNN and Outlier Detection. In Proceedings of the 2017 Third International Conference on Advances in Electrical, Electronics, Information, Communication and Bio-Informatics (AEEICB), Chennai, India, 27–28 February 2017; pp. 255–258. [Google Scholar]
  28. Rousseeuw, P.J. Least Median of Squares Regression. J. Am. Stat. Assoc. 1984, 79, 871–880. [Google Scholar] [CrossRef]
  29. Hubert, M.; Debruyne, M.; Rousseeuw, P.J. Minimum Covariance Determinant and Extensions. WIREs Comput. Stat. 2018, 10, e1421. [Google Scholar] [CrossRef] [Green Version]
  30. Hubert, M.; Debruyne, M. Minimum Covariance Determinant. WIREs Comput. Stat. 2010, 2, 36–43. [Google Scholar] [CrossRef]
  31. Zaman, A.; Rousseeuw, P.J.; Orhan, M. Econometric Applications of High-Breakdown Robust Regression Techniques. Econ. Lett. 2001, 71, 1–8. [Google Scholar] [CrossRef] [Green Version]
  32. Welsch, R.E.; Zhou, X. Application of Robust Statistics to Asset Allocation Models. REVSTAT–Stat. J. 2007, 5, 97–114. [Google Scholar]
  33. Jolliffe, I.T. Principal Component Analysis, 1st ed.; Springer Series in Statistics; Springer: New York, NY, USA, 1986; ISBN 978-1-4757-1904-8. [Google Scholar]
  34. Xu, H.; Caramanis, C.; Sanghavi, S. Robust PCA via Outlier Pursuit. IEEE Trans. Inf. Theory 2012, 58, 3047–3064. [Google Scholar] [CrossRef] [Green Version]
  35. Stanimirova, I.; Daszykowski, M.; Walczak, B. Dealing with Missing Values and Outliers in Principal Component Analysis. Talanta 2007, 72, 172–178. [Google Scholar] [CrossRef]
  36. Amnarttrakul, R.; Thongteeraparp, A. New Statistics for Detection of Outliers Using the Last Few Principal Components. Sci. Asia 2011, 37, 355–359. [Google Scholar] [CrossRef]
  37. Kriegel, H.-P.; Schubert, M.; Zimek, A. Angle-Based Outlier Detection in High-Dimensional Data. In Proceedings of the 14th ACM SIGKDD International Conference on Knowledge Discovery and Data Mining, Las Vegas, NV, USA, 24–27 August 2008; Association for Computing Machinery: New York, NY, USA, 2008; pp. 444–452. [Google Scholar]
  38. Pham, N.; Pagh, R. A Near-Linear Time Approximation Algorithm for Angle-Based Outlier Detection in High-Dimensional Data. In Proceedings of the 18th ACM SIGKDD International Conference on Knowledge Discovery and Data Mining, Beijing, China, 12–16 August 2012; Association for Computing Machinery: New York, NY, USA, 2012; pp. 877–885. [Google Scholar]
  39. Liu, F.T.; Ting, K.M.; Zhou, Z. Isolation Forest. In Proceedings of the 2008 Eighth IEEE International Conference on Data Mining, Pisa, Italy, 15–19 December 2008; pp. 413–422. [Google Scholar]
  40. John, H.; Naaz, S. Credit Card Fraud Detection Using Local Outlier Factor and Isolation Forest. Int. J. Comput. Sci. Eng. 2019, 7, 1060–1064. [Google Scholar] [CrossRef]
  41. Laimek, R.; Kaothanthong, N.; Supnithi, T. ATM Fraud Detection Using Outlier Detection. In Proceedings of the Intelligent Data Engineering and Automated Learning (IDEAL 2018), Madrid, Spain, 21–23 November 2018; Yin, H., Camacho, D., Novais, P., Tallón-Ballesteros, A.J., Eds.; Springer International Publishing: Cham, Switzerlands, 2018; pp. 539–547. [Google Scholar]
  42. Buschjäger, S.; Honysz, P.-J.; Morik, K. Randomized Outlier Detection with Trees. Int. J. Data Sci. Anal. 2020. [Google Scholar] [CrossRef]
  43. Patterson, D.W. Artificial Neural Networks: Theory and Applications, 1st ed.; Prentice Hall PTR: Upper Saddle River, NJ, USA, 1998; ISBN 0-13-295353-6. [Google Scholar]
  44. Szegedy, C.; Zaremba, W.; Sutskever, I.; Bruna, J.; Erhan, D.; Goodfellow, I.; Fergus, R. Intriguing Properties of Neural Networks 2014. arXiv 2014, arXiv:1312.6199. [Google Scholar]
  45. Khamis, A.; Ismail, Z.; Khalid, H.; Mohammed, A. The Effects of Outliers Data on Neural Network Performance. J. Appl. Sci. 2005, 5, 1394–1398. [Google Scholar] [CrossRef]
  46. Chen, J.; Sathe, S.; Aggarwal, C.; Turaga, D. Outlier Detection with Autoencoder Ensembles. In Proceedings of the 2017 SIAM International Conference on Data Mining, Houston, TX, USA, 27–29 April 2017; pp. 90–98. [Google Scholar]
  47. Yusup Anomaly Detection Part 1: Autoencoder. Available online: https://medium.com/ai3-theory-practice-business/anomaly-detection-part-1-autoencoder-58bdbbea5001 (accessed on 4 December 2020).
  48. Lenderink, R.J. Unsupervised Outlier Detection in Financial Statement Audits. Master’s Thesis, University of Twente, Enschede, The Netherlands, September 2019. [Google Scholar]
  49. Bolton, R.; Hand, D. Unsupervised Profiling Methods for Fraud Detection. Credit Scoring Credit Control 2001, 7, 235–255. [Google Scholar]
  50. Kanhere, P.; Khanuja, H.K. A Methodology for Outlier Detection in Audit Logs for Financial Transactions. In Proceedings of the 2015 International Conference on Computing Communication Control and Automation, Pune, India, 26–27 February 2015; pp. 837–840. [Google Scholar]
  51. Kanhere, P.; Khanuja, H.K. A Survey on Outlier Detection in Financial Transactions. Int. J. Comput. Appl. 2014, 108, 23–25. [Google Scholar] [CrossRef]
  52. Zhu, T. An Outlier Detection Model Based on Cross Datasets Comparison for Financial Surveillance. In Proceedings of the 2006 IEEE Asia-Pacific Conference on Services Computing (APSCC’06), Guangzhou, China, 12–15 December 2006; pp. 601–604. [Google Scholar]
  53. Perez, D.G.; Lavalle, M.M. Outlier Detection Applying an Innovative User Transaction Modeling with Automatic Explanation. In Proceedings of the 2011 IEEE Electronics, Robotics and Automotive Mechanics Conference, Cuernavaca, Morelos, 15–18 November 2011; pp. 41–46. [Google Scholar]
  54. Zhao, Y.; Nasrullah, Z.; Li, Z. PyOD: A Python Toolbox for Scalable Outlier Detection. arXiv 2019, arXiv:1901.01588. [Google Scholar]
  55. Spackman, K.A. Signal Detection Theory: Valuable Tools for Evaluating Inductive Learning. In Proceedings of the Sixth International Workshop on Machine Learning, New York, NY, USA, 26–27 June 1989; Morgan Kaufmann Publishers Inc.: San Francisco, CA, USA, 1989; pp. 160–163. [Google Scholar]
  56. Hanley, J.A.; Mcneil, B. The Meaning and Use of the Area Under a Receiver Operating Characteristic (ROC) Curve. Radiology 1982, 143, 29–36. [Google Scholar] [CrossRef] [Green Version]
  57. Fawcett, T. Introduction to ROC Analysis. Pattern Recognit. Lett. 2006, 27, 861–874. [Google Scholar] [CrossRef]
  58. Mohri, M.; Rostamizadeh, A.; Talwalkar, A. Foundations of Machine Learning; The MIT Press: Cambridge, MA, USA, 2012; ISBN 0-262-01825-X. [Google Scholar]
  59. Lopez-Rojas, E.A.; Elmir, A.; Axelsson, S. PaySim: A Financial Mobile Money Simulator for Fraud Detection. In Proceedings of the 28th European Modeling and Simulation Symposium, Larnaca, Cyprus, 26–28 September 2016. [Google Scholar]
Figure 1. High level architecture.
Information 12 00034 g001
Figure 2. True Positives (TP), False Positives (FP), True Negatives (TN) and False Negatives (FN) illustration.
Information 12 00034 g002
Figure 3. Abnormal detection engine.
Information 12 00034 g003
Figure 4. Financial outlier detection table.
Information 12 00034 g004
Figure 5. Real-time financial outlier detection table.
Information 12 00034 g005
Figure 6. Knowledge graph visualization tool User Interface (UI).
Information 12 00034 g006
Table 1. Overview of Area Under the ROC (AUC) and Precision metrics (train and test data) for different algorithms.
Proximity-BasedLinearModelVector-BasedOutlier EnsembledNeural Networks
MetricLOFCBLOFHBOSKNNMCDPCAABODI-FORESTAUTO-ENCODER
AUC—Train0.49420.82440.56770.92850.79640.91920.47310.97850.9985
Precision—Train0.00990.84750.82470.83790.75220.75460.30850.92740.9474
AUC—Test0.48310.82380.57110.92750.79510.91850.47110.97210.9974
Precision—Test0.00860.84620.82340.83670.74870.75330.30740.92630.9461
Table 2. Overview of Receiver Operating Characteristics (ROC) performance using the studied algorithms in different datasets.
DatasetLOFCBLOFHBOSKNNMCDPCAABODI-FOREST
arrhythmia0.77870.78350.82190.78610.77900.78150.76880.8005
letter0.85940.50700.59270.87660.80740.52830.87830.6420
mnist0.71610.80090.57420.84810.86660.85270.78150.8159
pendigits0.45000.50890.87320.37080.39790.50860.46670.7253
satellite0.55730.55720.75810.68360.80300.59880.57140.7022
Table 3. Overview of precision using the studied algorithms in different datasets.
DatasetLOFCBLOFHBOSKNNMCDPCAABODI-FOREST
arrhythmia0.43340.45390.51110.44640.39950.46130.38080.4961
letter0.36410.07490.07150.33120.19330.08750.38010.1003
mnist0.33430.33480.11880.42040.34620.38460.35550.3135
pendigits0.06530.27680.29790.09840.08930.31870.08120.3422
satellite0.38930.41520.56900.49940.68450.47840.39020.5676
Publisher’s Note: MDPI stays neutral with regard to jurisdictional claims in published maps and institutional affiliations.

