
Leveraging Aviation Risk Models to Combat Cybersecurity Threats in Vehicular Networks
by
 and
and
Jonathan Ebert
1,†, 
Ohad Newton
1,†,
Jeffery O’Rear
1,†,
Scott Riley
1,†,
Jaehong Park
1,* and
Maanak Gupta
2 1
Department of Management, Marketing and Information Systems, University of Alabama in Huntsville, Huntsville, AL 35899, USA
2
Department of Computer Science, Tennessee Technological University, Cookeville, TN 38505, USA
*
Author to whom correspondence should be addressed.
†
These authors contributed equally to this work and listed in alphabetic order.
Information 2021, 12(10), 390; https://0-doi-org.brum.beds.ac.uk/10.3390/info12100390
Submission received: 16 August 2021
/
Revised: 8 September 2021
/
Accepted: 12 September 2021
/
Published: 23 September 2021
(This article belongs to the Special Issue Secure and Trustworthy Cyber–Physical Systems)
Abstract
:The rapidly developing technology and lack of standards in the transportation industry for the proposed Vehicle-to-Vehicle (V2V), Vehicle-to-Infrastructure (V2I), and Vehicle-to-Everything (V2X) networks, which all vehicles will operate under, drives concern about information validity and authenticity due to the risk of erroneous or malicious information being injected into a vehicular network (VN). In this paper, we apply a risk management process to a vehicular network that will identify hazards and possible controls that can lower their risk. After researching and reviewing various technologies along with several risk models, we have developed a basic framework for assessing and assigning risk through a phased method that leads to input for our developed model.
1. Introduction
The National Highway Traffic Safety Administration (NHTSA) and the Department of Transportation (DOT) have been reviewing several emerging technologies for use within a Vehicular Network (VN) that include proposed Vehicle-to-Vehicle (V2V), Vehicle-to-Infrastructure (V2I), and Vehicle-to-Everything (V2X) networks. These various networks will process a significant amount of data through a multitude of sensors and signals from varying technologies in order to provide information to an integrated transportation network. This integration creates a multitude of associated vulnerabilities in the VN that an attacker may possibly exploit (see Appendix A for examples). There needs to be an assessment made of any existing or new technologies that will be integrated into this network and how they will affect each other or how they can provide erroneous data because of certain hazards, including malicious actors. This assessment should also propose controls, such as user alerts, that can mitigate this risk and make the vehicular network a safer environment.
In this paper we have developed an assessment model for vehicular network technologies that can identify and categorize vulnerabilities during the design phase. The threats associated with these vulnerabilities are categorized to determine what levels of risk are associated with them in order to eliminate or mitigate their impact. This is accomplished by a phased implementation process for vehicular network adoption with risk models and matrices. This makes sure that vulnerabilities are identified early in the development process and throughout the implementation phases as new technologies are introduced.
When the top automotive giants were conceptualizing their ideas of what the automobile should be, there was no way they could have imagined how far automobiles and technology would have come. What started as a medium to transport people across the highways and byways, has exploded into the information highway. It is now literally part of the global network of system and data we call the Internet. As such, more people are reliant on their vehicle for more than just transportation. Today’s vehicles are a veritable resource for communication, entertainment, weather, navigation and more. As the vehicle systems become more and more a part of this global infrastructure (i.e., Internet and other networked systems), they are more susceptible to disruptive or destructive cyber-attacks. Because of this rapidly developing technology and the lack of standards in the transportation industry for the proposed V2V, V2I, and V2X networks, which all vehicles will operate under, there is concern about how all this information will interact. With all the different integrated systems used to provide information to a vehicle’s situational awareness, processes have to be in place to determine if there are any discrepancies and alert users to any possible threats or hazards that will affect the VN. If a risk based approach is integrated during the design phase and threats are identified before the deployment phase, then controls can be implemented to mitigate or possibly eliminate the threats. This will increase cyber resilience while also saving time and money in the prevention of cyber related incidents. Additionally, this research will ultimately provide a safer environment by providing greater situational awareness about how the subsystems interact, which could foresee problems and prevent accidents.
The rest of the paper consists of the following sections. In Section 2, we discuss several related works. Section 3 presents comparative review of risk models found in aviation industry. In Section 4, we propose a vehicular network risk management model. We then discuss the proposed model with our use case scenario in Section 5. Section 6 concludes the paper.
2. Related Works
In this section, we first review some of the notable research that discussed the need for a risk management approach for VNs and information about risk reduction through the comparison of multiple input sources. Boyes and Luck [1] examine the need to adopt a security-minded approach to in-vehicle automation, V2I, and V2V technologies in order to reduce the likelihood of malicious exploitation. The increased use of software-based components in the vehicle and the V2V, V2I, and V2X connectivity, that provide external access, will create new vulnerabilities. These vulnerabilities can be exploited in a way that will impact the safety of the vehicle occupants and other users of the road. The vehicle Controller Area Network (CAN) used to be considered isolated from other networks but Valasek and Miller [2] proved that it can be remotely accessed in some vehicles. This risk is currently low but it is expected to increase with the increase in connectivity. Boyes and Luck [1] recommend a risk management approach that includes risk assessment and risk mitigation. This approach should be applied throughout the life cycle of the vehicle. The future use of V2V and V2I in traffic control will require a similar risk management approach for the infrastructure and the traffic system as a whole. While this work covers the high-level need for a risk management approach with a few examples, it does not attempt to perform a comprehensive risk assessment.
Ward and Wooderson [3] point out that, as modern vehicles are increasingly connected, the new systems need to be sufficiently resilient against intentional abuse. The additional connectivity is increasing the attack surface of these vehicles. The increased automation of vehicle control means that, if an attacker penetrated the vehicle system, the potential harm is greater. They surveyed existing standards that address the safety and security integrity levels of vehicles and other programmable electronic safety-related systems. IEC 61508 defines Safety Integrity Levels (SILs) that, for frequently used systems, specify an allowable frequency of dangerous failure. The Motor Industry Software Reliability Association (MISRA) Safety Analysis guidelines determine risk based on severity of the consequences of the hazard, probability of exposure to the hazardous situation, and either the possibility of avoiding the hazardous event, or controllability which is an estimate of the degree of control over the safety of the situation following a hazard. ISO 26262 defines an Automotive Safety Integrity Level (ASIL) based on hazard analysis and risk assessment. IEC 15408, known as the Common Criteria, defines an Evaluation Assurance Level (EAL) as a scale of increasing assurance from one to seven. The European EVITA project covered several aspects of in-vehicle system security. This project defined a method for threat analysis and risk assessment that results in a risk score of R0 to R7+. Ward and Wooderson [3] propose an automotive security integrity level (denoted xIL), which, based on the previously mentioned work, takes the outcome of threat analysis and risk assessment as an input risk level. They recommend that this classification scheme will be adopted across the automotive industry to ensure consistency across the supply chain.
Rockl et al. [4] describe sensor fusion as a way to mitigate the errors of individual sensors, such as radar and Lidar (light detection and ranging), by adding readings from V2V communication. Each sensor reading includes errors from environmental impact, unintended reflections, and low angular resolution. The filtering is based on Bayesian theory and can be implemented using algorithms such as Kalman filter or particle filter. Their paper does not explicitly address the possibility that the V2V readings are intentionally wrong due to malicious intent.
In [5], Obst et al. collected location, heading and velocity information of another vehicle through V2V communication using a MobilEye vision-system. The information from the MobilEye vision-system is used to check the plausibility of the information provided through V2V communication. The calculated plausibility levels are ’neutral’, ’valid’ and ’invalid’. When a real target vehicle is in the line-of-sight (LoS) of the ego vehicle, the information from the MobilEye vision-system corroborate the information from the V2V communication and the reading is confirmed as ’valid’. When the target vehicle is out of the LoS of the ego vehicle (aka subject vehicle or vehicle under test (VUT)), there is no reading from the MobilEye vision-system and the V2V information plausibility is ’neutral’. When a ghost target vehicle is injected by a simulated attacker and reports a location that is in the LoS of the ego vehicle, the information from the MobilEye vision-system is used to determine that the plausibility of the V2V information is ’invalid’. Their work shows that the principle of calculated plausibility is working but in a very narrow set of circumstances.
Our literature studies, documented in this section, and the study of several threat risk models that organizations are using, aided in our evaluation of the risks related to people, technology, and vehicles in the context of their involvement inside a vehicular network. Similar studies [6] have shown a comparison of risk models that highlight the aspects of each, and it is this coupled with our examination of other models used for risk management that has driven us toward our consideration of the National Institute of Standards and Technology (NIST) Special Publication 800-30 [7] guidance on how to conduct risk assessments for federal information systems and organizations. It details how risk assessments are part of an overall process that provides decision makers with the information they need to make informed decisions. This publication provides guidance on what is needed to determine appropriate courses of action in response to identified risks. It also provides the necessary details that are required to identify specific risk factors and how they can possibly be categorized and mitigated.
Smith [8] identifies the various technologies available to interact with and perform security testing on vehicular networks. Since the CAN has been in use for several years, there are numerous inexpensive hardware devices available to interact with it. These devices are primarily used for packet injection and inspection. The more expensive hardware devices such as the ChipWhisperer Toolchain are built for side-channel attacks such as power analysis and clock glitching [8]. In addition to the hardware tools available, the software tools allow for a larger set of capabilities including sniffing, packet injection, visualization, brute force, reverse engineering, and fingerprinting. As has been seen with the maturation of network assessment tools, the maturation of CAN tools and the increase in interconnectivity with vehicular networks will lead to an increased risk of vulnerability exploitation.
Risks to vehicular networks come from several angles. Smith [8] explains that potential attack surfaces include internal components such as infotainment and navigation systems, USB connections, OBD-II connectors, and CAN Bus splicing. The external attack surfaces include cellular connections, Wi-Fi connections, Bluetooth connections, Tire Pressure Monitor System (TPMS), and Key Fobs (KES). While many of these technologies were designed without security in mind, V2V is the first automotive protocol to consider cybersecurity threats at the design stage, rather than after the fact [8]. However, there are hurdles yet to be overcome as implementation and interoperation between countries are still being determined, so many processes and security measures are still undecided. To mitigate the risks associated with wireless communications, V2V and V2I will use Dedicated Short Range Communications (DSRC) based on 802.11p and 1609.x protocols. These communications are secured using Public Key Infrastructure for encryption; however, the standards are not yet compatible between the United States and Europe.
Sharma et al. [9] discuss an active research area related to V2V/V2I communication and the encryption mechanisms mentioned above. They briefly detail 802.11p, Wireless Access in Vehicular Environment (WAVE), and 1609.x, which includes 1609.1, message protocols and standardized responses, 1609.2, which covers security, 1609.3, which defines WAVE networking services, and 1609.4, which defines Media Access Control (MAC) layers. IEEE 1609 includes a few other standards in this family, but only these standards are relevant to this paper. Their primary contribution is an analysis of the computation and network overhead due to encryption and verification of beacon messages for V2V and V2I, as well as an analysis of filtering methods to reduce such overhead.
Heineke et al. [10] address some of the hurdles that need to be overcome before autonomous vehicles can be considered a viable technology. They provide all the current technologies that encompass what is currently envisioned as requirements to make a fully autonomous vehicle in the near future. The article also details some of the subsystems that will be used to develop the vehicle’s perception. It also goes into the decision making algorithms that will have to be in place for the vehicle to determine the best course of action. Finally, it goes into the testing and validation requirements that must be met before vehicles can become truly autonomous.
In [11], Stewart talks about the artificial intelligence that is already being developed in the aviation industry and how systems are being developed that are making human pilots less necessary. The article provides several examples of how pilots are already limited in their actions aboard autonomous aircraft and how some accidents were caused by human error because they were too reliant on automation. It also discusses the challenges still remaining in the aviation industry before aircraft can truly become pilotless.
3. Comparative Review of Aviation Industry Risk Models
Though we have focused our research on the private sector, through our findings in literature readings, policies, and standards development; it can be seen that the government is working closely with the private sector to help validate and socialize new ideas for cybersecurity. One area can be seen within the aviation industry, who are also adopting a common communications network to be mandated by 1 January 2020 [12]. This technology is known as automatic dependent surveillance-broadcast (ADS-B) and works by periodically broadcast its position so it can be tracked.
The Federal Aviation Administration (FAA) [13] is becoming less reliant on radar and leaning more towards satellite data. It describes how the aviation implementations of ADS-B is already leading to reductions in the risk of runway incursions by giving pilots indications or alerts of potential collisions. They are shown the location of other aircraft and equipped ground vehicles on airport surfaces—even at night or during heavy rainfall. It is this technology that affirms the direction of V2X development and the success of such vehicular network implementations.
Our research examines current and emerging technologies to produce useful risk models and recommendations for improving current systems. It also leverages knowledge from adjacent transportation domains, such as ADS-B, which is used in aviation applications. This will allow the use of existing research to form a better analysis of possible risks and mitigation. One such area of risk has already been identified and is being explored for solutions [13]. Like many industrial Internet of Things (IoT) controllers, ADS-B equipment does not support encryption, so it is possible to forge the broadcast packet with a man-in-the-middle (MitM) attack. In theory, a threat actor could take a Boeing 777 and make it appear miles away from its actual location, potentially leading to mid-air collisions. This is an anticipated risk to be seen in a vehicular network and thus following the FAA’s proposed solution and results should help reduce research and testing required in vehicular network development. Since aircraft systems do not have enough CPU power for encryption and due to backward compatibility concerns with the installed base, the FAA devised other methods to verify authenticity. These methods, while not publicly detailed, involve analytic geometry combined with a database of aircraft performance to calculate an aircraft’s previous position and compare it to the recently received packet. Likewise, one could devise an automotive database solution to manage traffic performance for comparison and validation in a similar manner.
When it comes to assessing risk, there are many similarities between the ground transportation and aviation sectors and between the private and government sectors. Take for instance the fact that each sector establishes guidance through policies and procedures, models and methodologies, and processes and frameworks. Even though the US Department of Defence (DoD) is working in conjunction with the private sector and they have some common goals of communications, safety and defense, there are some differences. One notable difference from the DoD can be found in that the President or Secretary of Defense can deem it appropriate to conduct cyber operations that disrupt or destroy an adversary’s infrastructure. This is not a mission, goal or objective of the automotive industry nor the vehicle communications industry.
In our process, we leveraged this research and used similar methods, such as identifying and categorizing items which are possible hazards and then evaluating them to determine how they affect the overall risk. The aviation Flight Risk Assessment Tool (FRAT) deals mostly with safety oriented risk assessment based on human factors [14]. Some of these factors include the experience levels of pilots (how many hours they have been flying), how many hours the pilots have in that type and series of aircraft, how current they are in the aircraft (how long it has been since they have flown), how much rest they have had, and other criteria based on a pilot’s ability to fly the aircraft. This is because human factors are the largest contributor to accidents in the aviation industry.
While the process being proposed for the vehicle security network has reliance on human operators, its focus is more on the reliability of the technologies used in the vehicular network and not on the risk contribution of human factors as in the aviation models. The experience levels and lessons learned in a technology reliant system are equal throughout the network. If the systems and subsystems are updated they will all have the same level of expertise. The technology used in a vehicular network is also going to perform at the same level without regard to how much it has been used or how long it has not been used. Though the aviation industry is becoming more reliant on technology everyday, their risk levels and policies are mainly formulated around factors that affect the pilot’s ability to fly the aircraft [15]. Perhaps as reliance on technology continues to grow in the aviation industry, they could possibly incorporate this approach into their risk model.
This process being proposed is different from previously researched models because this is constantly ongoing while those are only implemented before the flight begins and do not change [15]. This research is more focused on system reliability and looks at the factors that can affect the system’s ability to function as designed. These factors are referred to as “threats”. Threats are any action, whether intentional or not, that affect the network’s reliability. The model proposed in this paper will provide a systematic method to identify threats from development to implementation into the vehicular network. It will also help identify controls, implement them, and monitor their effectiveness. This will give the assessment of a residual risk based on the control that was implemented to counteract a particular threat. This is an ongoing process that is constantly reassessed and controls are modified to counter evolving threats.
4. A Proposed Vehicular Network Risk Management Model and Methodology
Currently, no single standard exists to support our particular approach; and thus our processes, models and methodologies draw upon accepted standard formats used in risk management models and assessment matrices found in the following policies, procedures and standards:
- ISO 26262 ASIL Hazard Classification [16]
- ISO 15408 Evaluation criteria for IT security [17]
- ISO 27001 Information Security Management System [18]
- NHTSA-2016-0126 Federal Motor Vehicle Safety Standards: V2V Communications [19]
- SAE J3061 Cybersecurity Guidebook for Cyber-Physical Vehicle Systems [20]
- NIST SP 800-30 Guide for Conducting Risk Assessments [7]
- NIST SP 800-39 Managing Information Security Risk [21]
- NIST SP 800-53 Security and Privacy Controls for Federal Information Systems and Organizations [22]
- NIST SP 800-82 Guide to Industrial Control Systems (ICS) Security [23]
- DOT HS 812 073 National Institute of Standards And Technology Cybersecurity Risk Management Framework Applied to Modern Vehicles [24]
- NIST SP 800-37, Risk Management Framework for Information Systems and Organizations [25]
- DODi 8510.01, Risk Management Framework (RMF) for DoD Information Technology (IT) [26]
- NASA SP-2011-3422, NASA Risk Management handbook [27]
- DOD Risk, Issue, and Opportunity Management Guide for Defense Acquisition Programs [28]
- ISO 31000, Risk Management—Guidelines [29]
4.1. Vehicular Network Risk Model
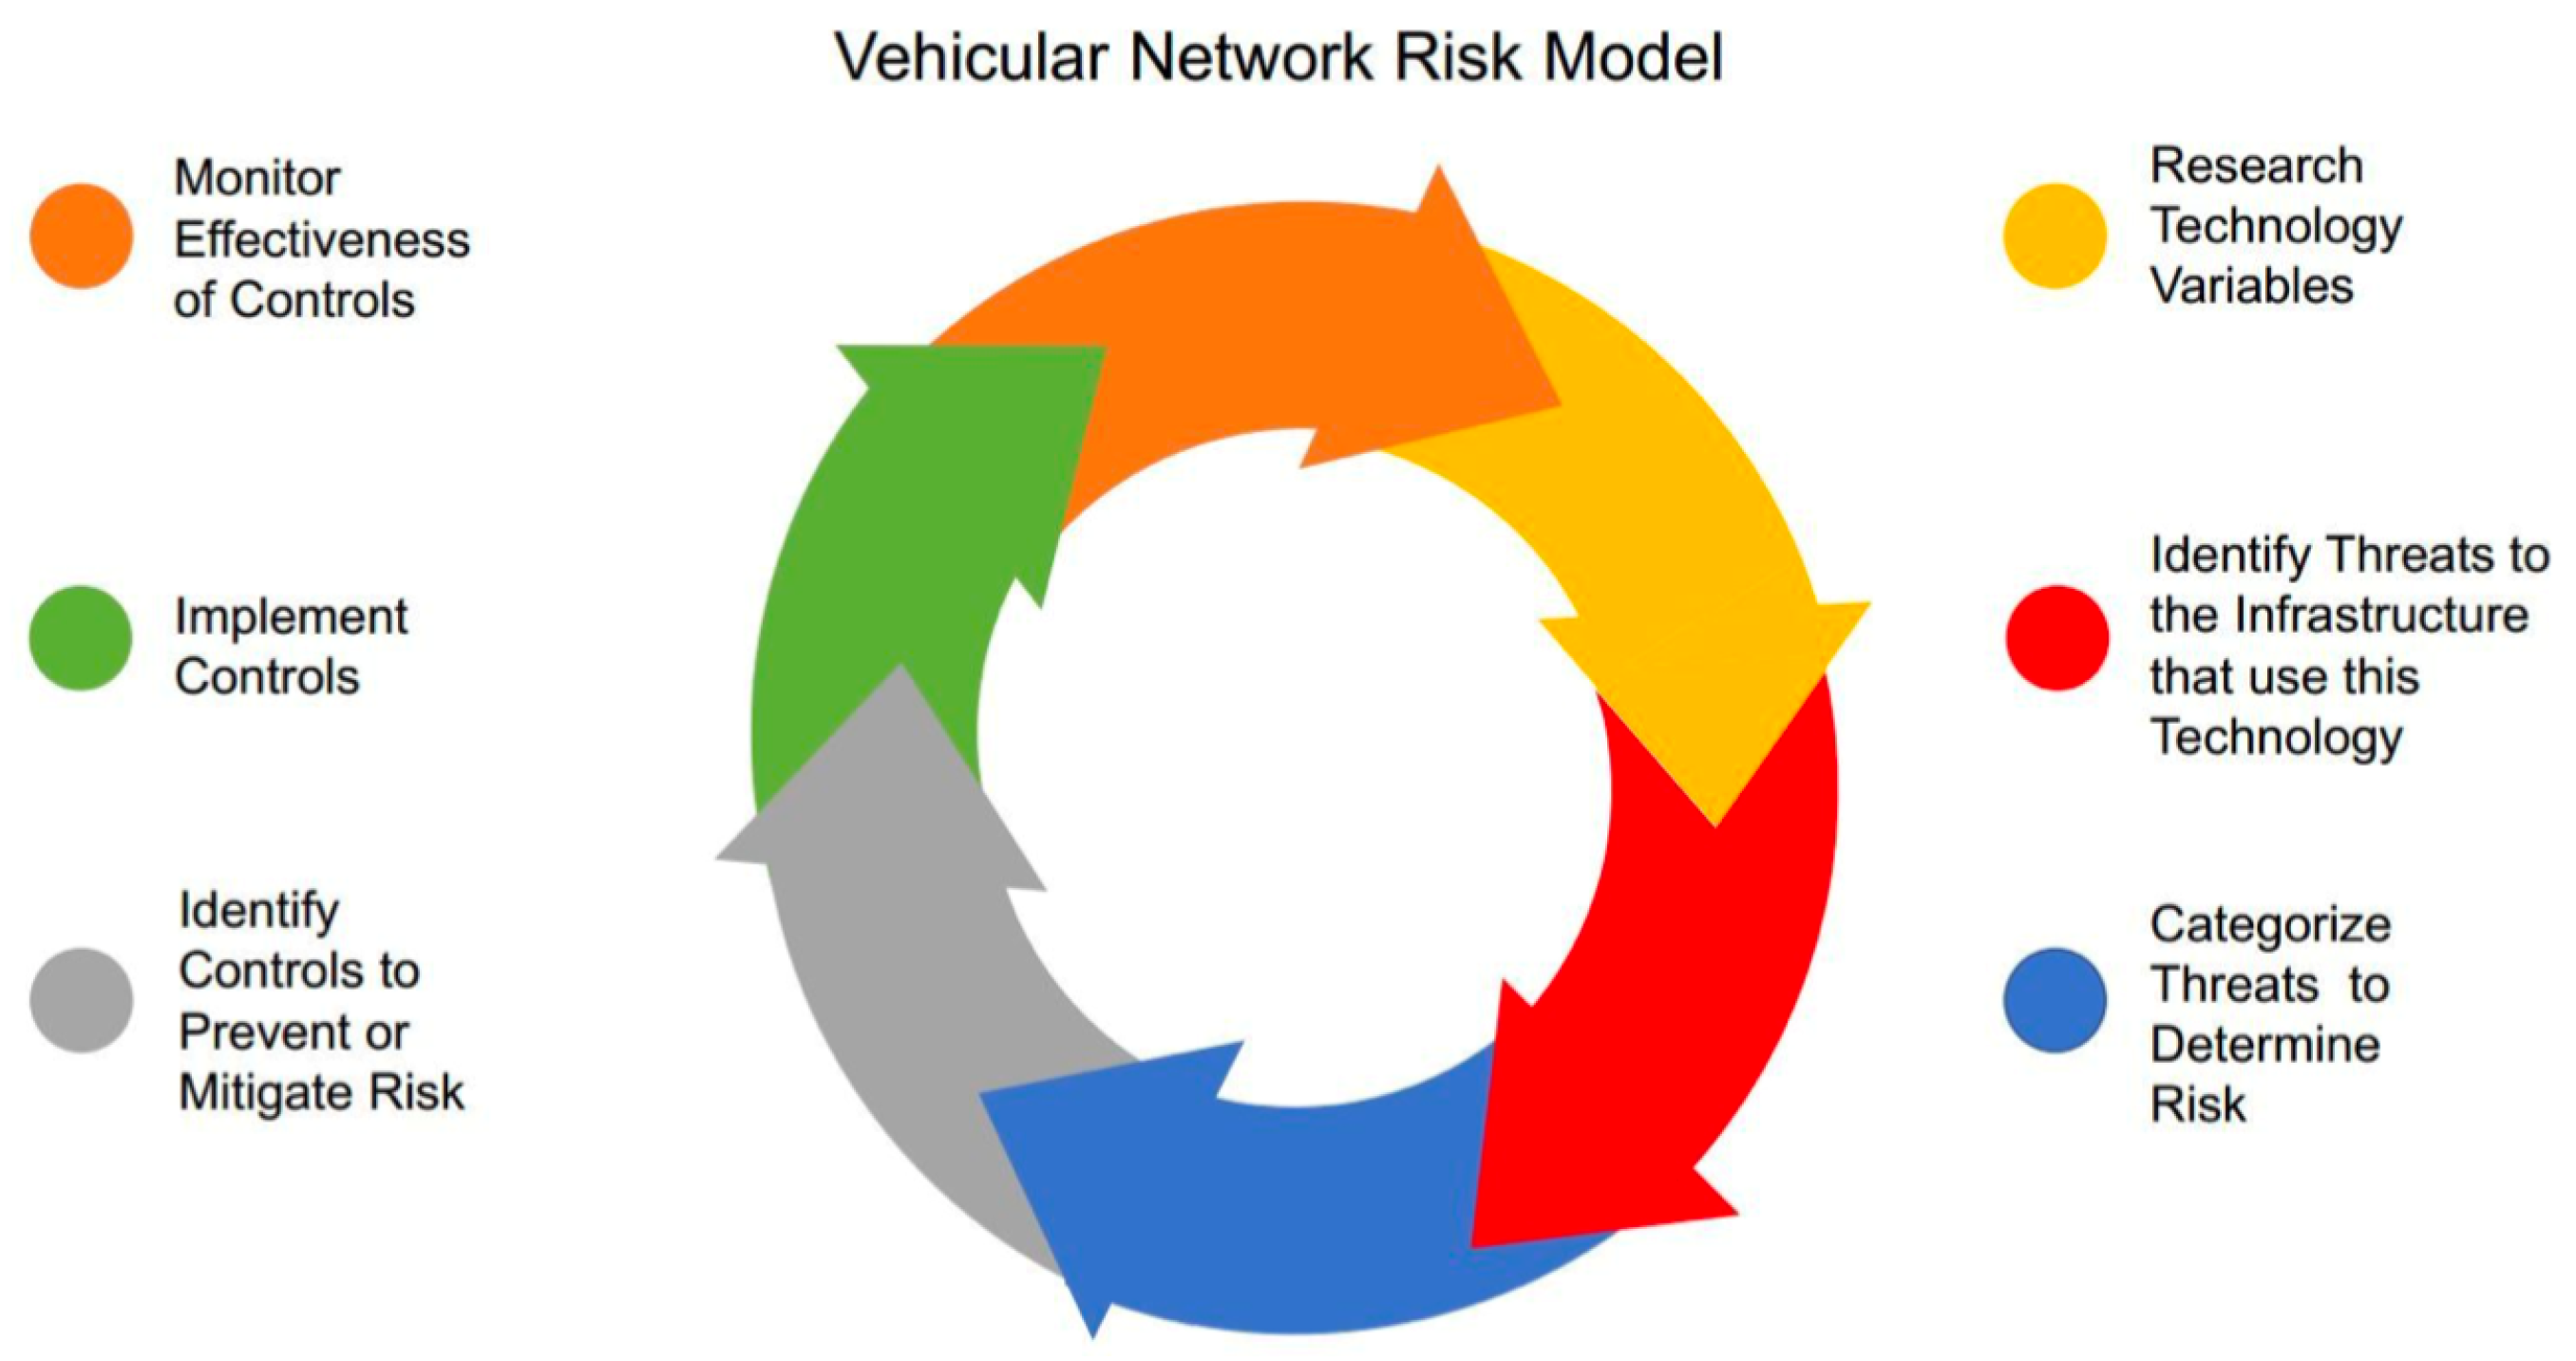
In this subsection, as shown in Figure 1, we propose an assessment model for vehicular network technologies which includes six phases. The phases are:
- Research Technology Variables;
- Identify Threats to the infrastructure that use this Technology;
- Categorize Threats to Determine Risk;
- Identify Controls to Prevent or Mitigate Risk;
- Implement Controls;
- Monitor Effectiveness of Controls.
As depicted in Figure 1, the proposed model is circular and can be started at any of these phases. In the rest of this paper, we will assume that the first phase is to research technology variables.
4.2. Risk Management Process
The vehicular network risk management process follows the six phases of the assessment model. In this subsection, we discussed each phase of the process by giving a description of the phase and what its function is. Each phase in the process is followed by attributes and details that are collected during that particular phase of the process. Possible values for each of these items are provided with descriptions of what each means and how it could be utilized by users in a hypothetical vehicle network. The template(s) provided for each phase identify key attributes that need to be examined in the corresponding phase. An application for the risk management process can be developed using these templates to assist the management processes.
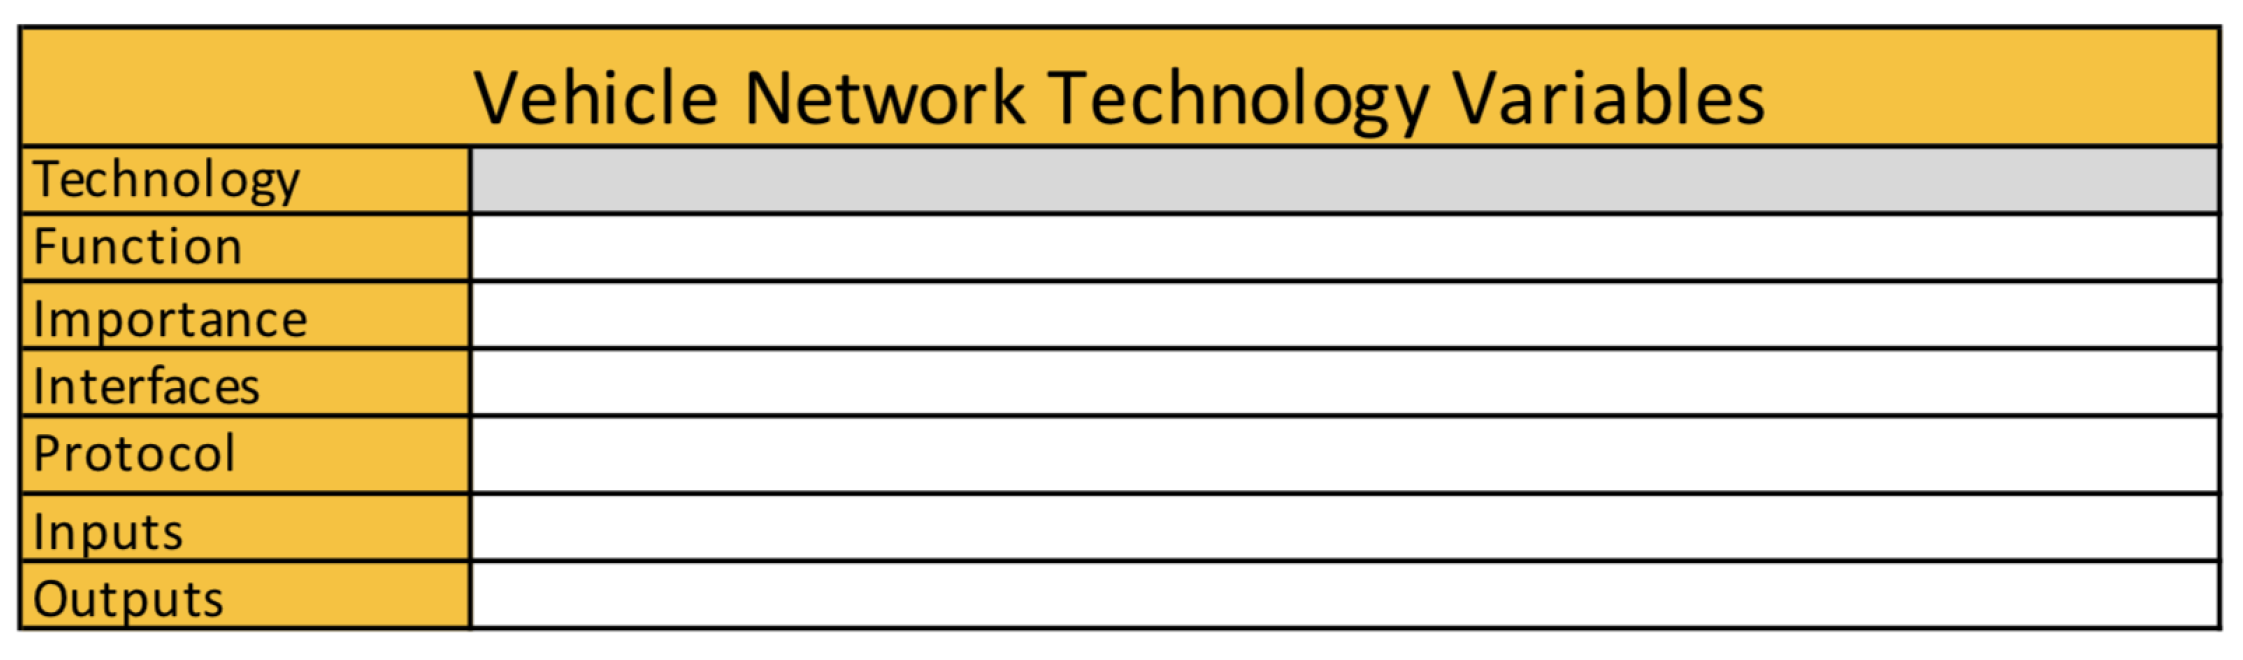
Phase 1: Research Technology Variables. In this phase of the process, technologies are identified along with their attributes. This is necessary to the process so that analysts can attribute threats to a particular technology based on its structure and dependencies. To do this, analysts need to collect information about the way a technology will interface and communicate within the network. Figure 2 shows a template that analysts can use for Phase 1. It includes several attributes that can be used to build a better understanding of the technology. These attributes are listed below with descriptions:
- Technology—The common name for the technology that the threat assessment is being done for;
- Function—The purpose of this technology in the vehicle network;
- Importance—The level of importance to the vehicle network (High, Medium, Low)
- Interfaces—How this technology connects within vehicle network;
- Protocol—Protocol standards used for the technology to communicate within the vehicle network;
- Inputs—Data input into this technology;
- Outputs—Where it sends the information once it is processed.
Phase 2: Identify Threats to the infrastructure that uses this Technology. In this phase of the process, the possible threats against this technology are identified. A threat is an event that has the capability to adversely affect the vehicle network’s operations, assets, vehicles or users by manipulating the network through unauthorized access, destruction, modification of information, and/or denial-of-service (DoS). This can be both intentional or unintentional. The threat source can come from both malicious and accidental exposures of vulnerabilities. This includes hostile actors, accidents from users, or acts of nature. A vulnerability is a weakness that a threat can exploit with a threat source. The template in Figure 3 is developed for this phase. In the table, we have identified several attributes that can be used to develop a threat scenario, which then can be used to determine the level of risk associated with it. These attributes are listed below with descriptions:
- Vulnerability Description—Brief description of what the vulnerability is for this vehicle network technology;
- Threat—The name of the threat or scenario that has been identified;
- Threat Type—The type of threat describes what the threat actually is. This is used to develop a scenario to better assess the level of the threat, intent, and where it is coming from. It can also be used to determine whether a threat is malicious, accidental, or environmental. Some threats can consists of one of the following:
- –
- User—Unsuspecting user of the network (non-malicious);
- –
- Adversary—Threat agent with malicious intent against the network;
- –
- Vehicle—Threat is an irregularity coming from one of the vehicles in the network;
- –
- Environmental—Threat is from environmental effects (e.g., Snow, Fog, Rain, Wind, Sand);
- –
- Equipment—Threat is coming from hardware incorporated in the network;
- Method of Implementation—This describes how the threat will be initiated into the network or how it will exploit vulnerabilities. This information can be used to develop controls later on in the process.
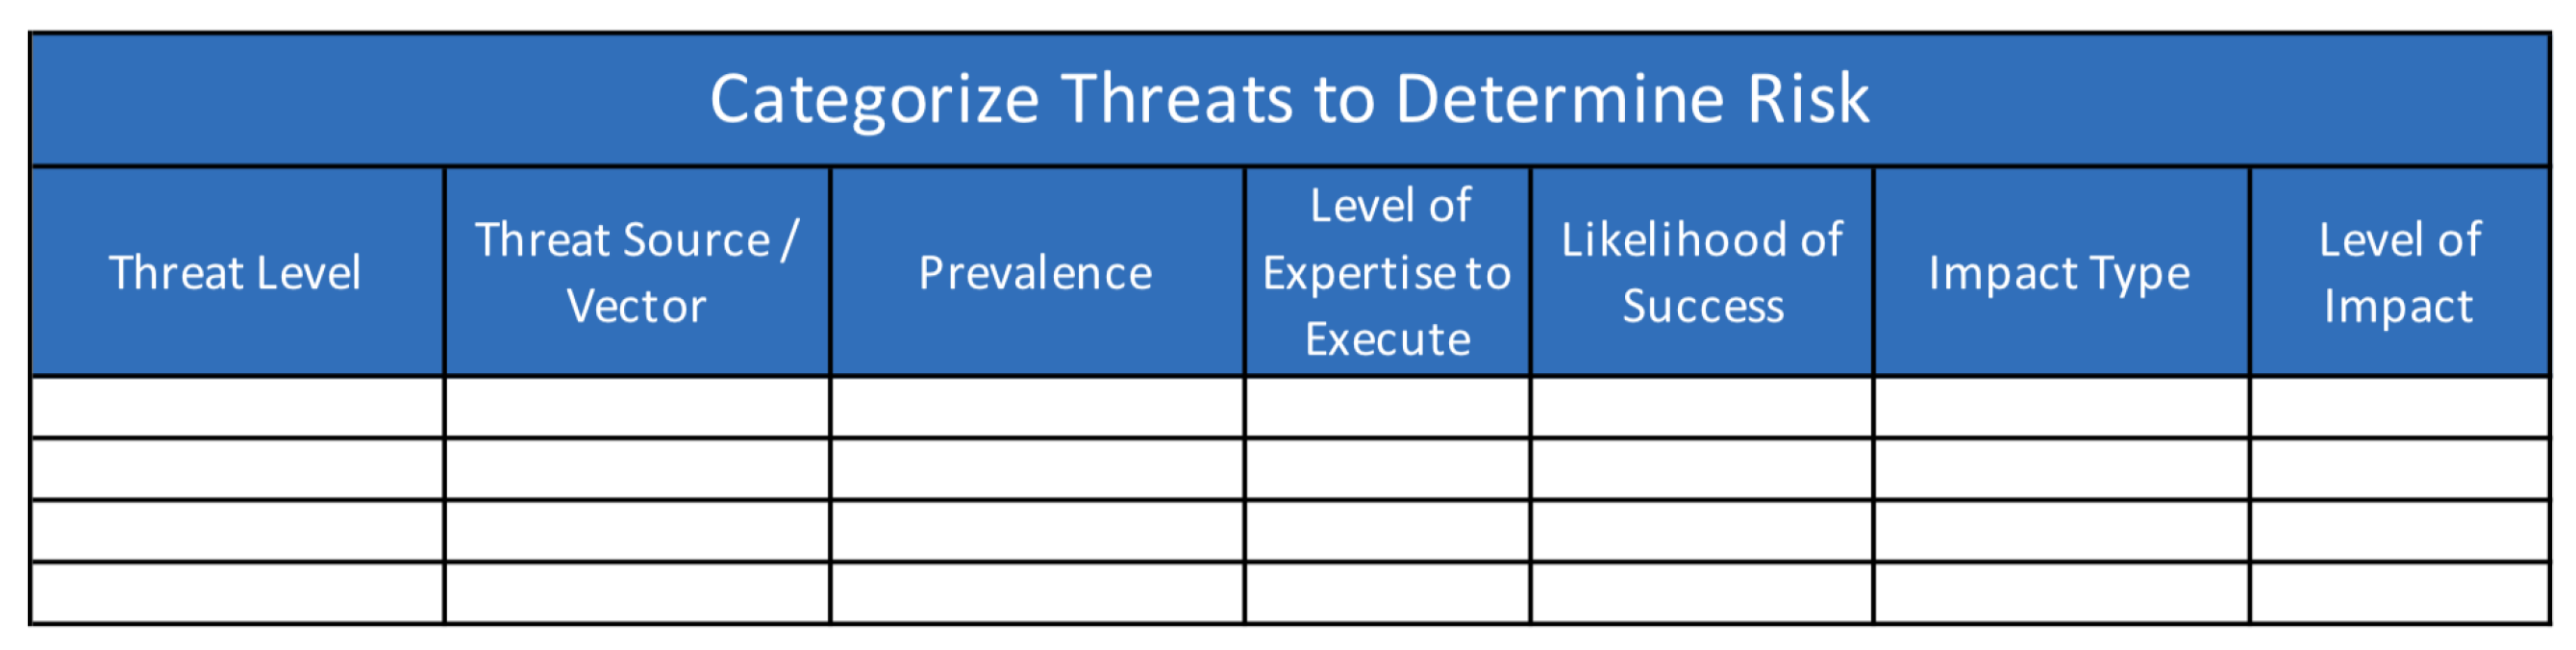
Phase 3: Categorize Threats to Determine Risk. In this phase of the process the threats are categorized into greater detail to help determine the level of risk they can impose against the vehicle network. The template in Figure 4 is developed for this phase. The information that is collected in this phase is used to determine the likelihood of the threat’s initiation and impact. The target of the attack, historical information about the threat, and the amount of resources and expertise required to make a threat scenario possible are taken into consideration. Below, we present the factors that need to be considered in this phase:
- Threat Level—This level describes the scope of the network that can be affected by this type of threat. In a malicious attack this would be the target of the attack. It could also be the amount of the network’s infrastructure that can be affected based on the threat scenario and its capabilities. This information can be used to determine the level of impact from this threat occurring in the network. The description of the level of infrastructure that can be affected by this threat can consists of one of the following:
- –
- Individual Vehicle—Only one vehicle in single location;
- –
- Multiple Vehicles—Capable of affecting more than one vehicle;
- –
- Critical Process—Affects a process that can affect the entire network;
- –
- Critical Infrastructure—Affects a part of the network’s infrastructure.
- Threat Source/Vector—The source/vector describes the size of the entity required to facilitate this threat. This is used to determine the required resources and likelihood of the threat occurring and can be used in control measure development. These can consist of one of the following:
- –
- Individual—Can be performed by one person acting alone;
- –
- Group/Organization—Takes an organized group to execute;
- –
- Nation—Takes the resources of a nation state to implement.
- Prevalence—The prevalence is directly proportional to the likelihood of this threat taking place on the vehicle network. This is based of historical evidence of this particular threat taking place inside a vehicle network;
- –
- Unlikely—Has not been seen in the vehicle network;
- –
- Possible—Has happened before in the network;
- –
- Expected—Happens often in the vehicle network;
- –
- Confirmed—Is happening currently in the network.
- Level of Expertise to Execute—The level of expertise that is required for a perpetrator to execute the attack against the system. The more skill that is required to execute an attack could mean the less prevalent it is and therefore make its occurrence less likely. Levels are categorized as:
- –
- None—This level is for non-adversarial threats, acts of nature, or accidents;
- –
- Novice—Little to no technical knowledge of the attack. Someone that is mimicking a previous attack or following a provided script. This could also include a user that unintentionally introduces the threat to the network;
- –
- Moderate—Attacker with limited skills or resources for attacks; Skilled—Attacker with the necessary experience and skills to execute successful attacks;
- –
- Expert—Attacker with high skills and significant resources at their disposal.
- Likelihood of Success—Based on analysis of the preceding variables and historical information, analysts can estimate the possibility that the attack will have its desired effect on the network. This information is used to determine the initial risk of the threat. The following categories are the success rates for this particular threat once introduced to the network.
- –
- Very Low—0%–4%
- –
- Low—5%–20%
- –
- Medium—21%–79%
- –
- High—80%–95%
- –
- Very High—96%–100%
- Impact Type—The impact type is the affected area of a successful occurrence of this threat. This information can be used to develop control measures. Types of impact can consist of one of the following:
- –
- Operational—The threat will affect how the network runs;
- –
- Assets—The threat will affect components of the network;
- –
- Network—The threat will affect the entire network.
- Level of Impact—This is used to estimate the portion of the vehicle network that will be impacted/affected if this threat is successful. This is used to perform a cost benefit analysis of a control and its effectiveness after it is implemented.
- –
- Small—0%–5%
- –
- Restricted—6%–25%
- –
- Moderate—26%–50%
- –
- Pervasive—51%–85%
- –
- Extreme—86%–100%
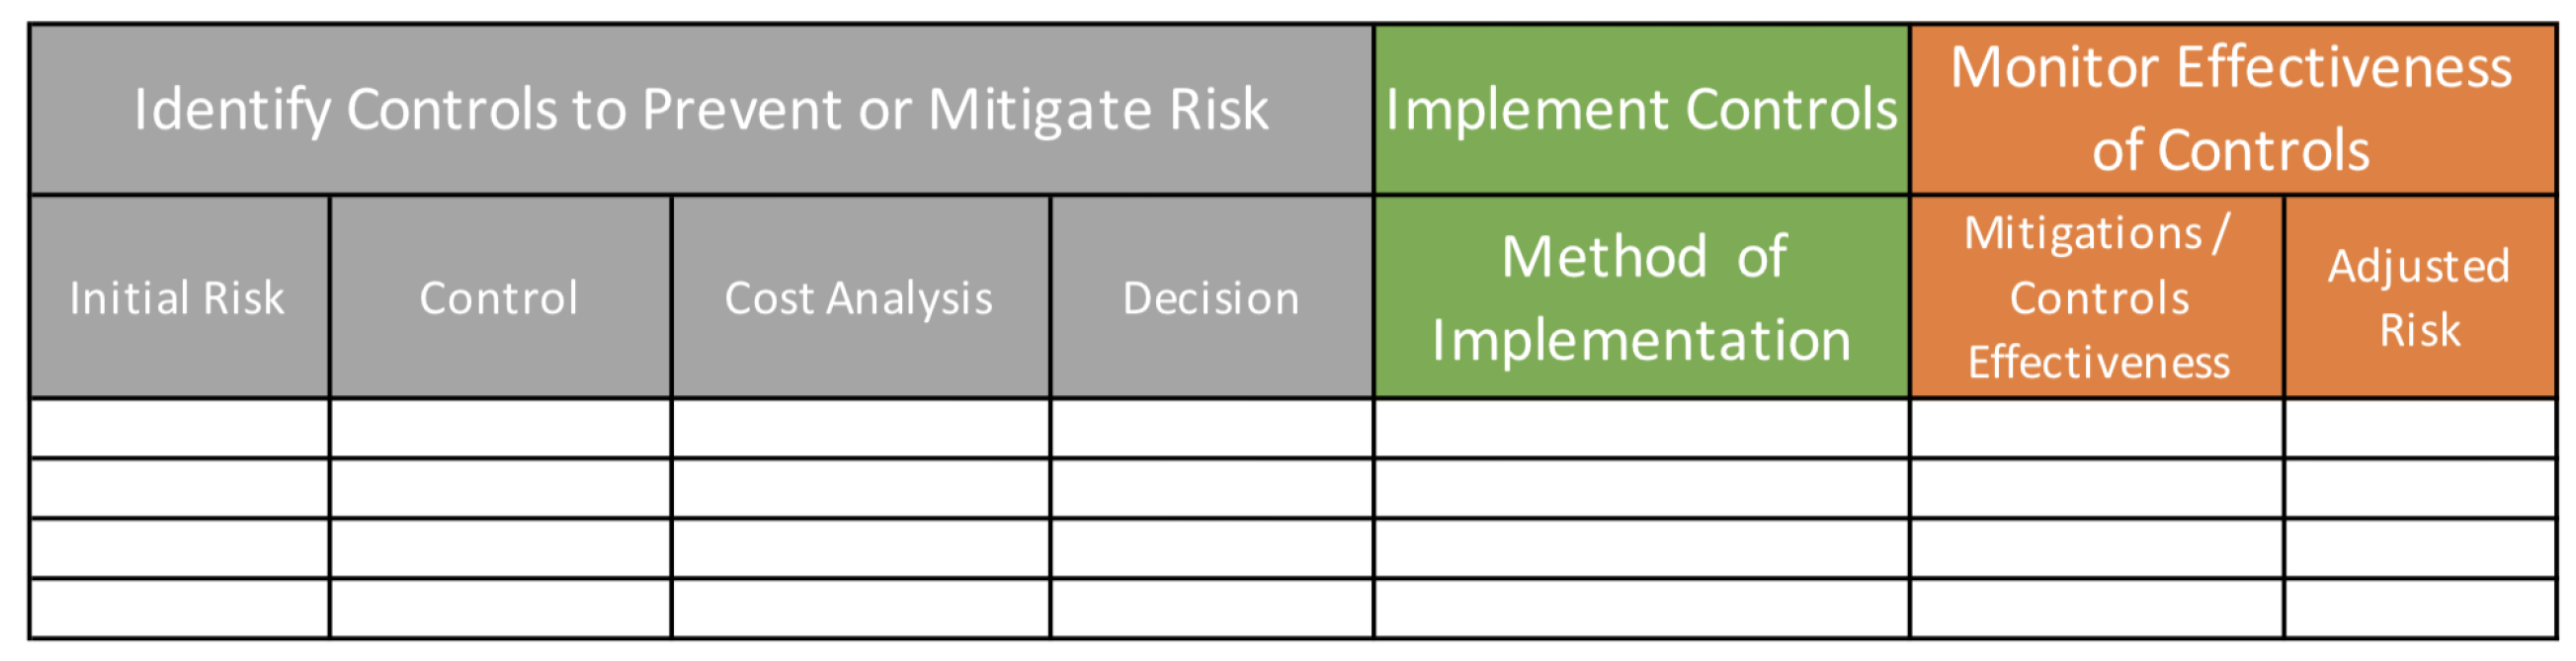
Phase 4: Identify Controls to Prevent or Mitigate Risk.Figure 5 shows templates for Phase 4 to Phase 6. In the table, the part with a grey-colored header is used for Phase 4. During this phase of the process, the initial risk to the vehicular network is determined, and control measures are identified for the threats. This is done so that a cost–benefit analysis can be performed based on the cost of the control measures versus the amount of risk reduction. This can be done for several different control measures so that a decision can be made about the best course of action to mitigate this threat.
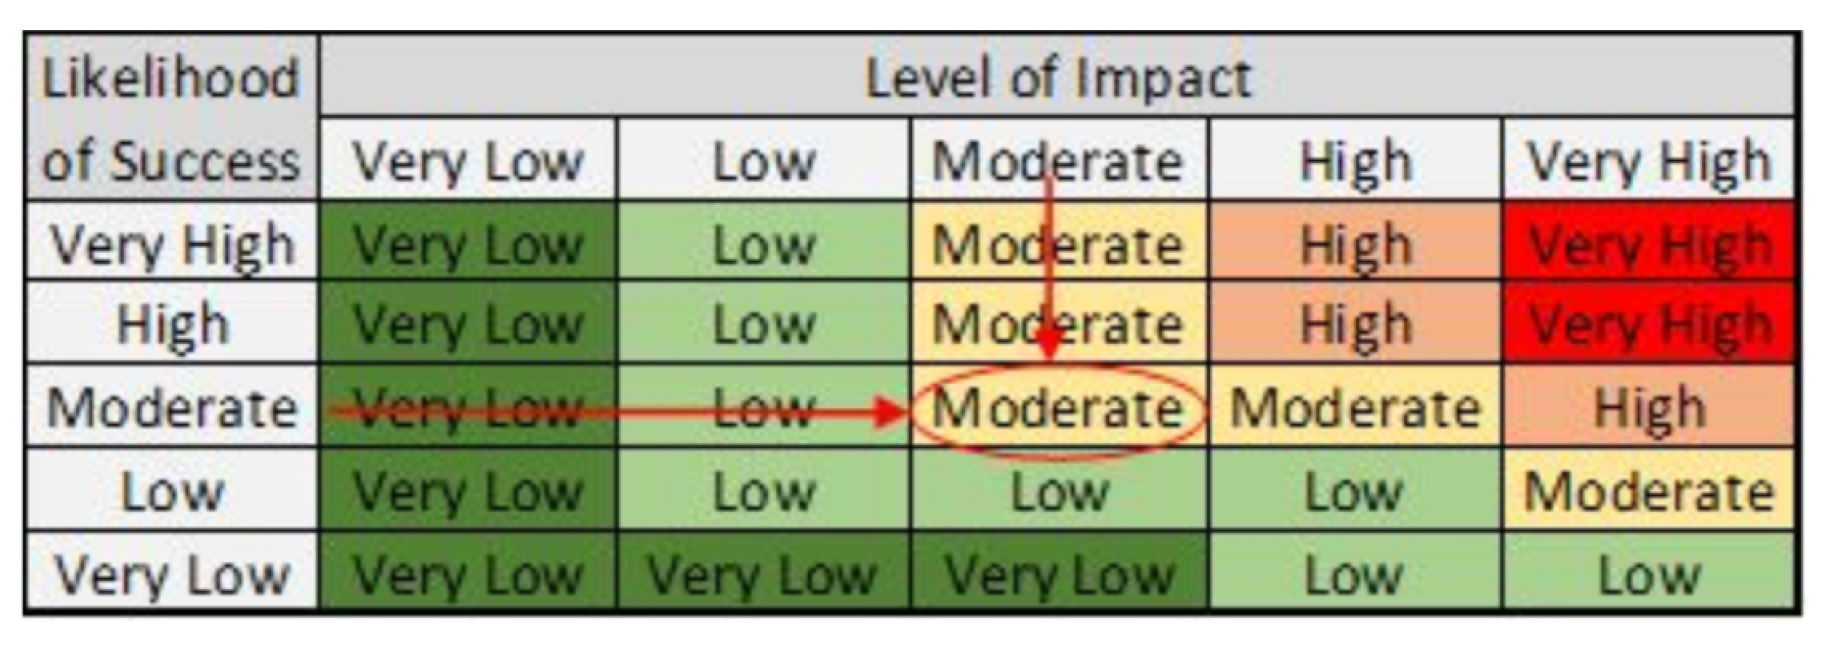
- Initial Risk—The initial risk of this threat occurring in the network. This is based on the proposed Risk Guide shown in Figure 6 that uses the likelihood of success of the threat and the impact it has against the network. For example, in Figure 6, if the impact level of a threat is moderate and the likelihood of success of the threat is moderate, the (initial) risk is considered “Moderate”. If both of them are assessed as “high”, then the risk is determined to be “high”.
- Control—After reviewing all the characteristics of the threat from previous analysis, analysts must now choose a viable control that will mitigate this threat by lowering its prevalence and/or impact to the network. More than one control measure can be identified to counteract this threat.
- Cost Analysis—This cost analysis is used to show the amount of resources it will take to implement this control to mitigate this threat. A cost may also be anything negative resulting if a control is not implemented properly or in a timely fashion. This can include network availability, assets, man hours, and publicity. Once again more than one control measure can be evaluated and this information can be used for a cost benefit analysis to help make a decision about what control(s) to implement. The costs can be described as:
- –
- None—The control is already in existence for other threats;
- –
- Slight—The control can be implemented through existing measures with minimal resources;
- –
- Moderate—The control may cause some inconveniences to the network or require expenditure of excess resources;
- –
- Serious—This control will require portions of the network to be shutdown and upgrade or require the expenditure of significant resources;
- –
- Extreme—This control will cause a network wide upgrade that can cause significant problems with network reliability. It will also require the expenditure of resources that are unavailable.
- Decision—After researching the types of controls to mitigate or prevent the risk and performing the cost analysis, a decision must be made about the best method to handle the risk. This decision should be based on available resources or expertise in dealing with this type of threat. The previous attributes in the process, such as, prevalence, likelihood of success, and impact, should also be taken into consideration when making this decision. The decision about the risk can consist of one the following:
- –
- Prevent—Implement a control that will eliminate the risk;
- –
- Accept—If the risk is to be accepted because it is low or implementing the control will have little to no effect, then analysts can make the decision to not do anything about this threat and accept the risk;
- –
- Mitigate—If the decision is made to accept the cost of implementing this control to lower the risk then it will be mitigated;
- –
- Transfer—If there is a third party that can implement the control measures more efficiently, then the control measure can be outsourced to a third party (e.g., insurance).
Phase 5: Implement Controls. In Figure 5, the table with a green-colored header shows this phase. This phase analyzes details of the process where the chosen control measures are integrated into the vehicular network system to mitigate or prevent the risk. Some control implementations may be simpler than others and will have no functional and performance impact on current operations. Other controls may be more complex and require control implementation milestones that can be used to track the phased implementation of the control so there is minimum impact to the system’s operations during its implementation. This information is useful to analysts because it lets them know how the control implementation will affect the system operations.
- Method of Implementation:
- –
- None—No control will be implemented;
- –
- Immediate—The resources are available to immediately implement the control;
- –
- Phased Implementation—A more deliberate approach will be used to integrate the control.
Phase 6: Monitor Effectiveness of Controls. In Figure 5, the table with an orange-colored header shows this phase. In this phase of the process, analysts monitor the effectiveness of the control against the threat and ensure it does not cause any unforeseen hindrances to the system and that the allocated resources are helping to mitigate the threat’s prevalence and/or impact.
Because threats are constantly evolving to react to control measures, there must be a periodic reassessment of the control’s effectiveness. This is a continual process until the threat is completely eliminated or the control is no longer reliable to counteract the threat. Once this occurs, the threat must be re-evaluated by going through earlier phases of the process.
- Mitigation/Controls Effectiveness:
- –
- None—The control measures had no effect against the threat. If this is the case analysts need to make a decision to either give the control more time, alter it, or replace it altogether by reassessing the threat using earlier phases of the process;
- –
- Semi-Effective—This effectiveness level means that the control did prevent the threat, but not entirely or it hampered the system in some other ways that make it inadequate to mitigate the threat. Analysts should reassess the control to make it more effective or reassess the threat earlier in the process to ensure it was evaluated accurately;
- –
- Mostly-Effective—This level means that the control is making a significant impact against the threat with only minimal effect to the existing system;
- –
- Effective—This level of effectiveness means the control has worked against the threat and it no longer affects the system and the control has little or no effect on the system;
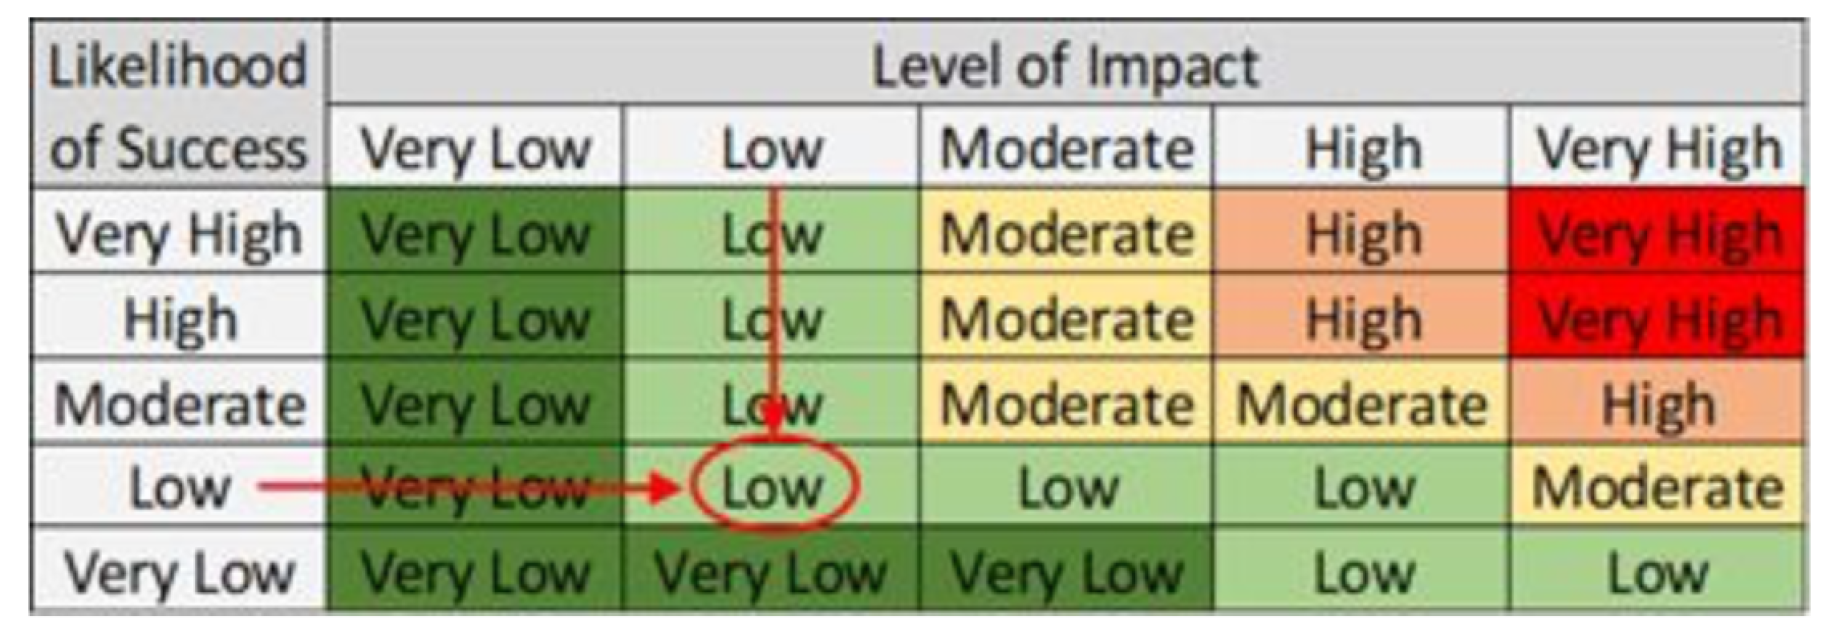
- Adjusted Risk—This is where the adjusted risk of the threat is measured after the control is fully implemented. An assessment of the control’s ability to lower the likelihood of success or level of impact can use the previous phases in the process in order to determine adjusted values. This needs to be done on a recurring basis to ensure that the risk level is accurate and has not changed. The same Risk Guide that was used to determine the initial risk would be used to determine the adjusted risk. Figure 7 demonstrates a lowered adjusted risk that is determined based on the lowered impact and/or likelihood of success.
4.3. Control Implementation Milestones Template
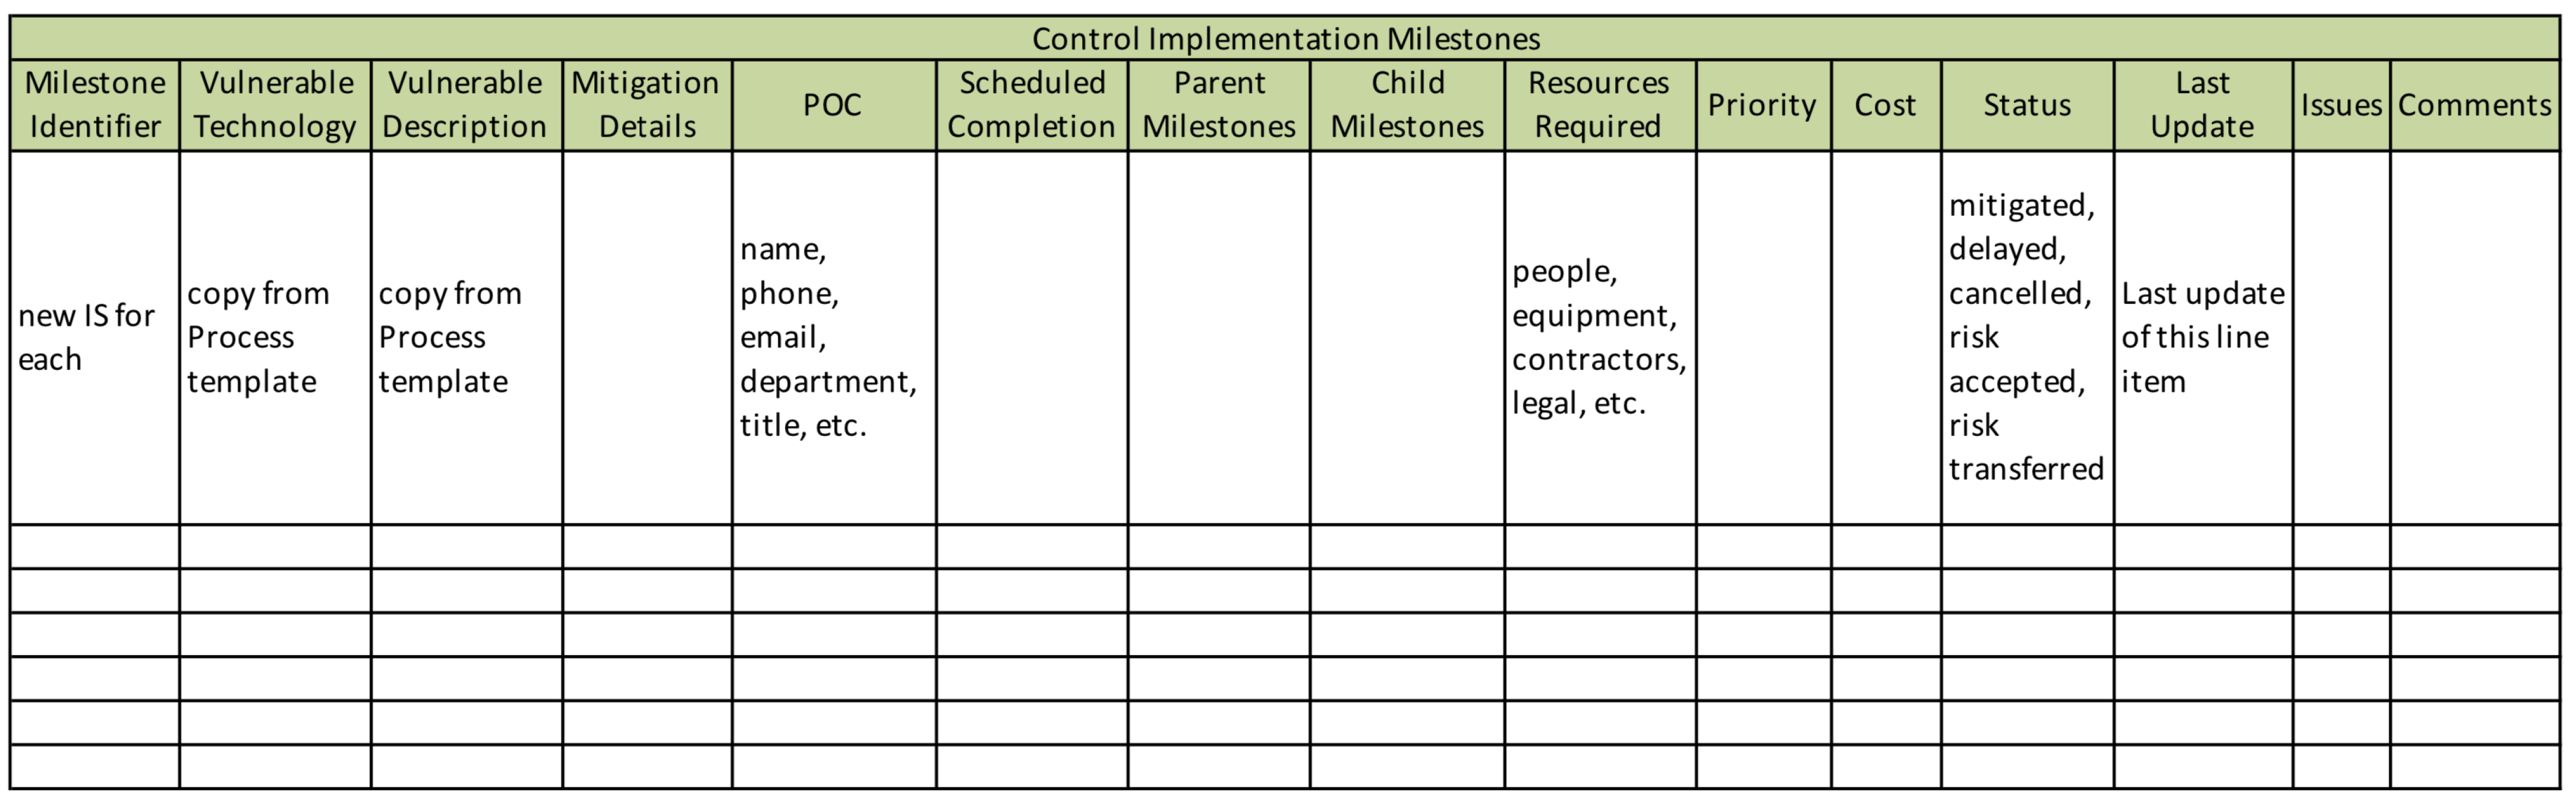
As shown in Figure 8, the Control Implementation Milestones Template has been developed as a mechanism for tracking actions associated with risk mitigation, transferal, or acceptance of vehicular network threats. The template includes several suggested fields including: status, cost, priority, points of contact, issues, and comments. These fields can be adjusted, as needed, to fit an organization’s needs. The document will contain each item identified as a threat or vulnerability in the Process and is meant to be updated each time an update to one of the fields is encountered. It is recommended that the document be reviewed in regularly scheduled meetings with the proper technical, managerial, and legal points of contact to identify any missing information when dealing with risk determination.
This template is beneficial to the successful implementation of the control as it helps to maintain the focus of the task. Since budget constraints and deadlines are potential risk factors to the successful completion of the risk mitigation, this template aims to lower such unnecessary risks. Furthermore, when it comes to mitigating risks in vehicular networks, particularly in existing infrastructure, it is fair to assume that both cost and effort will be great. Therefore, the goal of developing this template is to reduce both by having a structured template to record and plan the milestones of each identified threat item. Lastly, since vehicular network vulnerabilities could potentially cause harm to the public, these templates may need to be kept confidential once populated with vulnerability data that are not publicly known. If an organization decides to do so, it is possible to have a redacted version to use in meetings with personnel not intimately involved in the mitigation, in addition to having a detailed confidential version to only be available to those involved in implementing the mitigation. This will ensure that only those with the proper need-to-know privilege will have access to the vulnerability details with the anticipation that mitigation or mitigation plans will be in place before exploit proofs of concept are made public.
5. Use Case and Discussion
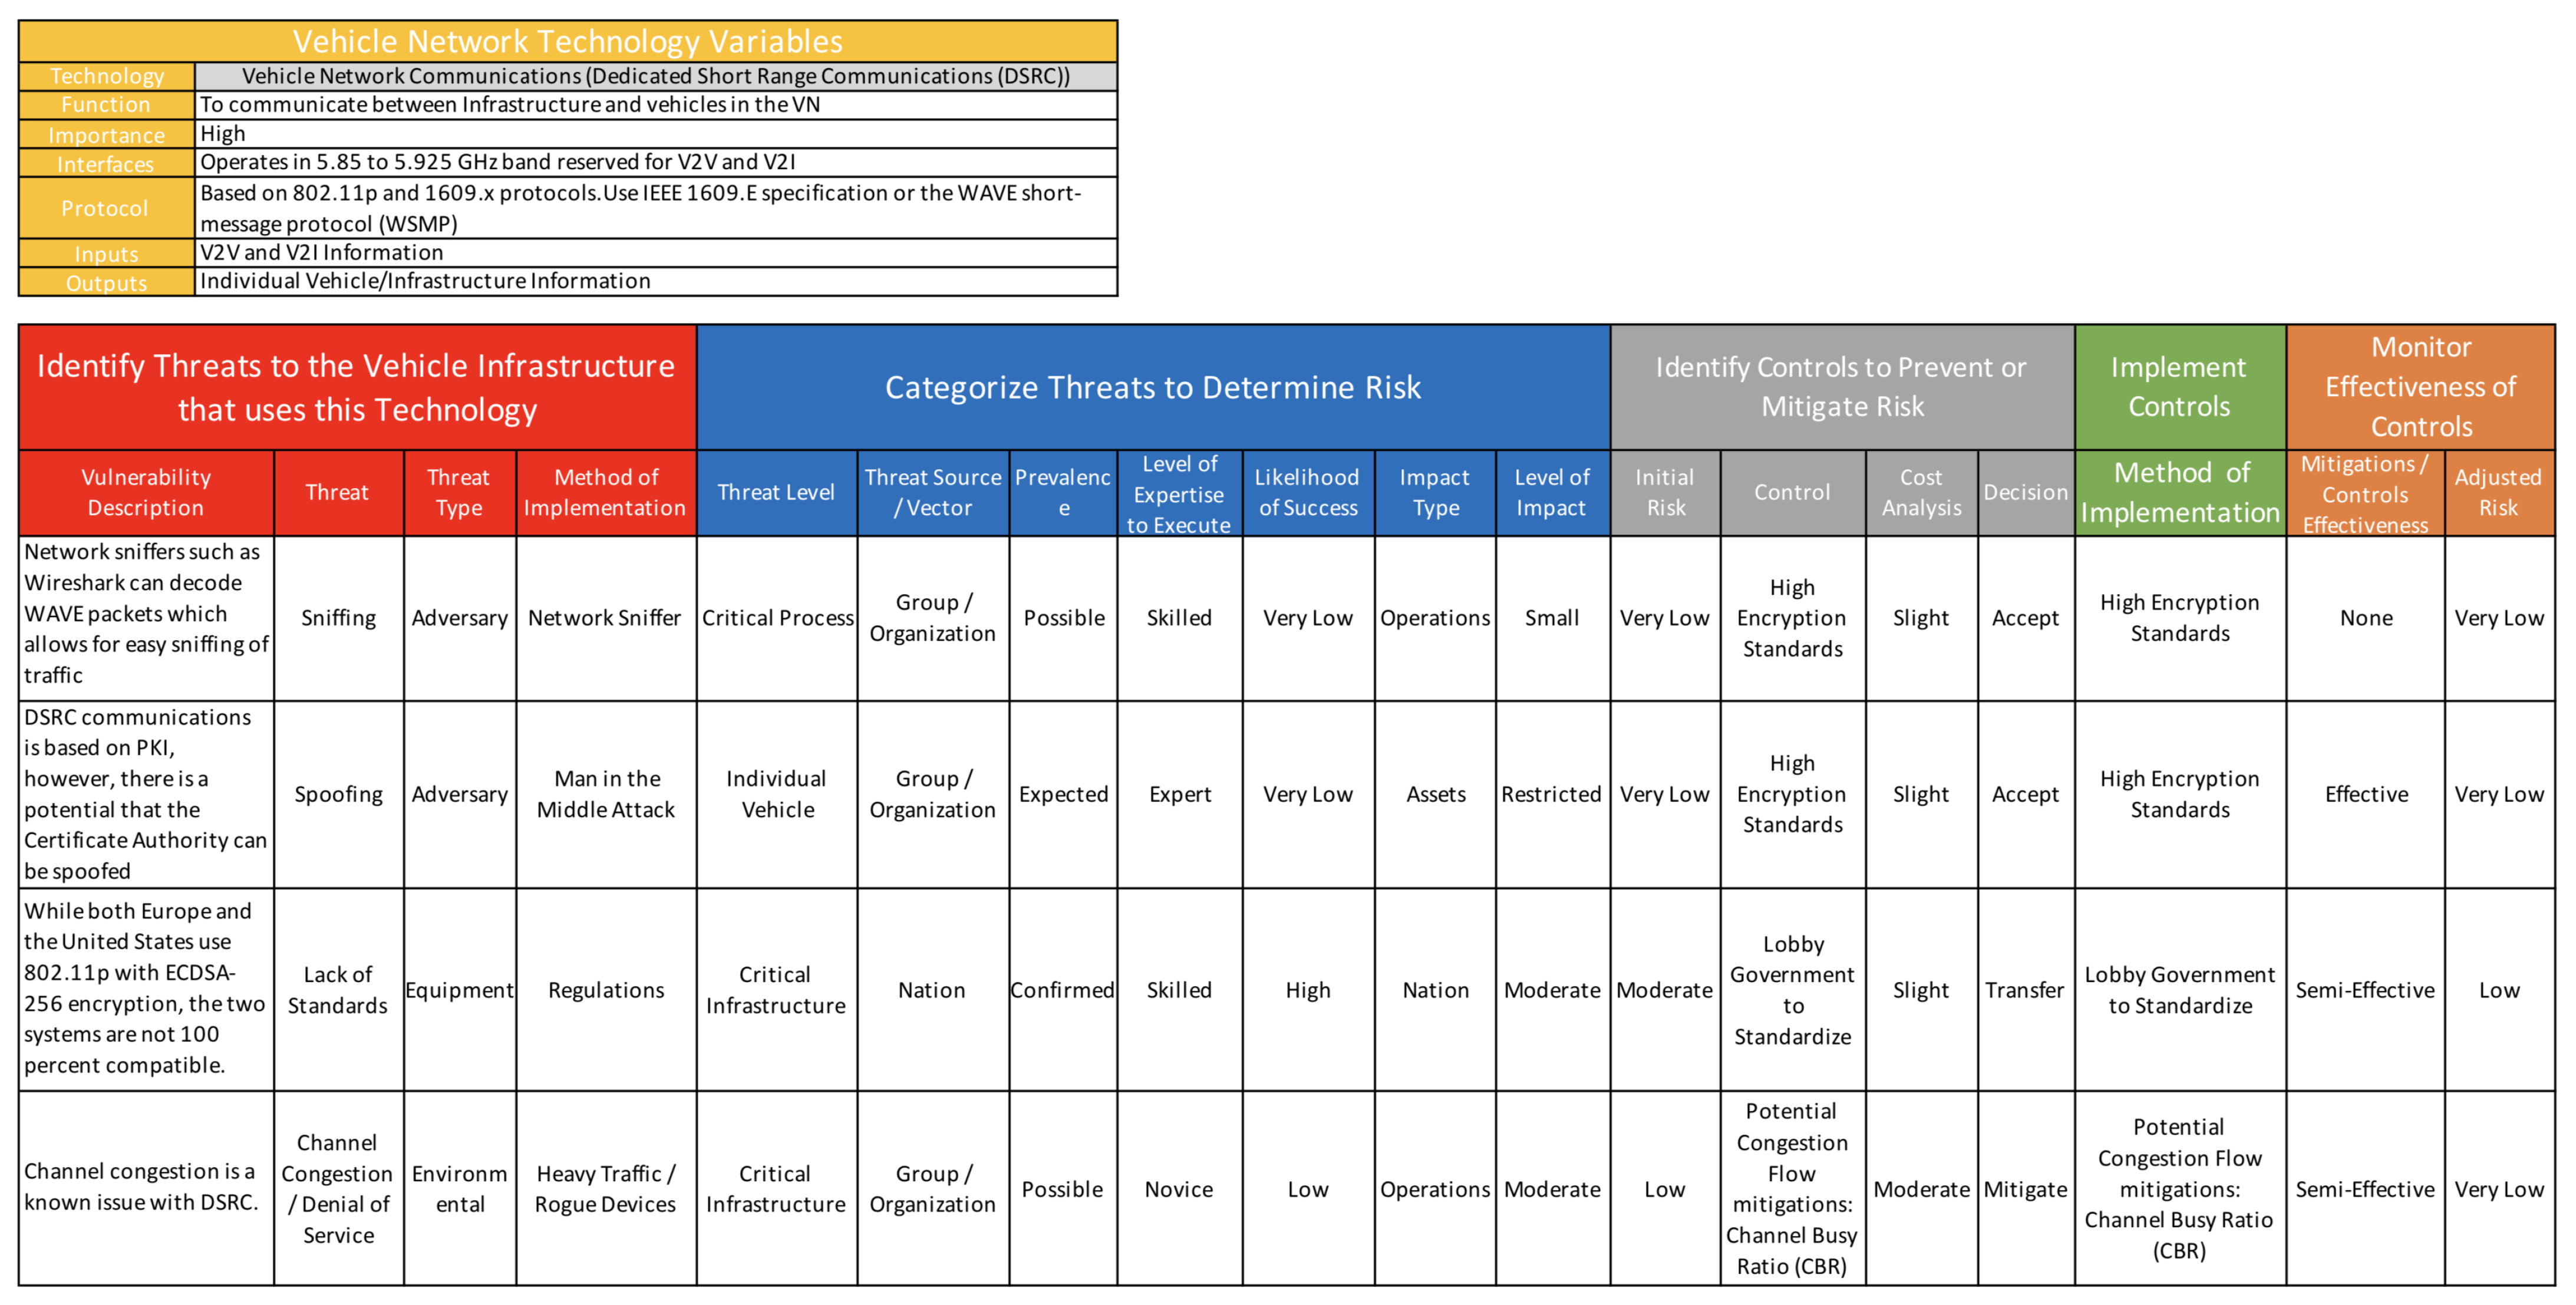
In this section, we use the table templates shown above and consider a sample vehicular technology to demonstrate how the proposed risk model can used to assess risks in a vehicular network system. Figure 9 presents these six phase processes in tabular forms where each process is shown in a different color. In Figure 9, the first table (a yellow-colored header) shows one of the technologies identified in Phase 1, while the second table shows Phase 2 through Phase 6 processes and includes the assessment results of several sample vulnerabilities identified for the technology listed in the first table. For example, a sample technology “DSRC” is identified in the first table as part of the Phase 1 process. Then in Phase 2 (shown with a red-colored header), four sample vulnerabilities of the listed technology (in this case, DSRC) are identified. Those vulnerabilities are shown in the column ‘Vulnerability Description’. For each of these vulnerabilities, risk assessments are performed for the rest of the phases. More assessment details about this sample technology are discussed below. In addition, additional assessments for other sample technologies are provided in Appendix A.
5.1. Phase 1
In Figure 9, the table with a yellow-colored header is for Phase 1. In the table, the selected sample technology is “DSRC”. For this technology, several attributes are assessed. For example, the main function of this technology is “To communicate between Infrastructure and vehicles in the VN”, its importance is assessed as “high”, and so forth. This phase allows users to identify the technology’s purpose, importance, and the interactive components of the network.
5.2. Phase 2
For the sample technology in Figure 9, the table with a red-colored header shows Phase 2. In this case, four vulnerabilities are identified and they are: (1) Network sniffers such as Wireshark can decode WAVE packets which allows for easy sniffing of traffic; (2) DSRC communications is based on PKI; however, there is a potential that the Certificate Authority can be spoofed; (3) While both Europe and the United States use 802.11p with ECDSA-256 encryption, the two systems are not 100 percent compatible; and (4) Channel congestion is a known issue with DSRC. For each of these vulnerabilities, the major threat, type of threat and how the threat will exploit the vulnerability are analyzed in the table. For example, for the vulnerability “Network sniffers such as Wireshark can decode WAVE packets which allows for easy sniffing of traffic”, the threat is “sniffing”, threat type is “adversary” and it can be exploited using a “network sniffer”. This phase allows users to identify the threat type, attack surfaces, and vectors used to affect the network. This is normally the initial phase for identifying possible threats to the network based on this particular technology.
5.3. Phase 3
In Figure 9, Phase 3 is shown in the table with a blue-colored header. Here, several threat aspects are assessed to determine the risk of the threat. For example, the threat level of the “sniffing” is categorized as a “critical process” and the likelihood of the success of “sniffing” is identified as being “very low”. This phase allows users to categorize the threat’s possible impacts on the network. This will assist users in determining the likelihood that certain threats will be a factor for their network and help them prioritize mitigation.
5.4. Phase 4
In Figure 9, Phase 4 is shown in the table with a grey-colored header. Here, the threats are categorized to determine the initial risk level of the threat. For example, for the identified threat, “Channel Congestion/Denial of Service”, the likelihood of success is low and the impact level is moderate, hence the initial risk is considered “low”. For the same threat, “Potential Congestion Flow mitigation: Channel Busy Ratio (CBR)” is identified as a control measure. The threat level for the “sniffing” threat is initially categorized as a “very low” risk. This phase allows users to determine if the cost/benefit of controls is necessary for each particular threat to the network. This will assist users in allocating resources where they can make the greatest impact.
5.5. Phase 5
In Figure 9, Phase 5 is shown in the table with a green-colored header. Here, the particular control is identified that will be used to mitigate a threat. For example, the control that was chosen to mitigate the threat of “sniffing” was “High Encryption”. This phase allows users to identify all the controls that will be used to mitigate threats. This will assist users in determining which controls are going to be implemented and may be beneficial for other threats. It will also allow users to determine all the controls that are being used and which are more prevalent so they can be prioritized later for resourcing.
5.6. Phase 6
In Figure 9, this phase is shown in the table with an orange-colored header. Here, the particular control is assessed for effectiveness to determine if it changes the risk level. For example, by using “High Encryption” to mitigate the effects of a “sniffing” threat, it was determined that the effectiveness would be “None”. This phase allows users to assess whether the control had a significant impact against the threat. This will additionally assist users in determining if the chosen controls are going to make a significant impact against a particular threat which will assist in determining if a particular control is beneficial enough to be implemented.
6. Conclusions and Future Work
In this paper, we developed a risk management model for a vehicular network system. The proposed risk management process is developed based on an aviation risk model. We believe the proposed risk model provides a comprehensive foundation that can be enhanced or modified for real world implementation as necessary. The proposed model includes a risk control decision. Multi-attribute utility theory combines models that can be applied to making decisions based on multiple variables and under uncertain conditions [30]. Future researchers may look into applying multi-attribute utility theory to make the risk control decision. This paper includes risk management process examples using data from the current literature. Manufacturers and government agencies that collect data about new technologies may apply the method and process proposed in this paper.
Author Contributions
Supervision, J.P.; Writing—original draft, J.E., O.N., J.O., S.R. and J.P.; Writing—review & editing, J.P. and M.G. All authors have read and agreed to the published version of the manuscript.
Funding
This research received no external funding.
Institutional Review Board Statement
Not applicable.
Informed Consent Statement
Not applicable.
Conflicts of Interest
The authors declare no conflict of interest.
Appendix A
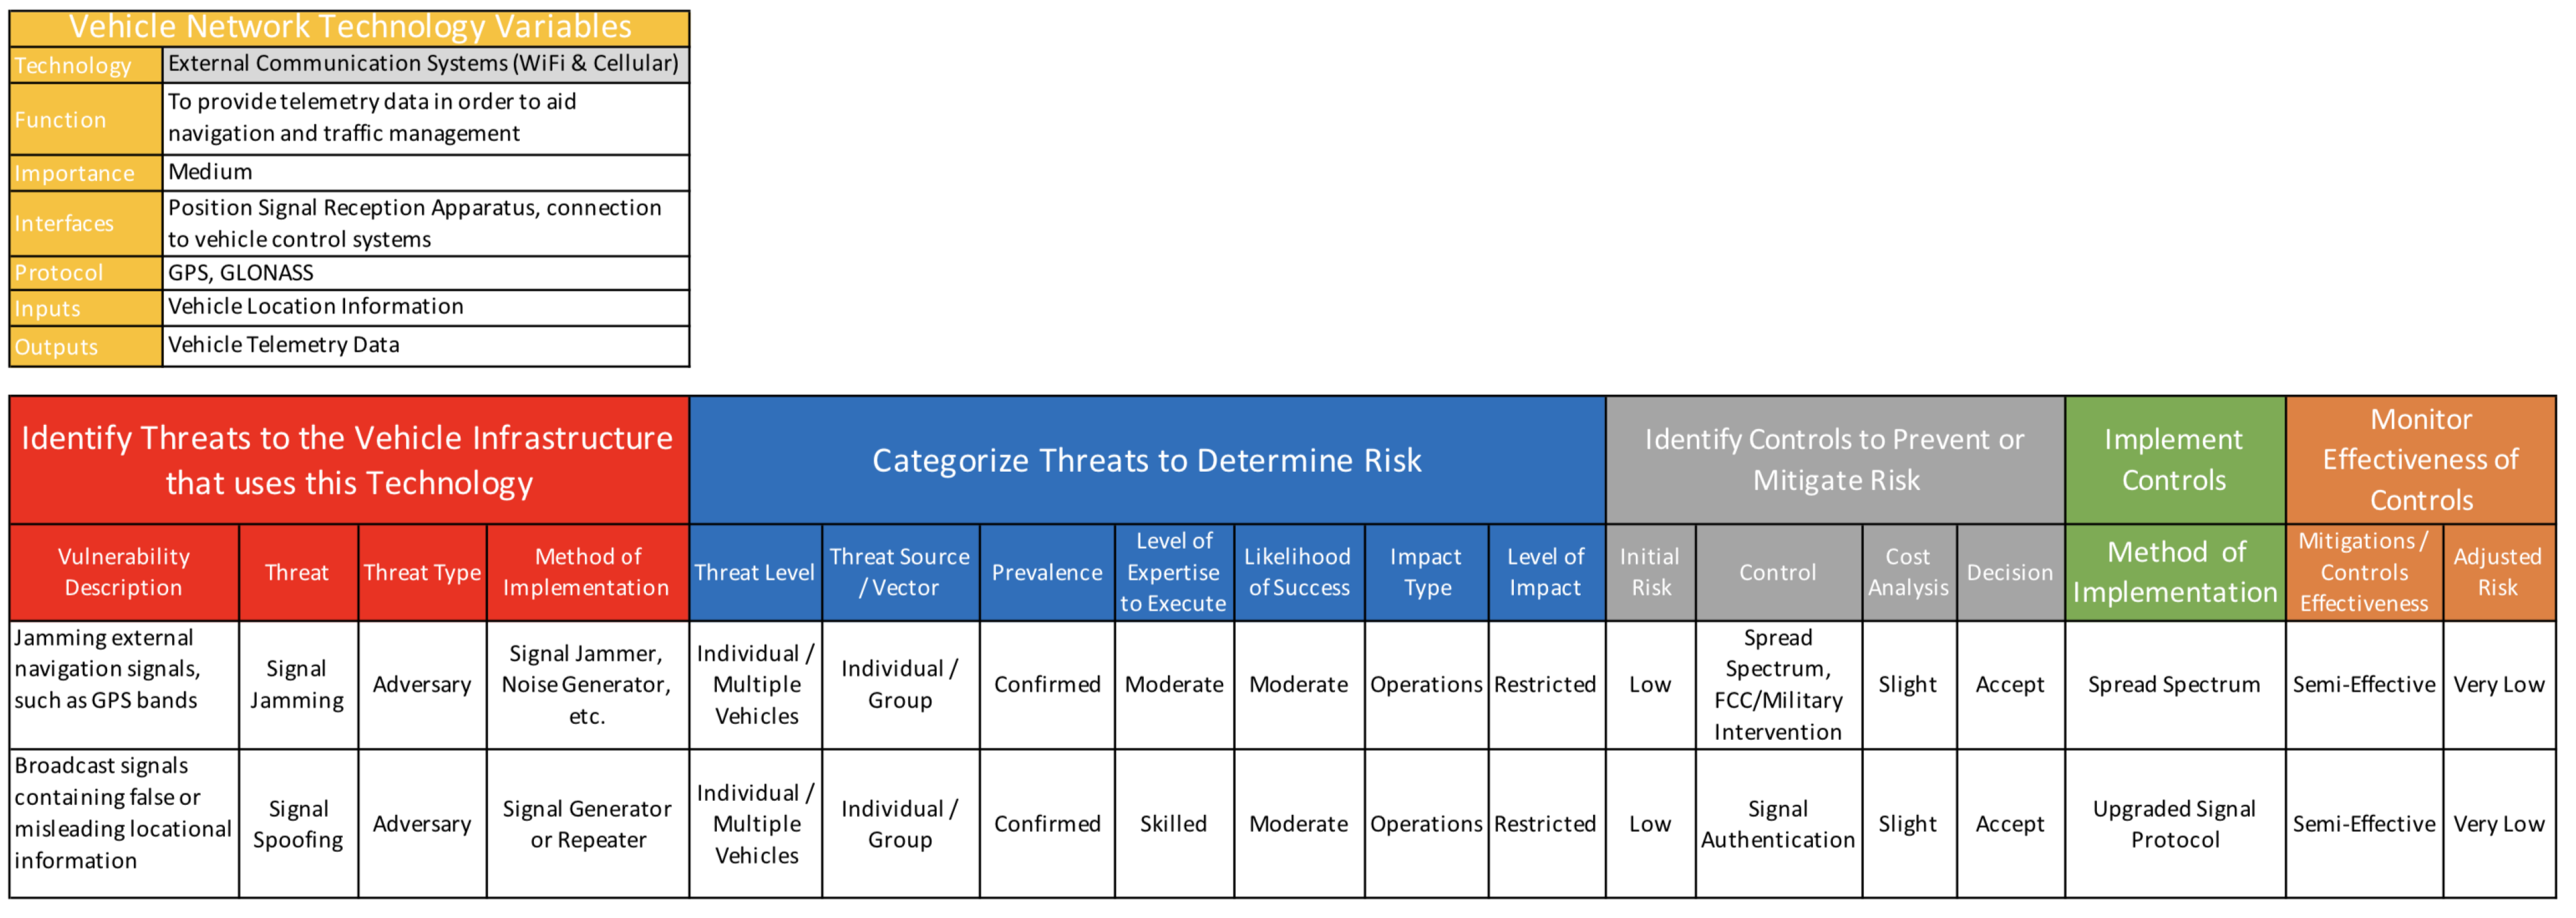
In this paper, we discussed our proposed risk model for vehicular network system based on hypothetical threats for a sample vehicular network technology. It shows how the process can be used to determine risk and identify possible controls for potential Vehicle Network technologies. In this Appendix, we include additional risk assessment results for three other technologies that can be found in vehicular network system using the proposed vehicular Network risk model. They are:
Figure A1.
Vehicular Network Risk Management Process Example for External Communication Systems (WiFi & Cellular).
Figure A1.
Vehicular Network Risk Management Process Example for External Communication Systems (WiFi & Cellular).

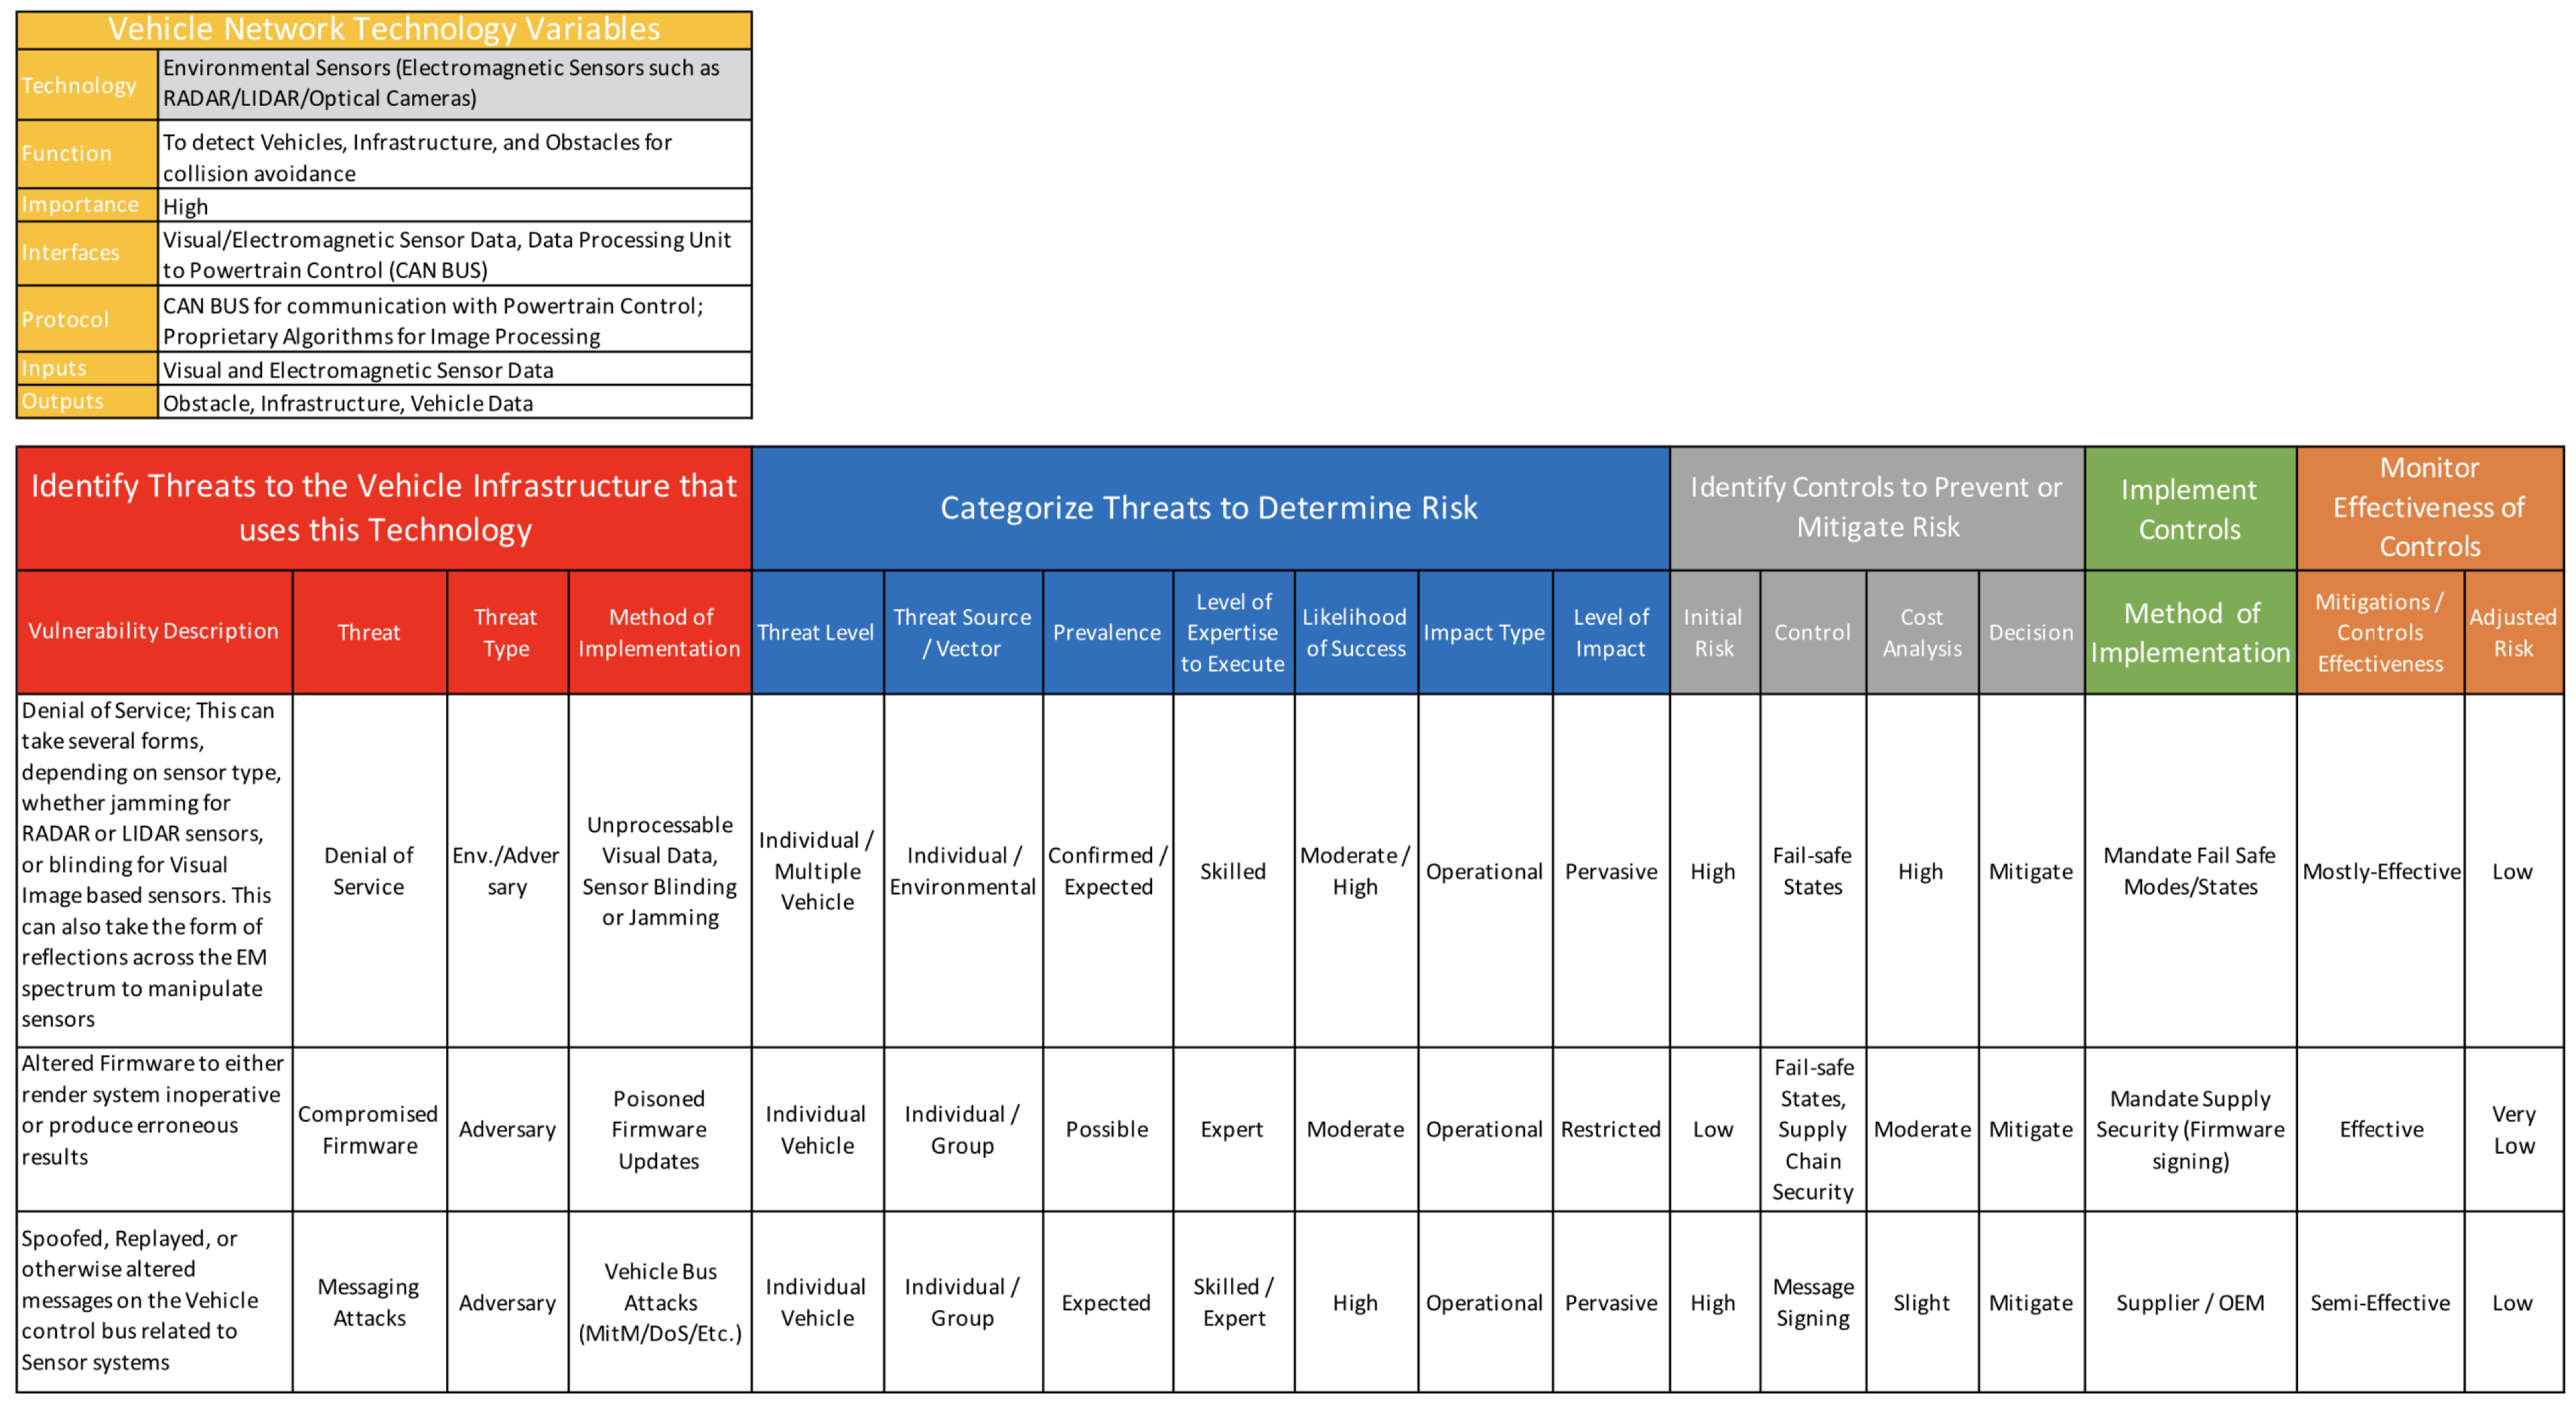
Figure A2.
Vehicular Network Risk Management Process Example for Environmental Sensors (Electromagnetic Sensors such as RADAR/LIDAR/Optical Cameras).
Figure A2.
Vehicular Network Risk Management Process Example for Environmental Sensors (Electromagnetic Sensors such as RADAR/LIDAR/Optical Cameras).

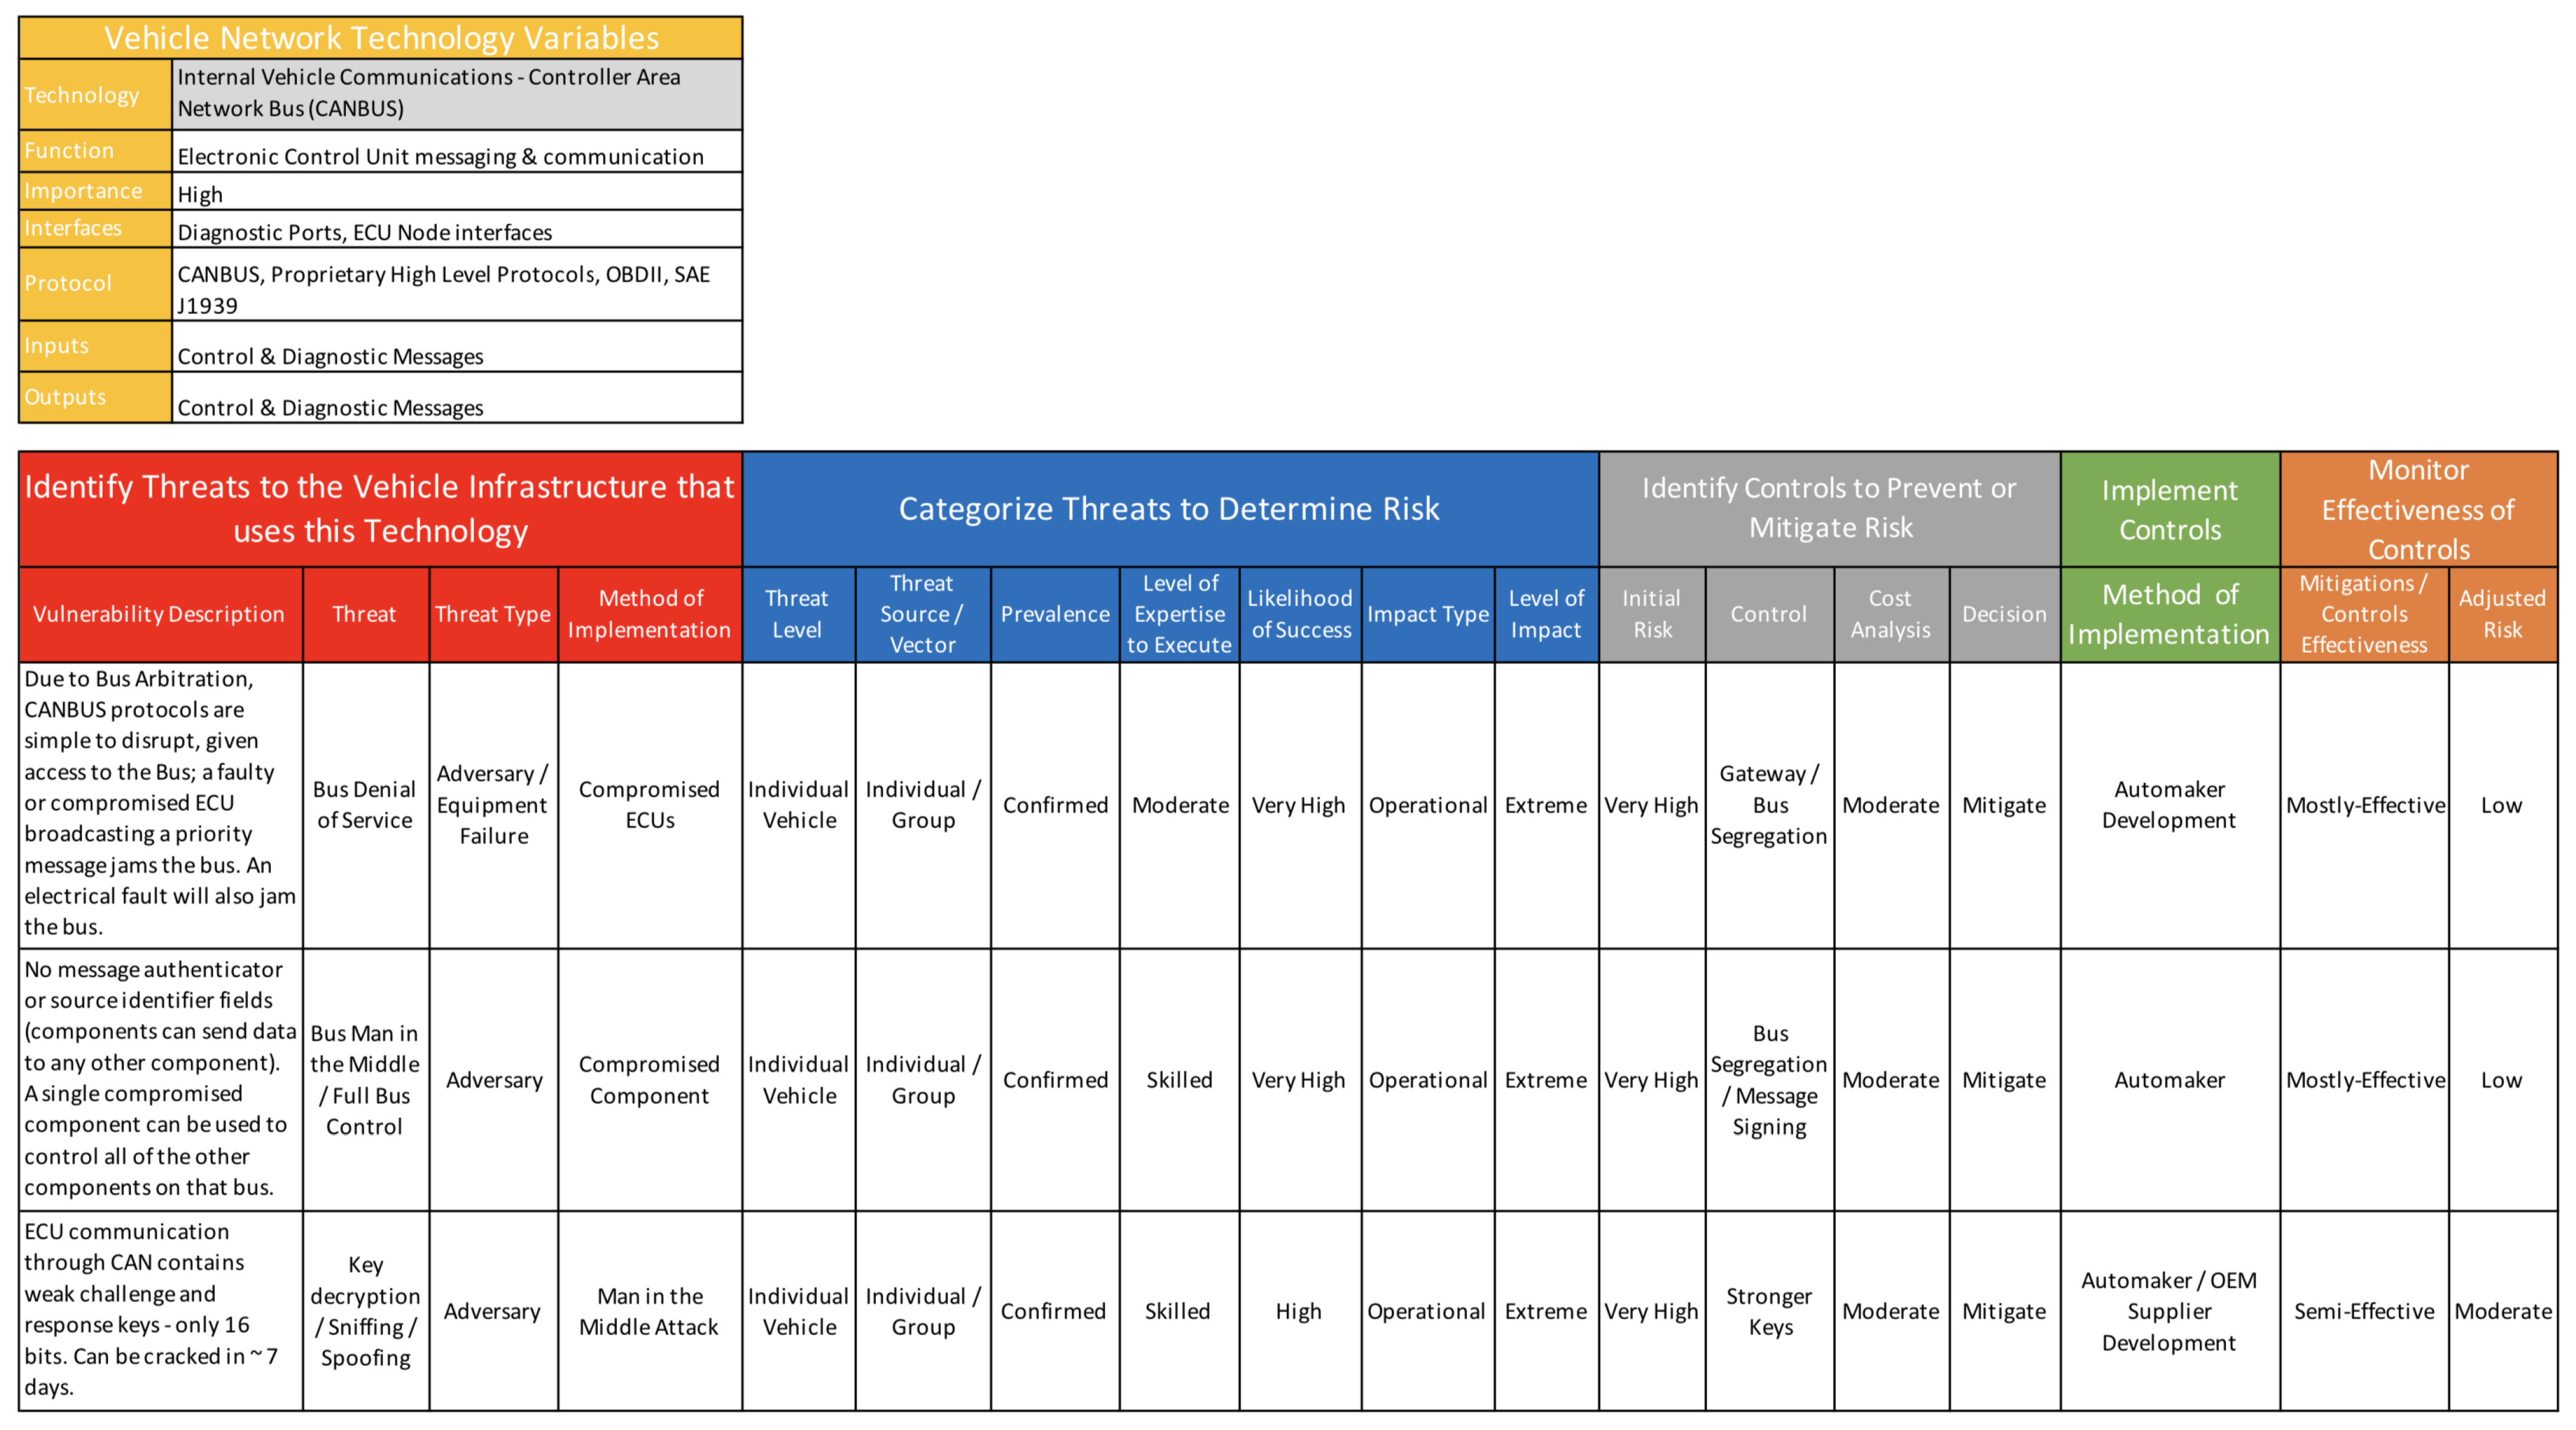
Figure A3.
Vehicular Network Risk Management Process Example for Internal Vehicle Communications—Controller Area Network Bus (CANBUS).
Figure A3.
Vehicular Network Risk Management Process Example for Internal Vehicle Communications—Controller Area Network Bus (CANBUS).

References
- Boyes, H.A.; Luck, A.E.A. A Security-Minded Approach to Vehicle Automation, Road Infrastructure Technology, and Connectivity. In Proceedings of the 10th IET System Safety and Cyber-Security Conference 2015, Bristol, UK, 21–22 October 2015. [Google Scholar]
- Miller, C.; Valasek, C. Remote Exploitation of an Unaltered Passenger Vehicle. In Proceedings of the Black Hat USA 2015, Las Vegas, NV, USA, 1–6 August 2015. [Google Scholar]
- Ward, D.; Wooderson, P. Automotive cyber-security integrity levels. In Proceedings of the 11th International Conference on System Safety and Cyber-Security, London, UK, 11–13 October 2016. [Google Scholar]
- Rockl, M.; Strang, T.; Kranz, M. Demonstrator: V2V Communications in Automotive Multi-Sensor Multi-Target Tracking. In Proceedings of the 2008 IEEE 68th Vehicular Technology Conference, Calgary, AB, Canada, 21–24 September 2008. [Google Scholar]
- Obst, M.; Hobert, L.; Reisdorf, P. Multi-sensor data fusion for checking plausibility of V2V communications by vision-based multiple-object tracking. In Proceedings of the IEEE Vehicular Networking Conference (VNC), Paderborn, Germany, 3–5 December 2014. [Google Scholar]
- Stanganelli, J. Which Threat Risk Model Is Right for Your Organization? September 2016. Available online: https://www.esecurityplanet.com/network-security/which-threat-risk-model-is-right-for-your-organization.html (accessed on 11 September 2021).
- National Institute of Standards and Technology. Special Publication 800-30, Revision 1, Guide for Conducting Risk Assessments; NIST: Gaithersburg, MD, USA, 2012.
- Smith, C. The Car Hacker’s Handbook: A Guide for the Penetration Tester; No Starch Press: San Francisco, CA, USA, 2016. [Google Scholar]
- Sharma, P.; Liu, H.; Wang, H.; Zhang, S. Securing wireless communications of connected vehicles with artificial intelligence. In Proceedings of the 2017 IEEE International Symposium on Technologies for Homeland Security (HST), Waltham, MA, USA, 25–26 April 2017. [Google Scholar]
- Heineke, K.; Kampshoff, P.; Mkrtchyan, A.; Shao, E. Self-Driving Car Technology: When Will the Robots Hit the Road? 2017. Available online: https://www.mckinsey.com/industries/automotive-and-assembly/our-insights/self-driving-car-technology-when-will-the-robots-hit-the-road (accessed on 11 September 2021).
- Stewart, J. Don’t Freak Over Boeing’s Self-Flying Plane-Robots Already Run the Skies. Wired, June 2017. Available online: https://www.wired.com/story/boeing-autonomous-plane-autopilot/ (accessed on 11 September 2021).
- Federal Aviation Administration, Equip ADS-B. April 2018. Available online: https://www.faa.gov/nextgen/equipadsb/ (accessed on 11 September 2021).
- Federal Aviation Administration, ADS-B. January 2018. Available online: https://www.faa.gov/nextgen/programs/adsb/faq/#g1 (accessed on 11 September 2021).
- Federal Aviation Administration, Flight Risk Assessment Tool. 2008. Available online: https://www.faa.gov/news/safety_briefing/2015/media/SE_Topic_15-08.pdf (accessed on 11 September 2021).
- Federal Aviation Administration, Risk Management Handbook. FAA-H-8083-3; 2009. Available online: https://www.faa.gov/regulations_policies/handbooks_manuals/aviation/media/faa-h-8083-2.pdf (accessed on 11 September 2021).
- International Organization for Standardization. ISO 26262: Road Vehicles: Functional Safety; ISO: Geneva, Switzerland, 2012. [Google Scholar]
- International Organization for Standardization. ISO/IEC 15408-1: Informational Technology: Security Techniques: Evaluation Criteria for IT Security; ISO: Geneva, Switzerland, 2009. [Google Scholar]
- International Organization for Standardization. ISO/IEC 27001: Information Technology: Security Techniques: Information Security Management Systems: Requirements; ISO: Geneva, Switzerland, 2013. [Google Scholar]
- NHTSA. Vehicle-to-Vehicle Communication. April 2018. Available online: https://www.nhtsa.gov/technology-innovation/vehicle-vehicle-communication (accessed on 11 September 2021).
- SAE International. Surface Vehicle Recommended Practice: Cybersecurity Guidebook for Cyber-Physical Vehicle Systems; SAE International: Warrendale, PA, USA, 2016. [Google Scholar]
- National Institute of Standards and Technology. Special Publication 800-39, Managing Information Security Risk; NIST: Gaithersburg, MD, USA, 2011.
- National Institute of Standards and Technology. Special Publication 800-53, Security and Privacy Controls for Federal Information Systems and Organizations; NIST: Gaithersburg, MD, USA, 2017.
- National Institute of Standards and Technology. Special Publication 800-82, Guide to Industrial Control Systems (ICS) Security; NIST: Gaithersburg, MD, USA, 2015.
- National Highway Traffic Safety Administration. DOT HS 812 115, Critical Reasons for Crashes Investigated in the National Motor Vehicle Crash Causation Survey; NHTSA: Washington, DC, USA, 2015.
- NIST. Special Publication 800-37, Risk Management Framework for Information Systems and Organizations, REV 2; NIST: Gaithersburg, MD, USA, 2018.
- DODD. DODi 8510.01: Risk Management Framework (RMF) for DoD Information Technology (IT), Change 3; DODD: Washington, DC, USA, 2014.
- NASA/SP-2011-3422. NASA Risk Management Handbook, Version 1; NASA Headquarters: Washington, DC, USA, 2011.
- Department of Defense Risk. Issue, and Opportunity Management Guide for Defense Acquisition Programs; Office of the Deputy Assistant Secretary of Defense for Systems Engineering: Washington, DC, USA, 2017. [Google Scholar]
- International Organization for Standardization. ISO 31000: Risk Management—Guidelines; ISO: Geneva, Switzerland, 2018. [Google Scholar]
- Von Winterfeldt, D.; Fischer, G.W. Multi-attribute utility theory: Models and assessment procedures. In Utility, Probability, and Human Decision Making; PsycEXTRA Dataset; Springer: Dordrecht, The Netherlands, 1975. [Google Scholar]
Figure 1.
Vehicular Network Risk Model.

Figure 2.
Phase 1 Template: Vehicle Network Technology Variables.

Figure 3.
Phase 2 Template: Identify Threats to the infrastructure that uses this Technology.
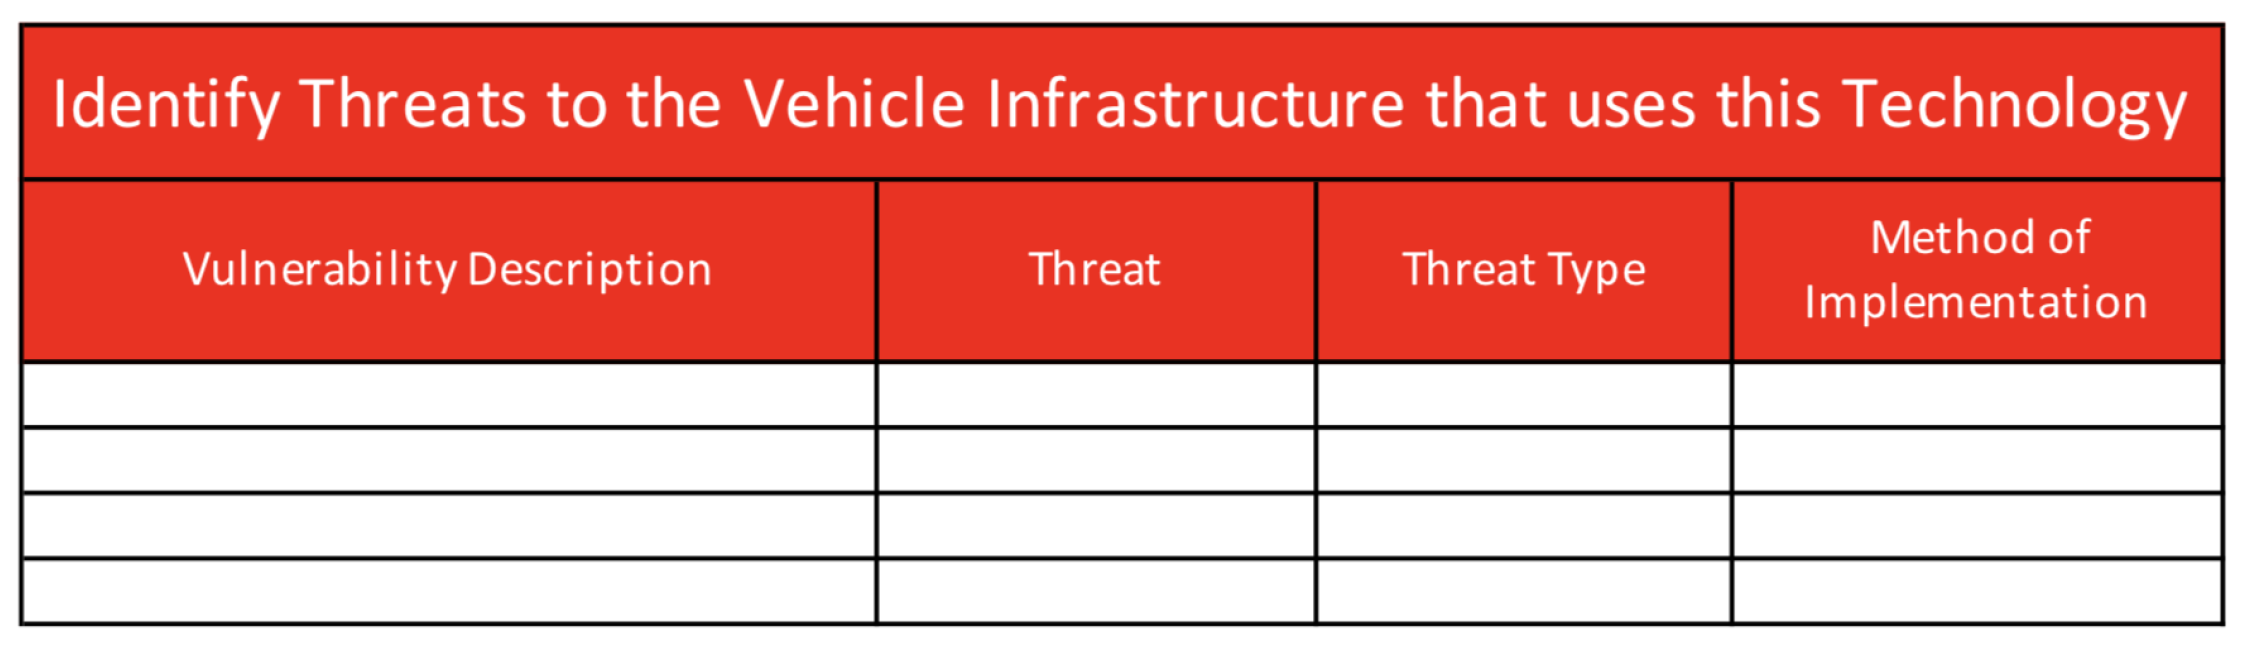
Figure 4.
Phase 3 Template: Categorize Threats to Determine Risk.

Figure 5.
Phase 4 to 6 Templates.

Figure 6.
Initial Risk Determination.

Figure 7.
Adjusted Risk Determination.

Figure 8.
Control Implementation Milestones.

Figure 9.
Vehicular Network Risk Management Process Example for DSRC.

Publisher’s Note: MDPI stays neutral with regard to jurisdictional claims in published maps and institutional affiliations. |
© 2021 by the authors. Licensee MDPI, Basel, Switzerland. This article is an open access article distributed under the terms and conditions of the Creative Commons Attribution (CC BY) license (https://creativecommons.org/licenses/by/4.0/).
Share and Cite
MDPI and ACS Style
Ebert, J.; Newton, O.; O’Rear, J.; Riley, S.; Park, J.; Gupta, M. Leveraging Aviation Risk Models to Combat Cybersecurity Threats in Vehicular Networks. Information 2021, 12, 390. https://0-doi-org.brum.beds.ac.uk/10.3390/info12100390
AMA Style
Ebert J, Newton O, O’Rear J, Riley S, Park J, Gupta M. Leveraging Aviation Risk Models to Combat Cybersecurity Threats in Vehicular Networks. Information. 2021; 12(10):390. https://0-doi-org.brum.beds.ac.uk/10.3390/info12100390
Chicago/Turabian StyleEbert, Jonathan, Ohad Newton, Jeffery O’Rear, Scott Riley, Jaehong Park, and Maanak Gupta. 2021. "Leveraging Aviation Risk Models to Combat Cybersecurity Threats in Vehicular Networks" Information 12, no. 10: 390. https://0-doi-org.brum.beds.ac.uk/10.3390/info12100390
Note that from the first issue of 2016, this journal uses article numbers instead of page numbers. See further details here.