
Information Content Measurement of ESG Factors via Entropy and Its Impact on Society and Security


1
Research Institute for Energy Management and Planning (RIEMP), University of Tehran, No. 9, Ghods St., Enghelab St., Tehran 1417466191, Iran
2
Department of Economics & Business, Saint Anselm College, Saint Anselm Drive 100, Manchester, NH 03102, USA
3
Statistics and Computer Sciences, School of Mathematics, University of Tehran, Tehran 1417935840, Iran
*
Author to whom correspondence should be addressed.
Information 2021, 12(10), 391; https://0-doi-org.brum.beds.ac.uk/10.3390/info12100391
Submission received: 15 August 2021
/
Revised: 12 September 2021
/
Accepted: 17 September 2021
/
Published: 23 September 2021
(This article belongs to the Special Issue Data Modeling and Predictive Analytics)
Abstract
:We conducted a singular and sectoral vulnerability assessment of ESG factors of Dow-30-listed companies by applying the entropy weight method and analyzing each ESG factor’s information contribution to the overall ESG disclosure score. By reducing information entropy information, weaknesses in the structure of a socio-technological system can be identified and improved. The relative information gain of each indicator improves proportionally to the reduction in entropy. The social pillar contains the most crucial information, followed by the environmental and governance pillars, relative to each other. The difference between the social and economic pillars was found to be statistically not significant, while the differences between the social pillar, respective to the economic and governance pillars were statistically significant. This suggests noisy information content of the governance pillar, indicating improvement potential in governance messaging. Moreover, we found that companies with lean and flexible governance structures are more likely to convey information content better. We also discuss the impact of ESG measures on society and security.
1. Introduction
This study investigated the information content provided by the economic, social, and governance (ESG) factors, as measured by various information providers, to identify potential vulnerabilities and improvements in information content provision when applied to a socio-technological framework. The emergence of ESG factors within the last decade can primarily be traced back to the urge for a better understanding of the drivers behind economic development. The introduction of the measurement of soft factors allows for tracking the operation standards within a firm concerning environmental, social, and governance aspects. This, in turn, supports decision makers and policy makers within a socio-technological framework to better navigate the Sustainability Development Goals (SDGs) of the United Nations’ 2030 agenda. To better understand the impact of these measures on operational activity within firms and society, it is essential to assess the effectiveness of each of these measures. We used information theory and utilized the measure of entropy to quantify the relative information content of each factor and sub-factor by assessing the ESG factors of the Dow-30-listed companies. By measuring the relative information gain generated by introducing each of the ESG pillars, it is possible to identify which measures convey most information content and which are trailing behind. Identification of weaknesses in the system of ESG helps to improve the messaging and to address the needs for improvement of measurement and policy impacts. The objective of our employed method was to measure the information content conveyed by each of the ESG pillars in the Dow-30-listed companies and to compare the information gained by the introduction of each ESG factor. This allowed us to measure the relative impact of the arrival of new information through information channels such as ESG, e.g., through a new policy implementation in one of these pillars, from sector to another. Thus, our analysis tackled the identification of the vulnerable spots in the information content of ESG information transmission by minimization of the entropy of each pillar’s score. We further performed a sectoral analysis to identify which sectors exhibit which vulnerable ESG information content messaging problems. In order to identify possible vulnerabilities of socio-technological systems, the entropy of the system, contingent upon its sub-systems, needs to be identified, and respectively calculated. In information theory, entropy defines the average amount of information produced by a system. The second law of thermodynamics indicates that every natural system leads to maximum entropy by enhancing its complexity. However, the complexity of the system increases by adding information to the system. A system converges to an equilibrium situation by increasing a sufficient amount of information (Unger: New York, NY, USA, 2019) [1]. Vice versa, if a system exhibits a low level of entropy, this means that the level of noise incorporated in the information structure of the system is rather low. Therefore, adding information to a system, while increasing the complexity, should always minimize the level of entropy. Thus, in this paper, we applied the entropy weight method, which is very suitable to determine the relative noise incorporated by information transmission of several channels.
To find the minimum entropy of a system, the entropy of each of the system’s constituents needs to be minimized. Therefore, our goal in identifying vulnerabilities of ESG factors in a socio-technological framework was to minimize the entropy in a setup that automatically increases its complexity with each ESG measurement. The idea behind entropy reduction is that noise in the system is being reduced, which enhances the predictability of the system and, thus, reliability due to qualitatively higher information content. The implications are manifold when applied to ESG factors. ESG measures environmental, social, and governance actions of companies towards managerial behavior in a social context. It is estimated through different levels, from a comprehensive ESG score to sub-level item scores, and provides investors information about the attitude and actual actions companies perform in the certain so-called “ESG pillars”. Each pillar can be considered as its own index, consisting of sub-indexes, which can be comprised as an aggregated ESG index, measured by its score.
As ESG can be considered as a novel index measurement of the impact of a company’s operation on stakeholders considering social-, environmental-, and governance-related actions, the question about each of the components’ relative information content remains still unclear. The identification of potential weaknesses in this system of indexes is of crucial importance as it reveals potential disturbances in signaling and messaging of certain policies or actions.
Our key findings included the detection of the governance score as a vulnerable spot in the socio-technological system of the ESG universe by finding that it exhibited the highest entropy in the system. This means that policy formulation, messaging, and governance measure implementations are more noisy than compared in the other two ESG pillars, indicating potential low effectiveness and higher probability for poor policy implementation or performance due to redundant information, unclear messaging, or misunderstandings. Moreover, we found the environmental disclosure score to be the only significant contributor to the aggregate ESG disclosure score.
By analyzing the impact of the various channels on each sector in the Dow-30-listed companies, we found that the healthcare, defense, and automotive sectors are conveying unclear messaging within the environmental and social pillar, while the financial, consumer goods, and industrial sectors convey messages very efficiently in these pillars. Another key finding was that sectors with clear, lean, and flexible governance structures, such as automotive, IT, and travel, are most effective in messaging.
The implications of these findings are manifold. Firstly, the increased entropy in the governance pillar indicates a call for action in messaging and conveying information to the public and stakeholders in general. Reluctancy in doing so means reduced effectivity of current and future policy implementations. Secondly, the environmental disclosure score seems to reflect the currently increased environmentally induced and pushed policies. The reason for that might lie in the reduced complexity to formulate policy measures and possibility to communicate action plans more clearly. The danger in overemphasizing one set of policy measures lies in the potential distortion of market economics and market signaling, which might, in the long-run, negatively affect sustainable development. In order to increase the relative contribution of the other pillars in the aggregate ESG disclosure score, certain key topics in the corresponding pillars should be addressed and plans set forth to solve long-term issues associated with these.
Moreover, our results show that the establishment of lean and flexible governance structures increases the effectiveness of ESG information conveyance. Different methods to employ such effectivity in increasing governance structures could be subject to future research.
Our paper is structured as follows: we present a literature review in Section 2; describe the data and methodology we used in detail in Section 3, including the description of our robustness check; followed by presentation and interpretation of the obtained results in Section 4. We round up the results in our conclusion.
2. Literature Review
Information content measurement is a very important topic in communication theory. The idea behind transferring messages as efficiently as possible has had important implications on the development of modern telecommunication devices. First introduced by Rudolf Clausius in the 1850s in a thermos-dynamical setting, Claude Shannon extended 1948 the concept of entropy to the concept of information entropy (Shannon, 1948) [2].
According to Shannon (1948) [2], the information content is a basic quantity derived from the probability of a particular event occurring from a random variable. Hartley (1928) [3] already introduced a quantitative measure of information transmission of information where he discussed the rate of transmission of this information over a system, which is limited by the distortion resulting from storage of energy.
In this context, the concept of entropy can be applied to a socio-technological framework, as well as design and evaluation of complex organizational systems, as discussed in Hassani et al. (2021) [4]. According to Cherns (1976) [5] and Cherns (1987) [6], a socio-technological design of an organization can be defined as an outcome of random decision-making processes, since all contributors to the development of a socio-technological framework in an organization are subject to random decision-making processes. In this sense, the ESG factors can be seen as a measurable outcome of managers who pursue various ESG-related measures and introduce different policies. Waterson et al. (2002) [7] and Hollnagel and Woods (2005) [8] introduced, under the concept of a socio-technological framework, a method for allocating work between and among humans and machines. What is missing in the existing literature about socio-technological methods is the integration and analysis of ESG factors into such frameworks. That is where our research contributes to the research on socio-technological frameworks.
Due to the increased digitalization of society, the creation and integration of ESG measures, as well as their evaluation due to their effectiveness, nowadays fits better in the concept of a socio-technological framework than ever. Related to this categorization, Beyer and Holtzblatt (1999) [9] considered the uprising of human-centered informatics, which help in capturing important information of key determinants of contextual system designs. This involves system constituents that can be considered as an input for the entropy weight, which we applied in this study to measure ESG factors’ vulnerability according to their relative information content in the context of a socio-technological system.
As each ESG pillar value reflects information that is being sent to the recipient, our research contributes to closing the existing knowledge gap between the digital economy’s objective and transparent mechanisms to provide reliable assessments of the published sustainability information. Zakaria et al. (2021) [10] compiled a sustainability dictionary corpus and implemented the corpus to objective assess the relative entropy between the probability distributions of words in the sustainability dictionary and those in corporate reports.
In contrast to their work, we investigated potential improvement possibilities in the information content transmission of sustainability measures reported through the ESG measures. Another purpose of this research was to present the application of a general entropy weight reduction methodology that can be applied to any type of socio-technological system in order to identify potential vulnerabilities in policy, such that measures can be taken in order to improve the content channel transmission.
Most of the ESG research that has been conducted has targeted the understanding of the relationship between corporate social responsibility (CSR) and ESG measures, their effectiveness, how these measures should be measured and implemented, which policies should be implemented, what impact which disclosure levels have on corporate performance, and many more factors.
Loew et al. (2021) [11] investigated the effectiveness of the EU Non-Financial Reporting Directive (2014/95/EU) with respect to the CSR disclosure quality in European banks from 2017–2019. While their research gave important insights regarding the impact certain measures might have on the significance of the ESG disclosure score in the financial sector, they neither measured the information content conveyed by these measures nor analyzed the effect of these measures on each ESG pillar. Moreover, their analysis focused only on financial institutions and did not give an overview about the effectiveness of certain policy implementations across various sectors. Our approach contributes to a broader picture by measuring the effectiveness, or significance, of certain policy implementations through the measurement of the information content provided by policies targeting certain ESG pillars.
Another branch of the existing ESG literature has dealt with the impact measurement of ESG policies on a firm’s performance, such as Azmi et al. (2021) [12], Saygili et al. (2021) [13], Wang et al. (2021) [14], Abdi et al. (2021) [15] and Wang et al. (2020) [16] who elaborate ESG activities and banking and financial performance.
Atan et al. (2016) [17] explored the level of disclosure based on different regulatory requirements of ESG information while exploring its effect on the firm’s performance in Denmark and Malaysia. They found that the aggregate ESG disclosure level in Denmark was not higher than in Malaysia even though Denmark exhibited a much higher legislative pressure than Malaysia. Moreover they found no relation between ESG disclosure level and a firm’s performance, which indicates a significant influence of the country’s regulatory background on the firm’s ESG disclosure level. While our research does not tackle the question of the impact of ESG measures on a firm’s performance, we contribute to this insight by identifying the necessary pillars that should be targeted by changes in the regulatory framework in order to increase the overall effectivity of the aggregate ESG disclosure score.
Jun et al. (2018) [18] investigated the relationship between corporate efficiency and corporate sustainability to determine whether firms concerned about ESG issues can also be efficient and profitable. They found evidence for a positive relationship between ESG activities and corporate efficiency, return on assets, market value, and corporate sustainability. While their results indicated the importance of corporate governance for corporate efficiency, their findings lack an explanation of why ESG measures have a positive impact only on moderate disclosure levels, and none on high or low disclosure levels. The authors argued that the discretionary-based disclosure of ESG information has a complex association with corporate efficiency, but they were missing an explanation for the negative impact of the positive relationship, specifically the negative impact of the different disclosure levels. Our findings revealed that the average governance disclosure score of the Dow-30-listed companies exhibit the highest measure of entropy, indicating very noisy and unclear information conveyance in ESG policy communication in this pillar. When it comes to governance, unclear communication strategies or board structures and responsibilities lead to inefficient outcomes, due to either over-or under-regulation. This explains why high and low disclosure levels actually have a negative impact on corporate efficiency.
Gangi et al. (2020) [19] evaluated how environmental policies affect corporate reputation, and how this influences risk-adjusted profitability and the company’s risk. They found that corporate reputation has a positive impact on risk-adjusted profitability and the Z score indicator of financial distress risk. Their results confirm our finding of a superior information content transmission of the environmental score. The authors wrote: “Social responsibility can be considered a multidimensional concept (Melo and Garrido-Morgado, 2012) [20], whose business effects need to be investigated by disentangling the impacts of single pillars on firm performance”. Our research did exactly that and investigated the relative information contribution of each of these pillars to overall firm performance and efficiency. We revealed the relative noisiness associated within the score, compared to the social and governance score, which is important when it comes to the decision-making process about which measures to implement to enhance corporate reputation.
Hagendorff and Clacher (2012) [21] addressed the messaging power of ESG measures by investigating the stock market reaction to the announcement that a firm has been included in an index for socially responsible firms. However, they did not find strong evidence in favor of a positive market reaction. The reason for the lack of a positive market reaction was addressed by our research as we found two out of three pillars have problems conveying the appropriate information content. While their research targeted the messaging impact of ESG measures, it failed to distinguish the types of messages to identify which ESG policy was addressed. We showed that an increased emphasis on the social and governance disclosure score would increase the chance for a positive market reaction.
Our research revealed the level of noise incorporated in the governance disclosure score, and thus, in governance messaging, which might have several reasons. One reason might lie in the board structure or size of firms, others might be due to poor communication channels.
Germain et al. (2014) [22] studied corporate governance reform in Malaysia by investigating the determinants of the board structure for Malaysian firms from 2000 to 2007. While our findings revealed that reforms in corporate governance contribute significantly to the potential to increase messaging quality, this study focused only on the importance of the board size of a company and found that board size and board independence are correlated with the operation level of the firms. This indicates that, in order to increase messaging quality, companies should adjust their board size according to the operation level.
The impact of board composition on the level of ESG disclosures was also investigated by Arayssi et al. (2020) [23], who analyzed the impact of board composition on ESG reporting in the Persian Gulf countries. Here, we determined a relative share by which governance structure should be improved such that information conveyed in policies are more clearly communicated.
Another different approach to analyze the content transmission has been taken by Linkov et al. (2018) [24], who examined the original sustainability policy concepts applied within the Brundtland Report of 1987 through the lens of digitalization. Their analysis implied that adaptive governance approaches are required to explain the economic and social sustainability challenges. Their insights are in-line with our findings that the governance pillar plays an important role when it comes to communication of policies addressing corporate sustainability. Since we found the governance pillar to exhibit the highest measure of entropy, this means that most information prevails in the governance disclosure score, but is disturbed with a higher relative share of noise than compared to the environmental and social disclosure pillars. Our results emphasize the necessity to reduce the noise generated within the governance disclosure score to enhance quality of information conveyance.
One problem that comes along with the measurability of ESG measures was stressed by Yo et al. (2020) [25], who studied mechanisms to lessen firms’ greenwashing behavior in ESG dimensions holistically. One of the main reasons why ESG scores look often better than they really are is that the ESG data provided in sustainability reports by firms are often unaudited. The authors concluded that two firm-level governance factors are most effective at attenuating firms’ misleading disclosure relating to ESG dimension. By providing an estimate of the relative noisiness contained in the governance disclosure score, relative to the environmental and social disclosure score, policy makers can deduct the relative contribution such governance factors need to do in order to minimize the danger of greenwashing the aggregate ESG disclosure score.
An essential contribution to communication and evaluation of ESG measures on firm level activity and performance was made by Albitar et al. (2020) [26], who investigate the effect of the aggregated ESG disclosure on firm performance before and after the introduction of integrated reporting. Since integrated reporting can be understood as one possible tool for internal information conveyance, it can be viewed as one way to enhance communication quality of ESG policies. The authors found that firms that voluntarily associate with IR have a tendency to achieve better firm financial performance. Building upon their insights, our results indicate that integrated reporting could improve the information content provision in the governance pillar.
In order to measure the relative information content provided by each of the ESG pillars to each other, we applied the entropy weight method (EWM) to the ESG disclosure scores. Since this method is widely used in information theory, engineering, machine learning, and other fields, there exists a lot of literature that has examined the advantages and disadvantages of this method, e.g., Wu et al. (2015) [27] and Yan et al. (2019a, 2019b) [28,29].
Kumar et al. (2021) [30] conducted an extensive literature review of research articles dealing with the deployment of this method in the various fields of science. They also provided a comprehensive list of advantages and disadvantages of the entropy weight method when applied to machine operations. Summarized, the advantage of the entropy weight method lies in its simplicity and flexibility of application, as well as in its closer relationship between the model, the modeler, and the decision maker. The weaknesses of the method encompass the sizing of the problems, e.g., the decision matrix encloses a large set of alternatives, and the consideration of no description of the reciprocated associations amongst responses (Mustajoki et al., 2004) [31].
Zhu et al. (2020) [32] also investigated the effectiveness of the entropy weight method. They identified potential problems with the EWM results when there are too many zero values in the measured values. However, since we were not conducting any simulations, and only used historic ESG data, which do not contain any zero values, this shortcoming did not affect the quality of our results.
Wang et al. (2015) [33] applied the EWM and grey relation analysis to rank airlines according to their the corporate social responsibility. They showed that most of the larger state-controlled airlines perform better in performance of CSR and that for private airlines, listed airlines are better than non-listed airlines in CSR performance. In contrast to this research, we investigated more industry sectors and went more in-depth by revealing the relative effectiveness of information conveyance of each of the ESG pillars to each other.
3. Data and Methodology
3.1. Data Description
We used yearly historic Bloomberg ESG data ranging from 2010–2019 for the current 30 constituents of the U.S. Dow 30 index. The constituents comprised all 30 companies except Dow Inc., for which no data were available. We focused on 4 common available indicators, which were available across all 29 companies: the ESG disclosure scores, governance scores, environmental scores, and social scores. For a detailed calculation methodology of each score, we referred to the Bloomberg ESG fact sheets. According to the definitions of Bloomberg, the Governance Scores for Board Composition rank the relative performance of companies across industries on measures of diversity, refreshment, director roles, and independence, while the Environmental and Social News Sentiment Scores, derived from news coverage, provide daily insights into companies’ environmental and social behavior. The ESG disclosure scores rate companies on their level of ESG disclosure.
To provide a more detailed overview of the analyzed data, we describe the used indicators in more detail below. The ESG disclosure scores cover 4 fields (ESG, E, S, G).
Governance Scores for Board Composition.
The Board Composition Scores provide an analysis of over 4300 companies across all sectors and regions.
Industry-specific Environmental and Social (ES) Scores.
Bloomberg releases ES scores on oil and gas (253 companies), chemicals (139 companies), metals and mining and steel (168 companies), construction materials (46 companies), coal (18 companies), and utilities (180 companies).
Environmental and Social News Sentiment Scores.
The Bloomberg ES News Sentiment Scores present insight into companies’ environmental and social behavior daily, supporting investors and companies to evaluate corporate sustainability performance among sustainability report releases.
3.2. Methodology: Application of Entropy Weight Method to ESG
In order to calculate the entropy of the ESG system we needed to define each index and sub-index. The main index can be defined through the comprehensive ESG disclosure score while the sub-indexes are comprised of separate environmental, social, and governance disclosure scores. These sub-level indexes are the level at which we conducted our analysis. There exist also more sub-constituents of these sub-indexes, but the available types of factor measurements differ from company to company and, therefore, make a comparative analysis impossible.
To make a cross-company comparison of the different ESG factors possible, we standardized the data by applying the entropy weight method, as explored by Zhang (2014) [33] and Hassani et al. (2021) [4], where the standardized ESG sub-index value, xij can be calculated via the Z-score, xij:
where xij represents the standardized data from the ith ESG sub-index, Xij represents the original data, while µi and σi are the mean and standard deviation of the ith ESG sub-index. In order to ensure consistency during ESG index and sub-index aggregation, we transformed all indices to positive values using the coordinate transformation method:
where xtij is the standard value after the translation, xtij > 0, and A represents the translational amplitude A > |min(xij)|. The closer the value of A to |min(xij)|, the more significant the assessment result. The index weights are calculated by:
where pij is the specific gravity value for each xtij. The ESG index, as well as the sub-index entropy, is calculated by
where ei the ith entropy, k is a positive value, and k = 1/ln(n) is selected to ensure that 0 ≤ ei ≤ 1 with n being the number of observances. A smaller entropy coefficient indicates a greater difference among the indicators, and thus, contains less noise. We remark that in order to calculate the entropy, we first calculated the marginal information content of each ESG pillar, and respective sector, independently and then compared the relative entropy contribution of each pillar to the total entropy of the system, as provided by the aggregate ESG disclosure score.
The channel capacity, , for each ESG pillar, i, is defined by
where the supremum is taken over all possible choices of the marginal distribution , with X being the channel input value and Y being the channel output value.
In order to analyze the interference of the ESG pillars, we further explored the contribution of each ESG pillar to the aggregate ESG disclosure score. This estimation also serves as robustness check, since each ESG measure should reflect a proportionate contribution to the aggregate ESG disclosure score.
The aggregate ESG disclosure score is explained by the three scores of the underlying pillars: environment, social, and governance. Thus, any policy implementation in any of the pillars should directly affect the aggregate ESG disclosure score, which is calculated as:
where is the aggregate ESG disclosure score at time t, values are the weights of the ESG pillars at time t, is the environmental disclosure score at time t, is the social disclosure score at time t, is the governance disclosure score at time t.
The contribution of each of the pillars to the aggregate ESG score might change over time, therefore, we ran a regression to determine if any of the ESG pillar entropies contributed significantly to the aggregate ESG score entropy by
Moreover, we performed an ESG entropy sector analysis over all Dow 30 companies to analyze the relative performance of each sector to the average sector performance. We did this by taking the average of each company’s ESG pillar entropy for each sector, then divided each sector’s average entropy by the sum of all sector entropies per pillar:
where is the entropy of company i, the average ESG pillar entropy of sector j, and is the average ESG pillar entropy over all 12 sectors. The relative entropy performance of each sector entropy is the difference between each sector entropy to the average ESG sectoral pillar entropy:
4. Results
4.1. ESG Disclosure Entropies
We first calculated the entropy for the aggregate ESG disclosure score, as well as for each of the ESG pillars, using the entropy weight method, and present the results in Table 1. Then, we conducted a Student t-test to test for potential significant divergence in the information content from one ESG pillar to another and list the results in Table 2.
We can see from Table 1 that the social score exhibited the least entropy, followed by the aggregate ESG, environmental, and governance disclosure score. The results imply a superior information content transmission of measures covered in by the social pillar. This means that measures taken to improve social factors within a company are easier to communicate and implement. The good performance of the aggregate ESG disclosure relative to the evaluation of its pillars shows that the ESG measures are effective as a whole. The worse performance of the environmental disclosure score exhibits some problems in messaging, indicating some potential improvement possibilities that could be achieved, e.g., through more transparency and clear communication of the measures being implemented. Nevertheless, there was no significant deterioration of information content transmission detectable, as indicated by Table 2.
Table 2 reports the information content provision of each of the pillars relative to each other. Firstly, we performed a Student’s t-test between the relative performance of the economic pillar (E) to the social pillar (S). We did not find any significant, statistical difference in information provision between these two pillars. Secondly, we performed a t-test between the economic pillar and the governance pillar (G) and found a statistically significant superiority in information provision of the environmental score compared with the governance score. Thirdly, we ran a t-test between the social pillar and the governance pillar and found a statistically significant superiority in information provision of the social score over the governance score.
The significant deterioration of information content in the governance disclosure score reveals potential weaknesses in conveying information to the recipients. Potential reasons for the poor performance of the governance pillar could be the different compositions of board structures, which lead to different ways of measure implementation, or the diverse nature of governance practices, as the governance pillar is the most closely related measure of how policy measures are actually developed.
4.2. Robustness and ESG Pillar Contribution
In order to identify each ESG pillar’s contribution to the aggregate ESG disclosure score entropy, we ran a multivariate OLS regression comprising each ESG pillar entropy. To check for robustness of our calculated ESG entropies, an instantaneous relationship analysis at t = 0 sufficed.
Table 3 exhibits the estimated parameters for the ESG pillar entropies. Firstly, it is important to note that the R square value indicates a good fit of the model, which was expected since the ESG aggregate disclosure entropy should comprise the entropy of each ESG pillar.
Secondly, we can see that the biggest and only significant contribution to the aggregate ESG disclosure score entropy actually came from the environmental disclosure score entropy, which was unexpected. A possible explanation for this result might be a higher weight of environmental scores in the aggregated ESG disclosure score. What is interesting is the negative contribution of the governance pillar entropy to the aggregated ESG disclosure score entropy, which indicates a huge potential to reduce aggregate ESG entropy by improving information conveyance in the governance pillar. An improvement in governance communication, would increase governance activity and reduce information noise on an aggregate ESG level. The results obtained from the ESG pillar regression confirm our results as robust as the governance pillar turns out to be the pillar which has the most potential to improve aggregate ESG score information conveyance.
4.3. ESG Pillar Entropy Sector Analysis
We further performed a sector analysis of the 12 sectors currently represented in the Dow 30 according to their entropy contribution in each of the ESG pillars, relative to each other. The idea behind this was to show which sectors actually convey the information content of their ESG policy measures in their corresponding category well, and which sectors distort the information content by implementation of the corresponding ESG measure. Any positive entropy contribution indicates an addition of noise and, thus, reveals potential room for improvement in communication and policy content. The 12 sectors we analyzed were consumer staples, energy, automotive, financials, healthcare, home goods, IT, communications, defense, industrials, consumer goods, and travel.
To distinguish these sectors from each other, consumer staples is, by definition, a sector that provide goods and services that people use on a daily basis, like food, clothing, or other personal products, while consumer goods, from an economic standpoint, can be classified as a sector that produces durable goods useful for longer than 3 years. Home goods comprises hardware items such as equipment, tools, machines, and other things used in a house. The reason why Bloomberg distinguishes between these sectors seems to be that the production of these goods require different types of communication strategies, as indicated by our relative inter-sectoral analysis below.
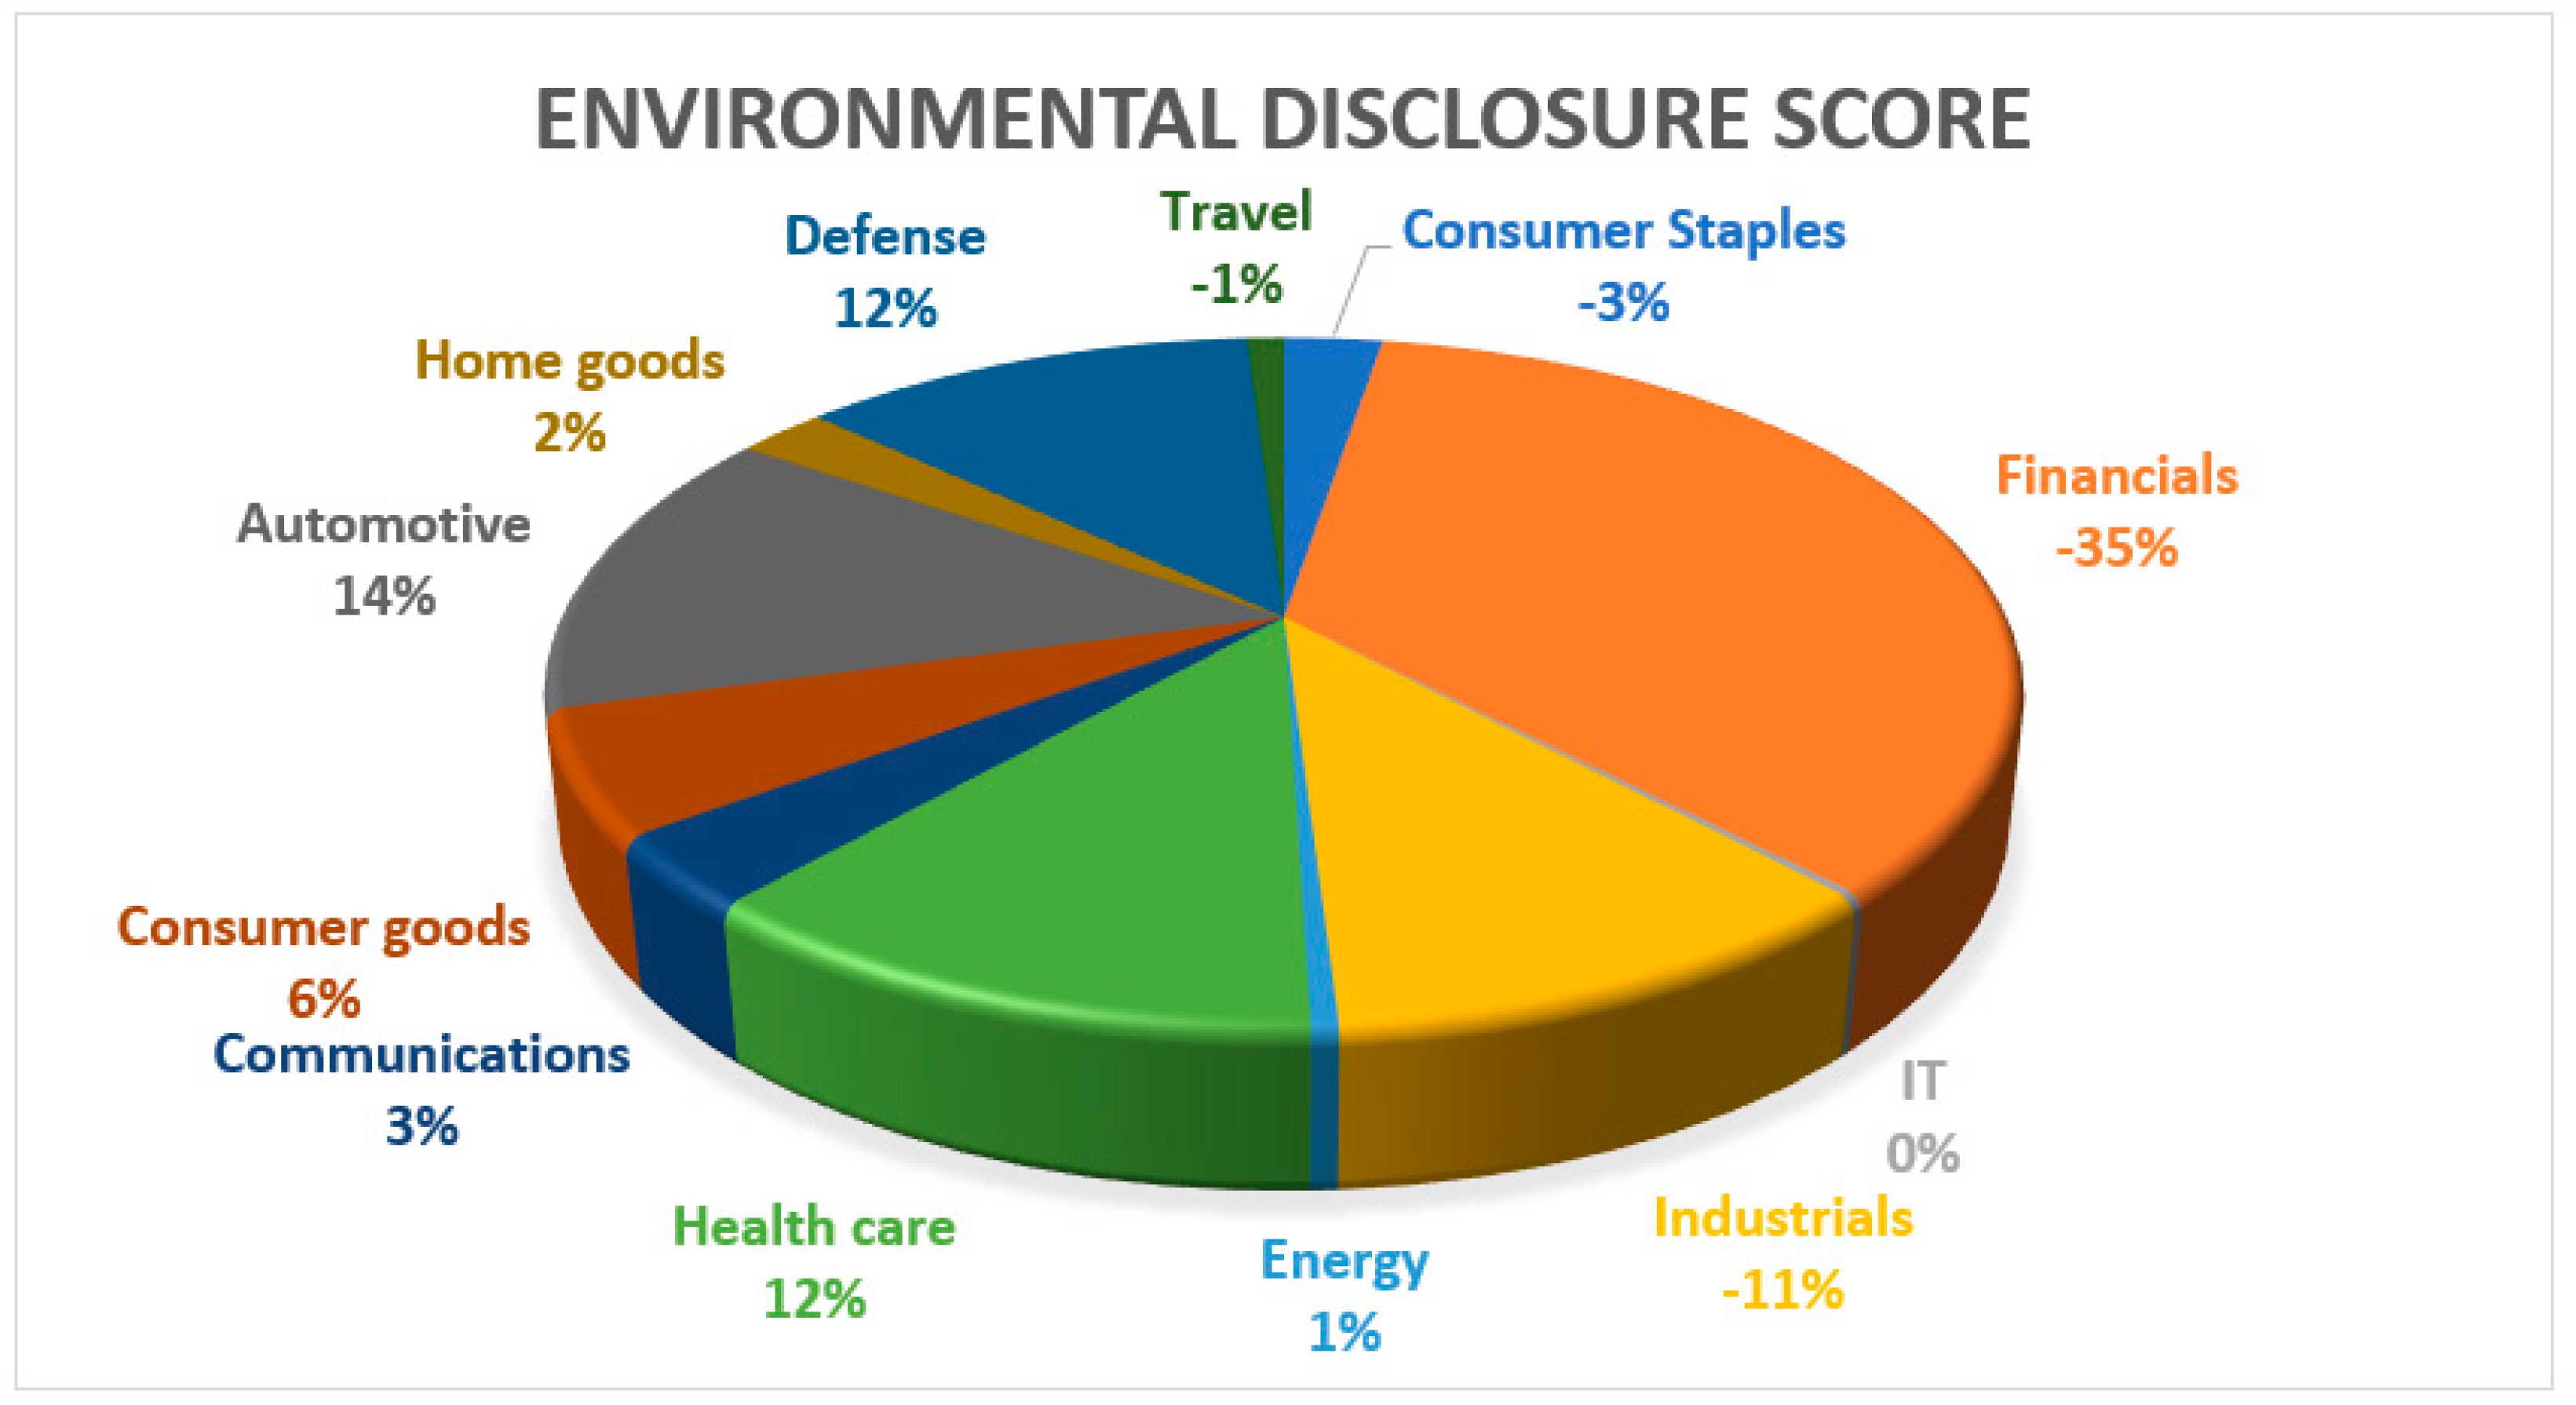
Figure 1 shows the entropy reduction of each sector relative to the sectoral entropy mean in the environmental pillar. It shows a superior entropy reduction of the financial sector, relative to the Dow 30 sector average for the environmental pillar, followed by the industrial sector and consumer staples. The most entropy disturbance to the environmental pillar, relative to the sectors’ averages, was added by the automotive sector, followed by the communications and healthcare sectors.
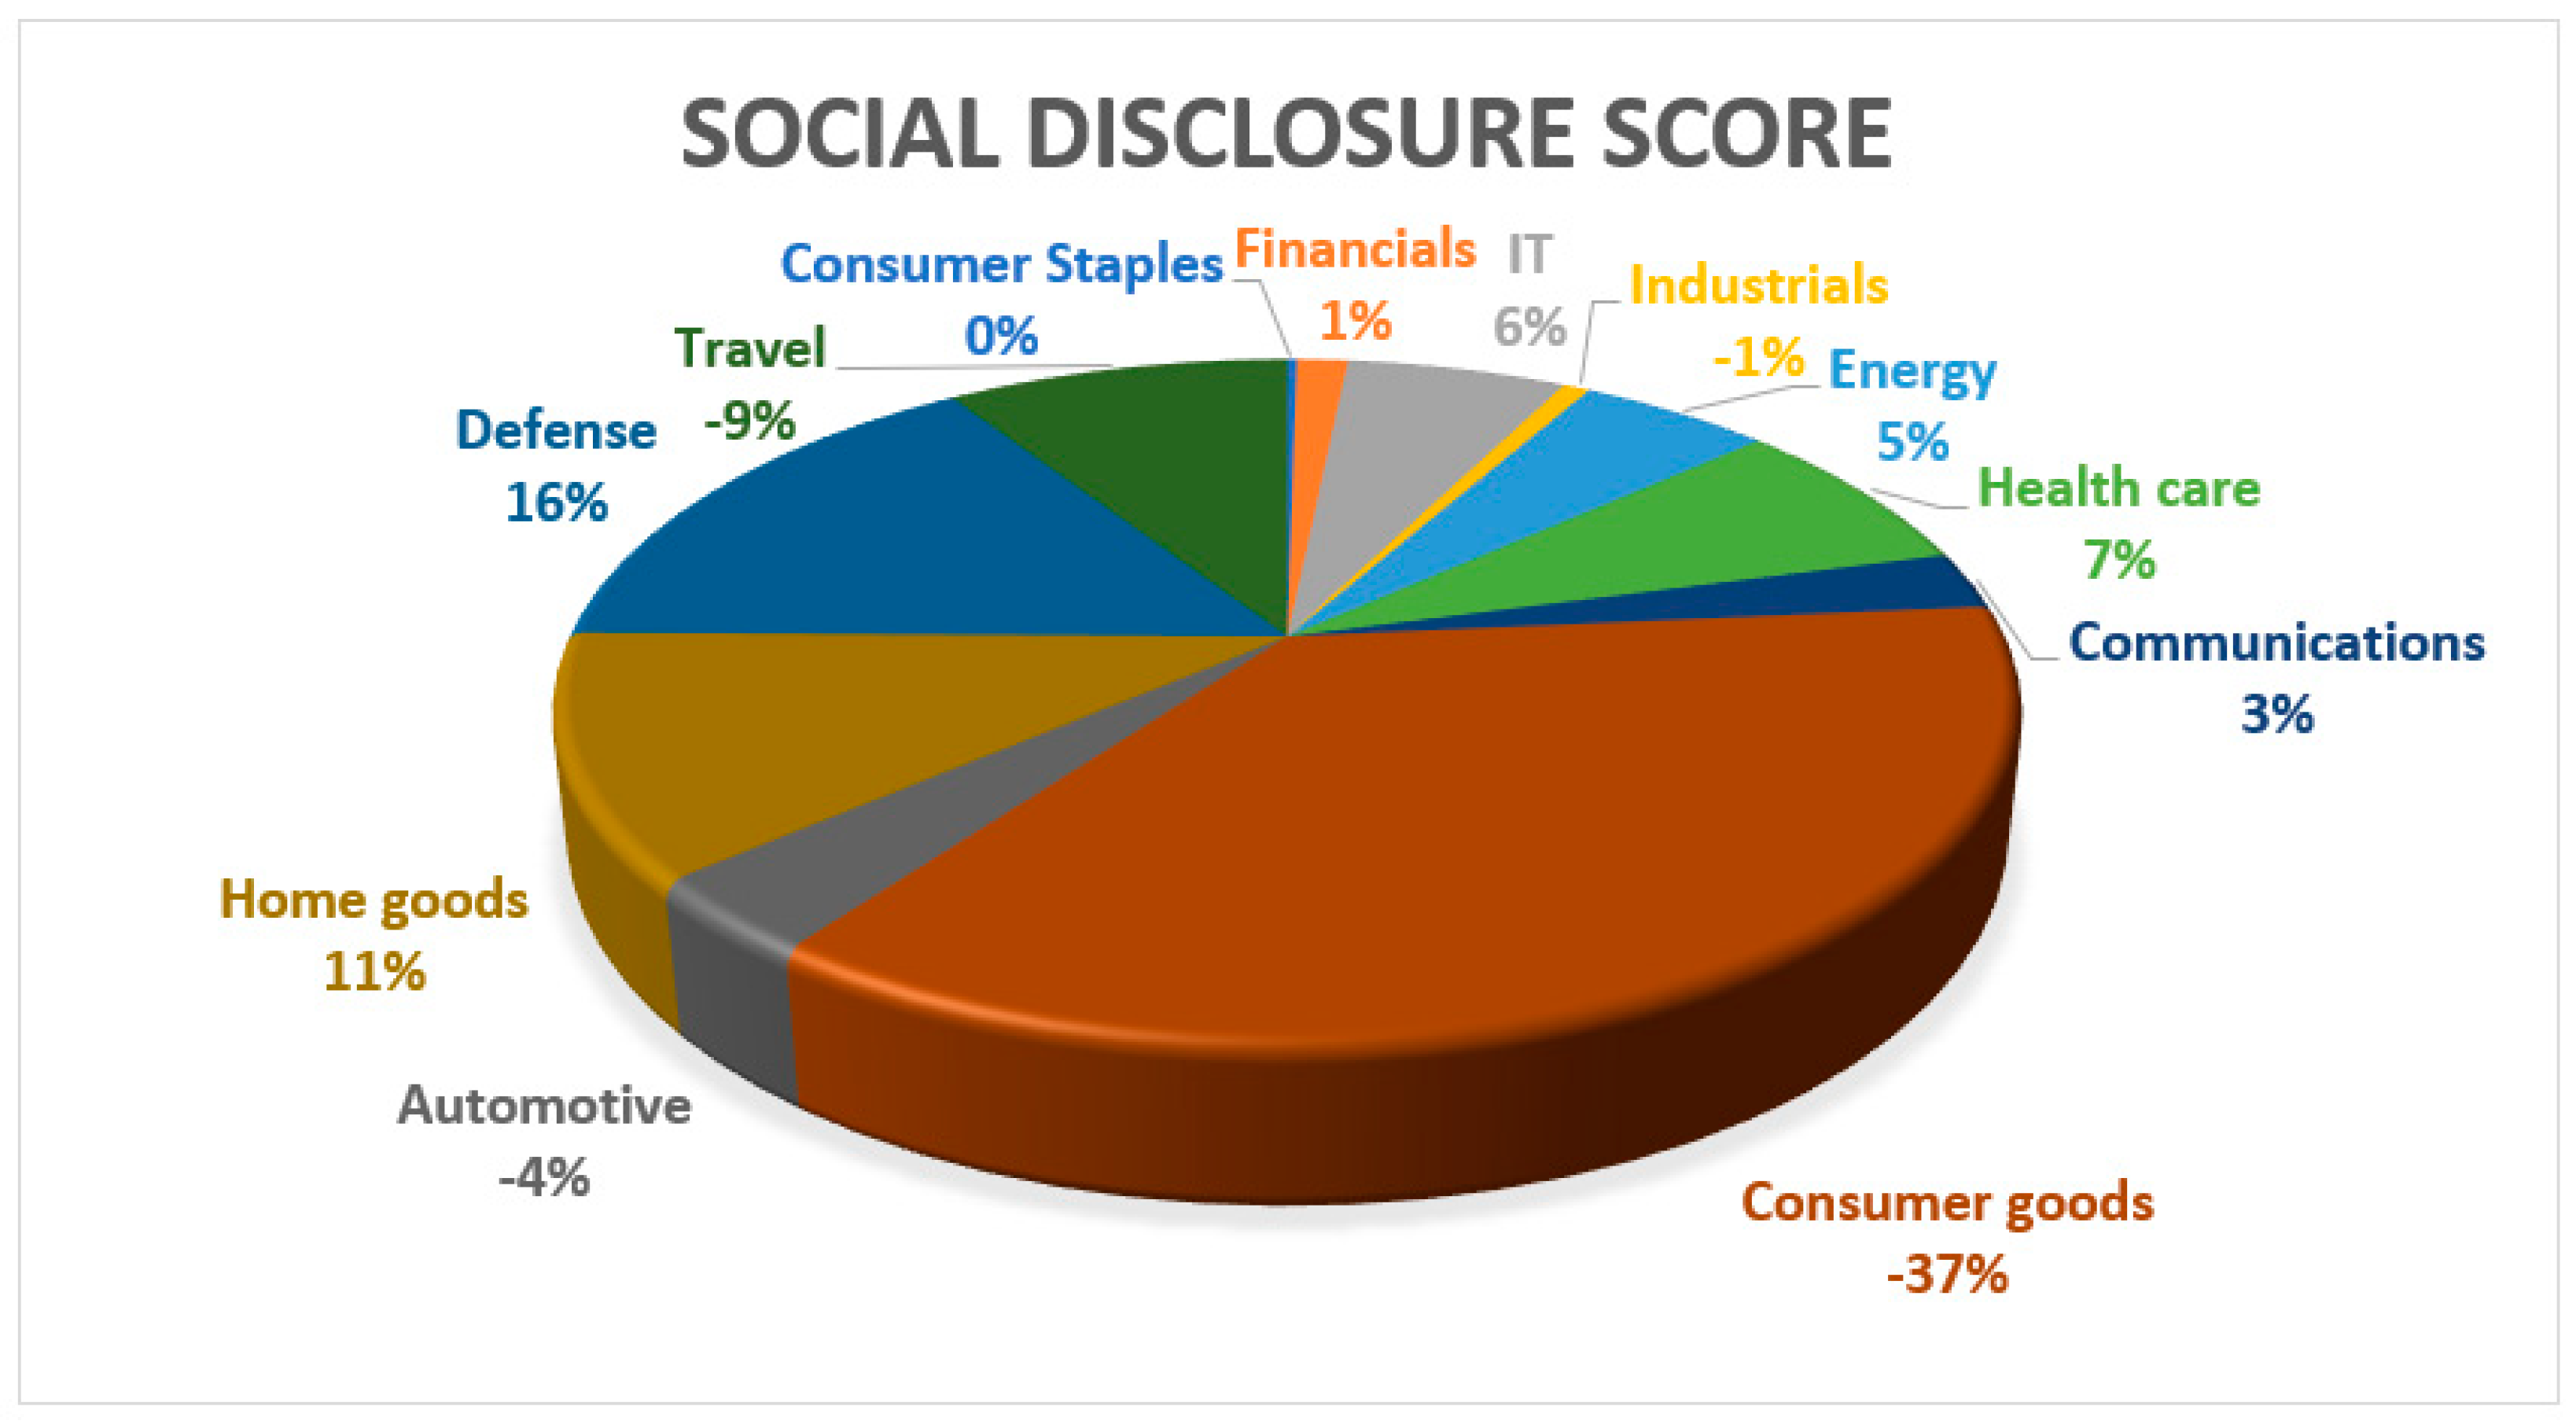
Figure 2 shows the entropy reduction of each sector relative to the sectoral entropy mean in the social pillar. It shows a superior entropy reduction of the consumer goods sector relative to the Dow 30 sector average for the social pillar, followed by the travel and IT sectors. The most entropy disturbance to the social pillar, relative to the sectors’ averages, was added by the defense sector, followed by home goods and healthcare.
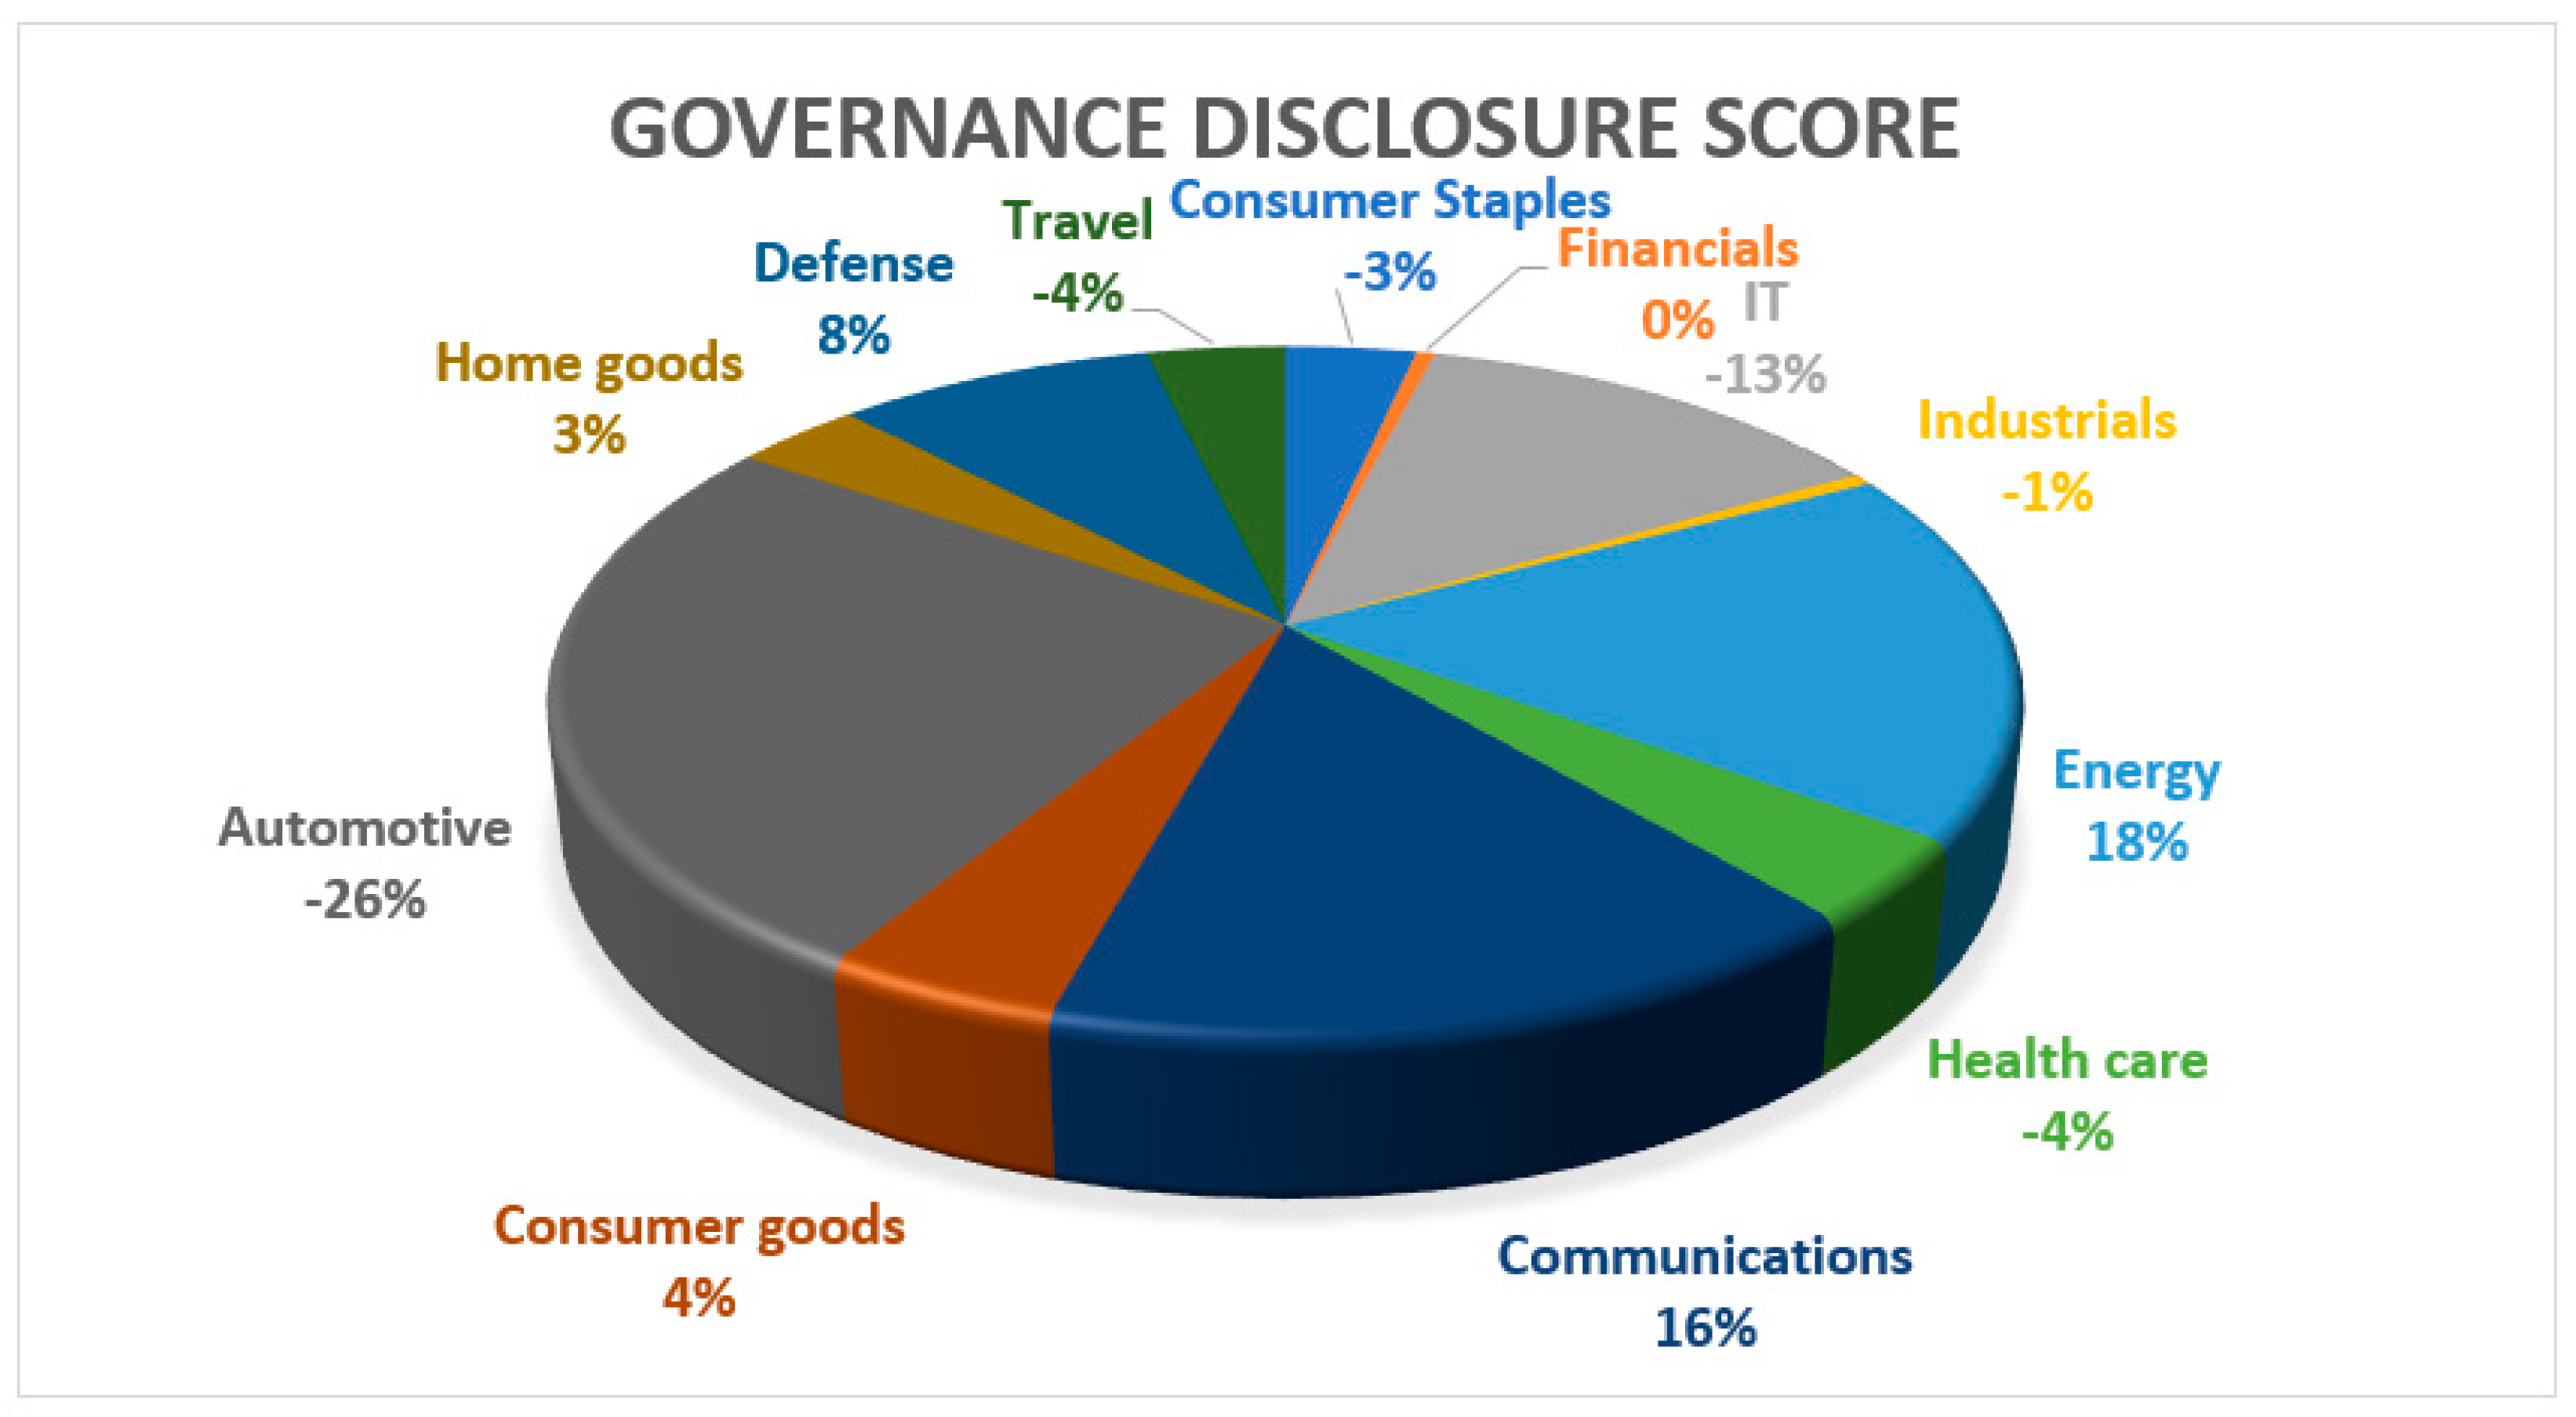
Figure 3 shows the entropy reduction of each sector relative to the sectoral entropy mean in the governance pillar. It shows a superior entropy reduction of the governance pillar by the automotive sector, relative to the Dow 30 sector average, followed by IT, healthcare, and travel. The most entropy disturbance to the governance pillar, relative to the sectors’ averages, was added by the energy sector, followed by communications and defense.
To sum up, the automotive, healthcare, and defense sectors seem to have room for improvement in their information content conveyance in the environmental and social pillars, while the financial, consumer goods, and automotive sectors seem to efficiently convey their ESG policy measures in the corresponding ESG pillars.
The automotive sector seems to convey information content in governance-related messaging best, as well as IT and travel. The reason for this might be the relative ease of policy implementation and more flexible governance structures compared to the other sectors.
5. Discussion
Our results have interesting implications for future vulnerability assessments of socio-technological frameworks, i.e., when it comes to the information conveyance of ESG policies. We have provided an estimate of the information conveyance capability of such a system and showed the relative strengths and weaknesses of each ESG pillar with respect to their information content provision. While most of existing ESG literature has investigated the impact each ESG measure has on firm performance, we have gone one level beyond that by revealing the causality behind certain measures improving firm performance, thus contributing to a more sustainable development of the firm and society.
Other branches of ESG research have focused on the measurement of the effectiveness of ESG policies. This effectiveness is, again, most often measured through firm performance. Since our results indicate a strong need for improvement in governance communication, tools such as integrated reporting could improve the information content provision in governance. However, existing literature has showed that companies with either very high or very low disclosure scores exhibit lower level of productivity. Our analysis explains this underperformance due to inefficiency of over- or under-regulation in governance and provides an estimate of the relations by how much information conveyance of governance policies should be improved in relation to environmental and social measures.
The inefficiency of the governance communication channel has important implications for sustainable development of a firm or a whole sector, since overregulation hinders quick and responsive sustainable policy implementation, while under-regulation causes a lack of support in policy development, implementation, and control. When it comes to issues that require quick responses, necessary policies need to be either already in place or set up in framework in which they can be developed.
With emerging ESG measures, the question arises about the increasing impact of ESG measures on the sustainable development of a firm, and thus of the whole sector and the economy. Furthermore, adequate ESG credentials and long-term plans to improve their relationship with society and the environment are increasingly essential to guarantee companies’ access to capital. Increased access to capital empowers sustainable long-term growth for companies, which creates jobs and, thus, enhances social security.
Moreover, the implementation of ESG measures also leads to other increased social security benefits, such as fighting climate change and other environmental risks and improving employee health and safety, pay equity, board and employee diversity, corporate governance, data security and customer privacy, consumer and product safety standards, business continuity, disaster, and crisis management, as well as addressing human rights concerns, including the use of trafficked or child workers in the supply chain (Connellan et al., 2020) [34]. Companies that make use of ESG-enhancing measures contribute to general wealth generation, which is rewarded, and respectively reflected, in the outperformance of the market. As more wealth is being generated, tax revenues for states increase, which enables the establishment of a more sustainable social safety net.
All these impacts lead to a more resilient system as they improve social security.
More resilience through ESG measures also includes an appropriate cyber security defense. As breaches of firewalls, hacks of cyber security walls, etc. can have severe negative impacts on a company’s conduct of business, cyber-attacks pose a real threat to wealth generation and, therefore, to social security in the long-run.
Moreover, through the implementation of sustainable measures, as provided by the ESG framework, long-term investments such as 401 Ks, as well as other pension contributions are more likely to prevail and increase their value over time, which again plays an important role in long-term social security.
Therefore, the identification and assessment of vulnerabilities through approaches such as entropy measurement is of increasing importance and should and can be applied to any type of business process as the identification of vulnerabilities along the value chain is scale- and unit-invariant.
By application of the entropy weight method, every firm is able to calculate the effectiveness of their information policies. The strength of the method is that it can be applied to almost any socio-technological framework. Thus, by application of the entropy weight method to existing policy frameworks that can be quantified, we can see which policies are effective and which need improvement. Future research might tackle exactly this area of interest, since the measurement of policy impact is still a challenge. We suggest that upcoming research might focus on the quantification of policy measures, inference of effectiveness of policies and their impact on sustainability, and evaluation of existing policy frameworks with respect to ESG measures, as well as on the impact estimation of new ESG measures on firm performance, society, and security.
6. Conclusions
In this article, we conducted a vulnerability assessment of the ESG factors of Dow-30-listed companies by measuring their entropy. In information theory, entropy defines the average amount of information content conveyed by a system. The ESG factors are a pretty novel instrument to measure social and sustainable measures undertaken by companies, and are based upon the decision making of their managers. The three categories in which these actions were measured were the environmental, social, and governance scores. The bridge that we built in this article is the application of entropy measurement to any generalized, socio-technological system, as well as what ESG measures can be seen as, since their scores convey certain information content to the recipient, usually investors. By measurement of the entropy of the system, it is possible to detect potential vulnerabilities in information content conveyance of a digitized socio-technological system. In our case, we detected the governance score to be a significant, vulnerable spot in the socio-technological system of the ESG universe as it exhibited the highest entropy in the system, indicating a high level of noise and uncertainty associated with the formulation, messaging, and implementation of governance measures within the Dow 30 firms.
Moreover, we analyzed the contribution of each ESG pillar to the aggregate ESG disclosure score and found the environmental disclosure score to be the only significant contributor. The reason is that the aggregate ESG measures are highly dependent on measures and actions undertaken in the environmental pillar. We indeed found a positive correlation of 0.48 between the aggregate the ESG score and environmental score, followed by a positive correlation of 0.42 between the ESG score and social score, while the governance pillar actually exhibited a negative correlation of −0.47, indicating an increased disturbance of information content on an aggregate ESG score level for implementation of governance policies. The reason for the negative impact of governance policy measures on the aggregate information content might be due to the difficulty to comprehend and streamline different governance practices.
In addition, we performed a sector analysis of the Dow 30 according to the relative entropy contribution of each sector to each ESG pillar. We found that the healthcare, defense, and automotive sectors add a lot of noise to the information conveyance within the environmental and social pillars, while the financial, consumer goods, and industrial sectors convey messages very efficiently in these pillars. In the governance sector we found sectors with lean and flexible governance structures, such as automotive, IT, and travel, to be most effective in conveying information content.
Moreover, we showed in our paper that the entropy weight method is suitable to be applied to the measurement of policy effectiveness and their corresponding frameworks by measuring the information conveyance capability of the policies themselves, as well as of the channels through which there are provided.
The results show the importance of proper governance, as overregulation as well as under-regulation lead to ineffective policy implementation and roll-out. The significant high noise in the governance pillar indicates the difficulty of conveying governance messages and the importance of lean and flexible governance structures. By quantification of policies, it is possible to determine the relative strength and weakness of the policy and compare them to, for example, the policies that are in-place. Other evaluations might tackle the sub-levels of the governance pillar, as measured by Bloomberg, which include the size of the board, the independence of directors, the percentage of independent directors, the board duration in years, the number of board meetings, as well as the board meeting attendance.
The probability of successful implementation of a policy increases with proper communication, clear messaging, efficient communication channels, and proper evaluation and revision mechanisms. The relative superiority of information conveyance in the environmental and social pillars compared to the governance pillar, as found in our analysis, shows that communication channels of these two pillars are more efficient than governance channels. The reason for this might lie in the ongoing change of governance structures all over the world towards a more diverse, inclusive, and sustainable framework, such that an equilibrium has not been found yet. However, by improving the information conveyance in the governance pillar, positive long-term implications can be expected for economic and firm performance, as well as for society and security in general.
Author Contributions
Conceptualization, methodology, validation, writing—original draft preparation, H.H., S.U., and M.R.E. All authors have read and agreed to the published version of the manuscript.
Funding
This research received no external funding.
Institutional Review Board Statement
Not applicable.
Informed Consent Statement
Not applicable.
Data Availability Statement
Not applicable, the study does not report any data.
Conflicts of Interest
The authors declare no conflict of interest.
References
- Unger, S. The Effect of Allocative Efficiency of Free Markets on Entropy and its Implications on Taxes. Athens J. Bus. Econ. Athens Inst. Educ. Res. 2019, 5, 287–300. [Google Scholar] [CrossRef]
- Shannon, C. A Mathematical Theory of Communication. Bell Syst. Tech. J. 1948, 27, 379–423, 623–656. [Google Scholar] [CrossRef] [Green Version]
- Hartley, R. Transmission of Information. Bell Syst. Tech. J. 1928, 7, 535–563. [Google Scholar] [CrossRef]
- Hassani, H.; Komendantova, N.; Unger, S. Chapter 3 Vulnerability Assessment of Digitized Socio-technological Systems via Entropy. In Resilience in the Digital Age. Lecture Notes in Computer Science; Roberts, F.S., Sheremet, I.A., Eds.; Springer: Cham, Switzerland, 2021; Volume 12660. [Google Scholar] [CrossRef]
- Cherns, A. Principles of socio-technical design. Hum. Relat. 1976, 29, 783–792. [Google Scholar] [CrossRef] [Green Version]
- Cherns, A. Principles of socio-technical design revisited. Hum. Relat. 1987, 40, 153–162. [Google Scholar] [CrossRef]
- Waterson, P.E.; Older Gray, M.T.; Clegg, C.W. A sociotechnical method for designing work systems. Hum. Factors 2002, 44, 376–391. [Google Scholar] [CrossRef] [PubMed]
- Hollnagel, E.; Woods, D.D. Joint Cognitive Systems: Foundations of Cognitive Systems Engineering; CRC Press: Boca Raton, FL, USA, 2005. [Google Scholar]
- Beyer, H.; Holtzblatt, K. Contextual design. Interactions 1999, 6, 32–42. [Google Scholar] [CrossRef]
- Zakaria, M.; Aoun, C.; Liginlal, D. Objective Sustainability Assessment in the Digital Economy: An Information Entropy Measure of Transparency in Corporate Sustainability Reporting. Sustainability 2021, 13, 1054. [Google Scholar] [CrossRef]
- Loew, E.; Erichsen, G.; Liang, B.; Postulka, M.L. Corporate Social Responsibility (CSR) and Environmental Social Governance (ESG)–Disclosure of European Banks (3 February 2021); European Banking Institute Working Paper Series 2021-No. 83; EBI: Frankfurt am Main, Germany, 2021; Available online: https://ssrn.com/abstract=3778674 (accessed on 16 September 2021).
- Azmi, W.; Hassan, M.K.; Houston, R.; Karim, M.S. ESG activities and banking performance: International evidence from emerging economies. J. Int. Financ. Markets. Inst. Money 2021, 70, 101277. [Google Scholar] [CrossRef]
- Saygili, E.; Arslan, S.; Birkan, A.O. ESG practices and corporate financial performance: Evidence from Borsa Istanbul. Borsa Istanb. Rev. 2021. [Google Scholar] [CrossRef]
- Wang, D.; Li, X.; Tian, S.; He, L.; Xu, Y.; Wang, X. Quantifying the dynamics between environmental information disclosure and firms’ financial performance using functional data analysis. Sustain. Prod. Consum. 2021, 28, 192–205. [Google Scholar] [CrossRef]
- Abdi, Y.; Li, X.; Càmara-Turull, X. Exploring the impact of sustainability (ESG) disclosure on firm value and financial performance (FP) in airline industry: The moderating role of size and age. Environ. Dev. Sustain. 2021, 1–28. [Google Scholar] [CrossRef]
- Wang, S.; Wang, H.; Wang, J.; Yang, F. Does environmental information disclosure contribute to improve firm financial performance? An examination of the underlying mechanism. Sci. Total Environ. 2020, 714, 136855-10. [Google Scholar] [CrossRef] [PubMed]
- Atan, R.; Razali, F.A.; Said, J.; Zainun, S. Environmental, social and governance (ESG) disclosure and its effect on firm’s performance: A comparative study. Int. J. Econ. Manag. 2006, 10, 355–375. [Google Scholar]
- Xie, J.; Nozawa, W.; Yagi, M.; Fujii, H.; Managi, S. Do environmental, social, and governance activities improve corporate financial performance? Bus. Strategy Environ. 2019, 28, 286–300. [Google Scholar] [CrossRef] [Green Version]
- Gangi, F.; Daniele, L.M.; Varrone, N. How do corporate environmental policy and corporate reputation affect risk-adjusted financial performance? Bus. Strategy Environ. 2020, 29, 1975–1991. [Google Scholar] [CrossRef]
- Melo, T.; Garrido-Morgado, A. Corporate reputation: A combination of social responsibility and industry. Corp. Soc. Responsib. Environ. Manag. 2012, 19, 11–31. [Google Scholar] [CrossRef]
- Hagendorff, J.; Clacher, I. Do Announcements about Corporate Social Responsibility Create or Destroy Shareholder Wealth? Evidence from the UK. J. Bus. Ethics 2012, 106, 253–266. [Google Scholar] [CrossRef]
- Germain, L.; Galy, N.; Lee, W. Corporate governance reform in Malaysia: Board size, independence and monitoring. J. Econ. Bus. 2014, 75, 126–162. [Google Scholar] [CrossRef]
- Arayssi, M.; Jizi, M.; Tabaja, H.H. The impact of board composition on the level of ESG disclosures in GCC countries. Sustain. Account. Manag. Policy J. 2020, 11, 137–161. [Google Scholar] [CrossRef]
- Linkov, I.; Trump, B.D.; Poinsatte-Jones, K.; Florin, M.-V. Governance Strategies for a Sustainable Digital World. Sustainability 2018, 10, 440. [Google Scholar] [CrossRef] [Green Version]
- Yu, E.P.Y.; Van Luu, B.; Chen, C.H. Greenwashing in environmental, social and governance disclosures. Res. Int. Bus. Financ. 2020, 52, 101192. [Google Scholar] [CrossRef]
- Albitar, K.; Hussainey, K.; Kolade, N.; Gerged, A.M. ESG disclosure and firm performance before and after IR: The moderating role of governance mechanisms. Int. J. Account. Inf. Manag. 2020, 28, 429–444. [Google Scholar] [CrossRef]
- Wu, J.; Li, P.; Qian, H.; Chen, J. On the sensitivity of entropy weight to sample statistics in assessing water quality: Statistical analysis based on large stochastic samples. Environ. Earth Sci. 2015, 74, 2185–2195. [Google Scholar] [CrossRef]
- Yan, F.; Qian, B.; Xiao, X. Geo-accumulation vector model for evaluating the heavy metal pollution in the sediments of Western Dongting Lake. J. Hydrol. 2019, 567, 112–124. [Google Scholar]
- Yan, F.; Qiao, D.Y.; Qian, B. Improvement of CCME WQI using grey relational method. J. Hydrol. 2019, 543, 316–323. [Google Scholar] [CrossRef]
- Kumar, R.; Singh, S.; Bilga, P.S.; Jatin, K.; Singh, J.; Singh, S.; Pruncu, C.I. Revealing the benefits of entropy weights method for multi-objective optimization in machining operations: A critical review. J. Mater. Res. Technol. 2021, 10, 1471–1492. [Google Scholar] [CrossRef]
- Mustajoki, J.; Hämäläinen, R.P.; Marttunen, M. Participatory multicriteria decision analysis with Web-HIPRE: A case of lake regulation policy. Environ. Model. Softw. 2004, 19, 537–547. [Google Scholar] [CrossRef]
- Zhang, X.; Wang, C.; Li, E.; Xu, C. Assessment Model of Eco-environmental Vulnerability Based on Improved Entropy Weight Method. Sci. World J. 2014, 7, 653. [Google Scholar]
- Wang, Q.; Wu, C.; Sun, Y. Evaluating corporate social responsibility of airlines using entropy weight and grey relation analysis. J. Air Transp. Manag. 2015, 42, 55–62. [Google Scholar] [CrossRef]
- Connellan, C.; Gez, M.; Kerschner, S.; MacLennan, J. ESG Takes Center Stage Amid Economic Crisis and Social Unrest, White & Case. 2020. Available online: https://mergers.whitecase.com/highlights/esg-takes-center-stage-amid-economic-crisis-and-social-unrest#! (accessed on 21 May 2021).
Figure 1.
Relative entropy reduction in the environmental pillar.

Figure 2.
Relative entropy reduction in the social pillar.

Figure 3.
Relative entropy reduction in governance pillar.

Table 1.
Dow 30 entropy results for the comprehensive ESG disclosure score and sub-levels (environmental disclosure score, social disclosure score, and governance disclosure score).
Table 1.
Dow 30 entropy results for the comprehensive ESG disclosure score and sub-levels (environmental disclosure score, social disclosure score, and governance disclosure score).
| Index | Entropy |
|---|---|
| ESG Disclosure Score | 90.50% |
| Environmental Disclosure Score | 91.40% |
| Social Disclosure Score | 90.47% |
| Governance Disclosure Score | 101.99% |
Table 2.
Student T-test for ESG entropy pillar combinations.
| Pillar | p Value | |
|---|---|---|
| E/S | 0.667392 | No statistical difference |
| E/G | 0.005228 *** | Statistical difference |
| S/G | 0.004076 *** | Statistical difference |
*** indicates a statistically significant at 0.01 significance level.
Table 3.
Regression results of comprehensive ESG disclosure score entropy regressed on environmental, social, and governance disclosure score entropies.
Table 3.
Regression results of comprehensive ESG disclosure score entropy regressed on environmental, social, and governance disclosure score entropies.
| SUMMARY OUTPUT | ||||||||
| Regression Statistics | ||||||||
| Multiple R | 0.64318 | |||||||
| R Square | 0.41369 | |||||||
| Adjusted R Square | 0.34333 | |||||||
| Standard Error | 0.03569 | |||||||
| Observations | 29 | |||||||
| ANOVA | ||||||||
| df | SS | MS | F | Significance F | ||||
| Regression | 3 | 0.02 | 0.007 | 5.87 | 0.003 | |||
| Residual | 25 | 0.03 | 0.001 | |||||
| Total | 28 | 0.05433 | ||||||
| Coefficients | Standard Error | t Stat | p-value | Lower 95% | Upper 95% | Lower 95.0% | Upper 95.0% | |
| Intercept | 0.6440 | 0.149 | 4.30 | 0.0002 | 0.335 | 0.952 | 0.335 | 0.952 |
| Environment | 0.2605 | 0.101 | 2.57 | 0.016 | 0.052 | 0.468 | 0.052 | 0.468 |
| Social | 0.0986 | 0.088 | 1.11 | 0.275 | −0.08 | 0.280 | −0.08 | 0.280 |
| Governance | −0.065 | 0.046 | −1.40 | 0.170 | −0.16 | 0.030 | −0.16 | 0.030 |
Publisher’s Note: MDPI stays neutral with regard to jurisdictional claims in published maps and institutional affiliations. |
© 2021 by the authors. Licensee MDPI, Basel, Switzerland. This article is an open access article distributed under the terms and conditions of the Creative Commons Attribution (CC BY) license (https://creativecommons.org/licenses/by/4.0/).
Share and Cite
MDPI and ACS Style
Hassani, H.; Unger, S.; Entezarian, M.R. Information Content Measurement of ESG Factors via Entropy and Its Impact on Society and Security. Information 2021, 12, 391. https://0-doi-org.brum.beds.ac.uk/10.3390/info12100391
AMA Style
Hassani H, Unger S, Entezarian MR. Information Content Measurement of ESG Factors via Entropy and Its Impact on Society and Security. Information. 2021; 12(10):391. https://0-doi-org.brum.beds.ac.uk/10.3390/info12100391
Chicago/Turabian StyleHassani, Hossein, Stephan Unger, and Mohammad Reza Entezarian. 2021. "Information Content Measurement of ESG Factors via Entropy and Its Impact on Society and Security" Information 12, no. 10: 391. https://0-doi-org.brum.beds.ac.uk/10.3390/info12100391
Note that from the first issue of 2016, this journal uses article numbers instead of page numbers. See further details here.