
Tool for Measuring Productivity in Software Development Teams


1
Department of Computer Science, University of Brasília (UnB), P.O. Box 4466, Brasília 70910-900, Brazil
2
Computer Science Department, Federal Institute of Paraná (IFPR), Curitiba 80000-000, Brazil
*
Author to whom correspondence should be addressed.
†
These authors contributed equally to this work.
Information 2021, 12(10), 396; https://0-doi-org.brum.beds.ac.uk/10.3390/info12100396
Submission received: 28 July 2021
/
Revised: 6 September 2021
/
Accepted: 8 September 2021
/
Published: 27 September 2021
Abstract
:Despite efforts to define productivity, there is no consensus in the software industry regarding what the term productivity means and, instead of having only one metric or factor that describes productivity, it is defined by a set of aspects. Our objective is to develop a tool that supports the productivity measurement of software development teams according to the factors found in the literature. We divided these factors into four groups: People, Product, Organization, and Open Source Software Projects. We developed a web system containing the factors that influence productivity identified in this work, called Productive, to support software development teams in measuring their productivity. After developed the tool, we monitored its use over eight weeks with two small software development teams. From the results, we found that software development companies can use the system to support monitoring team productivity. The results also point to an improvement in productivity while using the system, and a survey applied to users demonstrates the users’ positive perception regarding the results obtained. In future work, we will monitor the use of the tool and investigate the users’ perceptions in other project contexts.
1. Introduction
Productivity management in companies has become increasingly crucial in an environment of external openness and globalization of business. Without knowing their productivity, it is unlikely that a company will be successful or even survive in the market [1]. Ishizaka et al. [2] stated that, considering the current increasingly globalized context and the huge amount of data present in the daily life of a company, decision-makers have more than ever the need to manage their business efficiently and productively. For this reason, the theme has been discussed in works from different contexts, such as academy [3,4], computing [5], public services [6], economics [7,8], forest conservation [9], and software development teams [10,11,12,13,14].
In the context of software development, productivity is related to the concepts of efficiency and effectiveness of development processes [15]. Morasca and Russo [16] stated that productivity can be an item in the quality process. Therefore, the increase in productivity is one of the motivating sources of the process improvement programs [17]. Mizuno et al. [18] mentioned that, in a software organization, improving productivity consequently also improves issues related to deadlines, costs, and user satisfaction. Still, in the same context, Ramírez-Mora and Oktaba [19] stated that one of the main objectives in software development is to improve productivity, as organizations want to produce more software and, at the same time, reduce development costs.
Fardo [20] stated that a team’s productivity is related to how motivated its members are. The feeling of motivation is one of the consequences of the proper application of the concept of gamification, which we can understand as the use of elements characteristic of game mechanics outside this context as a way of solving problems and motivating a specific target audience [21].
When analyzing the literature, it is possible to see several definitions for the term productivity and factors described as influential on it [5,19,22]. According to Tangen [23], there is no consensus in the industry regarding what productivity means. Therefore, in this work, we used the concept for productivity presented by Sadowski et al. [5], which states that there is no single metric or factor that defines productivity but a set of factors.
Given the context described, we developed a web system to assist organizations and development teams in measuring productivity in software development. This system uses the influencing factors identified in the literature as parameters to perform the measurement and uses the benefits of gamification to motivate participants in the measurement process.
This research was carried out in four stages: 1. The first stage consisted of a literature review to identify the factors that influence productivity. 2. In this stage, we applied a questionnaire where software development teams evaluated these factors. The developed system used the result of the questionnaire to weigh a factor when measuring productivity. We analyzed the target audience characteristics to find appropriate gamification techniques to motivate the system users. From that, we defined the gamification project. 3. The third step consisted of developing the application. 4. Lastly, a case study was planned and implemented.
We organized this work as follows. Section 2 contains a contextualization of the related subjects to this research. Section 3 describes the research methodology and details the processes used in the theoretical study, planning, construction, and case study. Section 4 presents the details of the developed system as well as the result of its use. Section 5 shows some threats to the validity of this work. Lastly, Section 6 presents the conclusions and future work.
2. Background
2.1. Productivity
The existing competitiveness in the software production industry requires shorter delivery times for the products produced and, in such a way, creates the need to increase the teams’ performance so that companies can remain in the market [22]. In addition, the number of demands related to software development has grown faster than the number of new professionals, and for this reason, optimizing the productivity of existing professionals is of paramount importance [24]. Kemerer [24] stated that, in this context, improving productivity means producing the same systems with a reduced number of resources. In addition to that, Ramírez-Mora and Oktaba [19] stated that one of the main goals in development is to improve productivity as organizations want to produce more software and, at the same time, reduce development costs.
In the context of software development, Graziotin and Fagerholm [25] pointed out that the link between happiness and productivity is real and claimed that the factors that make team members most unhappy are low cognitive performance, mental malaise, low motivation, withdrawal/denial of work, delays, procedural deviations, low code quality, destruction of produced code, flow break, and low productivity. The authors concluded that lower productivity causes unhappiness and that unhappiness causes low productivity.
We can also describe productivity in software development by the relationship between the size of the software delivered (input from the development process) and the effort spent in building the software (output from the development process). Therefore, the general productivity equation is given by productivity = size/effort [12,26,27]. As stated by Delaney and Schmidt [28], such a definition cannot be applied universally. On the other hand, Sadowski et al. [5] stated that we see productivity through different lenses:
- Stakeholders: different stakeholders can value a different set of characteristics and objectives;
- Context: the particularities of the project and the social and cultural characteristics of the context can change the perception of productivity. For example, if developers feel that helping others is an action valued by the team, they will feel that spending time helping others is productive;
- Level: individuals, teams, organizations, and communities have different perceptions of productivity. For example, under the view of a developer, refactoring a module of a system that is already working can be considered productive and can be understood as unproductive by other team members;
- Period: a process change can slow down the development in the present but lead to improved team learning over time. Likewise, short-term speed improvements can lead to fatigue and less developer satisfaction over a long period.
In this work, we use the concept for productivity presented by Sadowski et al. [5]. The authors stated in their work (which aimed to develop a framework to conceptualize productivity in software development) that there is no metric or factor that defines productivity precisely but rather a set of factors. In that work, they considered only three factors: speed, quality, and satisfaction.
2.2. Gamification
According to Schlemmer [21], gamification consists of using elements characteristic of game mechanics outside of such games as a way of solving problems and motivating a specific target audience. Navarro [29], in a similar definition, stated that it is the application of elements, mechanisms, dynamics, and techniques of games in a context external to the games, that is, in the individual’s professional, school, or social life. Fardo [20] emphasized that gamification does not imply creating a game that addresses the problem.
According to Zichermann and Cunningham [30], the main idea behind a gamified system is that the user can use intrinsic (such as competition and cooperation) and external stimuli (such as points, levels, missions, and rankings) to carry out the proposed tasks. We can perceive the possibility of using gamification in varied contexts because there are currently several works and publications related to gamified processes involving areas such as physics, math, pedagogy, biology, languages, story, and chemistry [31].
Concerning ways of applying gamification, the Octalysis framework is widely used. This framework aims to facilitate the gamification of processes through the analysis of four aspects that influence people: additives (by providing rewards and providing pleasant feelings), subtractive (by providing motivation generated by the fear that something will happen), intrinsic (elements internal to the individual that influence his motivation, such as self-realization and self-esteem), and extrinsic (external to the individual that affects his motivation) [32]. Chou [32] presented Octalysis divided into eight core drives aimed at motivating people:
- C1—Epic Meaning and Calling: seeks to give the person the conviction that he/she is doing something greater than themself or has been chosen to take action.
- C2—Development and Accomplishment represents the internal impulse of the human being to progress, develop skills, achieve mastery and overcome challenges.
- C3—Empowerment of Creativity and Feedback: this happens when users are engaged in a creative process where new things or new combinations are constantly being discovered.
- C4—Social Influence and Relatedness: this core drive contains the social elements that motivate people, such as orientation, social acceptance, social feedback, companionship, competition, envy.
- C5—Unpredictability and Curiosity: niches of people may feel more engaged by participating in unpredictable processes that stimulate their curiosity.
- C6—Loss and Avoidance are the core drive that describes the motivation generated by the will to avoid a negative event.
- C7—Scarcity and Impatience: this drive represents the motivation obtained by wanting something that you cannot easily have.
- C8–=Ownership and Possession represents the motivation obtained by owning something.
It is important to note that the effect of these core drives can be amplified or diminished according to the public profile of the gamified process. Therefore, when applying gamification, it is essential to know the target audience [32].
2.3. Related Works
The literature presents several works that, regardless of having this as their goal, report factors that influence the productivity of individuals or teams. Among these factors, the one with the most influence on the present work is that of Canedo and Santos [22], who described the factors that influence productivity in four groups (people, product, organization, and free software projects), containing a list of thirty-seven factors that influence productivity. In this same context, Oliveira et al. [14] conducted an empirical study that concluded that the most used metrics for measuring productivity are time, effort, and the number of lines of code.
Oliveira et al. [33] researched whether productivity metrics can complement team leaders’ perceptions of the topic. During their work, Oliveira et al. [33] classified metrics into two groups: code-based metrics (basically the amount of code produced) and commit-based metrics (commit activity). Their results show that the perception of leaders is generally more correlated with code-based metrics than commit-based metrics. Finally, they concluded that obtaining data on productivity metrics coupled with the perceptions of leaders can "strengthen the organization’s conviction about productive developers and can reveal productive developers not yet perceived by team leaders”.
In this work, we use the same organization of the four groups of factors presented by Canedo and Santos [22]. We also add to the list of factors other works, such as the ones developed by Graziotin and Fagerholm [25], Souza et al. [34], Murphy et al. [35], Sadowski et al. [5], and Ramírez-Mora e Oktaba [19], among others.
The literature contains several works related to gamification in the Information and Communication Technology (ICT) field. Among them, we can mention the work of Naik and Jenkins [36] that described a gamified process called "Relax, It’s a Game", which aims to teach university students the SCRUM agile development methodology. They aim for that in a simplified, more interesting, and less pressing way when compared with traditional teaching methods.
Considering Schlemmer’s statement [21] that one of the goals of gamification is to motivate the participant in the gamified process and associating this assertion with the fact that the productivity of a team is related to their motivation [37], the use of gamification can have a positive impact on productivity.
Reinforcing that, Moldon et al. [38] conducted a study where they examined how software developers’ behavior changes in response to the removal of gamification elements from GitHub. According to the authors, the change triggered significant changes in behavior. For example, long-lasting activity sequences (streaks) have been dropped and become less frequent, weekend activities have diminished, and days with developers’ contributions have become less common. Thus, this work provides evidence of the significant impact of gamification on the behavior of software developers.
In the context of gamification and productivity, Coonradt and Nelson [39] analyzed the fact that, in sports, people try harder than at work. The authors stated that the participant rarely knows the result or what they need to do to win. In addition, the authors say that recreational activities applied to the workplace promote increased productivity. The association between gamification and productivity is natural since some techniques related to gamification (such as rankings, scores, levels, and challenges) are motivational factors for productivity when used in software development [40]. A ranking, for example, when comparing the position of the players, motivates such players to be better and better (to produce more and more) [40]. In this paper, we use gamification in the implementation of the web application to engage the members of the development teams in the process of measuring and improving productivity.
Helie et al. [41] carried out work to measure productivity in software development applying machine learning techniques in a version control system. The authors calculated productivity considering three factors: quantity, quality, and size. For Helie et al. [41], the amount of work can be defined by a model that predicts the number of hours spent per change, quality is defined by a model that predicts the distribution of problems identified through a code analysis tool, and the size is inferred by the number of lines of code. The authors did not specify what issues they could point out or which code analysis tool they used. In addition, the authors described only machine learning techniques and did not present the results related to the way of use or its application in a software development context [41].
Sadowski et al. [5] proposed a framework to conceptualize productivity in software development according to three dimensions (speed, quality, and satisfaction) essential for understanding productivity. Their framework presented, therefore, seeks only to conceptualize productivity according to the three dimensions, and, consequently, processes related to its measurement are not part of the scope.
The productivity management process presented by King and Lima [42] used the Analytic Hierarchy Process (AHP), a method to assist in decision making, and through this method, allowing for the prioritization of factors by a decision-maker on a nine-point scale. This process has no pre-established factors and remains in the hands of the decision-maker, including the selection of which factors to use and the decision on how to measure them.
Ciervo el al. [43] introduced a new risk and issue management system to improve productivity, quality, and compliance in clinical trials. The authors used JIRA, a popular issue and project tracking tool for software development, in conjunction with third-party and custom plug-ins to provide the additional functionality lacking in the core product. The new system integrates issues into a single tracking tool and offers a range of features such as configurable issue management workflows, integration with other systems, reporting, and trends in a web interface. Similar to our work, the authors used a system that captures and exposes metrics that, when analyzed, can improve productivity. Unlike our work, the authors’ research does not have the specific objective of measuring productivity. Furthermore, in our work, in addition to exposing metrics, we use gamification to motivate users to use the process.
Palvalin et al. [44] introduced SmartWoW, a tool for measuring job performance in a changing environment. Similar to our proposal, SmartWoW gives its final result by evaluating factors using a scale. In SmartWoW, six factors are considered: physical environment, virtual environment, social environment, individual work practices, well-being at work, and productivity. Although they suggest that the last two factors (well-being at work and productivity) are consequences of the previous ones (physical, virtual and social environments, and individual work practices), its measurement is not an objective of the work. In the case of our tool, productivity measurement is the main focus of the work.
Finally, we mention the work of Balk [45], which presented a toolbox for calculating and decomposing total factor productivity indices called the Total Factor Productivity (TFP) Toolbox. Quantity-only indices (Malmquist and Moorsteen-Bjurek) as well as price-based indices (Fisher and Trnqvist) can be calculated and decomposed. The toolbox relies on mathematical programming techniques to calculate the different indices. Unlike TFP Toolbox, our work does not use such mathematical formulas and chooses to use factors evaluated by team members. Furthermore, in our work, we use gamification to motivate users to use the process.
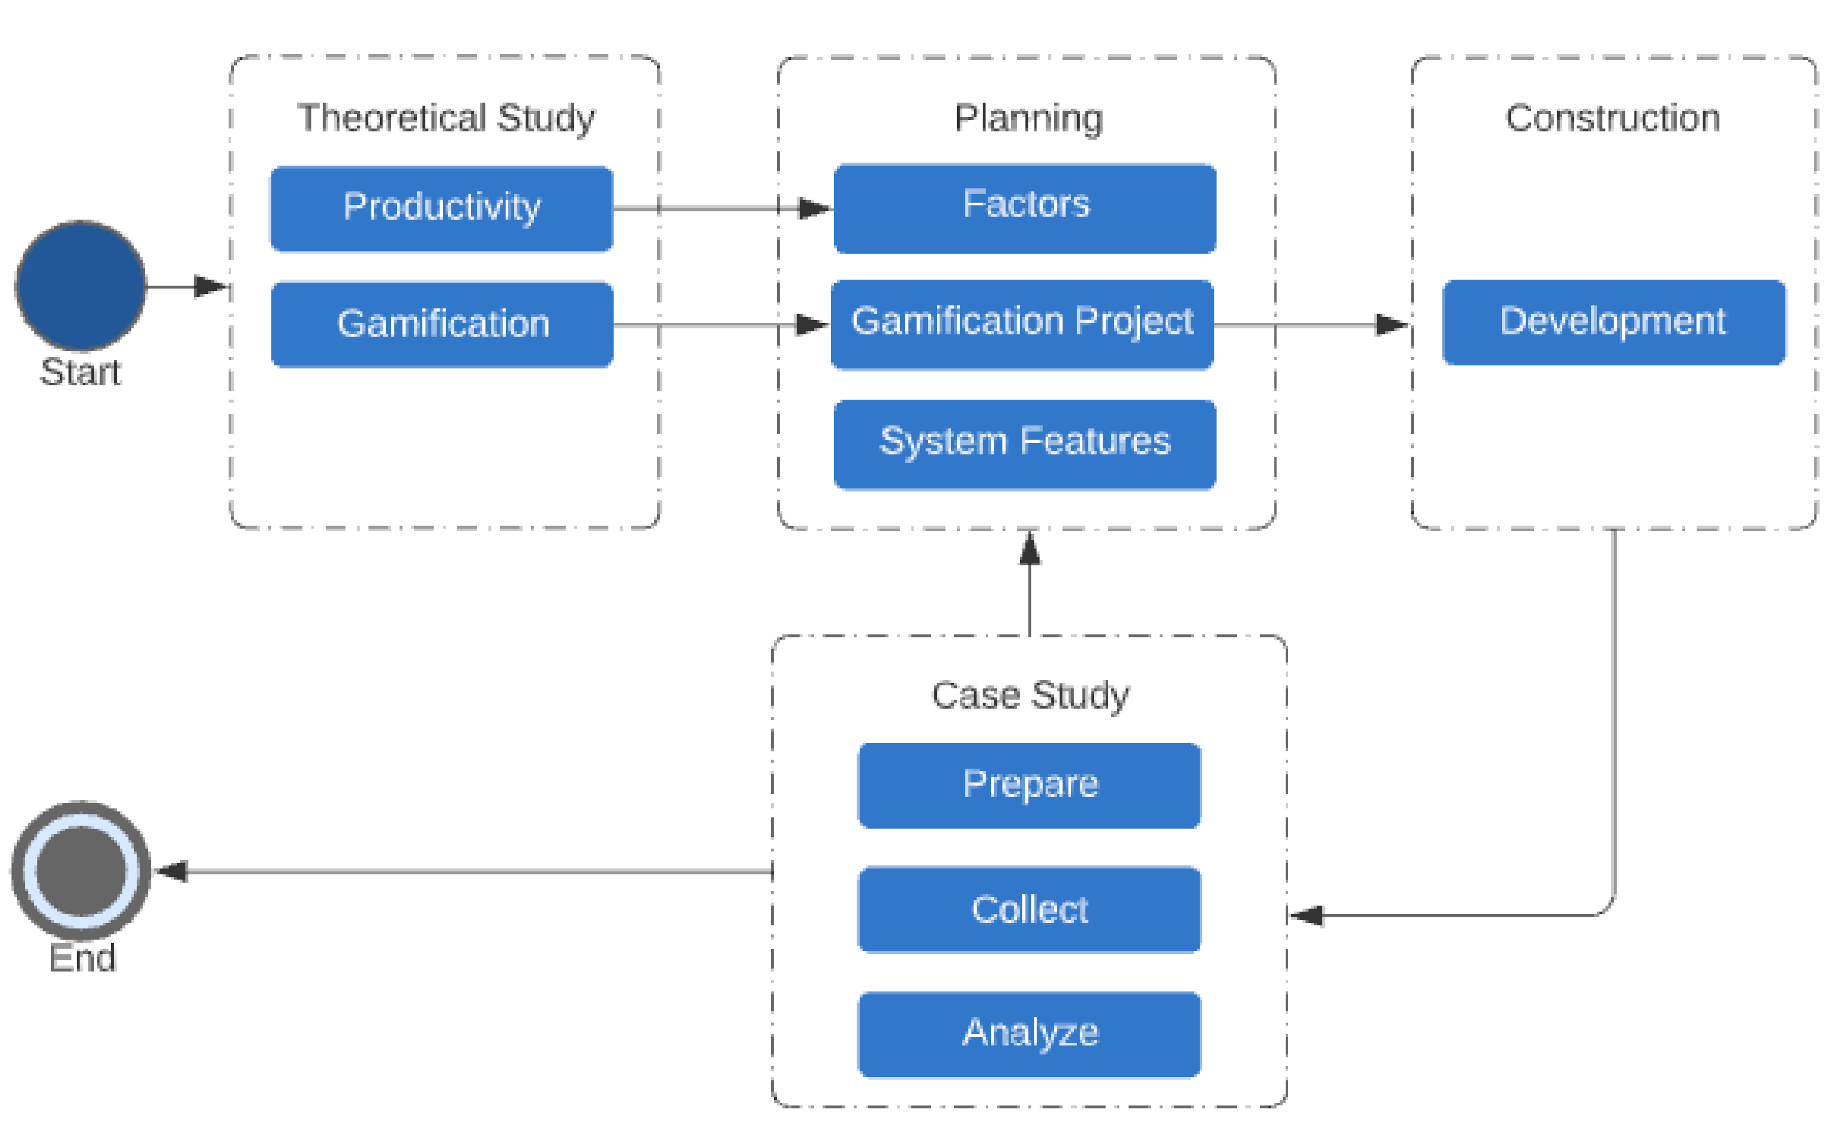
3. Study Settings
The development of this work was carried out according to the following steps: theoretical study, planning, construction, and case study, as shown in Figure 1. The following research questions were defined:
RQ.1: What is the effect on productivity assessments of adding gamification?
RQ.2: What is the perception of users concerning the productivity calculation system?
3.1. Theoretical Study
The first stage consisted of a literature review. The objective of this stage was that the context related to the research was better known, and for this reason, this was the first stage of the work.
During the theoretical study stage, we used the following sources of knowledge: articles, books, dissertations, theses, technical manuals, and web pages found from the literature review. The themes studied during this stage were productivity and gamification. To identify the factors that influence productivity, we conducted a complementary literature review on the Systematic Literature Review (SLR) carried by Canedo and Santos [22].
The main output for the next steps was the list of factors influencing productivity. This list was used extensively in later steps and is presented in Figure 2.
3.2. Planning
After carrying out the theoretical study, we started the planning phase, where we defined the identified factors, the gamification project, and the functionalities of the web system.
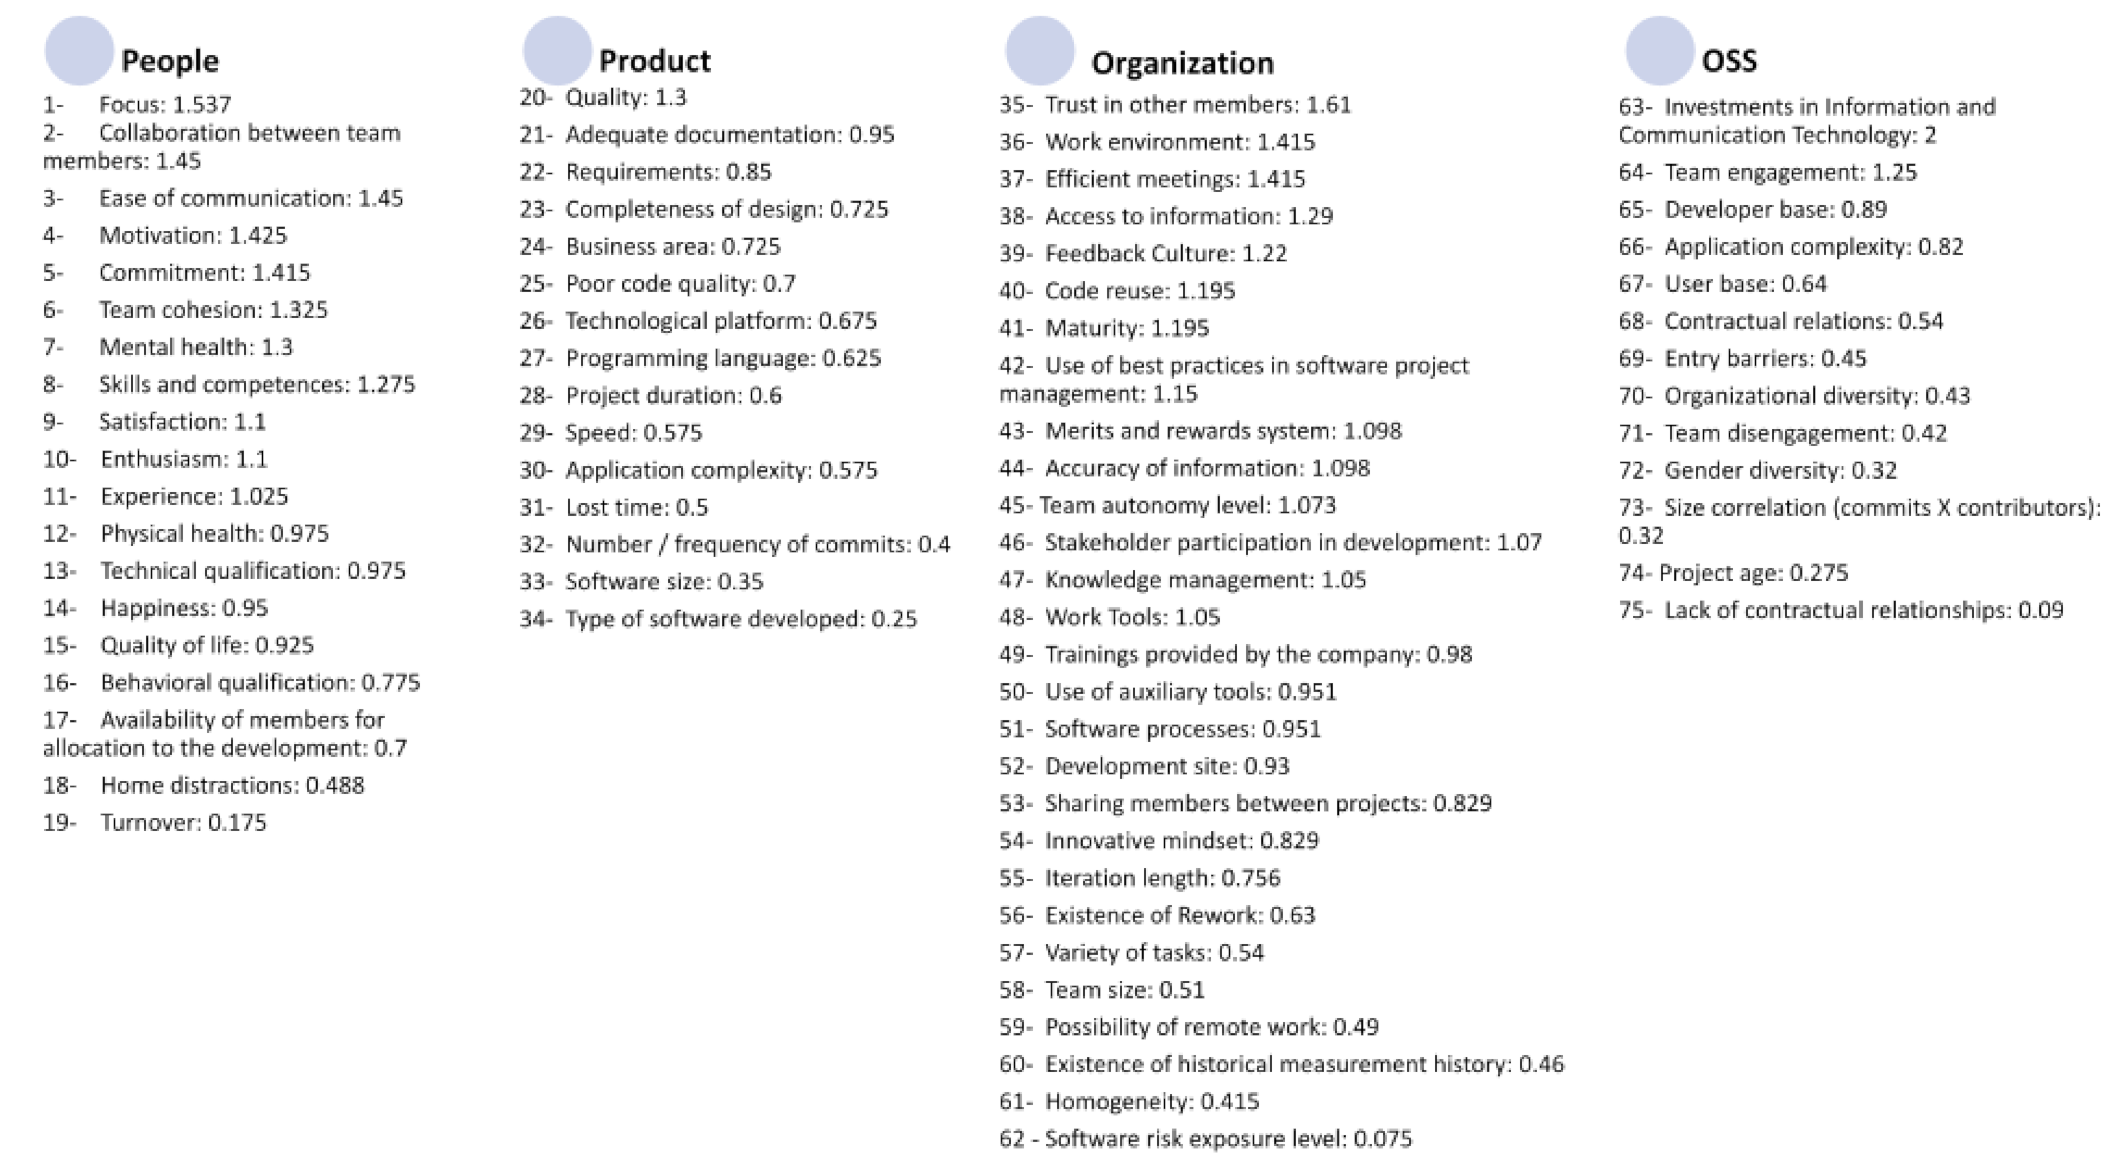
3.2.1. Identified Factors
We identified a total of seventy-five factors that influence productivity, as shown in Figure 2. The development teams assessed these factors through a survey. In total, forty-four participants rated their agreement to the factors identified in the literature, using a five-point Likert scale [46] ranging between −2 and 2. With the result, we calculate the rating of each factor using the arithmetic mean of the evaluations. That value represents the weight that each factor has in measuring the productivity of the developed system. Figure 2 shows the seventy-five factors grouped according to the classes: People, Product, Organization, and Open Source Software and organized in descending order, according to the rating. The details of each of the seventy-five factors can be consulted at the Table A1–Table A4.
3.2.2. The Gamification Project
We conducted another online survey to identify the characteristics of the software development teams to understand the target audience, which is necessary for the gamification project [32]. Sixty-nine software developers responded to this survey. Participants assessed the questions using a Likert scale [46] (between 1 and 5) how much the octalysis core drives (Section 2.2) influence themselves. In this context, the averages among all the responses ordered in descending order were 1. C5 (4,34); 2. C7 (4,26); 3. C3 (4,19); 4. C1 (4,02); 5. C2 (3,91); 6. C6 (3,78); 7. C4 (3,25); and 8. C8 (3,04).
Based on the influence of core drives on the target audience, we choose the gamification techniques applied in the web system. Chou [32] presented more than ninety gamification techniques, each associated with at least one core drive. Among these, the techniques chosen were 1. Trophy room (associated with the C5 core drive); 2. Visual storytelling (associated with the C7 core drive); and 3. Combos (associated with the C3 core drive). In addition to these three gamification techniques, the system also uses the Leaderboards technique [32] associated with the C2 core drive since this technique can be applied as a motivating factor for productivity when used in software development [40].
3.2.3. Functionalities of the Web System
In general, our measurement system can use all factors found in the literature. However, as some factors may not be relevant in a given context, the developed software allows users to add or remove these factors.
For the assessment of factors to occur as expected, our tool has the functionality of measuring productivity. In addition, to calculate productivity, our system has other resources, such as 1. user registration; 2. company registration; 3. factors registration; 4. user login; 5. trophy room; 6. leaderboards; and 7. Combos. The development and detailing of features is reported in the Section 4. Such planning sought to use the gamification techniques selected and described in Section 3.2.2.
3.3. Construction
As with other complex systems, software systems evolve, which means that functional and non-functional requirements can frequently change [47]. The incremental development model, according to Pressman [47], is an evolution of the waterfall model (traditional) where, instead of specifying and developing all the requirements at once, we work with the construction of small pieces of software separately (in iterations).
In this work, the incremental model was combined with component-based development that, according to Pressman [47], foresees the construction and use of reusable components. The modularization of the system, in turn, will help in the use of another concept: the Single Responsibility Principle (SRP), which states that each module or class must have responsibility for a single part of the functionality provided by the software [48]. The use of the SRP allows, in addition to the organization, benefits such as ease in the identification and correction of errors, since the code is more granular [49]. In addition, we built the entire system following test-oriented modeling. This approach incorporates consistency and semantics checks during system engineering and therefore helps to produce high-quality models [50].
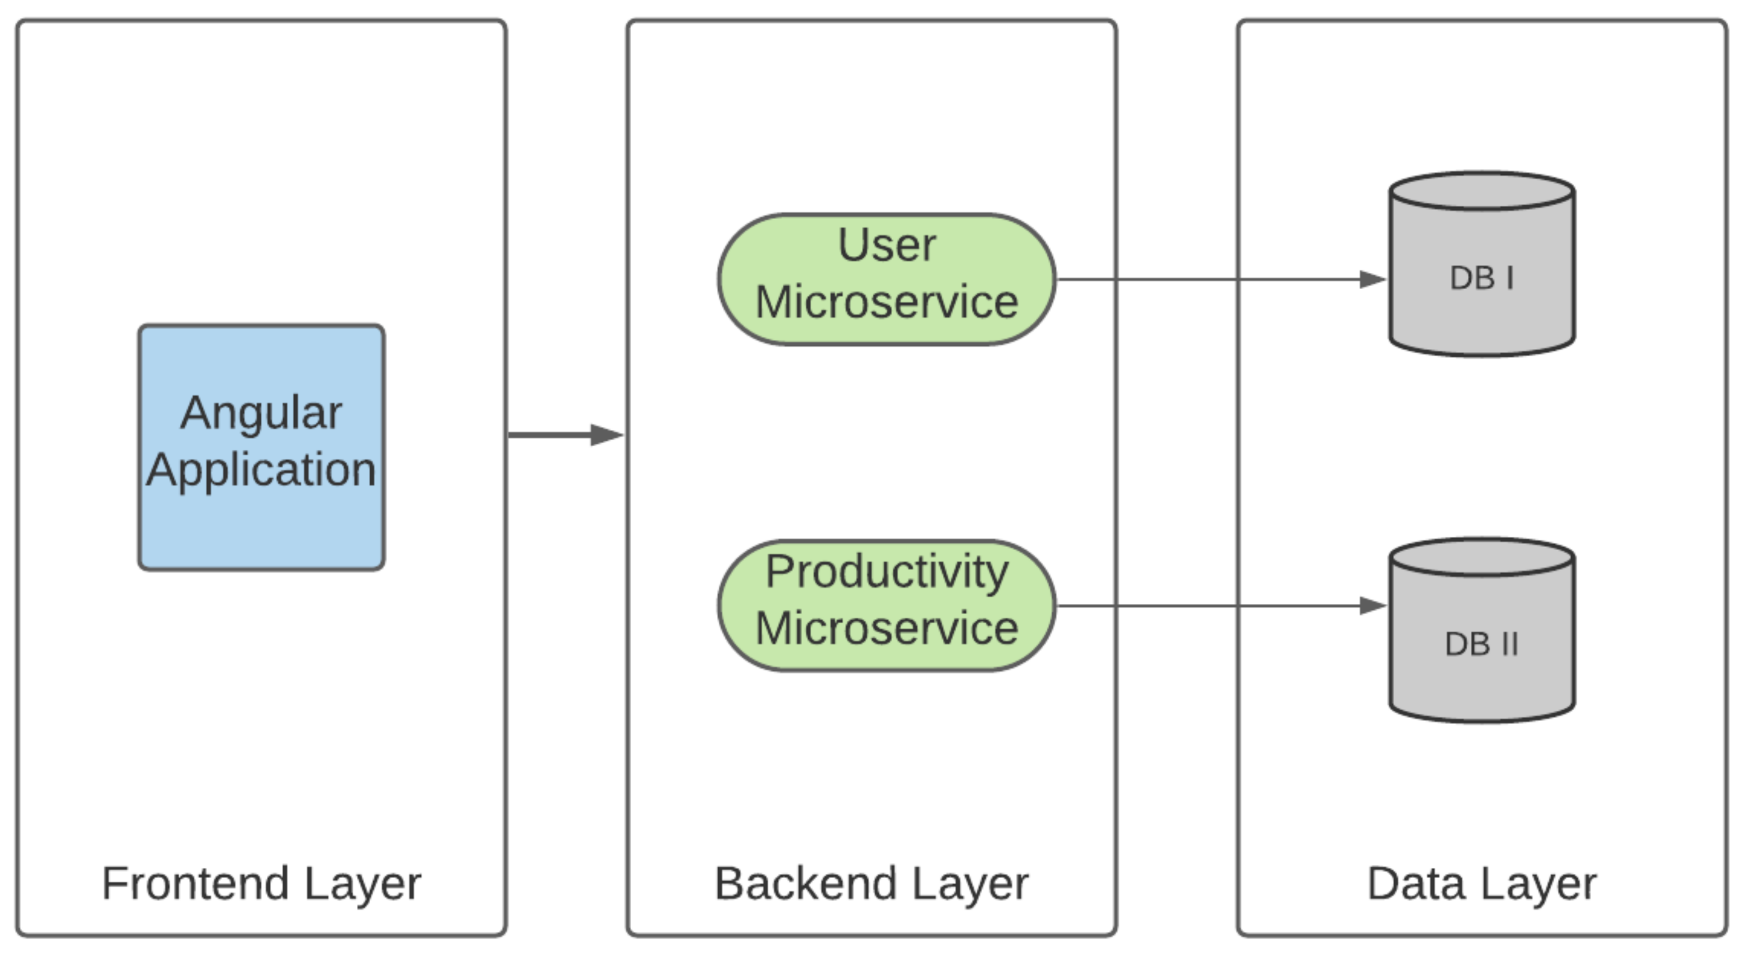
Figure 3 represents the architecture of the open-source system we developed. Such a system can be divided into the three conceptual layers described below.
- Frontend Layer: where is the application developed with Angular, a framework created by Google developers to build the application interface using HTML, CSS, and JavaScript (https://angular.io/). The code for this layer is available on GitHub.
- Backend Layer: layer which contains the two microservices built in this work. The “User Microservice“ (code available on GitHub)) is responsible for all operations related to user registration, while the “Productivity Microservice“ (also available on GitHub) is responsible for operations related to the calculation of productivity. Microservices architecture is used as an alternative to monolithic applications because they are simpler to scale, are more flexible, and allow for different contexts to be handled in different code units [51]. The language used to build the microservices was Java with the Spring framework that “makes programming in Java faster, easier and safer”, in addition to being the most popular Java framework in the world (https://spring.io/why-spring/).
- Data Layer: we used the microservices architecture in conjunction with the Database per Service pattern that helps ensure that services are loosely coupled and that changes to a service’s database do not affect any other service. The DBMS (Database Management System) selected was PostgreSQL, which “is a powerful open source object-relational database system” (https://www.postgresql.org/).
As for the features developed and related iterations, Table 1 contains a relationship where the first column represents the functionality and the second column represents the iteration.
3.4. Case Study
We conducted a case study with two software development teams. The teams had a total of four participants each, totaling eight participants. Among the participants, six were developers and two were project managers. The development methodology used by the two teams was agile, but they did not follow a specific one (such as Scrum [52]). Instead, the teams incorporated elements they judged to be positive, such as the daily meeting of up to 30 min (instead of the 15 provided in Scrum); sprints with their size defined by the backlog desired by the client (varied duration); and a peer review. The sprint tasks were organized in a three-column Kanban board: To Do, Doing, and Done.
One of the projects had its development started in April 2019 (here, called Team 1). Until the application of the case study of this work, they used no form of productivity measurement. The second project (here, called Team 2) started in February 2021.
When the case study started, Team 1’s project already had several deliveries to the customer and was nearing the end of its planned development phase. After that, the sustain phase started. However, for the two projects to be evaluated in more similar scenarios, the productivity measurement only took place until the completion of the development stage. The second project (from Team 2) had the productivity measurement started in the first months of its implementation, during the development stage.
Another characteristic of the two teams is that they both work remotely. Team 1 contained people who worked face-to-face together and started working remotely in March 2020. Team 2 had people who have never met face-to-face and who, since its inception (in February 2021), had worked exclusively remotely. All participants of both teams were Brazilians residing in Brazil and living in different states.
Table 2 presents the demographic information of the development teams. Through Table 2 it is possible to see that Team 1 and Team 2 have some similar characteristics: the average experience of Team 1 is 14 years (considering “More than 30 years" with the value 30 for this calculation); while the average for Team 2 is 12 years (considering “Over 20 years” with the value 20 for this calculation); and all participants are male.
As for the people’s roles on the project, both have a manager and three people from technical roles. However, Team 1 has an integration architect (not present in Team 2), and Team 1 has no distinction between front-end and back-end developers—both developers are full-stack. Meanwhile, Team 2 has a front-end manager, a back-end manager, and a full-stack developer who works on the front-end and back-end.
Table 2 also shows the schooling degree of all participants. Team 1 consists of two graduates, a postgraduate, and a master’s student, that is, all of them have at least a college degree. The second team consists of a postgraduate, a graduate, a master’s student, and a person with only a high school education.
4. Results
Canedo and Santos [22] described a list of thirty-seven factors that influence productivity divided into four groups: People, Product, Organization, and Open Source Software projects. In our paper, we used the same grouping structure and all thirty-seven factors. However, we found in the literature and added to the list other thirty-eight factors. All seventy-five factors are detailed in the Table A1–Table A4.
- People: This group contains nineteen factors related to the characteristics of the people who participate in the software development team. The factors in this group include aspects related to the individual.
- Product: It encompasses the fifteen factors related to the characteristics of the software product itself. The factors present in this include business field, application complexity, and programming language.
- Organization: The twenty-eight factors related to the organization include work environment, knowledge management, team size, and maturity.
- Open Source Software Projects: This group of thirteen factors represents those related to free software projects. The factors of this group include investments in Information and Communication Technology (ICT), contractual relations, and team engagement.
4.1. The Application
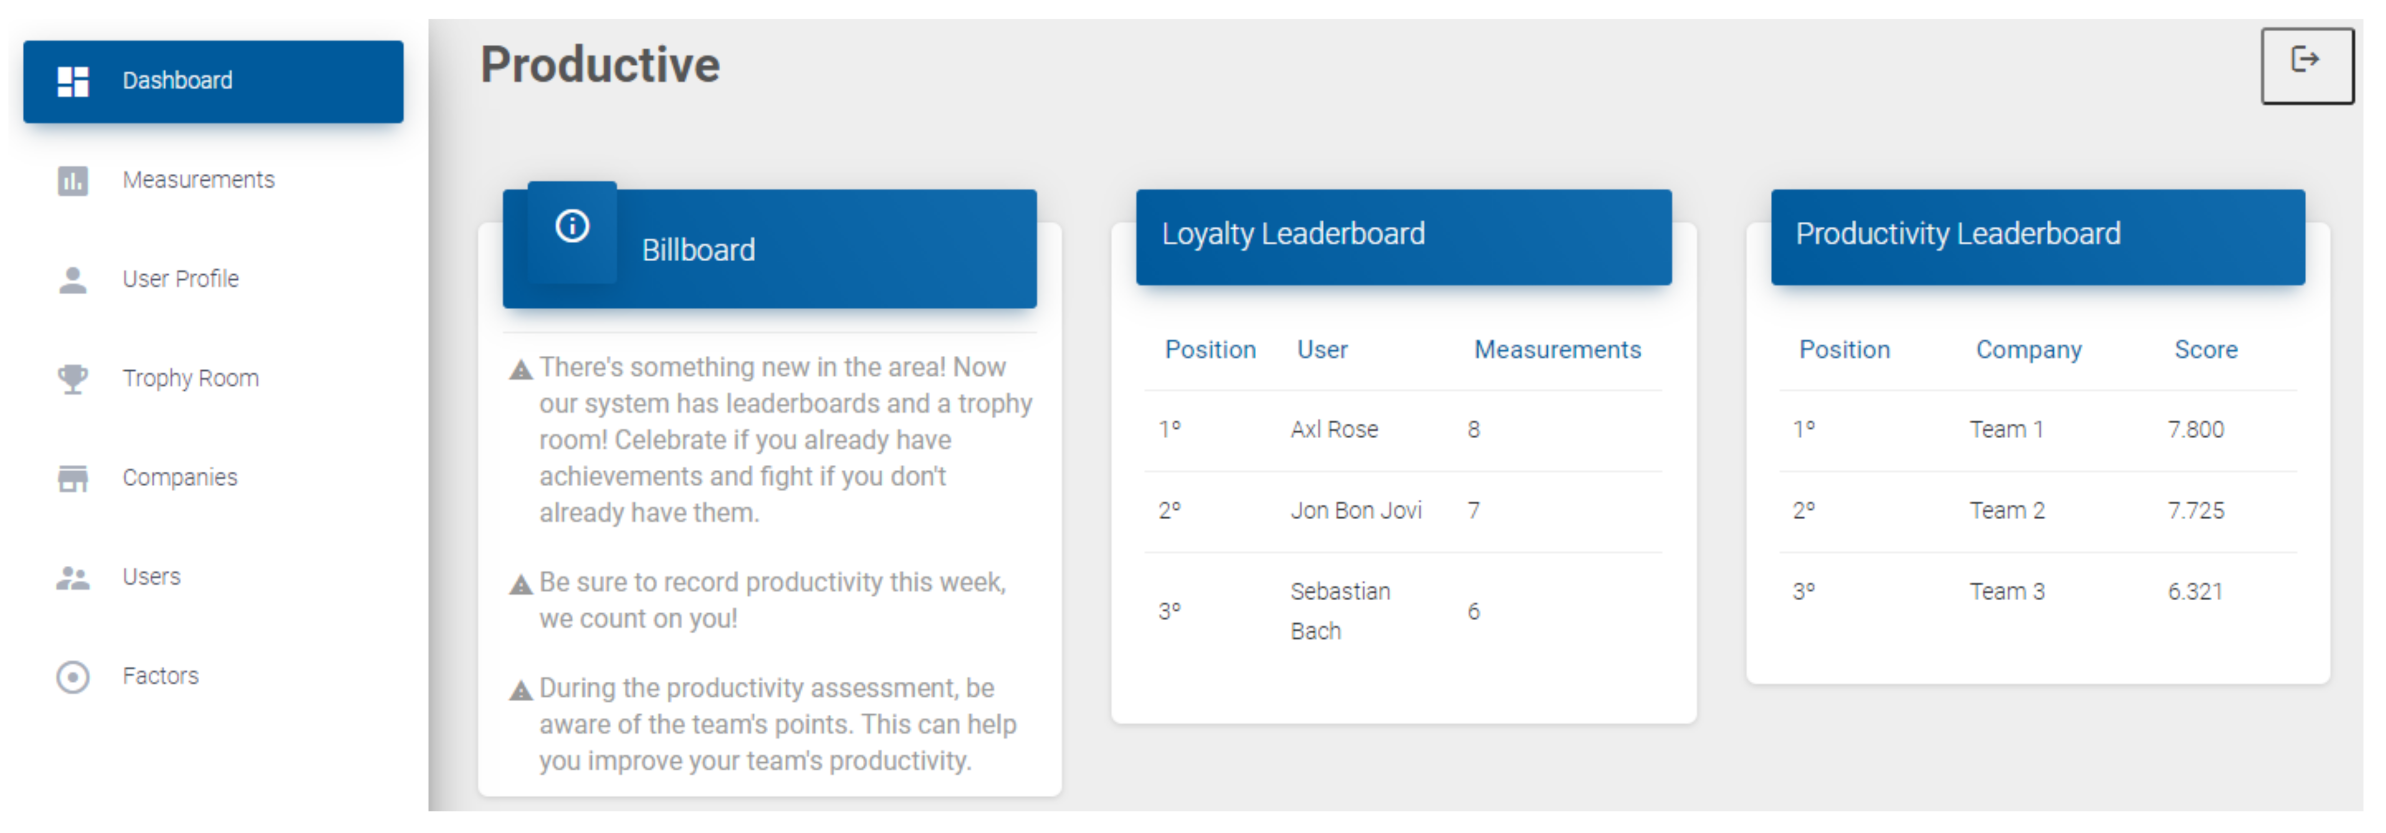
The application has a series of features that allow measuring the productivity of a team. The first is the login functionality, through which the user must enter their e-mail and password to access the application. After login, the user sees (Figure 4) a menu configured according to their permissions on the home screen. If it is a regular user, the only menus displayed will be the Dashboard, Measurements, User Profile, and Trophy Room. If it is an administrator, the system shows all of these and three others: Companies, Users, and Factors.
In addition to the menu, the screen also shows a Billboard. The role of this table is to provide information to the user in a clear and easily accessible way (as it is the first information after login) and in a way that can help motivate the user. Right after the Billboard, the screen shows the user a Loyalty Leaderboard. This feature orders the users who have contributed most to measurements since the system started. We highlight that leaderboards do not directly impact the productivity measurement and correspond to one of the gamification techniques used in this work.
The system displays the Productivity Leaderboard in the last column on the right. There is a process that generates the leaderboards for the current month. The responsible for the project can choose to execute it on the date they want. To calculate the productivity score, the system considers all productivity measurements for a development team during that period.
The company’s score consists of the arithmetic mean of all its evaluations. Besides that, there is a possible increase of 10% if the company has performed a Combo, that is if it has made measurements in all the weeks of the month. The use of Combos refers to one of the gamification techniques chosen for this project. After calculating the score, the leaderboard is assembled by sorting the respective scores in a decreasing manner, that is, from highest to lowest. It is noteworthy that, despite the process being carried out for all teams registered in the database of the Productive tool, only the first three teams with the highest score are displayed on the dashboard.
4.1.1. The Admin Features
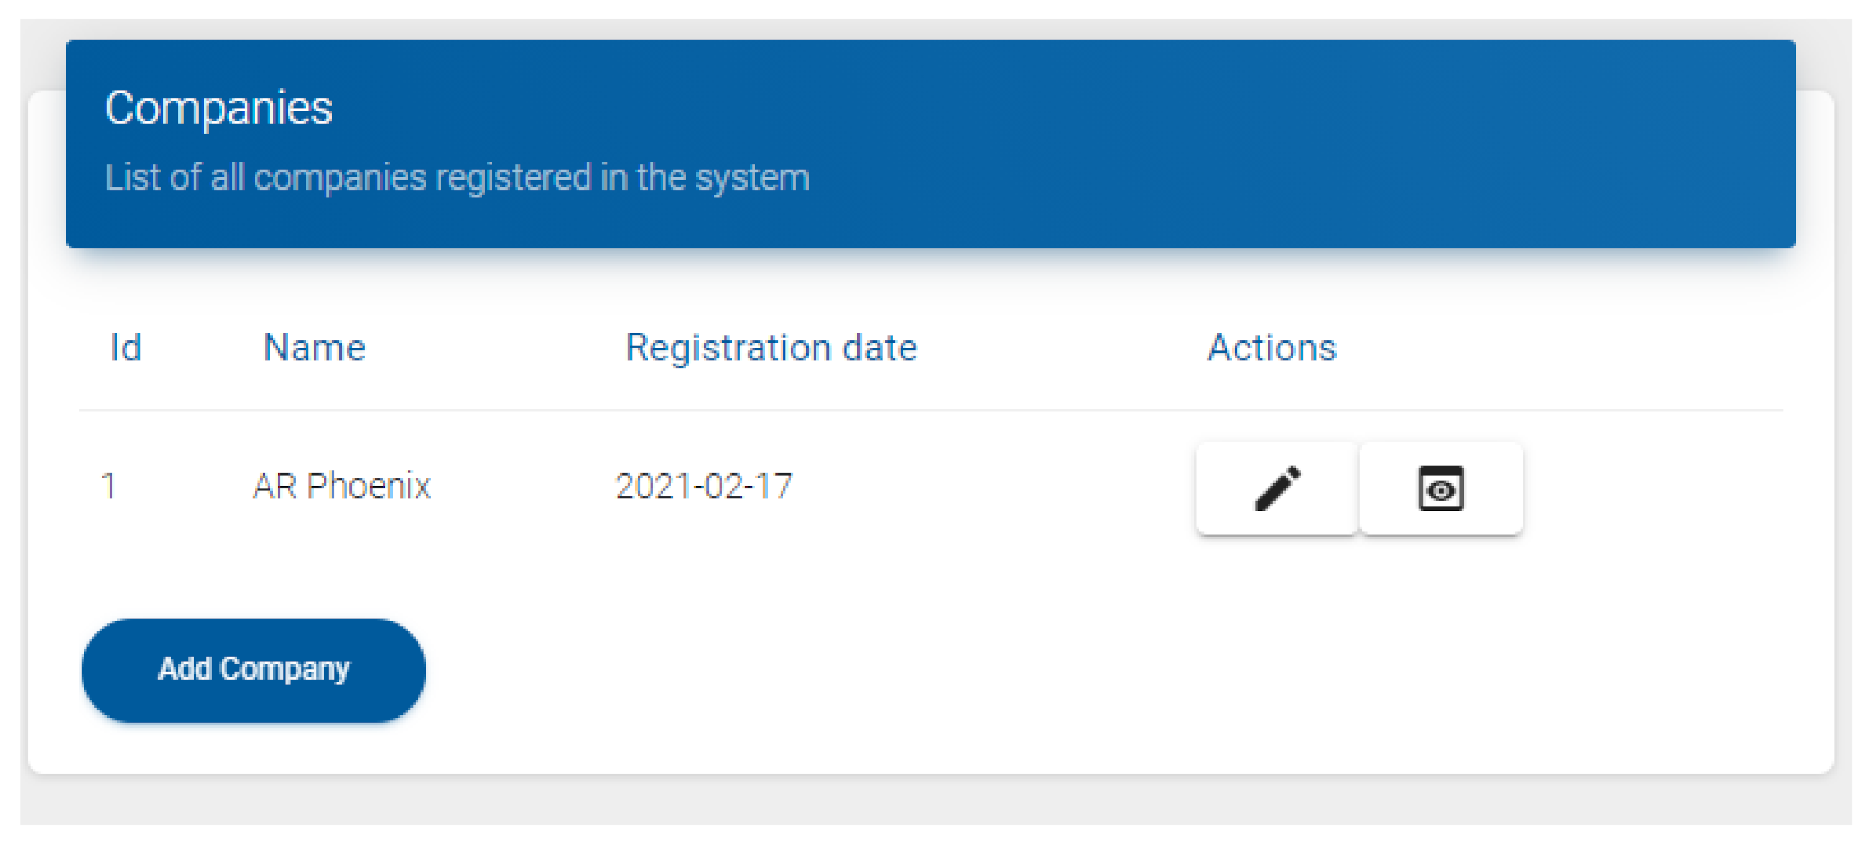
The set of administrative functionalities of the Productive tool consists of Companies, Users, and Factors. Through the Companies menu, as shown in Figure 5, the administrator user can view a list of all companies registered in the system. The user also has the possibility to add a new company. To add a new company, the user has to assign the company a name not yet used in the system. It is worth mentioning that, when adding a company, the system automatically allocates the user responsible for the addition to that company. After that, other existing users can be allocated as members of the company team.
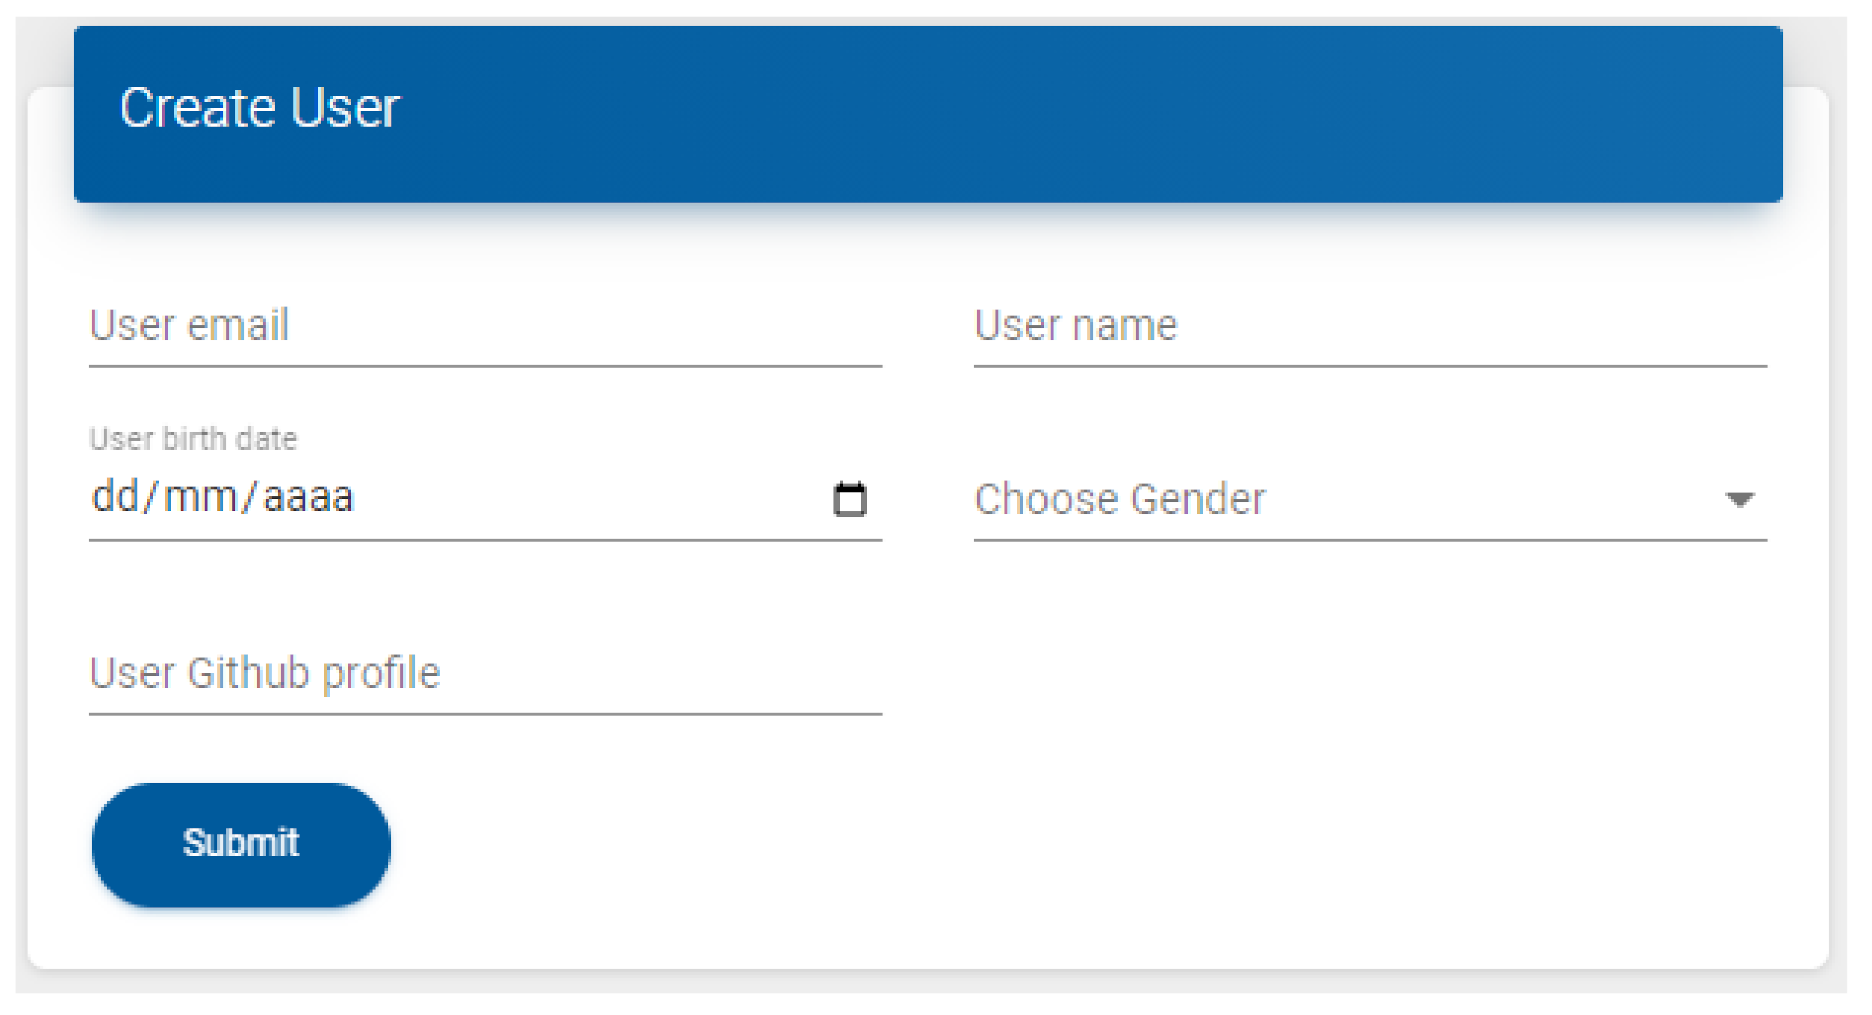
Through the Users Menu, the administrator user is able to view a list of all users registered in the system, and he/she also has the possibility to create a new item. To create a user, as shown in Figure 6, it is necessary that the user who is making the registration provide their e-mail, name, date of birth, gender, and Github profile. In addition, the system automatically sets a random password for accessing the application. It is worth mentioning that, at the time of its creation, a user still does not have an allocation to any company.
The Factors menu shows a list of all factors that influence productivity (seventy-five factors identified in the literature registered in the application. This functionality also allows the user to register new factors. Figure 7 shows the factor registration screen, where we can see that, to register a new, the user must provide a name, description, weight, the type of user responsible for registering it, and a category. Initially, the factors’ weights are the values found and presented in Section 3. In addition to the registration, a factor can also be activated or deactivated at any time in the application. When a factor is in "Inactive" status, the system will not use it when calculating new measurements.
4.1.2. Common Features
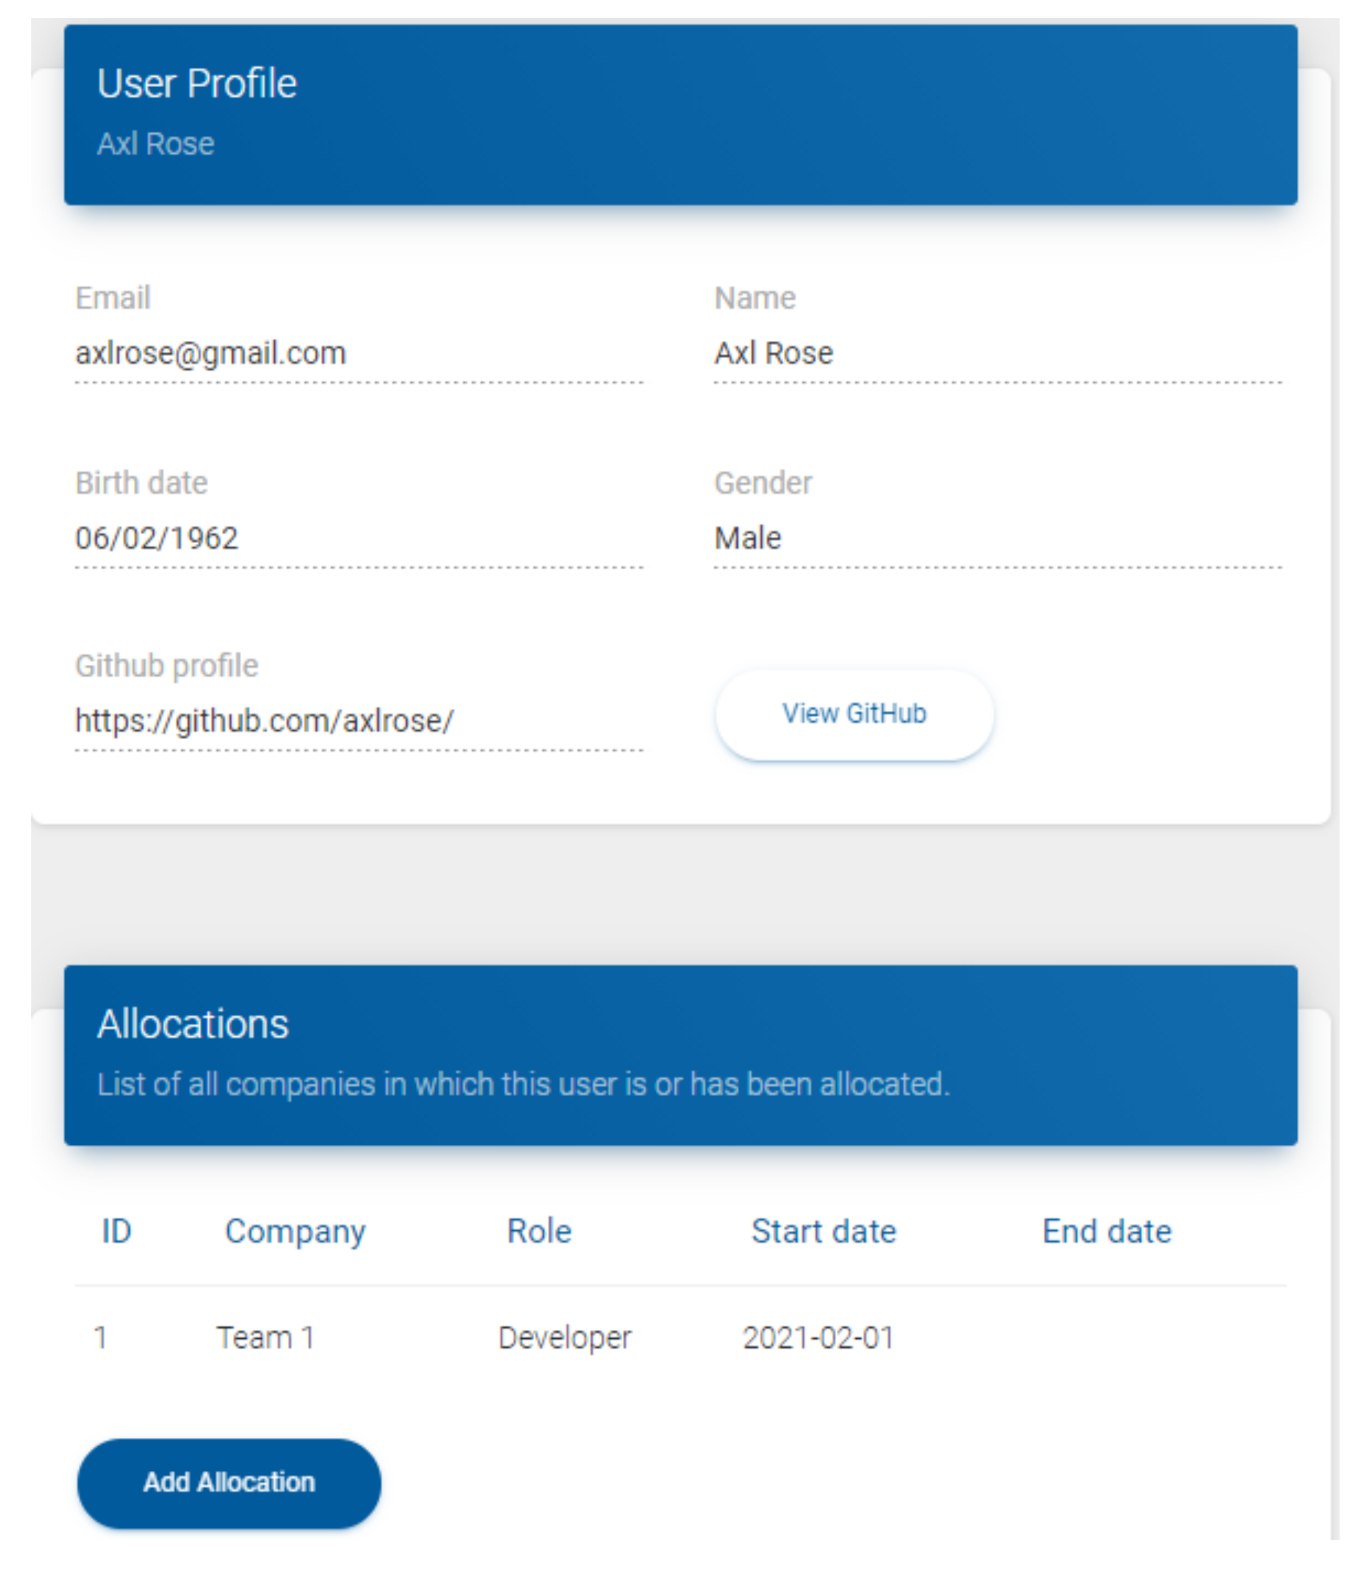
As soon as all the settings are ready, that is, all of the registered factors, a company created, users created, and allocated to a company, a common user will be able to access the system. The set of common features available consists of the Measurements, User Profile, and Trophy Room. The User Profile functionality is responsible for showing the logged-in user information related to their registration, namely name, e-mail, birth date, gender, and profile on Github.
In addition to this information, as shown in Figure 8, a list of all user allocations is also displayed. The user’s allocation represents the relationship between a user and a company. This list shows the following information: allocation ID, company name, role, start date, and end date. At the end of the allocation list, if the user has an administrator profile, the Add Allocation button is also displayed, allowing the user to add allocations to new companies.
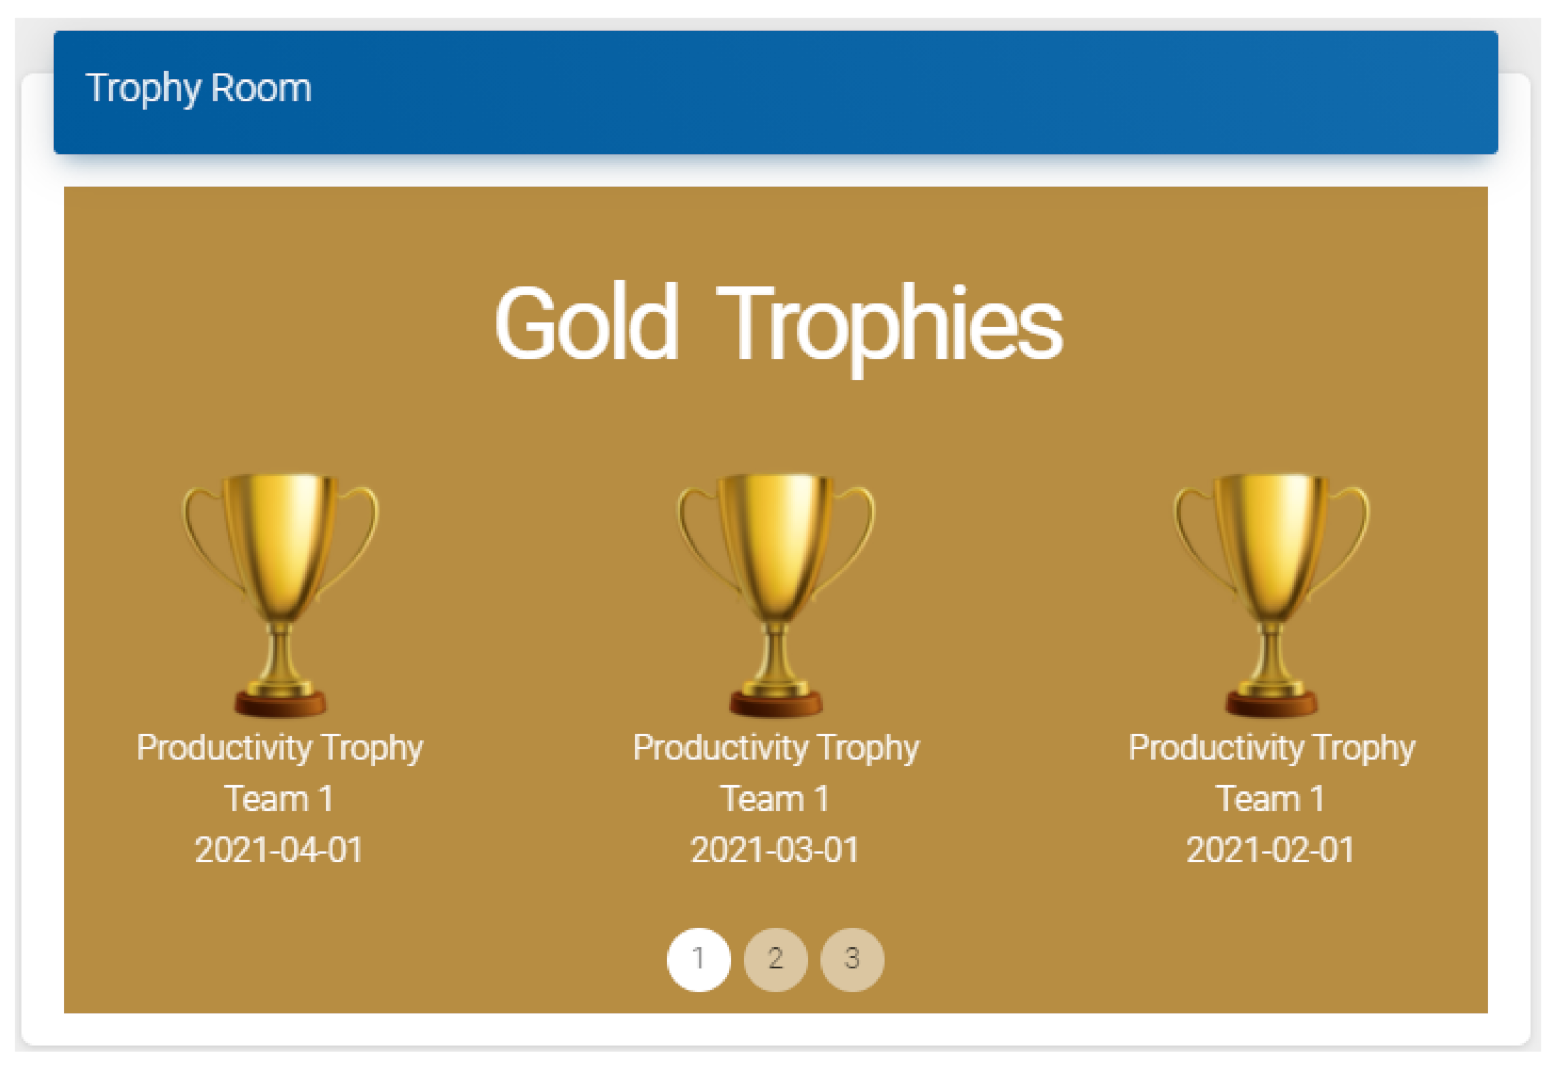
The Trophy Room functionality is where the user can check the trophies won by the teams in which he/she is allocated. When clicking on the related menu, the system redirects the user to the screen shown in Figure 9.
Figure 9 shows a slider with three pages: first, the system displays the gold trophies won by the teams of the logged-in user; the second shows the silver trophies; and the third shows the bronze trophies. If the user does not have any trophies at any of the levels (gold, silver, or bronze), the related page will display a message stating: “What a pity, you and your team have not won any trophies yet”.
When clicking on the Measurements menu, the system directs the user to the initial screen of the Measurements functionality, which as was adopted by default for other functionalities, contains a list of items. The system displays only measurements related to companies for a user in which they have an allocation.
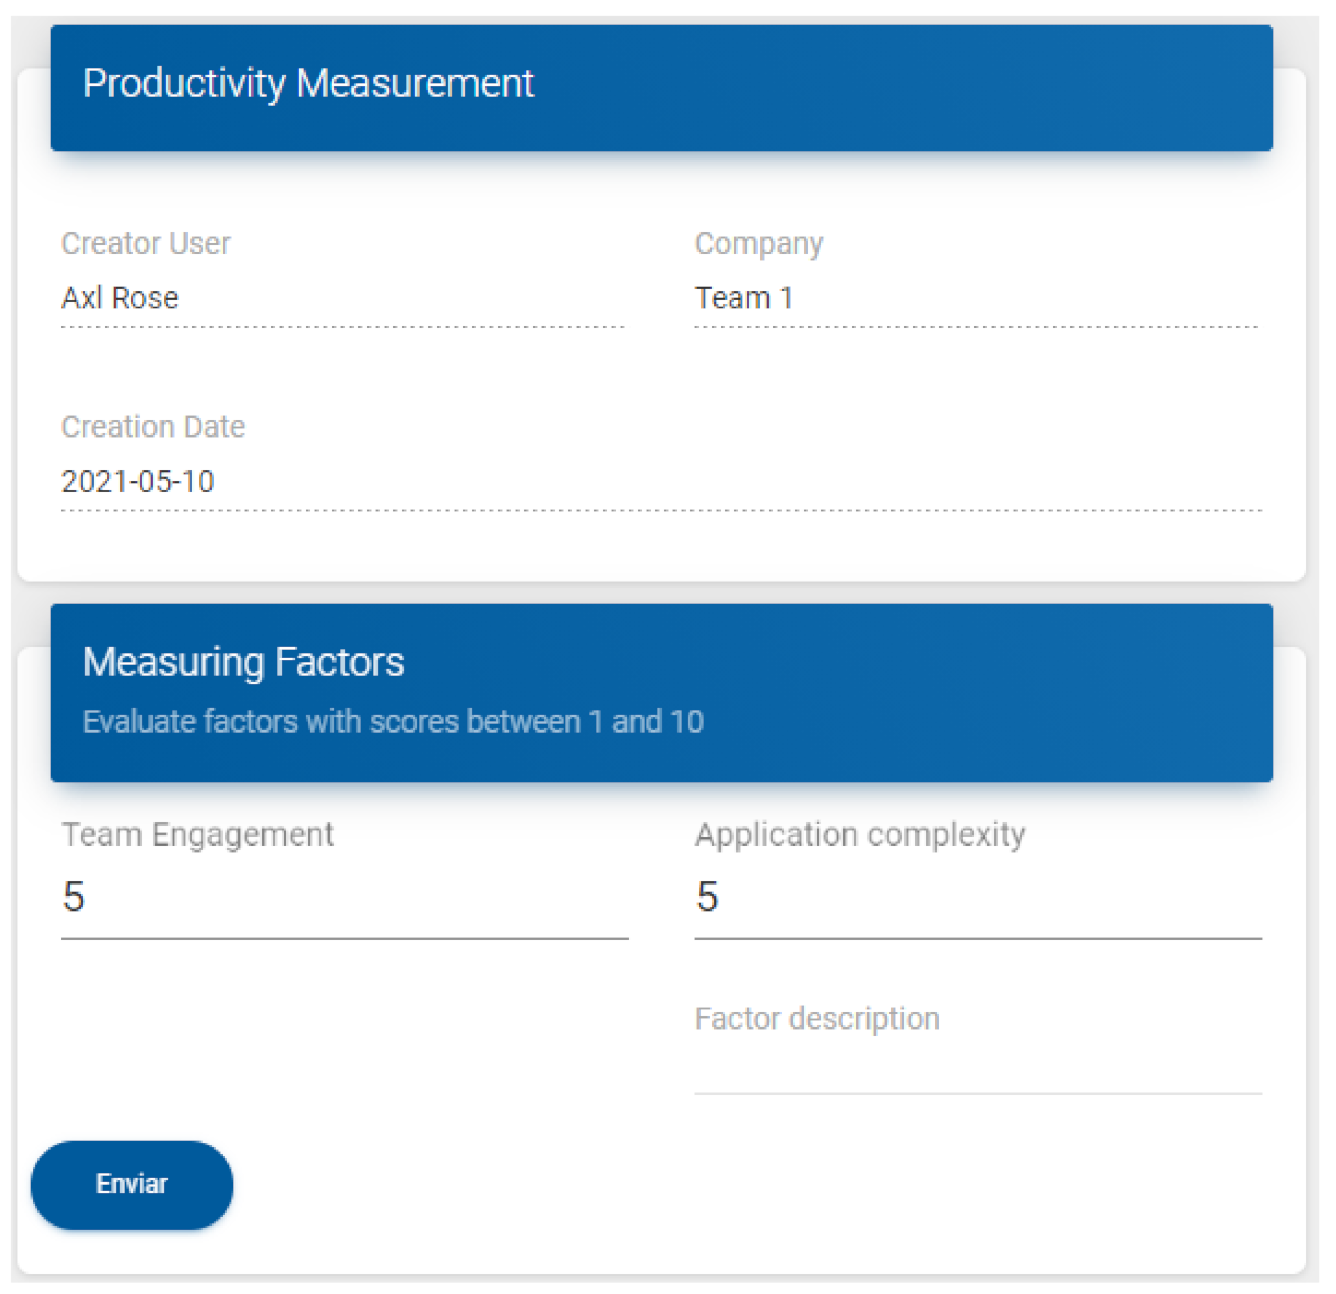
To measure productivity, a user must fill in the form presented in Figure 10. All users registered in the tool and with an active allocation to a company can input the data. The system displays the name of the user, the name of the company, and the date of the evaluation. At the bottom of the screen (section Measuring Factors), the system displays a form where each field represents a factor registered in the factor registration functionality.
As for the form’s assembly, the system displays only factors that are registered and active. Furthermore, a user only evaluates a factor if the factor is set to be filled by users of his role. In addition, we highlight that users evaluate all factors in a scale with numbers between 1 and 10. For each factor, the text displayed above the input box corresponds to the factor’s name, while the text displayed below this box corresponds to the description registered to the factor.
Considering that a team’s measurements are visible to all its participants, to monitor if the tool is being used regularly and properly, we encourage users to make team productivity measurements a frequent topic at meetings, discussing outliers whenever they arise.

Listing 1.
How we calculate productivity.
| private List<CompanyAssessment> calculateProductivity(List<UserAssessment> lastMonthItems) { |
| // an item of this list represents a company and its productivity |
| List<CompanyAssessment> assessmentsByCompany = new ArrayList<>(); |
| // Scroll through the list of all measurements created in the last month |
| // this list contains an item for each user assessment. |
| lastMonthItems.forEach(userAssessment -> { |
| if (assessmentsByCompany.stream().anyMatch(abc -> abc.getCompanyId() |
| .equals(userAssessment.getCompanyId()))) { |
| // if the valuation is for a company that already exists: update item |
| CompanyAssessment valComp = assessmentsByCompany.stream() |
| .filter(abc -> abc.getCompanyId().equals(userAssessment.getCompanyId())) |
| .collect(Collectors.toList()).get(0); |
| // the productivity of the company is given by the allocated users assessments |
| // so here we take as result the mean between the current value |
| // and the value of the user assessment |
| double productivity = (valComp.getProductivity() + userAssessment.getAssessment())/2; |
| // if its a combo, company gets 10% extra |
| // a combo happens when the company has measurements in all the weeks of the month |
| productivity = isCombo(lastMonthItems, userAssessment.getCompanyId()) |
| ? (productivity * 1.1) : productivity; |
| valComp.setProductivity(productivity); |
| } else { |
| // if the valuation is for a company that does not yet exist: add item |
| // in this case, the productivity value is simply the users’ evaluation |
| CompanyAssessment newItem = CompanyAssessment |
| .leaderboardId(0L) |
| .empresaId(userAssessment.getCompanyId()) |
| .productivity(userAssessment.getAssessment()) |
| .build(); |
| assessmentsByCompany.add(newItem); |
| } |
| }); |
| return assessmentsByCompany; |
| } |
4.2. Case Study Results
As described in Section 3.4, the object of this case study was composed of two software development teams. To start the productivity measurement process, we registered both companies in the application as well as the users who participated in the measurements and created allocations between people and the respective companies. The developed system allows for the factors that are used by a given software development team to be changed through the system itself. This functionality is important because some factors may not apply to a given context since the context is one of the modifiers of the perception of productivity [5].
Thus, to allow for this research to compare the results of the two development teams according to similar parameters, the members of the two teams talked with each other to decide which factors would be used to perform the productivity measurements in the case study. The members chose twenty-one factors out of seventy-five possible with the justification that these are the most related to their development teams. Table 3 contains the twenty-one factors selected by the two teams.
Before measurement started, users needed to know how to use the system. For this, we recorded and distributed a video containing a simulation of the use of the tool. Although there were plans for the later addition of gamification-related features, we did not pass this information to users. After we added gamification, we gave no new explanation, so users learned to use these features on their own.
For organizational purposes, the two teams agreed that the measurements would start on Fridays and end on Saturdays. Thus, people who did not record their measurements in this period did not have their perception of the team’s productivity computed.
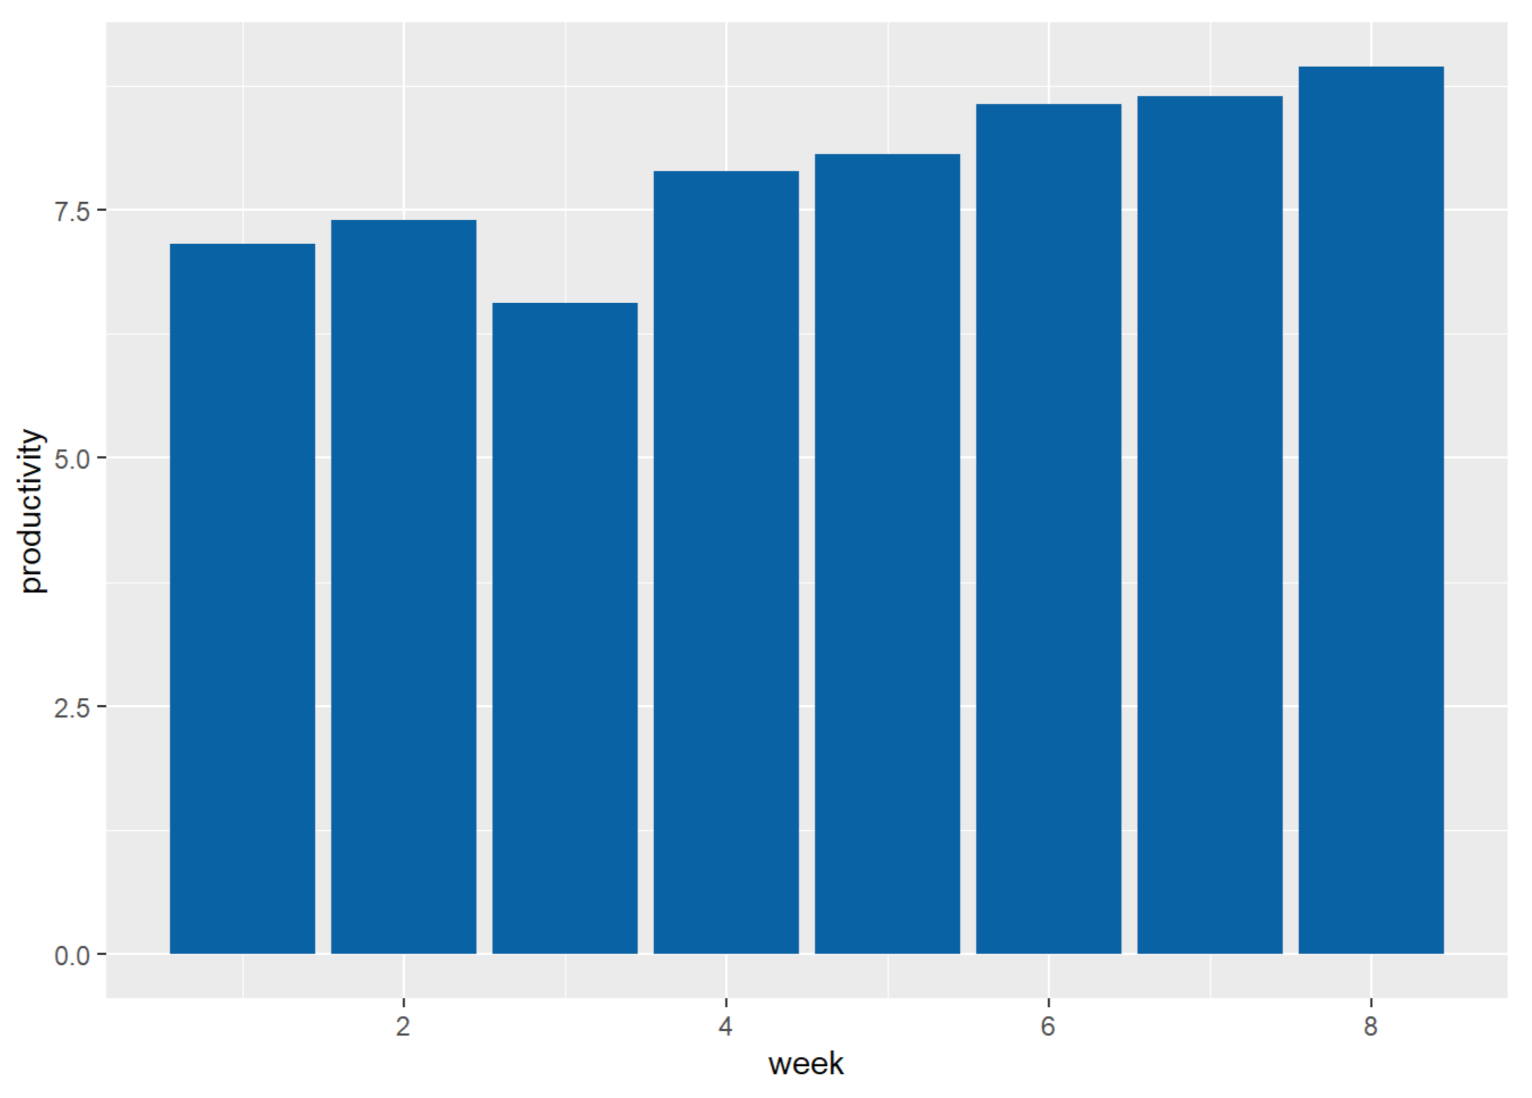
The x-axis of the graphs shown in Figure 11 and Figure 12 represents the week in which the measurement happened. The y-axis represents the arithmetic mean of the measurements of all users allocated to the team during the week. It is worth remembering that each allocated user (team member) records one measurement per week.
Figure 11 shows Team 1’s progress over the eight weeks that we applied the productivity measurement process. It is possible to observe in Figure 11 that the arithmetic mean of the evaluations increased slowly over the weeks—with 7.81 being the arithmetic mean of the first week and 9.11 the value corresponding to the last week, showing an improvement of 1.3 points in the period. The general mean, that is, of all values for all weeks, was 8.35; the median was 8.11; and the standard deviation (considering the arithmetic mean of each week) was only 0.539. Considering these values, we can see that the dispersion is small, meaning that the results do not tend to deviate much from the average between one week and another.
Figure 12 shows Team 2’s progress over the eight weeks that we applied the productivity measurement process. According to the information presented in Figure 12, it is possible to observe an atypical behavior in the first three weeks, followed by a gradual improvement in the last five weeks. According to the team’s report, the drop in productivity occurred in the third week due to internal team disagreements caused by a specific situation during the development process that they already resolved. This situation caused a decrease in some factors evaluation that made the overall average decrease.
The arithmetic mean of the first week was 7.16, with 8.94 being the value corresponding to the last week, showing an improvement of 1.78 points in the period. The overall mean was 7.90. The median value was 7.97, and the standard deviation, considering the arithmetic mean of each of the eight weeks, was 0.816. This value was more significant than the standard deviation of 0.539 found for Team 1, representing 151.39% of this value. Considering these values, we can measure a relatively large dispersion, meaning that for Team 2, results far from the mean are more common.
4.2.1. RQ.1. What Is the Effect on Productivity Assessments of Adding Gamification?
As mentioned, the gamification-related features were only available from the fourth week onwards. In other words, just in these weeks, participants had access to the Leaderboard to see the position of their team, had visual stimuli to perform the tasks (such as those on the Billboard), had access to the Trophy Room, and possibly won trophies and combos had effects.
As shown in Figure 11, if we consider the average of Team 1’s weekly ratings before adding gamification, we have a value of 7.92. The average after adding the gamification elements was 8.78—a difference of 0.86 points. The standard deviation before the addition of the gamification elements was only 0.096. After that, the value raised to 0.418—that is, results far from the mean became more common.
Subtracting the value of the arithmetic mean of the evaluations obtained in one week by the same value obtained in the previous week, we have the value that represents the evolution from one week to another. The average evolution in the weeks before the addition of gamification for this team was 0.077 points per week, while the same average in the weeks after the application of gamification was 0.268 points, representing a more significant value (higher average weekly evolution).
Regarding the impact of inserting the gamification elements on the results obtained for Team 2, if we consider the average of the weekly evaluations of Team 2 (Figure 12) before this, we have a value of 7.25. The average after adding the gamification elements rose to 8.55—a difference of 1.3 points. The average evolution in the weeks before applying gamification for Team 2 was 0.243 points per week. The same average in the weeks after gamification was 0.263 points—a higher value represents a better evolution per week. However, this result is lower than that obtained by Team 1, which had an improvement of 179.16% in the average weekly evolution (going from 0.077 before the addition of gamification and reaching 0.268 after the addition), while the improvement obtained by Team 2 was 8.23% (out of 0.243 and reaching 0.263 points). The standard deviation before the addition of the gamification elements was only 0.549. After that, the value raised to 0.364—that is, results far from the mean became less common.
Before adding the gamification elements, the two teams already had a small improvement in the weekly productivity rating. For this reason, we used the metrics general average of the evaluations and average weekly evolution. We used both metrics for comparing the results obtained before and after the addition of the gamified elements.
When we analyze these metrics, the two software development teams had bigger improvements in productivity after adding gamification; however, they manifested differently: Team 1 had a steady and more linear improvement, while Team 2 had a more visible variation in the results in the first three weeks and started to evolve more linearly from the fourth week onwards.
In addition, we used one more auxiliary metric to assess the impact of gamification: the standard deviation. For Team 1, this metric indicates that, after the addition of gamification, the results show a higher standard deviation, that is, values that are farther from the mean and, consequently, less linear. The numbers obtained for Team 2 indicate, however, that the results became more linear after the addition of gamification. However, it is valid to remember the incident that occurred with this team in the third week, before the gamification, which changed the linearity of the results over the period.
4.2.2. RQ.2. What Is the Perception of Users concerning the Productivity Calculation System?
Despite the positive results presented in Section 4.2.1, we understand that we need validation of the perception of the users regarding the productivity calculation system. For this reason, at the end of the eight weeks of measurement, we applied a survey so that system users could assess their perceptions over the system. This survey consisted of only three questions:
- Q1: How much do you agree that using the productivity measurement tool helped the team improve productivity?
- Q2: How much do you agree that using gamification helped improve your team’s results?
- Q3: Considering your team’s productivity graph throughout the measurement process, how much do you agree that it represents reality?
The respondents answered all the questions in the survey using a Likert [46] scale with five options, the first representing total disagreement and the last representing complete agreement. For the mathematical analysis, the options were weighted with the corresponding number between 1 and 5. The option that represents total disagreement has a value of “1“, and the one that represents complete agreement has a value of “5“.
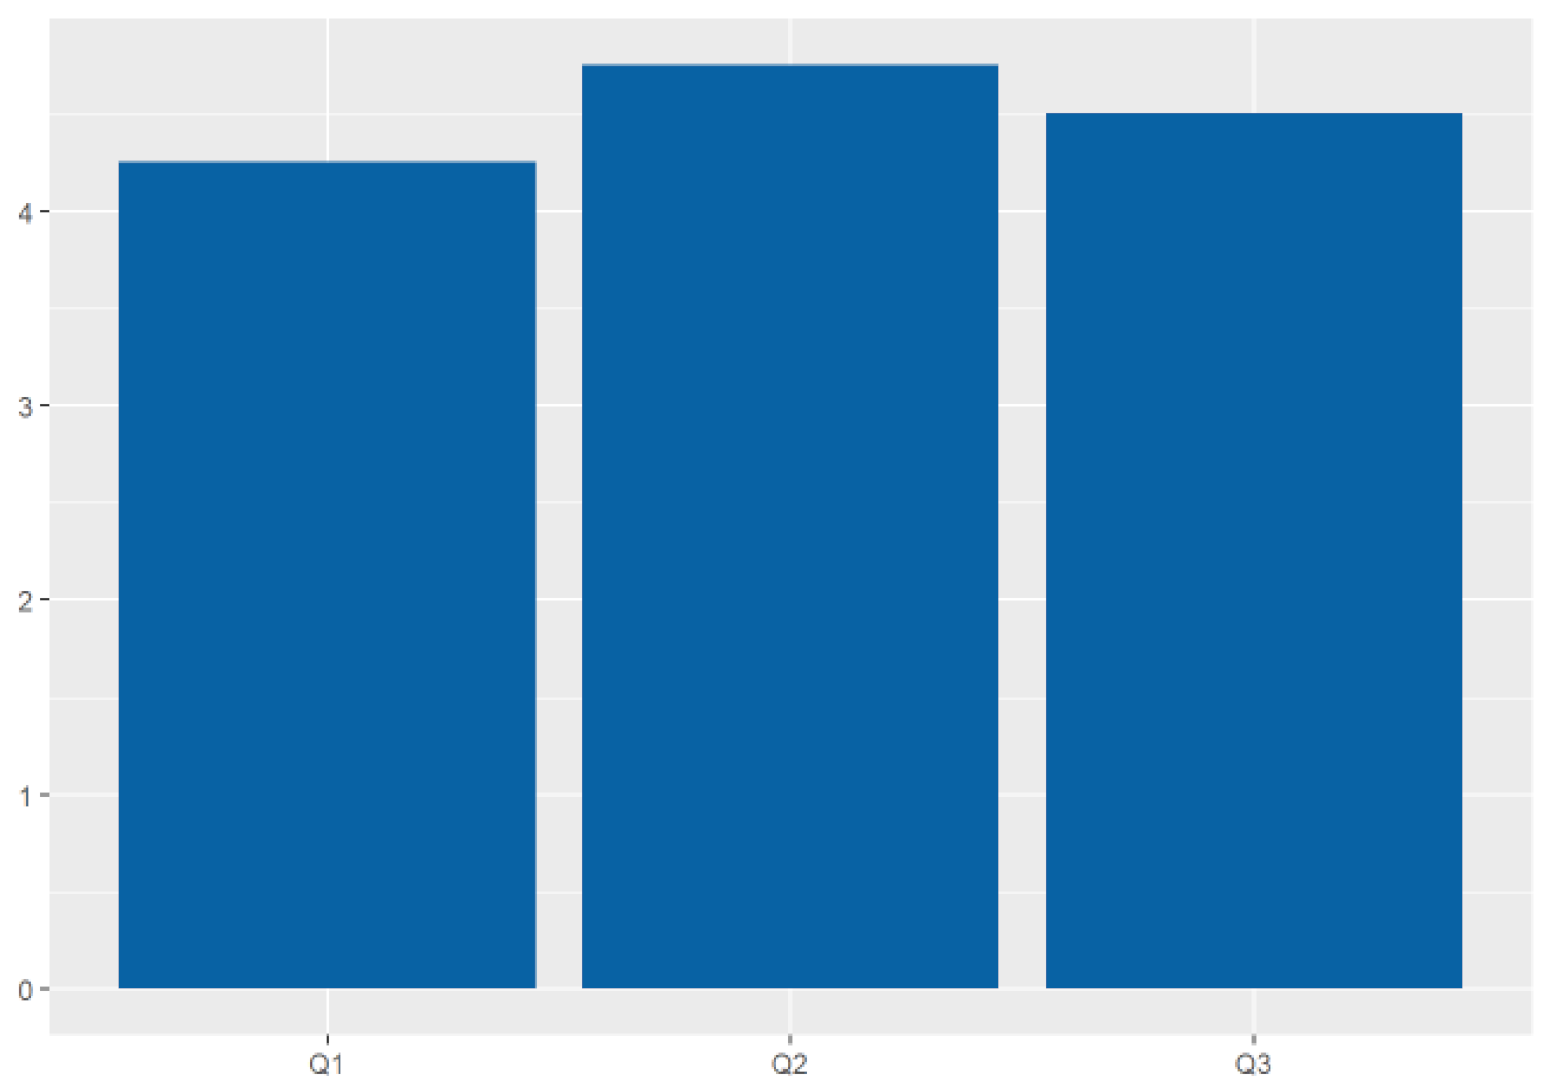
Figure 13 represents the evaluations made by the members of Team 1. The average of the answers for Q1 was 4.25; for Q2, it was 4.75; and for Q3, it was 4.5. Thus, all users of Team 2 considered 1. that the use of the productivity measurement tool helps the team to improve its productivity; 2. that the use of gamification helped to improve these results; and 3. that the measurements performed in the system correspond to reality—since the graph we have shown to the team was the graph referring to its progress (Figure 11).
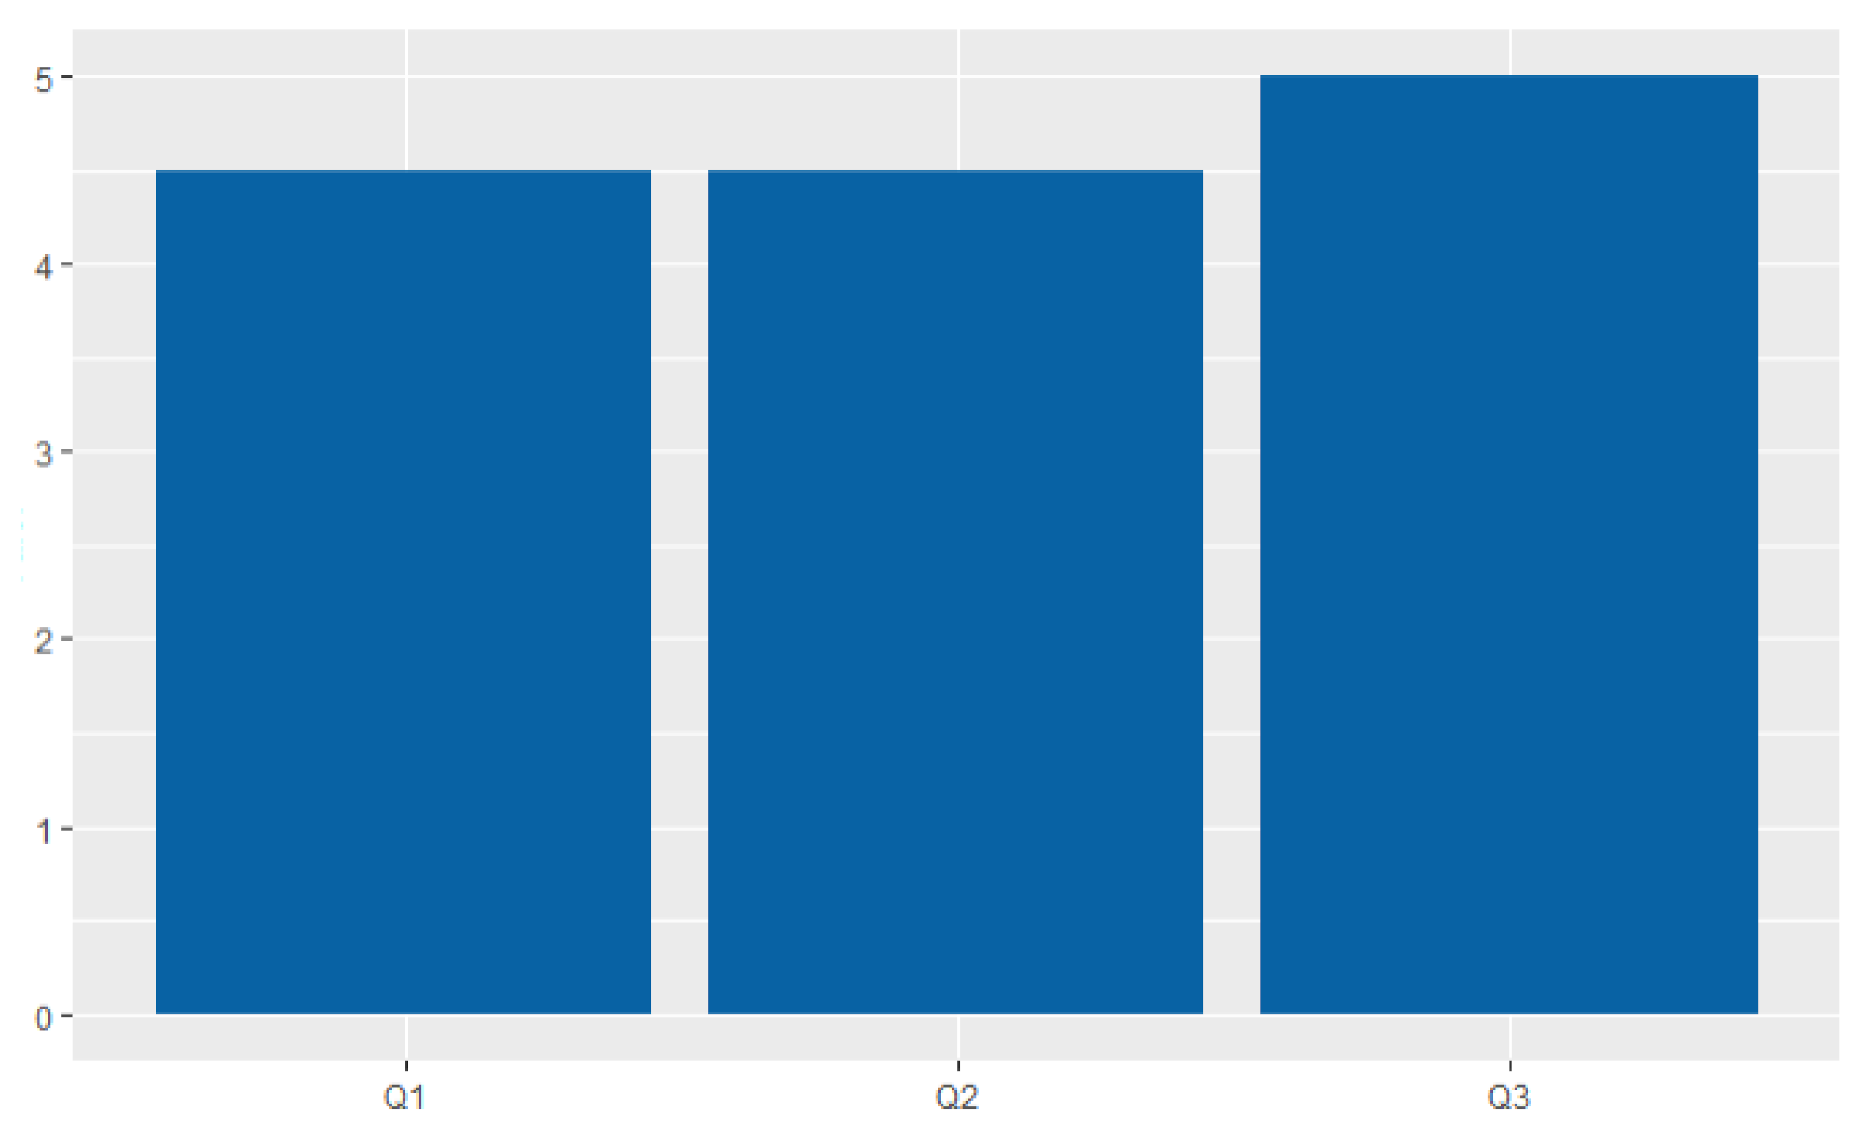
Figure 14 represents the evaluations made by the members of Team 2. For this team, the average of the answers for Q1 was 4.5; for Q2, it was 4.5; and for Q3, it was 5. That is, all users of Team 2 considered 1. that the use of the productivity measurement tool helps the team to improve its productivity; 2. that the use of gamification helped to improve these results; and 3. that the measurements performed in the system correspond to reality—since the graph we have shown to the team was the graph referring to its progress (Figure 12).
When we compare the results for Team 1 (Figure 13) and Team 2 (Figure 14), we can see similar behavior since both evaluations were positive. In the first question, the evaluation of Team 2 was superior by 0.25 points. The members of Team 2 consider that the use of the productivity measurement tool helps the team to improve productivity more. For the second question (Q2), we note that the evaluation of Team 1 was higher by 0.25 points (the members of this team consider the use of gamification more effective). We highlight that the users’ perception was consistent with the productivity measurement result since, as shown above, gamification had better results with Team 1. Concerning Q3, Team 2’s ratings averaged 5 (that is, all members had the maximum degree of agreement) and showed a result with a 0.5 point advantage over Team 1.
Considering the evaluations of all participants, the average of the answers for Q1 was 4.375; for Q2, it was 4.625; and for Q3, it was 4.75. Thus, we consider that (according to the results obtained in the measurement process and to user feedback) the use of the measurement tool helped teams to improve productivity, using gamification improved results, and the value corresponding to productivity contained in the platform represents the users’ perception of reality well.
5. Threats to Validity
This research presents some threats to validity. The first threat is the number of responses we obtained for the surveys. The survey to identify the characteristics of the target audience obtained sixty-nine answers. The survey to assess the productivity factors obtained forty-four answers. The number of survey participants can be considered a threat to validity as this number does not represent a large scale of the members of the software development teams, so the knowledge extracted from the survey responses may not be valid for all development teams. To mitigate this threat, we aimed to find teams with different characteristics that operate in the software industry in multiple contexts.
As for the measuring productivity way, in our work, the productivity of a team is given by its members; therefore, there is a possibility of a loss of accuracy due to biased evaluations.
Another threat is related to the sample size that participated in the case study. We carried out the case study with two teams of four people each. Thus, we understand that the sample size is a threat to validity, as we may identify different behaviors and results in larger samples. In future experiments, we will perform a study with a more diverse sample and with more participants. Finally, we also considered the duration of the case study to be a threat since the participants used the tool for only eight weeks. In the future, we will mitigate this threat by conducting experiments during all phases of the software development process and with a larger sample of participants and projects.
6. Conclusions
This paper presented a tool built to measure productivity according to factors found in the literature. In the measurement, each factor can have a different weight, and to obtain these weights, software development teams’ members evaluated them in a survey. To motivate users to use the tool, we developed it using gamification techniques. To select these, members of software development teams assessed which gamified elements have the most effect on them through a survey.
When we compare the results of the two software development teams (Team 1 and Team 2), it is possible to see that, in general, both showed an improvement in productivity after starting the measurements. However, this improvement manifested itself differently: while Team 1 had a steady and more linear improvement, Team 2 had a more visible variation in results in the first three weeks and started to evolve more linearly from the fourth week onwards. We highlight that Team 2 started the project a short time ago and, its members did not know each other that well yet. Thus, certain situations can affect the perception of Team 2 members about their productivity due to a lack of knowledge and trust in other team members.
We also observed that the productivity increased after the addition of the elements related to gamification, demonstrating a positive effect of these. We applied a survey to obtain users’ feedback about the tool’s effectiveness and had positive results: users agree with the tool’s usefulness and agree with the numerical results shown.
As future work, we will assess the validation of the tool in other contexts with a larger number of participants in the development teams to investigate the impact of using the tool in measuring the productivity of teams in larger software projects.
To enable the use of our tool in the context of software development teams that already use other tools where members must input data, another future work is building integrations with external systems. Finally, to speed up the form completion task, we propose the development of an auto-completion feature of the productivity evaluation form data based on the last user evaluation as a future work.
Author Contributions
Writing—original draft preparation, J.S.M., E.D.C., and H.A.T.; writing—review and editing, J.S.M., E.D.C., and H.A.T.; visualization, J.S.M., E.D.C., and H.A.T. All authors have read and agreed to the published version of the manuscript.
Funding
This research received no external funding.
Institutional Review Board Statement
Not applicable.
Informed Consent Statement
Not applicable.
Data Availability Statement
Not applicable.
Conflicts of Interest
The authors declare no conflict of interest.
Appendix A. Factor Detailing
Table A1.
People factors.
| Category | Factor | Detailing | Rating |
|---|---|---|---|
| People | Focus | the focus factor measures how focused the team is on achieving the iteration goal [53]. | 1.537 |
| People | Collaboration between team members | collaborative work positively influences productivity in software development [22]. | 1.45 |
| People | Ease of communication | in collaborative development environments, the ease of communication between members is an important factor in increasing productivity [22]. | 1.45 |
| People | Motivation | the motivation of those involved in software design positively influences productivity in software development [22]. | 1.425 |
| People | Commitment | it represents the responsibility level that team members are willing to assume in their tasks within their work team [54]. | 1.415 |
| People | Team cohesion | cohesion is one of the factors that positively affect productivity [22]. | 1.325 |
| People | Mental health | the good mental health of employees leads to productivity gains [4]. | 1.3 |
| People | Skills and competences | even without identifying the types of skills and competencies, the relationship between them and productivity is positive [22]. | 1.275 |
| People | Satisfaction | this dimension captures human productivity factors and has several possible subcomponents, including physiological factors, such as fatigue and team comfort measures. [5]. | 1.1 |
| People | Enthusiasm | the degree of enthusiasm for the work is the factor that most affects the productivity of developers [55]. | 1.1 |
| People | Experience | the team members’ experience positively influences productivity in software development [22]. | 1.025 |
| People | Physical health | the good physical health of employees leads to productivity gains [4]. | 0.975 |
| People | Technical qualification | technically well-qualified developers can be more productive because that allows them flexibility in the tasks they can perform [56]. | 0.975 |
| People | Happiness | developers’ happiness positively impacts team productivity [25]. | 0.95 |
| People | Quality of life | the literature points out that the quality of life at work is related to the organization’s productivity [57]. | 0.925 |
| People | Behavioral qualification | the good behavioral qualification of the developers involves focus, concentration, tranquility, commitment [56]. | 0.775 |
| People | Availability of members for allocation | availability of members for allocation to the development team: having the resources available in the necessary time is an important aspect and positively influences productivity [22]. | 0.7 |
| People | Home distractions | in home-office it is common for people to lose productivity because they are distracted from their activities [58]. | 0.488 |
| People | Turnover | the lower the resource turnover within a project, the better for productivity. In such a way, this is a factor of negative influence [22]. | 0.175 |
Table A2.
Product factors.
| Category | Factor | Detailing | Rating |
|---|---|---|---|
| Product | Quality | represents the quality of the work conducted. Such a metric can be obtained according to internal values (for example, the quality of the code and the number of bugs produced) or external (for example, the quality of the product from the perspective of the end users) [5]. | 1.3 |
| Product | Adequate documentation | this factor represents how well the documentation fits the needs [59]. | 0.95 |
| Product | Requirements | considering the dependence on several factors (such as ambiguity and volatility of requirements) the influence of this factor varies according to the context [22]. | 0.85 |
| Product | Business area | it consists of the business area covered by the software, and its impact varies according to the product area [22]. | 0.725 |
| Product | Completeness of design | it shows that the more complete the design when starting development, the better [59]. | 0.725 |
| Product | Poor code quality | the lack of quality in the code developed directly impacts the motivation and productivity of developers [25]. | 0.7 |
| Product | Technological platform | each platform has a productivity impact, so an organization’s analysis of historical bases is needed to define which is more productive [22]. | 0.675 |
| Product | Programming language | the higher the level of abstraction of the language used in the solution, the better software development productivity [22]. | 0.625 |
| Product | Project duration | the duration of a project is a factor that negatively affects productivity [22]. | 0.6 |
| Product | Application complexity | can be defined as the degree of difficulty for a project or part of it [22]. | 0.575 |
| Product | Speed | is the ratio of the time spent required to perform a given amount of work. This factor, as presented by [5], resembles Sharpe’s definition of productivity [7]. | 0.575 |
| Product | Lost time | a quarter of developers’ working time is wasted, and additional code analysis and technical debt cause it [60]. | 0.5 |
| Product | Number/frequency of commits | Helie et al. [41] classify the frequency of code commits in an hour interval as a factor to define productivity. According to the authors, a high number means (according to empirical knowledge) that more work is conducted. | 0.4 |
| Product | Software size | the reason for the negative relationship between productivity and software size is the increased complexity of the project [22]. | 0.35 |
| Product | Type of software developed | the different types of systems have different influences on productivity [22]. | 0.25 |
Table A3.
Organization factors.
| Category | Factor | Detailing | Rating |
|---|---|---|---|
| Organization | Trust in other members | the ability of team members to trust each other influences productivity [61]. | 1.61 |
| Organization | Work environment | the work environment contains aspects that together positively influence productivity [22]. | 1.415 |
| Organization | Efficient meetings | the efficiency of meetings and their related practices also affects the productivity of development teams [55]. | 1.415 |
| Organization | Access to information | productivity is positively impacted in a software creation environment where the flow of information between humans and the tools involved is optimized [35]. | 1.29 |
| Organization | Feedback Culture | performance feedbacks influence how well developers produce [55]. | 1.22 |
| Organization | Code reuse | the reuse of code, libraries, or even functionality is a factor that positively impacts productivity in software development [22]. | 1.195 |
| Organization | Maturity | is one of the factors that most positively affect productivity and requires a team with effective communication, high adaptability, conflict management skills, shared decision-making, cohesion, mutual trust, behavioral compliance, clear responsibilities, and shared responsibilities [19]. | 1.195 |
| Organization | Use of best practices in software project management | practices that support the construction of a work environment that favors the commitment and interest of team members are factors of positive impact on productivity [22]. | 1.15 |
| Organization | Merits and rewards system | these systems contribute positively to the productivity of the development team [22]. | 1.098 |
| Organization | Accuracy of information | the accuracy of the information that reaches the development team (such as bug reports, use cases, and change requests) influences its productivity [27] | 1.098 |
| Organization | Team autonomy level | it subjectively represents the extent to which the software team has authority and control in making decisions to carry out the project [62]. | 1.073 |
| Organization | Stakeholder participation in development | in general, it affects productivity positively, but if excessive, this participation can be negative [22]. | 1.07 |
| Organization | Knowledge management | the lack of knowledge exchange between developers is a factor that negatively influences productivity [22]. | 1.05 |
| Organization | Work Tools | the use of good work tools also influences productivity [55]. | 1.05 |
| Organization | Trainings provided by the company | the existence of training is a factor that improves productivity by allowing the acquisition of significant knowledge for software development [22]. | 0.98 |
| Organization | Use of auxiliary tools | no matter how much using different tools requires effort, its use is considered a factor that positively impacts productivity [22]. | 0.951 |
| Organization | Software processes | the improvement of processes leads to improvements of other aspects, such as reuse, the flexibility of adaptation, and process stability achieved under conditions of high maturity. In such a way, this is a positive factor [22]. | 0.951 |
| Organization | Development site | studies indicate that the development location affects productivity (for example, different countries, military or industrial organizations, etc.) [22]. | 0.93 |
| Organization | Sharing members between projects | resource sharing between projects is negative for productivity as developers have to keep different contexts in mind [22]. | 0.829 |
| Organization | Innovative mindset | the existence of a mindset that is always open to new ideas influences the productivity of software developers [55]. | 0.829 |
| Organization | Iteration length | the length of an iteration in days, calculated as the time elapsed between the start and end dates of the iteration, can affect productivity [53]. | 0.756 |
| Organization | Existence of Rework | the existence of rework is negative for productivity as it indicates some other negative aspects as the existence of defects [22]. | 0.63 |
| Organization | Variety of tasks | the variety of types of tasks is one of the factors that affect the productivity of software developers [55]. | 0.54 |
| Organization | Team size | small teams made up of experienced developers have better levels of productivity [22]. | 0.51 |
| Organization | Possibility of remote work | the possibility of doing the work remotely to perform tasks that require uninterrupted concentration positively affects productivity [55]. | 0.49 |
| Organization | Existence of historical measurement history | the existence of historical data positively influences productivity, as such data can serve as a support for comparison and because they can also allow for a better understanding of the behavior of software projects [22]. | 0.46 |
| Organization | Homogeneity | teams with the highest homogeneity levels are more productive, produce better quality code, and are more effective in testing [63]. | 0.415 |
| Organization | Software risk exposure level | represents the level of project uncertainty, having a noticeable impact on how the software can respond to business needs over time [62]. | 0.075 |
Table A4.
OSS factors.
| Category | Factor | Detailing | Rating |
|---|---|---|---|
| OSS | Investments in Information and Communication Technology | comprises investments in software, hardware, and laboratories and is a factor of positive influence on productivity [22]. | 2 |
| OSS | Team engagement | in general, developers of open-source software projects are more motivated to contribute and, in addition, there is a very positive exchange of experiences between these individuals [22]. | 1.25 |
| OSS | Developer base | it is natural for developers to be more interested in contributing to open-source software projects that have more developers contributing [64]. Ref. [65] stated that in larger development communities (with a large number of participants) developers are more active. | 0.89 |
| OSS | Application complexity | a modularized architecture without complexity makes it easier for other people to contribute to the project, thus making it more productive [64]. | 0.82 |
| OSS | User base | it is natural for developers to be more interested in contributing to open-source software projects with a larger user base [64]. | 0.64 |
| OSS | Contractual relations | establish more security for developers and therefore make development more productive [22]. | 0.54 |
| OSS | Entry barriers | barriers to entry can directly impact productivity in open-source software projects [22]. | 0.45 |
| OSS | Organizational diversity | open-source software projects with the best organizational diversity, where people from different companies contribute, have better productivity [65]. | 0.43 |
| OSS | Team disengagement | open-source software developers may lose interest in the project due to several factors faced by these [22]. | 0.42 |
| OSS | Gender diversity | teams composed of men and women bring different perspectives and, thus, have better results [22]. | 0.32 |
| OSS | Size correlation (commits X contributors) | Jiang et al. [65] considered, in open-source software development projects, the correlation between the number of commits and the number of contributors as the main factor for productivity. | 0.32 |
| OSS | Project age | software productivity gradually decreases after reaching a peak in the project development cycle. That indicates that project age affects productivity [66]. | 0.275 |
| OSS | Lack of contractual relationships | the lack of contractual relationships allows contributors to free software projects to spend their time contributing to activities that directly increase software productivity [22]. | 0.09 |
References
- Macedo, M.d.M. Gestão da produtividade nas empresas. Rev. Organ. Sistêmica 2012, 1, 110–119. [Google Scholar]
- Ishizaka, A.; Resce, G.; Mareschal, B. Visual management of performance with PROMETHEE productivity analysis. Soft Comput. 2018, 22, 7325–7338. [Google Scholar] [CrossRef] [Green Version]
- Mukred, M.; Yusof, Z.M.; Alotaibi, F.M. Ensuring the Productivity of Higher Learning Institutions Through Electronic Records Management System (ERMS). IEEE Access 2019, 7, 97343–97364. [Google Scholar] [CrossRef]
- Spanbauer, S.J. Reactivating higher education with total quality management: Using quality and productivity concepts, techniques and tools to improve higher education. Total. Qual. Manag. 1995, 6, 519–538. [Google Scholar] [CrossRef]
- Sadowski, C.; Storey, M.D.; Feldt, R. A Software Development Productivity Framework. In Rethinking Productivity in Software Engineering; Sadowski, C., Zimmermann, T., Eds.; Apress Open/Springer: Berlin/Heidelberg, Germany, 2019; pp. 39–47. [Google Scholar] [CrossRef] [Green Version]
- Rosen, E.D. Improving Public Sector Productivity: Concepts and Practice; Sage: Thousand Oaks, CA, USA, 1993. [Google Scholar] [CrossRef]
- Sharpe, A. Productivity Concepts, Trends And Prospects: An Overview. In The Review of Economic Performance and Social Progress 2002: Towards a Social Understanding of Productivity; Andrew Sharpe, E.D., France St-Hilaire, Banting, K., Eds.; Centre for the Study of Living Standards: Ottawa, ON, Canada, 2002; Volume 2. [Google Scholar]
- Bonelli, R.; Fonseca, R. Ganhos de Produtividade e de Eficiência: Novos Resultados para a Economia Brasileira. Pesqui. Planej. Econômico 1998, 28. Available online: http://repositorio.ipea.gov.br/bitstream/11058/2383/1/td_0557.pdf (accessed on 5 September 2021).
- Moreno, A.; Neumann, M.; Mohebalian, P.M.; Thurnher, C.; Hasenauer, H. The Continental Impact of European Forest Conservation Policy and Management on Productivity Stability. Remote. Sens. 2019, 11, 87. [Google Scholar] [CrossRef] [Green Version]
- Triplett, J.E. The Solow Productivity Paradox: What do Computers do to Productivity? Can. J. Econ. Rev. Can. d’Economique 1999, 32, 309–334. [Google Scholar] [CrossRef]
- Ray, D.M.; Samuel, P. Improving the productivity in global software development. In Innovations in Bio-Inspired Computing and Applications; Advances in Intelligent Systems and Computing; Springer: Berlin/Heidelberg, Germany, 2016; Volume 424, pp. 175–185. [Google Scholar] [CrossRef]
- De Aquino Junior, G.S.; de Lemos Meira, S.R. Towards Effective Productivity Measurement in Software Projects. In Proceedings of the Fourth International Conference on Software Engineering Advances, Porto, Portugal, 20–25 September 2009; ICSEA: Porto, Portugal, 2009; pp. 241–249. [Google Scholar] [CrossRef]
- Lavazza, L.; Morasca, S.; Tosi, D. An empirical study on the effect of programming languages on productivity. In Proceedings of the 31st Annual ACM Symposium on Applied Computing, Pisa, Italy, 4–8 April 2016; pp. 1434–1439. [Google Scholar] [CrossRef] [Green Version]
- De Oliveira, E.C.C.; Viana, D.; Cristo, M.; Conte, T. How have Software Engineering Researchers been Measuring Software Productivity? In —A Systematic Mapping Study. In Proceedings of the ICEIS 2017-Proceedings of the 19th International Conference on Enterprise Information Systems, Porto, Portugal, 26–29 April 2017; Volume 2, pp. 76–87. [Google Scholar] [CrossRef]
- Melo, C.D.O.; Cruzes, D.S.; Kon, F.; Conradi, R. Interpretative case studies on agile team productivity and management. Inf. Softw. Technol. 2013, 55, 412–427. [Google Scholar] [CrossRef]
- Morasca, S.; Russo, G. An Empirical Study of Software Productivity. In Proceedings of the 25th International Computer Software and Applications Conference (COMPSAC 2001), Invigorating Software Development, Chicago, IL, USA, 8–12 October 2001; pp. 317–322. [Google Scholar] [CrossRef]
- Yilmaz, M.; O’Connor, R.V.; Clarke, P. Effective Social Productivity Measurements during Software Development—An Empirical Study. Int. J. Softw. Eng. Knowl. Eng. 2016, 26, 457–490. [Google Scholar] [CrossRef] [Green Version]
- Mizuno, O.; Kikuno, T.; Inagaki, K.; Takagi, Y.; Sakamoto, K. Statistical analysis of deviation of actual cost from estimated cost using actual project data. Inf. Softw. Technol. 2000, 42, 465–473. [Google Scholar] [CrossRef]
- Ramirez-Mora, S.L.; Oktaba, H. Team Maturity in Agile Software Development: The Impact on Productivity. In Proceedings of the 2018 IEEE International Conference on Software Maintenance and Evolution, ICSME 2018, Madrid, Spain, 23–29 September 2018; pp. 732–736. [Google Scholar] [CrossRef]
- Fardo, M. A GamificaçãO Aplicada em Ambientes de Aprendizagem. Renote 2013, 11. [Google Scholar] [CrossRef]
- Schlemmer, E. GamificaçãO em EspaçOs de ConvivêNcia HíBridos e Multimodais: Design e CogniçãO em DiscussãO. Rev. FAEEBA Educ. Contemp. 2014, 23. [Google Scholar] [CrossRef]
- Canedo, E.D.; Santos, G.A. Factors Affecting Software Development Productivity: An Empirical Study. In Proceedings of the XXXIII Brazilian Symposium on Software Engineering, New York, NY, USA, 23–27 September 2019; SBES 2019; Association for Computing Machinery: New York, NY, USA, 2019; pp. 307–316. [Google Scholar] [CrossRef]
- Tangen, S. Understanding the concept of productivity. In Proceedings of the 7th Asia-Pacific Industrial Engineering and Management Systems Conference, Taipei, Taiwan; 2002; pp. 18–20. Available online: https://shorturl.at/vwBCN (accessed on 5 September 2021).
- Kemerer, C.F. Software Development Productivity Measurement. Data Base 1986, 17, 41. [Google Scholar] [CrossRef]
- Graziotin, D.; Fagerholm, F. Happiness and the Productivity of Software Engineers. In Rethinking Productivity in Software Engineering; Sadowski, C., Zimmermann, T., Eds.; Apress Open/Springer: Berlin/Heidelberg, Germany, 2019; pp. 109–124. [Google Scholar] [CrossRef] [Green Version]
- Petersen, K. Measuring and predicting software productivity: A systematic map and review. Inf. Softw. Technol. 2011, 53, 317–343. [Google Scholar] [CrossRef]
- Vasilescu, B.; Yu, Y.; Wang, H.; Devanbu, P.T.; Filkov, V. Quality and productivity outcomes relating to continuous integration in GitHub. In Proceedings of the 2015 10th Joint Meeting on Foundations of Software Engineering, ESEC/FSE 2015, Bergamo, Italy, 30 August–4 September 2015; pp. 805–816. [Google Scholar] [CrossRef]
- Delaney, S.; Schmidt, D. A Productivity Framework for Software Development Literature Review. In Proceedings of the 2nd International Conference on Software Engineering and Information Management, Bali, Indonesia, 10–13 January 2019; ICSIM 2019; Association for Computing Machinery: New York, NY, USA, 2019; pp. 69–74. [Google Scholar] [CrossRef]
- Navarro, G. Gamificação: A transformação do conceito do termo jogo no contexto da pós-modernidade. Bibl. Lat. Am. Cult. Comun. 2013, 1, 1–26. [Google Scholar]
- Zichermann, G.; Cunningham, C. Gamification by Design: Implementing Game Mechanics in Web and Mobile Apps, 1st ed.; O’Reilly Media, Inc.: Newton, MA, USA, 2011. [Google Scholar]
- Leite, B. Gamificando as aulas de química: Uma análise prospectiva das propostas de licenciandos em química. RENOTE Rev. Novas Tecnol. Educ. 2017, 15, 1–10. [Google Scholar] [CrossRef] [Green Version]
- Chou, Y. Actionable Gamification: Beyond Points, Badges, and Leaderboards; CreateSpace: Scotts Valley, CA, USA, 2015. [Google Scholar]
- Oliveira, E.; Fernandes, E.; Steinmacher, I.; Cristo, M.; Conte, T.; Garcia, A. Code and commit metrics of developer productivity: a study on team leaders perceptions. Empir. Softw. Eng. 2020, 25, 2519–2549. [Google Scholar] [CrossRef]
- Souza, A.L.M.d.; Evangelista, R.A.; Bueno, A.A.; Silva, L.A.d. A Influência da Qualidade de Vida no Trabalho (QVT) na Produtividade de Equipes de Manutenção; Atena Editora: Ponta Grossa-PR, Brazil, 2019. [Google Scholar] [CrossRef]
- Murphy, G.C.; Kersten, M.; Elves, R.; Bryan, N. Enabling Productive Software Development by Improving Information Flow. In Rethinking Productivity in Software Engineering; Apress: Berkeley, CA, USA, 2019; pp. 281–292. [Google Scholar] [CrossRef] [Green Version]
- Naik, N.; Jenkins, P. Relax, It’s a Game: Utilising Gamification in Learning Agile Scrum Software Development. In Proceedings of the 2019 IEEE Conference on Games (CoG), London, UK, 20–23 August 2019; pp. 1–4. [Google Scholar] [CrossRef]
- Haefner, J.; Makrigeorgis, C. A Study of the Systemic Relationship Between Worker Motivation and Productivity. IJTD 2010, 1, 52–69. [Google Scholar] [CrossRef] [Green Version]
- Moldon, L.; Strohmaier, M.; Wachs, J. How Gamification Affects Software Developers: Cautionary Evidence from a Natural Experiment on GitHub. In Proceedings of the 2021 IEEE/ACM 43rd International Conference on Software Engineering (ICSE), Madrid, Spain, 25–28 May 2021; IEEE/ACM: Piscataway, NJ, USA, 2021; pp. 549–561. [Google Scholar]
- Coonradt, C.; Nelson, L. The Game of Work: How to Enjoy Work as Much as Play; Shadow Mountain: Layton, UT, USA, 1985. [Google Scholar]
- De Quadros, G.B.F. Construindo o estado da arte da gamificação. In Anais do Encontro Virtual de Documentação em Software Livre e Congresso Internacional de Linguagem e Tecnologia Online; CILTec: Minas Gerais, Brasil, 2016; Volume 4, pp. 1–6. [Google Scholar]
- Hélie, J.; Wright, I.; Ziegler, A. Measuring software development productivity: A machine learning approach. In Proceedings of the Conference on Machine Learning for Programming Workshop, Affiliated with FLoC, Oxford, UK, 18–19 July 2018; Volume 18. [Google Scholar]
- King, N.C.d.O.; Lima, E.P.d.; Costa, S.E.G.d. Produtividade sistêmica: Conceitos e aplicações. Production 2014, 24, 160–176. [Google Scholar] [CrossRef] [Green Version]
- Ciervo, J.; Shen, S.; Stallcup, K.; Thomas, A.; Farnum, M.; Lobanov, V.; Agrafiotis, D. A new risk and issue management system to improve productivity, quality, and compliance in clinical trials. JAMIA Open 2019, 2. [Google Scholar] [CrossRef] [PubMed] [Green Version]
- Palvalin, M.; Vuolle, M.; Jääskeläinen, A.; Laihonen, H.; Lönnqvist, A. SmartWoW—Constructing a tool for knowledge work performance analysis. Int. J. Product. Perform. Manag. 2015, 64, 479–498. [Google Scholar] [CrossRef]
- Balk, B.M.; Barbero, J.; Zofío, J.L. A toolbox for calculating and decomposing Total Factor Productivity indices. Comput. Oper. Res. 2020, 115, 104853. [Google Scholar] [CrossRef]
- Allen, I.E.; Seaman, C.A. Likert scales and data analyses. Qual. Prog. 2007, 40, 64–65. [Google Scholar]
- Pressman, R. Software Engineering: A Practitioner’s Approach, 7th ed.; McGraw-Hill, Inc.: New York, NY, USA, 2009. [Google Scholar]
- Martin, R.C. Agile Software Development: Principles, Patterns, and Practices; Prentice Hall PTR: Hoboken, NJ, USA, 2003. [Google Scholar]
- Ampatzoglou, A.; Tsintzira, A.; Arvanitou, E.; Chatzigeorgiou, A.; Stamelos, I.; Moga, A.; Heb, R.; Matei, O.; Tsiridis, N.; Kehagias, D.D. Applying the Single Responsibility Principle in Industry: Modularity Benefits and Trade-offs. In Proceedings of the Evaluation and Assessment on Software Engineering, EASE 2019, Copenhagen, Denmark, 15–17 April 2019; Ali, S., Garousi, V., Eds.; ACM: Copenhagen, Denmark, 2019; pp. 347–352. [Google Scholar] [CrossRef]
- Rinker, F.; Waltersdorfer, L.; Biffl, S. Towards Test-Driven Model Development in Production Systems Engineering. In Proceedings of the 22nd International Conference on Enterprise Information Systems, ICEIS 2020, Prague, Czech Republic, 5–7 May 2020; Filipe, J., Smialek, M., Brodsky, A., Hammoudi, S., Eds.; SCITEPRESS: Prague, Czech Republic, 2020; Volume 1, pp. 213–219. [Google Scholar] [CrossRef]
- Richardson, C. Microservices Patterns: With Examples in Java; Manning Publications: New York, NY, USA, 2018. [Google Scholar]
- Sutherland, J. Scrum, a Arte de Fazer o Dobro do Trabalho em Metade do Tempo; LUA DE PAPEL: New York, NY, USA, 2016. [Google Scholar]
- Scott, E.; Charkie, K.N.; Pfahl, D. Productivity, Turnover, and Team Stability of Agile Teams in Open-Source Software Projects. In Proceedings of the 46th Euromicro Conference on Software Engineering and Advanced Applications, SEAA 2020, Portoroz, Slovenia, 26–28 August 2020; IEEE: Piscataway, NJ, USA, 2020; pp. 124–131. [Google Scholar] [CrossRef]
- Machuca-Villegas, L.; Gasca-Hurtado, G.P.; Puente, S.M.; Tamayo, L.M.R. An Instrument for Measuring Perception about Social and Human Factors that Influence Software Development Productivity. JUCS J. Univers. Comput. Sci. 2021, 27, 111–134. [Google Scholar] [CrossRef]
- Murphy-Hill, E.; Jaspan, C.; Sadowski, C.; Shepherd, D.; Phillips, M.; Winter, C.; Knight, A.; Smith, E.; Jorde, M. What Predicts Software Developers’ Productivity? IEEE Trans. Softw. Eng. 2019, 47, 582–594. [Google Scholar] [CrossRef] [Green Version]
- Oliveira, E.; Conte, T.; Cristo, M. Fatores de InfluêNcia na Produtividade dos Desenvolvedores de Organizações de Software. Ph.D. Thesis, Universidade Federal do Amazonas, Manaus, Spain, 2017. [Google Scholar]
- Sauerssig, R.H.S.S.; Sparemberger, A.; Zamberlan, L.; Büttenbender, P.L.; Kuhn, I.N. Impacto e Influência dos Fatores da Qualidade de vida no Desempenho Pessoal: O caso de uma Instituição de Ensino Superior (IES/RS). XIX Coloq. Int. Gest. Univ. 2019. [Google Scholar]
- Russo, D.; Hanel, P.H.P.; Altnickel, S.; van Berkel, N. Predictors of well-being and productivity among software professionals during the COVID-19 pandemic - a longitudinal study. Empir. Softw. Eng. 2021, 26, 62. [Google Scholar] [CrossRef] [PubMed]
- Wagner, S.; Ruhe, M. A Systematic Review of Productivity Factors in Software Development. arXiv 2018, arXiv:1801.06475. [Google Scholar]
- Besker, T.; Martini, A.; Bosch, J. Software developer productivity loss due to technical debt - A replication and extension study examining developers’ development work. J. Syst. Softw. 2019, 156, 41–61. [Google Scholar] [CrossRef]
- Vargas, P.S.C.; Mauricio, D. New Factors Affecting Productivity of the Software Factory. IJITSA 2020, 13, 1–26. [Google Scholar] [CrossRef]
- Chapetta, W.A.; Travassos, G.H. Towards an evidence-based theoretical framework on factors influencing the software development productivity. Empir. Softw. Eng. 2020, 25, 3501–3543. [Google Scholar] [CrossRef]
- Qamar, N.; Malik, A.A. Birds of a Feather Gel Together: Impact of Team Homogeneity on Software Quality and Team Productivity. IEEE Access 2019, 7, 96827–96840. [Google Scholar] [CrossRef]
- Midha, V.; Palvia, P. Factors affecting the success of Open Source Software. J. Syst. Softw. 2012, 85, 895–905. [Google Scholar] [CrossRef] [Green Version]
- Jiang, Q.; Lee, Y.C.; Davis, J.G.; Zomaya, A.Y. Diversity, Productivity, and Growth of Open Source Developer Communities. arXiv 2018, arXiv:1809.03725. [Google Scholar]
- Liao, Z.; Zhao, Y.; Liu, S.; Zhang, Y.; Liu, L.; Long, J. The Measurement of the Software Ecosystem’s Productivity with GitHub. Comput. Syst. Sci. Eng. 2021, 36, 239–258. [Google Scholar] [CrossRef]
Figure 1.
Steps and procedures adopted in the development.

Figure 2.
Factors that influence Productivity and their respective rating.

Figure 3.
Platform architecture.

Figure 4.
Dashboard screen.

Figure 5.
Companies list.

Figure 6.
User registration.

Figure 7.
Factor registration.

Figure 8.
User profile.

Figure 9.
Trophies Room.

Figure 10.
Productivity measurement.

Figure 11.
Team 1 progress.

Figure 12.
Team 2 progress.

Figure 13.
Team 1 user evaluation about the tool.

Figure 14.
Team 2 user evaluation about the tool.

Table 1.
Features and iterations.
| Feature | Iteration |
|---|---|
| User registration | 1 |
| Login | 1 |
| Companies registration | 2 |
| Factor registration | 2 |
| Measurement with registered factors | 3 |
| Leaderboards | 4 |
| Trophy room | 4 |
| Combos | 4 |
Table 2.
Profile of the development teams.
| ID | Team | Role | Experience | Level |
|---|---|---|---|---|
| P01 | 1 | Project Manager | more 30 years | Graduate |
| P02 | 1 | Full-Stack Developer | 7 years | Postgraduate |
| P03 | 1 | Integration Architect | 14 years | Graduate |
| P04 | 1 | Full-Stack Developer | 5 years | Master’s student |
| P05 | 2 | Back-End Developer | 8 years | Postgraduate |
| P06 | 2 | Front-End Developer | 15 years | High school |
| P07 | 2 | Project Manager | more 20 years | Graduate |
| P08 | 2 | Full-Stack Developer | 5 years | Master’s student |
Table 3.
Selected factors for the case study.
| Category | Selected Factors |
|---|---|
| People | 1. Collaboration between team members |
| 2. Ease of communication | |
| 3. Motivation | |
| 4. Team cohesion | |
| 5. Skills and competences | |
| Product | 6. Lost time |
| 7. Poor code quality | |
| 8. Completeness of design | |
| 9. Requirements | |
| 10. Quality | |
| 11. Adequate documentation | |
| Organization | 12. Code reuse |
| 13. Feedback Culture | |
| 14. Access to information | |
| 15. Efficient meetings | |
| 16. Working environment | |
| 17. Trust in other members | |
| OSS | 18. Organizational diversity |
| 19. Application complexity | |
| 20. Team engagement | |
| 21. IT investments |
Publisher’s Note: MDPI stays neutral with regard to jurisdictional claims in published maps and institutional affiliations. |
© 2021 by the authors. Licensee MDPI, Basel, Switzerland. This article is an open access article distributed under the terms and conditions of the Creative Commons Attribution (CC BY) license (https://creativecommons.org/licenses/by/4.0/).
Share and Cite
MDPI and ACS Style
Mota, J.S.; Tives, H.A.; Canedo, E.D. Tool for Measuring Productivity in Software Development Teams. Information 2021, 12, 396. https://0-doi-org.brum.beds.ac.uk/10.3390/info12100396
AMA Style
Mota JS, Tives HA, Canedo ED. Tool for Measuring Productivity in Software Development Teams. Information. 2021; 12(10):396. https://0-doi-org.brum.beds.ac.uk/10.3390/info12100396
Chicago/Turabian StyleMota, Jhemeson Silva, Heloise Acco Tives, and Edna Dias Canedo. 2021. "Tool for Measuring Productivity in Software Development Teams" Information 12, no. 10: 396. https://0-doi-org.brum.beds.ac.uk/10.3390/info12100396
Note that from the first issue of 2016, this journal uses article numbers instead of page numbers. See further details here.