
Application of Multi-Criteria Decision-Making Models for the Evaluation Cultural Websites: A Framework for Comparative Analysis


Department of Environment, Ionian University, 49100 Kerkira, Greece
Information 2021, 12(10), 407; https://0-doi-org.brum.beds.ac.uk/10.3390/info12100407
Submission received: 24 August 2021
/
Revised: 20 September 2021
/
Accepted: 27 September 2021
/
Published: 30 September 2021
(This article belongs to the Special Issue Evaluating Methods and Decision Making)
Abstract
:Websites in the post COVID-19 era play a very important role as the Internet gains more visitors. A website may significantly contribute to the electronic presence of a cultural organization, such as a museum, but its success should be confirmed by an evaluation experiment. Taking into account the importance of such an experiment, we present in this paper DEWESA, a generalized framework that uses and compares multi-criteria decision-making models for the evaluation of cultural websites. DEWESA presents in detail the steps that have to be followed for applying and comparing multi-criteria decision-making models for cultural websites’ evaluation. The framework is implemented in the current paper for the evaluation of museum websites. In the particular case study, five different models are implemented (SAW, WPM, TOPSIS, VIKOR, and PROMETHEE II) and compared. The comparative analysis is completed by a sensitivity analysis, in which the five multi-criteria decision-making models are compared concerning their robustness.
1. Introduction
The electronic presence of museums in the post COVID-19 era plays a very important role as the number of visitors to the museums constantly reduces due to health constraints. Therefore, many museums have concentrated on improving their online image and services. However, creating the right electronic presence is not easy, and the success of a website can only be confirmed by its evaluation. The evaluation of a website is a complex procedure, which, despite its importance, is often omitted from the website life-cycle. As a result, many researchers have highlighted the need for evaluating museum websites [1,2,3,4,5,6,7,8].
In an effort to help developers and stakeholders implement evaluation experiments, several researchers have proposed frameworks, criteria, dimensions, and theories that could be used for this purpose. In some evaluation experiments, a first phase is proposed where experts independently extract the criteria that are going to be used in the next phases of the experiment [9]. Other proposed specific frameworks define both the criteria and the steps of the evaluation experiment (e.g., [2,4]).
A way of combining the dimensions and criteria that are taken into account while evaluating a website is using a multi-criteria decision-making (MCDM) model. Different models have been used in the past for this purpose. For example, Analytic Hierarchy Process (AHP) [10] has been used solely [11] or in combination with other methods, such as TOPSIS [2], fuzzy TOPSIS [5], WPM, fuzzy WPM, and fuzzy SAW [12,13].
Despite the fact that many MCDM methods are available, no single method has been considered as the most suitable for all types of decision-making situations [14,15,16]. A major criticism of MCDM is that different methods lead to different taxonomies when applied to the same problem [15,17,18]. For this purpose, lately, different comparative analyses of MCDM methods have been implemented in different domains [15,19,20,21,22,23,24,25,26,27,28,29].
In light of the above, the main contribution of this paper is on presenting a generalized framework that uses and compares MCDM models for the evaluation of cultural websites. The framework is called DEWESA (dimensions for evaluating websites and sensitivity analysis) and presents in detail the steps that have to be followed for selecting dimensions and criteria, their weights of importance, the MCDM models that seem to be more appropriate for the specific category of websites, and the comparative analysis that has to be performed to select which MCDM model is the most suitable.
DEWESA is implemented in the current paper for the evaluation of museum websites. More specifically, we used the dimensions and the criteria defined during the application of AHP for the evaluation of museums’ websites in a previous experiment [25]. New studies confirm these criteria [17,18,30] but many have a different focus, e.g., some implement heuristic evaluation [6]. Then, AHP was used for the estimation of the weights of the criteria, and five different MCDM models were implemented in turn. More specifically, we ran an inspection evaluation, in which expert users were asked to evaluate five websites of worldwide well-known museums. The results of the evaluation were processed by the different MCDM models, and their results were compared. For this purpose, we applied simple additive weighting (SAW) [25,31], weighted product model (WPM) [15], TOPSIS (technique for order of preference by similarity to ideal solution) [32], VIKOR model [33,34,35], and PROMETHEE II (preference ranking organization method for enrichment evaluations II) [36,37]. As a next step of DEWESA, a comparative analysis of the five MCDM models for the particular domain was implemented.
The main aim of this framework is the comparative analysis of the different models with respect to their consistency and robustness and, therefore, a sensitivity analysis was performed. Sensitivity analysis is an important procedure that allows testing the degree of change in the overall ranking of the alternatives when input data are slightly modified. In most approaches, the sensitivity analysis that takes place involves estimating the changes in the scores of alternatives, for a given change in the weight of one criterion or to all criteria. Although sensitivity analysis of the models has been implemented before in different domains [27,38,39,40], it is the first time that it is implemented for estimating the consistency of the MCDM models in museums’ website evaluation.
2. Framework
In this section, the generalized framework DEWESA for using MCDM models in websites’ evaluation is presented. The framework presents the steps that have to be followed for selecting dimensions and their weights for website evaluation as well as the MCDM models that seem to be more appropriate for the specific category of websites.
The main steps of the framework DEWESA are:
- Dimensions and Criteria. In this step, the dimensions and the criteria are defined. The dimensions are used for the evaluation of the website. The value of each dimension is affected by a subset of criteria. The criteria and the dimensions do not have the same importance; therefore, their weights must be calculated. For this purpose, AHP is used. The application of AHP involves setting a pair-wise comparison matrix for the dimensions and a pair-wise comparison matrix for the sub-criteria of each dimension. Then, an open-source decision-making software that implements AHP, such as ‘Priority Estimation Tool’ (PriEst) [41], could be used to estimate the weights. For the case of museum websites’ evaluation, this step is analyzed in Section 2.
- Set of alternative websites. The set of alternative websites is set (Section 3).
- Values of the Dimensions. A set of decision-makers is set in this step. The decision-makers interact with the museum websites and give value to the criteria. The final values of the criteria are estimated as a geometric mean of the corresponding values of all decision makers. The values of the dimensions are acquired as a weighted sum of the criteria. Section 4 provides an example of values of criteria and dimensions.
- MCDM models. In this step, the different MCDM models are applied. The number of MCDM models does not implementation of DEWESA. In the particular case study, five MCDM models are applied and compared (Section 5).
- Comparative Analysis. In order to compare the MCDM models, two statistical values are calculated: the Pearson correlation coefficient for making a pair-wise comparison of the values produced by the models and the Spearman’s correlation coefficient for making a pair-wise comparison of the rankings of the alternative websites (Section 6).
- Sensitivity Analysis. A sensitivity analysis is performed in order to check the consistency of the results produced by each MCDM model and evaluate the robustness of each model. The implementation of the sensitivity analysis involves using a different weighting scheme and re-calculating the final value for each alternative website using each one of the MCDM models. Then, the values and rankings of each MCDM model using the two different schemes are compared. This comparison involves calculating the Pearson correlation coefficient for comparing the values of each model using the different schemes of weights and checking the correlation of rankings. For the comparison of ranking, DEWESA checks how many identical rankings were among the rankings of each model using the different schemes and estimates the Spearman’s rho correlation for each model using the two schemes of weights. This procedure is given in detail for the comparison of SAW, WPM, TOPSIS, VIKOR, and PROMETHEE II in Section 7.
The analysis of the steps is presented in the subsequent sections, and an example for museum websites evaluation is presented.
3. Dimensions and Criteria
In this step of the framework, the dimensions used for the evaluation of the websites should be defined. Using the DEWESA, for the evaluation of museum websites, we had to define the set of dimensions for museum websites evaluation. Therefore, we used as a basis the dimensions proposed by Kabassi [2] based on the analysis of criteria used in the evaluation experiments of museums’ websites [14] and have gone through later studies to check whether new dimensions have been proposed. New studies confirm these criteria [3,16,17] but many have a different focus, e.g., some experiments implement heuristic evaluation, in which the criteria are prefixed [6]. The three dimensions proposed by Kabassi [2] are:
- Usability
- Functionality
- Mobile Interaction
Each one of these dimensions depends on several criteria. The values of the different criteria and their weights are used for calculating the final values of the dimensions. In this approach, we focus on the values of the dimensions and not the values of the criteria.
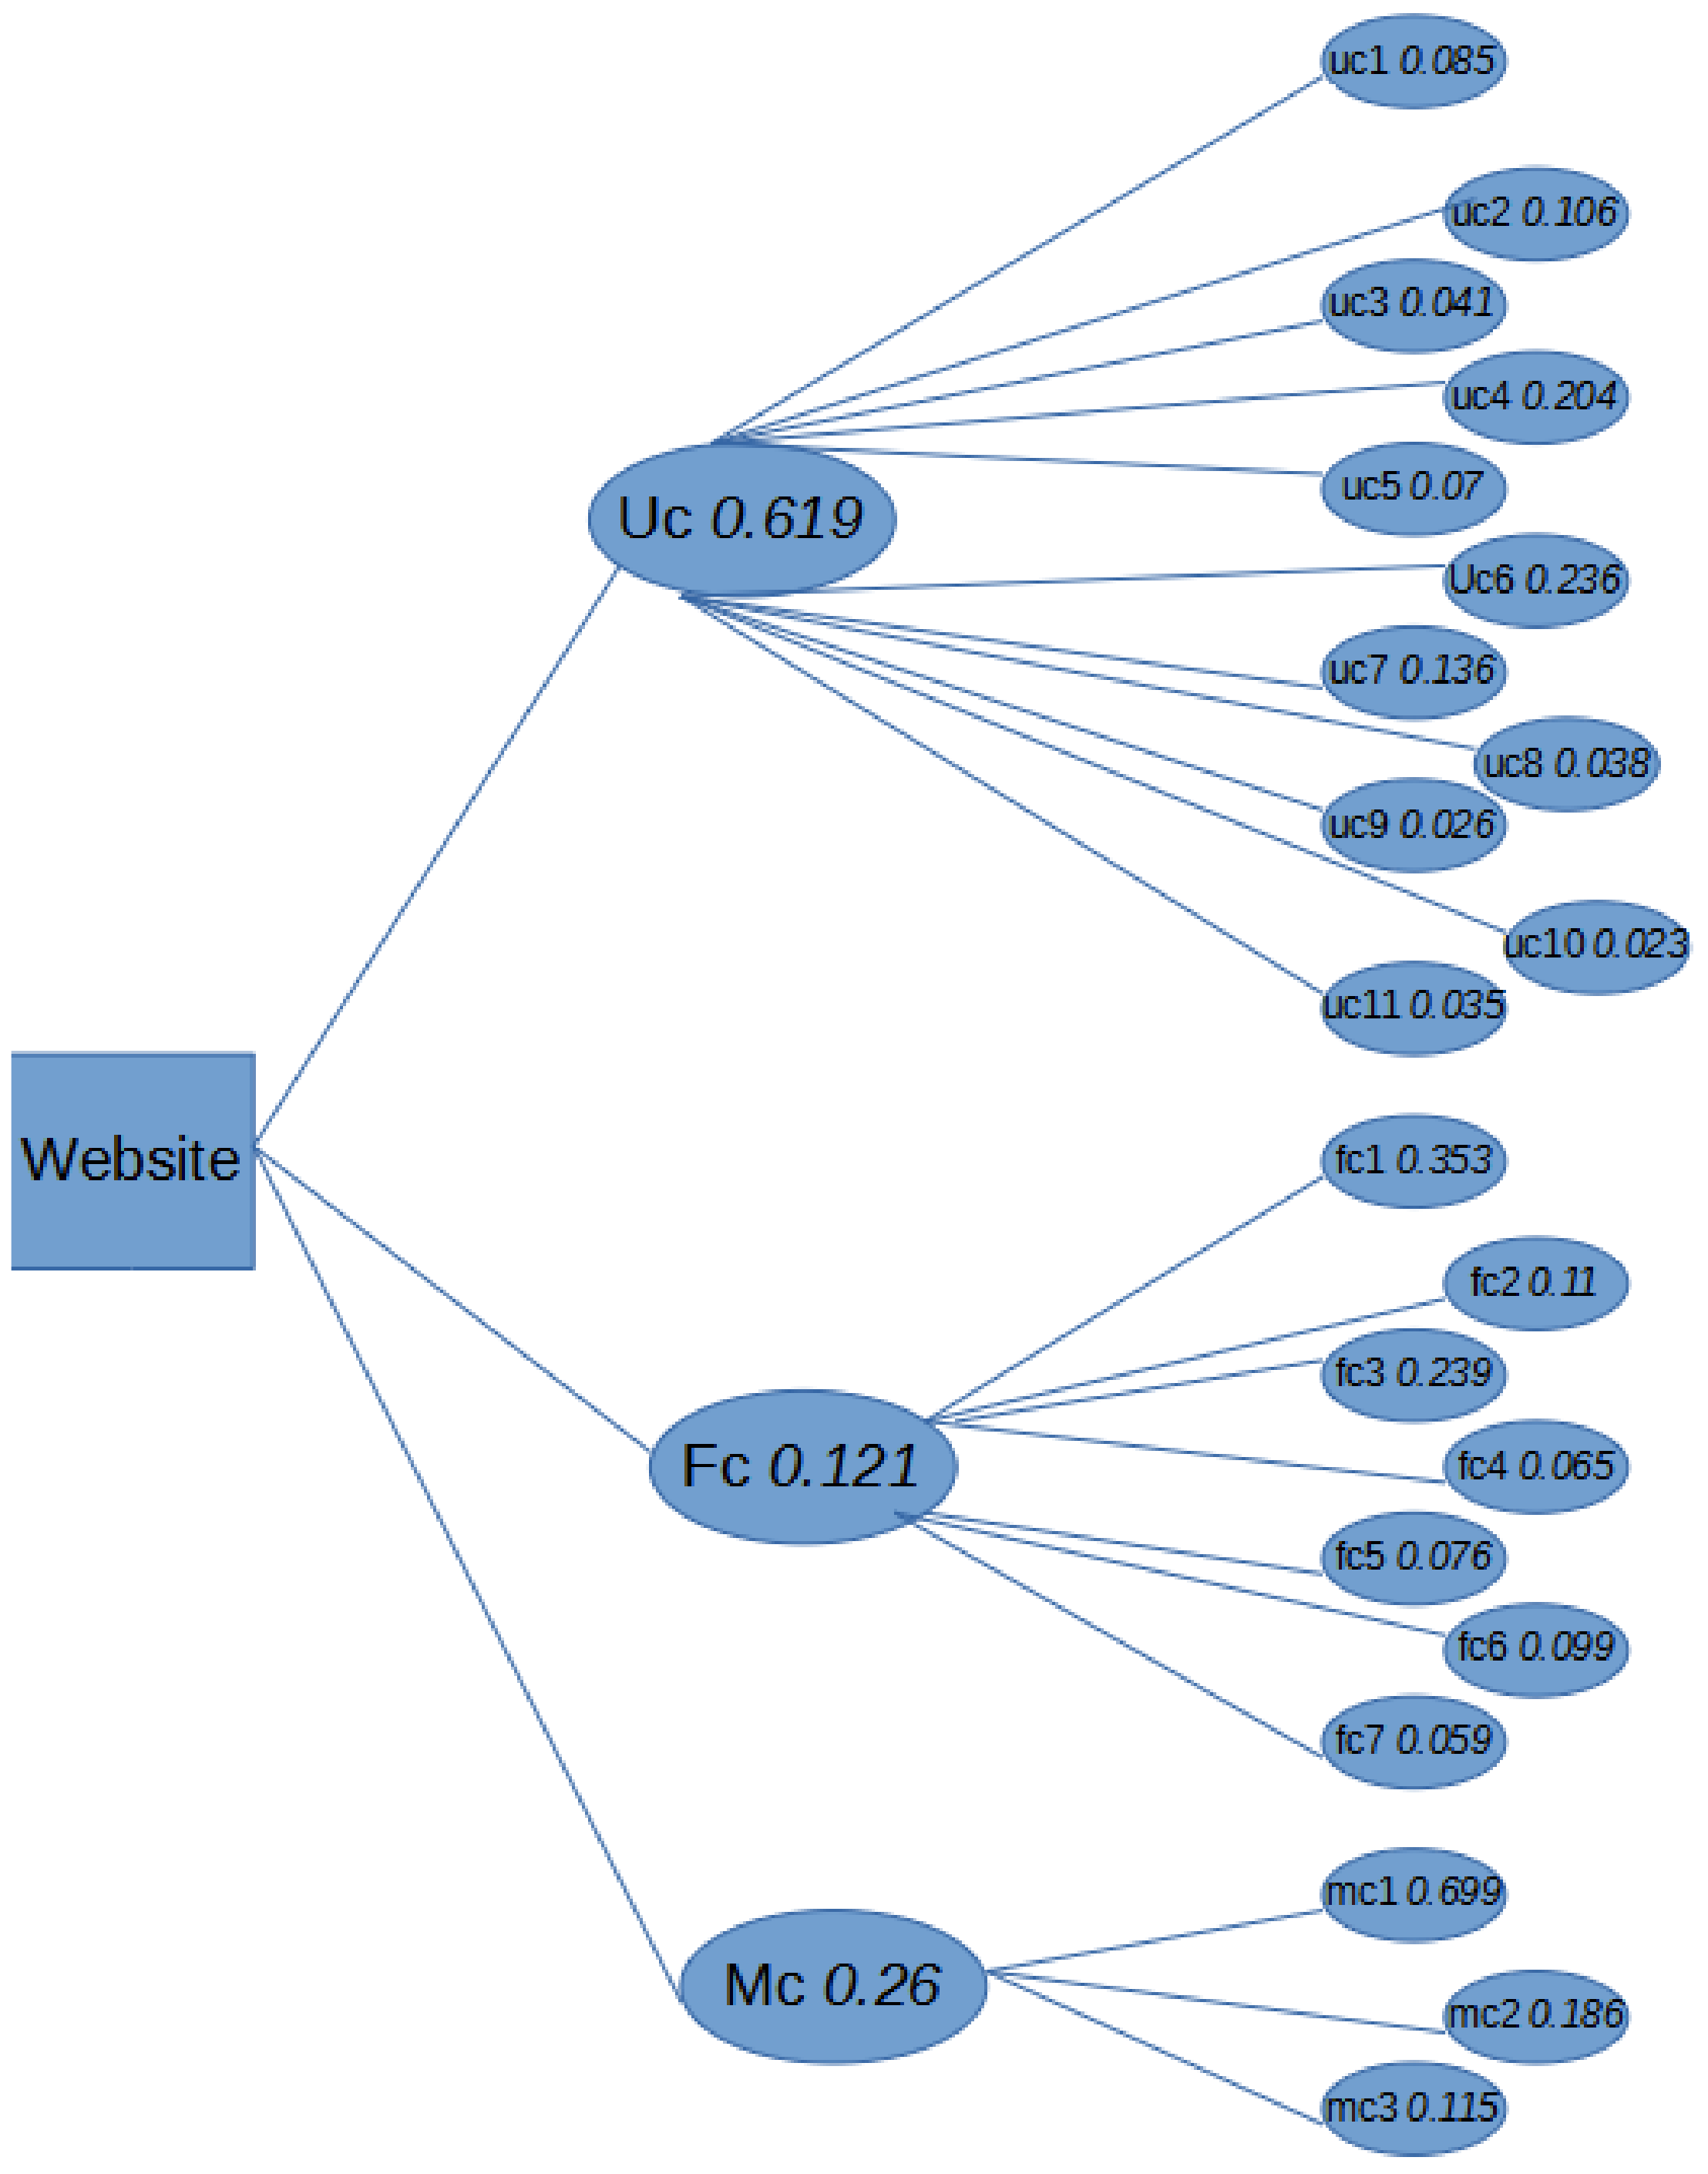
The dimension ‘Usability’ depends on eleven criteria: uc1: currency/clarity/text comprehension, uc2: consistency, uc3: accessibility, uc4: quality content, uc5: user interface and metaphors, uc6: overall presentation–design, uc7: structure/navigation/orientation, uc8: interactivity and feedback, uc9: multimedia usability, uc10: learnability, and uc11: efficiency. The seven criteria that are taken into account within the context of ‘Functionality’ are: fc1: multilingualism, fc2: multimedia features, fc3: service mechanisms, fc4: web communities, fc5: maintainability, compliance, and reliability, fc6: adaptivity/adaptability, and fc7: technical issues. The last dimension that is taken into account while evaluating museums’ websites is ‘Mobile Interaction’ [42]. The criteria that are evaluated within this context are: mc1: whole experience in a mobile device, mc2: educational experience, and mc3: effectiveness of learning.
The dimensions are not taken equally into consideration while evaluating a museum’s website. Furthermore, the criteria are not taken equally important in the estimation of the final value of each dimension. For this purpose, AHP is used for calculating the values of the weights both of dimensions and criteria.
AHP has a formal method of estimating weights and supporting hierarchies of criteria such as the one we have in the current experiment. According to AHP, a set of evaluators consisting of both software engineers and domain experts was formed. Each expert had to complete one matrix for pair-wise comparison of the dimensions and three matrices for pair-wise comparisons of the criteria of each dimension. The values that the experts used for completing the tables varied from 1/9 to 9, as Saaty [10] proposed. The final matrices of pair-wise comparisons of the criteria were formed by calculating the geometric mean of the corresponding values of the experts’ matrices. This procedure resulted in Table 1, Table 2, Table 3 and Table 4.
As soon as the final matrices have been completed, the principal eigenvalue and the corresponding normalized right eigenvector of each matrix give the relative importance of the various criteria being compared. The elements of the normalized eigenvector are the weights of dimensions or sub-criteria. These estimations are made using the ‘Priority Estimation Tool’ (PriEst) [41] and are presented in Figure 1.
4. Alternative Museums’ Websites and Criteria’s Values
The alternative museums’ websites that have been selected to be evaluated and compared in the current experiment are those of the five big museums of European cities. More specifically, the Louvre Museum in Paris, the British Museum in London, the Rijksmuseum in Amsterdam, the Acropolis Museum in Athens, and the Del Prado Museum in Madrid were selected (Figure 2, Figure 3, Figure 4, Figure 5 and Figure 6). These websites were assigned to:
- A1: Louvre Museum in Paris.
- A2: British Museum in London.
- A3: Rijksmuseum in Amsterdam.
- A4: Acropolis Museum in Athens.
- A5: Del Prado Museum in Madrid.
Figure 2.
The website of the Louvre museum on 30 September 2021.

Figure 3.
The website of the British museum today.

Figure 4.
The website of the Rijksmuseum on 30 September 2021.

Figure 5.
The website of the Acropolis museum today.

Figure 6.
The website of the Prado museum today.

The experts that evaluate the alternative websites interact with its interface and have to provide values to the criteria. This procedure is presented in the next section.
5. Estimating Dimensions’ Values
Nine expert users (three web designers, one software engineer, three curators, and two archaeologists) were asked to visit the websites of the museums and interact with them. At the end of their interaction, they were asked to provide values to the sub-criteria and not to the main dimensions. The final value of each sub-criterion was calculated as a geometric mean of the nine values assigned by the nine evaluators (Table 5).
The values of the main dimensions will be calculated as a weighted sum of the corresponding sub-criteria:
As a result, the values of the dimensions for the five alternative museums’ websites are presented in Table 6.
6. Applying MCDM Models
The main dimensions of each website will be combined using different MCDM models.
6.1. SAW
The simple additive weighting (SAW) [31,32] method consists of estimating a function for every alternative Aj and selecting the one with the highest value. The multi-attribute utility function U is calculated as a linear combination of the values of the n attributes:
where xij is the value of the i dimension for the Aj website.
6.2. WPM
In this paper, we use the approach of WPM proposed by Triantafyllou [15]. In this alternative approach of WPM, the following value is calculated for each website: , for j = 1, …, 5.
The term denotes the total performance value of the website .
6.3. TOPSIS
The central principle in TOPSIS model is that the best alternative should have the shortest distance from the ideal solution and the farthest distance from the negative-ideal solution.
Calculate Weighted Ratings. The weighted value is calculated as: , where wi is the weight, and xij is the value of the dimension i.
Identify Positive-Ideal and Negative-Ideal Solutions. The positive ideal solution is the composite of all best attribute ratings attainable and is denoted: , where is the best value for the dimension i among all alternatives. The negative-ideal solution is the composite of all worst attribute ratings attainable and is denoted: , where is the worst value for the dimension i among all websites.
Calculate the separation measure from the positive-ideal and negative-ideal alternative. The separation of each alternative from the positive-ideal solution is given by the n-dimensional Euclidean distance: , where j is the index related to the alternatives, and i is one of the n attributes. Similarly, the separation from the negative-ideal solution is given by .
Calculate Similarity Indexes. The similarity to positive-ideal solution, for alternative j, is finally given by with . The alternatives can then be ranked according to in descending order.
6.4. VIKOR
The basic concept of the VIKOR model lies in defining the positive and negative ideal points, which was first put forth by Opricovic and Tzeng [33,34].
Estimating the best and worst values of all dimensions
where fij is the weighted value of each dimension and is calculated as: fij = wjxji, where wj is the weight, and xji is the value of the dimension j.
Computing the values
where wj, j = 1, 2, 3 are the weights of dimensions, representing the decision maker’s relative preference for the importance of the dimensions.
Computing the values
Determining the value of/for i = 1–5 and ranking the alternatives by the values of Qi
The values of Q for each website are presented in Table 5. Taking into account these values, the alternatives are sorted Q in ascending order and compared with the ranking made also using S and R.
6.5. PROMETHEE II
PROMETHEE II creates a complete pre-order on the set of possible websites that can be proposed to the decision-maker in order to solve the decision problem. The steps of PROMETHEE II after having defined dimensions, their values, and their weights of importance are:
Making comparisons and calculate preference degree. This step computes, for each pair of websites and each dimension, the value of the preference degree. Let be the value of a dimension j for a website a. We note , the difference of the value of a dimension j for two websites a and b.
is the value of the preference degree of a dimension j for two websites a and b. The preference functions used to compute these preference degrees are defined such as:
Aggregating the preference degrees of all dimensions for pair-wise websites. This step consists of aggregating the preference degrees of all dimensions for each pair of possible websites. For each pair of possible websites, we computed a global preference index. Let C be the set of considered dimensions and the weight associated with dimension j. The global preference index for a pair of possible websites a and b is computed as follows:
Calculate positive and negative outranking flow. This step, which is the first that concerns the ranking of the possible websites, consists of computing the outranking flows. For each possible website a, we computed the positive outranking flow and the negative outranking flow . Let A be the set of possible websites and n the number of possible websites. The positive outranking flow of a possible website a is computed by the following formulae:
The negative outranking flow of a possible website a is computed by the following formulae: when .
Calculate the net outranking flow. An outranking flow is calculated for each alternative website as follows: .
Ranking websites. The ranking of museums’ websites is performed according to the value of .
7. Comparison of the MCDM Models
As soon as all the MCDM models have been applied, the final value for each alternative website using each one of the MCDM models is calculated. Those values are further used for ranking the alternative websites. Both the values and the ranking order of the websites using the five MCDM models are presented in Table 7.
In order to compare the MCDM models, we calculated the Pearson correlation coefficient for making a pair-wise comparison of the values produced by the models and the Spearman’s correlation coefficient for making a pair-wise comparison of the rankings of the alternative websites (Table 8 and Table 9). Spearman’s rho correlation is estimated by:
where is the rank different at position i and n is the number of ranks.
Both values of the Pearson and Spearman’s rho correlation coefficient revealed a high correlation of SAW and WPM, which was quite expected, as the reasoning of these two models is considered rather similar. A high correlation is also found between TOPSIS and SAW or TOPSIS and WPM. The lower correlation was spotted between TOPSIS and VIKOR or TOPSIS and PROMETHEE II.
In comparative studies, SAW has been compared with WPM [27,45], TOPSIS [27,28,45,46,47], VIKOR [27,47], and PROMETHEE II [28]. WPM has only been compared with TOPSIS [27,45] and VIKOR [27]. TOPSIS has been compared with SAW and WPM, as mentioned above, as well as with VIKOR [47,48,49] and PROMETHEE II [28,38,49]. Finally, VIKOR has been also compared with PROMETHEE II [49]. However, in most of these studies, general remarks are made and not specific statistical values, except for the study of Valikipour et al. [47] that uses Spearman’s rho and concludes that TOPSIS has a high correlation with SAW. This is in line with the results of the current study. The study of Widianta et al. [28] revealed a high correlation of TOPSIS with PROMETHEE. This is not completely in line with the current study, but the difference in the domain of application of the MCDM model justifies the disagreement. Regarding the evaluation of websites of museums, a comparison of MCDM models has been implemented for websites of museums’ conservation labs between fuzzy SAW and fuzzy WPM [12] and another one for environmental websites between TOPSIS and VIKOR [50].
8. Sensitivity Analysis of the MCDM Models
In order to check the consistency of the results produced by each MCDM model and evaluate the robustness of each model, we performed a sensitivity analysis. A way of performing sensitivity analysis in using a different scheme of weights or changing the weights of the dimensions one by one. In this case, we use a different scheme of weights, which uses the same weight for all dimensions. This means that all dimensions are considered equally important in the reasoning process, and the weight of each dimension is set to 0.333. We apply the second scheme of weights to the data of the dimensions as these were given by the human experts and re-calculate the final value for each alternative website using each one of the five MCDM models examined in this paper. After having calculated the new values for each alternative, the new ranking of the alternative websites is estimated. The values as well as the ranking of the alternatives using the five different MCDM models are presented in Table 10.
The main aim of the sensitivity analysis is to check how sensitive the MCDM models are in a change of weights of the dimensions. For this purpose, we calculated the Pearson correlation coefficient for each MCDM model. More specifically, the values generated by each MCDM using the two different schemes of weights were compared pair-wise, and the Pearson correlation coefficient was estimated. However, the most important analysis involves checking the rankings generated by the different models. We compared the rankings of websites using the two different schemes by
- checking how many identical rankings were among the rankings of each model using the different schemes;
- estimating the Spearman’s rho correlation for each model using the two schemes of weights.
Table 11 presents the Pearson correlation coefficient, the percentage of identical ranking, and Spearman’s correlation coefficient for each model when the results of the same models are compared using the two different weighting schemes.
One can easily observe that, although VIKOR and PROMETHEE II present a high correlation of the values because they have high values of Pearson correlation coefficient, they have low or null percentages of identical rankings and lower values of Spearman’s correlation coefficient, which means that the correlation of their ranking is very low or non-existent. As a result, VIKOR and PROMETHEE II appear to be very sensitive to changes in weights. Both SAW and WPM have mediocre values of Pearson correlation coefficient, a mediocre percentage of identical rankings, and a quite high Spearman’s correlation coefficient. This means that SAW and WPM are very robust. Finally, TOPSIS has a mediocre sensitivity as the percentage of identical rankings is medium and a quite high Spearman’s correlation coefficient but not that high value of Pearson correlation coefficient. In view of the statistical analysis presented in Table 11, VIKOR is presented to be the most sensitive in the changing of weights for the dimensions, while SAW and WPM are the most robust and less affected by changes in the weights of the criteria.
9. Conclusions
MCDM models have been used for evaluating and comparing cultural websites in the past [2,12]. However, MCDM models have been criticized for producing different results and no model has proved to be the best in all domains. The aim of this paper was to present a generalized framework for implementing and comparing MCDM models for the evaluation of cultural websites. The generalized framework gives the steps and the details for their implantation in order to apply the MCDM models and compare them. In the light of this information, many researchers can benefit since it would be easier for them to apply and compare MCDM models for the evaluation of cultural websites.
DEWESA was designed for cultural websites and has been applied for the evaluation of museum websites. However, the steps could be used by other researchers in the evaluation of any website. Furthermore, they could make changes by adjusting the dimensions and/or the MCDM models.
In this paper, DEWESA has been used to evaluate museum websites and, for this purpose, we apply and compare five different MCDM models. The evaluation of the museum websites is based on three main dimensions: usability, functionality, and mobile interaction. The dimensions and the criteria defined in this paper based on a study of Kabassi [2] and confirmed by other studies are used for the evaluation of museum websites and could be also used for the evaluation of other websites, as well. For the processing of the data of the evaluation and the aggregation of the values of the dimensions, five different models are used in turn: SAW, WPM, TOPSIS, VIKOR, and PROMETHEE II.
The comparative analysis proposed by DEWESA involves the estimation of statistical terms for comparing the values and the rankings of each model using the different schemes of weights. More specifically, Pearson correlation coefficient is used for comparing the values, and Spearman’s rho correlation is used for comparing the rankings of each model using the different schemes of weights. These statistical terms proved very effective for the extraction of conclusions on the similarity of results of MCDM models. In the implementation of DEWESA for museum websites, the statistical analysis of the comparison of the MCDM models revealed a high correlation of SAW and WPM, which was quite expected as the reasoning of these two models is considered rather similar. The lower correlation was spotted between TOPSIS and VIKOR or PROMETHEE II.
In order to check the robustness of the MCDM models, DEWESA implements a sensitivity analysis. For this purpose, the generalized framework proposes using a different scheme of weights, in which equal weights were used for all dimensions, and re-calculated all the values of the alternatives using the different MCDM models. In the implementation of DEWESA for the evaluation of museums’ websites, conclusions were drawn for the comparison of the five MCDM models applied: SAW, WPM, TOPSIS, VIKOR, PROMETHEE II. Indeed, the pair-wise comparison of the models using the two different weighting schemes revealed that VIKOR has the highest sensitivity in the change of the weights of criteria while SAW and WPM are considered to be rather robust and maintain partly the ranking of the alternatives despite the change of weights.
A possible limitation of the paper is that DEWESA has not been checked for the evaluation of other cultural websites to test its effectiveness. Furthermore, its effectiveness for the evaluation of other websites in other domains should be confirmed. Therefore, it is among our future plans to implement DEWESA in the other cultural websites and websites of different domains to check its usefulness and efficiency. Finally, it is intended to use DEWESA for the comparison of more than five MCDM models for the evaluation of museum websites.
Funding
This research received no external funding.
Institutional Review Board Statement
Not applicable.
Informed Consent Statement
Not applicable.
Data Availability Statement
Not applicable.
Conflicts of Interest
The authors declare no conflict of interest.
References
- Cunnliffe, D.; Kritou, E.; Tudhope, D. Usability evaluation for museum web sites. Mus. Manag. Curatorship 2001, 19, 229–252. [Google Scholar] [CrossRef]
- Kabassi, K.; Botonis, A.; Karydis, C. Evaluating the Websites of the Museums’ Conservation Labs: The Hidden Heroes. In Proceedings of the 9th International Conference on Information, Intelligence, Systems and Applications, Zakynthos, Greece, 23–25 July 2018. [Google Scholar]
- Kabassi, Κ.; Karydis, C.; Botonis, A. AHP, Fuzzy SAW and Fuzzy WPM for the evaluation of Cultural Websites. Multimodal Technol. Interact. 2020, 4, 5. [Google Scholar] [CrossRef] [Green Version]
- Kabassi, Κ.; Botonis, A.; Karydis, C. Evaluating Websites of Specialised Cultural Content using Fuzzy Multi-Criteria Decision Making Theories. Informatica 2020, 44, 45–54. [Google Scholar] [CrossRef] [Green Version]
- Kabassi, K.; Martinis, A. Multi-Criteria Decision Making in the Evaluation of the Thematic Museums’ Websites. In Business, Economics, Innovative Approaches to Tourism and Leisure, Proceedings of the 4th International Conference on “Innovative Approaches to Tourism and Leisure: Culture, Places and Narratives in a Sustainability Context”, Athens, Greece, 25–27 May 2017; Katsoni, V., Velander, K., Eds.; 453709_1_En (16); Springer: Berlin/Heidelberg, Germany, 2017; ISBN 978-3-319-67602-9. [Google Scholar]
- Kittur, J. Optimal Generation Evaluation using SAW, WP, AHP and PROMETHEE Multi-Criteria Decision Making Techniques. In Proceedings of the IEEE International Conference on Technological Advancements in Power & Energy, Kollam, India, 24–26 June 2015; pp. 304–309. [Google Scholar]
- Mulliner, E.; Malys, N.; Maliene, V. Comparative analysis of MCDM methods for the assessment of sustainable housing affordability. Omega 2016, 59, 146–156. [Google Scholar] [CrossRef]
- Widianta, M.M.D.; Rizaldi, T.; Setyohadi, D.P.S.; Riskiawan, H.Y. Comparison of Multi-Criteria Decision Support Methods (AHP, TOPSIS, SAW & PROMETHEE) for Employee Placement. J. Phys. Conf. Ser. 2018, 953, 012116. [Google Scholar] [CrossRef]
- Thor, J.; Ding, S.H.; Kamaruddin, S. Comparison of Multi Criteria Decision Making Methods from the Maintenance Alternative Selection Perspective. Int. J. Eng. Sci. 2013, 2, 27–34. [Google Scholar]
- Sałabun, W.; Wątróbski, J.; Shekhovtsov, A. Are MCDA Methods Benchmarkable? A Comparative Study of TOPSIS, VIKOR, COPRAS, and PROMETHEE II Methods. Symmetry 2020, 12, 1549. [Google Scholar] [CrossRef]
- Kiourexidou, M.; Antonopoulos, N.; Kiourexidou, E.; Piagkou, M.; Kotsakis, R.; Natsis, K. Websites with Multimedia Content: A Heuristic Evaluation of the Medical/Anatomical Museums. Multimodal Technol. Interact. 2019, 3, 42. [Google Scholar] [CrossRef] [Green Version]
- Kabassi, Κ.; Amelio, A.; Komianos, V.; Oikonomou, K. Evaluating Museum Virtual Tours: The case study of Italy. Information 2019, 10, 351. [Google Scholar] [CrossRef] [Green Version]
- Sean, H.; Luisa, N.; David, C. A Statistical Comparison between Different Multicriteria Scaling and Weighting Combinations. Int. J. Ind. Oper. Res. 2020, 3, 6. [Google Scholar] [CrossRef]
- Nemeth, B.; Molnar, A.; Bozoki, S.; Wijaya, K.; Inotai, A.; Campbell, J.D.; Kalo, Z. Comparison of weighting methods used in multicriteria decision analysis frameworks in healthcare with focus on low- and middle-income countries. J. Comp. Effectiv. Res. 2019, 8, 195–204. [Google Scholar] [CrossRef] [Green Version]
- Resta, G.; Dicuonzo, F.; Karacan, E.; Pastore, D. The impact of virtual tours on museum exhibitions after the onset of covid-19 restrictions: Visitor engagement and long-term perspectives. SCIRES IT SCIentific RESearch Inf. Technol. 2021, 11, 151–166. [Google Scholar]
- Vakilipour, S.; Sadeghi-Niaraki, A.; Ghodousi, M.; Choi, S.-M. Comparison between Multi-Criteria Decision-Making Methods and Evaluating the Quality of Life at Different Spatial Levels. Sustainability 2021, 13, 4067. [Google Scholar] [CrossRef]
- Sarraf, R.; McGuire, M.P. Integration and comparison of multi-criteria decision making methods in safe route planner. Expert Syst. Appl. 2020, 154, 1113399. [Google Scholar] [CrossRef]
- Saaty, T.L. The Analytic Hierarchy Process; McGraw-Hill: New York, NY, USA, 1980. [Google Scholar]
- Zhang, N.; Wei, G. Extension of VIKOR method for decision making problem based on hesitant fuzzy set. Appl. Math. Model. 2013, 37, 4938–4947. [Google Scholar] [CrossRef]
- Banaitiene, N.; Banaitis, A.; Kaklauskas, A.; Zavadskas, E. Evaluating the life cycle of a building: A multivariant and multiple criteria approach. Omega 2008, 36, 429–441. [Google Scholar] [CrossRef]
- Monistrol, R.; Rovira, C.; Codina, L. Catalonia’s Museums Websites: Analysis and Evaluation Proposal. Available online: https://www.upf.edu/hipertextnet/en/numero-4/museos.html (accessed on 31 July 2016).
- Abounaima, M.C.; Lamrini, L.; Makhfi, N.E.L.; Ouzarf, M. Comparison by Correlation Metric the TOPSIS and ELECTRE II Multi-Criteria Decision Aid Methods: Application to the Environmental Preservation in the European Union Countries. Adv. Sci. Technol. Eng. Syst. J. 2020, 5, 1064–1074. [Google Scholar] [CrossRef]
- Hwang, C.L.; Yoon, K. Multiple Attribute Decision Making: Methods and Applications A State-of-the-Art Survey; Lecture Notes in Economics and Mathematical Systems, 186; Springer: Berlin/Heidelberg, Germany, 1981. [Google Scholar]
- Erdoğan, N.K.; Altınırmak, S.; Karamaşa, Ç. Comparison of multi criteria decision making (MCDM) methods with respect to performance of food firms listed in BIST. Copernic. J. Financ. Account. 2016, 5, 67–90. [Google Scholar] [CrossRef] [Green Version]
- Chitsaz, N.; Banihabib, M.E. Comparison of Different Multi Criteria Decision-Making Models in Prioritizing Flood Management Alternatives. Water Resour. Manag. 2015, 29, 2503–2525. [Google Scholar] [CrossRef]
- Mahmoud, M.R.; Garcia, L.A. Comparison of different multicriteria evaluation methods for the Red Bluff diversion dam. Environ. Model. Soft. 2000, 15, 471–478. [Google Scholar] [CrossRef]
- Opricovic, S. Multicriteria Optimization of Civil Engineering Systems. Ph.D. Thesis, Faculty of Civil Engineering, Belgrade, Serbia, 1998. [Google Scholar]
- Van Welie, M.; Klaasse, B. Evaluating Museum Websites Using Design Patterns; Technical Report Number: IR-IMSE-001; Vrije Universiteit: Amsterdam, The Netherlands, 2004. [Google Scholar]
- Barbosa, M.G.; de Saboya, L.A.; Bevilaqua, D.V. A survey and evaluation of mobile apps in science centers and museums. J. Sci. Commun. 2021, 20, A01. [Google Scholar] [CrossRef]
- Guitouni, A.; Martel, J.M. Tentative guidelines to help choosing an appropriate MCDM method. Eur. J. Oper. Res. 1998, 109, 501–521. [Google Scholar] [CrossRef]
- Kabassi, K. Evaluating Websites of Museums: State of the Art. J. Cult. Herit. 2017, 24, 184–196. [Google Scholar] [CrossRef]
- Opricovic, S.; Tzeng, G.H. Compromise solution by MCDM methods: A comparative analysis of VIKOR and TOPSIS. Eur. J. Oper. Res. 2004, 156, 445–455. [Google Scholar] [CrossRef]
- Opricovic, S.; Tzeng, G.H. Extended VIKOR method in comparison with outranking methods. Eur. J. Oper. Res. 2007, 178, 514–529. [Google Scholar] [CrossRef]
- Pamučar, D.S.; Božanić, D.; Ranđelović, A. Multi-Criteria Decision Making: An example of sensitivity analysis. Serb. J. Manag. 2017, 12, 1–27. [Google Scholar] [CrossRef] [Green Version]
- Brans, J.P. L’elaboration d’instruments d’aide a la decision. In L’Aide a la Decision: Nature, Instruments et Perspectives d’Avenir; Nadeau, R., Landry, M., Eds.; Le Presses de l’Universite Laval: Québec, QC, Canada, 1986; pp. 183–214. [Google Scholar]
- Brans, J.P.; Vincke, P. A Preference Ranking Organisation Method (The PROMETHEE Method for Multiple Criteria Decision-Making). Manag. Sci. 1985, 31, 647–656. [Google Scholar] [CrossRef] [Green Version]
- Kolios, A.; Mytilinou, V.; Lozano-Minguez, E.; Salonitis, K. A Comparative Study of Multiple-Criteria Decision-Making Methods under Stochastic Inputs. Energies 2016, 9, 566. [Google Scholar] [CrossRef] [Green Version]
- Preko, A.; Gyepi-Garbrah, T.F.; Arkorful, H.; Akolaa, A.A.; Quansah, F. Museum experience and satisfaction: Moderating role of visiting frequency. Int. Hosp. Rev. 2020, 34, 203–220. [Google Scholar] [CrossRef]
- Kabassi, K. Comparison of Multi Criteria Decision Making Models: Analysing the Steps in the Domain of Websites’ Evaluation. Int. J. Inf. Technol. Decis. Mak. 2021. to appear. [Google Scholar] [CrossRef]
- Kabassi, K. Evaluating Museum Using a Combination of Decision-Making Theories. J. Herit. Tour. 2019, 14, 544–560. [Google Scholar] [CrossRef]
- Zlaugotne, B.; Zihare, L.; Balode, L.; Kalnbalkite, A.; Khabdullin, A.; Blumberga, D. Multi-Criteria Decision Analysis Methods Comparison. Environ. Clim. Technol. 2020, 24, 454–471. [Google Scholar] [CrossRef]
- Sirah, S.; Mikhailov, L.; Keane, L.; John, A. PriEsT: An interactive decision support tool to estimate priorities from pair-wise comparison judgments. Inter. Trans. in Oper. Res. 2015, 22, 203–382. [Google Scholar]
- Kokaraki, N.; Hopfe, C.J.; Robinson, E.; Nikolaidou, E. Testing the reliability of deterministic multi-criteria decision-making methods using building performance simulation. Renew. Sustain. Energy Rev. 2019, 112, 991–1007. [Google Scholar] [CrossRef]
- Triantafyllou, F. Multi Criteria Decision Making Methods: A Comparative Study; Kluwer Academic Publishers: Dordrecht, The Netherlands, 2000. [Google Scholar]
- Sylaiou, S.; Killintzis, V.; Paliokas, I.; Mania, K.; Patias, P. Usability Evaluation of Virtual Museums’ Interfaces Visualization Technologies. In Proceedings of the 6th International Conference, VAMR 2014; Heraklion, Crete, Greece, 22–27 June 2014, Shumaker, R., Lackey, S., Eds.; Part II, LNCS 8526; Springer: Cham, Switzerland; pp. 124–133.
- Vassoney, E.; Mammoliti Mochet, A.; Desiderio, E.; Negro, G.; Pilloni, M.G.; Comoglio, C. Comparing Multi-Criteria Decision-Making Methods for the Assessment of Flow Release Scenarios from Small Hydropower Plants in the Alpine Area. Front. Environ. Sci. 2021, 9, 635100. [Google Scholar] [CrossRef]
- Zanakis, S.H.; Solomon, A.; Wishart, N.; Dublish, S. Multi-attribute decision making: A simulation comparison of select methods. Eur. J. Oper. Res. 1998, 107, 507–529. [Google Scholar] [CrossRef]
- Fishburn, P.C. Additive Utilities with Incomplete Product Set: Applications to Priorities and Assignments. Oper. Res. 1967, 15, 537–542. [Google Scholar] [CrossRef]
- Yazdani, M.; Graeml, F.R. VIKOR and its Applications: A State-of-the-Art Survey. Int. J. Strateg. Decis. Sci. 2014, 5, 56–83. [Google Scholar] [CrossRef] [Green Version]
- Simanaviciene, R.; Ustinovichius, L. Sensitivity Analysis for Multiple Criteria Decision Making Methods: TOPSIS and SAW. Proc. Soc. Behav. Sci. 2010, 2, 7743–7744. [Google Scholar] [CrossRef] [Green Version]
Figure 1.
Hierarchy of dimensions and criteria as well as their weights of importance according to AHP.
Figure 1.
Hierarchy of dimensions and criteria as well as their weights of importance according to AHP.


Table 1.
Pair-wise comparison matrix of the main dimensions.
| Usability (d1) | Functionality (d2) | Mobile Interaction (d3) | |
|---|---|---|---|
| Usability (d1) | 1 | 4.95 | 2.45 |
| Functionality (d2) | 0.20 | 1 | 0.45 |
| Mobile interaction (d3) | 0.41 | 2.21 | 1 |
Table 2.
Pair-wise comparison matrix of the sub-criteria of usability.
| uc1 | uc2 | uc3 | uc4 | uc5 | uc6 | uc7 | uc8 | uc9 | uc10 | uc11 | |
|---|---|---|---|---|---|---|---|---|---|---|---|
| uc1 | 1.00 | 0.50 | 2.63 | 0.27 | 1.11 | 0.71 | 0.84 | 3.00 | 2.71 | 3.00 | 3.00 |
| uc2 | 2.00 | 1.00 | 3.00 | 0.50 | 3.00 | 0.23 | 0.50 | 3.72 | 3.46 | 3.72 | 3.72 |
| uc3 | 0.42 | 0.33 | 1.00 | 0.21 | 0.33 | 0.14 | 0.27 | 2.00 | 2.00 | 2.00 | 2.00 |
| uc4 | 3.72 | 2.00 | 4.68 | 1.00 | 4.23 | 0.93 | 3.22 | 4.73 | 4.86 | 4.73 | 4.73 |
| uc5 | 0.90 | 0.33 | 3.00 | 0.24 | 1.00 | 0.34 | 0.37 | 3.00 | 2.71 | 3.00 | 3.00 |
| uc6 | 1.41 | 4.28 | 6.96 | 1.07 | 3 | 1.00 | 4.95 | 1.86 | 6.65 | 5.66 | 7.74 |
| uc7 | 1.19 | 2.00 | 3.66 | 0.33 | 2.71 | 0.20 | 1.00 | 5.00 | 6.00 | 6.74 | 6.74 |
| uc8 | 0.33 | 0.27 | 0.50 | 0.21 | 0.33 | 0.54 | 0.20 | 1.00 | 2.21 | 2.00 | 0.45 |
| uc9 | 0.37 | 0.29 | 0.50 | 0.23 | 0.37 | 0.15 | 0.17 | 0.45 | 1.00 | 2.00 | 0.45 |
| uc10 | 0.33 | 0.27 | 0.50 | 0.21 | 0.33 | 0.18 | 0.15 | 0.50 | 0.50 | 1.00 | 0.45 |
| uc11 | 0.33 | 0.27 | 0.50 | 0.21 | 0.33 | 0.13 | 0.15 | 2.21 | 2.21 | 2.21 | 1.00 |
Table 3.
Pair-wise comparison matrix of the sub-criteria of functionality.
| fc1 | fc2 | fc3 | fc4 | fc5 | fc6 | fc7 | |
|---|---|---|---|---|---|---|---|
| fc1 | 1.00 | 4.12 | 4.12 | 2.00 | 4.43 | 3.00 | 3.00 |
| fc2 | 0.24 | 1.00 | 0.22 | 2.00 | 2.00 | 2.00 | 2.00 |
| fc3 | 0.24 | 4.47 | 1.00 | 4 | 3.46 | 3.22 | 3.22 |
| fc4 | 0.50 | 0.50 | 0.25 | 1.00 | 0.50 | 0.50 | 1 |
| fc5 | 0.23 | 0.50 | 0.29 | 2.00 | 1.00 | 0.45 | 2.21 |
| fc6 | 0.33 | 0.50 | 0.31 | 2.00 | 2.21 | 1.00 | 2.00 |
| fc7 | 0.33 | 0.50 | 0.31 | 1 | 0.45 | 0.50 | 1.00 |
Table 4.
Pair-wise comparison matrix of the sub-criteria of mobile interaction.
| mc1 | mc2 | mc3 | |
|---|---|---|---|
| mc1 | 1.00 | 4.61 | 4.95 |
| mc2 | 0.22 | 1.00 | 2 |
| mc3 | 0.20 | 0.5 | 1.00 |
Table 5.
The data of the evaluation.
| A1 | A2 | A3 | A4 | A5 | |
|---|---|---|---|---|---|
| uc1 | 7.21 | 8.40 | 8.03 | 8.18 | 7.43 |
| uc2 | 7.42 | 7.87 | 8.00 | 7.85 | 7.77 |
| uc3 | 7.42 | 7.87 | 7.07 | 8.15 | 7.77 |
| uc4 | 7.21 | 8.53 | 9.00 | 8.17 | 7.43 |
| uc5 | 5.89 | 4.36 | 7.68 | 6.97 | 6.75 |
| uc6 | 5.89 | 4.36 | 5.79 | 6.60 | 6.21 |
| uc7 | 7.42 | 7.65 | 6.00 | 8.40 | 7.62 |
| uc8 | 6.88 | 7.65 | 8.37 | 7.65 | 5.79 |
| uc9 | 7.75 | 7.65 | 8.75 | 7.56 | 6.75 |
| uc10 | 7.78 | 6.98 | 8.28 | 7.14 | 6.01 |
| uc11 | 7.53 | 7.77 | 7.04 | 7.84 | 6.87 |
| fc1 | 7.54 | 8.29 | 6.63 | 7.07 | 5.98 |
| fc2 | 8.43 | 7.52 | 8.88 | 7.63 | 6.30 |
| fc3 | 7.88 | 7.52 | 8.53 | 7.03 | 6.40 |
| fc4 | 6.87 | 6.98 | 7.18 | 6.52 | 5.10 |
| fc5 | 8.75 | 7.77 | 7.63 | 7.65 | 7.10 |
| fc6 | 7.49 | 6.54 | 8.17 | 7.93 | 7.65 |
| fc7 | 8.75 | 7.74 | 7.84 | 7.73 | 6.41 |
| mc1 | 7.26 | 7.77 | 7.95 | 7.82 | 7.85 |
| mc2 | 8.09 | 7.30 | 6.49 | 7.62 | 7.31 |
| mc3 | 8.75 | 7.65 | 6.95 | 7.75 | 7.40 |
Table 6.
The values of the dimensions.
| A1 | A2 | A3 | A4 | A5 | |
|---|---|---|---|---|---|
| x1 | 6.891 | 6.908 | 7.360 | 7.642 | 7.037 |
| x2 | 7.842 | 7.700 | 7.675 | 7.263 | 6.341 |
| x3 | 7.586 | 7.667 | 7.566 | 7.777 | 7.700 |
Table 7.
Values and ranking of the alternatives based on SAW, WPM, TOPSIS, VIKOR, and PROMETHEE II.
| A1 | A2 | A3 | A4 | A5 | |
|---|---|---|---|---|---|
| SAW-values | 7.187 | 7.201 | 7.451 | 7.631 | 7.125 |
| SAW-ranking | 4 | 3 | 2 | 1 | 5 |
| WPM-values | 7.177 | 7.192 | 7.450 | 7.630 | 7.114 |
| WPM-ranking | 4 | 3 | 2 | 1 | 5 |
| TOPSIS-values | 0.280 | 0.268 | 0.643 | 0.873 | 0.189 |
| TOPSIS-ranking | 3 | 4 | 2 | 1 | 5 |
| VIKOR-values (Q) | 1 | 0.924 | 0.471 | 0 | 0.808 |
| VIKOR-values (S) | 0.854 | 0.752 | 0.506 | 0.047 | 0.715 |
| VIKOR-values (R) | 0.619 | 0.605 | 0.26 | 0.047 | 0.499 |
| VIKOR-ranking | 5 | 4 | 2 | 1 | 3 |
| PROMETHEE II-values | −0.628 | −0.249 | 0.05 | 0.819 | 0.009 |
| PROMETHEE II-ranking | 5 | 4 | 2 | 1 | 3 |
Table 8.
The Pearson correlation coefficient.
| SAW | WPM | TOPSIS | VIKOR | PROMETHEE II | |
|---|---|---|---|---|---|
| SAW | 1 | 1 | 0.999 | −0.952 | 0.818 |
| WPM | - | 1 | 0.999 | −0.951 | 0.816 |
| TOPSIS | - | - | 1 | −0.950 | 0.808 |
| VIKOR | - | - | - | 1 | −0.947 |
| PROMETHEE II | - | - | - | - | 1 |
Table 9.
Spearman’s correlation coefficient.
| SAW | WPM | TOPSIS | VIKOR | PROMETHEE II | |
|---|---|---|---|---|---|
| SAW | 1 | 1 | 0.90 | 0.70 | 0.70 |
| WPM | - | 1 | 0.90 | 0.70 | 0.70 |
| TOPSIS | - | - | 1 | 0.60 | 0.60 |
| VIKOR | - | - | - | 1 | 1 |
| PROMETHEE II | - | - | - | - | 1 |
Table 10.
The values and ranking of the alternatives using the equal weighting scheme.
| A1 | A2 | A3 | A4 | A5 | |
|---|---|---|---|---|---|
| SAW-values | 7.440 | 7.425 | 7.533 | 7.561 | 7.026 |
| SAW-ranking | 3 | 4 | 2 | 1 | 5 |
| WPM-values | 7.429 | 7.416 | 7.532 | 7.558 | 7.004 |
| WPM-ranking | 3 | 4 | 2 | 1 | 5 |
| TOPSIS-values | 0.660 | 0.643 | 0.784 | 0.676 | 0.109 |
| TOPSIS-ranking | 3 | 4 | 1 | 2 | 5 |
| VIKOR-values (Q) | 0.926 | 0.82 | 0.808 | 0 | 1 |
| VIKOR-values (S) | 0.333 | 0.325 | 0.333 | 0.128 | 0.333 |
| VIKOR-values (R) | 0.634 | 0.531 | 0.495 | 0.128 | 0.723 |
| VIKOR-ranking | 2 | 3 | 4 | 5 | 1 |
| PROMETHEE II-values | −0.167 | −0.001 | −0.167 | 0.501 | −0.167 |
| PROMETHEE II-ranking | 5 | 2 | 3 | 1 | 4 |
Table 11.
The statistical analysis of the comparison.
| Pearson Correlation Coefficient | Percentage of Identical Rankings | Spearman’s Rho | |
|---|---|---|---|
| SAW | 0.715 | 60% | 0.900 |
| WPM | 0.721 | 60% | 0.900 |
| TOPSIS | 0.568 | 60% | 0.900 |
| VIKOR | 0.894 | 0% | −0.700 |
| PROMETHEE II | 0.822 | 40% | 0.700 |
Publisher’s Note: MDPI stays neutral with regard to jurisdictional claims in published maps and institutional affiliations. |
© 2021 by the author. Licensee MDPI, Basel, Switzerland. This article is an open access article distributed under the terms and conditions of the Creative Commons Attribution (CC BY) license (https://creativecommons.org/licenses/by/4.0/).
Share and Cite
MDPI and ACS Style
Kabassi, K. Application of Multi-Criteria Decision-Making Models for the Evaluation Cultural Websites: A Framework for Comparative Analysis. Information 2021, 12, 407. https://0-doi-org.brum.beds.ac.uk/10.3390/info12100407
AMA Style
Kabassi K. Application of Multi-Criteria Decision-Making Models for the Evaluation Cultural Websites: A Framework for Comparative Analysis. Information. 2021; 12(10):407. https://0-doi-org.brum.beds.ac.uk/10.3390/info12100407
Chicago/Turabian StyleKabassi, Katerina. 2021. "Application of Multi-Criteria Decision-Making Models for the Evaluation Cultural Websites: A Framework for Comparative Analysis" Information 12, no. 10: 407. https://0-doi-org.brum.beds.ac.uk/10.3390/info12100407
Note that from the first issue of 2016, this journal uses article numbers instead of page numbers. See further details here.