
GPR Investigation at the Archaeological Site of Le Cesine, Lecce, Italy

 , , , , , and
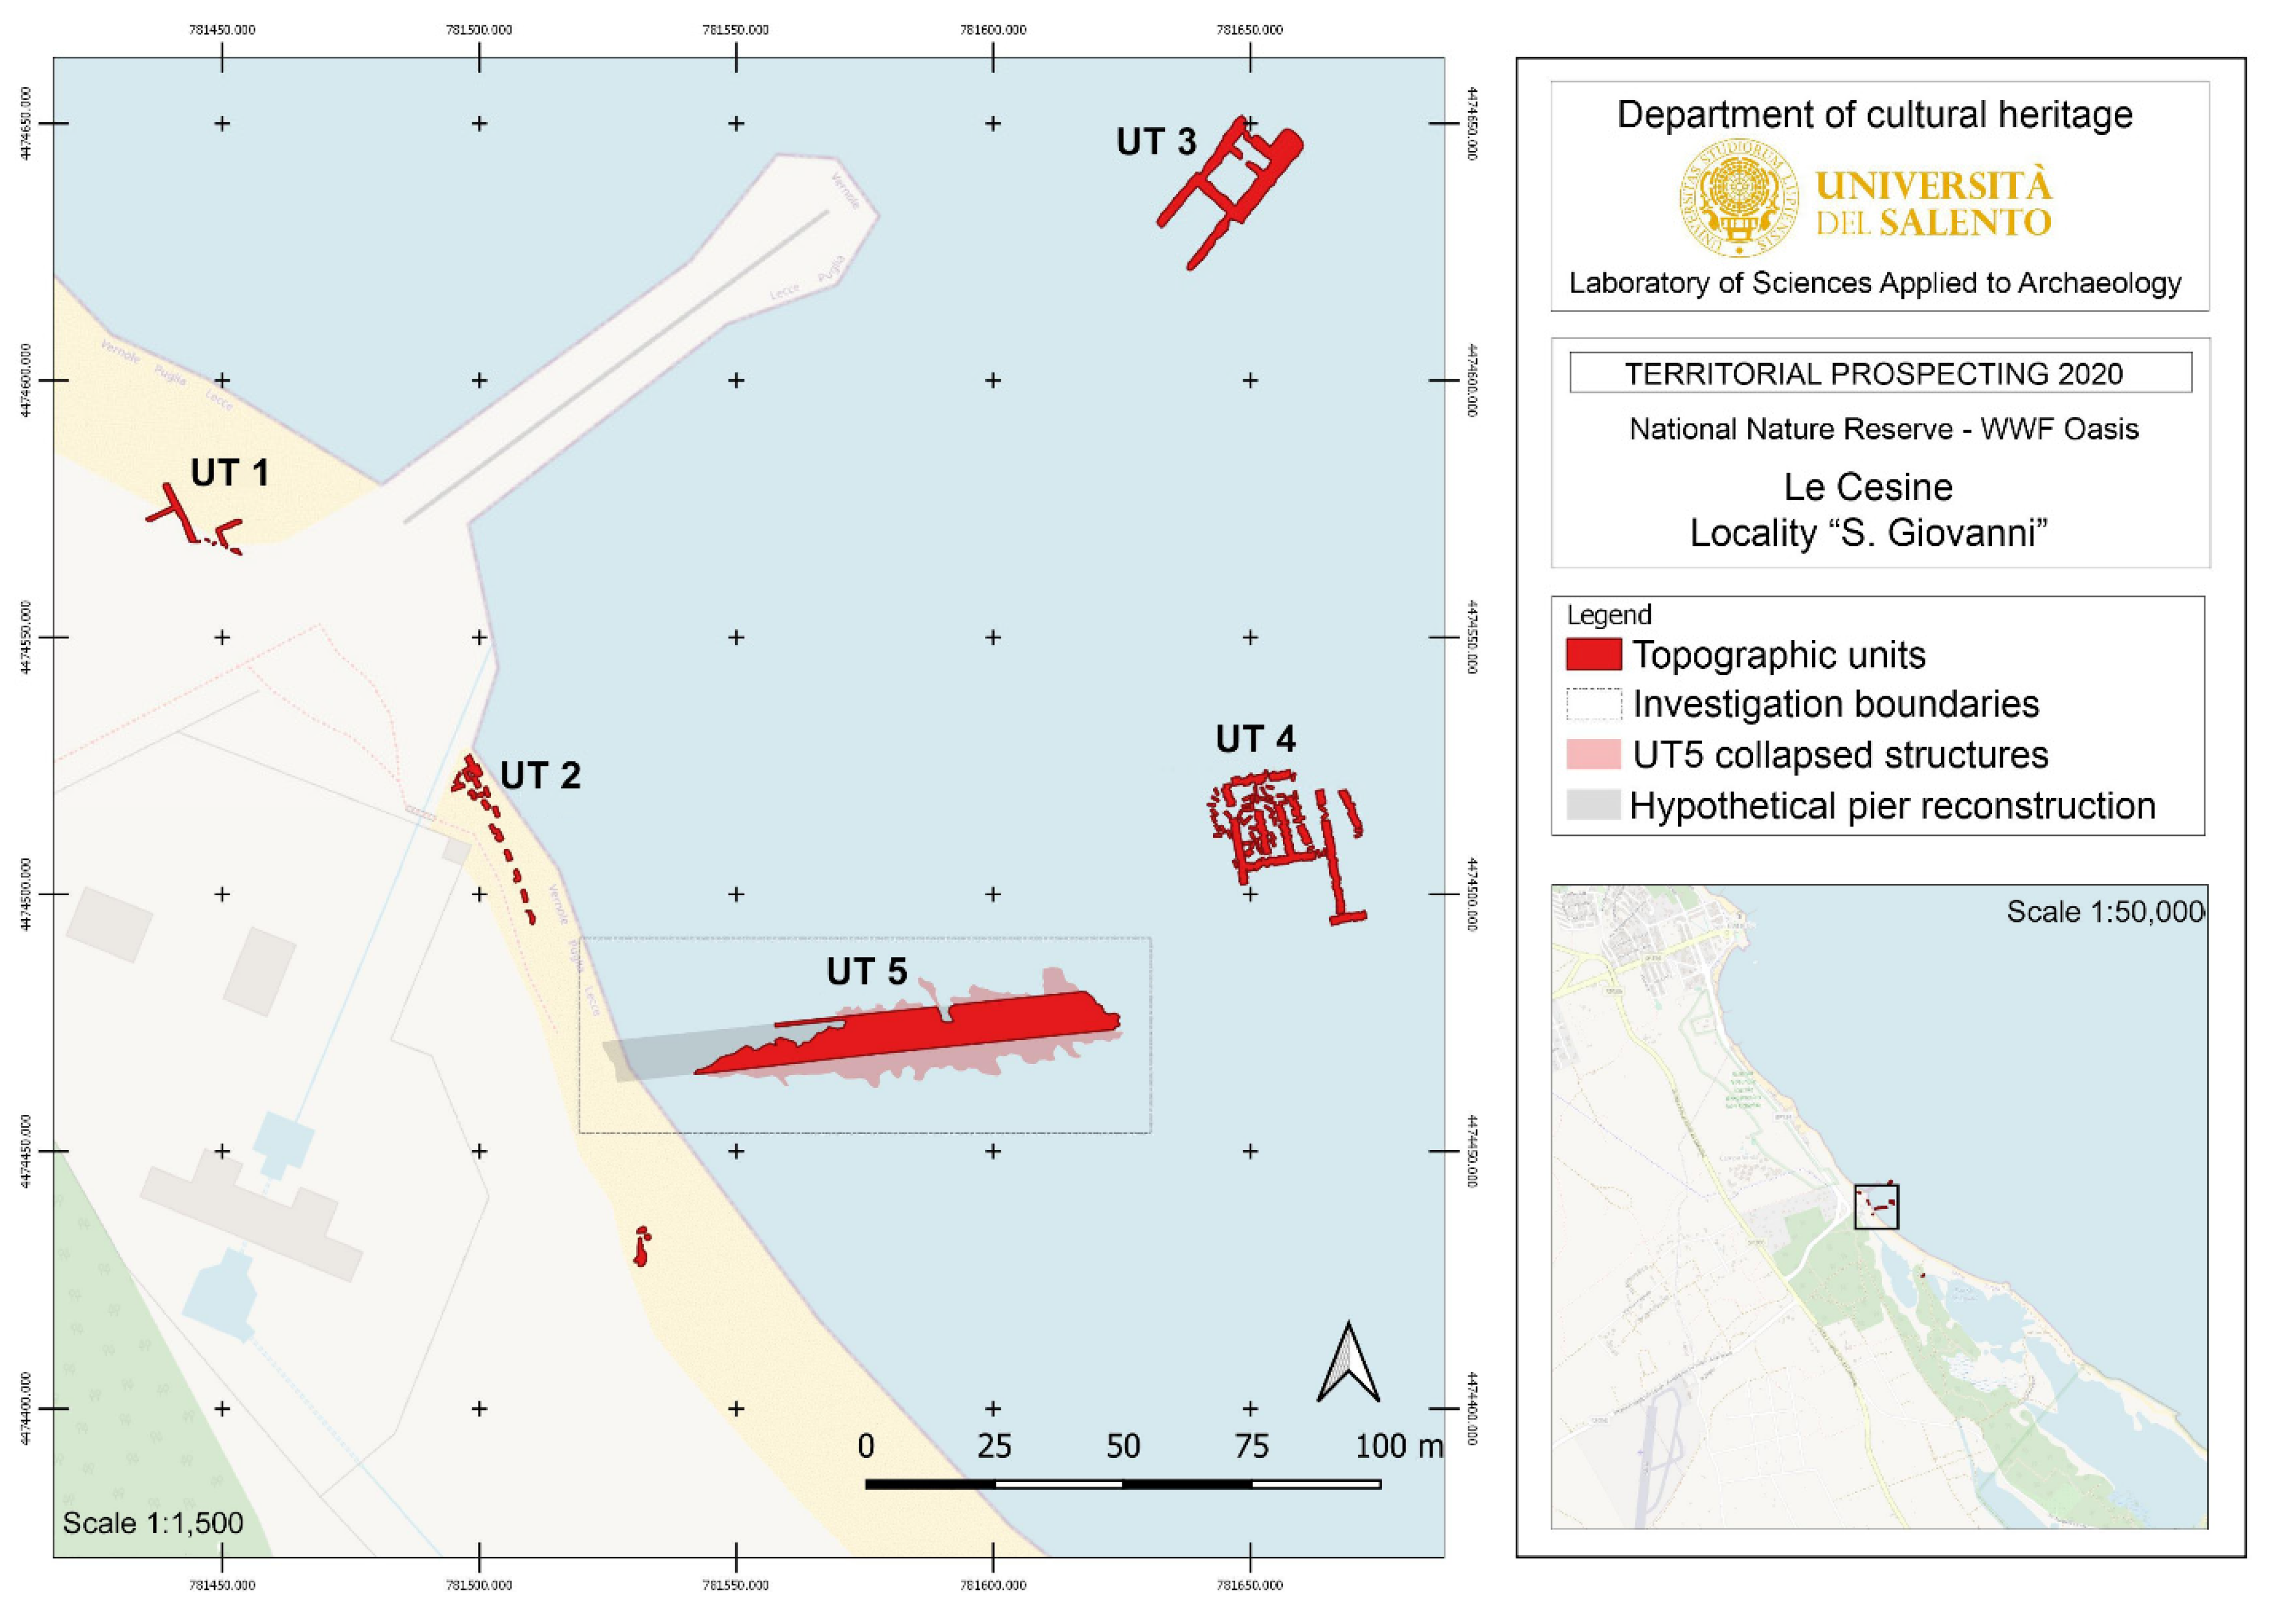
Abstract
:1. Introduction
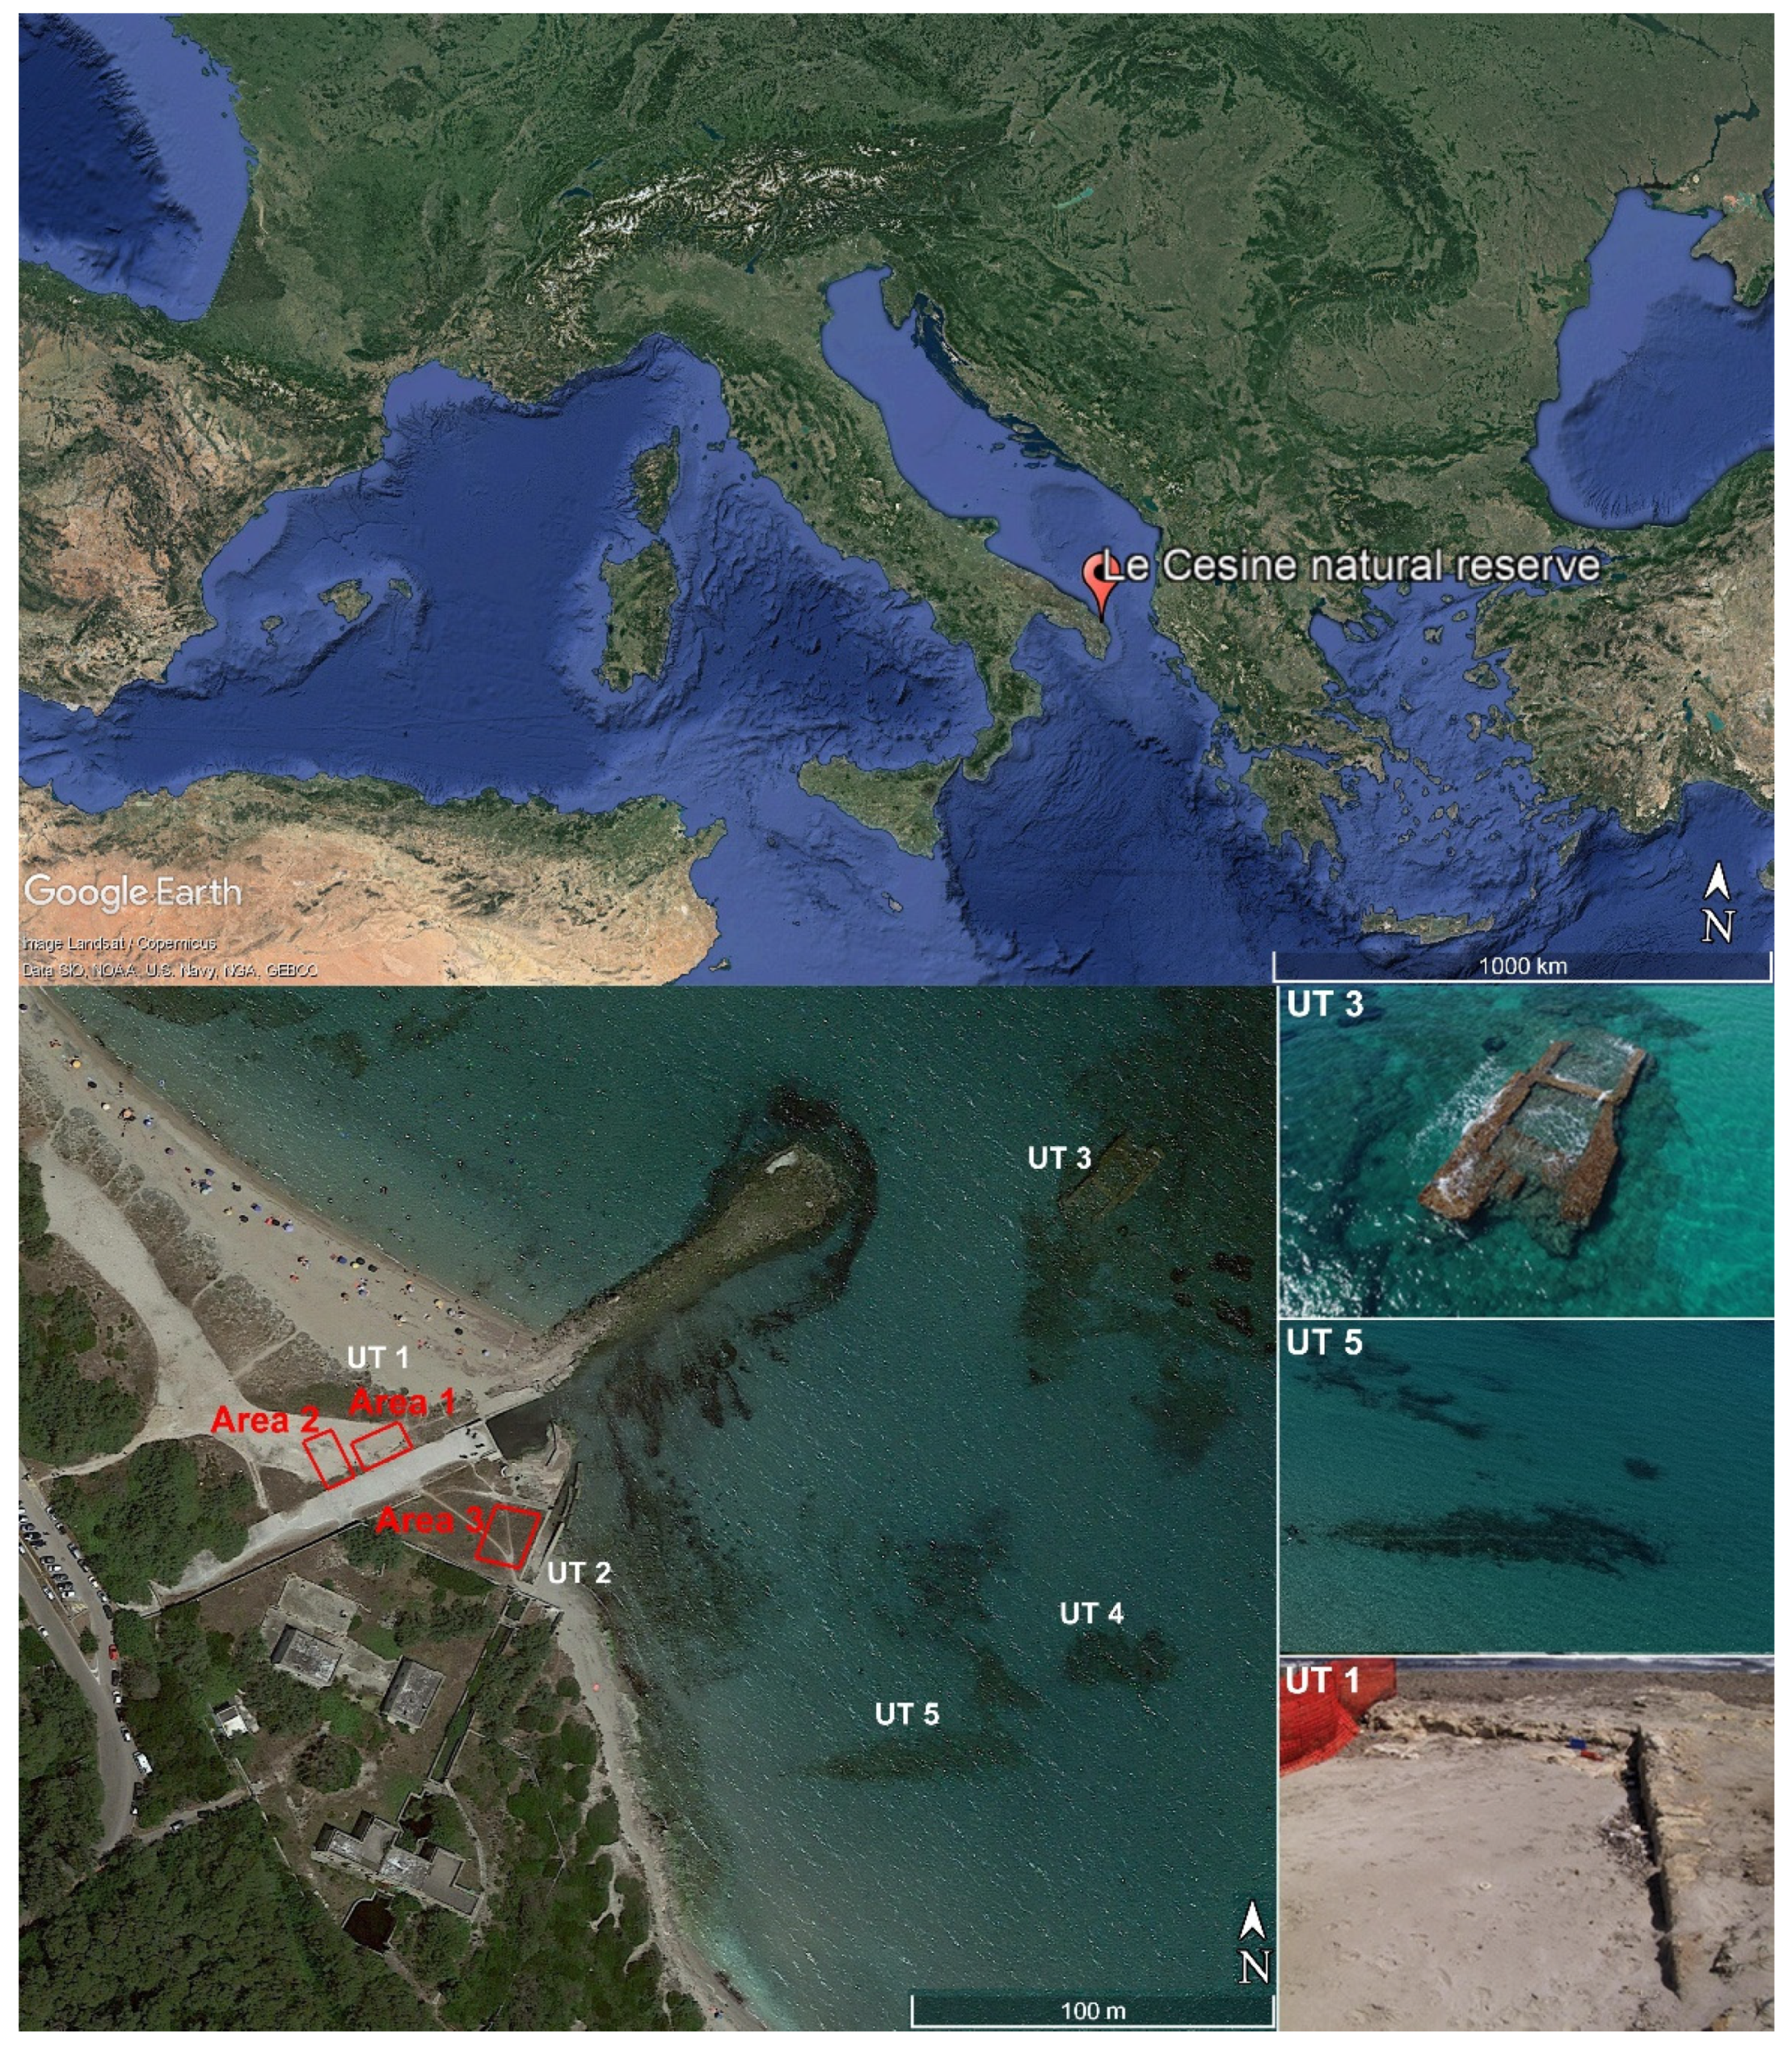
2. The Archaeological Site of Le Cesine
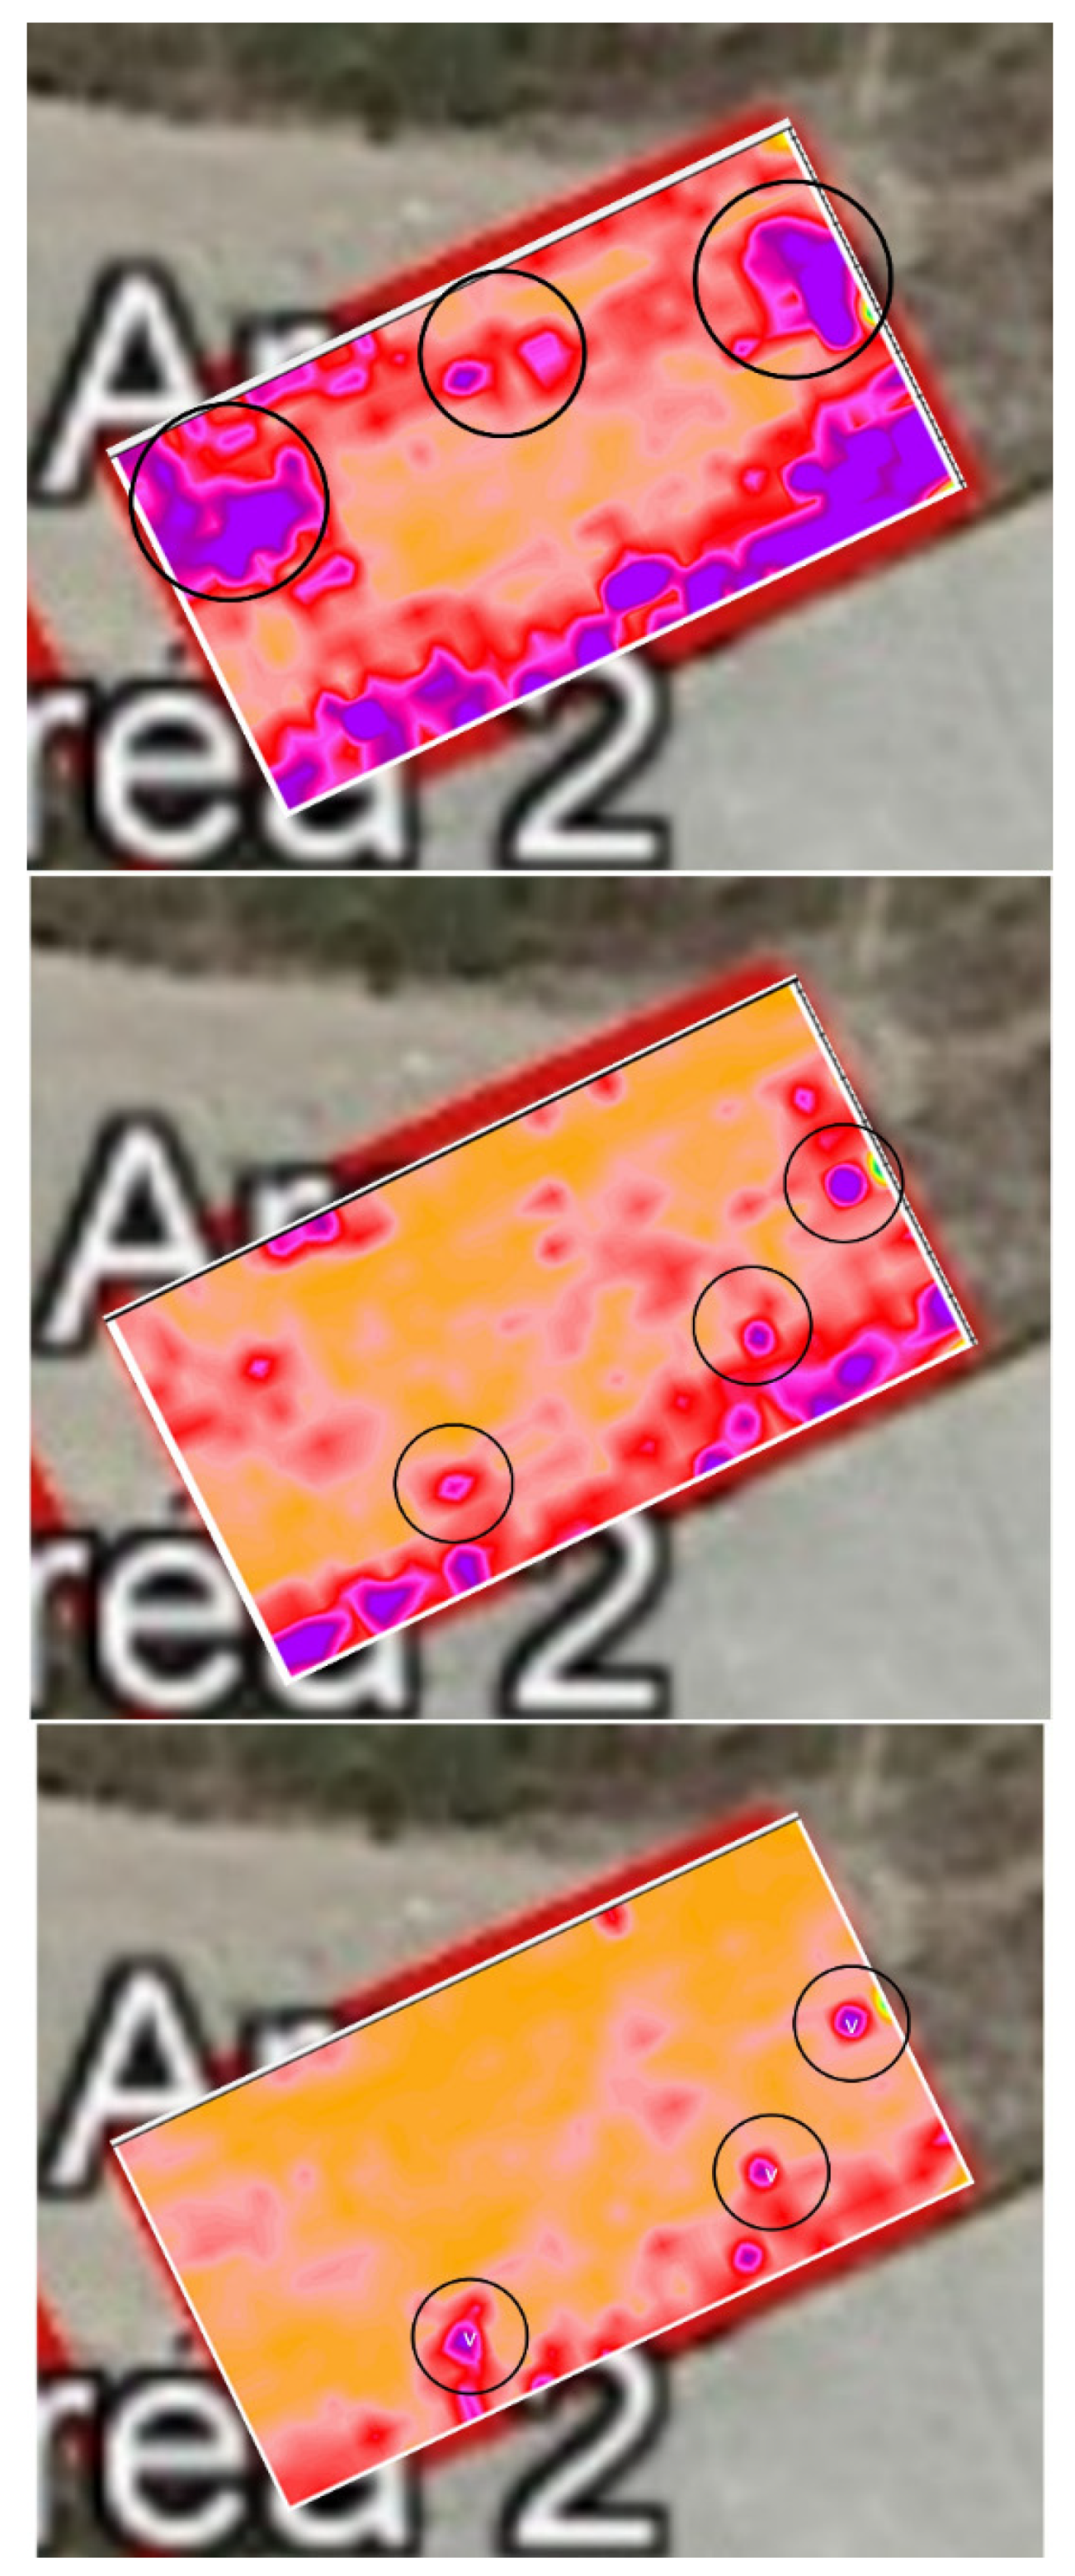
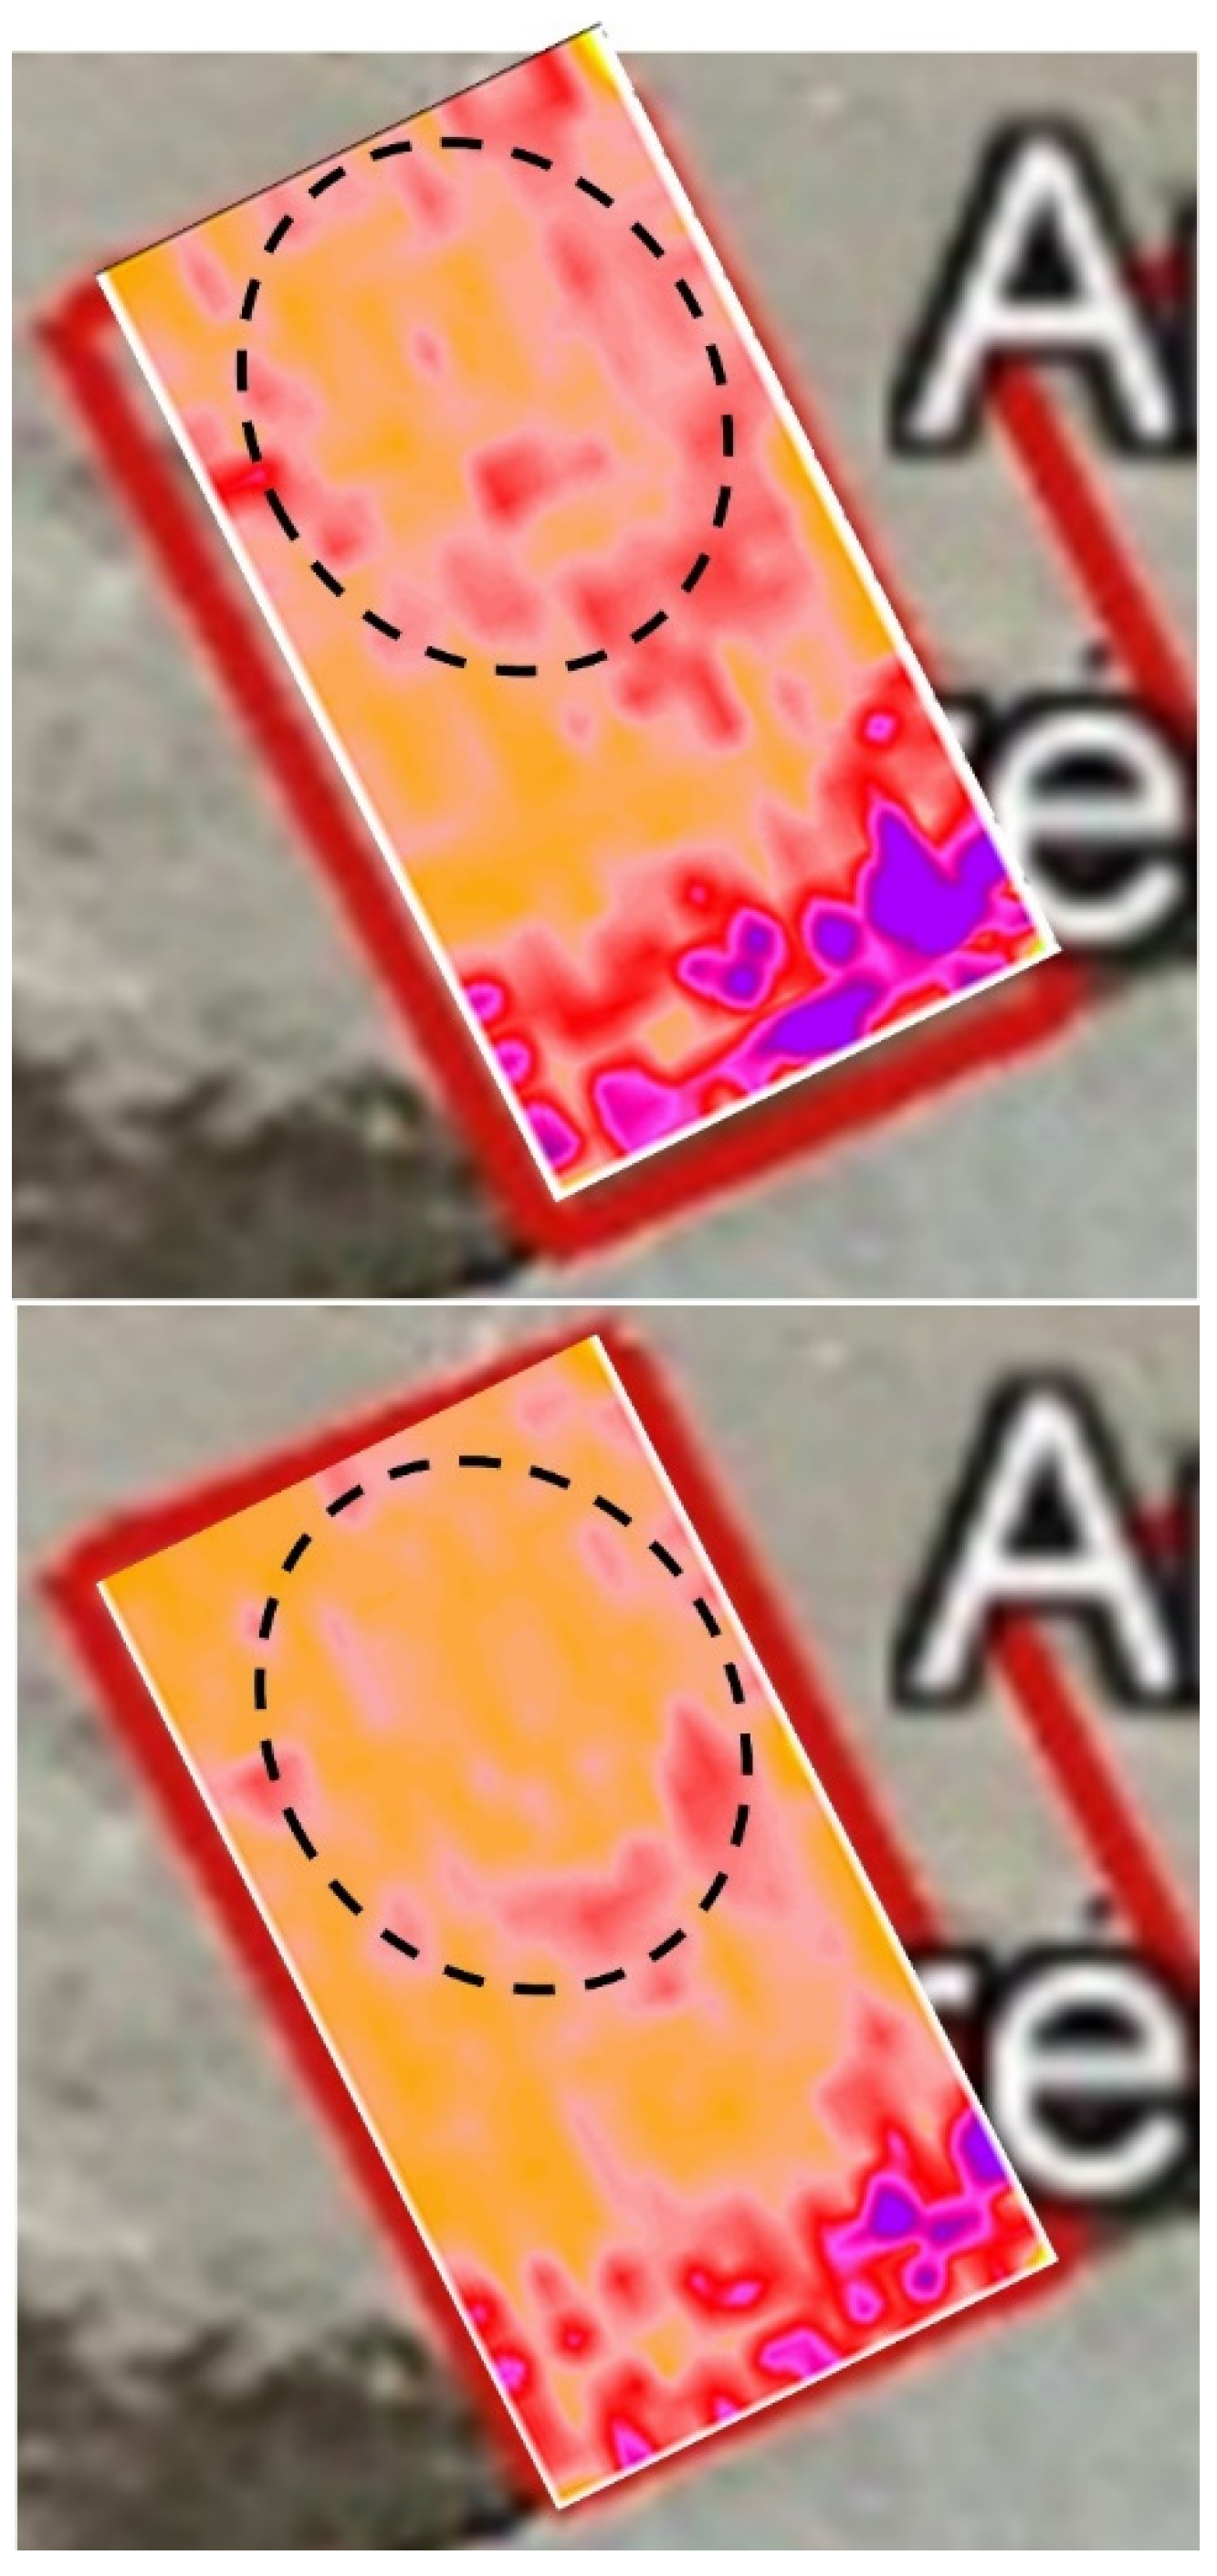
3. GPR Surveying and Results
4. Inverse Scattering Results
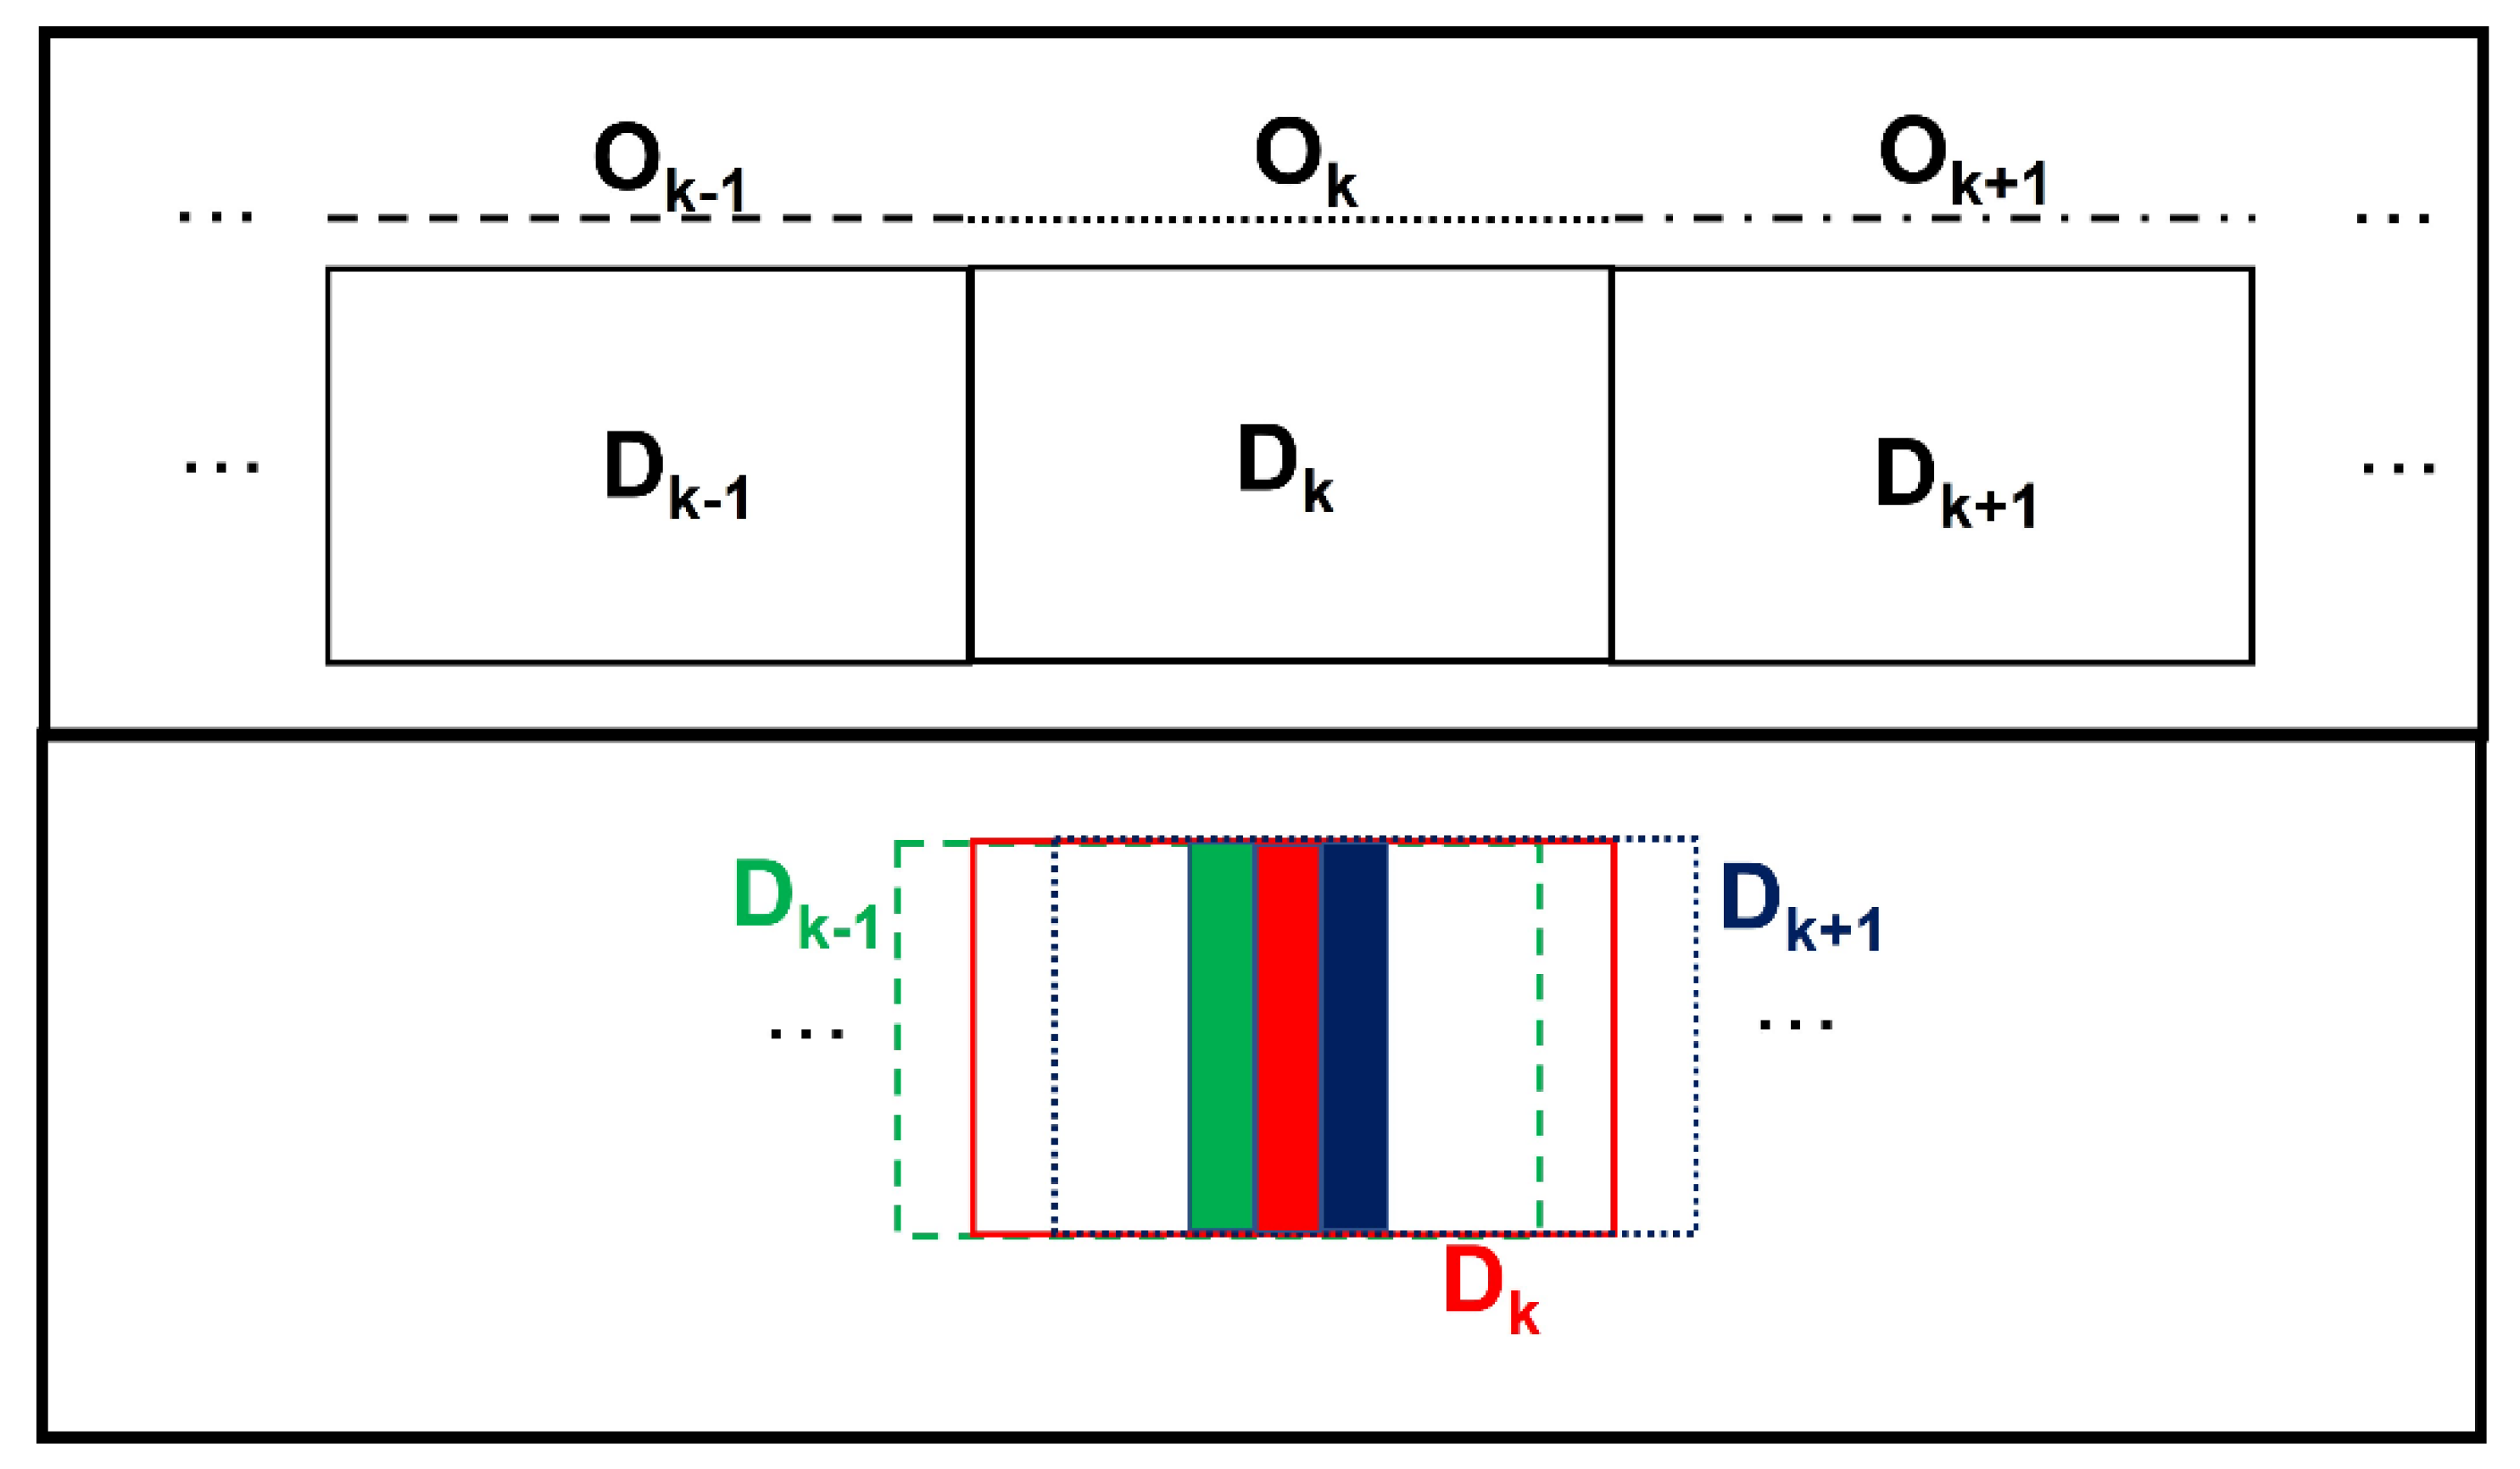
- The measurement line O and the investigated domain D are divided into K, partially overlapping subdomains Ok and Dk, k = 1, 2, …, K;
- For each subdomain Dk, the tomographic reconstruction of the contrast function χk is obtained by exploiting the TSVD inversion procedure;
- The tomographic image of the overall surveyed domain D is obtained by joining only the central parts of the K reconstructions χk achieved for each subdomain Dk, as shown in Figure 6 (lower panel).
- Besides all the central parts of all the sub-reconstructions, also the left hand side of the first sub-reconstruction and the right hand side of the last one are retained and added at the beginning and at the end of the comprehensive image, respectively. This because it is of primary importance not to miss any information retrievable from the data.
5. Conclusions
Author Contributions
Funding
Informed Consent Statement
Data Availability Statement
Acknowledgments
Conflicts of Interest
References
- Cataldo, A.; De Benedetto, E.; Cannazza, G.; D’Amico, S.; Farrugia, L.; Mifsud, G.; Dimech, E.; Sammut, C.; Persico, R.; Leucci, G.; et al. Dielectric permittivity diagnostics as a tool for cultural heritage preservation: Application on degradable globigerina limestone. Measurement 2018, 123, 270–274. [Google Scholar] [CrossRef]
- Persico, R.; D’Amico, S.; Matera, L.; Colica, E.; De Giorgio, C.; Alescio, A.; Sammut, C.V.; Galea, P. GPR investigations at St John’s Co-Cathedral in Valletta. Near Surf. Geophys. 2019, 17, 213–229. [Google Scholar] [CrossRef]
- D’Amico, S.; Colica, E.; Persico, R.; Betti, M.; Foti, S.; Barbino, M.P.; Galone, L. Geophysical investigations, digital reconstruction and numerical modeling at the Batia Church in Tortorici (Messina, Sicily): Preliminary results. In Proceedings of the 2020 IMEKO TC-4 International Conference on Metrology for Archaeology and Cultural Heritage, Trento, Italy, 22–24 October 2020; pp. 453–456. [Google Scholar]
- Piro, S.; Goodman, D.; Nishimura, Y. The study and characterization of Emperor Traiano’s Villa (Altopiani di Arcinazzo, Roma) using high-resolution integrated geophysical surveys. Archaeol. Prospect. 2003, 10, 1–25. [Google Scholar] [CrossRef]
- Gabellone, F.; Leucci, G.; Masini, N.; Persico, R.; Quarta, G.; Grasso, F. Non-destructive prospecting and virtual reconstruction of the chapel of the Holy Spirit in Lecce, Italy. Near Surf. Geophys. 2013, 11, 231–238. [Google Scholar] [CrossRef]
- Webster, J.G.; Catapano, I.; Gennarelli, G.; Ludeno, G.; Soldovieri, F.; Persico, R. Ground-penetrating radar: Operation principle and data processing. Wiley Encycl. Electr. Electron. Eng. 2019, 1–23. [Google Scholar] [CrossRef]
- Catapano, I.; Gennarelli, G.; Ludeno, G.; Soldovieri, F. Applying ground-penetrating radar and microwave tomography data processing in cultural heritage: State of the art and future trends. IEEE Signal Process. Mag. 2019, 36, 53–61. [Google Scholar] [CrossRef]
- Capozzoli, L.; Catapano, I.; De Martino, G.; Gennarelli, G.; Ludeno, G.; Rizzo, E.; Soldovieri, F.; Scelza, F.U.; Zuchtriegel, G. The discovery of a buried temple in Paestum: The advantages of the geophysical multi-sensor application. Remote Sens. 2020, 12, 2711. [Google Scholar] [CrossRef]
- Gennarelli, G.; Catapano, I.; Soldovieri, F.; Persico, R. On the achievable imaging performance in full 3-D linear inverse scattering. IEEE Trans. Antennas Propag. 2015, 63, 1150–1155. [Google Scholar] [CrossRef]
- Persico, R.; Leucci, G.; Matera, L.; De Giorgi, L.; Soldovieri, F.; Cataldo, A.; Cannazza, G.; Benedetto, E.D. Effect of the height of the observation line on the the diffraction curve in GPR prospecting. Near Surf. Geophys. 2015, 13, 243–252. [Google Scholar] [CrossRef]
- Pettinelli, E.; Di Matteo, A.; Mattei, E.; Crocco, L.; Soldovieri, F.; Redman, J.D.; Annan, A.P. GPR response from buried pipes: Measurement on field site and tomographic reconstructions. IEEE Trans. Geosci. Remote Sens. 2009, 47, 2639–2645. [Google Scholar] [CrossRef]
- Ritter, R.S.; Fiddy, M.A. Imaging from scattered fields: Limited data and degrees of freedom. In Image Reconstruction from Incomplete Data VII; International Society for Optics and Photonics: Bellingham, WA, USA, 2012; Volume 8500, p. 850007. [Google Scholar] [CrossRef]
- Persico, R.; Ludeno, G.; Soldovieri, F.; De Coster, A.; Lambot, S. Two-dimensional linear inversion of GPR data with a shifting zoom along the observation line. Remote Sens. 2017, 9, 980. [Google Scholar] [CrossRef] [Green Version]
- Persico, R.; Ludeno, G.; Soldovieri, F.; De Coster, A.; Lambot, S. Improvement of ground penetrating radar (GPR) data interpretability by an enhanced inverse scattering strategy. Surv. Geophys. 2018, 39, 1069–1079. [Google Scholar] [CrossRef]
- Auriemma, R. San Cataldo e la Costa delle Cesine. In Salentum a Salo. Porti, Approdi, Merci e Scambi Lungo la Costa Adriatica del Salento; Congedo: Milan, Italy, 2004; Volume I, pp. 155–176. [Google Scholar]
- Auriemma, R.; Calantropio, A.; Chiabrando, F.; Coluccia, L.; Rugge, M.; D’Ambrosio, P.; Buccolieri, M.; Picciolo, A. Underwater archaeological surveys in Salento waters: Results and methods. In Proceedings of the 6th European Conference on Scientific Diving, Freiberg, Germany, 21–22 April 2021; Merkel, B., Hoyer, M., Eds.; FOG Special. Volume 58, pp. 96–105, ISSN 1434-7512. [Google Scholar]
- Auriemma, R.; Buccolieri, M.; Coluccia, L.; D’Ambrosio, P.; Picciolo, A.; Rugge, M. The underwater archaeology tells of Salento: Recent research in the Adriatic and Ionian seas. In Poseidons’ Realm XXV; Skyllis: Xanten, Germany, 2021. [Google Scholar]
- Sammarco, M.; Marchi, S. Tra terra e mare: Ricerche lungo la costa di San Cataldo (Lecce). J. Anc. Topogr. 2012, 22, 107–132. [Google Scholar]
- Sammarco, M.; Marchi, S.; Delle Rose, M. Archeologia costiera a S. Cataldo. In Proceedings of the Atti del III Convegno di Archeologia Subacquea, Manfredonia, Italy, 4–6 October 2007. [Google Scholar]
- Schneider, W.A. Integral formulation for migration in two and three dimensions. Geophysics 1978, 43, 49–76. [Google Scholar] [CrossRef]
- Goodman, D.; Piro, S. GPR Remote Sensing in Archaeology; Springer: New York, NY, USA, 2013; Volume 9, p. 233. [Google Scholar]
- Lazzari, M.; De Giorgi, L.; Ceraudo, G.; Persico, R. Geoprospecting survey in the archaeological site of Aquinum (Lazio, central Italy). Surv. Geophys. 2018, 39, 1167–1180. [Google Scholar] [CrossRef]
- Neubauer, W.; Nau, E.; Trinks, I.; Sirri Seren, S.; Loker, K.; Klein, M. The school of gladiators at Carnuntum—Virtual reconstruction based on archaeological prospection data. In Proceedings of the First International Conference “Virtual Archaeology-2012”, Saint Petersburg, Russia, 4–6 June 2012. [Google Scholar]
- Matera, L.; Noviello, M.; Ciminale, M.; Persico, R. Integration of multisensor data: An experiment in the archaeological park of Egnazia (Apulia, Southern Italy). Near Surf. Geophys. 2015, 13, 613–621. [Google Scholar] [CrossRef]
- Chew, W.C. Waves and Fields in Inhomogeneous Media; Institute of Electrical and Electronics Engineers. Inc.: New York, NY, USA, 1995. [Google Scholar]
- Bertero, M.; Boccacci, P. Introduction to Inverse Problems in Imaging; Institute of Physics Publishing: Bristol, UK, 1998. [Google Scholar]


Publisher’s Note: MDPI stays neutral with regard to jurisdictional claims in published maps and institutional affiliations. |
© 2021 by the authors. Licensee MDPI, Basel, Switzerland. This article is an open access article distributed under the terms and conditions of the Creative Commons Attribution (CC BY) license (https://creativecommons.org/licenses/by/4.0/).
Share and Cite
Colica, E.; Antonazzo, A.; Auriemma, R.; Coluccia, L.; Catapano, I.; Ludeno, G.; D’Amico, S.; Persico, R. GPR Investigation at the Archaeological Site of Le Cesine, Lecce, Italy. Information 2021, 12, 412. https://0-doi-org.brum.beds.ac.uk/10.3390/info12100412
Colica E, Antonazzo A, Auriemma R, Coluccia L, Catapano I, Ludeno G, D’Amico S, Persico R. GPR Investigation at the Archaeological Site of Le Cesine, Lecce, Italy. Information. 2021; 12(10):412. https://0-doi-org.brum.beds.ac.uk/10.3390/info12100412
Chicago/Turabian StyleColica, Emanuele, Antonella Antonazzo, Rita Auriemma, Luigi Coluccia, Ilaria Catapano, Giovanni Ludeno, Sebastiano D’Amico, and Raffaele Persico. 2021. "GPR Investigation at the Archaeological Site of Le Cesine, Lecce, Italy" Information 12, no. 10: 412. https://0-doi-org.brum.beds.ac.uk/10.3390/info12100412