
An Approach to Ranking the Sources of Information Dissemination in Social Networks


St. Petersburg Federal Research Center of the Russian Academy of Sciences (SPC RAS), 39, 14th Line V.O., 199178 St. Petersburg, Russia
*
Author to whom correspondence should be addressed.
Information 2021, 12(10), 416; https://0-doi-org.brum.beds.ac.uk/10.3390/info12100416
Submission received: 30 August 2021
/
Revised: 6 October 2021
/
Accepted: 8 October 2021
/
Published: 11 October 2021
(This article belongs to the Special Issue Information Spreading on Networks)
Abstract
:The problem of countering the spread of destructive content in social networks is currently relevant for most countries of the world. Basically, automatic monitoring systems are used to detect the sources of the spread of malicious information, and automated systems, operators, and counteraction scenarios are used to counteract it. The paper suggests an approach to ranking the sources of the distribution of messages with destructive content. In the process of ranking objects by priority, the number of messages created by the source and the integral indicator of the involvement of its audience are considered. The approach realizes the identification of the most popular and active sources of dissemination of destructive content. The approach does not require the analysis of graphs of relationships and provides an increase in the efficiency of the operator. The proposed solution is applicable both to brand reputation monitoring systems and for countering cyberbullying and the dissemination of destructive information in social networks.
1. Introduction
The depth of penetration of social networks into everyday life is significant, and their advantage is the ability of communication participants to quickly express their opinions to a large group of people. Today, social networks (SN) are not only the means of communication, but also a tool for spreading information. The processes and conflicts in social networks are a reflection of the activity of various actors, whether they are individual, institutional, or group. At the same time, we observe the opposite trend, when conflicts and processes in the information field can generate events and conflicts that change society as a whole, as well as have a direct impact on the social activity of people, their hobbies, and life path. The processes that generate changes in the state of the individual and society occur, as a rule, in a hidden (latent) form, and we find the result of influence, for example, on the child’s consciousness, only at the moment of its culmination, when the process or conflict affect the life and health of the family or individual. An obvious common problem of information security in modern society has become malicious (or destructive, or false) information, which can include such concepts as cyberbullying, slander, and deliberately false information.
In the process of countering the spread of malicious information in the social network, the operator needs to somehow prioritize the selection of observed objects and measures to counter them. Most of the existing monitoring systems focus on three functions: (1) detection of emotions or opinions; (2) modeling of information flows; (3) modeling of opinion networks based on agents [1,2]. The existing monitoring systems are based on complexes of algorithms that include sorting in descending order (the number of views, the number of “like” marks, etc.), and among other things, the analysis of relationship graphs or bioinspired approaches are used. For example, the paper [3] presented an approach to the systematization of research directions in the field of social network analysis. In particular, it was argued that the task of detecting a source in a social network is to find a person or node from which such entities as a virus or disinformation originated. A taxonomy was also proposed, which contains various aspects (factors): network structure; distribution models; centrality measures; evaluation metrics. In [4], the problem of estimating the source of infection for the Susceptible–Infected model (SI), in which not all nodes are infected, was solved. It was shown in [4] that for social networks whose structure is more similar to a tree (Twitter, YouTube), the estimate of the source node associated with the most likely path of infection is set by the Jordan center, that is the node with the minimum distance to the set of observed infected nodes. The paper [5] considered the model of information dissemination as Susceptible–Infected–Susceptible (SIS), according to which any node in a social network can be infected with some information in the process of its dissemination, and then, it transmits it to its neighbors; however, this node remains susceptible to similar information from its neighbors. In [6], an approach based on a visual analysis of information distribution channels was proposed. This approach, by displaying the main participants in the creation and retransmission of information, allows specialists to independently draw conclusions without the need to analyze a huge amount of text data.
However, still, the existing systems, methods, and algorithms do not distinguish a group of information objects, taking into account the level of feedback from the audience. For malicious information, a delay in taking counteraction measures can be dangerous. If the counteraction to malicious messages and the sources that create and distribute them is carried out without taking into account the audience coverage and engagement metrics, then there is a high probability that in the most dangerous cases, counteraction will not be provided first.
This paper shows how an integral metric can be set that allows one to distribute the operator’s attention in monitoring systems and prioritize sources that distribute destructive content in social networks. At the same time, in the process of developing an approach to ranking information sources in social networks, the basis for analysis is discrete features, such as the number of source messages, the number of comments, and the number of “like” and “dislike” marks from the audience of social networks.
The novelty of the proposed approach is that the developed model of malicious information and a set of algorithms for analyzing and evaluating information sources provide a ranking of sources by priority, considering the number of messages containing destructive content that is created by the source and feedbacks from the audience, without taking into account the connection among objects in the social network. It can significantly reduce resource and time costs in the analysis process.
It is important to note that the aim of the proposed approach was to prioritize the malicious messages according to their importance according to the impact on the audience. The content analysis and the very recognition of the presence of the malicious content were out of the scope of this investigation. It was assumed that all the messages in the input dataset for the approach had a similar amount of malicious information. The difference between messages lied only in their audience and in the activity of this audience.
The paper is structured as follows. The second section presents an analysis of relevant studies. The third section describes the proposed approach, represented by the developed model of malicious information and a set of algorithms for ranking information sources in social networks. The fourth section presents the results of the experiments and shows the applicability of the proposed approach. The fourth section also contains an assessment of the approach and a discussion. The fifth section concludes the paper. The dataset for conducting the research and experiments was obtained from the Russian social network VK by connecting to an open API and preprocessed (depersonalized) for the possibility of open use for scientific purposes.
2. Background
The first studies on countering the spread of destructive content were conducted by scientists following the initial development of social networks, from 1995–2000. Fifteen works referring to the resource were published in the Google Academy [7] Class-mates.com and twenty-eight in SixDegrees.com. With the advent of new platforms, the number of studies in the field of social network analysis is growing exponentially. In 1990, Social Network Analysis (SNA) was the prerogative of such sciences as sociology and political science. For example, the collection of works [8] contains papers devoted to the analysis of human behavior in society. In [9], the interpenetration of the theory of exchange and the science of “social network analysis” was discussed. After 15 years, by 2005, the situation began to change dramatically, and by 2021, SNA became a process of studying various social structures [10]. At the same time, the object of research in SNA is network structures from the point of view of nodes (individual actors, people or things in the network), as well as edges or connections, relationships, or interactions. Many studies are devoted to the analysis of the spread of memes [11], information exchange [12], and communication networks among friends, colleagues, and clients [13]. Some of the works are devoted to the problems of media communications, journalism in social networks, or education through social networks. Thus, the modern section of SNA contains a massive theoretical and practical base of studies relevant to the topic of this study. Bioinspired approaches are also actively developing within the framework of SNA.
In the work presented in paper [14], the Suspicious–Infected–Removed (SIR) model was considered. It proposed a taxonomy for classifying information content to solve this problem at the stages of origin, distribution, detection, and localization. The study [15] demonstrated the mechanism of spreading moods on web forums. For this purpose, the possibility of applying the SIR epidemic model to the spread of moods was investigated.
In [16], a model of group polarization integrated into the SIRS epidemic model was proposed as part of research aimed at studying the evolutionary mechanism and processes of divergences in the opinions of participants in the discussions. At the beginning, an epidemic model was introduced, and the factors of relationship strength were determined to strengthen the transfer of information and interaction among individuals, based on the J-A model proposed by Jager and Amblard [17]. In addition, the work used the Barabashi–Albert model [18] for the formation of random scale-free networks.
The work presented in paper [19] offered a comprehensive approach to monitoring and countering harmful influences in the information space of social networks. The paper considered different approaches—both on the basis of text and graph analysis.
The paper [20] described a fairly large number of metrics for analyzing social networks, which were divided into several classes: (1) activity; (2) popularity; (3) measures of influence. Algorithms to obtain a numerical coefficient of Social Networking Potential (SNP) to represent the source network and its ability to influence this network were proposed. Such a source was called by the authors of the work as Alpha. It is the SNP algorithms that today allow monitoring systems to evaluate opinion leaders.
The problem is that all existing solutions consider the source from the point of view of the linear Shannon model [21], according to which the source is either the author, the primary source of information, or the creator of the message. Communication in the transmission/cybernetic tradition is considered as an information processing process. However, in order to find the place and role of the problem of ranking the sources of the distribution of malicious information in social networks, it is necessary to find out what a source is in the context of information exchange in social networks and how information exchange occurs and, with this in mind, to choose a priority object in the process of analyzing a variety of sources of spreading malicious information in social networks. Therefore, it is not necessary to limit ourselves only to technical algorithms to analyze social networks, at the beginning, and it is worth studying achievements in the field of communication theory, political science, and sociology. In the Oxford Dictionary, the theory of communication is interpreted as follows: “It is the study and presentation of the principles and methods by which information is transmitted” [22].
Most models of communication theory divide sources into primary sources (author of the message or the message itself, as an information object) and secondary sources as media. For example, Theodore Newcomb’s A-B-X model [23] is more related to such sciences as sociology, journalism, linguistics, and the psychology of communication. The model considers the relations among the participants of the communications and the object under discussion, describing the influence of these relations on the nature and result of the communicative interaction. The proposed approach allows one to expand the range of features for algorithms for analyzing and evaluating the sources of malicious information distribution in social networks through mechanisms to analyze the feedback from the audience. For example, in [24], a model for detecting sources and messages in SNs was proposed, and one of the strategies was based on the A-B-X model of T. Newcomb. In [25], a study was conducted on how students choose friends in social networks.
Theodore Newcomb’s A-B-X model answers a number of questions: (1) What motivates the subjects to enter into communication? (2) How do the relations among the subjects affect communication? (3) What will be the possible psychological and sociological effects for the participants of the communication?
As a basic model, Newcomb considered the situation of elementary communicative interaction, that is a dialogue in which subjects “A” and “B” enter into communication about some object external to them “X”. At the same time, “X” is an individual, an event, a message, any information, or any community. Then, any social subjects can also act as A and B—these being individuals, social groups, or social organizations. According to T. Newcomb, A and X are united by a certain topic, called “orientation”. Orientation can be described in the form of positive (+) or negative (−) attitudes. The concept of attitude in psychology and sociology is associated with social attitudes, and they are understood as sets of beliefs and interests of the subject. In this study, the orientation can be expressed through a positive or negative attitude toward the topic by a user of social networks. This model allows one to segment sources and recipients into those who are in solidarity and support topic X related to information and those who condemn topic X.
It is important that according to the A-B-X model, at any given time, the orientation in communication can be symmetric and asymmetric. The issues of the symmetry and asymmetry of communication and its effects are actively developed within the framework of research aimed at studying the behavior of users of social networks [26].
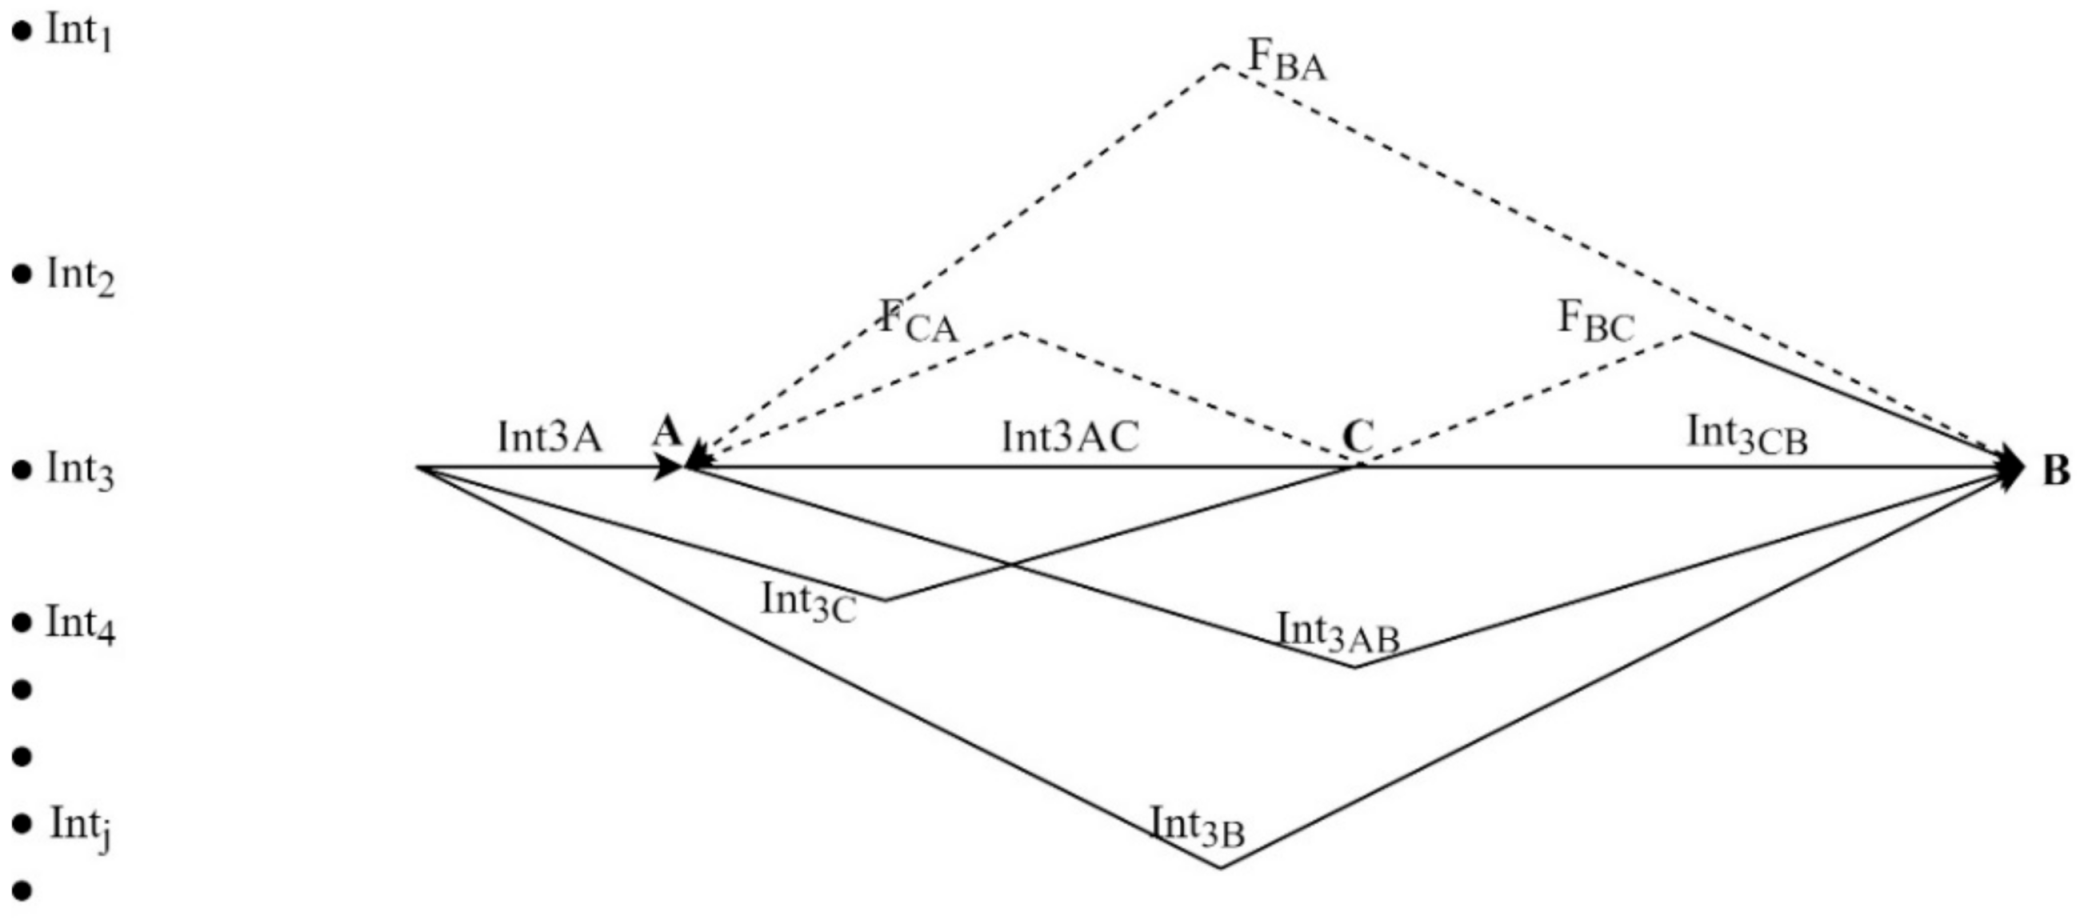
Researchers B. Westley and M. McLean [23] added an element to the A-B-X model that allows taking into account the subject’s need for information, provided that different sources are available (Figure 1). In today’s conditions, this is the set of sources that is available to the user to obtain information, that is websites, social networks, news aggregators, video hosting services, and more.
According to the proposed model, subjects form their information space in order to meet needs or solve problems. It is obvious that the range of interests of the subject is limited by the set Int1, Int2, …, Intn.
Communication is initiated when a certain subject B realizes the interest or the need to obtain information from the information space. In the Westley–Maclean model, the information space around the subject is called the space of elections Int1, Int2, …, Intn.
Suppose Int3 interest is chosen for the choice of the attitude, then depending on the methods of obtaining information, the subject can realize his (her) need through different sources in the modern digital space.
In the simplest example, the subject has the opportunity to simply obtain information through direct interaction with an event or text (Int3B arc), but when using modern web resources, video hosting, and social networks, there is always an access point to information—“A”. Perhaps the source “A” directly observed or created an object with information on the topic of interest to the subject, Int3, then it forms an attitude for “B”, and the Int3AB arc appears. Another option characteristic of social networks is the presence of a translator or repeater, which is any subject who has repeated information from source “A” about Int3 information. The authors of the model called it an “information intermediary”, or “information gatekeeper”. In fact, this subject is “media” (between). In the work presented in paper [27], a strategy for ranking information sources by user interests was proposed. Thus, the work took into account the range of interests of the user.
Unlike the A-B-X models of Theodore Newcomb, B. Westley and M. McLean considered the presence of feedback in their model. To do this, they divided communication into direct and indirect (feedback). In Figure 1, these are the arcs “B” to “A” (arc “FBA”), from “B” to “C” (arc “FBC”), and from “C” to “A” (arc “FCA”). In social networks, comments, responses to comments, “like”, “dislike”, subscriptions, and other actions of participants in the information exchange serve as an example of reverse communication. Therefore, it is possible to evaluate the source as media by the level of feedback from its audience in the SN.
Despite the fact that there are papers that took into account feedback from the user, for example the paper [28] raised a very important question: the challenges of IoT and social relationships via devices, the following main problems were considered in the paper: (1) social Big Data; (2) social feature processing; (3) social context awareness; (4) social data privacy. The basis for the occurrence of challenges is feedback at any level from the user. In their other work, the same authors suggested the user interest detection paradigm (IoP) [29]. However, such works are not aimed at detecting a popular source of malicious information.
Based on the analysis, it can be concluded that, despite the many existing approaches and solutions, most of them were developed within the framework of separate scientific schools, either in the technical sciences, or in the framework of research in sociology, political science, and communication theory. A paradigm shift is needed to expand the space of features that characterize the source of the distribution of destructive content. As part of the proposed approach, the authors propose to take into account not only such features as the number of messages from a source in a social network, but also to add an analysis of feedback from the message audience. This will allow one to rank objects by priority, highlighting those that attract the attention of the audience. Then, it will be possible to direct the resources and attention of the expert to priority objects. The same approach will reduce the cost of analyzing relationship graphs, which are an integral part of bioinspired algorithms and existing solutions.
3. An Approach to Ranking the Sources of Information Dissemination
The proposed approach to ranking the sources of information dissemination in social networks is based on the idea that every information object in a social network, whether it is the message itself or the page, on which it is published, has an audience. At the same time, all social networks are built in such a way that we see the number of views, like or dislike marks, and the number of comments. Consequently, both for a single message and for the page on which it is published (the source), such a set of features can be formed that will allow ranking messages, and on the basis of this, the sources can be ranked. It is also important to mention that in the proposed approach, we considered the source as a primary or secondary source, where the message is published. It is not the author; it is primarily a page in the social network.
Ranking sources by priority ensures that the operator’s attention is distributed from the most active and popular sources among the audience to the least noticeable. Furthermore, according to Hootsuite, in 2020, only the social network Facebook had 2.74 billion monthly active users per month [30]. Even if only 0.001 of these users post a message with destructive content, there will be 1,000,000 of them per month. The approach of ranking the sources of information dissemination in social networks ensures the distribution of the operator’s attention.
The approach itself includes a model and three algorithms. The model describes information objects, relationships among them, and features. Thus, the model allows one to form requirements for algorithms for analyzing and evaluating sources. A complex of three algorithms receives information about messages, sources, and activity metrics as the input. The first algorithm in the complex provides the ranking of sources by the number of messages published by them. The second algorithm calculates a set of indexes for each message and then for the source (audience activity, coverage, and an integral indicator: the influence of the source on its audience). The third algorithm ranks the sources and sorts them by priority, considering all the indicators obtained earlier.
The approach is divided into three algorithms, since the first and second algorithms provide analysis and evaluation of sources and can be used outside the approach in the process of selecting an object to choose a counteraction measure. However, together, all three algorithms allow one to rank sources considering various parameters.
3.1. Input and Output Data
The input data for the approach are described by a set of messages and the sources of these messages:
where —a set of messages containing malicious information and —a set of sources of these messages. At the same time, the content analysis of texts goes beyond the scope of the current research.
where —address of the message in the SN, —source of the message, as a page of the social network, characteristics of feedback from the message audience, and —message type (post, comment, or response to a comment).
where —unique source ID and —source address in the SN.
where —the number of “like” marks, —the number of “repost” (copies with a link to the source), —number of views, and —number of comments.
3.2. Malicious Information Model
The basis for the formation of the concept of malicious information is two terms: (1) information (); (2) information object (). Formally, both of these terms are related to each other, in such a way that , i.e., an information object is an element of the set of all the analyzed information.
Furthermore, in the process of developing a model of malicious information, the authors proceeded from the fact that:
- “Dissemination of information” is all actions aimed at obtaining information by an indefinite circle of persons or transmitting information to an indefinite circle of persons;
- “Source” is a page in a social network on which information is published that is accessible to an indefinite circle of people;
- A “message” is an information object containing a text created and published in the process of information exchange on a social network.
Let us assume that is a malicious information object that contains signs that allow one to decide that information harms society, individuals, the state, or business.
At the same time, the sign () of the information threat () is set by an expert (operator) depending on the conditions. Let us consider an example of the information and feature table formed by an expert (in Table 1).
Therefore, the set-theoretic model of malicious information in a social network includes such basic elements as:
- IO—the information object;
- T—the information threat;
- MIO—the malicious information object;
- Token—a sign of an information threat contained in a malicious information object;
- Feature—discrete attribute of an information object.
The set-theoretic model is formally presented as follows:
where —a discrete set of information objects, single information object, —a discrete set of all possible signs of an information threat, —one sign of an information threat, —a discrete set of malicious information objects, —a separate class of malicious information, a —a discrete set of features that characterize .
Thus, to analyze and evaluate the sources of malicious information in social networks, it is necessary to define a discrete set of signs characteristic of the information threat. A distinctive feature of the proposed model is that according to it, the presence features in a set is allowed, such as the date of creation of an information object, feedback from the audience, the frequency of the feature, etc.
3.3. Algorithms for Ranking the Sources of Information Distribution
3.3.1. Algorithm for Ranking Sources by Potential
Let us assume that the collection of messages in the can be divided using that belong to different numbers of messages from the . At the same time, each message is located at a certain depth level of the “message tree” on the source wall. If it is a post, it is the “root of the tree”. If this is a comment to a post, then the message is located on the second level of the tree, the response to the comment occupies the third level. A numerical coefficient is assigned to the each message according to the following: (1) the post coefficient is “1”; (2) the comment coefficient is “0.5”; (3) all additional responses to the comment are assigned a coefficient equal to “0.25”.
Depending on the number of messages on the wall, the sources can be grouped by their potentials, as follows:
- The source potential is low , when it corresponds to Inequality (6):where —the sum of the numerical coefficients of all messages on the source wall, —the amount of messages belonging to the source, and —the arithmetic mean in the dataset for all sources in ;
- The source potential is the medium , when the inequality is observed (7):where —the sum of the numerical coefficients of high-potential messages (message potential greater than ) on the source wall, —the amount of such messages, and —the arithmetic mean in the dataset obtained after separating the sources with low potential . from the original ;
- The source potential is high , if Inequality (8) is kept:where —the arithmetic mean in the dataset obtained after separating the sources with low potential . from the original (see Formula (7)).
Thus, all sources in the dataset, depending on the number and depth of messages on the source wall, can be ranked by the potential (Table 2):
Let us consider the algorithm for ranking sources by potential:
A set of tuples is fed to the input to the algorithm to rank sources by potential. Next, the data are processed in steps:
Step 1. Assigning a numerical coefficient to each message in the set depending on the attribute and summing the numerical coefficients of all messages for each source. The output is formed by the tuple ;
Step 2. Calculation of the first arithmetic mean by the number of messages belonging to the sources. For sources with a value less than the first arithmetic mean, a low potential indicator is assigned equal to 1. Sources with low potential are separated, and a new tuple is formed;
Step 3. Calculation of the second arithmetic mean by the number of source messages. For sources with a value less than or equal to the second arithmetic mean, a potential indicator equal to 2 is assigned. For sources with a value greater than the second arithmetic mean, the potential indicator is 3.
At the output of the algorithm for ranking sources by potential, the tuple .
The algorithm for ranking sources by potential, unlike existing ones, considers the number of published messages and the depth of their location on a page in a social network when ranking sources.
3.3.2. The Algorithm for Evaluating Sources
Let the set of include all the features of feedback from the audience of malicious information on a social network, while is the number of “like” marks, is the number of “repost”, is the number of views, and is the number of comments.
The set includes the source ID and the address of messages in the social network.
In accordance with the requirements, it is necessary to find a tuple of attributes that characterize the through the elements of the and the relation where is the index of activity, is the index of viewability, and is the index of influence of the source.
The activity index can be set via the objective Function (9):
where —activity of the source’ audience and —source activity index. The value of the activity index is between 0 and 2, and at the same time, normalization is applied to the values of the indices (); the normalization method is a comparative normalization, in which the maximum is selected for the ideal value.
The index of viewability can be set by Function (10):
where —source visibility and —the index of the viewability of the source, the value of which is normalized.
The index of the influence of the source can be set by the objective Function (11):
where —the influence of the source and —the index of the influence of the source to which the comparative normalization is applied.
All indexes mentioned above (index_active, index_viewability, and index_impact) can have values of “0”, “1”, and “2” for different messages. These values reflect the importance of the message in each aspect (auditory activity, viewing ability of the message—size of the auditory and possible impact of the message), where “2” is the maximal importance and “0” is the minimal importance.
The algorithm for evaluating sources, unlike analogues, considers the quantitative characteristics of feedback from the audience of malicious information in the process of information exchange and converts them into qualitative (indexes).
3.3.3. Algorithm for Ranking Sources by Priority
The algorithm for ranking sources by priority is related to the algorithms for ranking sources by potential and evaluating sources in such a way that it receives output data from these algorithms at the input and sorts sources by priority at the output. This allows us to rank sources taking into account the fact that the input is based on 2 axes (i.e., the priority of the source and the potential of the source). Besides reducing them to an integral indicator, this makes it possible to perform ranking to support the operator’s decision-making. An assessment of the effectiveness of this approach to support decision-making is given in Section 4.3.
Formally, the objective function of prioritizing sources can be given by Formula (12):
where —source, —source priority, —potential, and —influence index.
The algorithm for ranking sources by priority is based on a method with the step-by-step consideration of criteria such as the index of influence and potential. The procedure consists of alternately rejecting the worst-case variants for each of the normalized criteria, pre-ordered by degree of importance in a priority series, starting from the first. The worst options are determined by the minimum values of the corresponding criteria (the index of influence and potential) and close to the minimum.
According to the algorithm for ranking sources by priority, the rules for choosing a priority source for distributing information are as follows:
where is a set of sources of information diffusion ranked by priority, is the source priority, and symbol is read as equal (if the ranks for the influence index and for the source potential are equal to the maximum/minimum) or it is read as approximately equal (then, the rank of one of the criteria may not be the maximum/minimum).
A set of tuples is passed to the input of the sorting algorithm for the objects of influence, where —the address of the message in SN, —ID of the message source, —source potential, and —influence index.
The algorithm is based on sorting with binary search, for which the arithmetic mean value of the index of influence of all sources in the array is calculated at the first step. Next, the objects with high and low priority are selected. A set of tuples is created separately with a priority index .
At the output, two lists and a set of tuples are formed: (1) list —targets where the objects of observation are , having the highest priority and the highest potential; (2) list —targets where the objects of observation are , having a low priority (perhaps, the operator should not pay attention to these objects); such information objects have the lowest potential and influence index; (3) list —a set of tuples that is passed to experts for additional evaluation; for such sources, the influence index can either be maximum, but the source potential is average, or vice versa.
Thus, the model and algorithms provide the ranking of sources of information dissemination in social networks by priority, depending on the feedback from the audience on messages containing destructive content and depending on the number of such messages belonging to one source.
4. Experiments and Discussion
4.1. Description of the Testbed and the Original Data
A testbed with the following characteristics was prepared for the experimental evaluation: (1) Intel(R) Core (TM) i5-9600CPU 3.10 GHz/DDR16.00G/128SSD/1000HDD; (2) “Edition Windows 10 Education Version 20H2”, installed 6 November 2020, build 19042.685/Experience Windows Feature Experience Pack 120.2212.551.0; (3) Microsoft Office Standard 2019, Pycharm 2020.14 (Community Edition), Python 3.8. The software component of the analysis and evaluation of sources in social networks was implemented in Python. It was created in Google Colaboratory and is available on GitHub [31]. The datasets contain the following fields:
- (1)
- source (source id);
- (2)
- message (message id);
- (3)
- id_ath (author’s id);
- (4)
- date (date of the message);
- (5)
- type (message type);
- (6)
- like (the number of “likes” to the message);
- (7)
- comm (the number of comments on the message);
- (8)
- repost (the number of “repost” messages);
- (9)
- view (the number of views of the message).
To conduct the experiments, it was necessary to form a dataset that would contain malicious information. It is possible that the social network has already partially deleted the malicious information, so collecting a dataset with such information may lead to the fact that the dataset will not be relevant. The initial data were collected from the VK social network, and a neutral topic was used for data collection (skyscrapers in St. Petersburg). The data were collected in the context of the month: May or June. Further, the datasets were anonymized: the sources and messages were assigned IDs in a random order, while preserving the number of messages from the source and quantitative characteristics from the source’s audience. The date and author ID fields were stored in the dataset for future research. The detection of the malicious content is out of the scope in the approach evaluation, and that is why there is no difference between malicious and regular messages. The impact metrics were the same for all messages. However, the activity metrics can be affected by the social network activity, so for the correct evaluation, we selected the messages that were out of interest for the social network.
4.2. Analysis of the Results of the Experiment
According to the results of the experiment, the following data were collected for each month (Table 3).
In total, 2734 messages were collected in May. The application of the proposed approach (ranking experiment) showed that for 11 of them, the highest priority was assigned (May (A)), and 46 of them had almost the highest priority (May (B)). The sources in the second place had a high level of feedback from the audience, but they owned the average number of messages characteristic of the entire dataset. In June, only 1450 messages were collected. Five sources had the highest priority, and the largest number of messages belonging to them were allocated. The approach allowed us to identify those surveillance objects that require the close attention of information security experts.
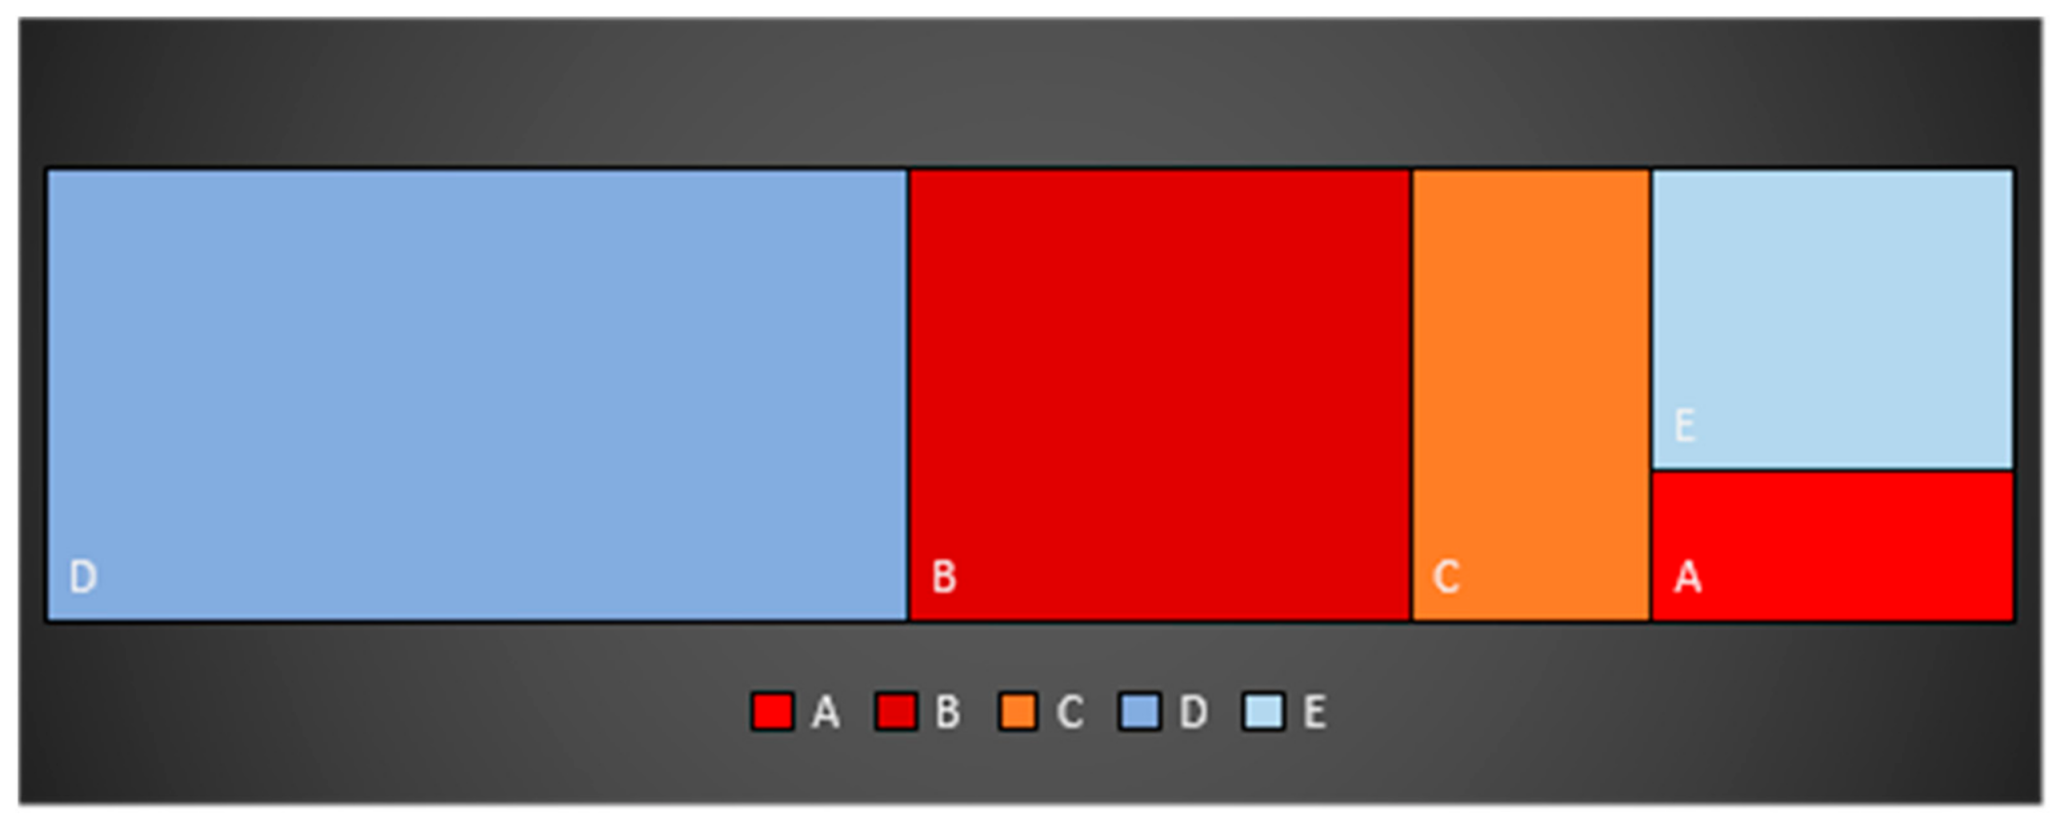
The distribution of the number of objects of the observation can be represented visually as follows (Figure 2). The first three rows from Table 3 are marked in red, burgundy, and orange. Block A includes the highest priority sources, which have a high priority (the highest index of influence) and a high potential. Block B consists of sources that have a high priority, but the source potential is two, that is the average. Block C includes sources that have an average priority, but the source potential is three, that is equal to the maximum. Block D includes sources that have an average priority and an average potential. Block E includes sources that have a high priority, but the potential is minimal.
The approach to ranking the sources of information dissemination in social networks allows one to distinguish among the many information objects containing destructive content and those that attract more audience attention and create new messages more often. Thus, an information security expert primarily pays attention to the most significant objects, thereby allocating his/her time and resources more efficiently.
4.3. Discussion and Evaluation of the Proposed Approach
One of the most controversial issues is content analysis, because the proposed approach assumes that all objects in the dataset contain destructive content. The analysis of text arrays and products of communicative correspondence is the subject of future research.
The positive side of the approach to ranking the sources of information dissemination in social networks is its simplicity; in fact, the complex of algorithms can be implemented in any programming language or in electronic tables, and this significantly reduces the resource consumption of the system during data processing. In the future, the authors plan to conduct research with datasets containing more than 100,000, 500,000, and 1,000,000 information objects and compare the CPU and RAM load indicators during processing.
The disadvantages of the approach include the need to collect data from social networks, which is difficult both from a legal point of view and from a technical point of view. For the experiments, we used data obtained from the Russian social network VK, and according to the rules, the data obtained through the API, including the methods of newsfeed.search, wall.get, and wall.search, including user IDs, cannot be used for the purpose of transfer or resale, the creation of analytical reports, scoring, etc., directly or through intermediaries, without the direct consent of the site administration. For research purposes, all data were anonymized, but the question of the consent of the administration of the social network to cooperate with a third-party organization, application, or service, even for the purpose of the information security of users, in order to protect children from cyberbullying, remains always open.
To evaluate the proposed approach, a comparison of the efficiency of the operator of the system for countering the spread of malicious information was used. Let us assume that messages containing malicious information were detected. Each of the sources containing these messages has its own audience. The audience size of each source is denoted as , where is the message number from one to . In order to carry out actions aimed at preventing the spread of a message, the system operator must consider this message and make a decision to block it or take other actions. For a fixed period of time (for example, one day), the operator can consider no more than messages, and is significantly less than the total number of messages .
Let us denote the average audience of all detected messages and processed by the operator as:
Thus, the efficiency of the operator’s work is the percentage of the audience of malicious messages that were protected from receiving malicious information (14):
If the operator works with traditional systems for detecting malicious information, he/she receives a random set of messages for processing. At the same time, the average audience size of these messages is approximately equal to the average audience size of all messages (). Thus, the efficiency of the operator’s work with traditional systems () can be represented as (15):
If the operator works using the approach proposed in this paper, then he/she receives messages ranked by their impact on the audience for consideration. Thus, the average audience size of the messages processed by the operator is larger than the average audience size of all messages (). This coefficient is equal to one if all messages have the same audience and more than one in the case when the audience of the messages is unevenly distributed. Thus, the efficiency of the operator’s work when using the proposed approach () can be represented as (16):
The ratio of the efficiency of the operator’s work using the traditional and the proposed approach can be represented as (17):
Thus, the increase in the operator’s efficiency is equal to , which is greater than or equal to one, which suggests that the application of the proposed approach makes it possible to increase the operator’s efficiency.
Furthermore, the results of the experiment were manually checked by an expert who works in the area of social network analysis for malicious information counteraction. The expert validated the random set of the results and evaluated our approach as something that can be useful for his duties.
Since no completely similar systems or analogues were found (there are many systems that can help the operator detect the malicious content, but there are almost none that can help him to prioritize them according to their impact on the audience), a theoretical evaluation of the results was carried out. A decrease of the required time and resources with an overall increase in the efficiency of the operator’s work were confirmed by the experimental evaluation. It is important to note that improving the efficiency of analysis and evaluation of malicious information sources, taking into account feedback from their audience, allows the operator to select the most relevant and noticeable media in the social network. The proposed approach does not require content analysis or graph analysis, but uses only visible quantitative characteristics of information objects. That is why it allows one to reduce resource and time costs in the monitoring process.
5. Conclusions
The paper proposed an approach to ranking the sources of information dissemination, considering feedback from the audience of social networks and the number of messages created by the source. This approach ensures the prioritization of monitoring objects for the operator of the monitoring system or the counteraction system and allows for the rational allocation of resources.
This study contains a detailed description of the proposed model of malicious information, including information objects, signs of destructive content, discrete features for information objects, and connections among them. A complex of three related algorithms was also developed. The first algorithm ranks the sources of malicious information distribution depending on the number of messages created by them. The second algorithm sets metrics for evaluating the level of feedback from the audience of social networks. The third algorithm ranks sources from the most popular to the least visible and then generates lists with sources that are a priority for the operator’s attention. Furthermore, optionally, the third algorithm identifies the worst sources of information dissemination; it was assumed that they should not be given time at all and/or operator can use automatic countermeasure.
This approach can be used in brand reputation monitoring systems. The model and algorithms are also applicable to countering cyberbullying and information diffusion about drugs, weapons, extremism, and terrorism. The authors plan to continue their research.
In the process of experimental testing, an algorithm for ranking countermeasures and a method for countering malicious information in social networks is being developed. In addition, the authors plan to conduct research to detect the targeted dissemination of malicious information using bots [32].
Author Contributions
Conceptualization and methodology: L.V., A.C. and I.K.; software and project administration: L.V. and A.C.; validation, formal analysis, and review and editing: L.V., A.C. and I.K.; investigation, writing original draft preparation, and visualization: L.V.; supervision: I.K. and A.C. All authors have read and agreed to the published version of the manuscript.
Funding
This research was funded by the Russian Science Foundation, Grant Number 18-71-10094P.
Institutional Review Board Statement
Not applicable.
Informed Consent Statement
Not applicable.
Data Availability Statement
The data presented in this study are available in https://github.com/LidiaISKIN/analyzing-evaluating_sources (accessed on 7 October 2021).
Conflicts of Interest
The authors declare no conflict of interest.
References
- Hootsuite Inc. Available online: https://www.hootsuite.com/platform (accessed on 21 August 2021).
- Top 25 [Free + Paid] Social Media Analytics Tools in 2021. Available online: https://keyhole.co/blog/list-of-the-top-25-social-media-analytics-tools/ (accessed on 21 August 2021).
- Shelke, S.; Attar, V. Source detection of rumor in social network—A review. In Online Social Networks and Media; Elsevier: Amsterdam, The Netherlands, 2019; Volume 9, pp. 30–42. [Google Scholar] [CrossRef]
- Luo, W.; Tay, W.P.; Leng, M. How to identify an infection source with limited observations. IEEE J. Sel. Top. Signal Process. 2014, 8, 586–597. [Google Scholar] [CrossRef] [Green Version]
- Wang, Z.; Zhang, W.; Tan, C.W. On inferring rumor source for SIS model under multiple observations. In Proceedings of the 2015 IEEE International Conference on Digital Signal Processing (DSP), Singapore, 21–24 July 2015; pp. 1543–8675. [Google Scholar] [CrossRef]
- Pronoza, A.; Vitkova, L.; Chechulin, A.; Kotenko, I. Visual analysis of information dissemination channels in social network for protection against inappropriate content. In Proceedings of the Third International Scientific Conference “Intelligent Information Technologies for Industry” (IITI’18), Sochi, Russia, 17–21 September 2018; Advances in Intelligent Systems and Computing. Springer: Cham, Switzerland, 2018; Volume 875, pp. 95–105. [Google Scholar] [CrossRef]
- Google Academy. Available online: https://scholar.google.com (accessed on 21 August 2021).
- Wasserman, S.; Galaskiewicz, J. Advances in Social Network Analysis: Research in the Social and Behavioral Sciences; SAGE Publications, Inc.: Thousand Oaks, CA, USA, 1994; Available online: https://0-sk-sagepub-com.brum.beds.ac.uk/books/advances-in-social-network-analysis (accessed on 21 August 2021).
- Cook, K.S.; Whitmeyer, J.M. Two Approaches to Social Structure: Exchange Theory and Network Analysis. Annu. Rev. Sociol. 1992, 18, 109–127. [Google Scholar] [CrossRef]
- Otte, E.; Rousseau, R. Social network analysis: A powerful strategy, also for the information sciences. J. Inf. Sci. 2002, 28, 441–453. [Google Scholar] [CrossRef]
- Dang, L.; Chen, Z.; Lee, J.; Tsou, M.H.; Ye, X. Simulating the spatial diffusion of memes on social media networks. Int. J. Geogr. Inf. Sci. 2019, 33, 1545–1568. [Google Scholar] [CrossRef]
- Grandjean, M. Analisi e visualizzazioni delle reti in storia. L’esempio della cooperazione intellettuale della Società delle Nazioni. Memoria Ricercar 2017, 55, 371–393. [Google Scholar] [CrossRef]
- Brennecke, J.; Rank, O. The firm’s knowledge network and the transfer of advice among corporate inventors–A multilevel network study. Res. Policy 2017, 46, 768–783. [Google Scholar] [CrossRef]
- Meel, P.; Vishwakarma, K. Fake news, rumor, information pollution in social media and web: A contemporary survey of state-of-the-arts, challenges and opportunities. Expert Syst. Appl. 2020, 153, 112–986. [Google Scholar] [CrossRef]
- Minnseok, C.; Chong, U.P.; Jiyoung, W. Epidemic Modeling of Sentiment Diffusion on Web Forums. Adv. Sci. Lett. 2017, 23, 10477–10480. [Google Scholar] [CrossRef]
- Chen, T.; Shi, J.; Yang, J.; Cong, G.; Li, G. Modeling Public Opinion Polarization in Group Behavior by Integrating SIRS-Based Information Diffusion Process. Complexity 2020, 1076–2787. [Google Scholar] [CrossRef]
- Jager, W. Uniformity, Bipolarization and Pluriformity Captured as Generic Stylized Behavior with an Agent-Based Simulation Model of Attitude Change. Comput. Math. Organ. Theory 2004, 10, 295–303. [Google Scholar] [CrossRef] [Green Version]
- Albert, R.; Barabási, A.L. Statistical mechanics of complex networks. Rev. Mod. Phys. 2002, 74, 47–97. [Google Scholar] [CrossRef] [Green Version]
- Kotenko, I.; Saenko, I.; Chechulin, A.; Desnitsky, V.; Vitkova, L.; Pronoza, A. Monitoring and counteraction to malicious influences in the information space of social networks. In Proceedings of the 10th Social Informatics conference (SocInfo2018), Proceedings, Part II. St. Petersburg, Russia, 25–28 September 2018; Lecture Notes in Computer Science. Springer: Berlin/Heidelberg, Germany, 2018; Volume 11186, pp. 159–167. [Google Scholar] [CrossRef]
- Riquelme, F.; González-Cantergiani, P. Measuring user influence on Twitter: A survey. Inf. Process. Manag. 2016, 52, 949–975. [Google Scholar] [CrossRef] [Green Version]
- Shannon, C.E. A Mathematical Theory of Communication. Bell Syst. Tech. J. 1948, 27, 379–423. [Google Scholar] [CrossRef] [Green Version]
- Communication Theory. Oxford Reference. Available online: https://0-www-oxfordreference-com.brum.beds.ac.uk/view/10.1093/oi/authority.20110810104639648 (accessed on 21 August 2021).
- Westley, B.H.; MacLean, M.S. A Conceptual Model for Communications Research. J. Mass Commun. Q. 1957, 34, 31–38. [Google Scholar] [CrossRef]
- Guo, Y.H.; Liu, L.; Wu, Y.; Hardy, J. Interest-aware content discovery in peer-to-peer social networks. ACM Trans. Internet Technol. (TOIT) 2018, 18, 1–21. [Google Scholar] [CrossRef]
- Small, M.L.; Perry, B.L.; Pescosolido, B.; Smith, E. The Past and Future of Ego-Centric Network Analysis. Available online: https://scholar.harvard.edu/files/mariosmall/files/small_etal_pastandpresentegonetworks.pdf (accessed on 21 August 2021).
- Mican, D.; Sitar-Tăut, D.A.; Mihuţ, I.S. User behavior on online social networks: Relationships among social activities and satisfaction. Symmetry 2020, 12, 1656. [Google Scholar] [CrossRef]
- Zeng, Y.; Hao, H.; Zhong, N.; Ren, X.; Wang, Y. Ranking and combining social network data for web personalization. In Proceedings of the 2012 Workshop on Data-Driven User Behavioral Modelling and Mining from Social Media, Maui, HI, USA, 29 October 2012; pp. 15–18. [Google Scholar]
- Dhelim, S.; Ning, H.; Farha, F.; Chen, L.; Atzori, L.; Daneshmand, M. IoT-Enabled Social Relationships Meet Artificial Social Intelligence. IEEE Internet Things J. 2021. [Google Scholar] [CrossRef]
- Dhelim, S.; Ning, H.; Aung, N. ComPath: User interest mining in heterogeneous signed social networks for Internet of people. IEEE Internet Things J. 2020, 8, 7024–7035. [Google Scholar] [CrossRef]
- 47 Facebook Stats. That Matter to Marketers in 2021/Hootsuite Inc. Available online: https://blog.hootsuite.com/facebook-statistics/ (accessed on 21 August 2021).
- Q3 paper.ipynb. Analyzing-Evaluating_Sources. Available online: https://github.com/LidiaISKIN/analyzing-evaluating_sources/blob/main/Q3_paper.ipynb (accessed on 21 August 2021).
- Kolomeets, M.; Tushkanova, O.; Levshun, D.; Chechulin, A. Camouflaged bot detection using the friend list. In Proceedings of the 29th Euromicro International Conference on Parallel, Distributed and Network-Based Processing (PDP), Valladolid, Spain, 10–12 March 2021; pp. 253–259. [Google Scholar] [CrossRef]
Figure 1.
The Westley–McLean integral communication model.

Figure 2.
Visual representation of priority sources in May.


Table 1.
Information and feature table of malicious information.
| Suicide | A message containing an order to commit suicide | |
| A message describing suicide as a way to solve problems with misunderstanding at school |
Table 2.
Numerical coefficient of the source potential.
| The Value of the Potential | The Potential | Description |
|---|---|---|
| 1 | Low potential of source | |
| 2 | Medium potential of source | |
| 3 | High potential of source |
Table 3.
Ranked sources of information diffusion by priority.
| Month | Priority of Source | Potential of Source | Number of Sources in the Set |
|---|---|---|---|
| May (A) | 3 | 3 | 11/2734 |
| May (B) | 3 | 2 | 46/2734 |
| May (C) | 2 | 3 | 22/2734 |
| May (D) | 2 | 2 | 79/2734 |
| May (E) | 3 | 1 | 22/2734 |
| May | 2 | 1 | 877/2734 |
| May | 1 | 3 | 66/2734 |
| May | 1 | 2 | 105/2734 |
| May | 1 | 1 | 1334/2734 |
| June | 3 | 3 | 5/1450 |
| June | 3 | 2 | 20/1450 |
| June | 2 | 3 | 8/1450 |
| June | 2 | 2 | 26/1450 |
| June | 3 | 1 | 168/1450 |
| June | 2 | 1 | 562/1450 |
| June | 1 | 3 | 19/1450 |
| June | 1 | 2 | 29/1450 |
| June | 1 | 1 | 613/1450 |
Publisher’s Note: MDPI stays neutral with regard to jurisdictional claims in published maps and institutional affiliations. |
© 2021 by the authors. Licensee MDPI, Basel, Switzerland. This article is an open access article distributed under the terms and conditions of the Creative Commons Attribution (CC BY) license (https://creativecommons.org/licenses/by/4.0/).
Share and Cite
MDPI and ACS Style
Vitkova, L.; Kotenko, I.; Chechulin, A. An Approach to Ranking the Sources of Information Dissemination in Social Networks. Information 2021, 12, 416. https://0-doi-org.brum.beds.ac.uk/10.3390/info12100416
AMA Style
Vitkova L, Kotenko I, Chechulin A. An Approach to Ranking the Sources of Information Dissemination in Social Networks. Information. 2021; 12(10):416. https://0-doi-org.brum.beds.ac.uk/10.3390/info12100416
Chicago/Turabian StyleVitkova, Lidia, Igor Kotenko, and Andrey Chechulin. 2021. "An Approach to Ranking the Sources of Information Dissemination in Social Networks" Information 12, no. 10: 416. https://0-doi-org.brum.beds.ac.uk/10.3390/info12100416
Note that from the first issue of 2016, this journal uses article numbers instead of page numbers. See further details here.