
Dynamic Community Structure in Online Social Groups


Department of Computer Science, University of Pisa, 56125 Pisa, Italy
*
Author to whom correspondence should be addressed.
†
All authors contributed equally to this work.
Information 2021, 12(3), 113; https://0-doi-org.brum.beds.ac.uk/10.3390/info12030113
Submission received: 3 February 2021
/
Revised: 25 February 2021
/
Accepted: 2 March 2021
/
Published: 5 March 2021
(This article belongs to the Special Issue The Integration of Digital and Social Systems)
Abstract
:One of the main ideas about the Internet is to rethink its services in a user-centric fashion. This fact translates to having human-scale services with devices that will become smarter and make decisions in place of their respective owners. Online Social Networks and, in particular, Online Social Groups, such as Facebook Groups, will be at the epicentre of this revolution because of their great relevance in the current society. Despite the vast number of studies on human behaviour in Online Social Media, the characteristics of Online Social Groups are still unknown. In this paper, we propose a dynamic community detection driven study of the structure of users inside Facebook Groups. The communities are extracted considering the interactions among the members of a group and it aims at searching dense communication groups of users, and the evolution of the communication groups over time, in order to discover social properties of Online Social Groups. The analysis is carried out considering the activity of 17 Facebook Groups, using 8 community detection algorithms and considering 2 possible interaction lifespans. Results show that interaction communities in OSGs are very fragmented but community detection tools are capable of uncovering relevant structures. The study of the community quality gives important insights about the community structure and increasing the interaction lifespan does not necessarily result in more clusterized or bigger communities.
1. Introduction
In recent years, the world has seen a progressive change of the way systems are working, switching from a service-centric design to a more user-centric one. For instance, the Internet of People (IoP), a newly introduced paradigm for Internet data and knowledge management [1], confirmed this trend, defining the future Internet with a human-centric approach where human behaviour models will be used to define the networks or to manage services. A concrete move in this direction is the Next Generation Internet (NGI) (Available online: https://ec.europa.eu/digital-single-market/en/policies/next-generation-internet (accessed on 31 January 2021)), a European initiative promoting the decentralization of services. Many fields will be touched by this newly born revolution: IoT, Cloud computing and Machine learning, among the others. One of the fields that will be mostly touched by this change of paradigm is the one of Social Media (Available online: http://www.eismd.eu/next-generation-internet-summit/ (accessed on 31 January 2021)), which are the most used services, where people share their personal data. Understanding the human behaviour is one of the main issue of NGI because it can help to better design human-centric services, and Social Media can help to customize services. Indeed, as many studies have demonstrated, the online behaviour of people has similar characteristics of the offline behaviour [2,3,4,5].
Current Online Social Media (OSMs), such as Facebook, Reddit, or Twitter, provide to users the possibility to establish and join virtual themed communities of people online [4,6]. People are able to easily join the so called Online Social Groups (OSGs), which gives them the ability to reach a lot of other people, possibly with common interests. These groups exist and can be joined for several reasons: helping connectivity of offline relationships (e.g., family groups), get access to more opportunities (e.g., work groups), or for simple common interests and hobbies and exchange of ideas. Despite the fact that human behaviour has been studied thoroughly in current OSMs, as the main scenario to understand the behaviour of users, OSG social properties are not analysed in depth, in contrast to offline social group properties. Typically, OSGs are virtual communities built around a common interest. Hashtags can be considered OSGs, as well as Facebook Groups, which probably represent the first definition of an OSG. Facebook Groups can have different visibility status: public or private (only visible to members). Public groups, that are groups that everyone on the Social Media can join, do not represent real content-based communities as people can exploit the openness of the group to join it, even if they are not interested in its contents. Instead, private groups require an invitation or that the user who wants to join is accepted by an administrator of the group. Private groups represent an interesting scenario that is still unexplored. Usually, in an OSG a user can join without knowing the other members of the group, and the interaction inside a group are interactions based on the membership concept. In this paper, we propose an analysis of the temporal user behaviour in OSGs by exploiting a real set of Facebook Groups. In our analyses, we focus on the study of dynamic communities built by exploiting the interactions among the users. Indeed, a group is represented as a graph where a link between two nodes means that these two nodes have interacted in the group. While the presence of communities in Social Media has been studied both in a general extent [7], and in a local extent [8,9], studies are still lacking in this specific case. We propose the concept of an interaction micro-community, which can be defined as a set of active users tightly connected to each other by the interactions they make within the group. Contrarily to the study presented in [6], in this work, we tried to have a more temporal localised approach to understand whether the daily interactions among people can still form interaction groups. The major contributions of this paper can be summarized in three points:
- We introduce the dynamic User Interaction Temporal Graph, that is a temporal graph made of the interactions among the users in the OSG;
- We analyse the dynamic Interaction Communities by exploiting a dataset consisting of 17 Facebook Groups;
- We propose a set of studies to assess the characteristics of the dynamic interaction communities by the means of 8 community detection algorithms and 6 measures.
Results show that interaction communities in OSGs are very fragmented and that different community definitions have major impact on the discovered structure. We discover that community definitions based on modularity optimization or structural definition have a more meaningful structure in the scenario of OSGs. Thanks to the temporal side of our analysis, we additionally discover that increasing the interaction lifespan does not necessarily result in more clusterized communities and that the core of an interaction community tends to be active daily.
The paper is organized as follows. Section 2 presents a survey of related works on OSG and community detection in Online Social Networks. Section 3 introduces the scenario and shows how we model the scenario using graph theory. Section 4 presents the tools used for the dynamic community detection, and Section 5 presents the measures we use to characterize the community structure. Section 6 briefly presents the dataset used for this work, while in Section 7 we propose the experimental evaluation of our analyses. Section 8 concludes the paper pointing out possible future works.
2. Related Work
Online communities are virtual social spaces where people interact to get and give information and/or support [10]. OSGs were shown to have mainly two functions, namely bridging, that is the ability to connect people with different ideas and point of views, and bonding, that is the ability to bring closer people with a similar social and ideological profile [11]. Formally, a group is described as two or more individuals who are connected by and within social relationships [12]. Instead, an OSG is described in [13] as a group of users in a Social Media environment who are closely connected to each other, interact with each other more frequently than with those outside the group, and may have interests on common topics. As explained in [14], two major types of groups exist. The first category consists of self-created groups by sorting social contacts into personal sets (colleagues, friends, followers, etc.). The second category is analogous to the clubs of the offline world: open to anyone, closed, or secret. Facebook Groups, for example, can be considered an online aggregation of individuals based on similar interests. The investigation of OSGs covers a large variety of research topics, such as information diffusion [15,16], the analysis of social engagement [17,18], the study of social roles [19] and the behaviour of the groups in general [20,21,22]. Facebook Groups in particular have been studied under many different aspects, from viral advertising [23] to peer support in medical conditions [10,24,25,26] and even as learning tools in school and university [27,28,29]. An important work studied the existence of Dunbar Circles in Facebook Groups [4], showing that these groups have characteristics similar to the offline world. However, most of their dynamics, especially the ones related to graph properties [30], are still unknown.
The literature concerning OSGs involved several other online platforms. In [31], Flickr groups have been used to characterize online groups along with space, time and social dimensions. In [32], authors show the structure of user interaction patterns in groups by analysing four datasets taken from LiveJournal, YouTube, Orkut and Yahoo. In [33], authors present an analysis of YouTube groups by showing the small-world nature of the interactions. Finally, in [13], authors propose an analysis of the user’s activeness on Twitter by exploiting hashtag groups.
A very important concept in both Social Network Analysis and graph theory is the one of community [34]. A community does not have a widely accepted definition, but it can be defined, at a very high level, as a set of nodes in a graph which are tightly connected with each other, more than with nodes belonging to other communities [35]. Community detection algorithms serve to identify such groups of nodes in a network, but the ill-posedness of the problem led to a plethora of different formal definitions of community, either based on structural properties of the networks or on the algorithm used to detect them. Several algorithms have been proposed during the years [34]. The importance of community detection in OSNs has been already highlighted [8,9], and several studies have been proposed [36,37,38,39], and some tools specifically developed for the scenario of the Next Generation Internet are already appearing [40].
Concerning the specific study of the community structure of Facebook Groups, a recent work [41] analyses the dynamic communities detected in a Facebook Group, based on the sentiment expressed in the posts during a certain period of time. Another previous relevant study, [6], proposes a study to understand at a general extent what are the interaction communities in OSGs, but considers the interaction graph in an incremental fashion. In fact, in that work, once an edge appears in the interaction graph, it will never be removed.
3. Modelling Interactions in OSGs
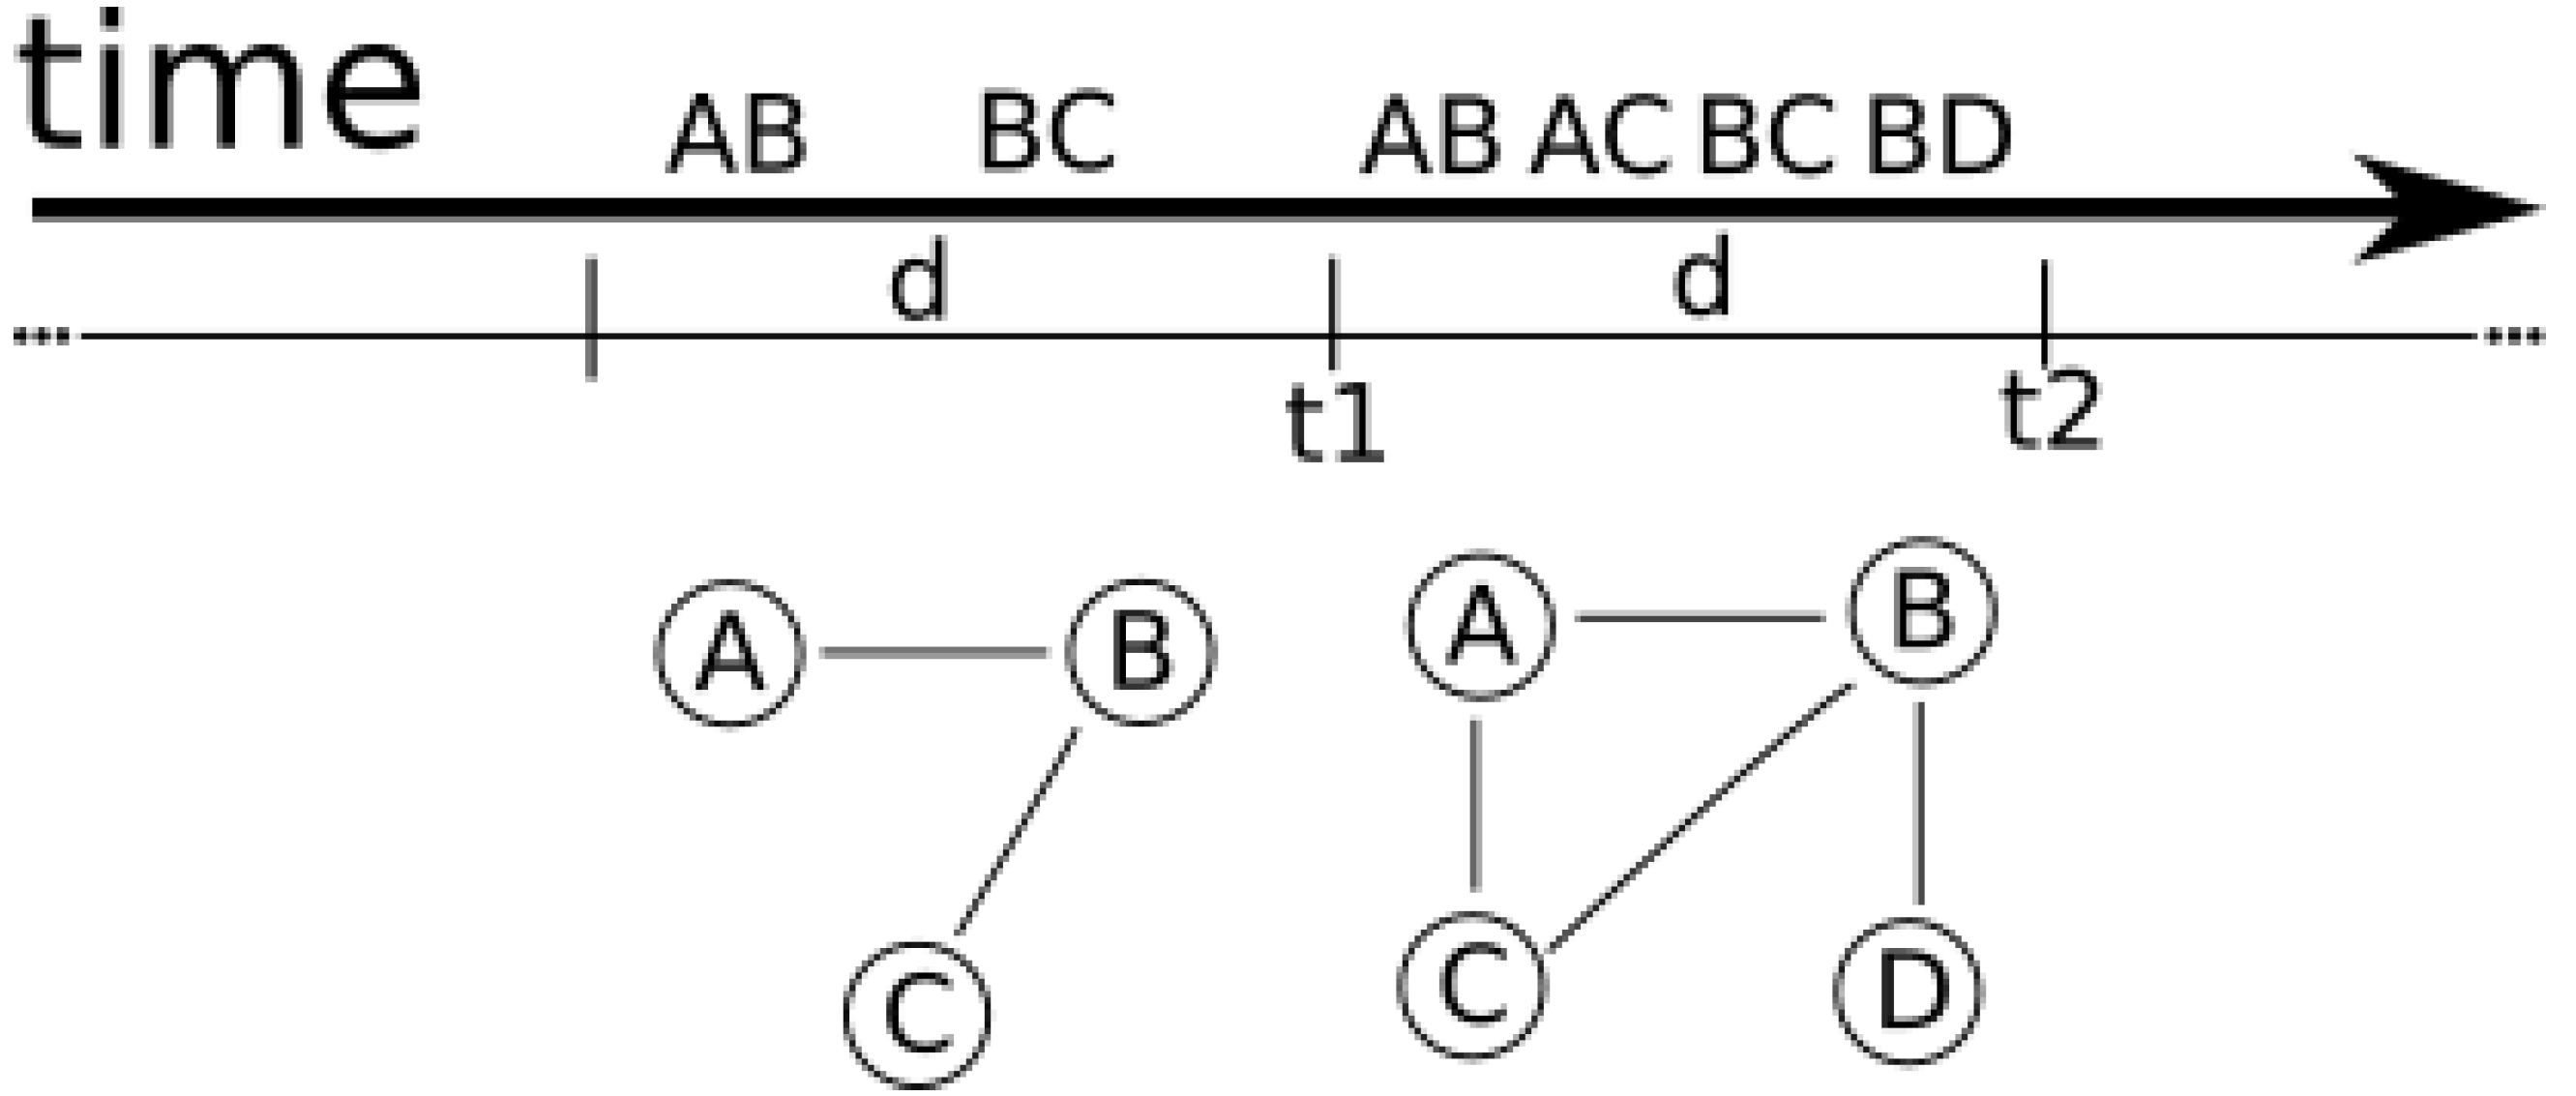
In this work we will study the interactions among users of Online Social Groups, and in particular we will study how their interactions tend to form communication groups within the social groups. To model the activity of the users inside an Online Social Group, the mostly used structure in literature is the graph coming from graph theory [6,30,34,42]. In its most basic form, a graph is a structure which is able to model a set of objects or entities through the set of vertices V, and their relations or interactions through the set of edges E. In our specific case, the set of vertices V will be used to model the users in an Online Social Group, and the set of edges will be used to model their social interactions in terms of comments to posts and comments to other comments. This model was introduced in [6], with the name User Interaction Temporal Graph (UITG). However, this model does not characterize the dynamics of the social group, due to the lack of temporal information. To face this issue, we enrich the edges , where the added information specifies at what time the interaction happened. To capture the dynamic evolution of the interactions in the OSG, we introduce the dynamic view of the UITG, called dynamic UITG (d-UITG), which works in a similar way to the UITG, but introducing an edge lifetime. Therefore, fixing an edge life duration d, the d-UITG at time t contains only the edges appearing in the time span starting from and ending at time t. The study of the d-UITG is organised as follows:
- Fix an observation period. We collect the interactions of an OSG that appeared in a fixed interval. In this study, the observations are made once every 24 h.
- d-UITG construction. The graph is obtained by fixing an edge life duration d. The graph at time t is then obtained considering the interactions appearing in the time span starting from , as described above.
- Dynamic community detection. We evaluate the communities by applying a specific community detection algorithm on the obtained d-UITG.
Through the introduction of this view, we aim to highlight the interactions that are recurring over time, which, with a long enough edge life duration, will be present in each subsequent d-UITG of the interaction network. Figure 1 showcases how the d-UITG is built. On the top part of the Figure, a shard of a UITG is represented.Below, we show the d-UITG at time , which includes two edges and three nodes, and at time , which includes four edges and four nodes. In the graphical representation of the d-UITG, the time labels on the edges are omitted for readability reasons. Thanks to the d-UITG, we are able to model the interactions recurring among users of OSGs.
Thanks to our analyses, we want to understand the typical human behaviour in these contexts, which is much different with respect to the classical scenario of OSNs. Indeed, in a traditional OSN people need to explicitly express the will to connect with other users, usually through friendship requests. On the other hand, a group is a much different entity, which revolves around a potentially numerous set of users, and typically, aside from a few exceptions, the users in the group do not know each other. Groups are not built around acquaintanceships, but they are built around shared interests, which range from arts to sports, from politics to health and beyond. Given their extreme novelty in the wide scenario of online social services, it is important to understand how people make use of them.
4. Dynamic Community Detection
In this paper, we will focus our attention on finding interactions communities in OSGs, that are the dense zones of the interaction graph. One of the major novelties included in this work, with respect to other similar works present in the literature, is that we consider that edges may be added as new pairs of nodes interacting, but edges may also disappear as two nodes do not interact again within a fixed amount of time. This novelty opens the possibility to have a more detailed and fine grained study of the community structure. Indeed, a direct consequence of considering an edge can disappear through time is the two corresponding users do not interact frequently enough. If the users have their duration refreshed and if the two users interact regularly, this will help us identify the core interaction communities in the groups. The detection and analysis of such structures is crucial, and can reveal important patterns of information flow and diffusion in these scenarios where a numerous set of peers have the chance to interact each other.
To perform the community detection task, we apply various algorithms, which can be categorized into two dynamic community detection approaches, namely the Instant Optimal approach and the Temporal Trade-off approach [43]. In the Instant Optimal approach, the community detection task at time t is performed using only the state of the network at time t. In this approach, the dynamic network is, usually, observed at equally distant points in time and for each observation the community structure is computed from scratch. This enables the usage of static community detection tools for the analysis of dynamic networks. We decided to apply this approach with 7 community detection algorithms as follows: Democratic Estimator of the Modular Organization of a Network (DEMON) [44,45] and label propagation [46] are two algorithms based on node labelling; Fast Greedy [47] and Multilevel [48] are two algorithms based on the modularity optimization; Walktrap [49] and Infomap [50,51] are two algorithms based on random walks; K-core is a structural definition based on the notion of degeneracy. Our choice was made based on a variety of unique community-type definitions and, for each type of community definition, we selected two algorithms.
On the other hand, a Temporal Trade-off approach, to compute the community structure at time t, can use the state of the network at time t and possibly all the information available in the past. The community detection process is usually carried out initializing the community structure at the first observation, and then keeping it updated through time. The algorithm of our choice belonging to this approach is TILES [38]. The choice was driven mainly by the logic of the community updates behind the algorithm. In TILES, each time an edge is added or removed in the network, communities are updated locally with respect to the change.
We now briefly present the community detection algorithms used for our analyses.
4.1. Tiles
Considering the temporal nature of communities, we need to choose an algorithm belonging to the Temporal Trade-off approach [43], and TILES [38] is a Temporal Trade-off approach with a very low running time. The algorithm considers the edge dynamism network model, which consists of considering that the network changes in terms of edge addition or removal, opposed to the node dynamism model which considers that whole nodes may join or leave the network. TILES adopts a triangle-based (subgraph of three nodes fully interconnected) definition of community to avoid accepting chain structures as communities. In fact, a node is required to be involved in at least a triangle with other nodes already inside a community to be accepted inside a community. The approach is also capable of considering edges that disappear from the network, either by explicit removal or implicit edge removal. In the explicit removal, a time at which each edge disappears must be specified. With the implicit edge removal, instead the algorithm takes as input a time to live (ttl) l for the edges, such that an edge is removed at time unless another edge is present such that , which will refresh the timeout, letting the edge survive until .
4.2. DEMON
Democratic Estimator of the Modular Organization of a Network (DEMON) [44,45] is a two step community detection algorithm. In the first step, communities local to each node are computed using label propagation [46], then these local communities are merged together to build the output communities. Local communities obtained from all nodes are then analysed and possibly merged pairwise using a threshold , which is a parameter of the algorithm. Two local communities are merged together if and only if at most a fraction equal to of the smaller community is not included in the bigger one. The merging process goes on until there are no more communities that can be merged together, and the resulting communities are returned as the global communities of the whole network G. The algorithm runs in time for a scale free network of n vertices and maximum degree K. This approach is most useful in systems where the computational power is a precious resource, such as Decentralized Online Social Networks [52], because, instead of computing the communities from scratch each time they are needed, one can also keep them updated according to the network changes (namely: edge or node addition and removal).
4.3. Walktrap
Walktrap [49] is a hierarchical community detection approach based on random walks. The general idea is that performing random walks on a graph, it tends to get trapped into sets of nodes that are densely connected. Initially, walktrap starts by assigning each node to its own community. Then, a pair of adjacent communities is chosen such that an objective function, based on computing the distance among the nodes within the chosen communities, is minimized. The two identified communities are merged together, and the merging process is stopped when all the nodes are unified within the same community. The returned communities are the ones of the partition with the highest modularity among all partitions. The algorithm computes communities structure in time where n is the number of vertices, m is the number of edges and d is the height of the corresponding dendrogram.
4.4. Multilevel
Multilevel [48] is an iterative algorithm based on the optimization of network modularity by the means of the local contribution of each node. At first, each node is assigned to its own community, then, through an iterative procedure, a node will change its community based on its contribution to the modularity score. The iterative procedure is repeated until modularity cannot be increased further. At this point, a new network is created by aggregating the nodes that belong to the same community, and on this aggregated network the iterative procedure is applied again to detect higher-level communities. The whole process is repeated recursively until only one node remains and the method runs in time where n is the number of vertices.
4.5. Label Propagation
Label propagation [46] is a very efficient algorithm for community detection claims to have almost a linear time complexity. The idea behind this algorithm is that a node should decide its community based on the communities its neighbours belong to. The algorithm starts by assigning a unique label to each node. Through an iterative procedure, labels are updated until nodes will stop changing their labels. To update the label of a node x, the most common label of its neighbours is chosen. In case of a tie (two or more labels are the most frequent ones among the neighbours of node x), a random label is chosen among the most frequent. The algorithm requires no parameter and the time complexity is where m is the number of edges and d is the total number of iterations.
4.6. K-Core
A very basic definition of community is given by the clique: A set of nodes fully interconnected. Despite its simple definition, finding all maximal cliques is a computationally hard task (NP-complete problem). The definition is also a very strict community definition and would surely lead to cases in which suboptimal communities are detected because of the missing few edges. A relaxation of the concept of clique is the K-core, which relaxes the concept of clique because, in a K-core, nodes must have at least k neighbours within the core. In other words, it is a subgraph such that each node has a degree of at least k. For large enough graphs, the K-core decomposition has time complexity, where m is the number of edges [53].
4.7. Infomap
Infomap [50,51] involves the optimization of the map equation, which models the description length of a random walk. The algorithm starts by assigning each node to its own community and nodes change their community to their neighbour’s community for which the map equation value is the lowest. If no more changes are possible, a new network is built where the nodes are the modules detected up to now, and the algorithm is repeated until a single node remains. The output is a hierarchical community structure of the network. The computational complexity of the algorithm is [54], where e is the number of edges.
4.8. Greedy Modularity
The greedy modularity method [47], also widely known as the Clauset–Newman–Moore greedy modularity maximization, is a modularity maximization approach in which nodes are initially in their own community. The pair of communities that, if considered as a single community, increases the most the modularity value is then merged. The merging process is repeated until there are no more merges that increase the modularity score. The algorithm has time complexity where n is the number of vertices, m is the number of edges and d is the depth of the dendrogram describing the network’s community structure.
5. Community Structure Evaluation
The application of the eight algorithms presented in this section will return just as many different community structures. We will then evaluate these structures using six measures which are introduced in this section for convenience.
Initially, we will analyse the community structure from a general point of view. In particular, to have a first understanding of the detected structure, we will study the number of communities and the number of active nodes for each algorithm. We say that a node is active at time t if it belongs to at least one community at time t. These two features of the community structures analysed will help us in assessing whether the algorithms used were capable of detecting a relevant community structure or not. For instance, a small number of communities and a small number of active nodes is a clear sign that the community structure is non-existent.
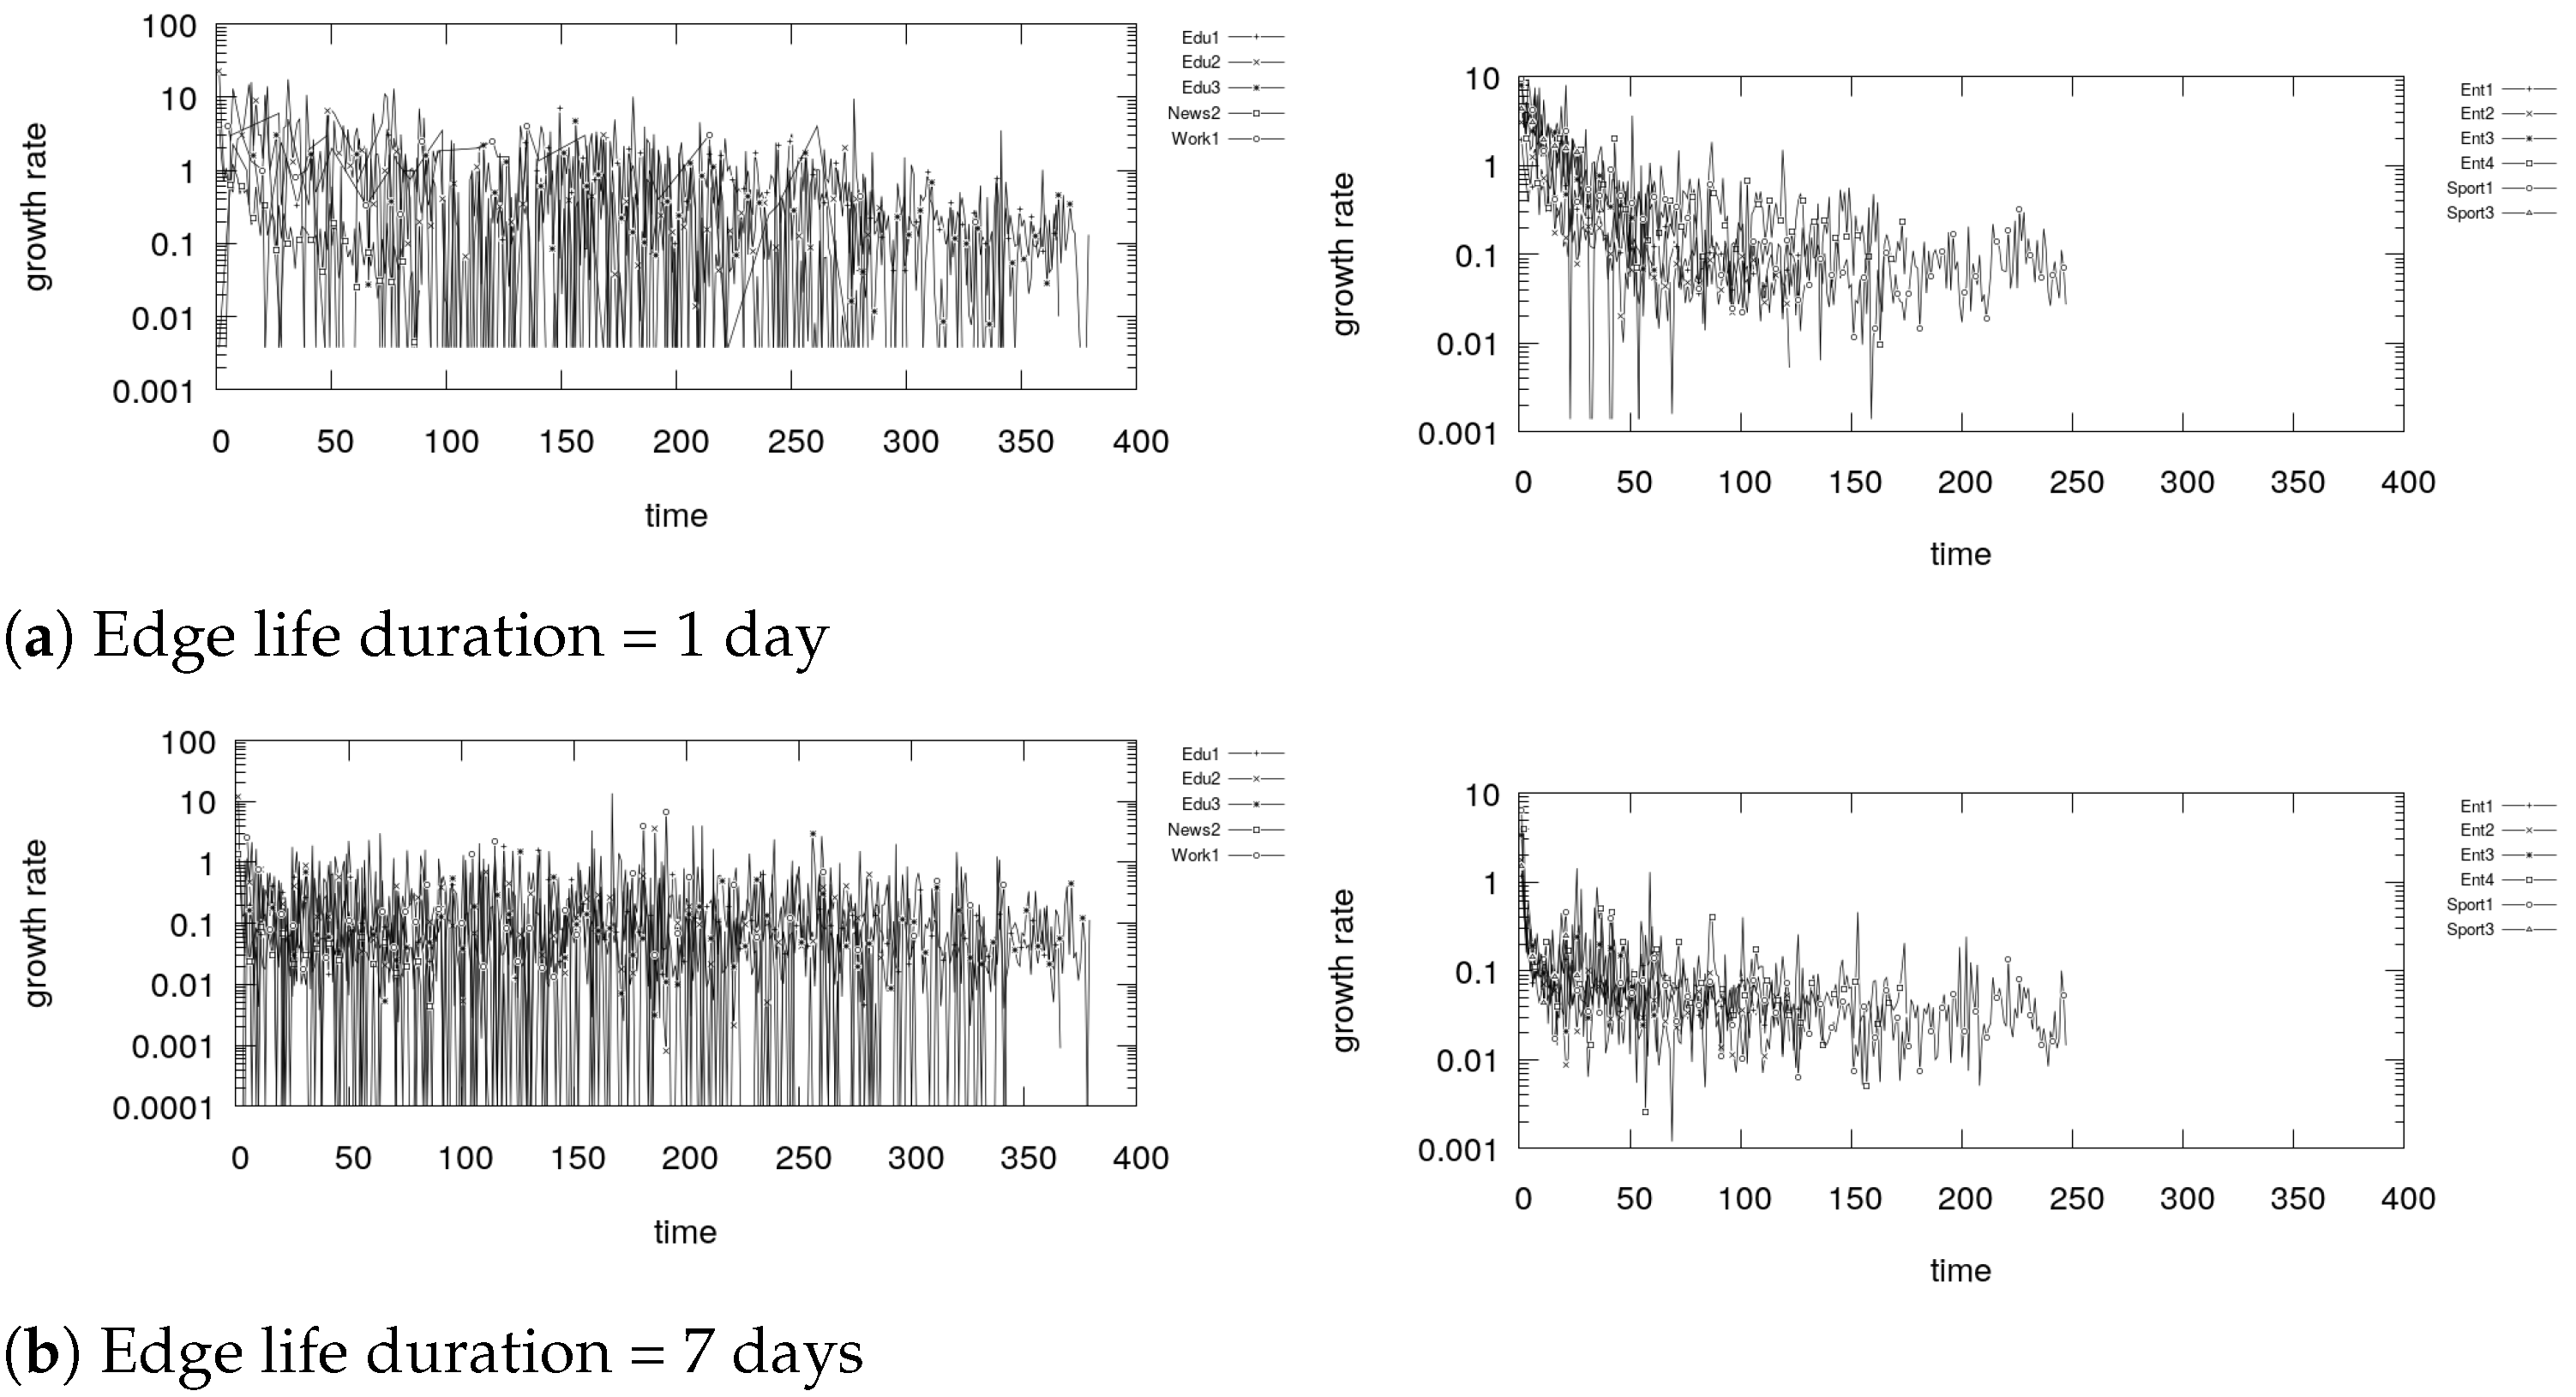
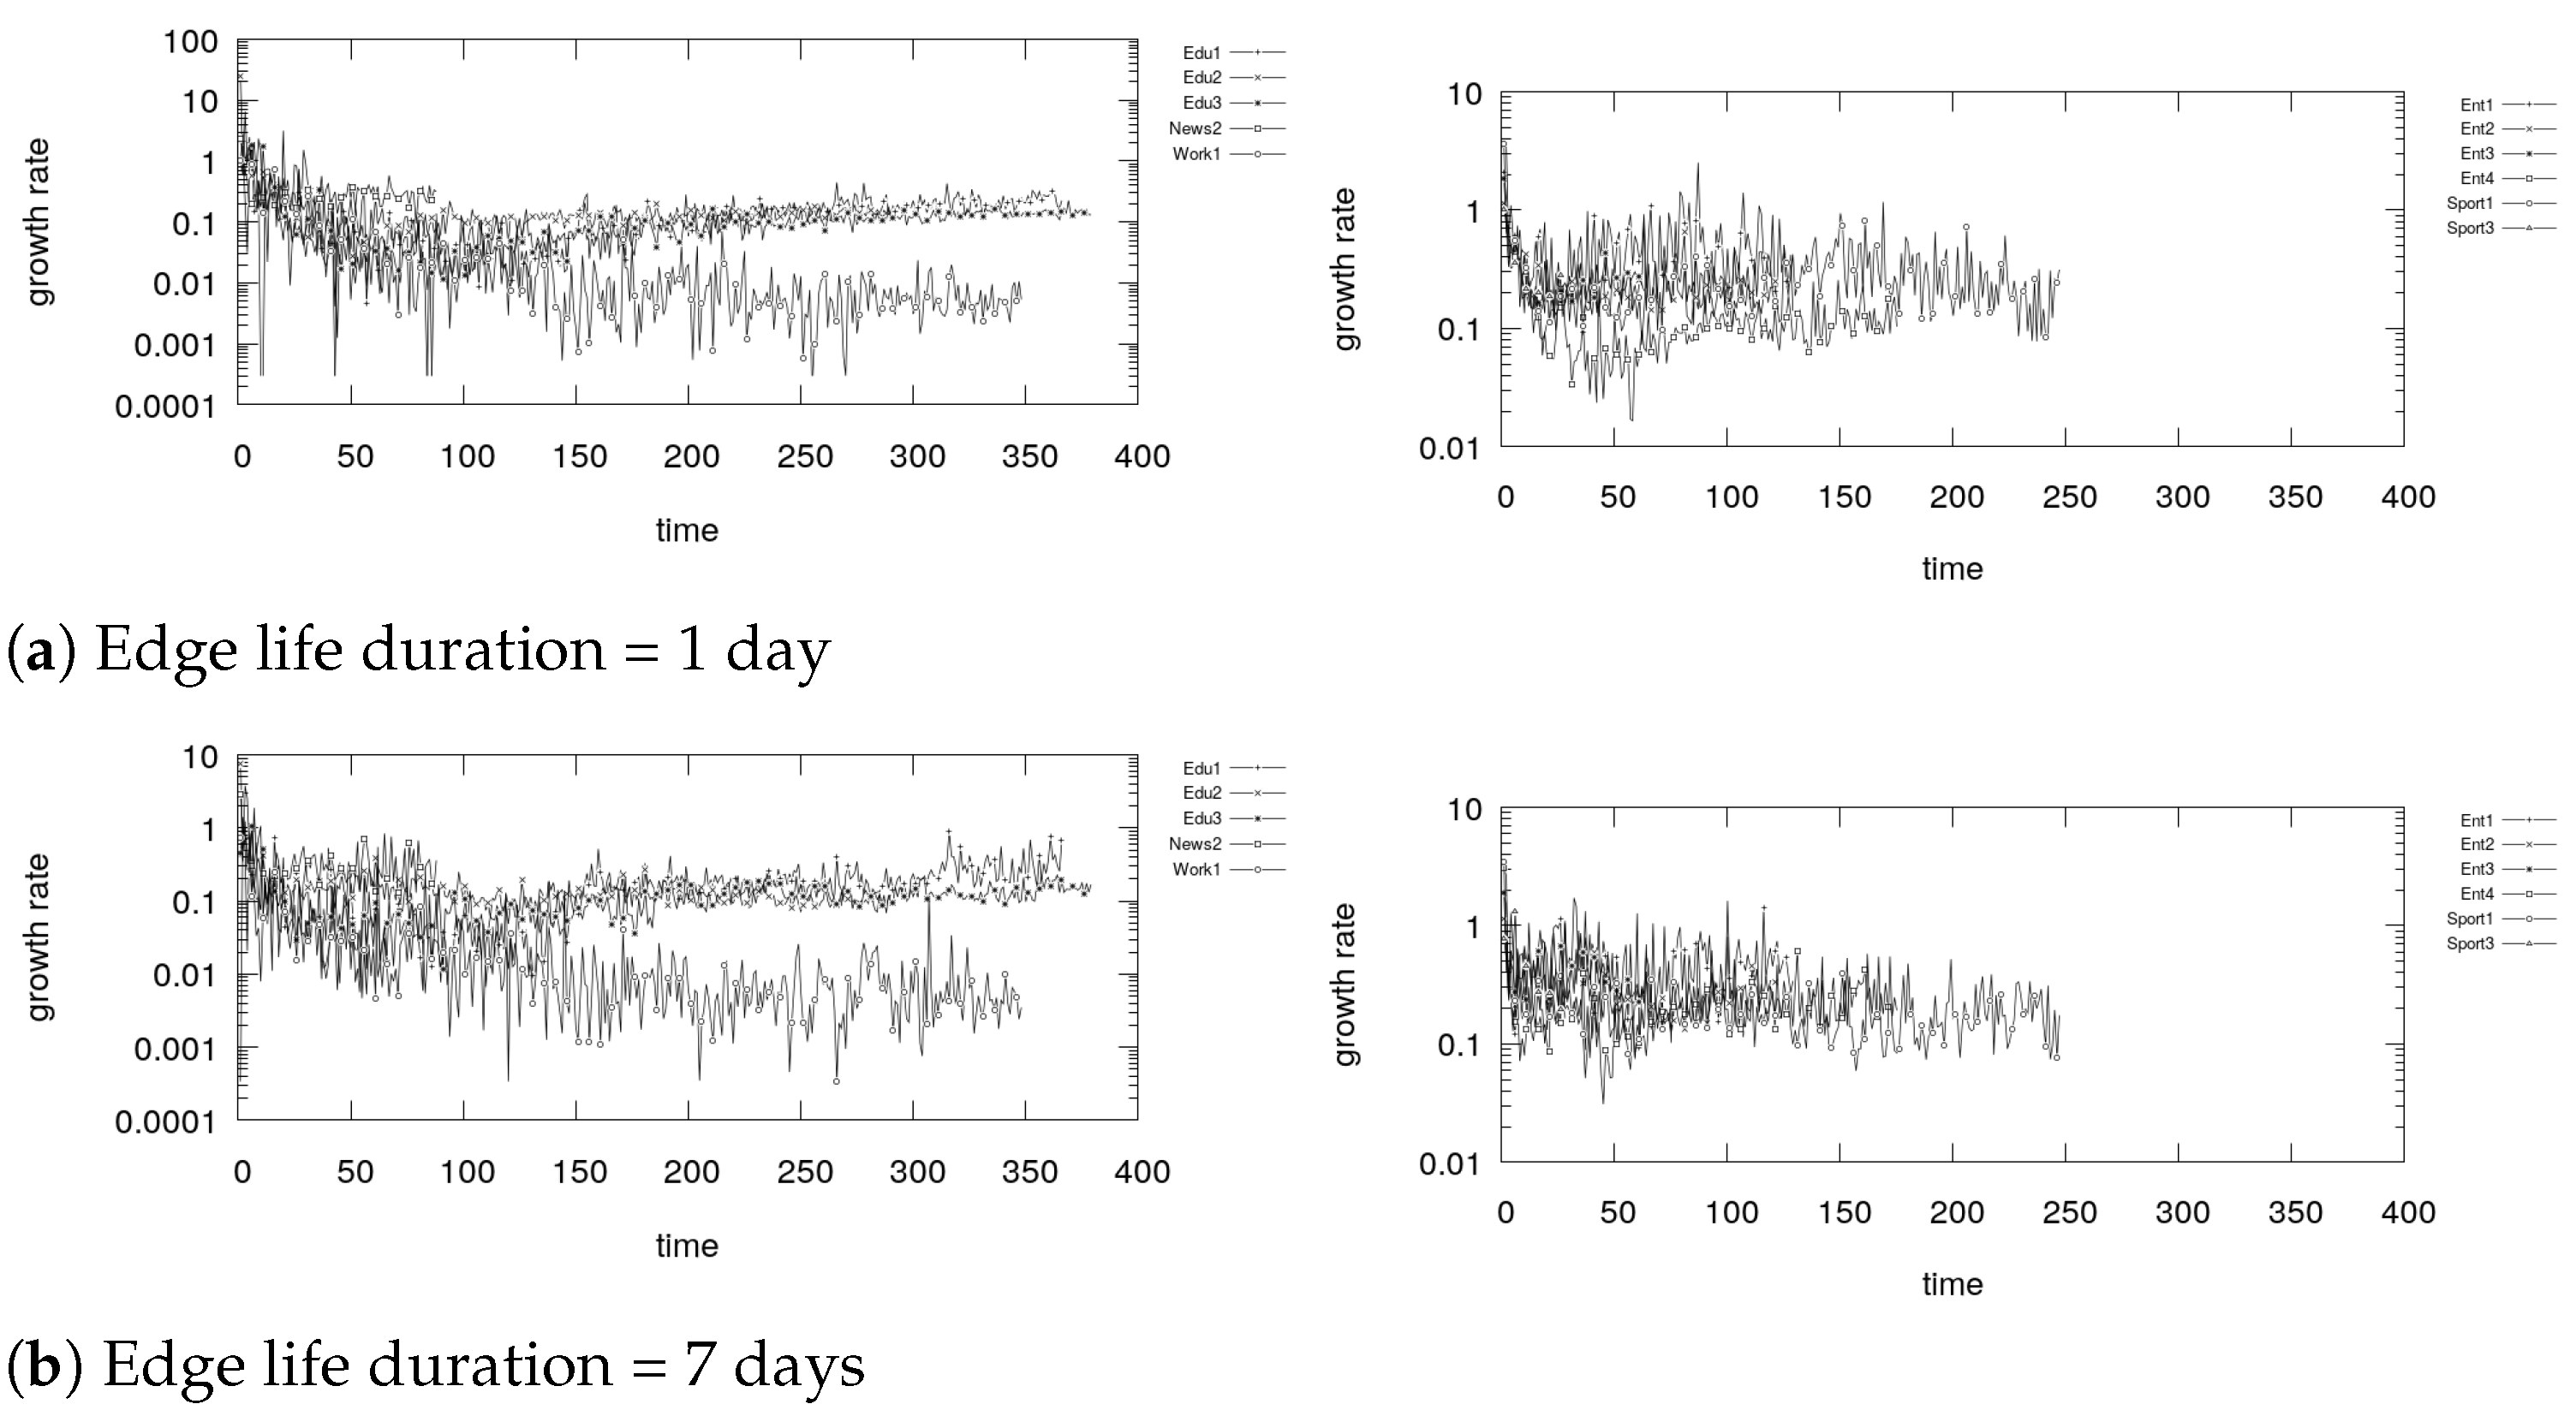
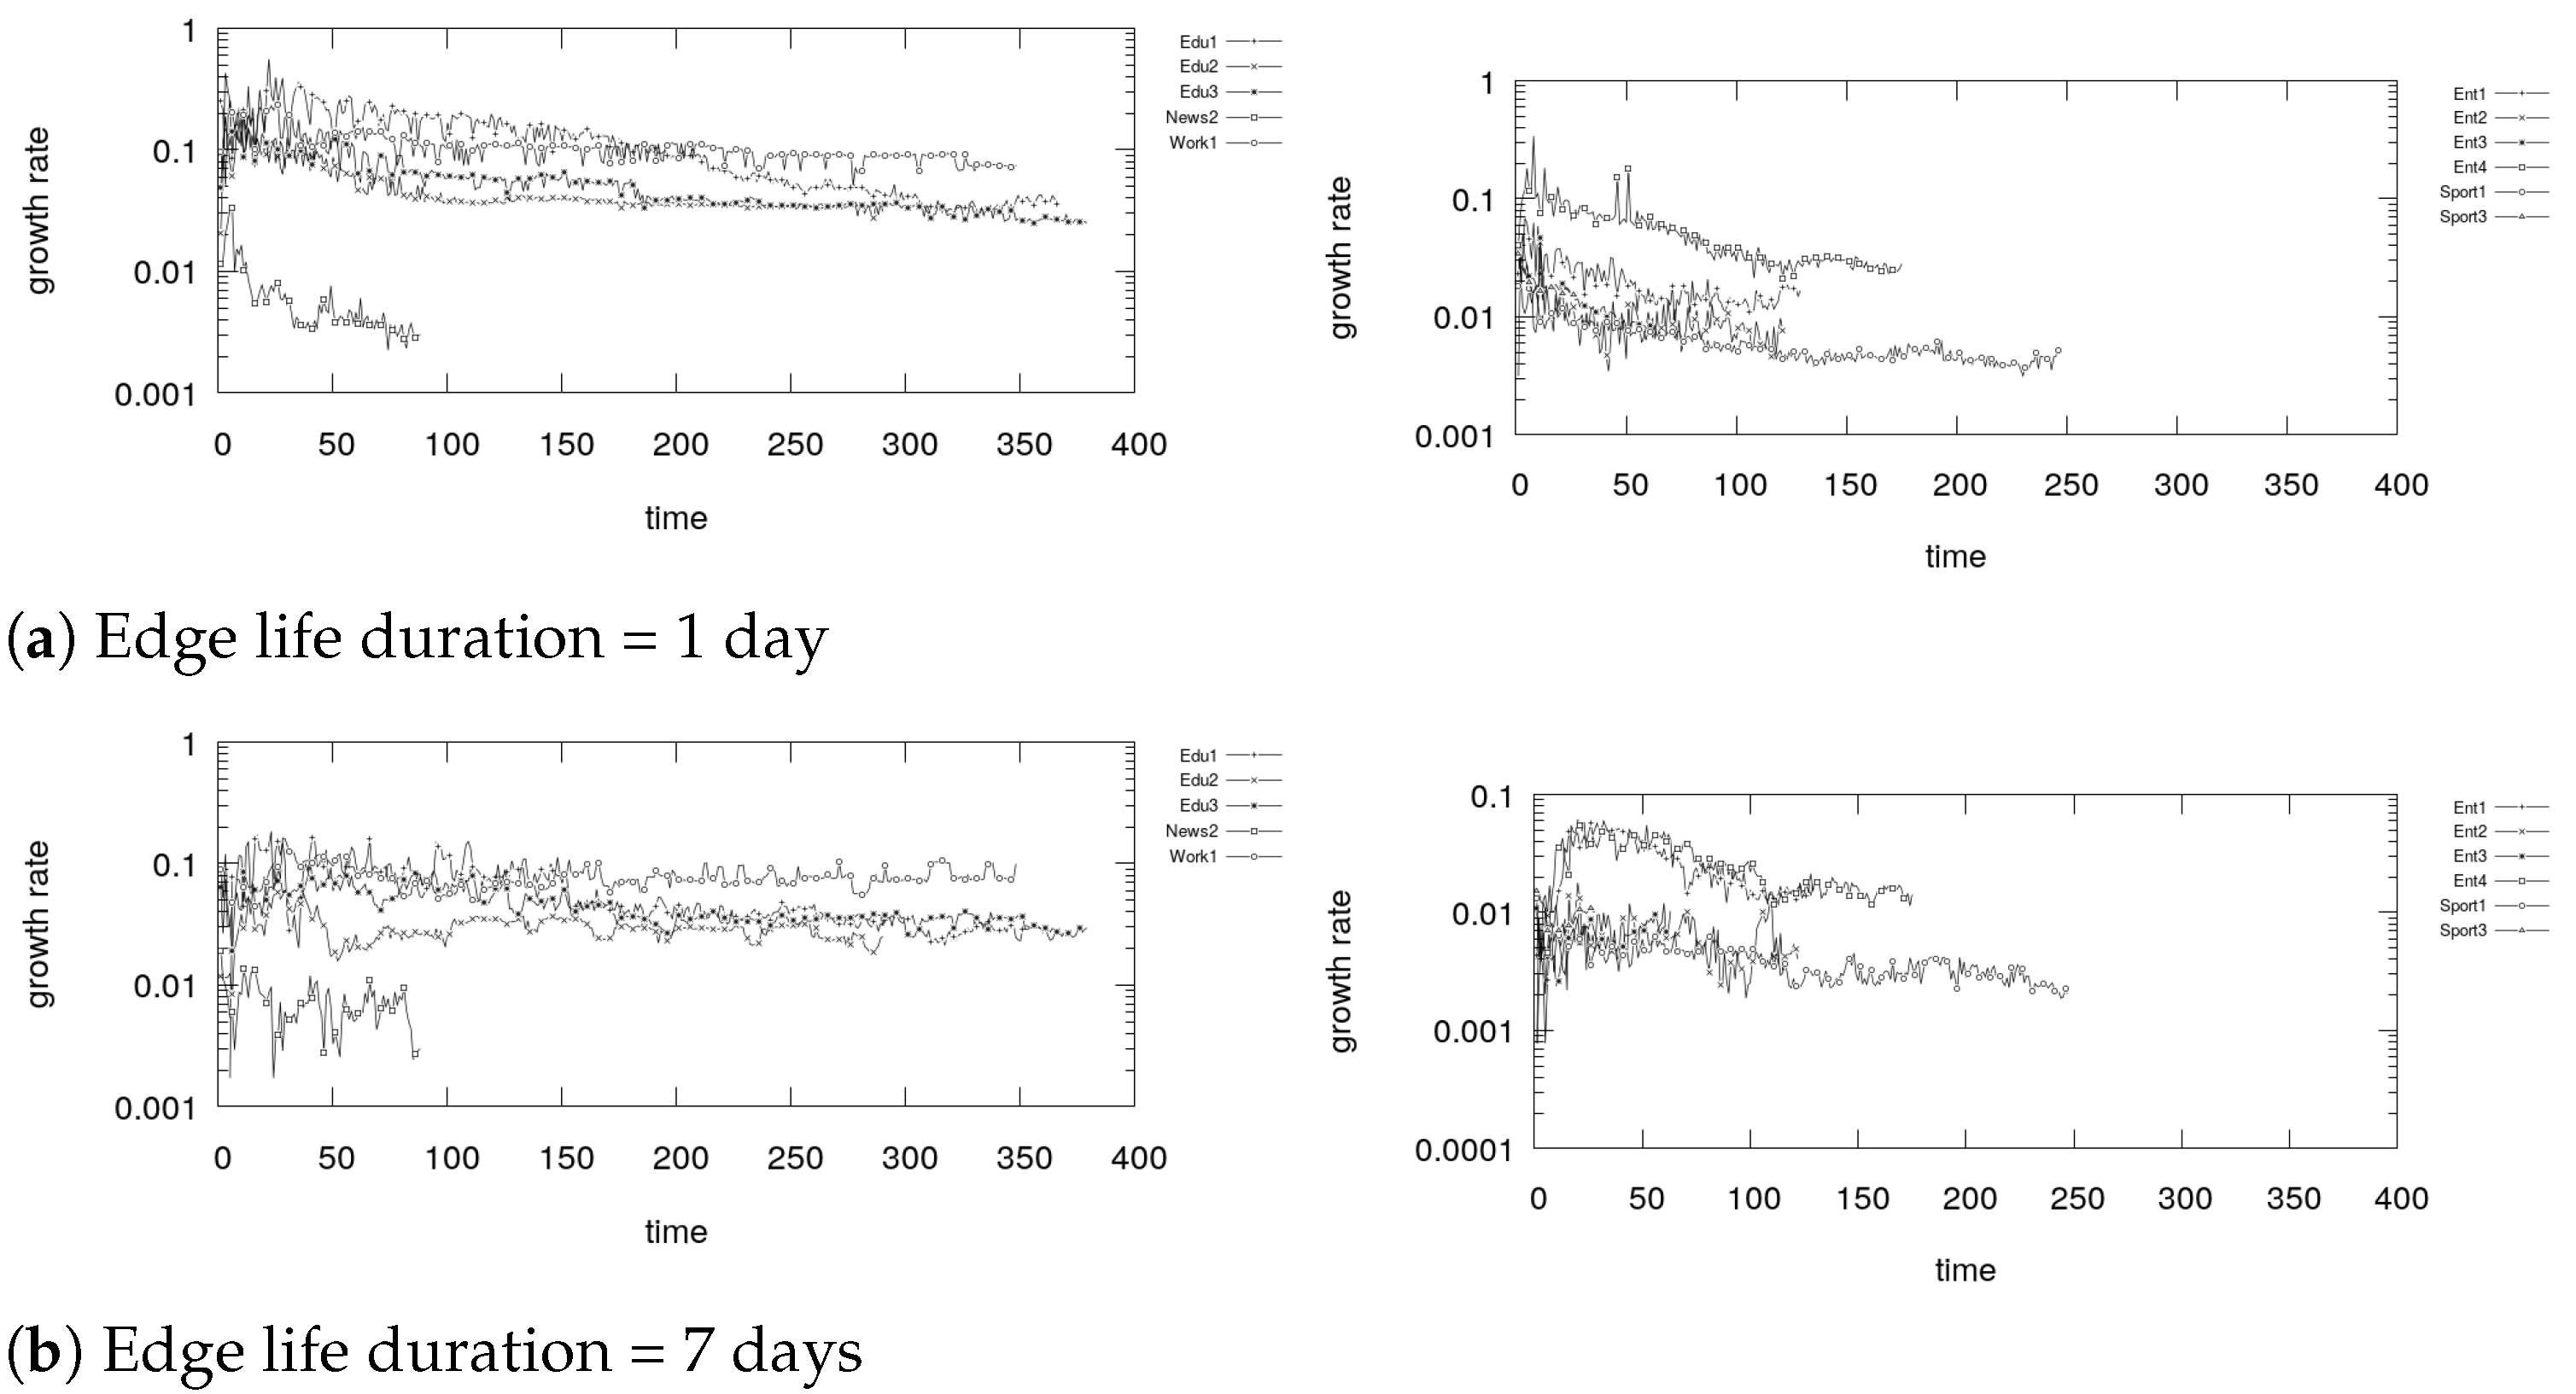
Since our study is centred on the study of the interaction community and its evolution through time, we will also study how much the community structure grows over time. To this purpose, we will study the growth rate, introduced in [6], which is defined as:
where is the ith community at the jth observation and is the set of active nodes of the community C at the jth observation. The growth rate measures how much a community has grown in size only considering newly activated nodes. This measure does not consider nodes that were already active in the previous view to avoid the possibility of having very high or low values coming from large community join or split events. Through this feature, we aim to capture, in a dynamic fashion, whether the community structure grows, at which rate or if it remains roughly the same.
Lastly, we evaluate the community quality structure through three widely used features: modularity, conductance and internal density. Modularity of a community structure evaluates how much the structure is modular, or, in other words, how much the communities are internally densely connected, but are well separated to each other. The conductance of a community evaluates how well the community is separated from the rest of the graph. We aggregate by taking the maximum value for each observation, so that the structure is evaluated by the worst case boundary. The internal density of a community evaluates how much a community is dense in terms of edges, thus how much the community is well knit. We aggregate the values by taking the minimum value for each observation, so that the structure is evaluated by the worst case boundary.
6. Dataset
We used a dataset presented in [42], which is made of the activity of 17 Facebook Groups gathered by an HTTP-crawler based on Selenium (Available online: https://www.seleniumhq.org/ (accessed on 31 January 2021)), a browser automation library. The activity gathered is in terms of posts published by the users of the groups, comments to such posts together with a reference to the original post, and comments to other comments again with a reference to the original comment. The crawler was able to retrieve all the interactions for a large portion of the groups available in the dataset, while for the others we have only partial information due to the high activity of users per day. Indeed, due to the excessive number of interactions performed on some groups (such as the group Sport3, which has about 226 posts per day), and due to the way of Facebook to organize the pages of groups, the browser page managed by our crawler was not able to retrieve all the history of the groups. This effect is also caused by massively targeted marketing campaigns where some members publish posts to promote services or products. A recap of the information gathered can be found in Table 1.
The Table shows the groups’ category (Category), the number of consecutive days on which our crawler collected the interactions (Days), the number of groups’ users (Users), the date of both the first (min Date) and the last post (max Date) retrieved by our crawler, and the total number of posts retrieved from the group in the monitored period (Posts). As we can see, the groups are quite heterogeneous, in fact they cover five different topics (Education, Sport, Work, Entertainment and News). We covered crawl lengths ranging from a few tens of days in Sport3 to almost one year and a half in Work4. The number of users ranges from a few thousands in Sport2 to more than 100,000 in Sport3 and the number of posts is between 155 in News1 and 6353 in Sport3.
7. Communities in the d-UITG
In this Section, we present the study we conduct regarding the interaction communities in OSGs. Starting from the interactions gathered by the HTTP-crawler, a UITG was built such that if a user A writes a comment at time t to a post owned by user B, the edge will be present in the graph. Analogous to this case, when a user A writes a comment to another comment posted by user B at time , the edge will be present in the graph. As output, we obtained a list of interactions, sorted by ascending timestamp.
To apply an Instant Optimal approach, we proceed in the following way. Fixing an edge life duration d, we produce a d-UITG once every 24 h, and then, for each d-UITG, we consider it as a static graph . Each represents the state of the interaction network of the ith day, and contains the edges that were created up to d seconds earlier. From the perspective of the OSG, each contains the recent interactions among users each day, where an interaction is considered recent if it happened within the last d seconds. Finally, we apply the algorithms presented in Section 4 to each we produced to get the communities.
As for the Temporal Trade-Off approach, TILES can be applied to the UITG without explicitly extracting the d-UITG, because the algorithm is already capable of managing the dynamics of the edges. In particular, to be able to model the disappearing of edges, we decided to apply TILES with the implicit edge removal, such that each edge has the same relevance, and a community structure would emerge around groups of users interacting frequently. To be consistent with the experiments carried out using the Instant Optimal approach, the ttl of the edges is set to be equal to the edge life duration d that we decided to set for the extraction of the d-UITG, for each of the experiments. Independently of the ttl we set for the edges, we once again decide to inspect the community structure once each 24 h.
Since the edge life duration d is a parameter of our experiments, we decided to produce two sets of experiments, to be able to capture possibly different behaviours based on its length. In the first experiment performed, we set s (1 day) as the edge life duration to capture small sets of users interacting with each other at least once per day. In the second experiment, we set the longest edge life duration, s, 7 days, to identify interaction communities happening around possibly recurring or weekly events, such as sport events, periodic occurrences and so on.
In all the experiments, we decided to inspect the community structure once per day for three motivations:
- First of all, having a too dense observation may lead to the situation in which we are not able to detect any real evolution of the community structure in time.
- The second motivation is connected to the fact that human life, generally speaking, follows a 24 h cycle, and therefore it makes sense to align with it.
- Finally, to be able to fruitfully compare the results of all the experiments, we needed observations at the same point in time, despite the different edge life durations.
In the following sections, we present the empirical results concerning our analysis. In the plots, despite the fact that the crawling process started in different days for each group, we decided to temporally align all results. Therefore, at time we have the results of the first day of activity of each group. This will help us understand the activity of the groups and the quality of the interaction communities detected aligned to the first available information.
7.1. Dynamic Communities Analysis: Community Number
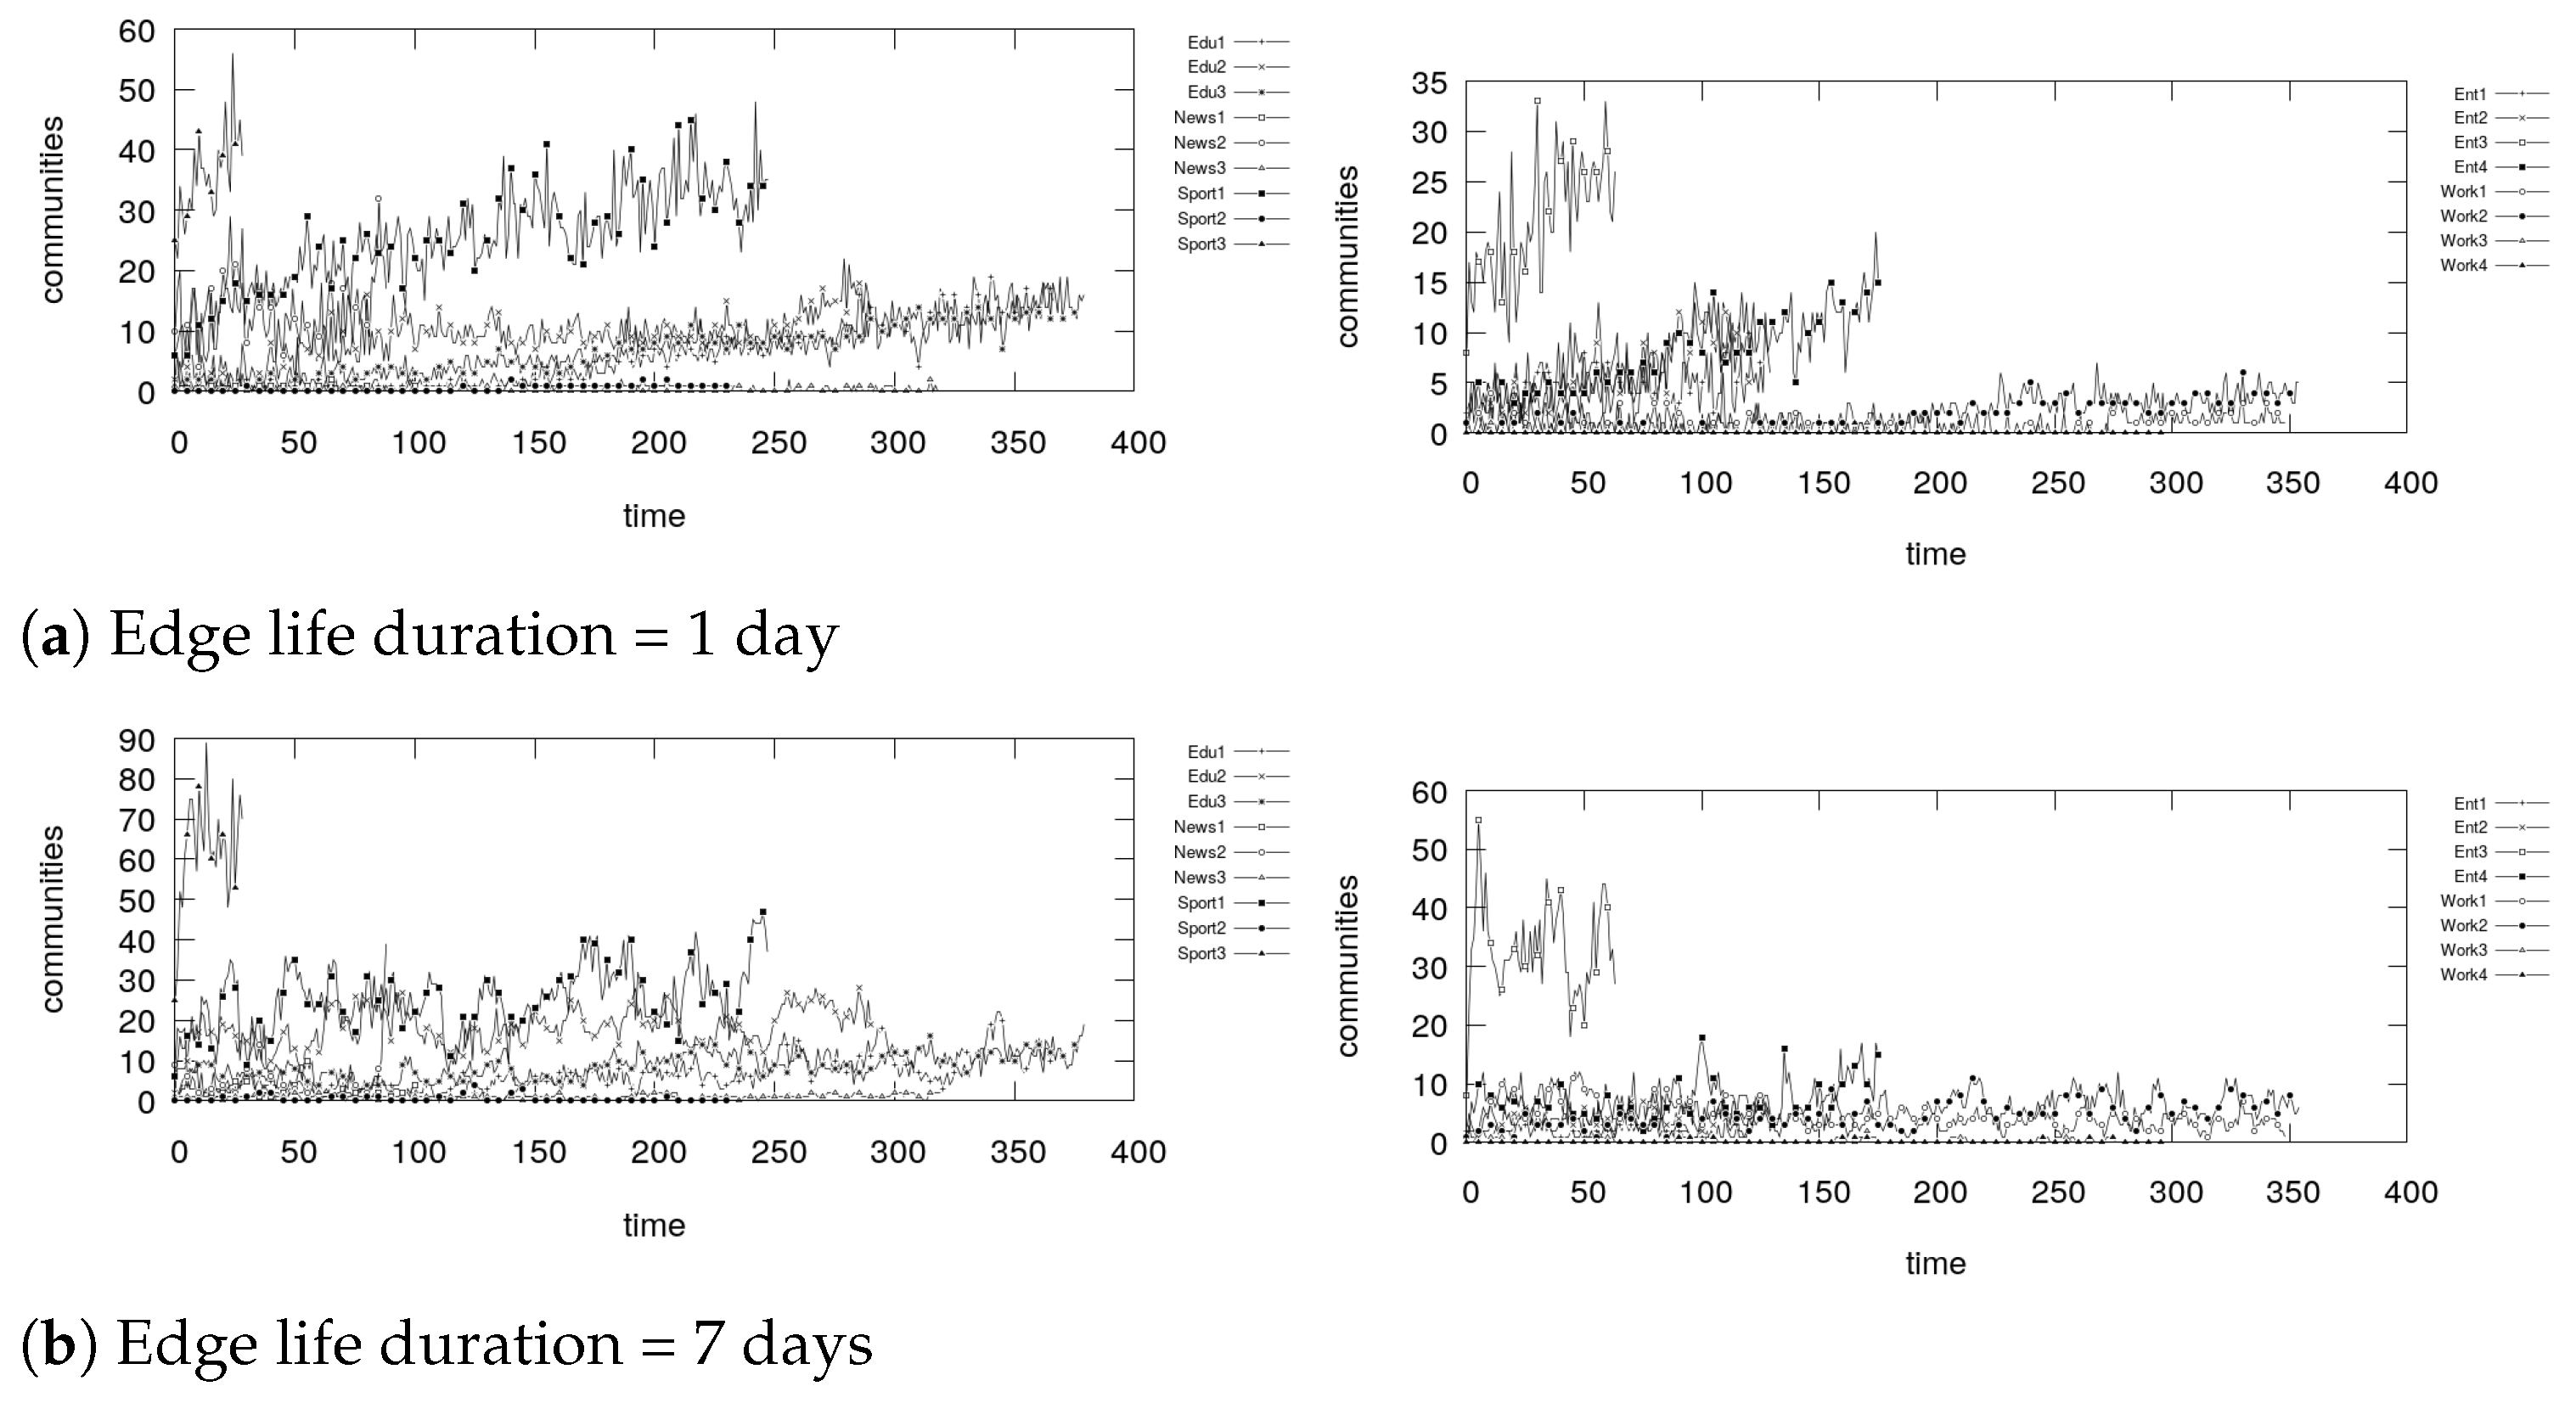
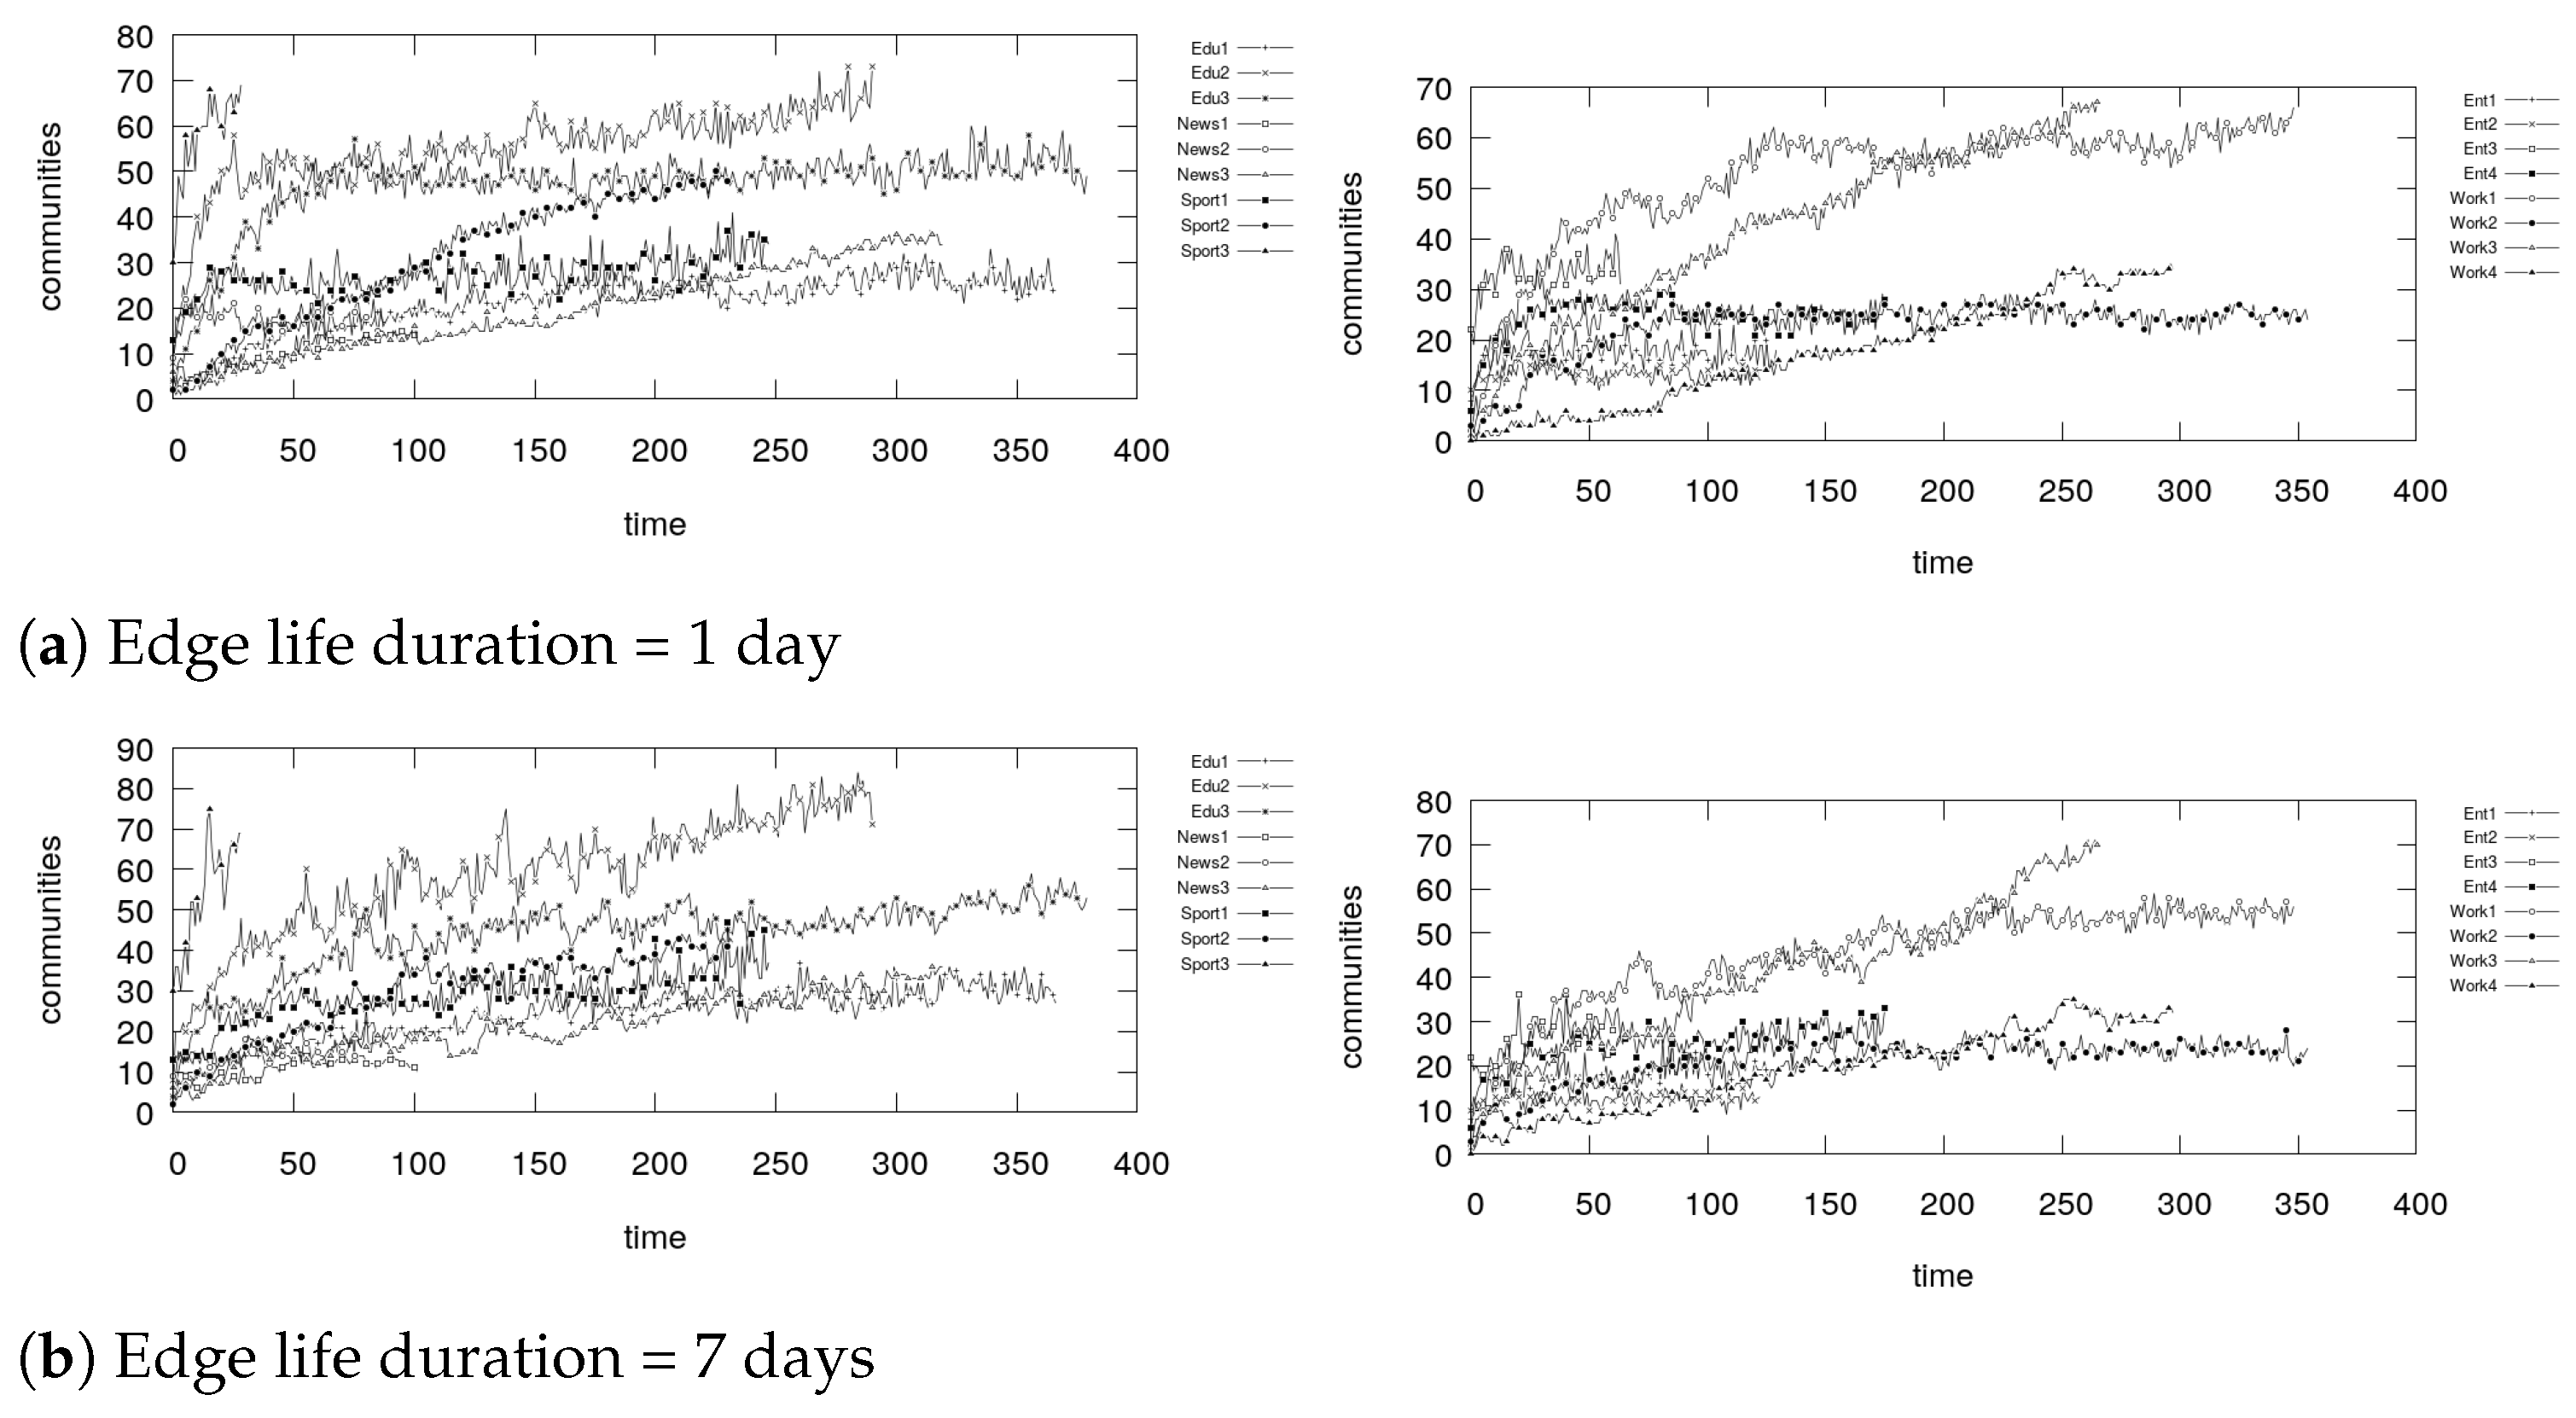
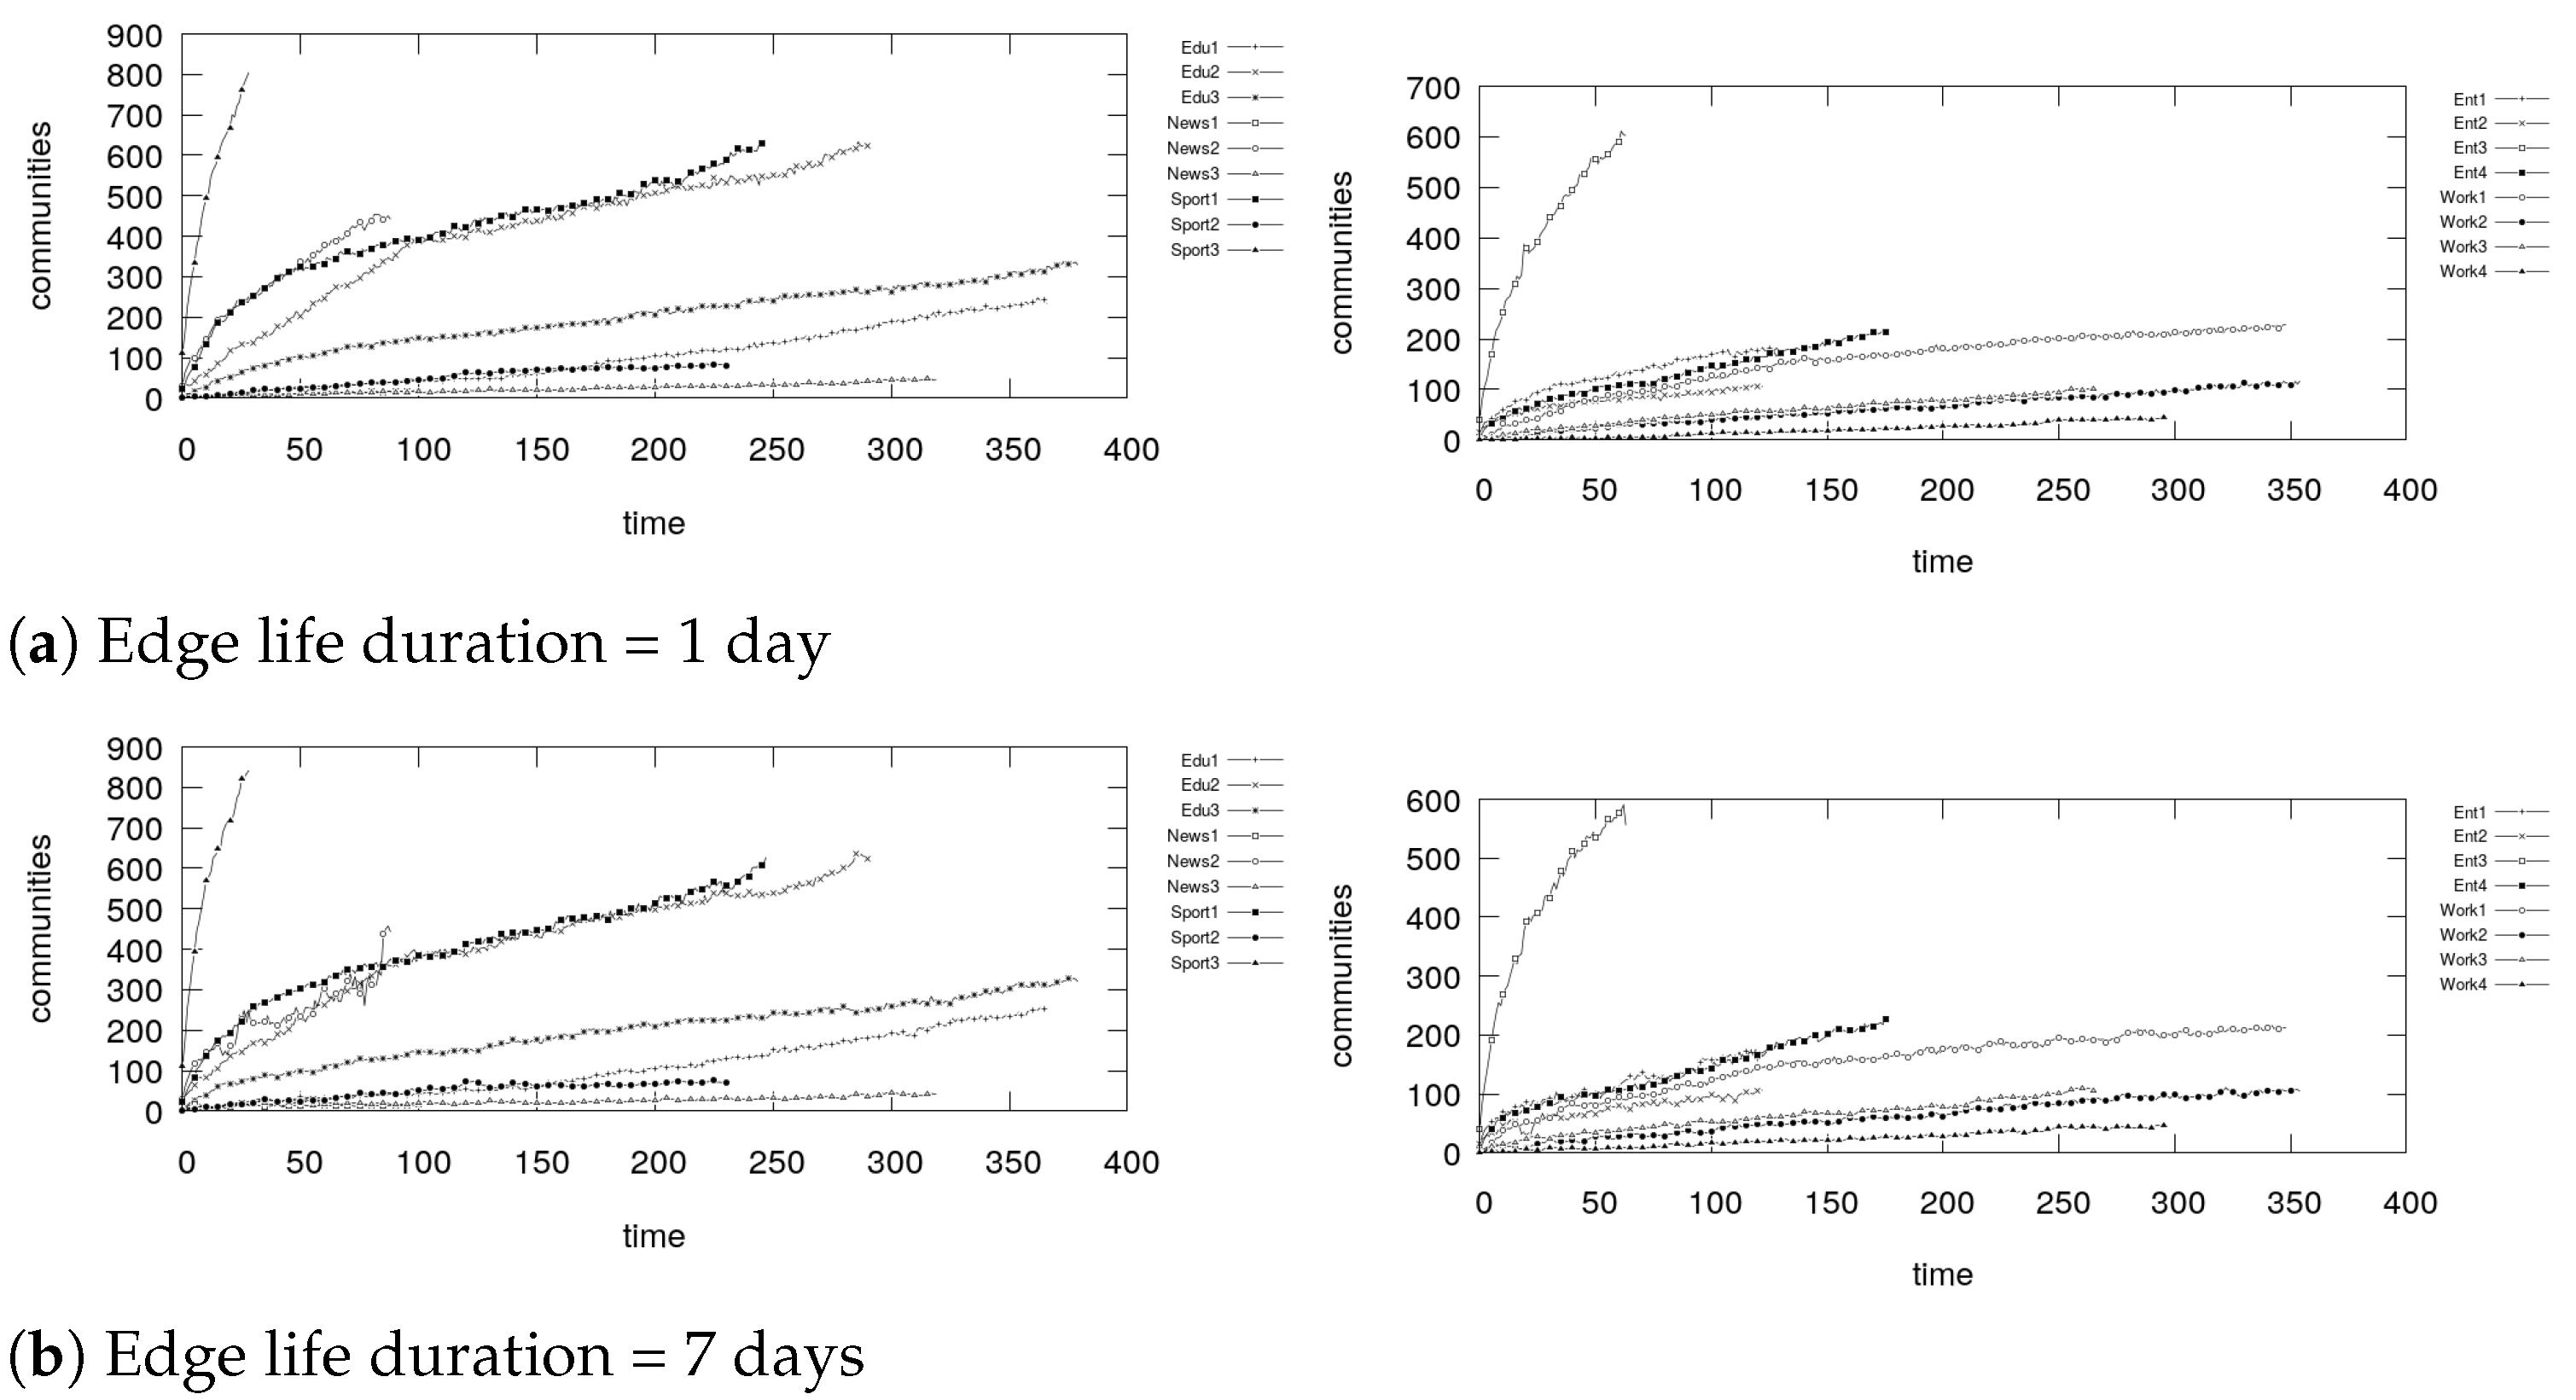
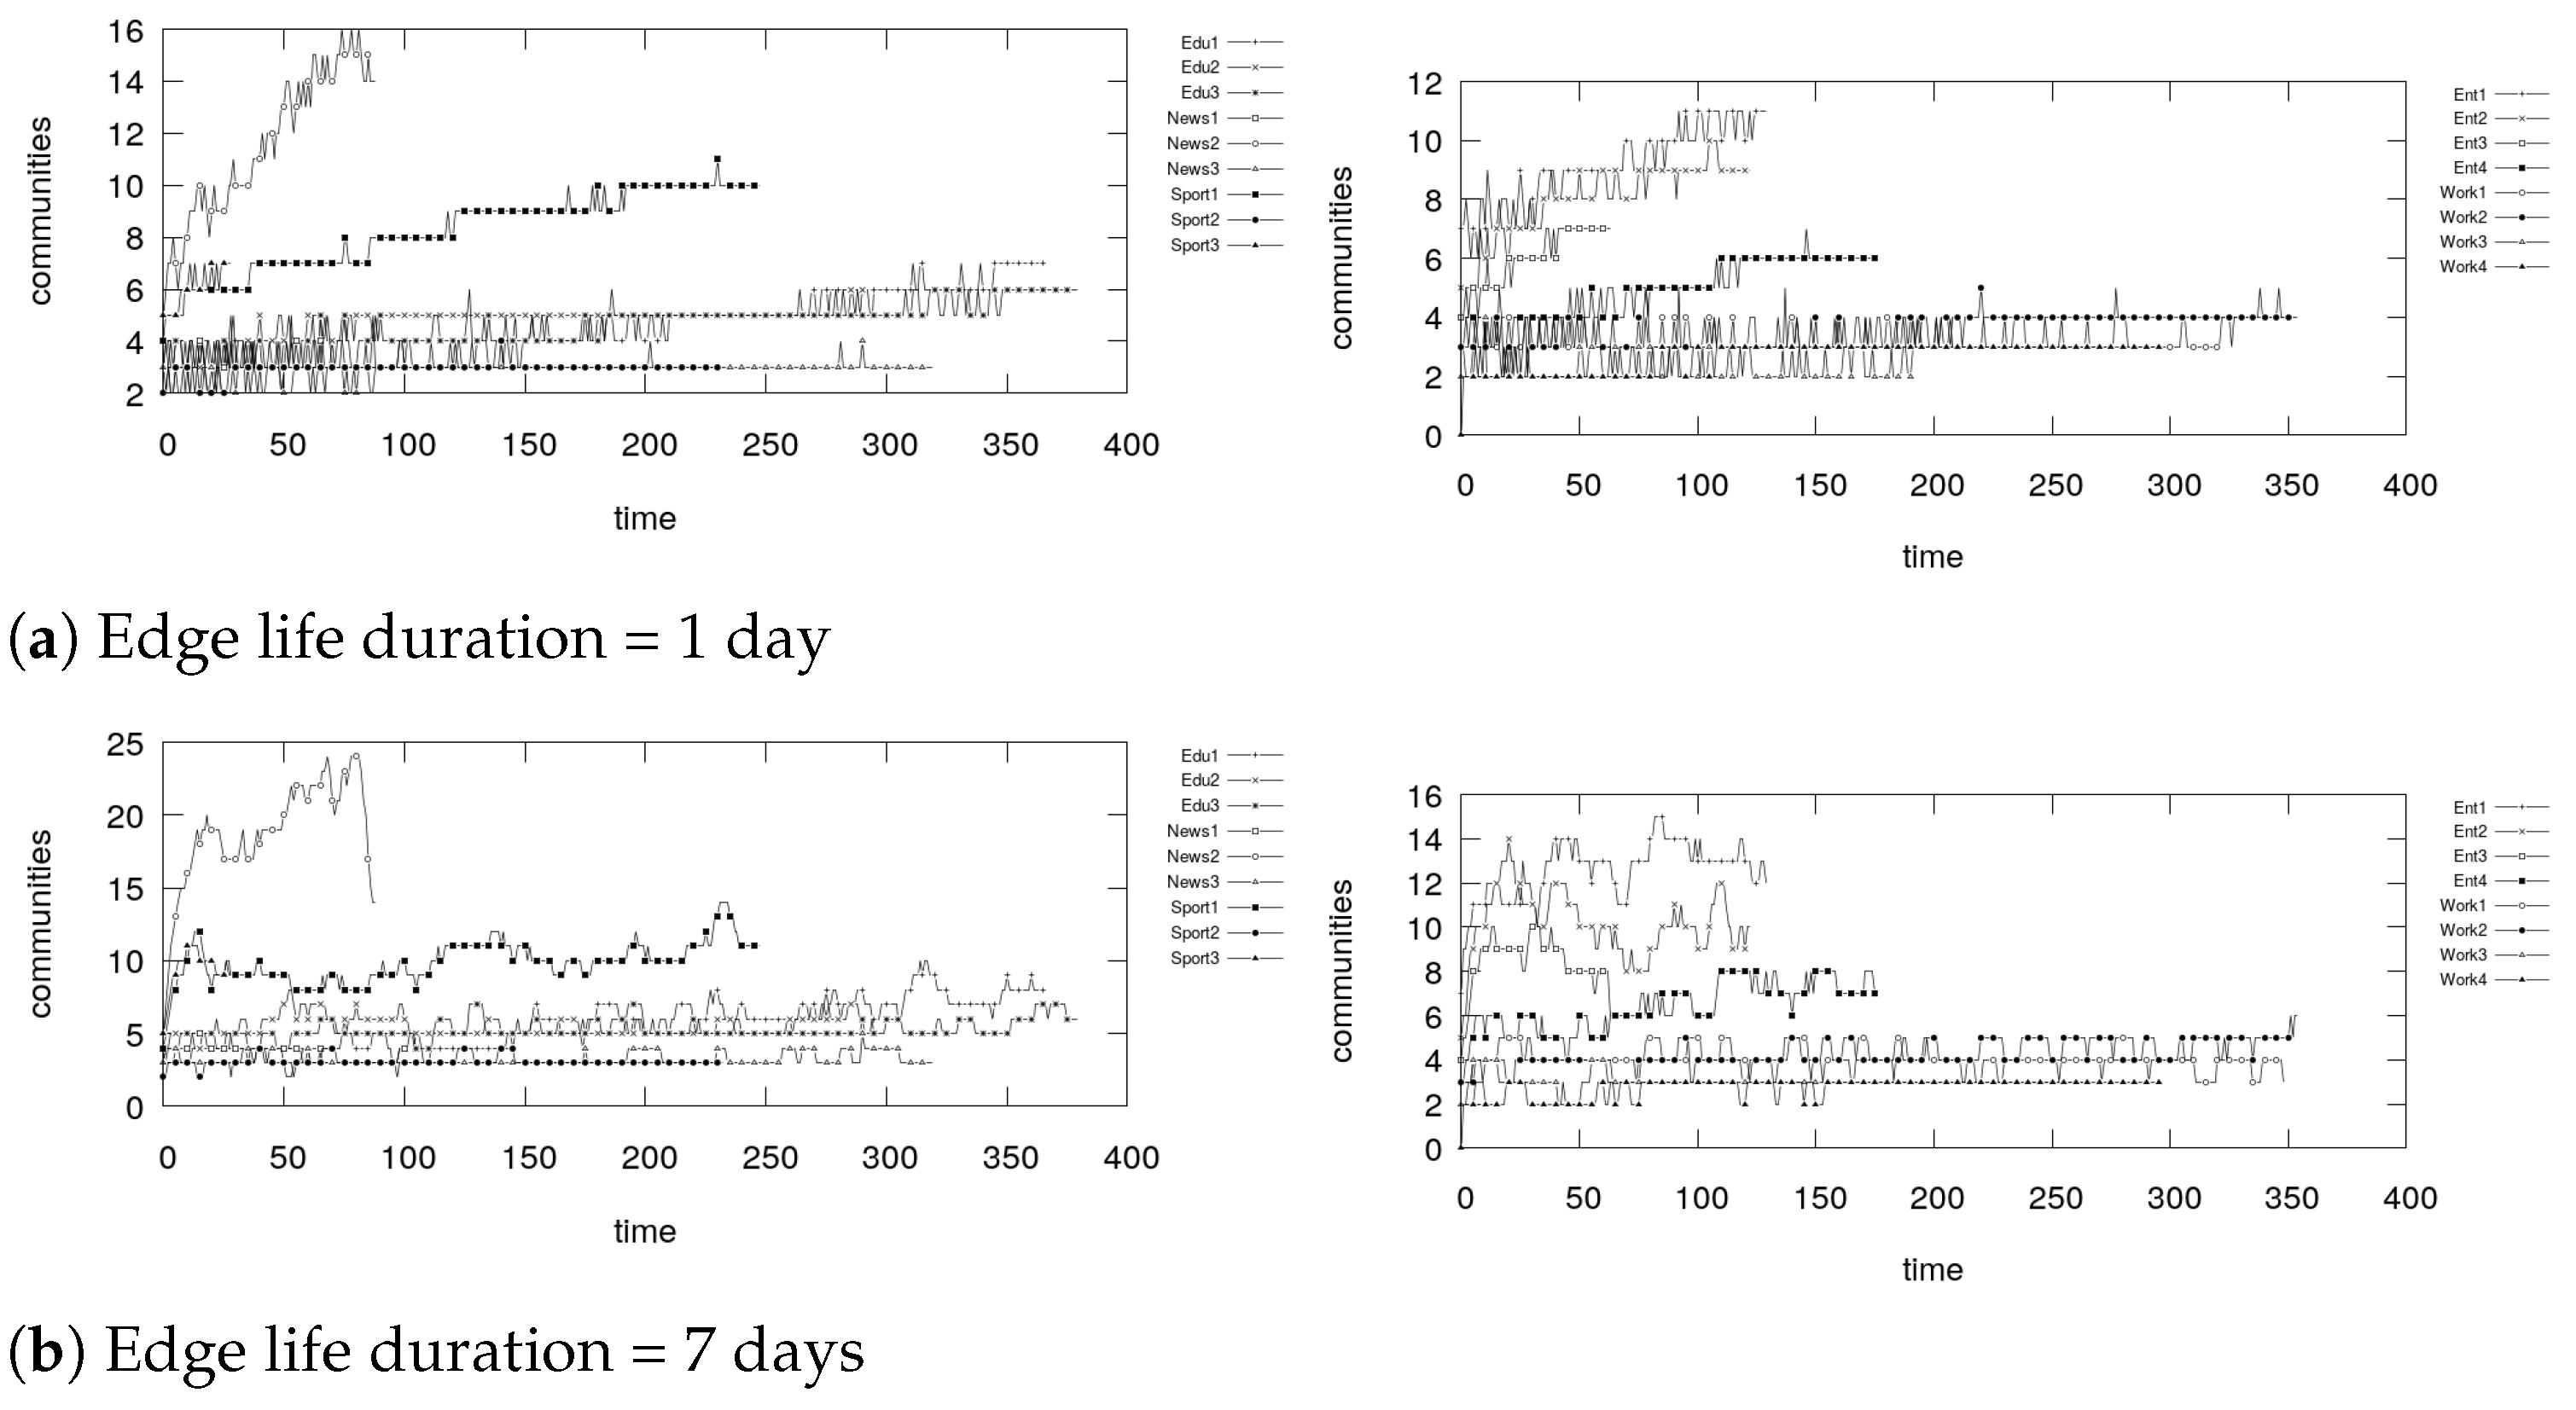
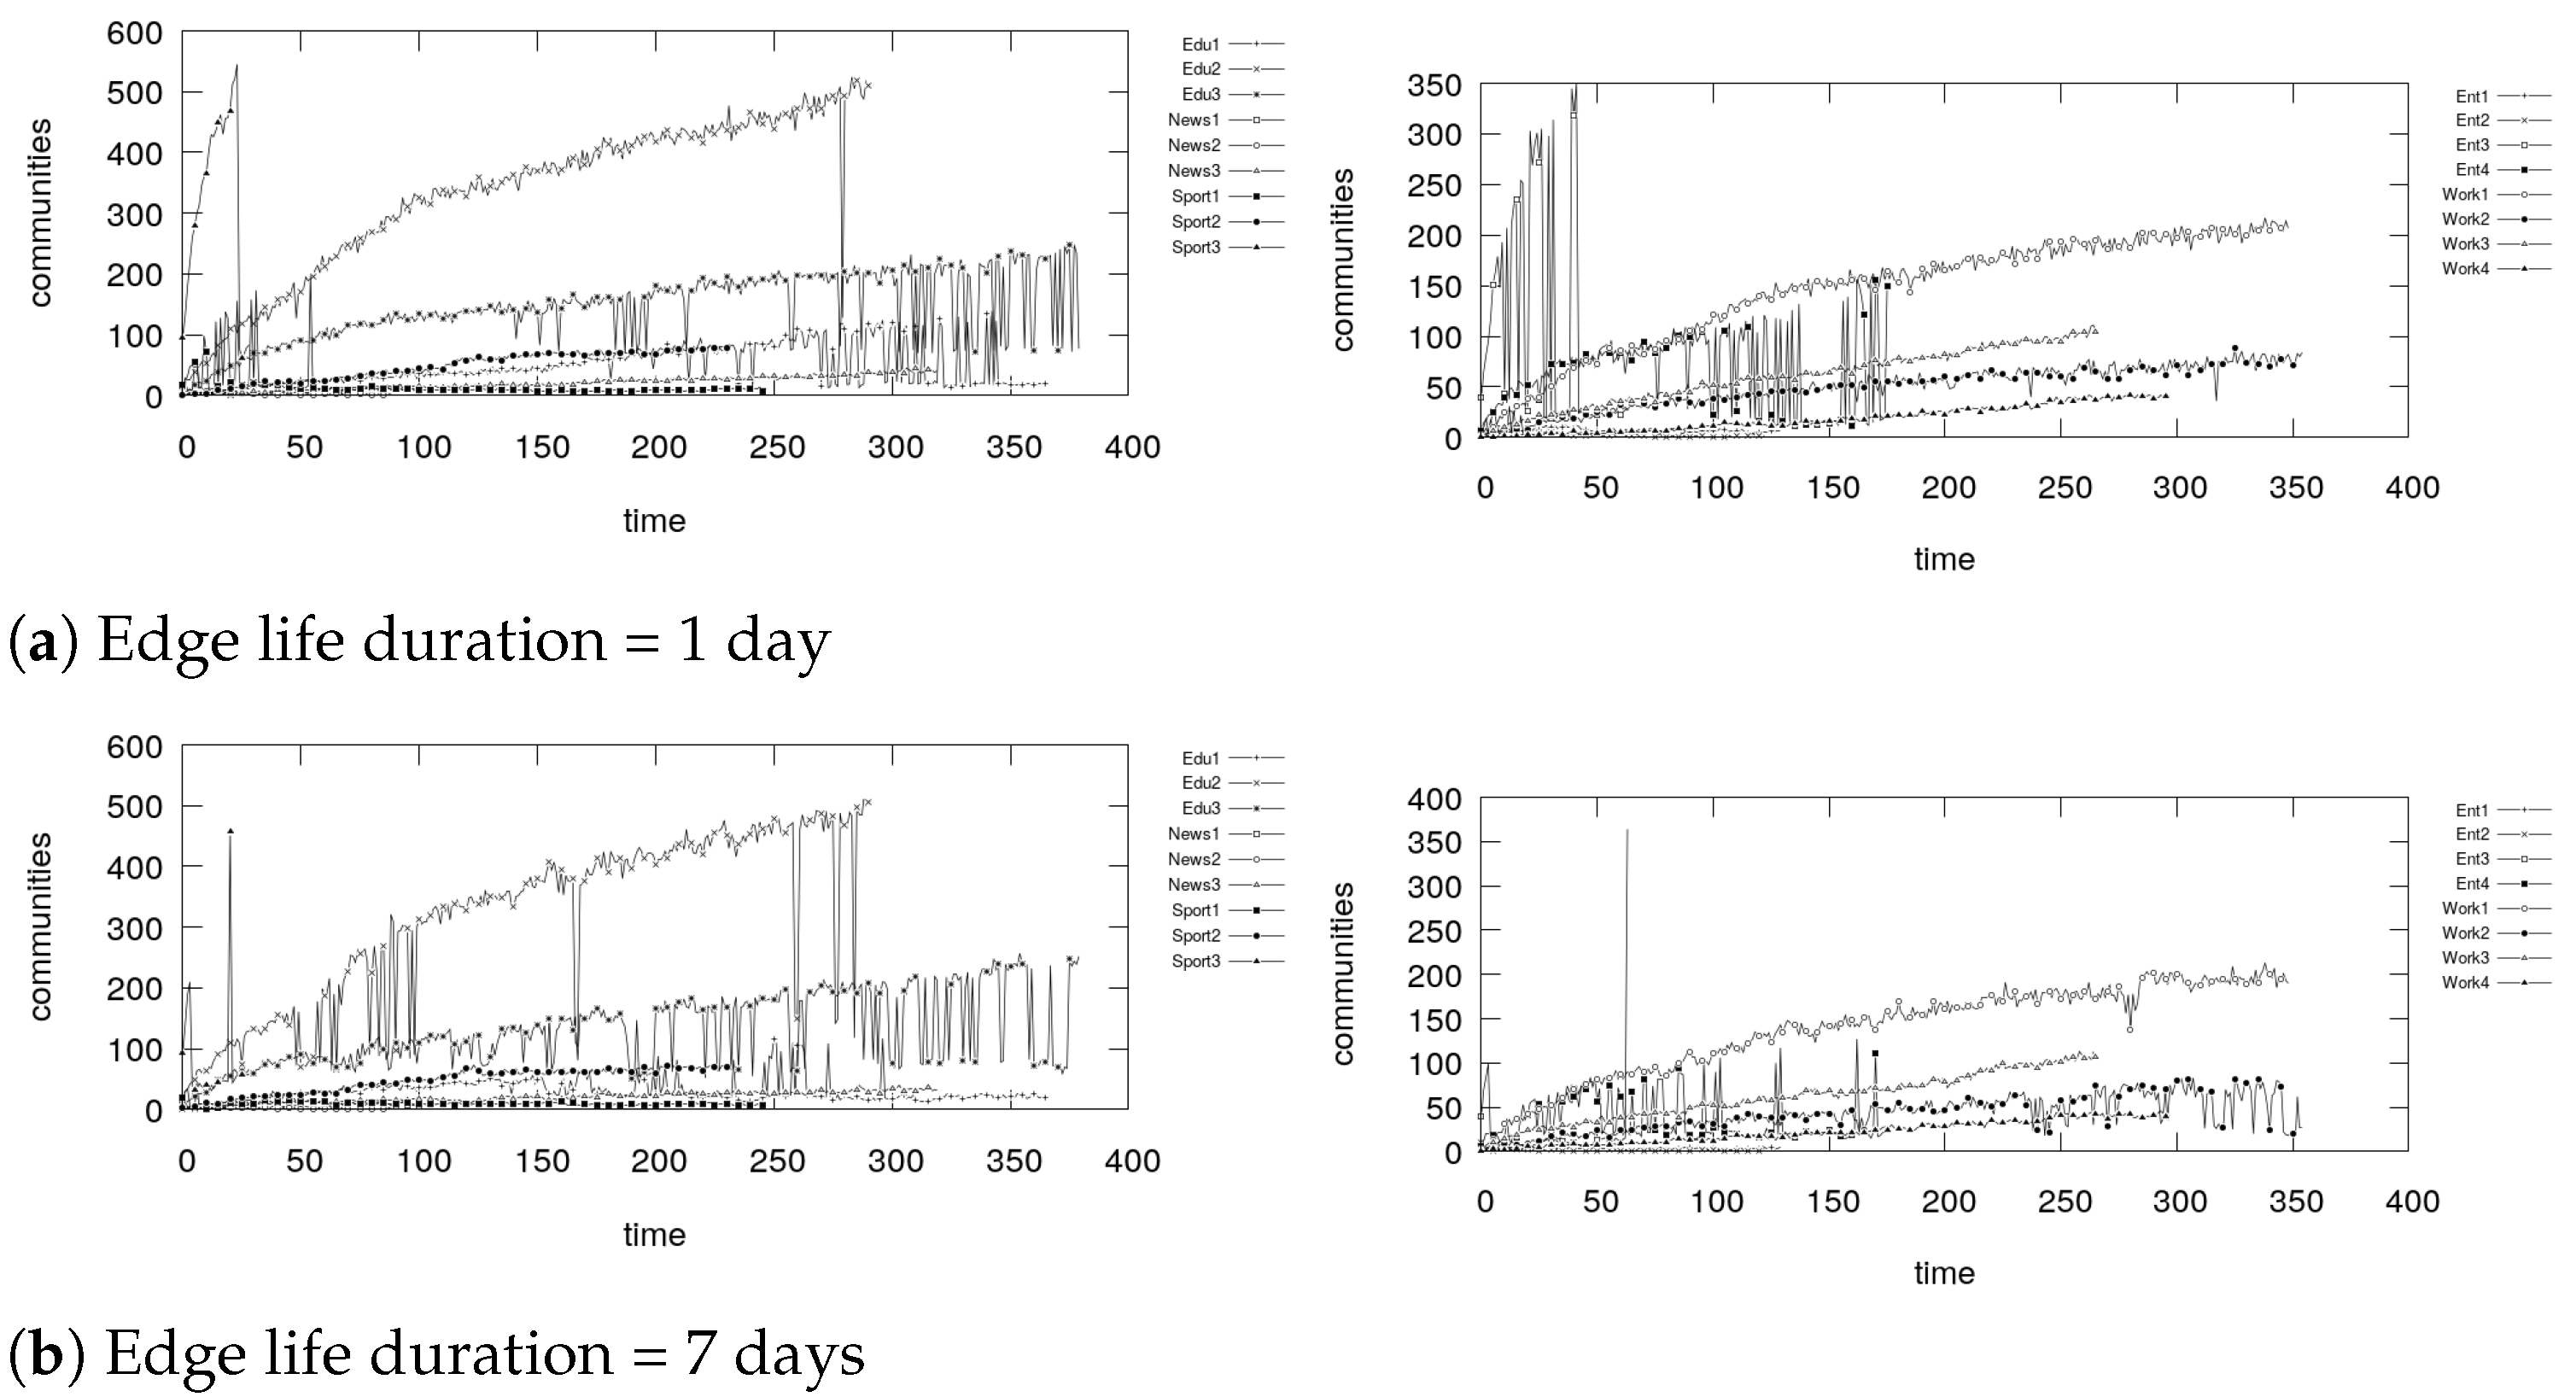
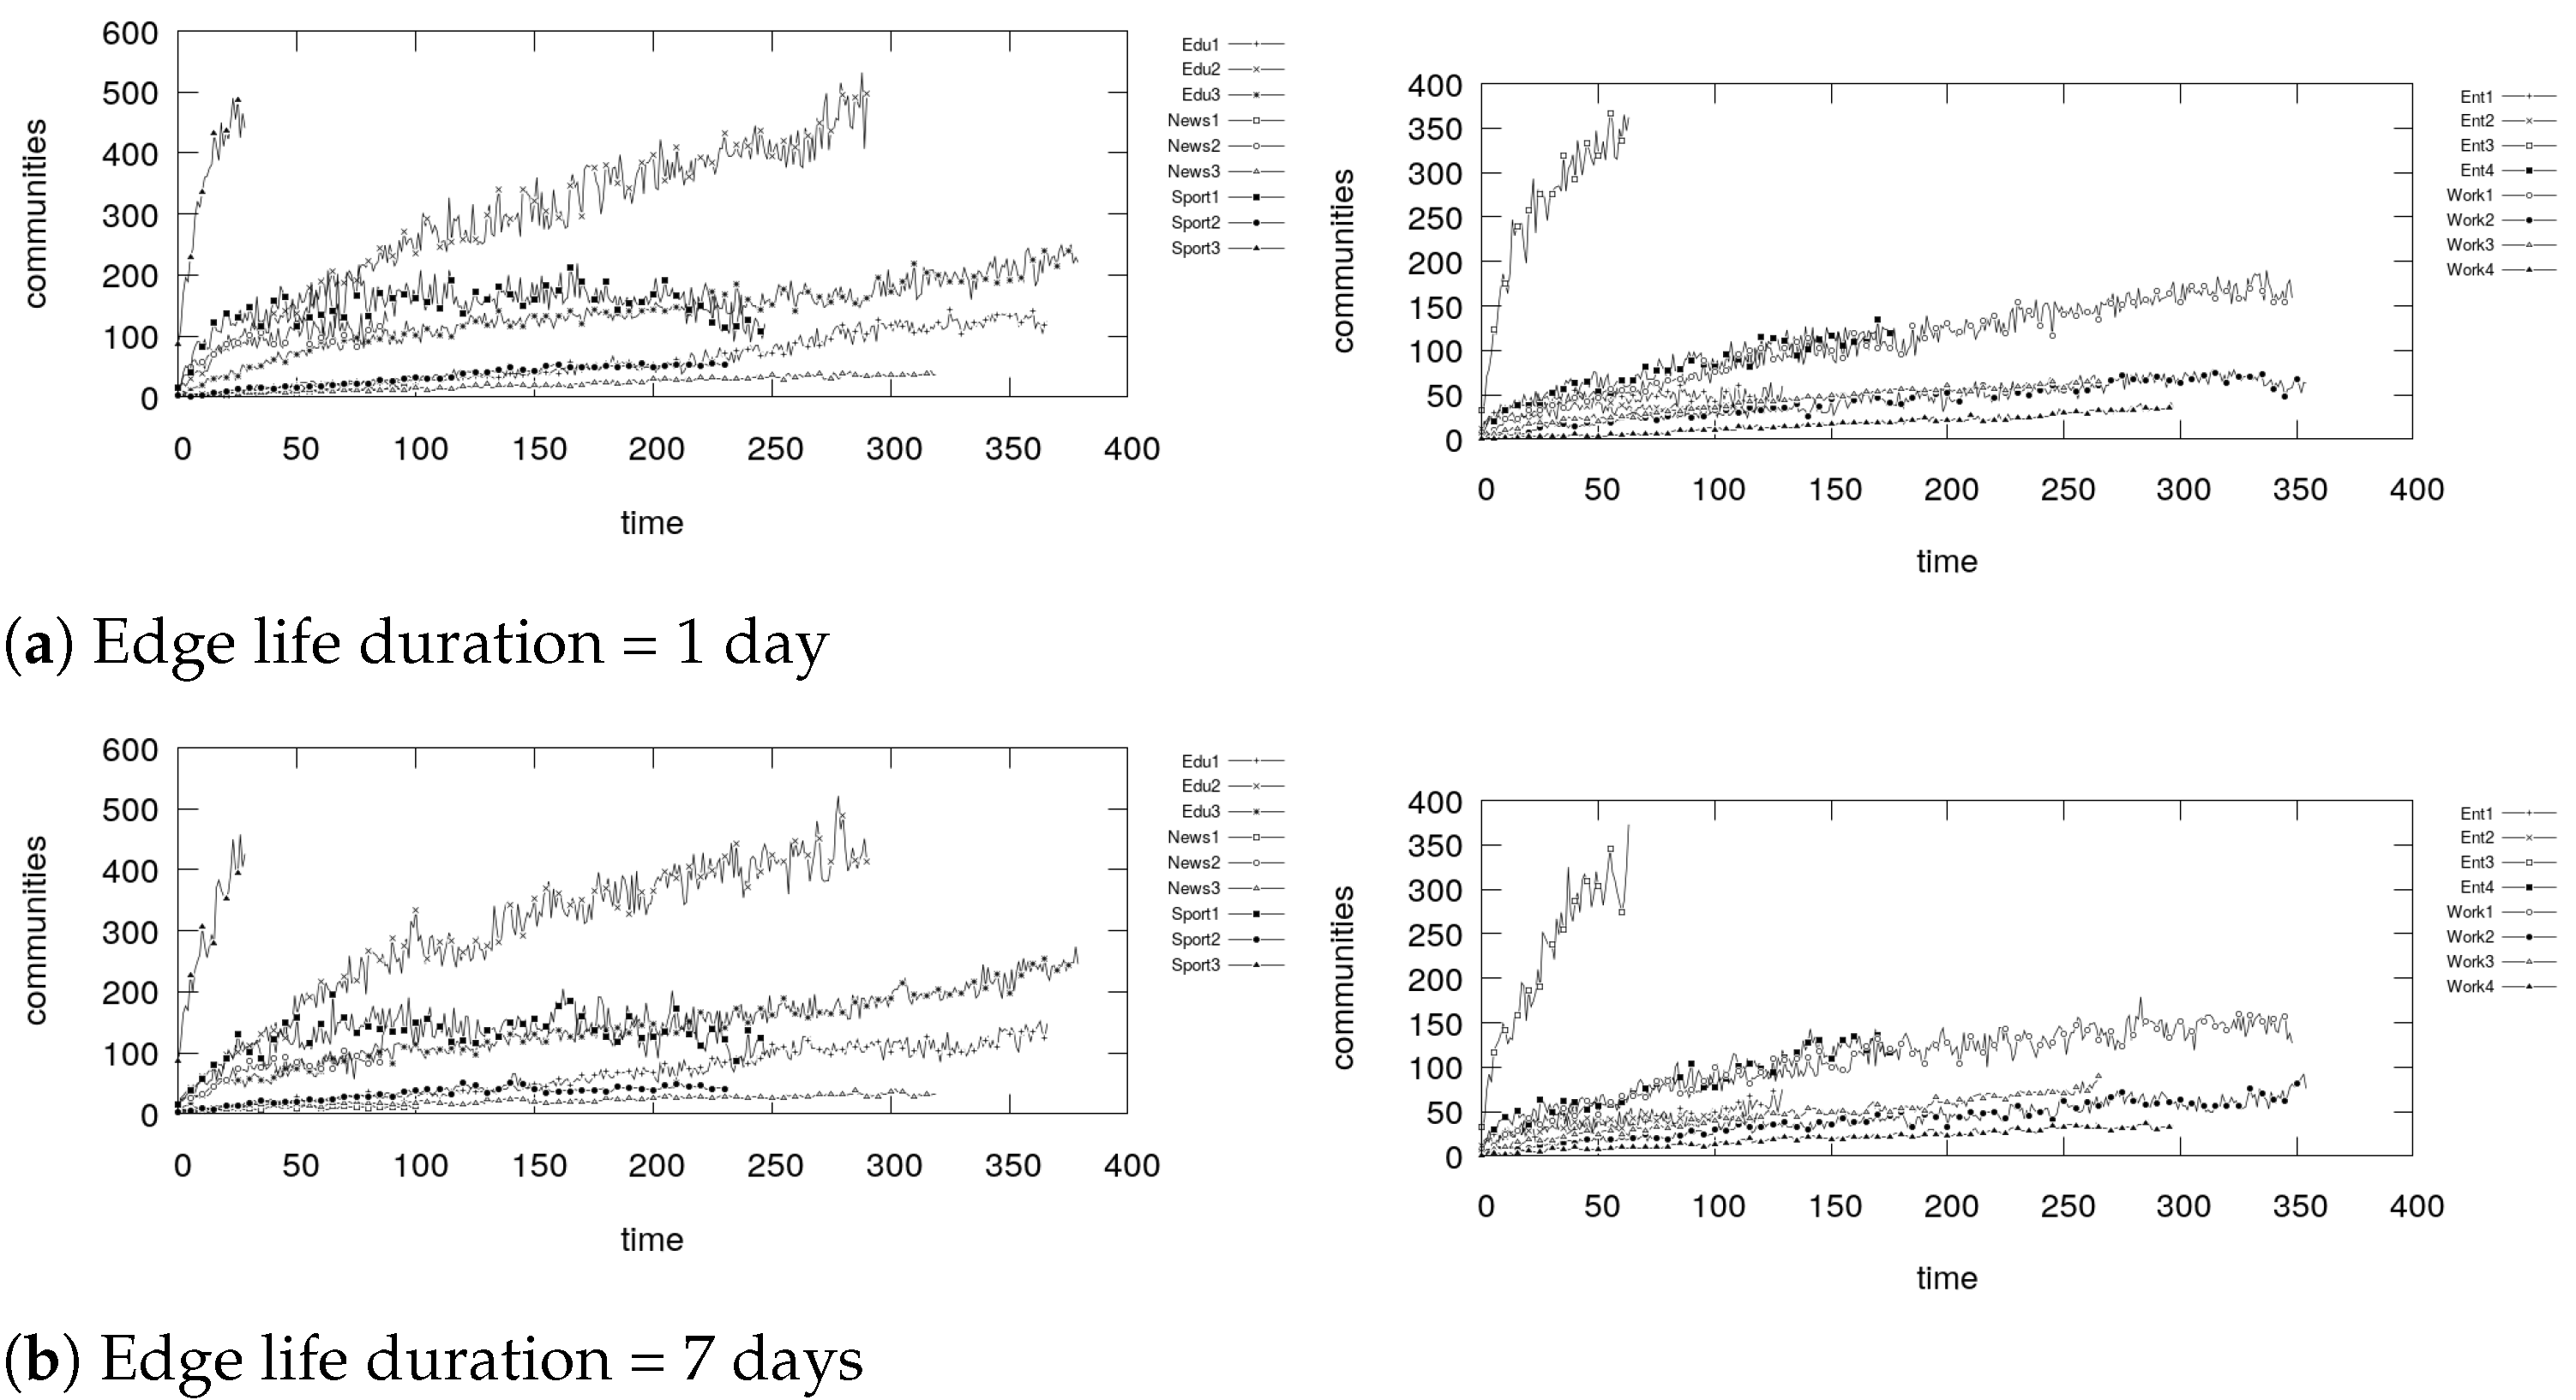
The first set of results we present concerns the number of communities detected in the d-UITG. Figure 2, Figure 3, Figure 4, Figure 5, Figure 6, Figure 7, Figure 8 and Figure 9 show the number of communities detected by the eight community detection algorithms used, for each edge life duration.
Considering the edge life duration equal to 1 day, we immediately observe that some of the groups, namely Sport2, Work3, Work4, News1 and News3, do not show a stable community structure, with a reduced number of communities or no communities at all. On the other hand, all the other groups can be categorized together as the number of communities tend to increase over time. We detect similar results by fixing the edge life duration for to 7 days. In particular, the same five groups show an irrelevant community structure, proving that the result is not bound to the community detection algorithms used. On the other hand, in the other groups, the number of communities tend to grow very steeply in the first observations, but then the growth stops suddenly and, even if there is some volatility in the number of communities over time, the number seems to stabilize within the same order of magnitude. There are, however, some exceptions. For instance, for the methods based on random walks, namely Infomap and Walktrap, the number of communities is constantly increasing over time. A similar result is obtained with label propagation, although with some noise in the result, due to the detection process. The result hints at the possibility that some algorithms are not well suited for this kind of extremely dynamic context.
Overall, we observe that the community detection tools do not converge on a single community structure, but instead we see a gradient that ranges from a small number of communities detected by K-core (see Figure 5), to several hundreds detected by Infomap (see Figure 4). In addition, Walktrap and label propagation have a higher number of communities with respect to the other methods, while TILES, the only method following a temporal trade-off approach, shows an average number of communities.
The groups showing the most communities are again Sport1, Sport3, Entertainment3 and News2, while the groups Sport2, Work3, Work4, News1 and News3 do not show a relevant number of communities. An important effect of using many different algorithms for community detection can be seen for the group Work1. In this case, DEMON is not able to detect a meaningful community structure, but other algorithms, such as Fast Greedy, are instead able to retrieve a relevant structure. One last important result is that having a longer edge life duration does not have a clear impact on the number of the communities. Indeed, in some cases we see the number increasing, such as in DEMON, as a direct consequence to the fact that more edges are considered in the community detection process. In some other cases we see the number of community decreasing, such as in Fast Greedy, as a direct consequence to the fact that more edges to be consider can lead to communities being brought close together, up to the point where they merge. Lastly, for K-core and TILES the number remains similar, however in some cases TILES detects a much larger number of communities.
These sets of results suggest that further investigation is needed because a relevant community structure can be found and it shows some non-trivial dynamics which are worth to be studied.
7.2. Dynamic Communities Analysis: Active Nodes
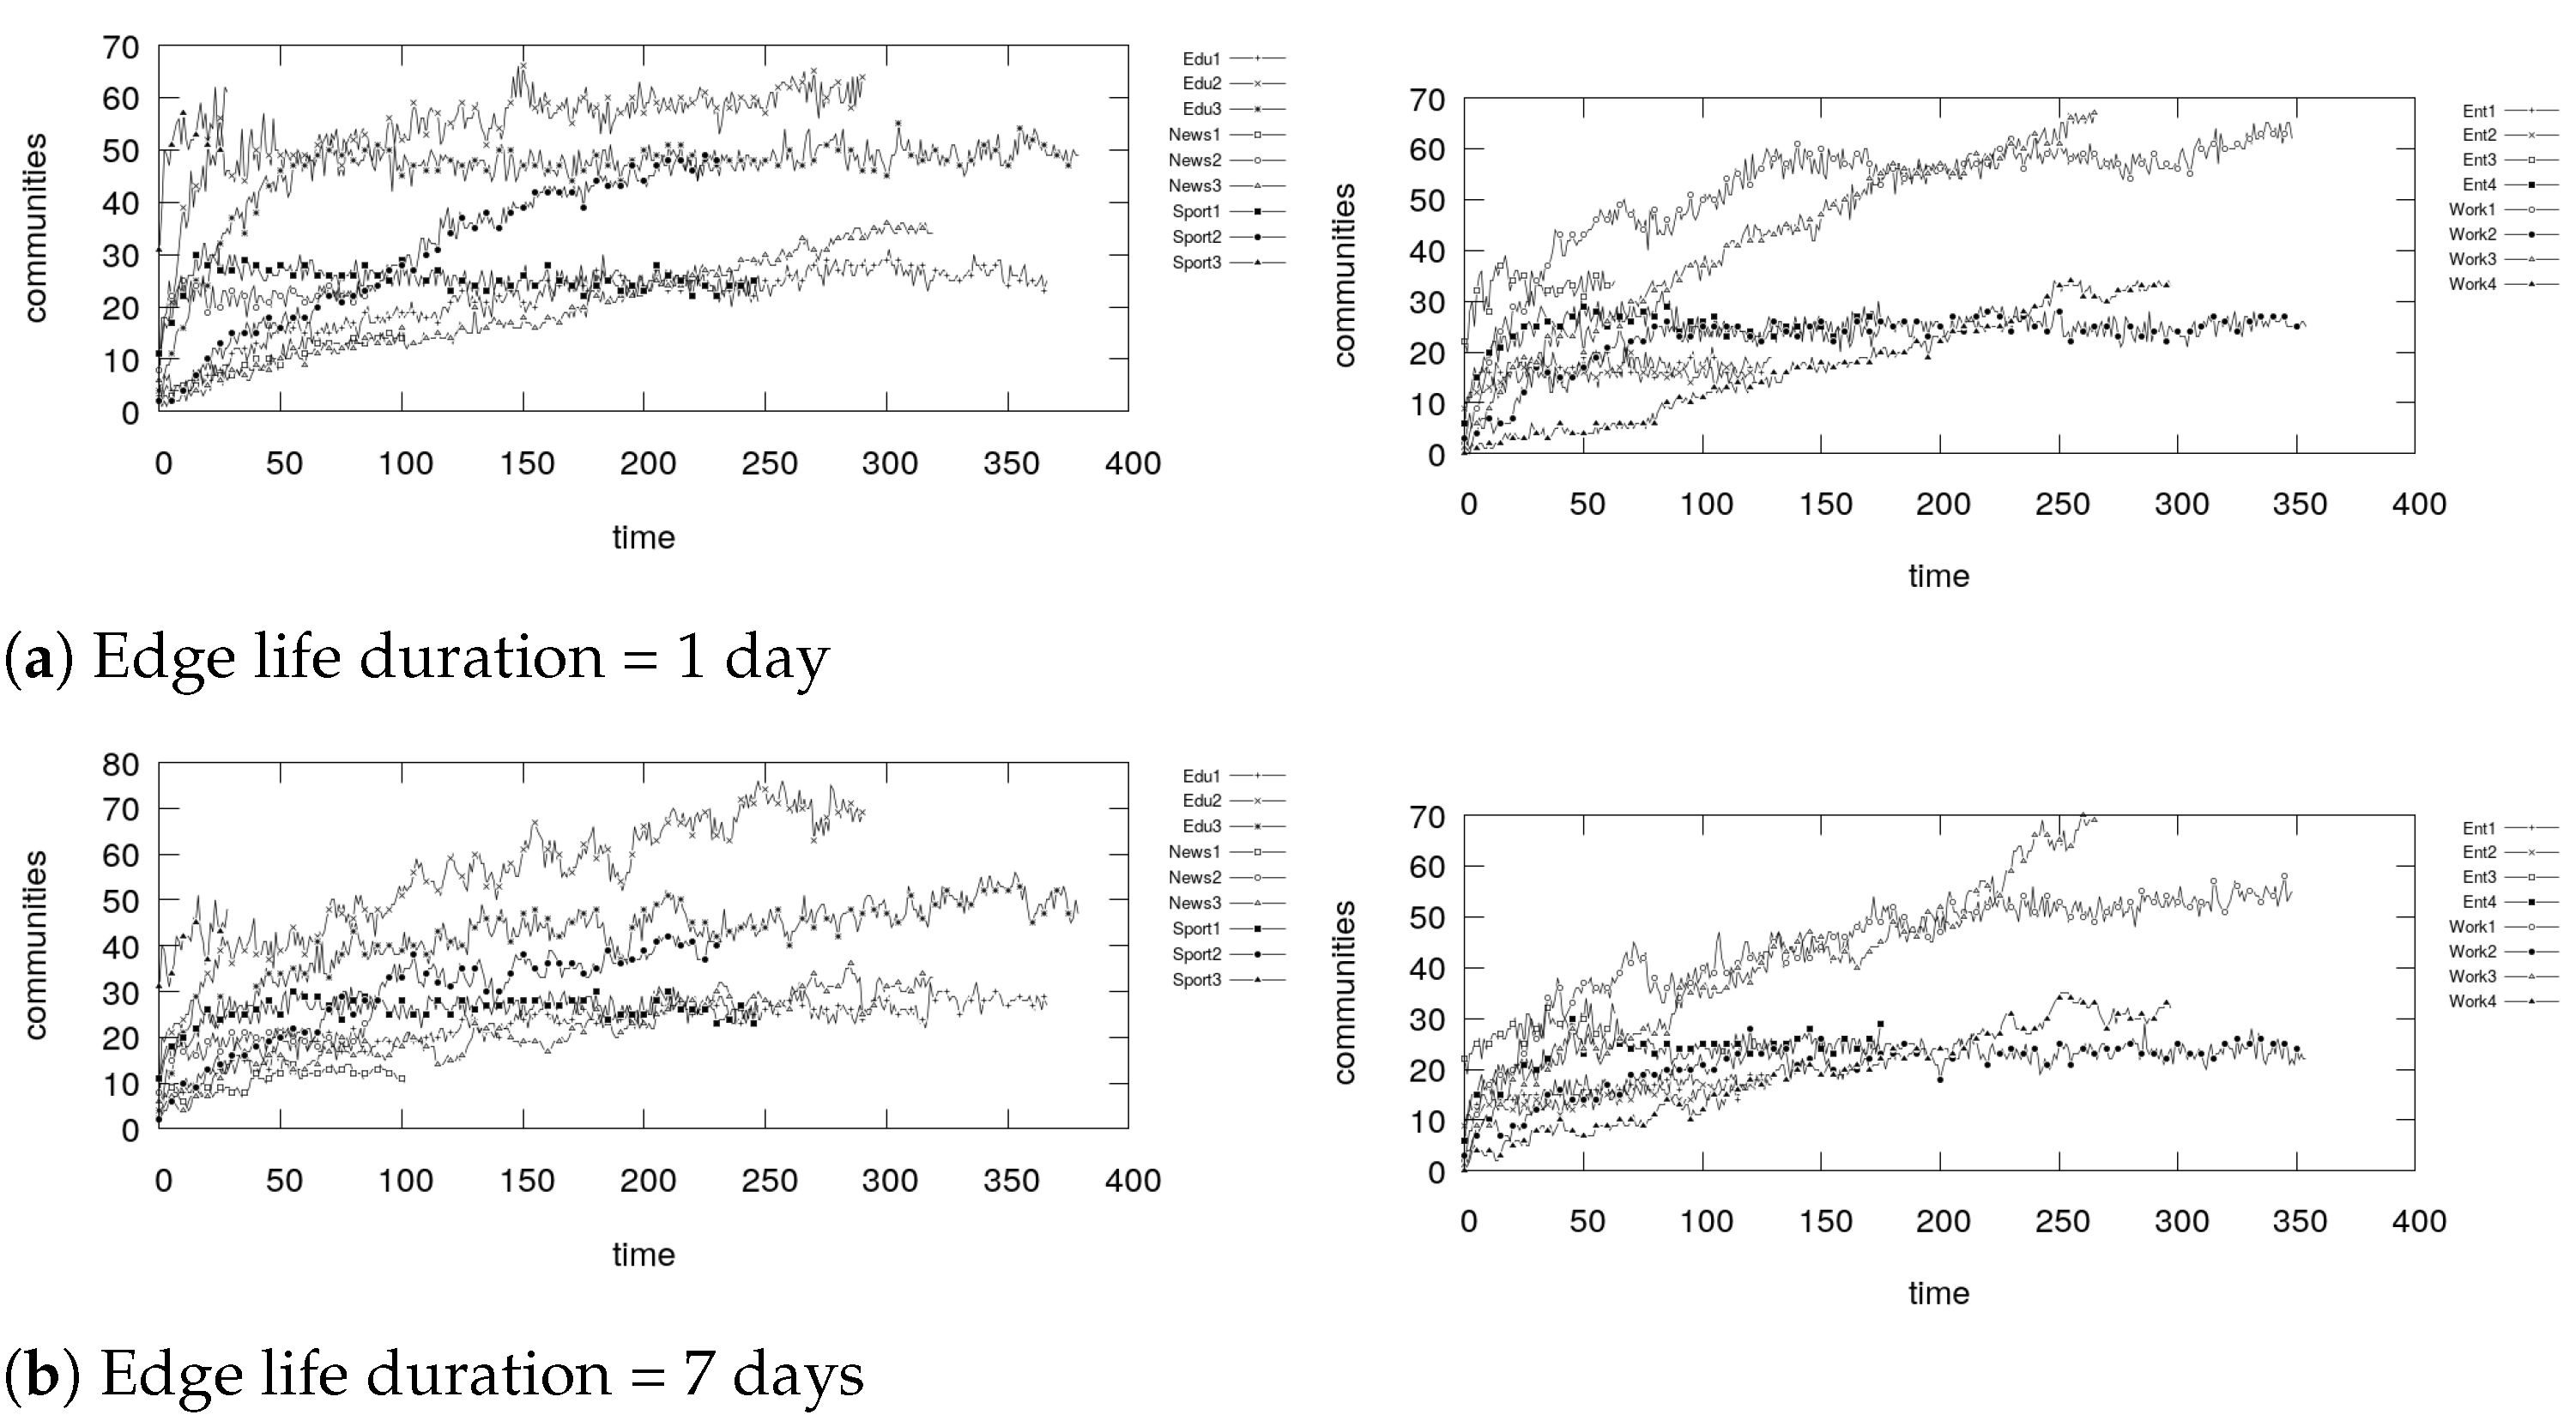
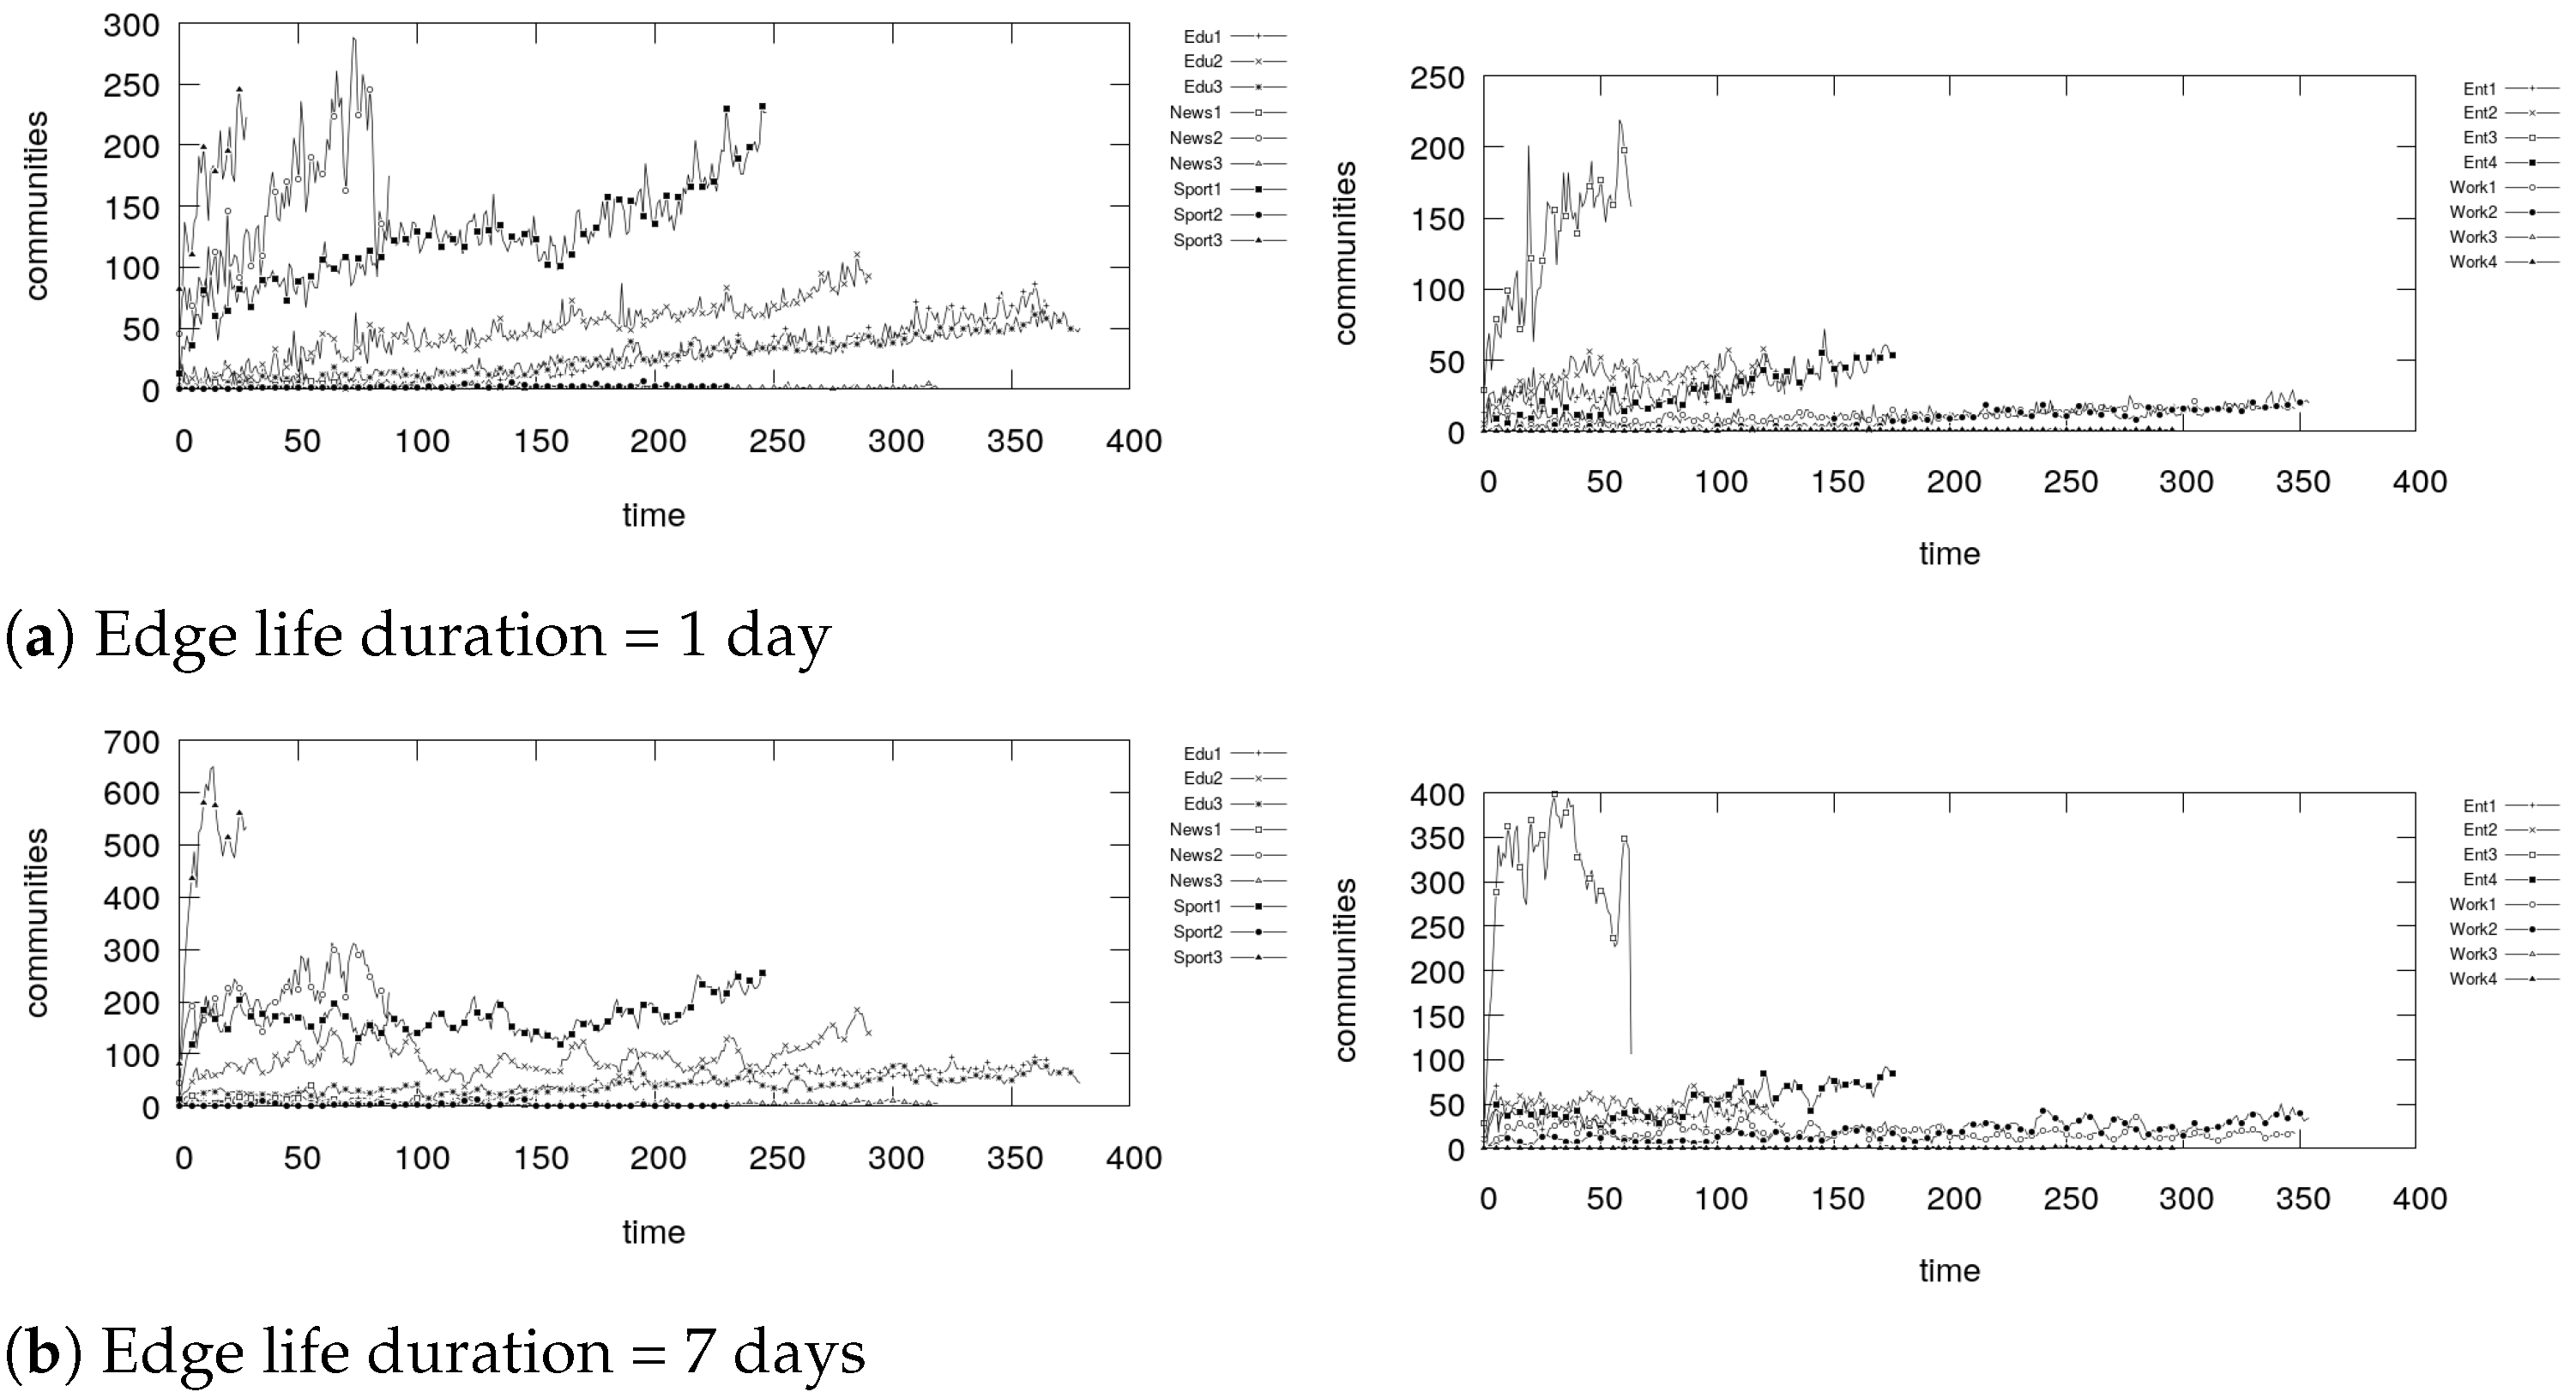
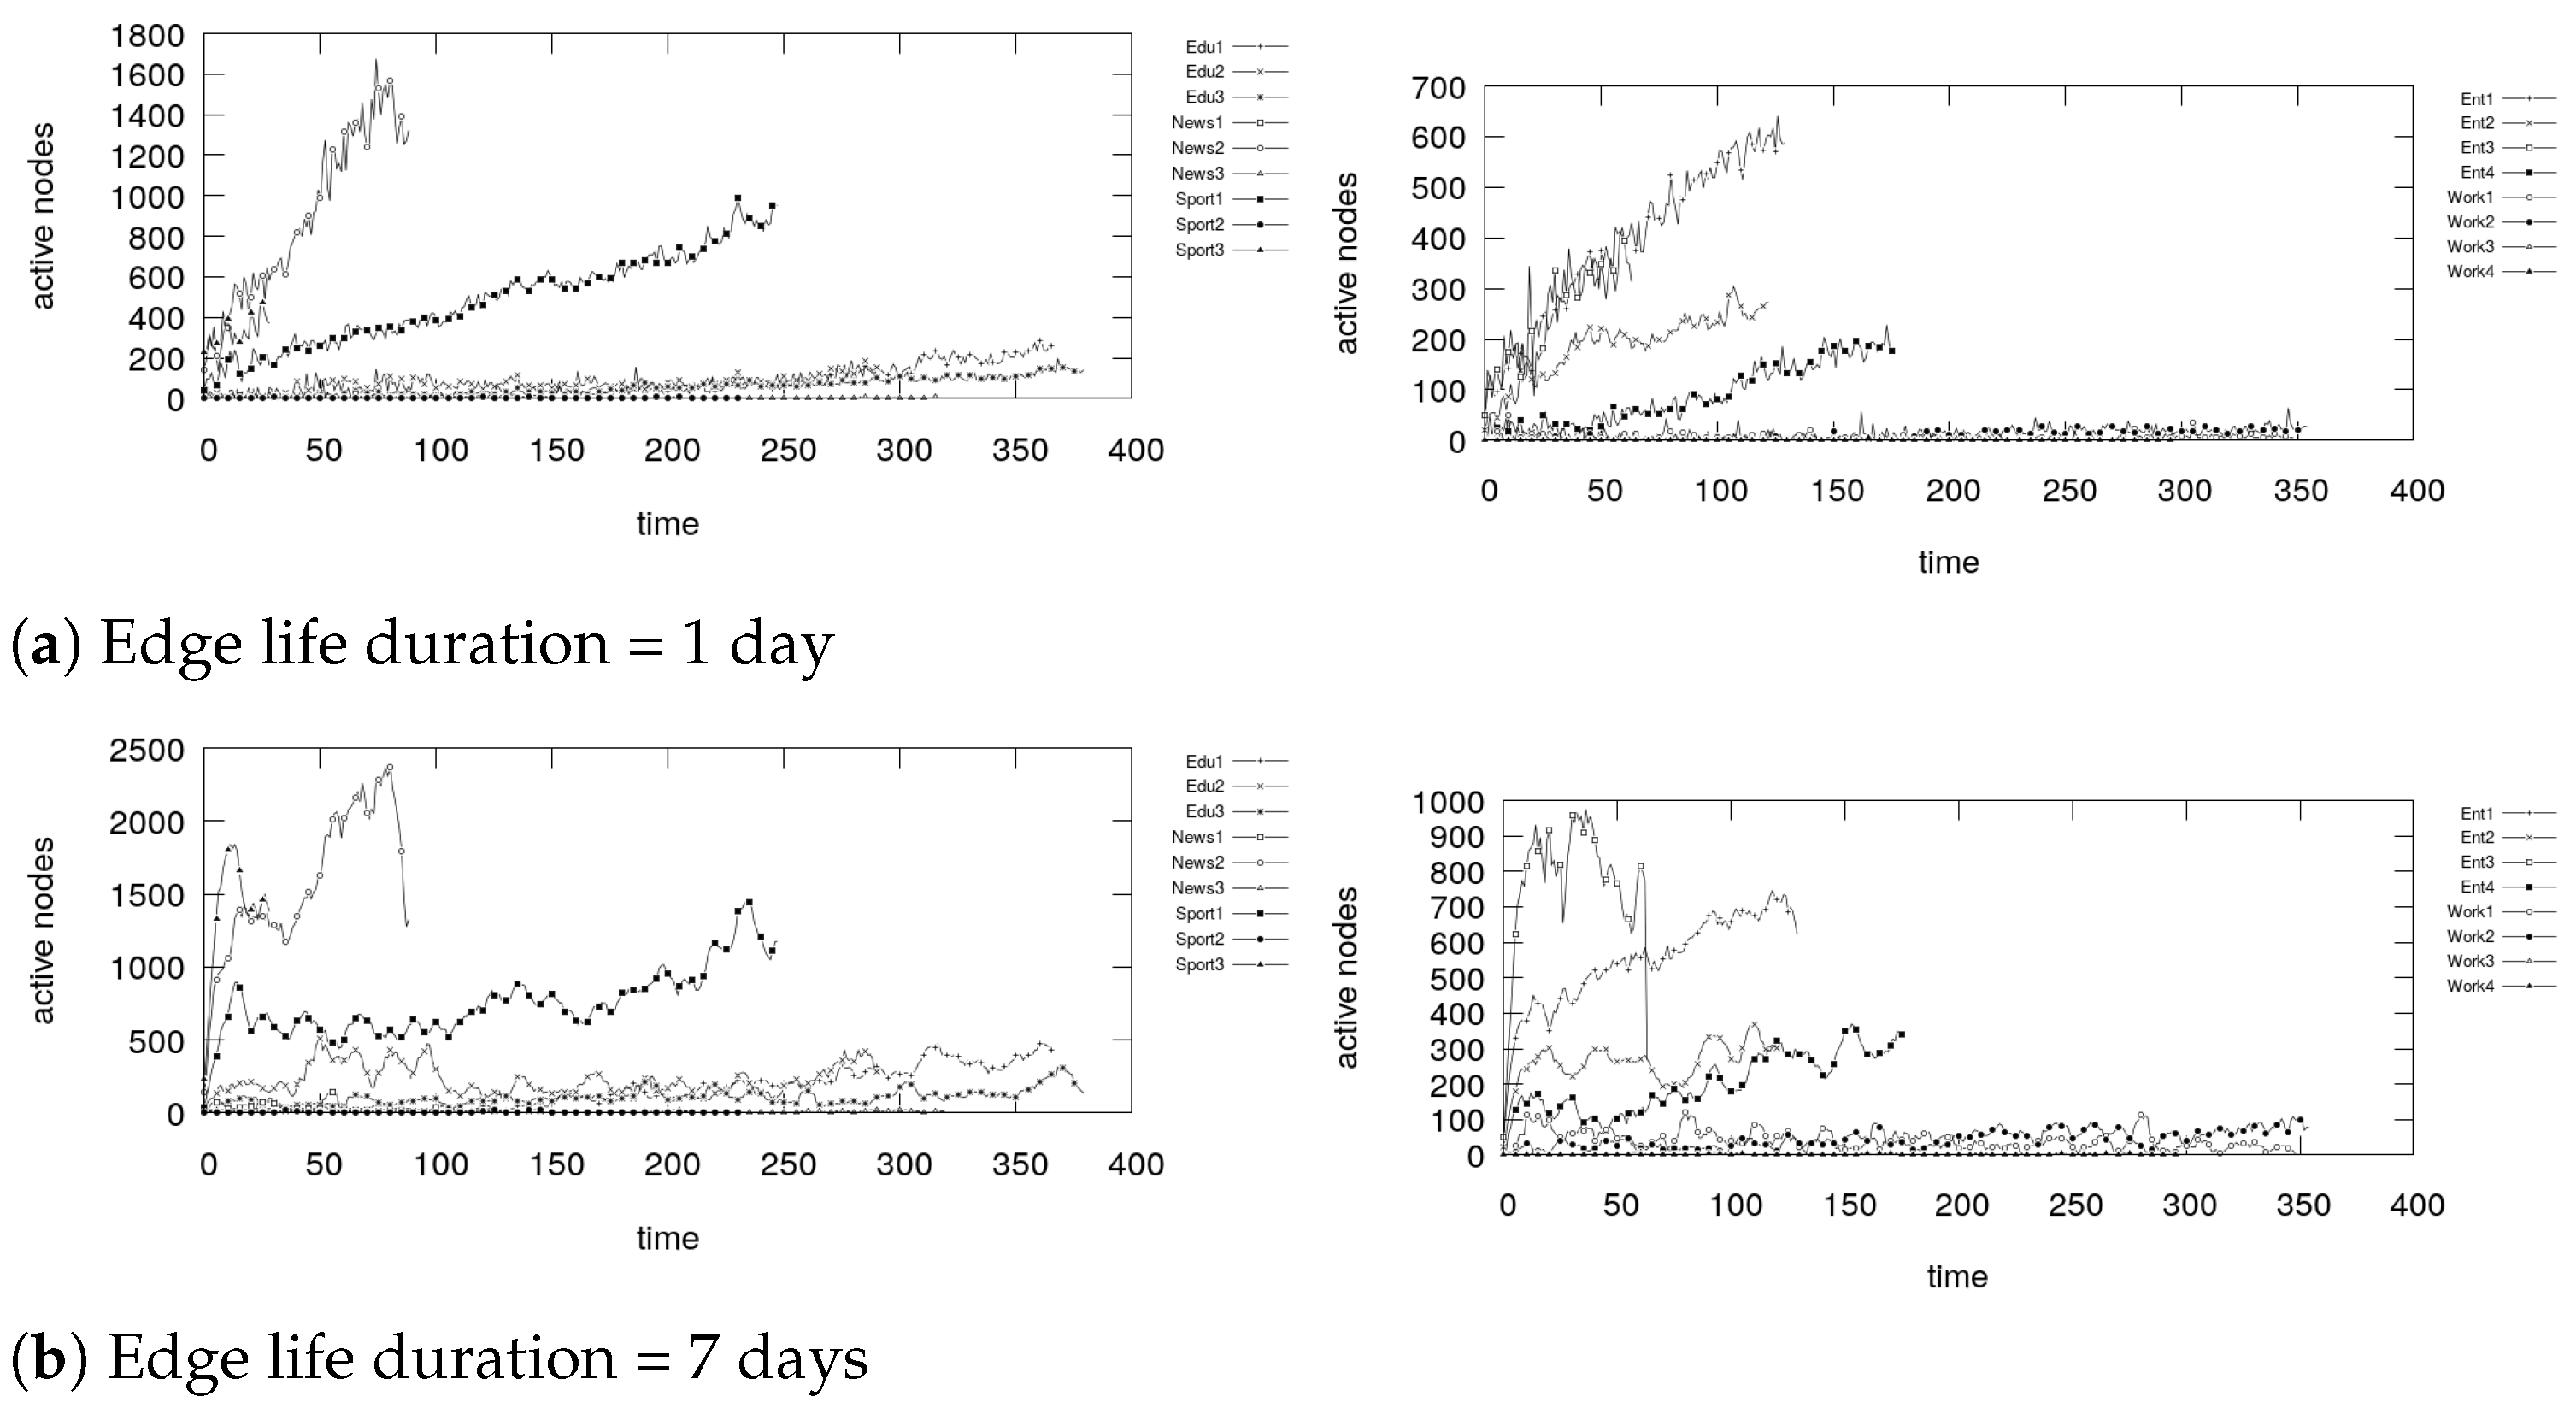
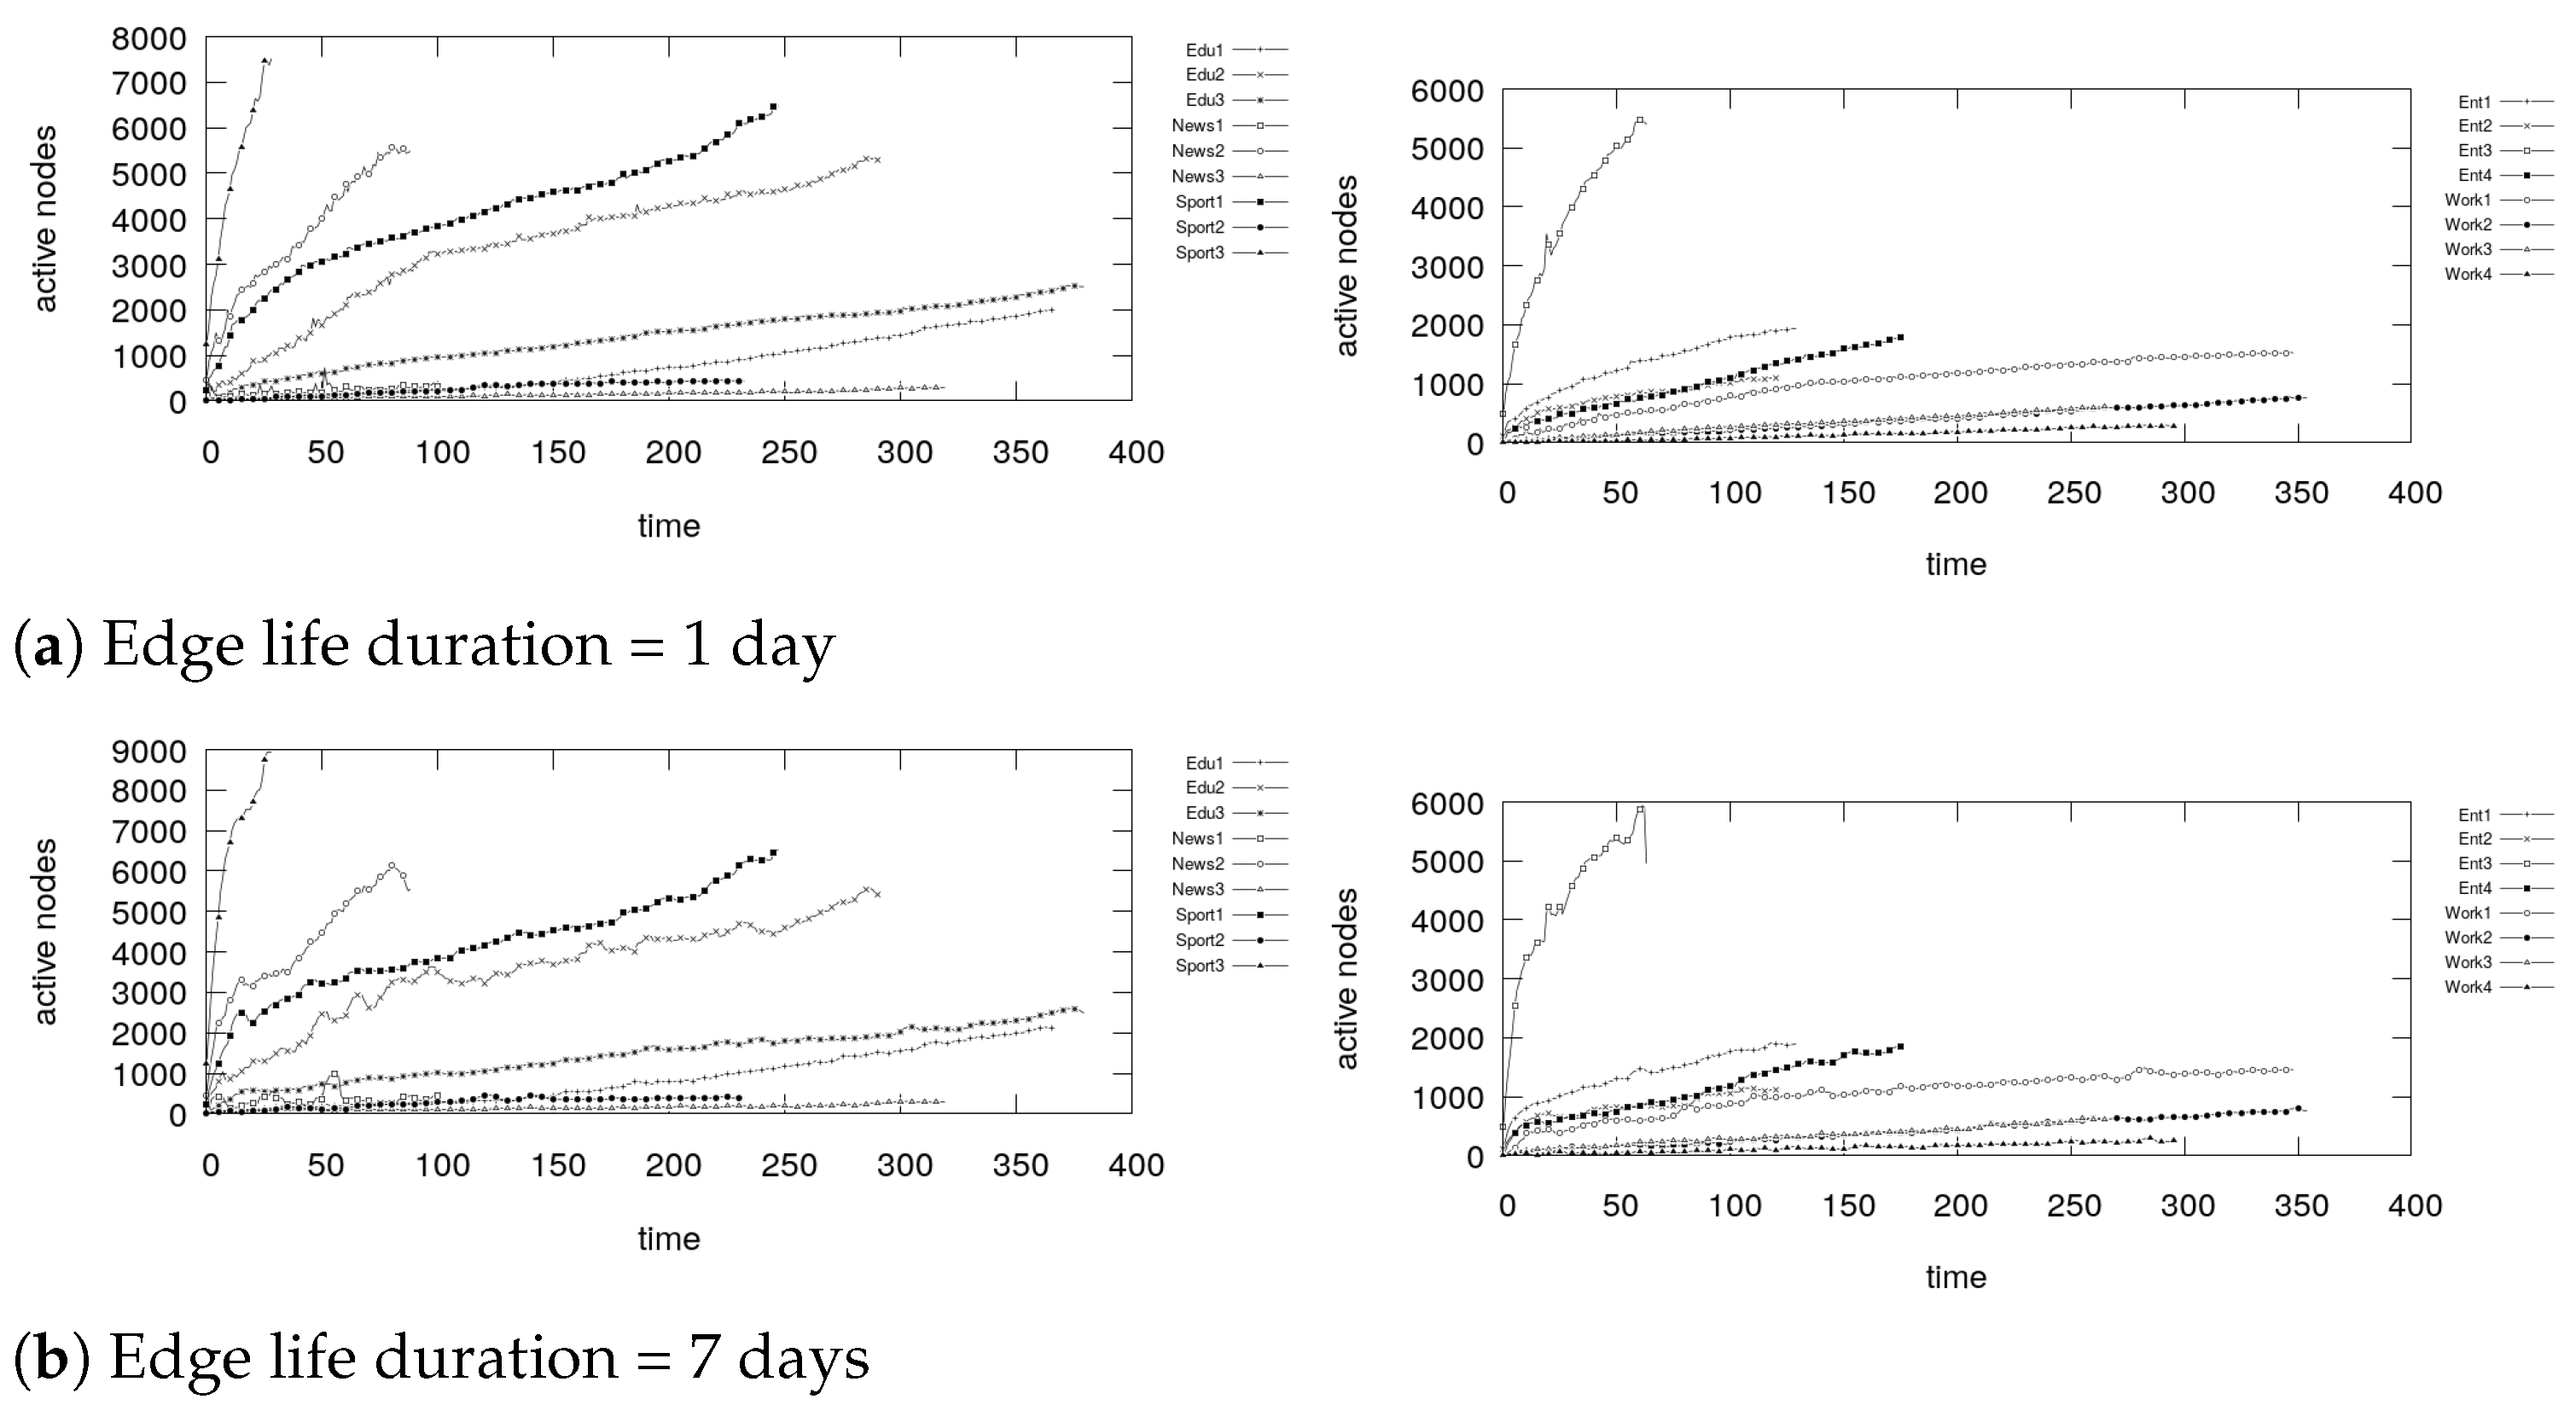
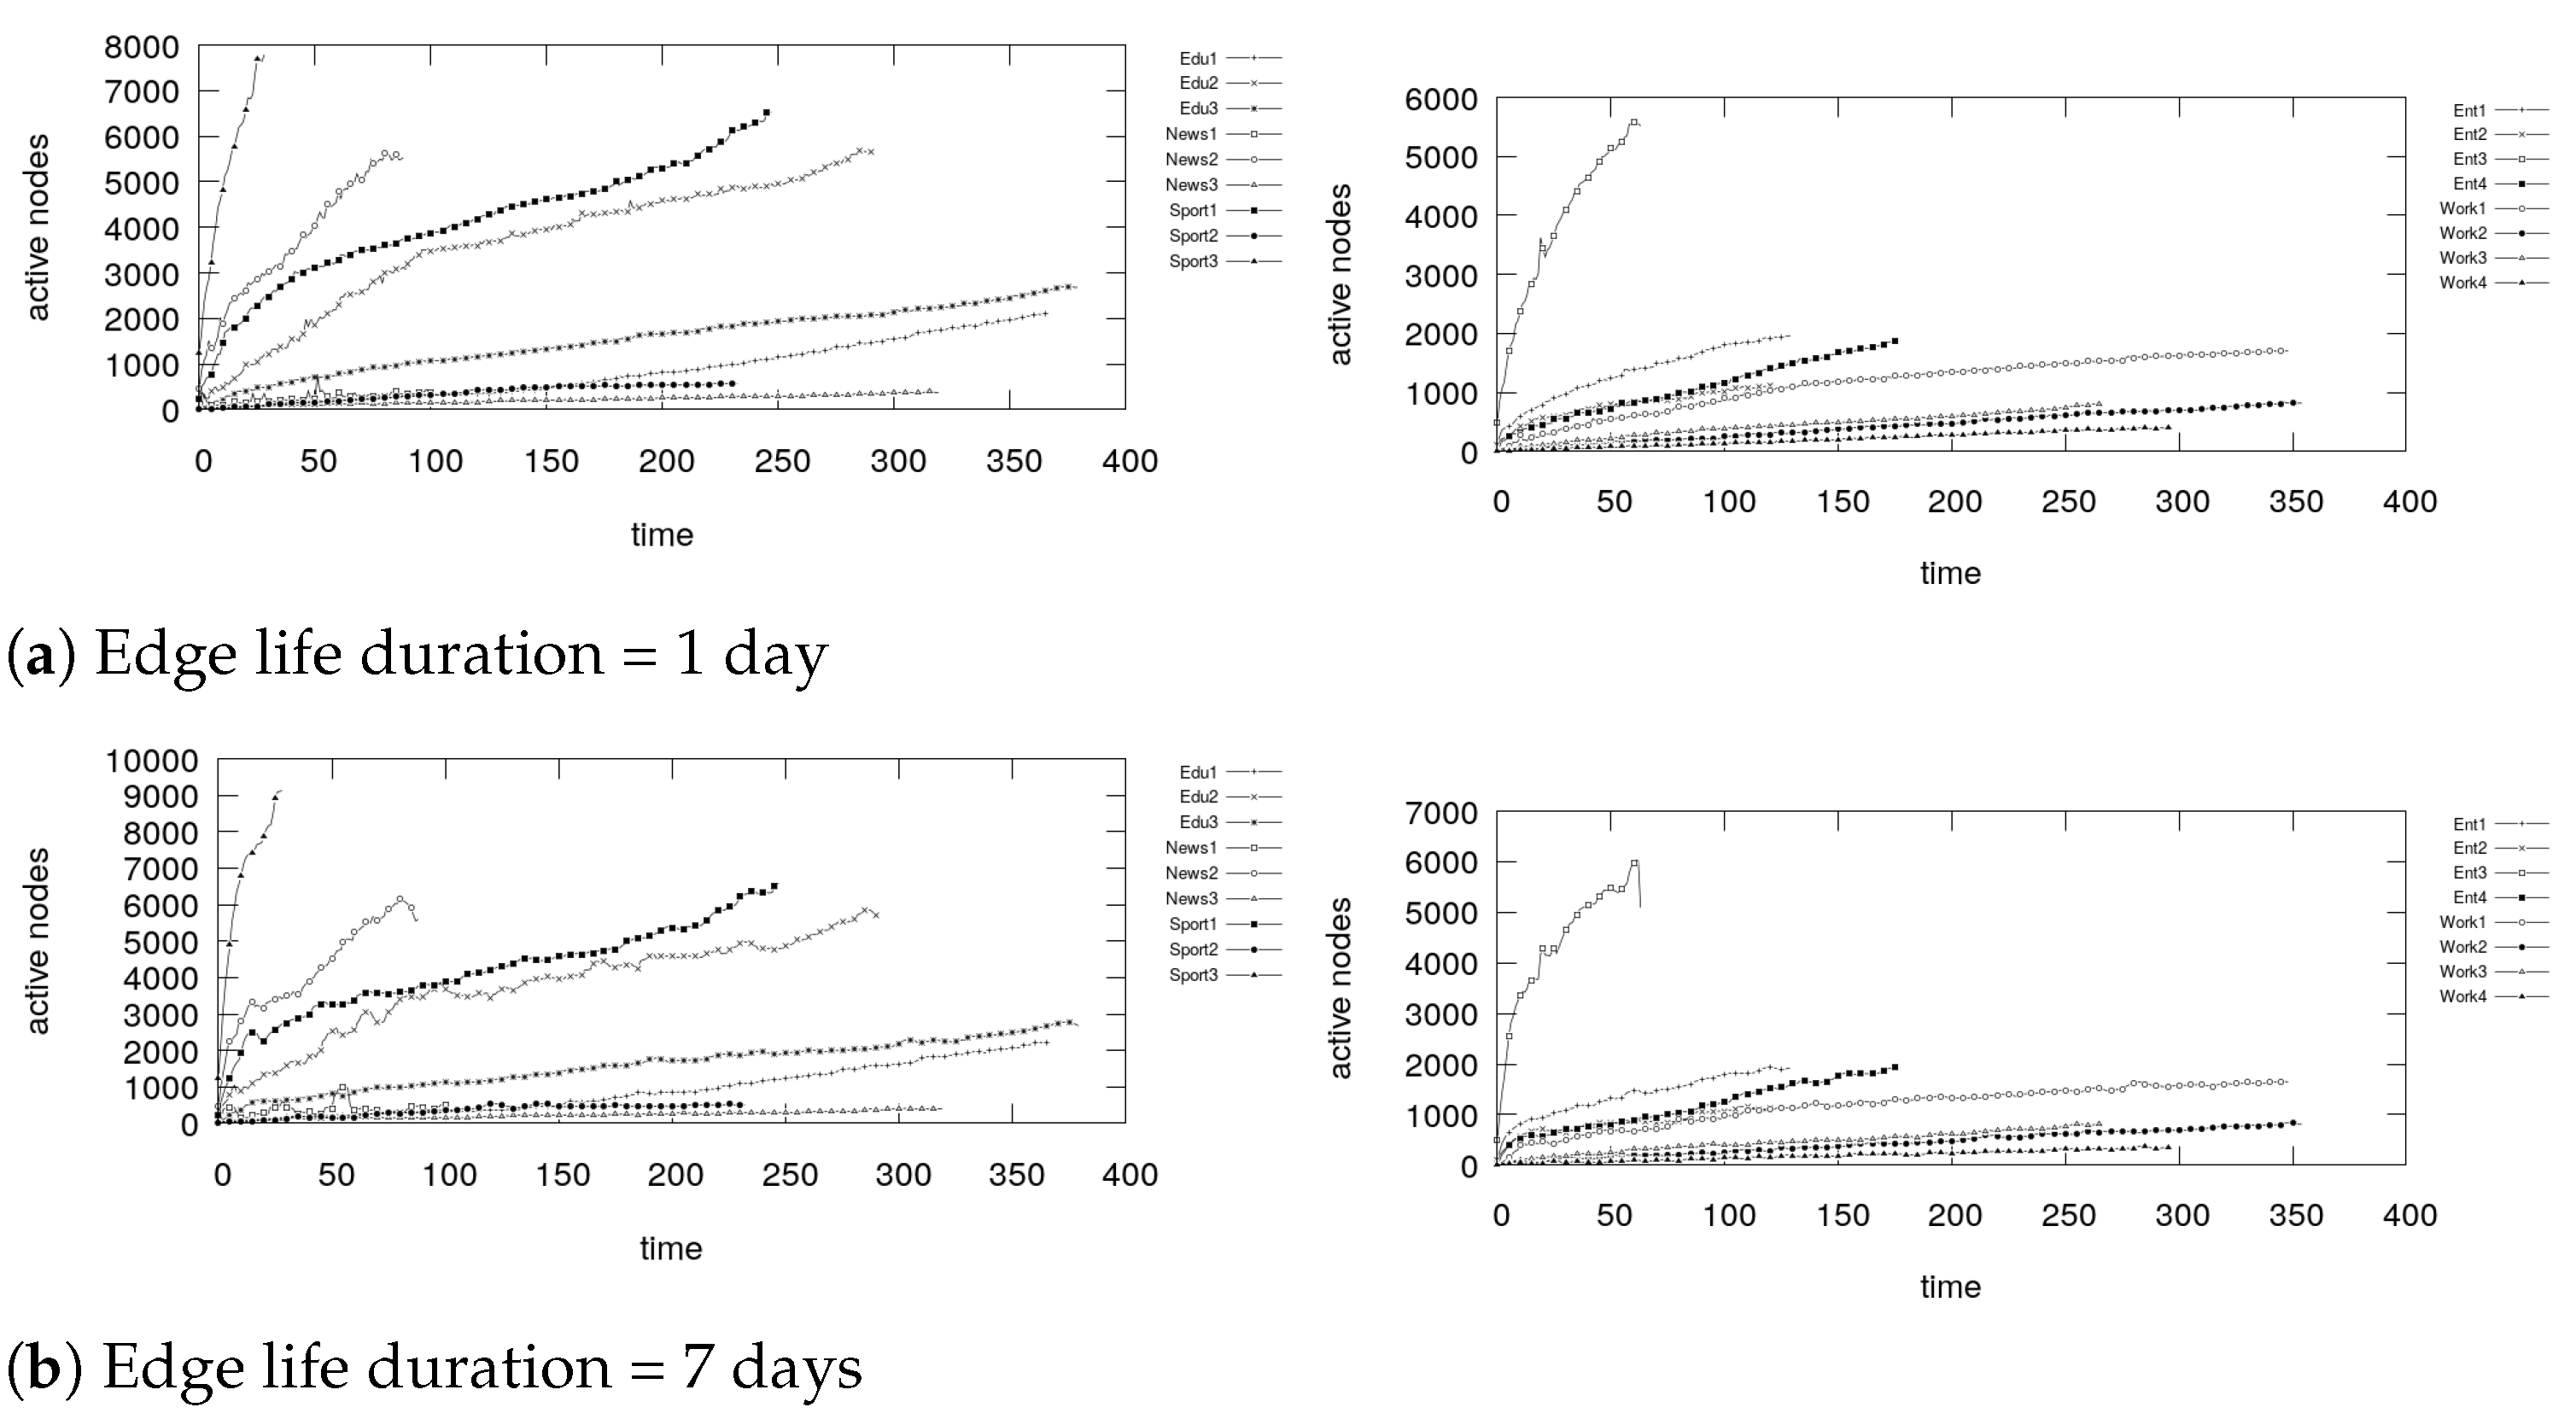
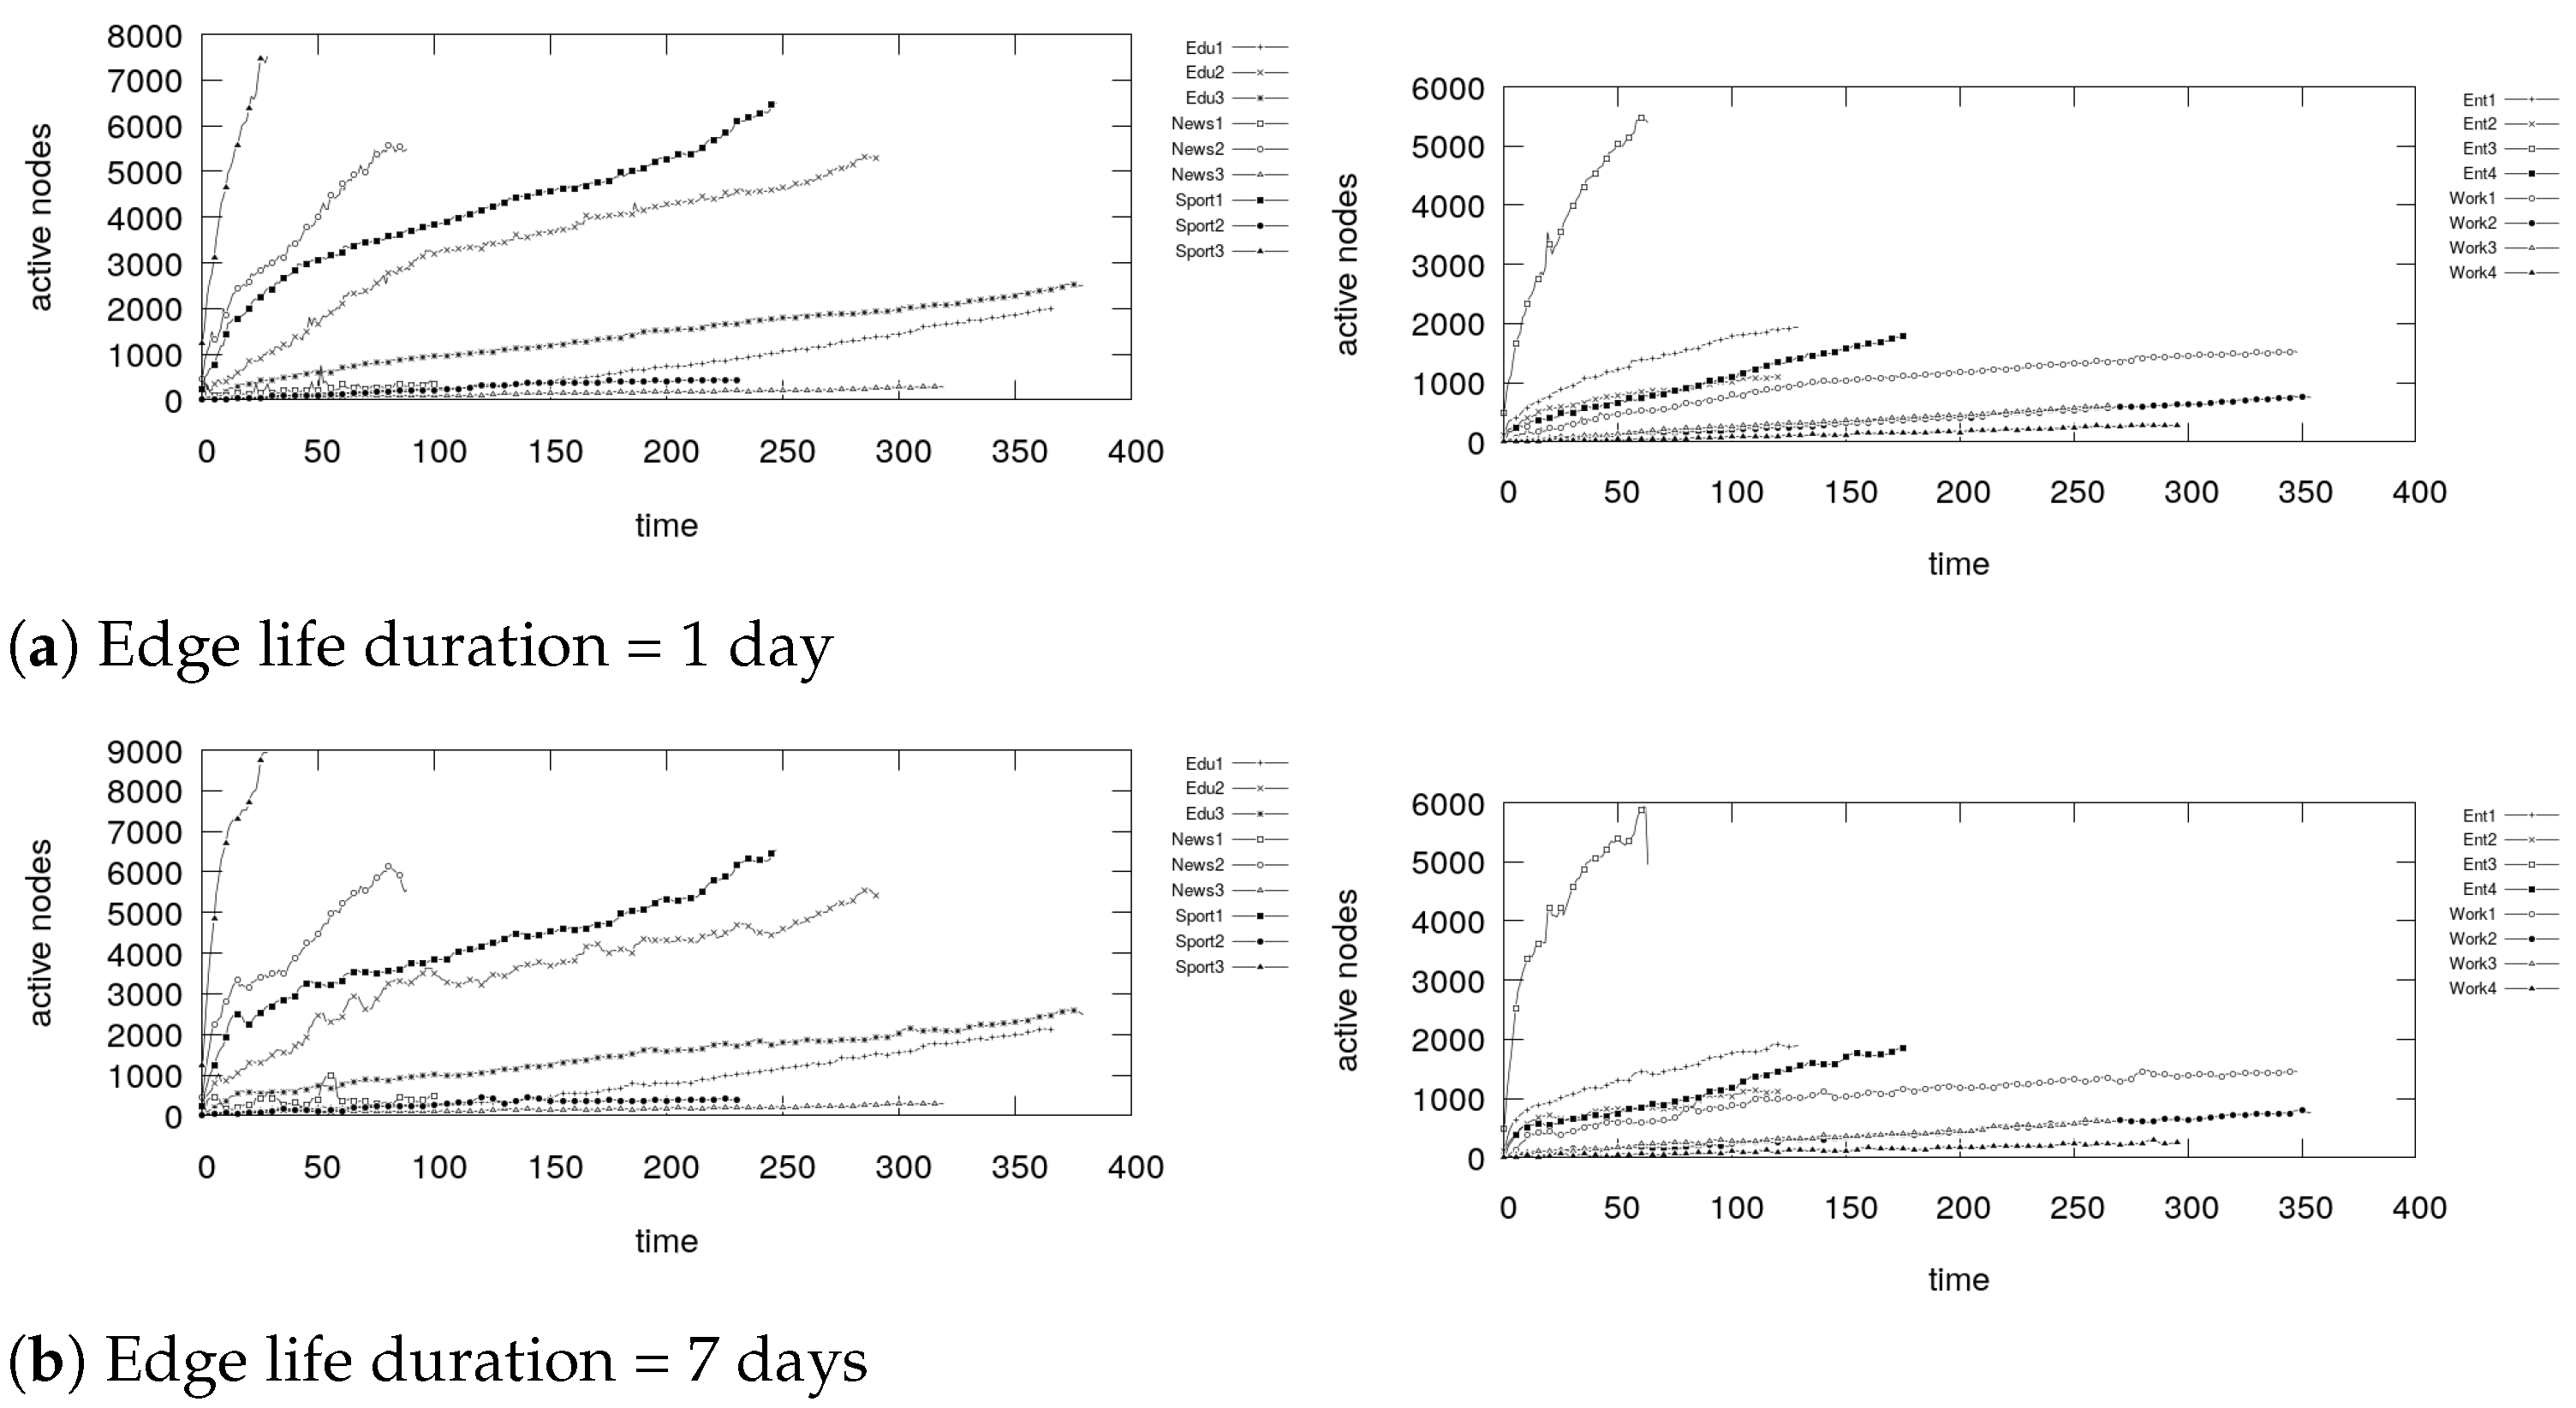
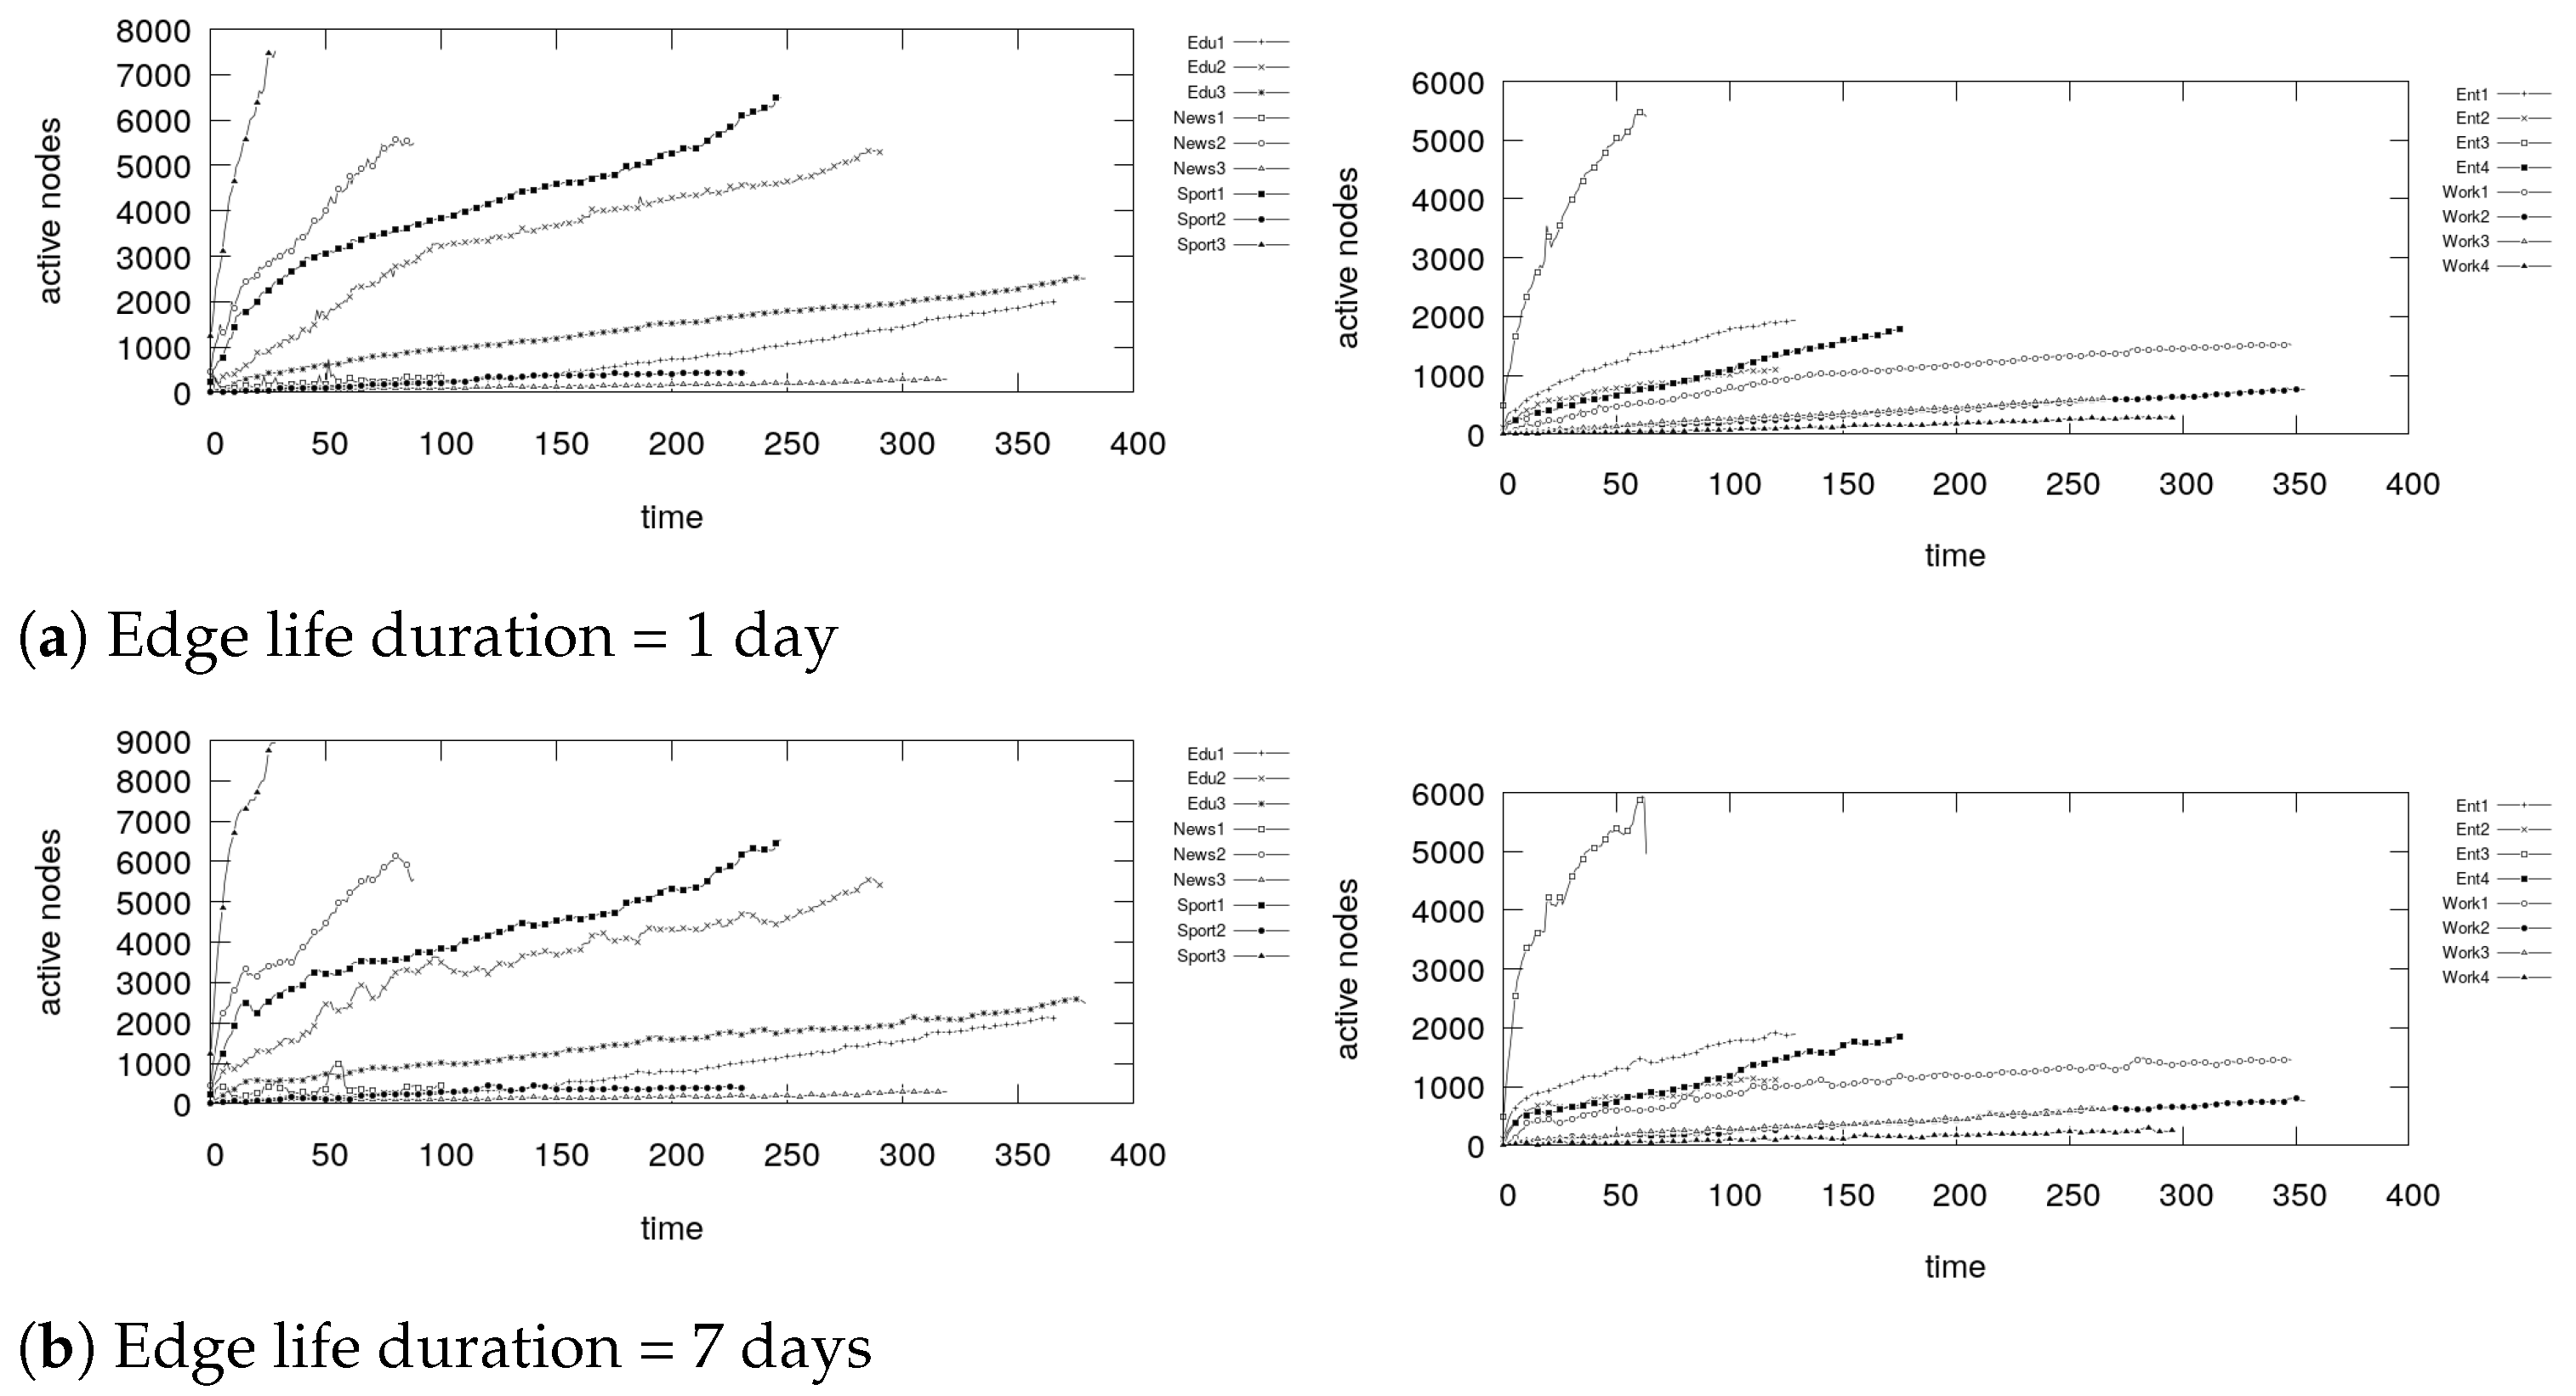
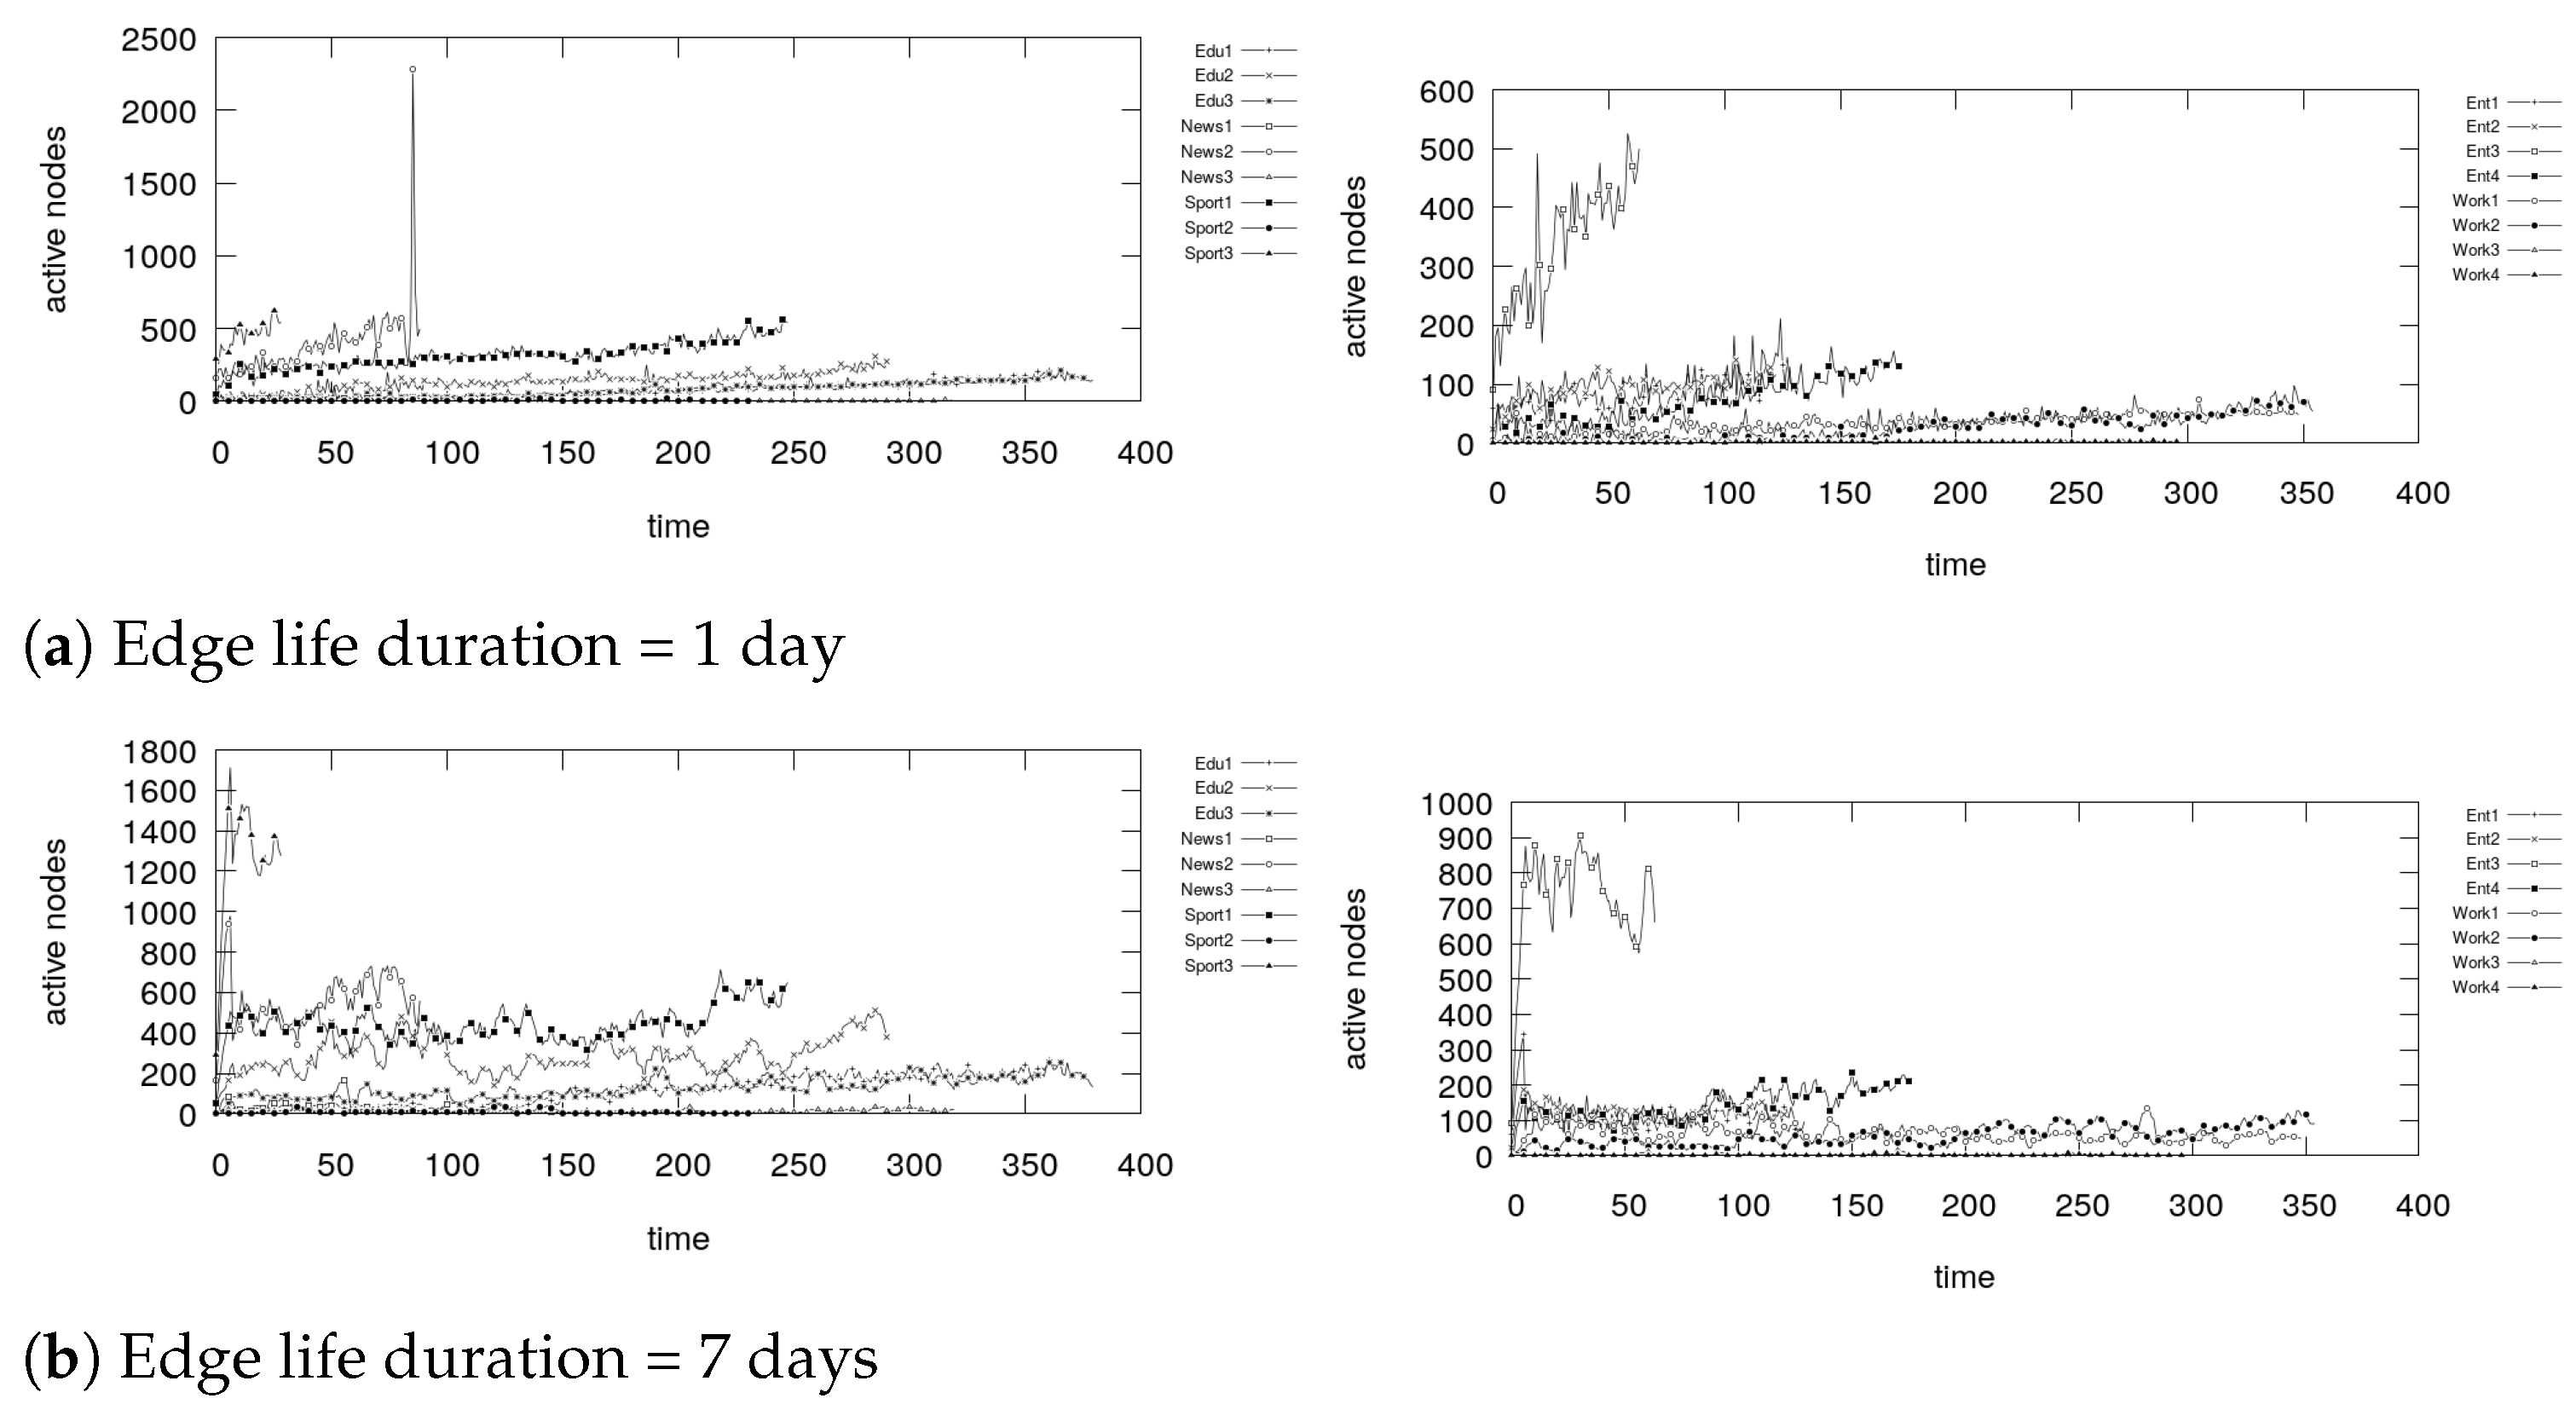
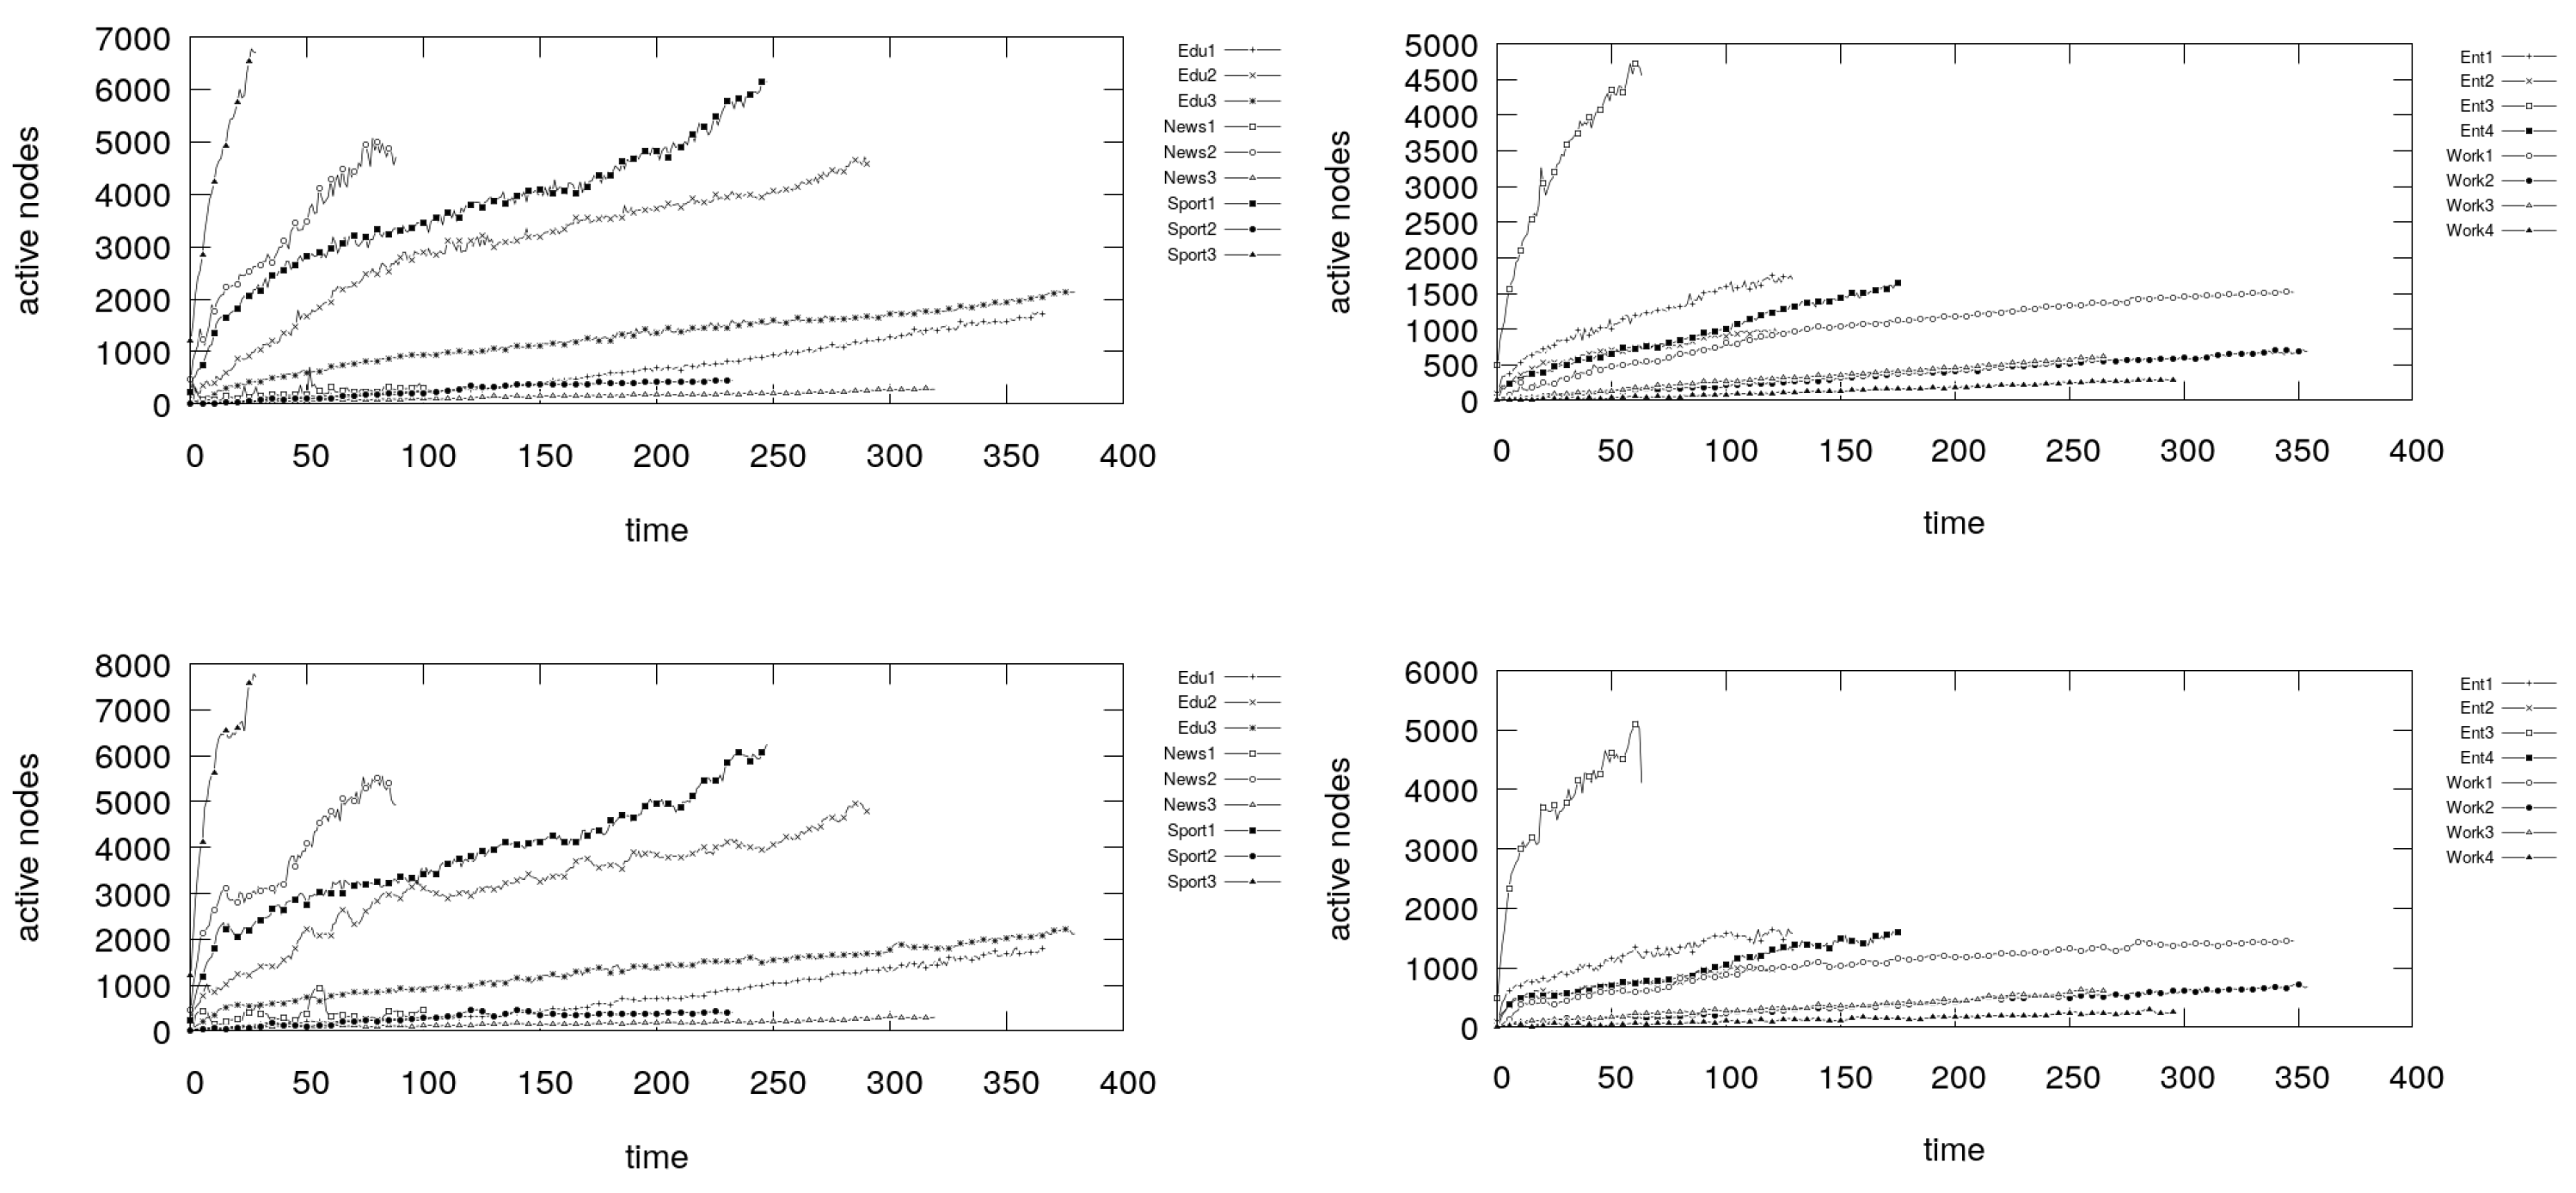
Having detected that some groups show a non-trivial dynamic community structure, we decided to investigate the nodes which make up the communities, and therefore we computed the number of active nodes at each view. A node is said to be active during a view t if it belongs to at least one community in the view t. Figure 10, Figure 11, Figure 12, Figure 13, Figure 14, Figure 15, Figure 16 and Figure 17 show the number of active nodes detected by the eight community detection algorithms used, for each edge life duration.
The plots show that in some groups, namely Sport2, Work2 Work3, Work4, News1 and News3, we see very few active nodes, despite the approach used to detect the communities. Considering that we also observe that these groups show a low amount of communities, we can conclude that in these 5 groups there is no dynamic community structure at all. For this reason, we will ignore these 5 groups in any further consideration. In all the other groups, instead, we detect an ever-increasing number of active nodes, even at a very late stage of the views. This suggests that the number of users who are daily active users and are involved in interaction groups increase as the group lifecycle progresses. Moreover, we notice that this happens regardless of the edge life duration. Additionally, we notice that only in some cases the number of active nodes is sensibly higher for the longer edge life duration, namely for the communities detected by DEMON, TILES and some cases of K-core and label propagation. In general, the number of active nodes has a very steep increase at the very beginning of the history of the groups, which is more distinct in the experiments where the edge life duration is set to 7 days. Additionally, in this case, we also notice that in some groups (Sport1, Sport3 and the groups in the Entertainment category), right after the steep increase, there is a sudden drop of the number of active nodes. This strange behaviour may suggest that at the very beginning of the life of a group many users are encouraged to engage with other users, some of them then lose interest in interacting further more.
This preliminary analysis shows a first characterization of the community structure detected by the chosen algorithms in the groups analysed. In particular, we saw that out of the 17 groups considered, 11 of them showed a complex interaction community structure that is worth to be studied further in detail. Therefore, for the rest of the paper, we will only consider the following groups: groups in the Education category (3 groups), groups in the Entertainment category (4 groups), News2, Sport1, Sport3 and Work1. Additionally, we only show the results of the advanced analyses of the four most relevant community detection algorithms, out of the eight we initially considered. In detail, we will consider DEMON (we discarded label propagation because they are both based on the same principle), Fast Greedy (we discarded Multilevel, the other approach based on modularity optimization), K-core (because of its unique definition), TILES (because its approach is unique with respect to the others). We discarded both approaches based on random walks, namely Infomap and Walktrap, because their approaches do not fit well the scenario we consider and their very large number of communities detected is a sign that the community structure is completely shattered with respect to the other approaches.
7.3. Dynamic Communities Analysis: Growth Rate
To have a better understanding of the ability of the interaction communities to form and attract new nodes, we consider the growth rate, as explained in Section 4.
Figure 18, Figure 19, Figure 20 and Figure 21 show the average growth rate of the communities found by the selected four community detection algorithms in the eleven groups. In the first experiments, when we set edge life duration to be 1 day, we see that at the beginning of the crawling process the growth rate of the communities often exceeds 1, except for K-core. This means that, on average, at the beginning of their lives all communities are made of at least half of nodes that were previously not active. This translates into having communities that grow very rapidly at early stages, where we also observed a rather steep increase of the number of active nodes, as shown in Section 7.2. In most cases, the growth rate tends to decrease as time passes by, reaching values in the interval between 0.1 and 1. The result holds despite the edge life duration. Moreover, we notice that the growth rate observed in the communities detected by DEMON and TILES is highly unstable, which is a clear sign that the dynamism of the network can highly impact the structures that are found. Fast Greedy detects a community structure that is much more stable over time, although the growth rate values tend to be smaller in most of the cases, as in Work1. A very unique result is achieved using K-core (see Figure 20), where the growth rate starts at smaller values, but it is much more stable through time. The results we observe in this section are tightly connected to the definition of community adopted by each algorithm. The efficient approaches based on the output of a process, such as DEMON and TILES, which have a non-structural definition of community, tend to be highly unstable because small changes in the network can have serious repercussions on the overall community structure. On the other hand, K-core, with its very strict definition of community, shows a community structure which is, overall, growing at a steadier, although slower, pace.
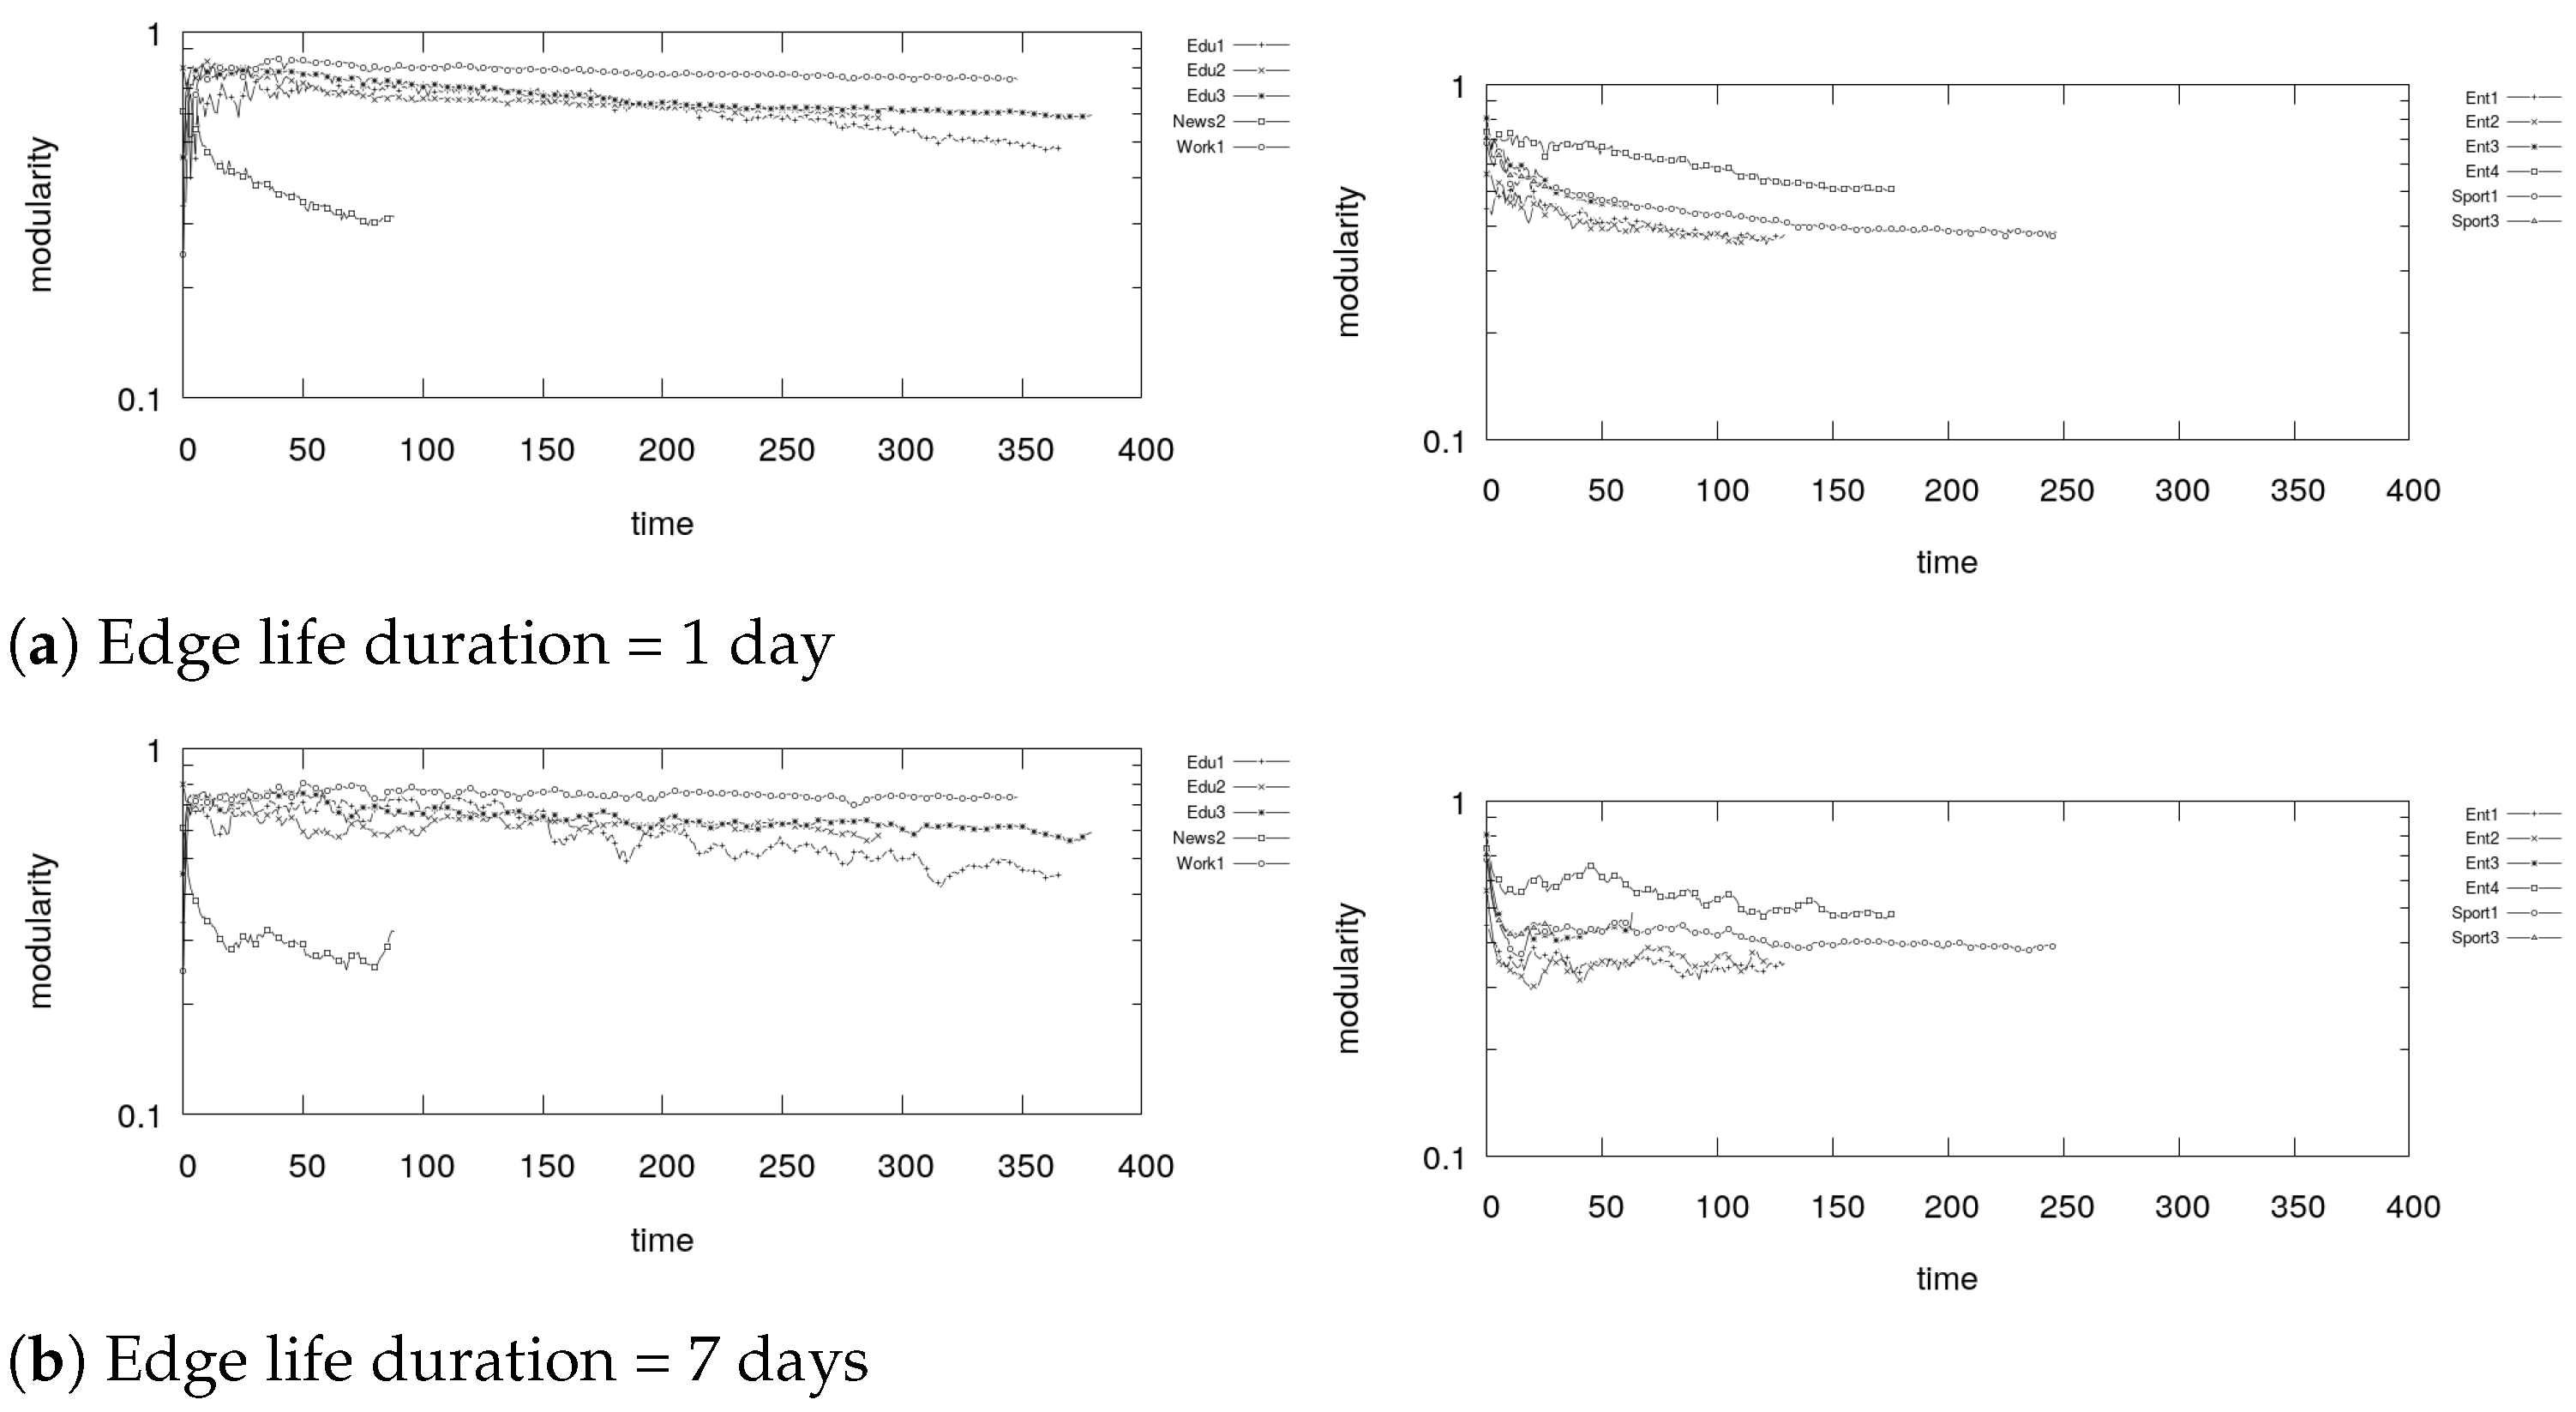
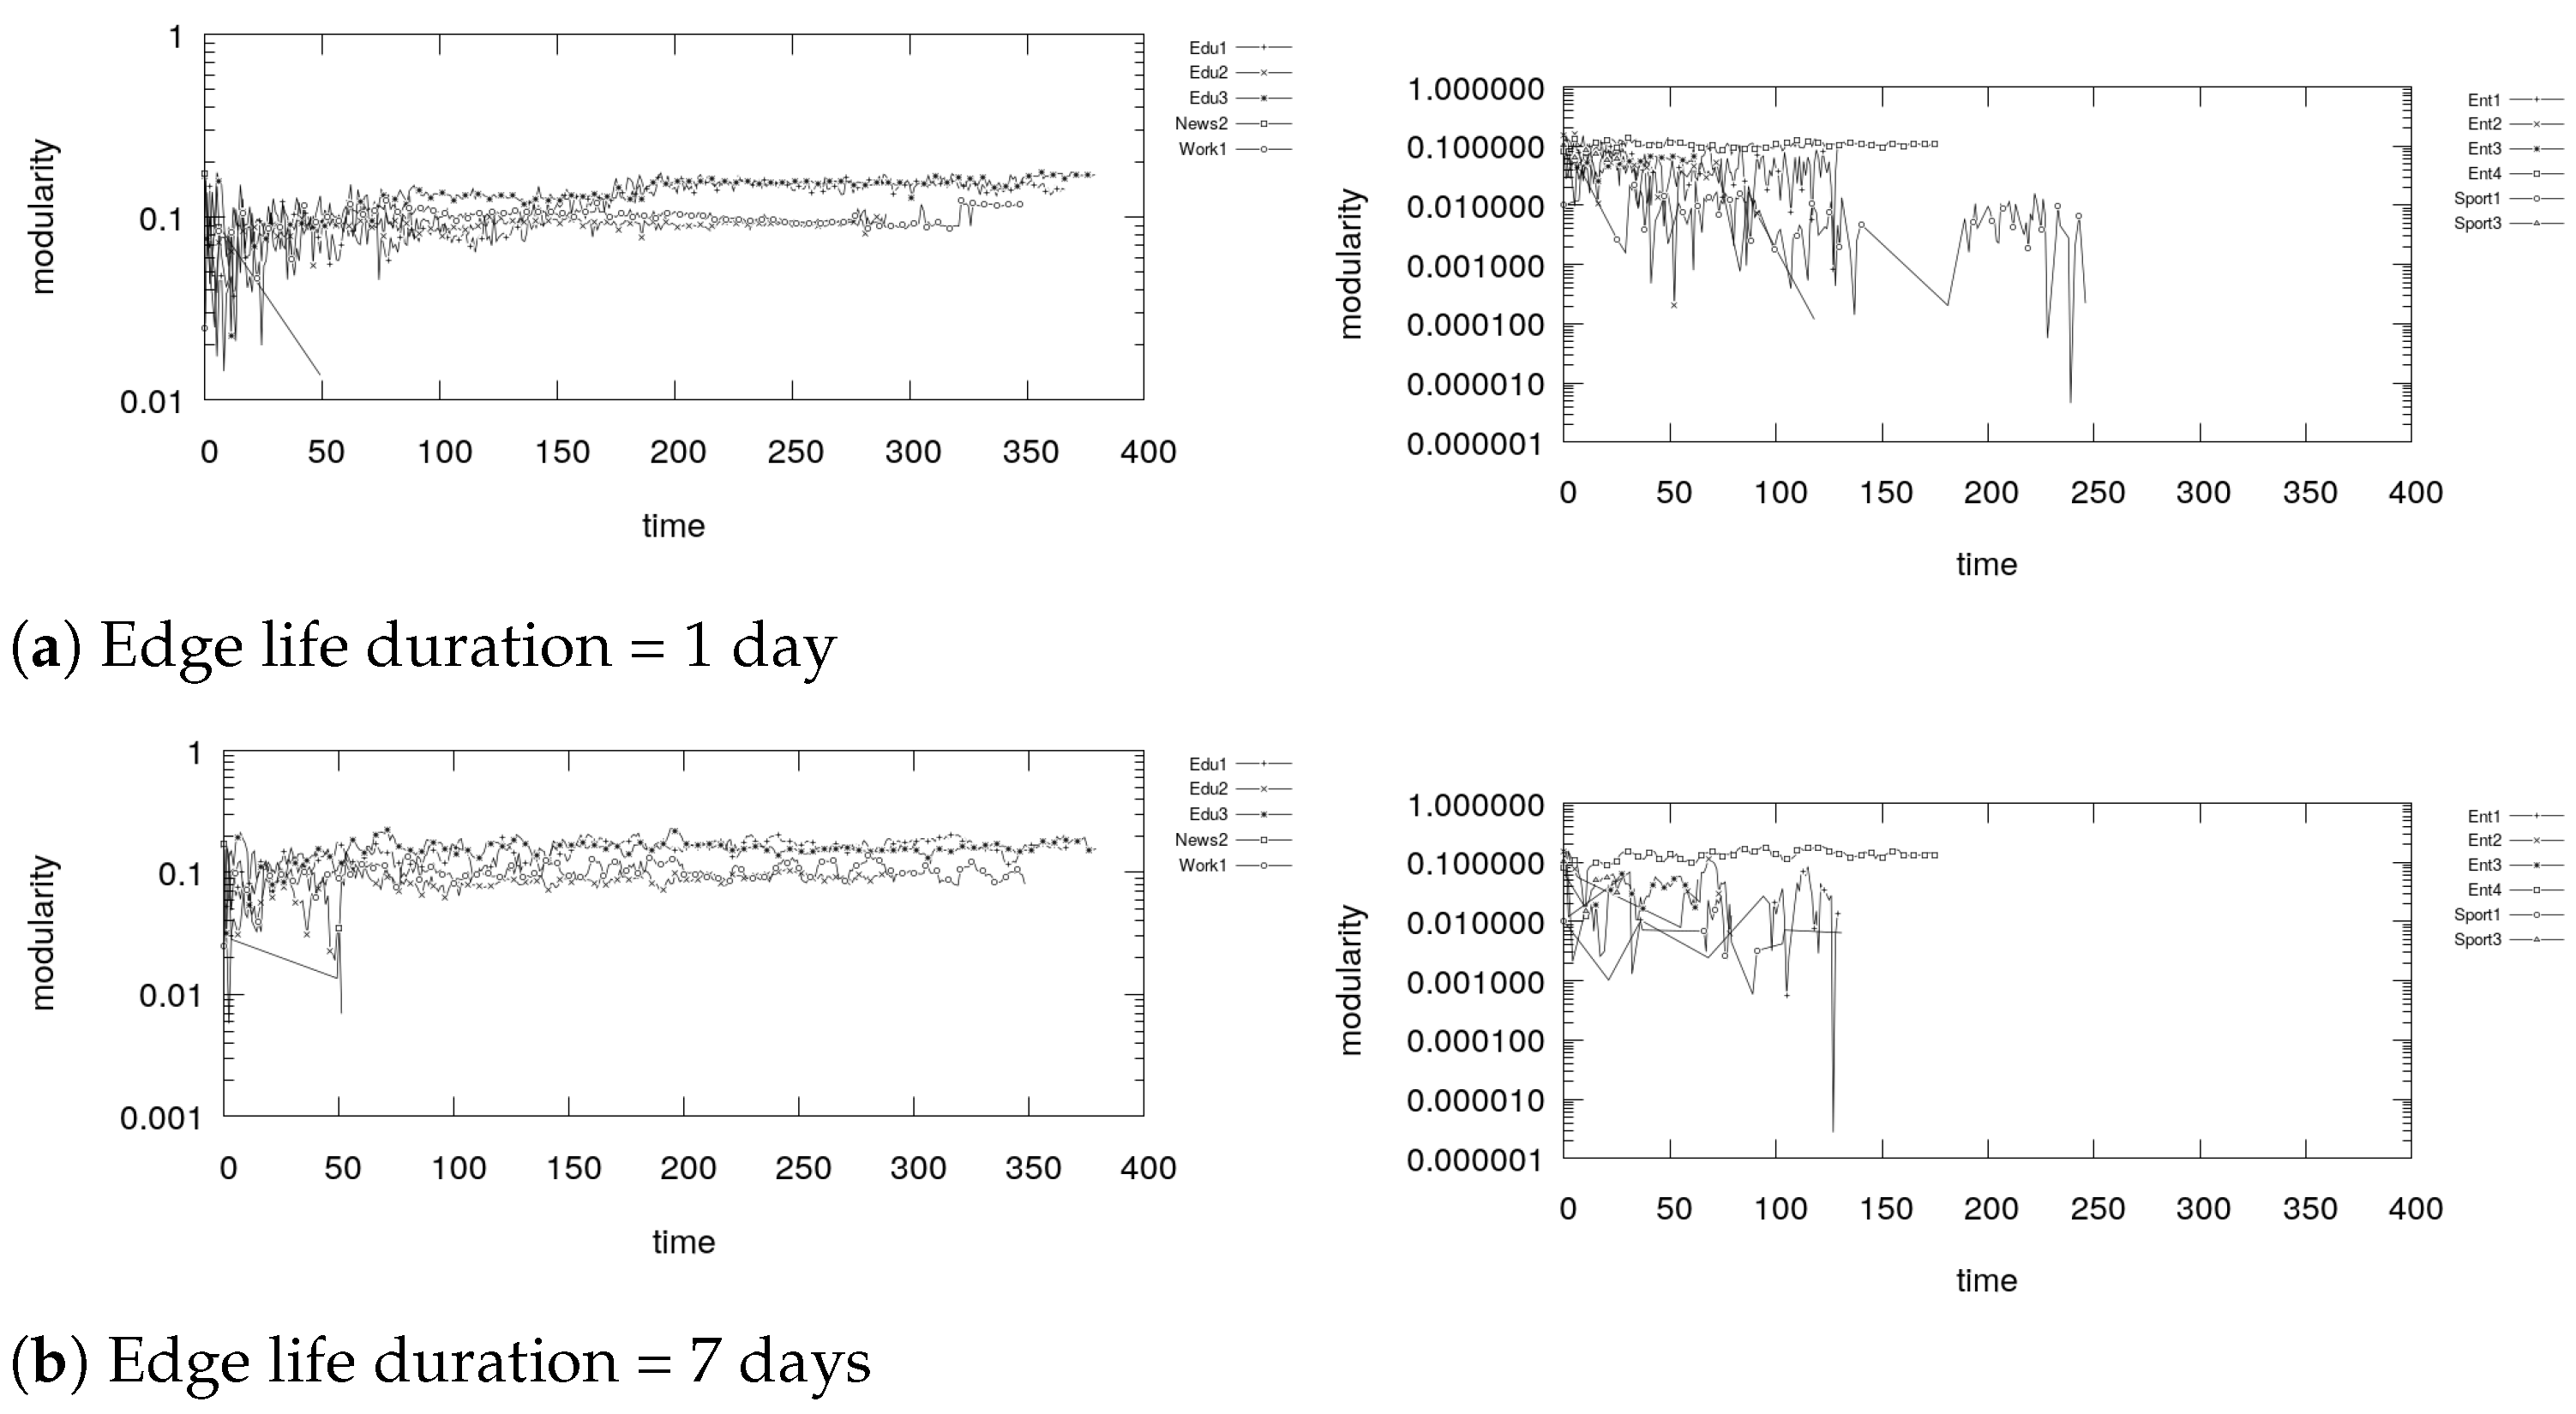
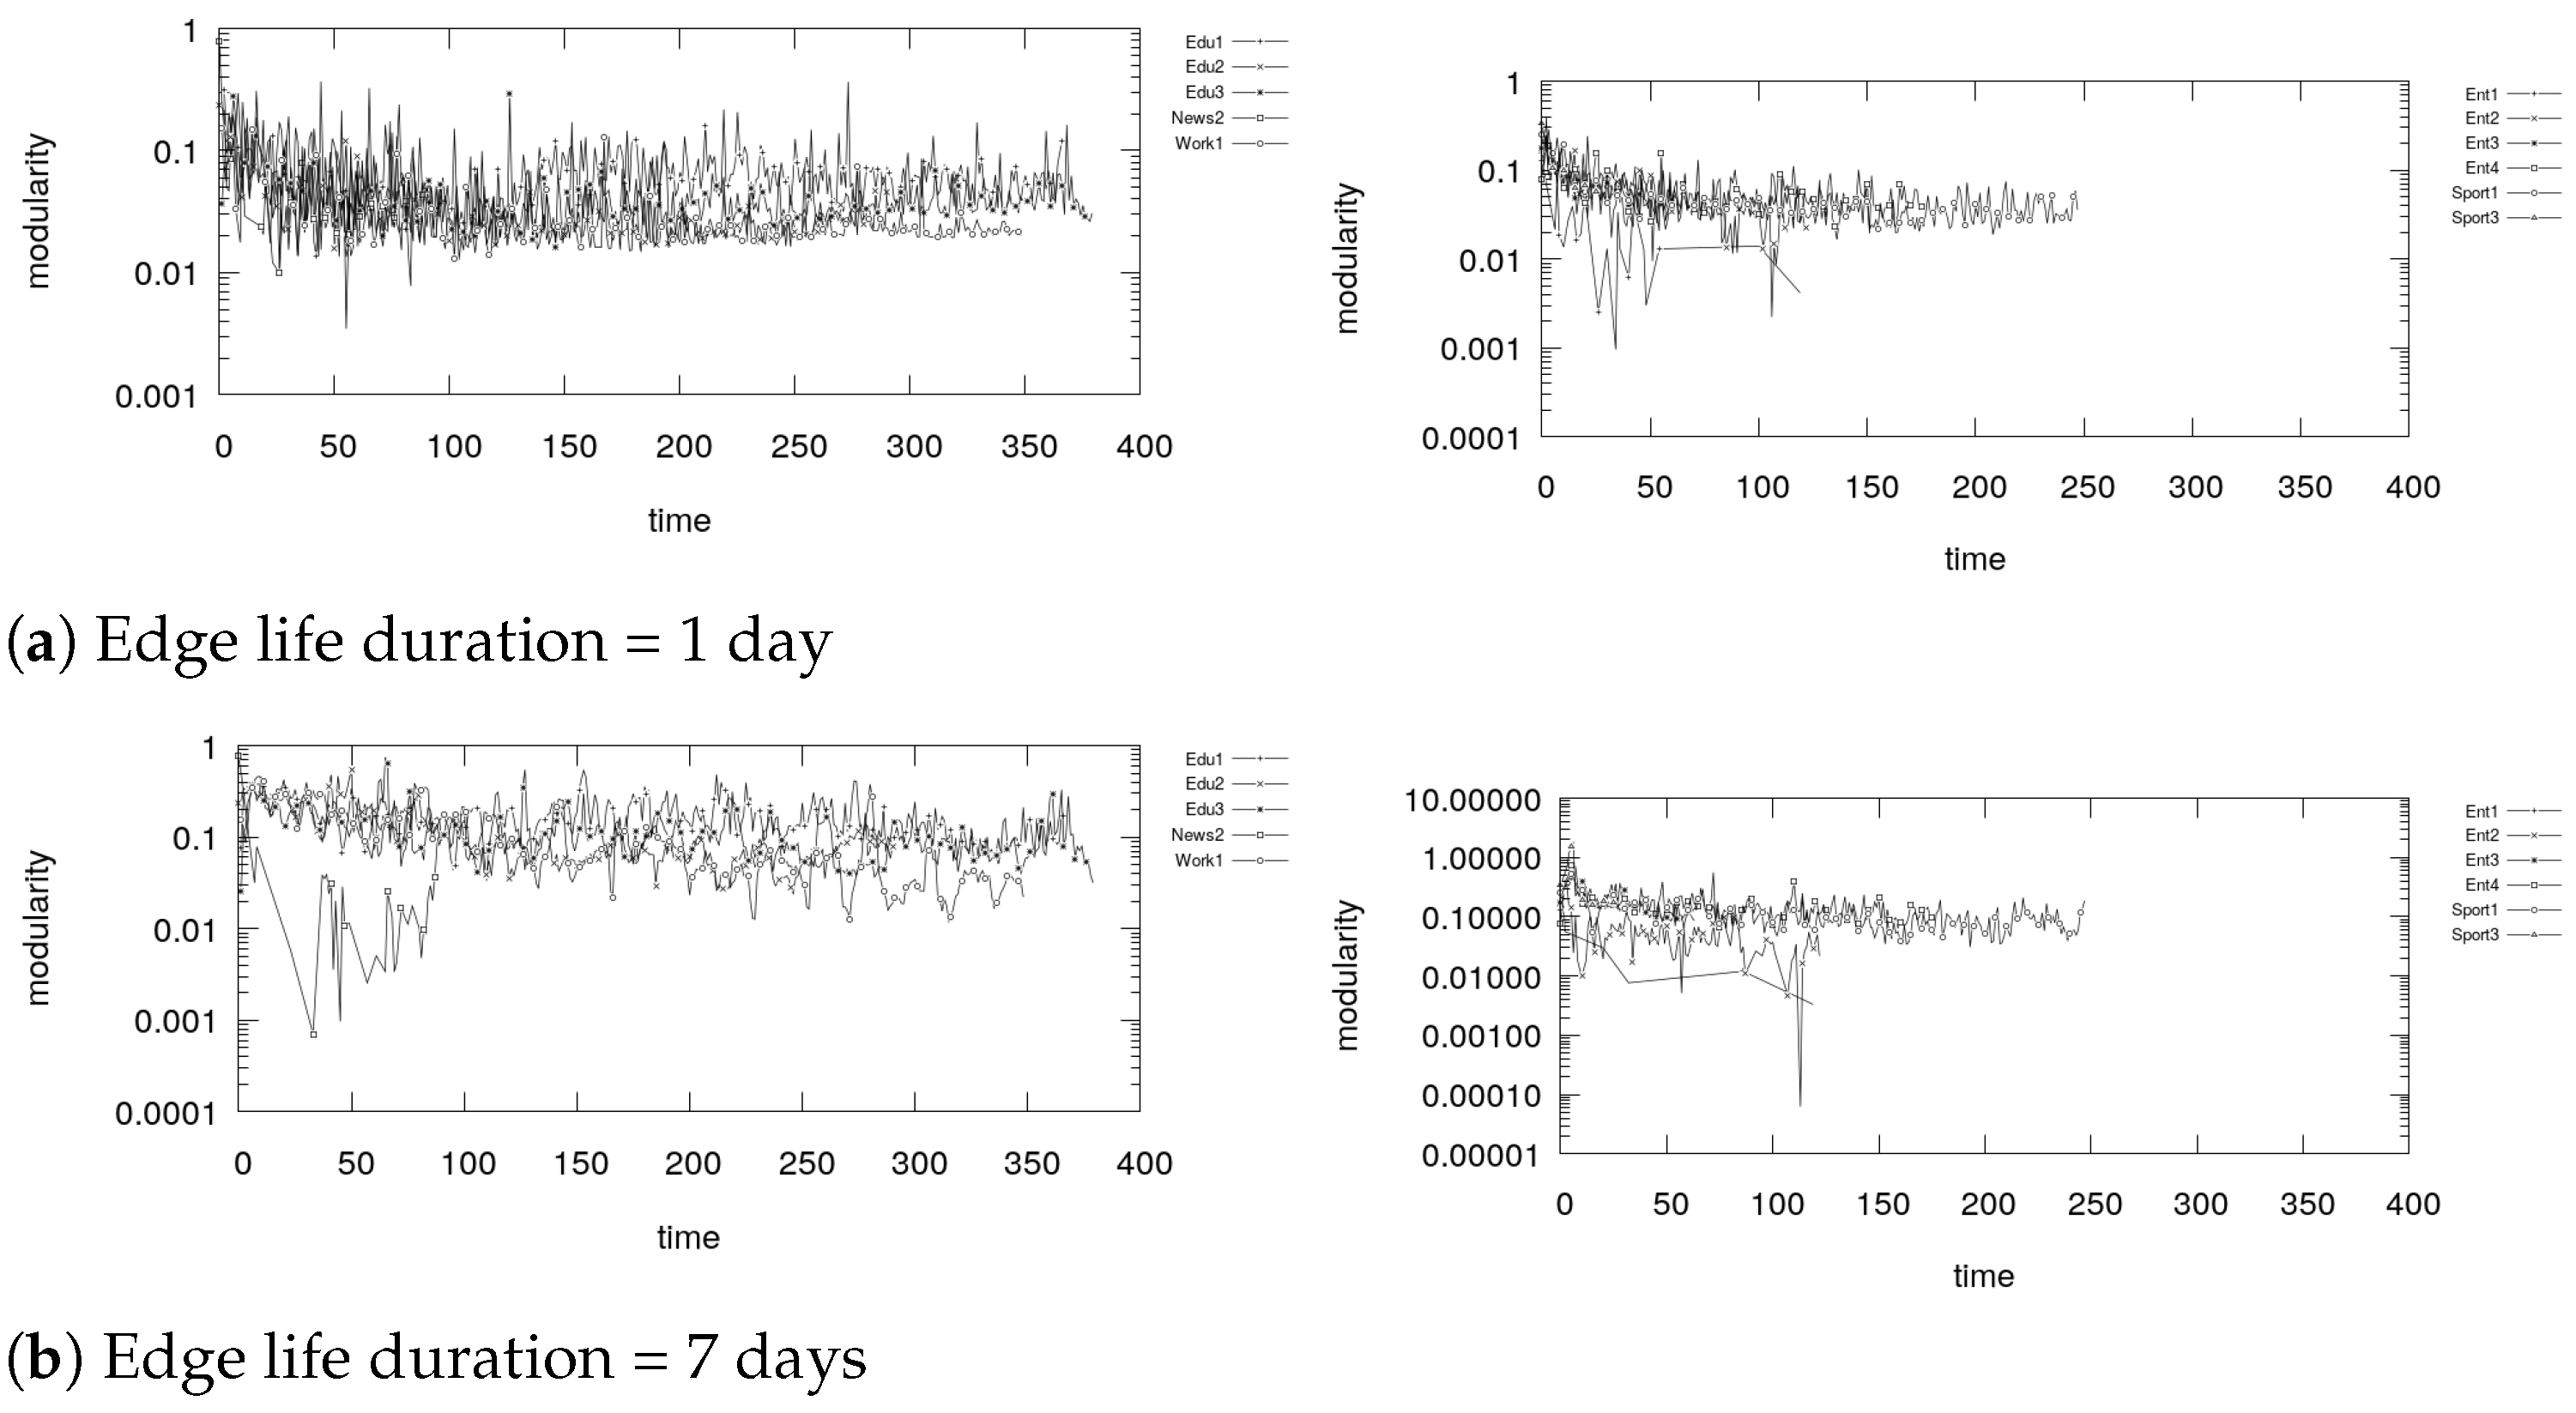
7.4. Dynamic Communities Analysis: Modularity
We conclude the study proposed in this paper with a detailed study of the community structure identified by the four community detection algorithms used in this paper. The structure is evaluated using modularity, which estimates how much a community structure is modular, the maximum conductance, to estimate how much the communities are well separated each other, and the minimum density, to estimate how well knit the communities detected by each approach are.
Figure 22, Figure 23, Figure 24 and Figure 25 show the modularity of the community structure detected by the selected algorithms in the groups considered. As expected, Fast Greedy is able to detect a community structure with a very high modularity score, as the algorithm is based on modularity optimization. The only exception in this algorithm is group News2, which has a low modularity score. An opposite result is achieved by K-core, which detects a community structure with an extremely low modularity score. This is a direct effect of the structure detected by the algorithm, which is similar to a clique. Indeed, modularity scores suffers greatly when the community structure detection is very strict, as in this case, but, on the other hand, may not be a good indicator if the network is made of several clique-like structures [35].
DEMON and TILES detect a community structure which is higher than K-core, but still very low. In few cases, namely Entertainment4 and Sport1, the modularity score slightly increases by the end of the simulations. Increasing the edge life duration helps in stabilizing the community structure, especially in the case of DEMON, while in the case of TILES slightly increases the modularity score.
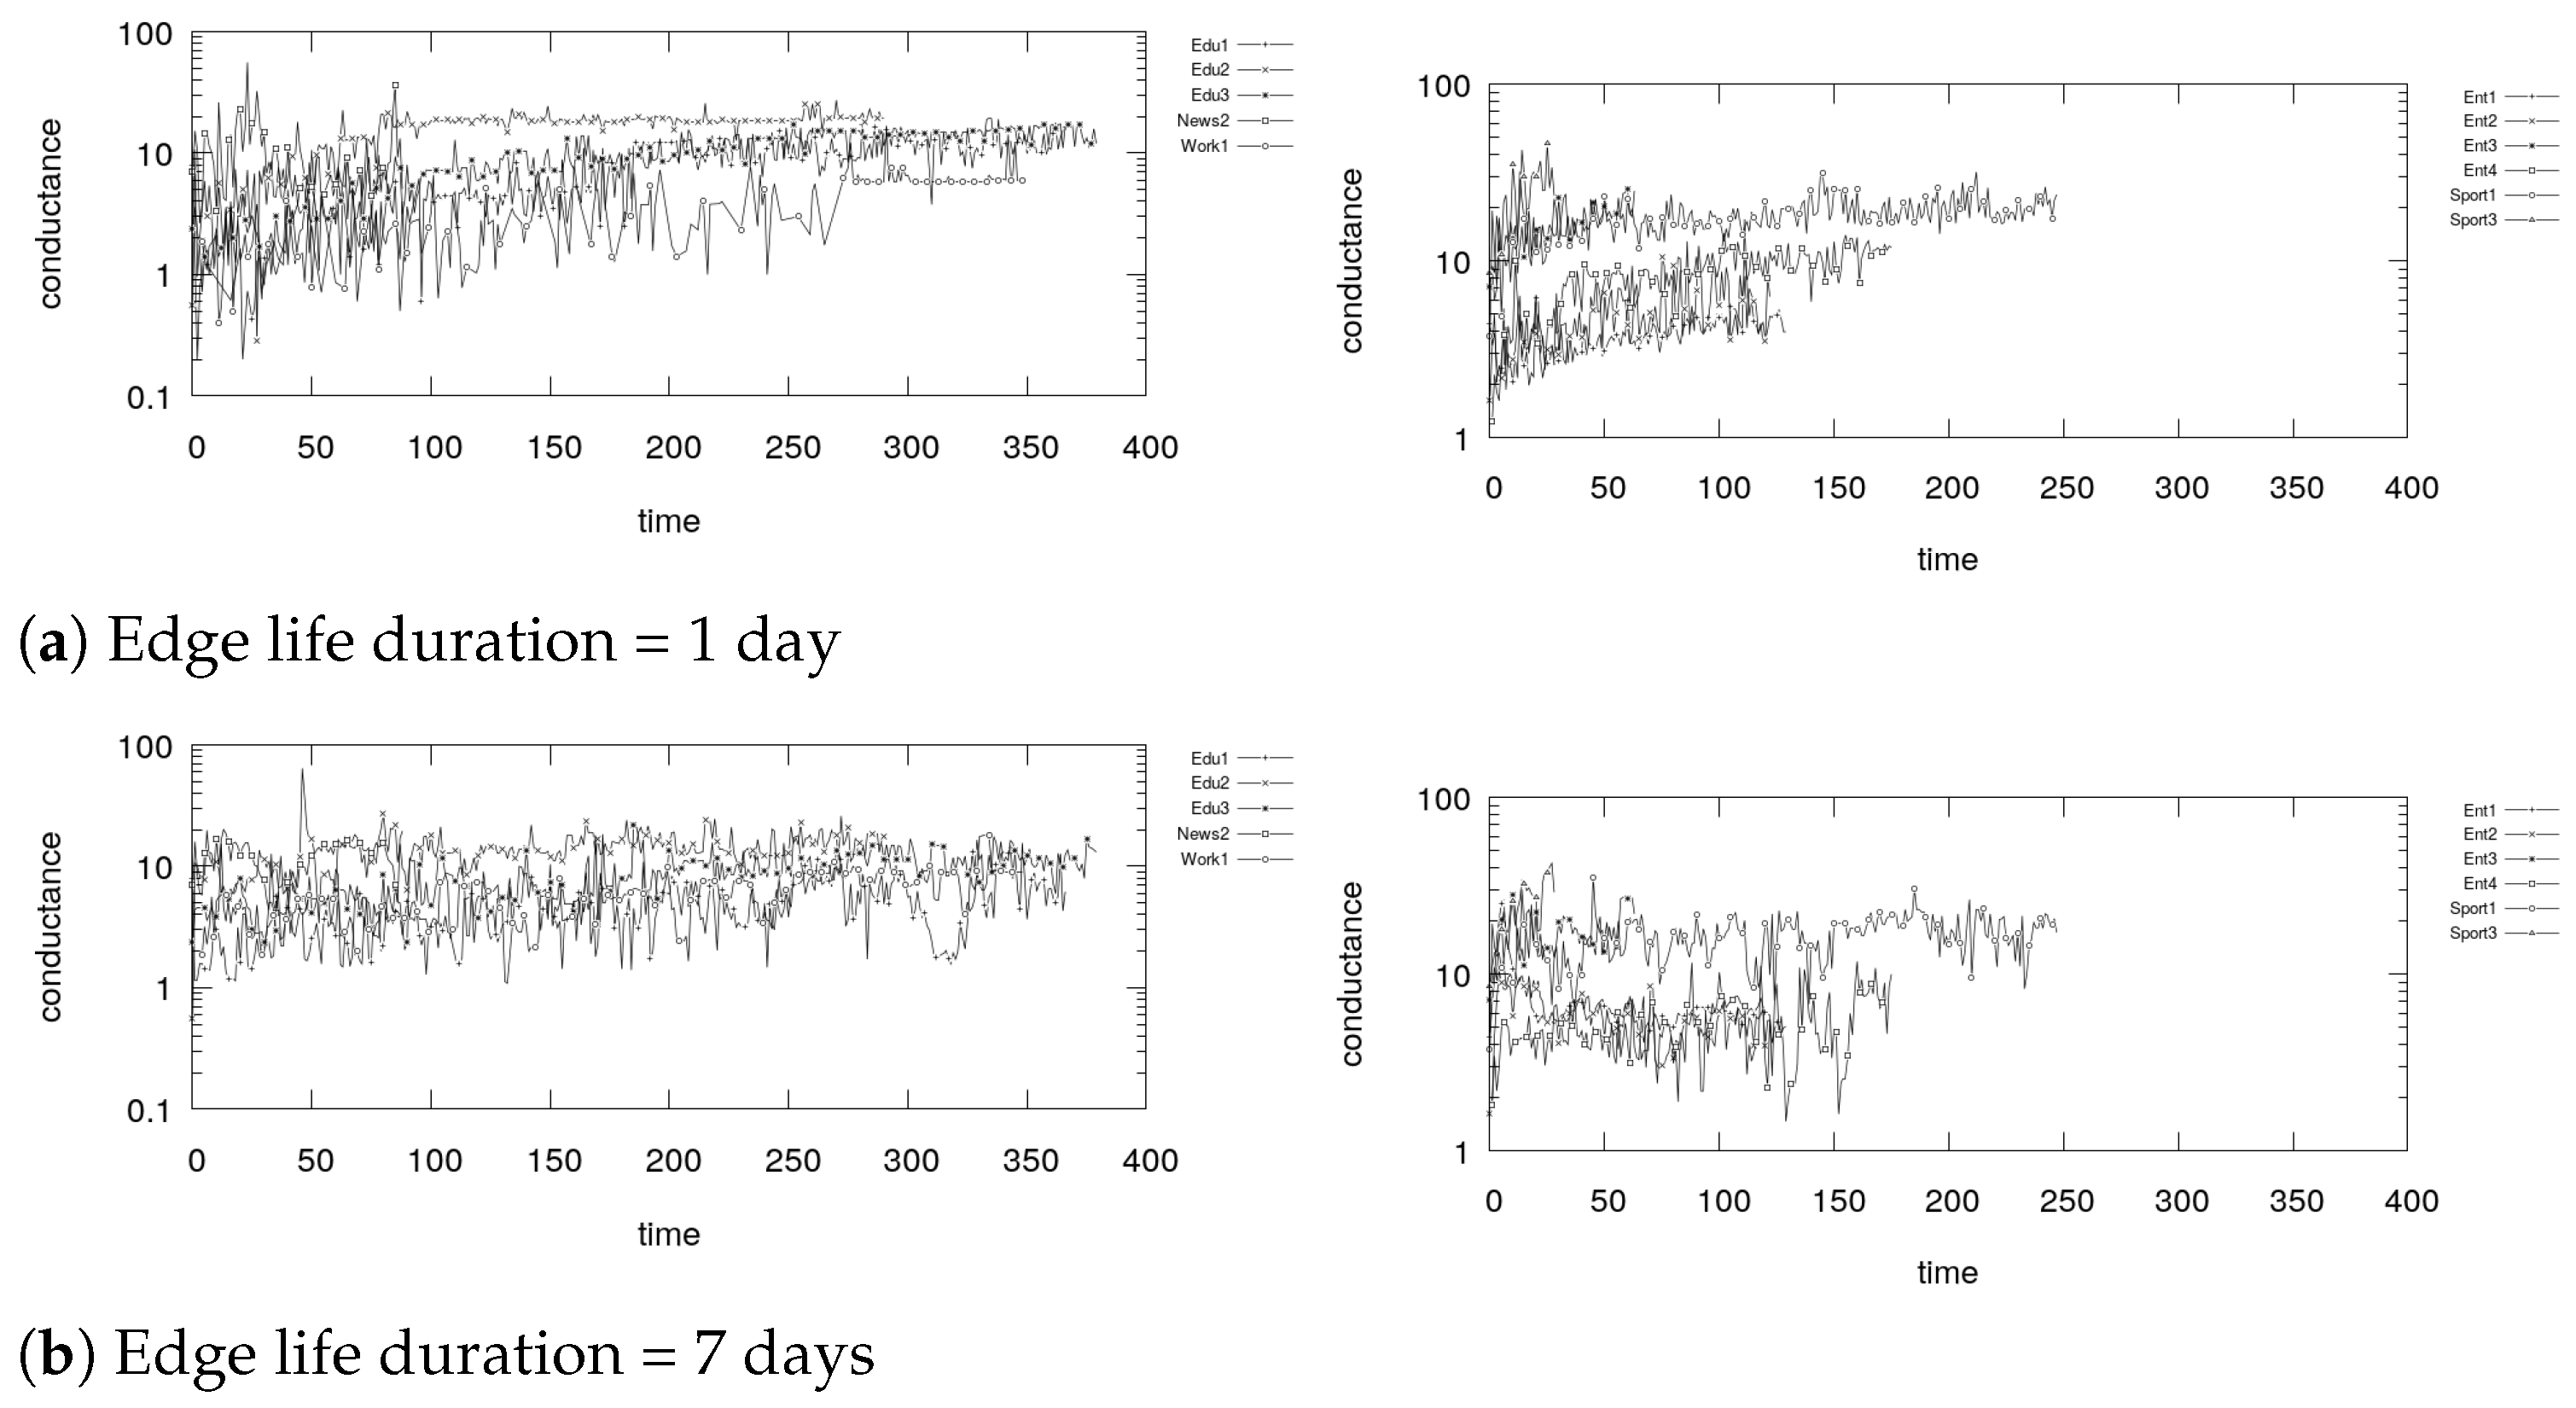
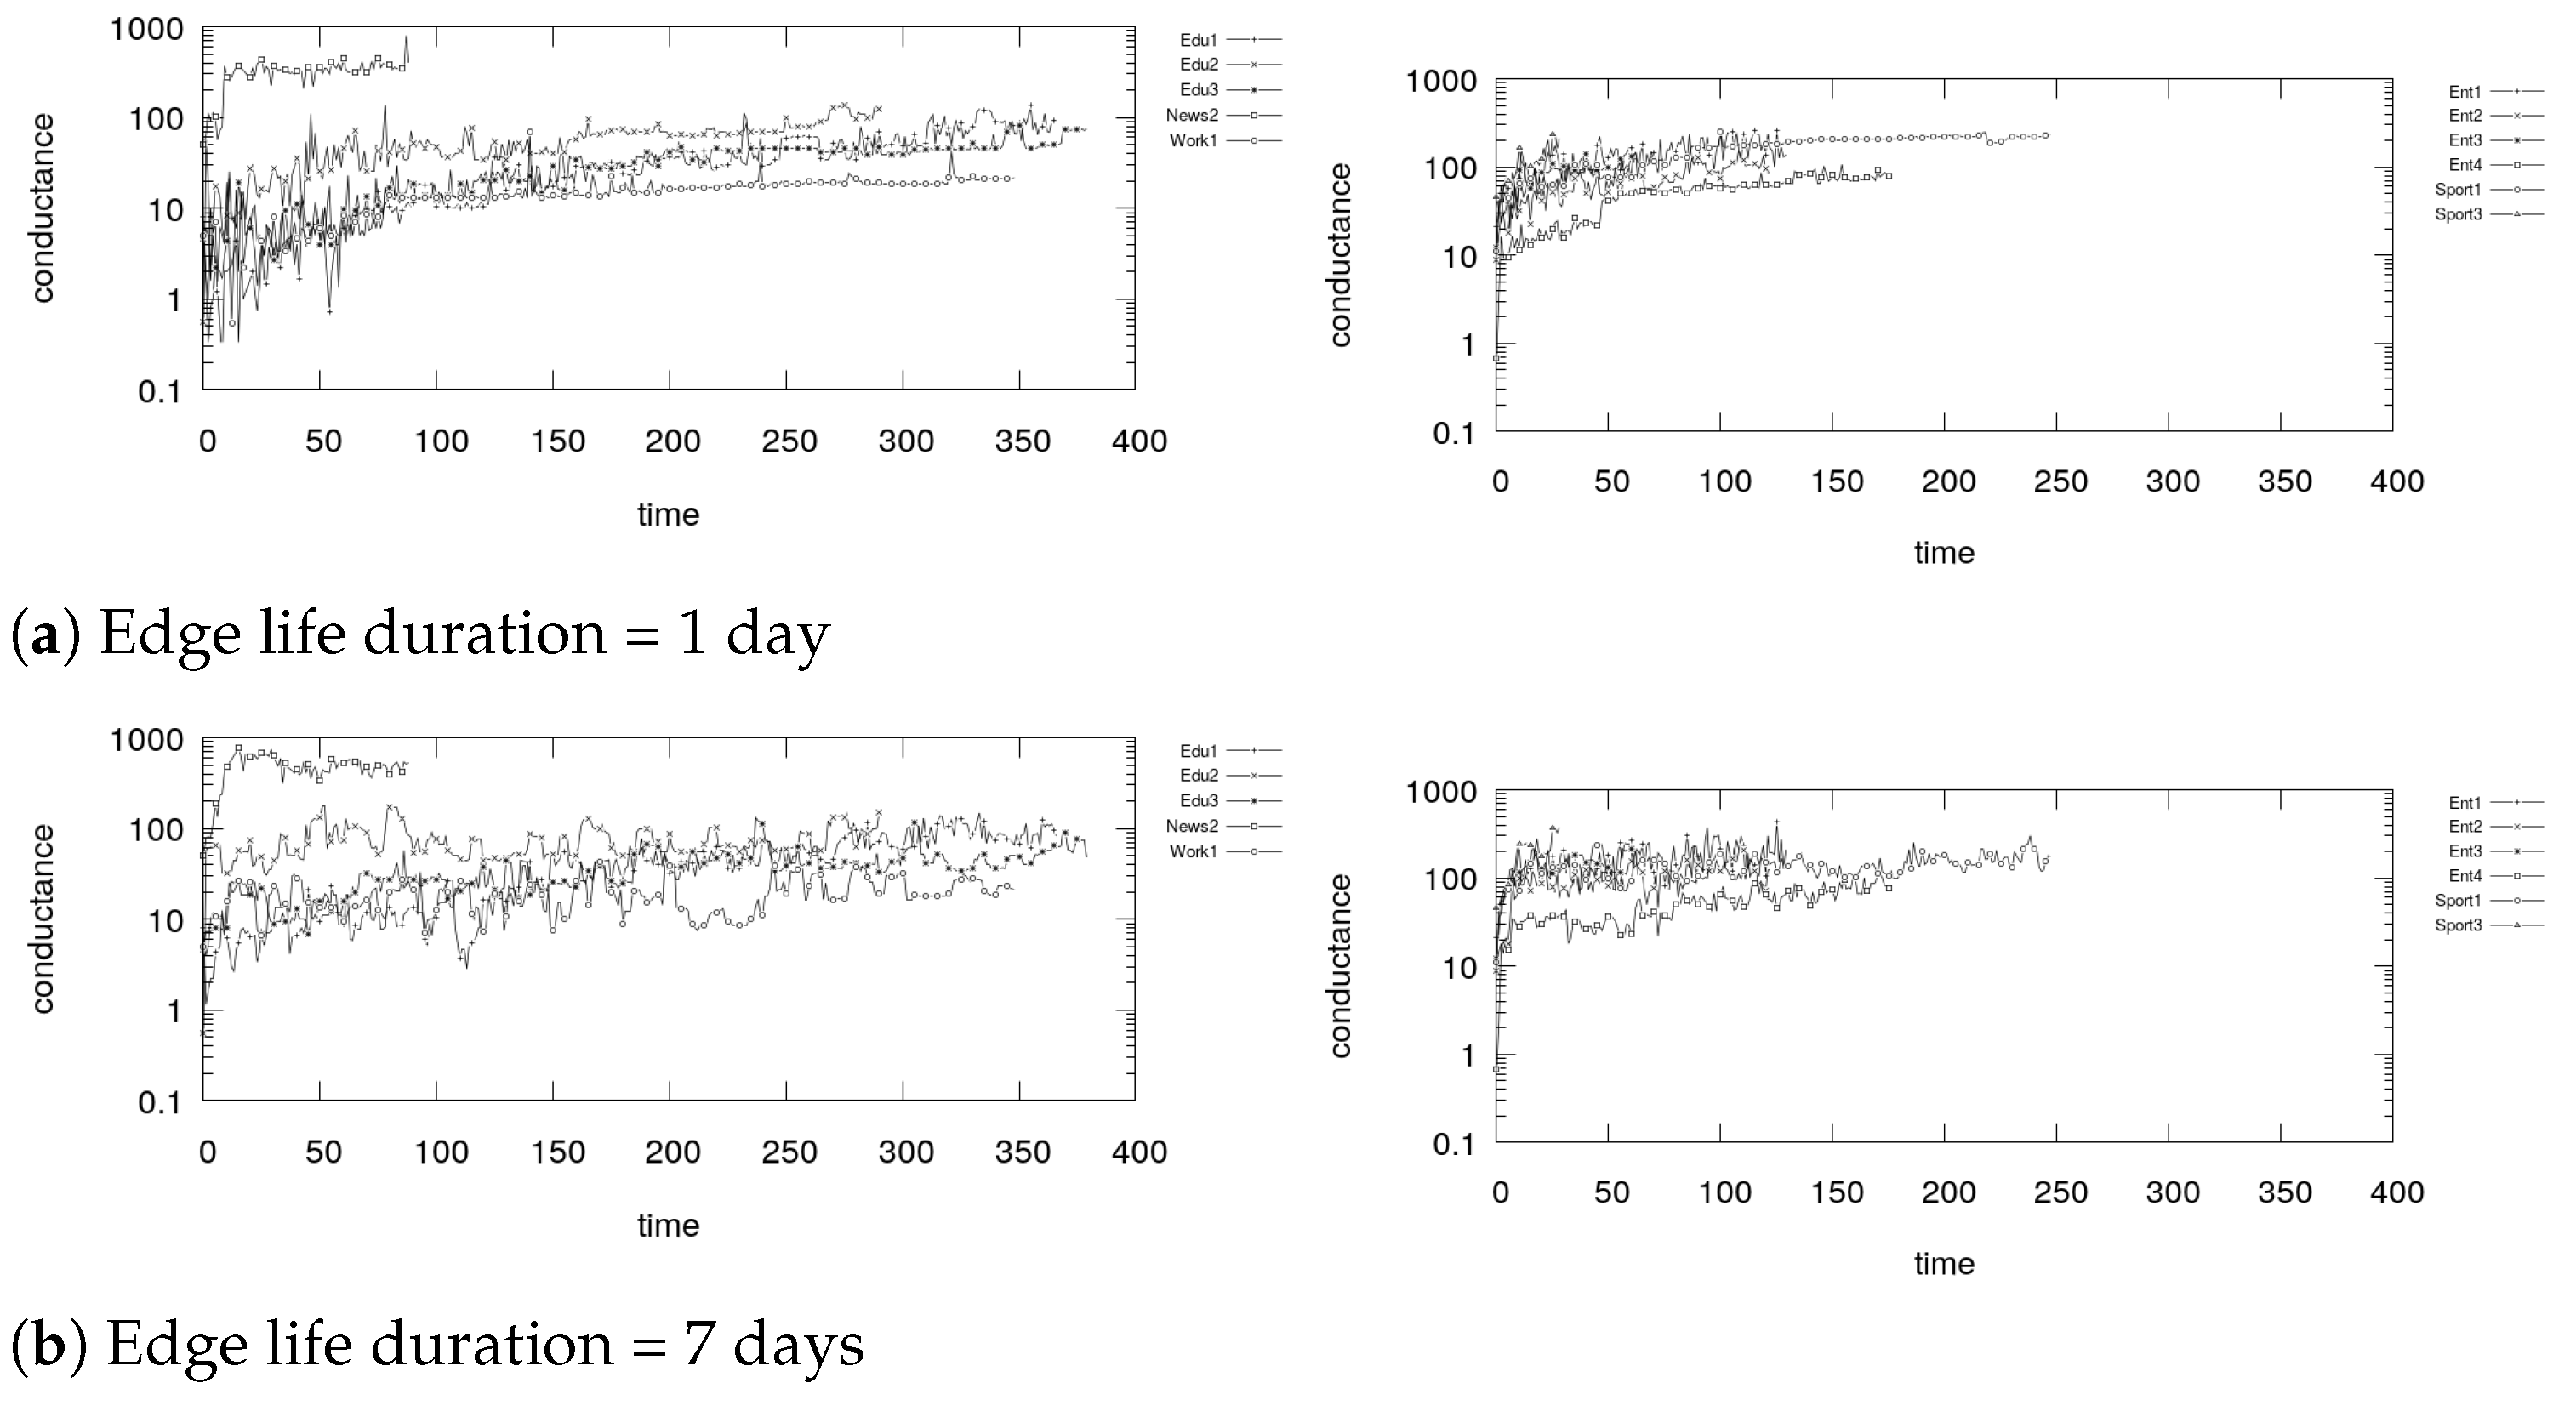
7.5. Dynamic Communities Analysis: Conductance
Figure 26, Figure 27, Figure 28 and Figure 29 show the conductance of the communities detected by the selected algorithms in the groups considered.
The values of conductance of the community structure detected by TILES are the highest, meaning that these communities are poorly separated to each other. The conductance starts with a high value and increase up to reaching 200, and a longer edge life time has no noticeable impact. This worse score is an effect of the way the algorithm works, which re-evaluates the community structure only locally to where the edges are added or removed, thus leading to situation where two sets of nodes are tightly connected but they make two different communities. The communities detected by DEMON and K-core achieve similar results, while the best (lowest) results are once again obtained by Fast Greedy.
If we consider a longer edge duration time, the conductance scores increase for all algorithms but TILES. This result can be ascribed to the ability of TILES to manage better the dynamism of the edges, and therefore can create communities that are more resistant to the test of time. Instead, the other algorithms suffer the fact that each time the community structure must be computed from scratch. Interestingly enough, the groups in the Entertainment category and the groups Sport1 and Sport3 suffer more from a longer edge life duration. Additionally, once again, the group News2 achieve the worst score, highlighting how the interaction in that group is not so well structured.
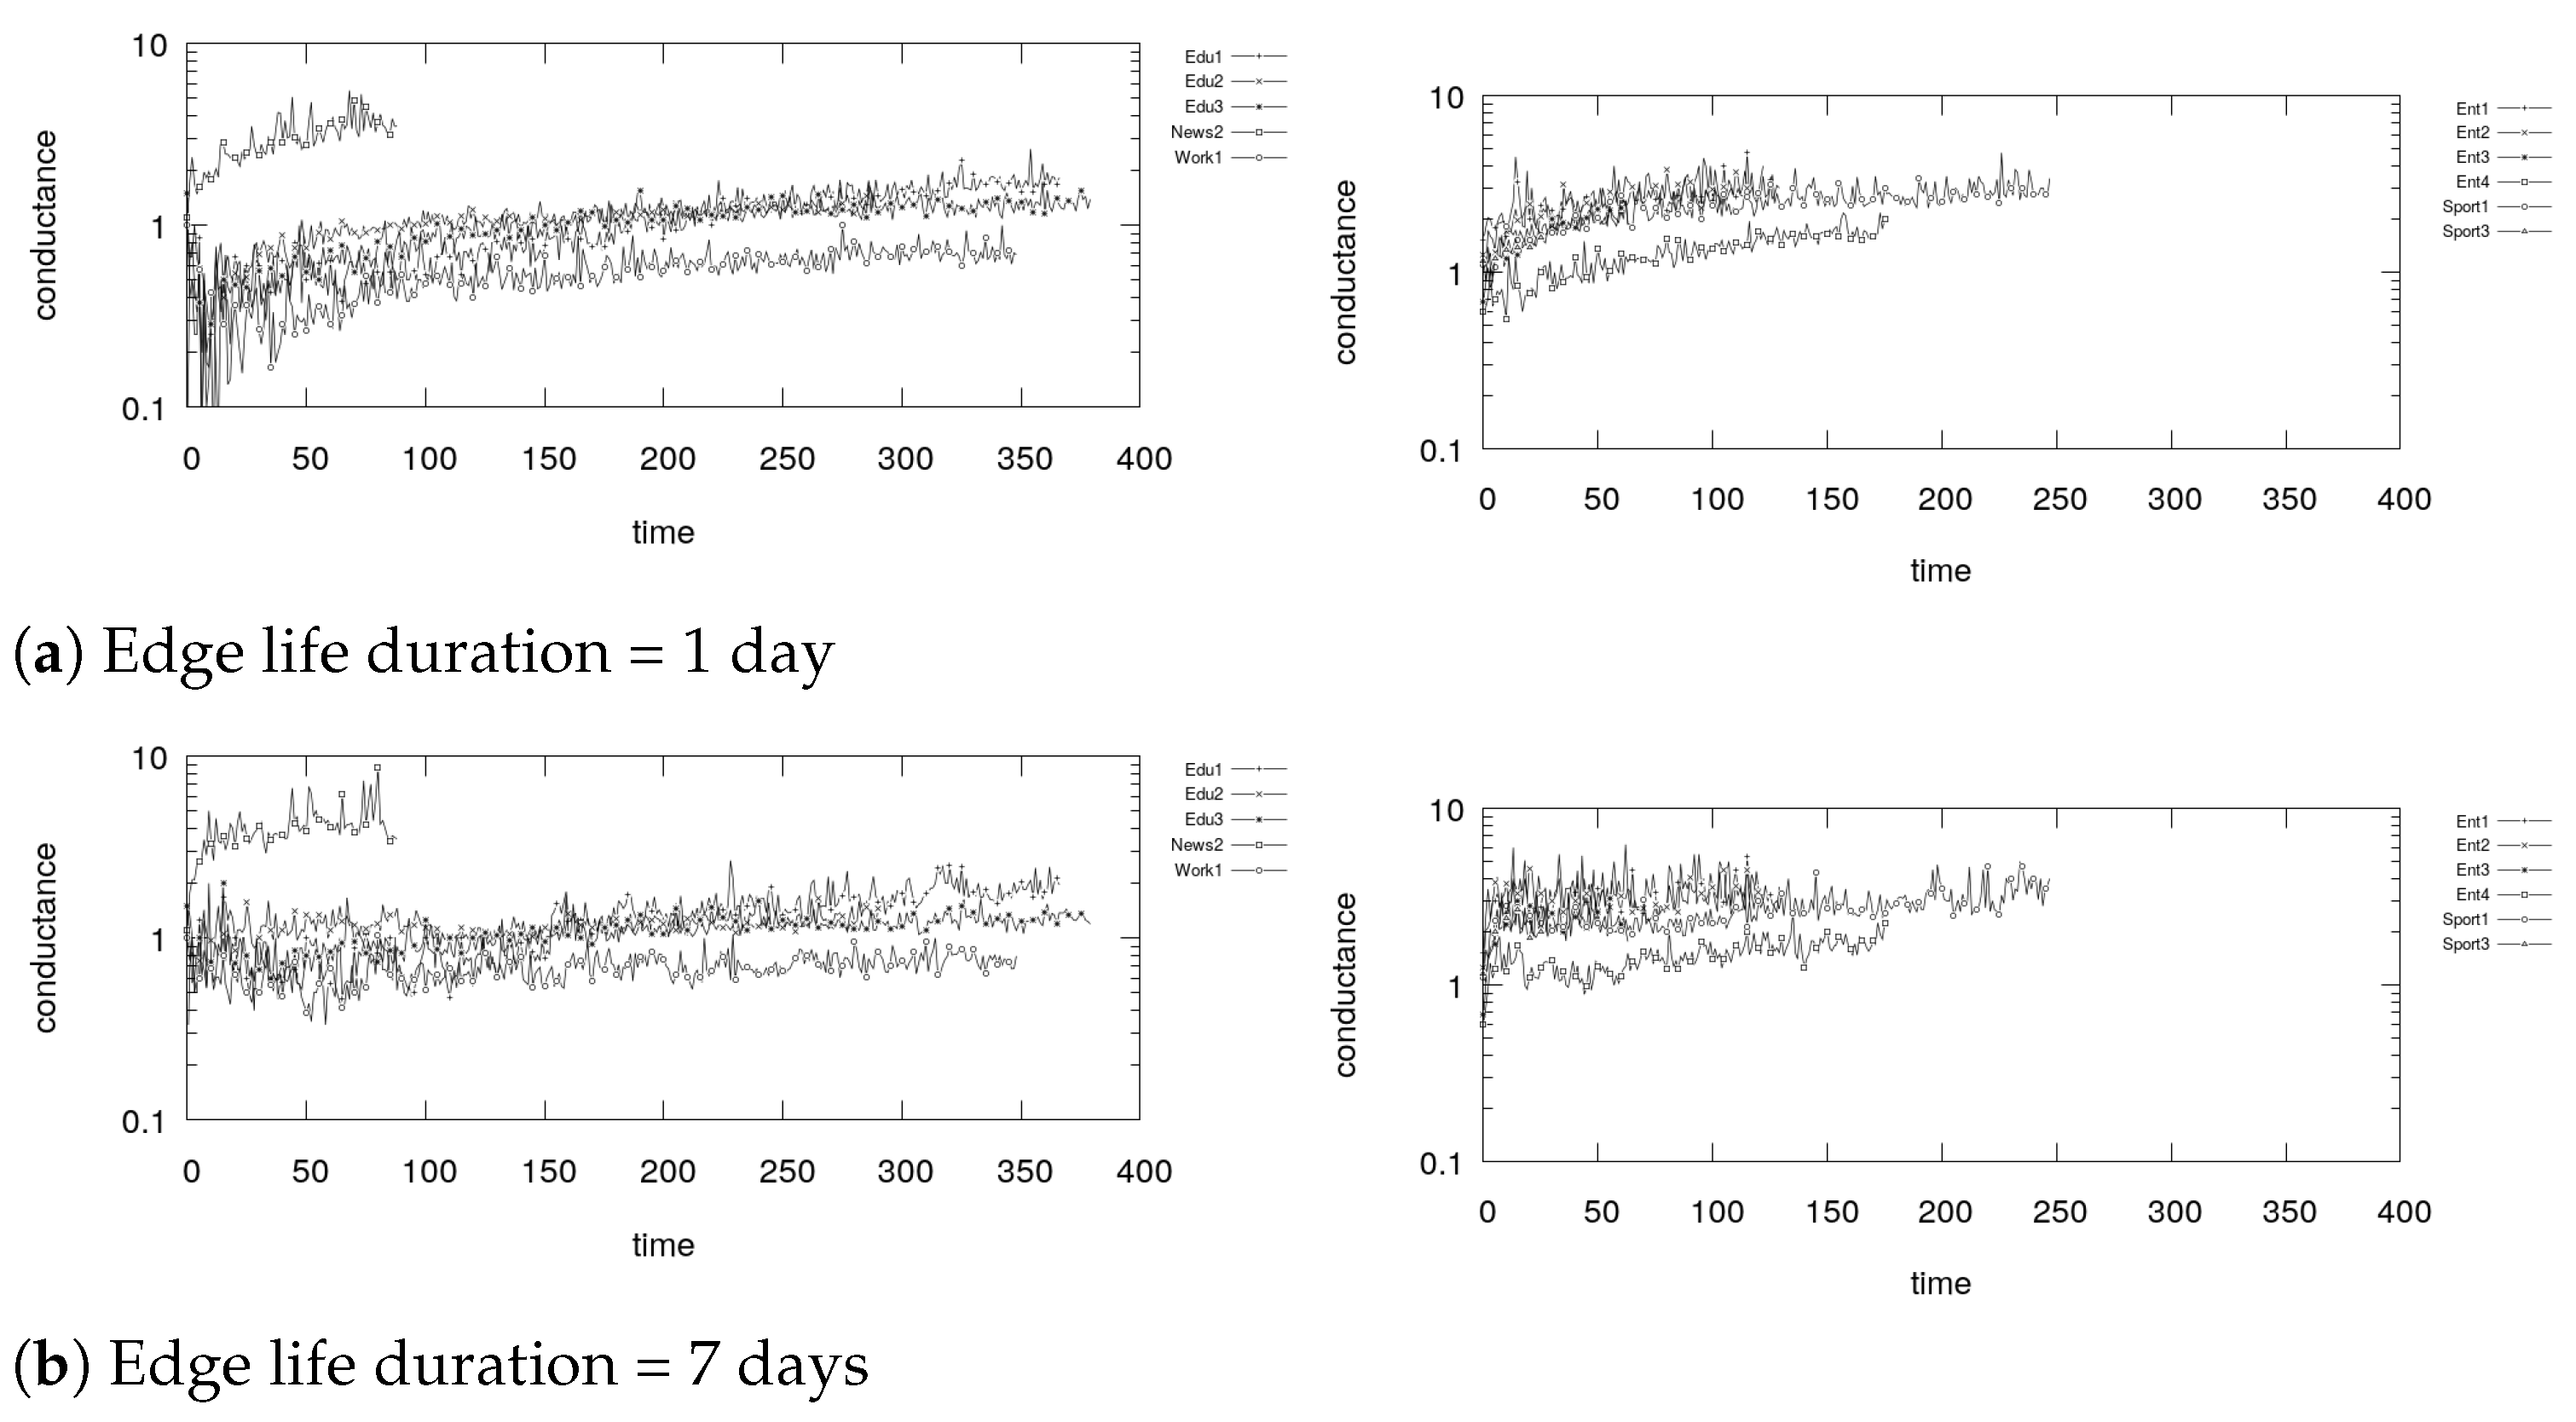
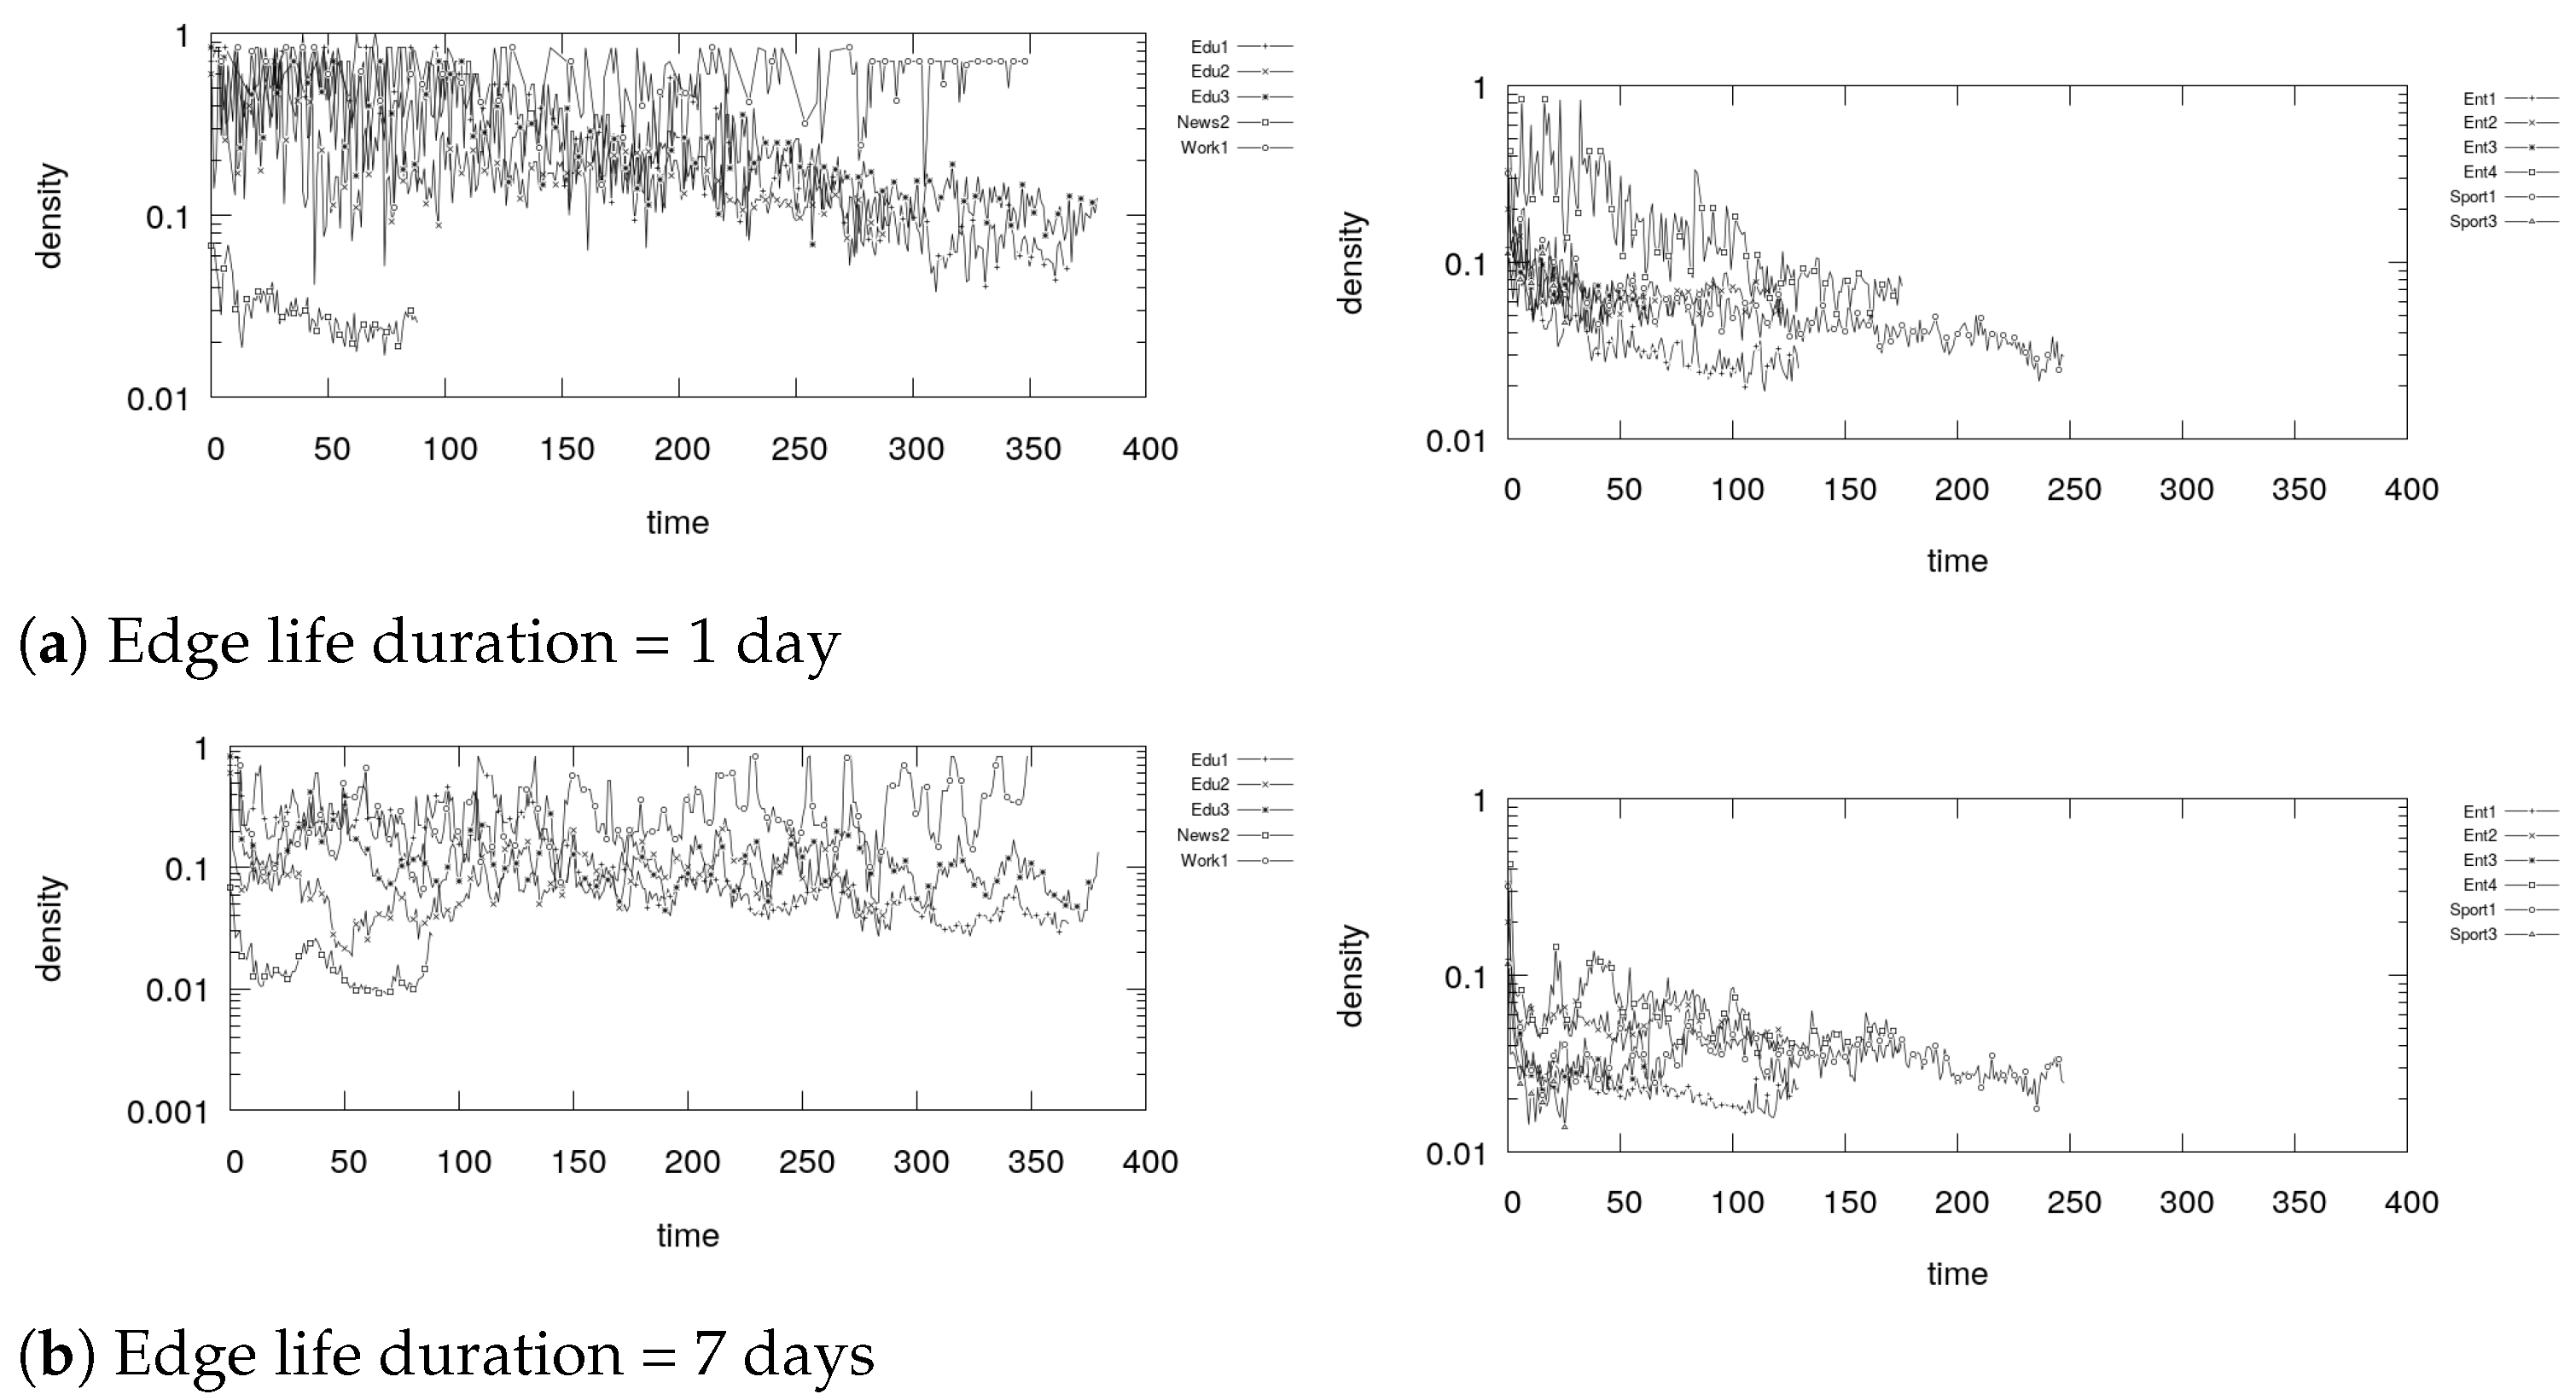
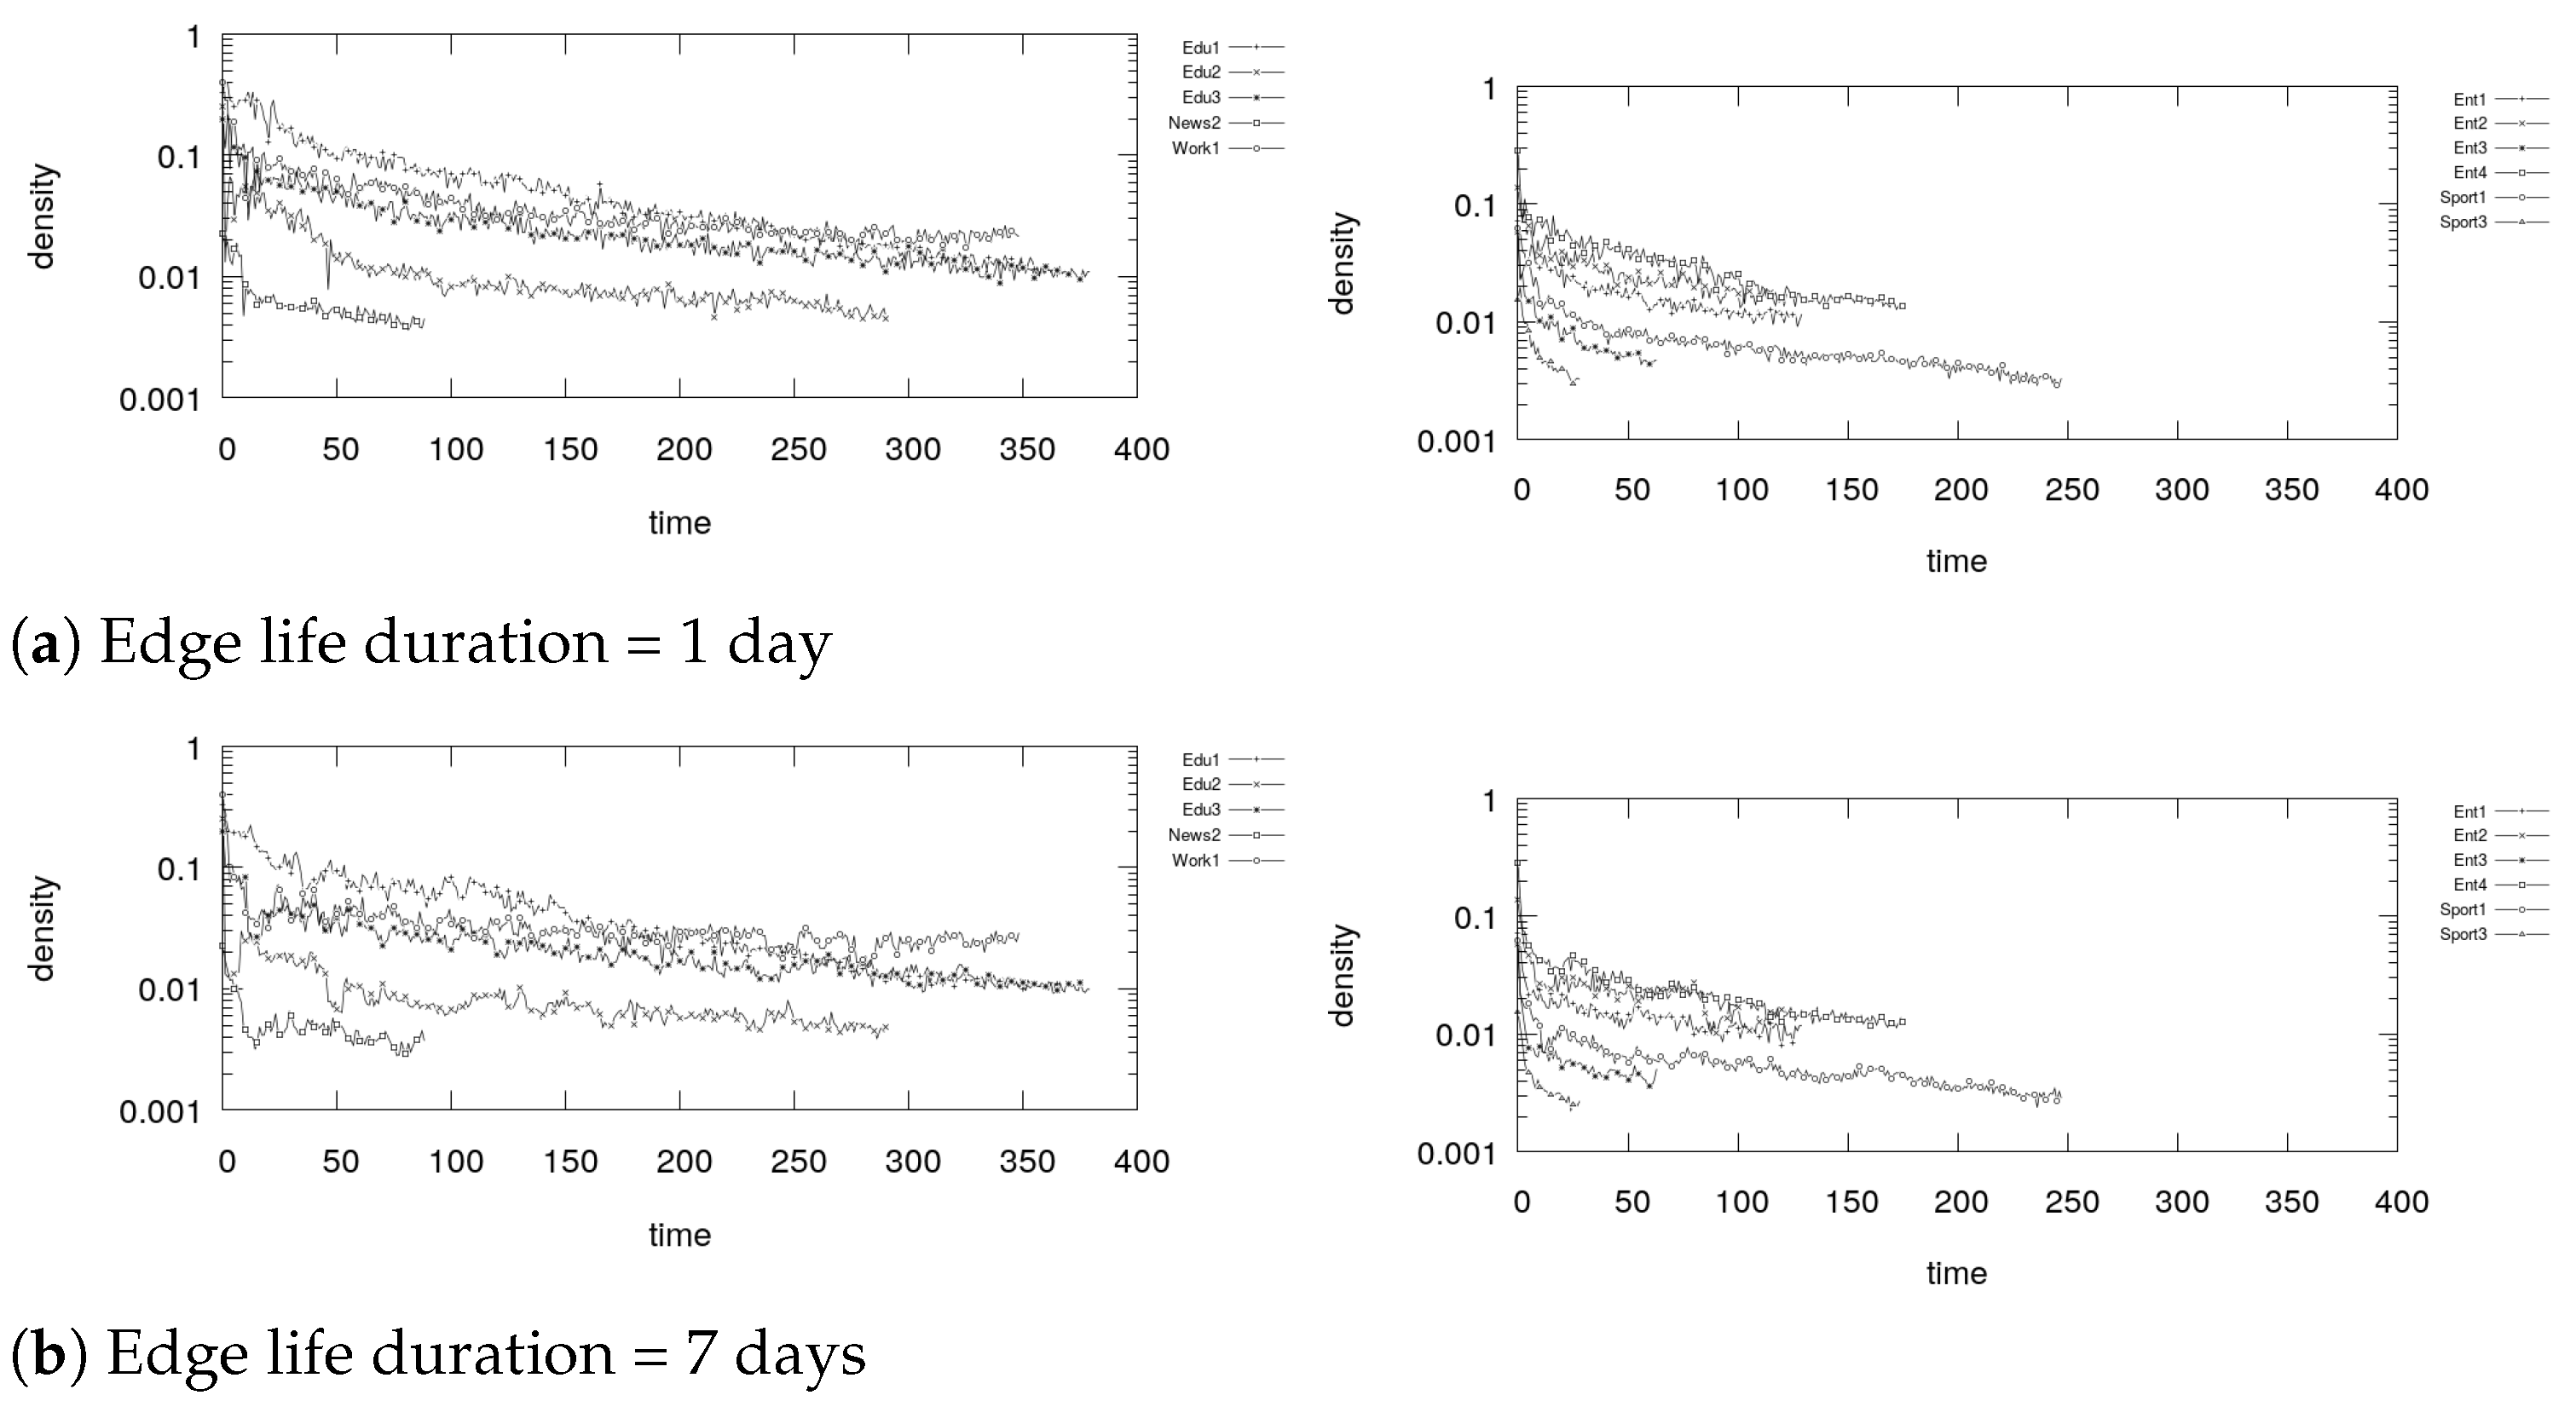
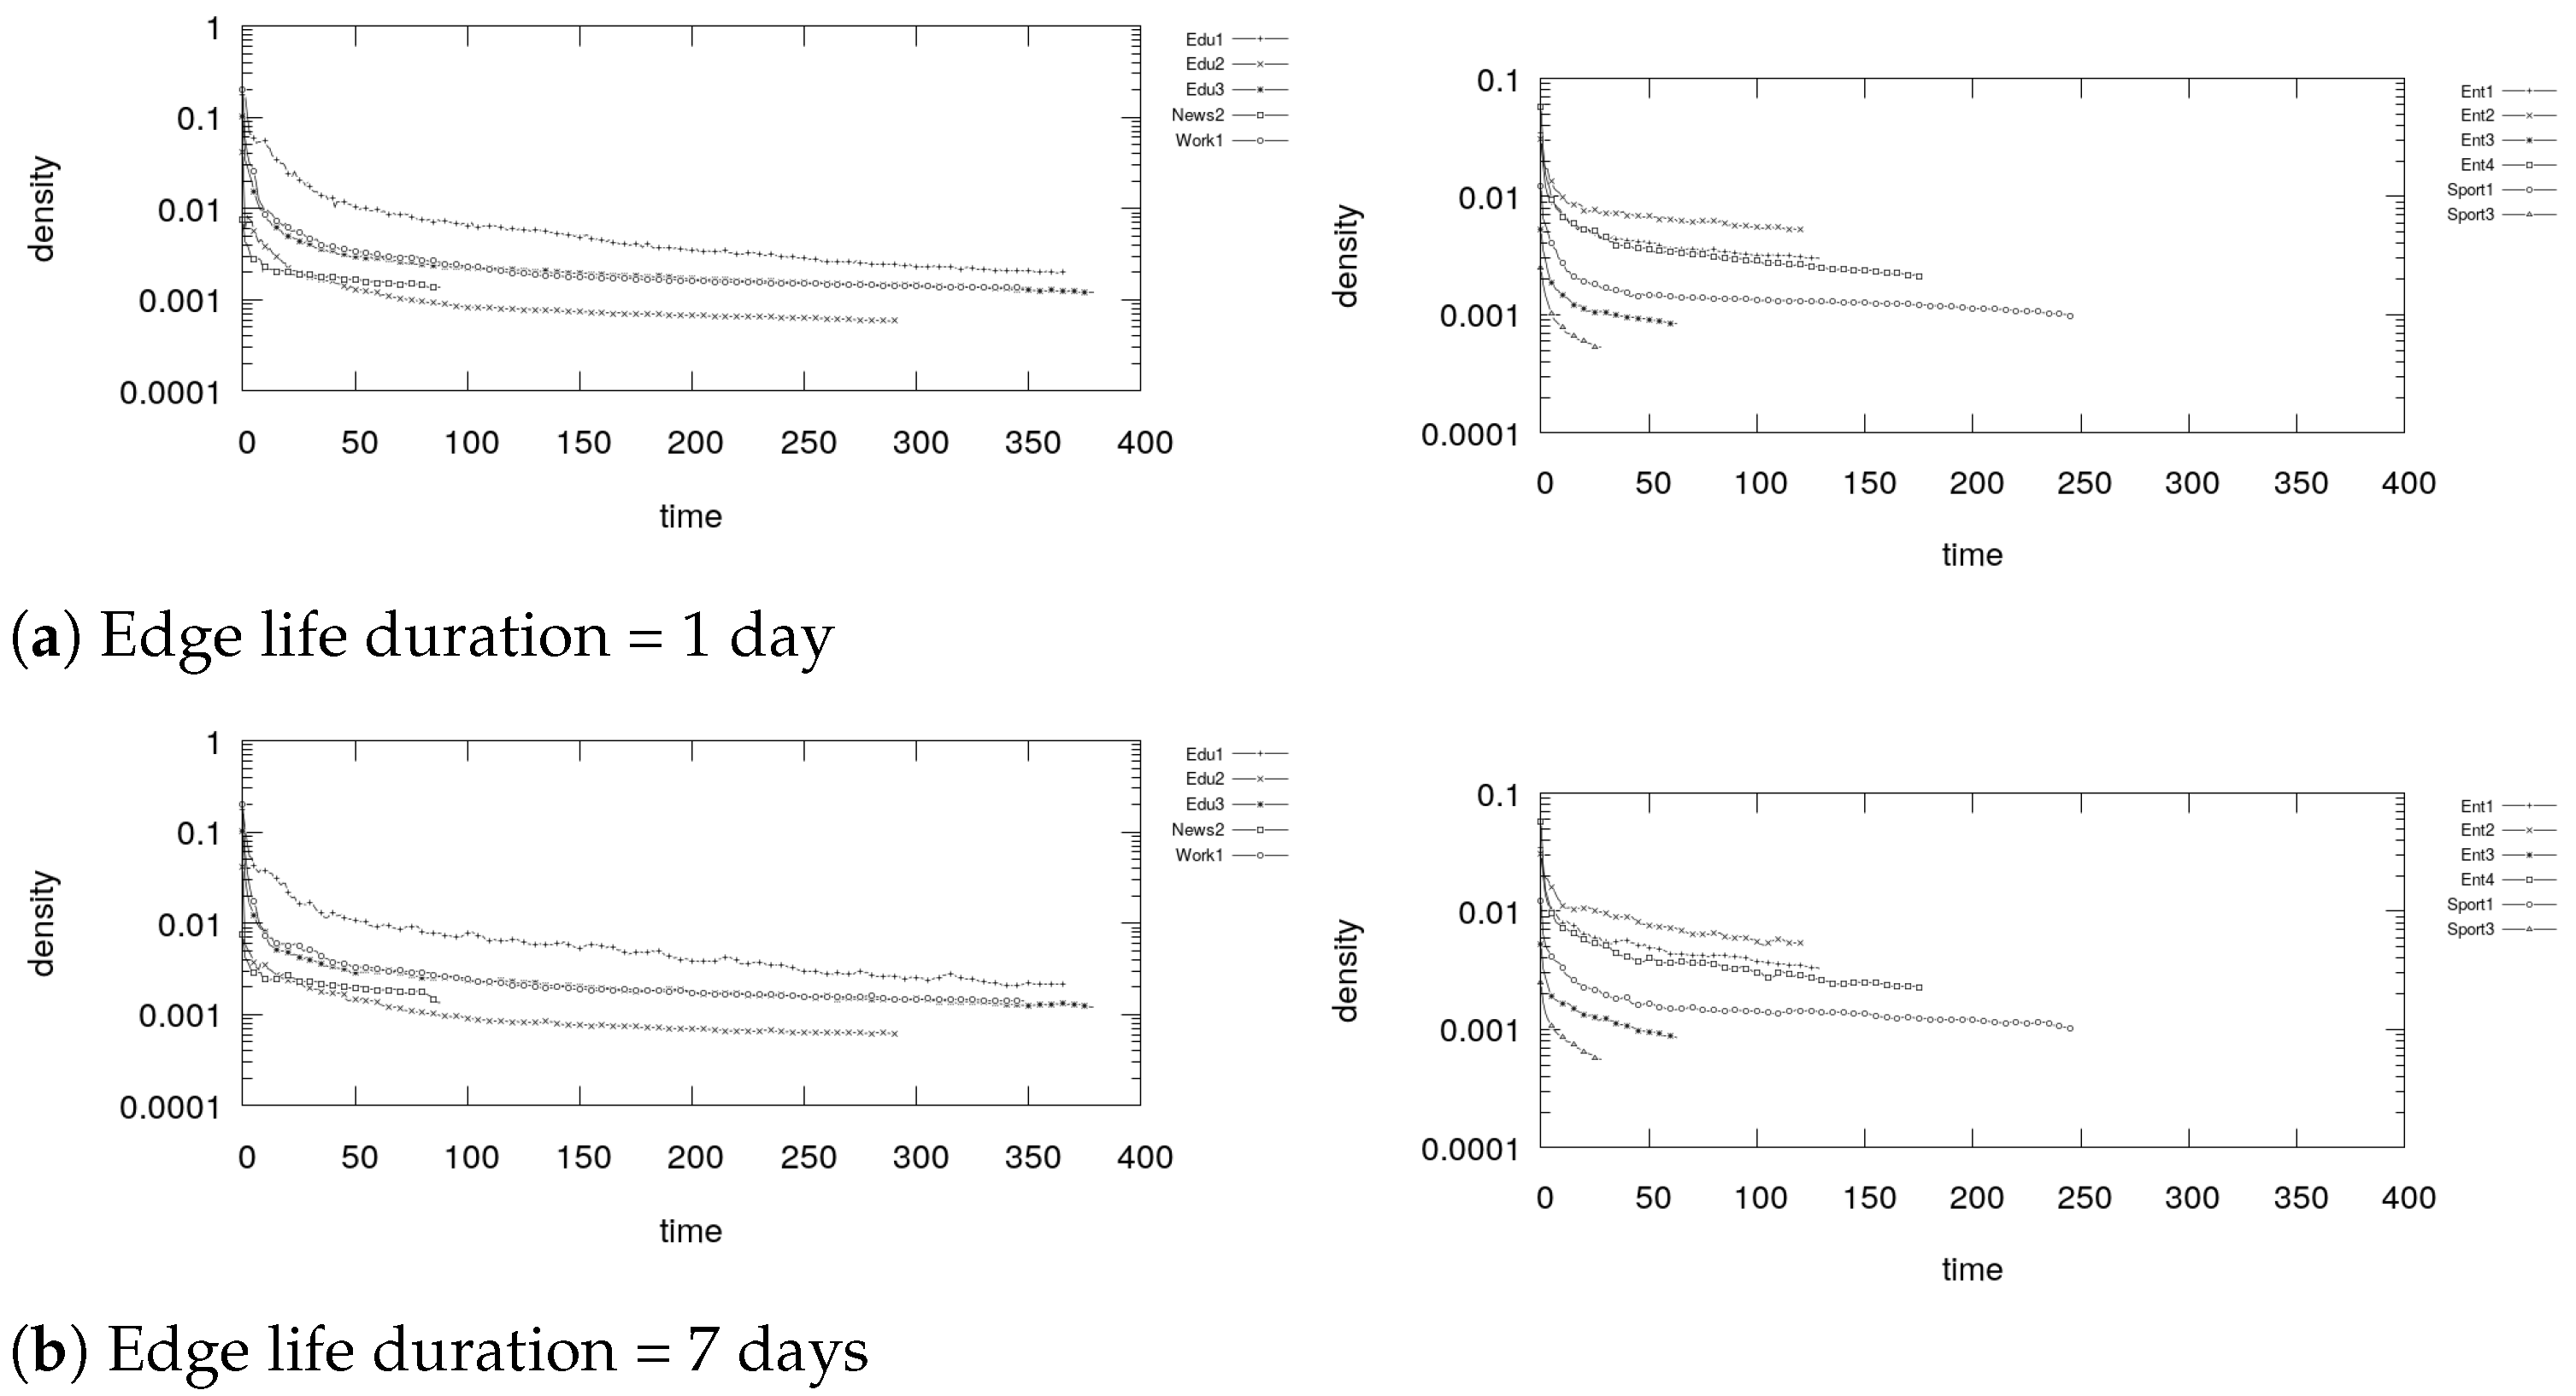
7.6. Dynamic Communities Analysis: Internal Density
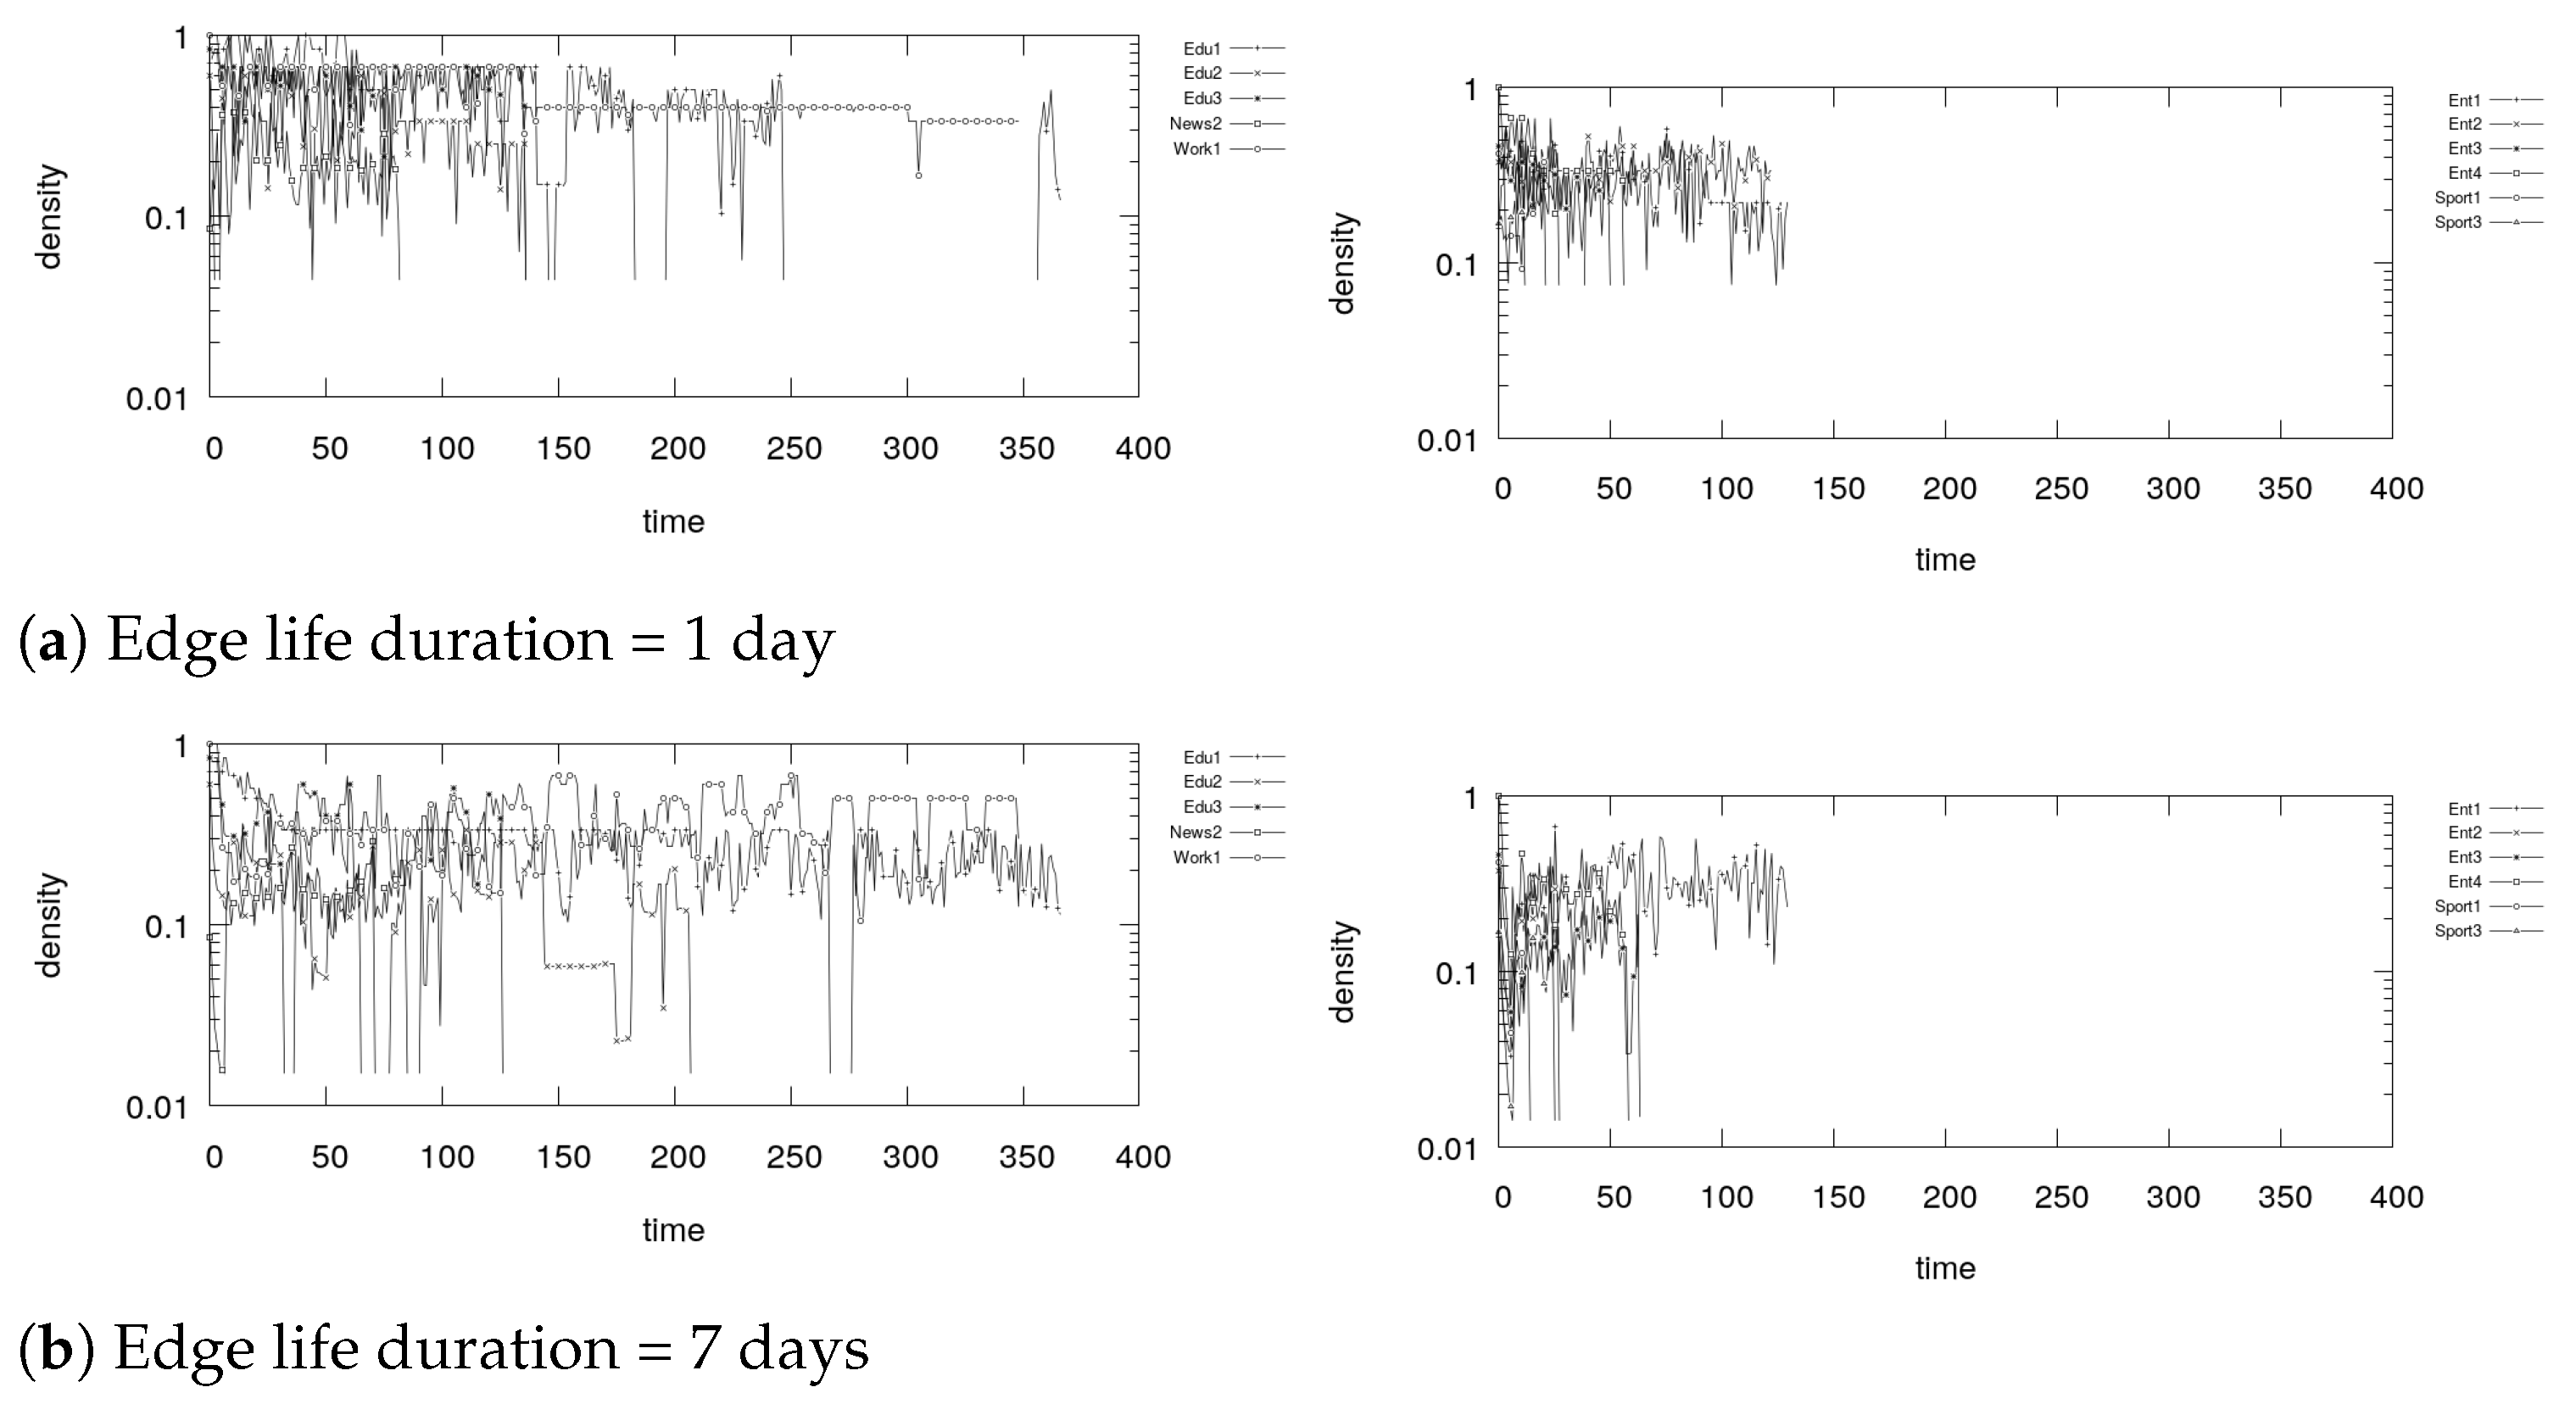
Figure 30, Figure 31, Figure 32 and Figure 33 show the internal density of the communities detected by the selected algorithms in the groups considered.
As we can see from the plots, Fast Greedy and K-core achieve significant values of internal density. Indeed, in the first case the internal density values range from to , and in case we set the edge life duration to 7 days we obtain similar results. In the latter case values are sensibly lower, ranging from to , which is clearly an effect of the structural definition of the community adopted in this case.
In the case of DEMON and TILES, we notice that values are much higher, which is connected to the community structure that is made of smaller communities. Overall, we can see that the internal density of the communities tend to lower over time, which is a sign that nodes can join existing communities. Additionally, the plots show that with a longer edge life duration the internal density achieved by most of the community structures is only slightly less.
8. Conclusions and Future Works
In this paper we studied the dynamic interaction structure of OSGs in terms of dynamic community detection. Eight, well known, community detection algorithms were exploited to analyse a dataset of Facebook Groups. The analyses were carried out using two different approaches for dynamic community detection: the Instant-Optimal and the Temporal Trade-off. The dataset is made of the stream of interactions of 17 Facebook Groups. For each group, we performed two sets of experiments, one for each edge life duration we decided to study: 1 day and 7 days.
Findings show that the interaction communities are fragmented, meaning that several discussions happen at the same time within the groups. The choice of the algorithm greatly influences the community structure detected, and through an analysis of three quality measures, we come to the conclusion that modularity optimization and structural definitions are the best in this scenario. Additionally, we notice with a longer edge life duration, the interaction network becomes more stable in terms of number of communities and in terms of nodes belonging to these communities. However, setting a longer edge life duration does not necessarily bring the community structure to a single community, confirming the existence of numerous parallel discussion groups, which are made of cores of users that interact daily.
As future work, we plan to study more in detail the dynamic community structure using more sophisticated techniques and measures, in order to highlight other important properties of OSGs. We plan to investigate more in detail the structure of the communities, by studying different features, such as the size of the communities, and their composition, and the whole lifecycle of the communities. Furthermore, we plan to analyse the role and the activity of central nodes in the community structure by using appropriate measures [55]. Finally, we plan to investigate the effects of community events, and a more detailed view of the community lifespan and of the nodes composing each community at each stage of its lifecycle.
Author Contributions
Conceptualization, B.G. and A.M.; Data curation, A.M.; Investigation, A.M.; Methodology, B.G. and A.M.; Supervision, B.G.; Writing—original draft, B.G. and A.M.; Writing—review & editing, B.G. and A.M. All authors have read and agreed to the published version of the manuscript.
Funding
This research received no external funding.
Data Availability Statement
The data presented in this study are available on request from the corresponding author. The data are not publicly available due to privacy reasons.
Conflicts of Interest
The authors declare no conflict of interest.
References
- Miranda, J.; Mäkitalo, N.; Garcia-Alonso, J.; Berrocal, J.; Mikkonen, T.; Canal, C.; Murillo, J.M. From the Internet of Things to the Internet of People. IEEE Internet Comput. 2015, 19, 40–47. [Google Scholar] [CrossRef]
- De Salve, A.; Guidi, B.; Ricci, L. Evaluation of Structural and Temporal Properties of Ego Networks for Data Availability in DOSNs. Mob. Netw. Appl. 2018, 23, 155–166. [Google Scholar] [CrossRef] [Green Version]
- De Salve, A.; Dondio, M.; Guidi, B.; Ricci, L. The impact of user’s availability on on-line ego networks: A facebook analysis. Comput. Commun. 2016, 73, 211–218. [Google Scholar] [CrossRef]
- Guidi, B.; Michienzi, A.; Ricci, L.; Ambriola, V. Analysing Dunbar Circles in Facebook Groups. In Proceedings of the IEEE Consumer Communications and Networking Conference 2021, Las Vegas, NV, USA, 9–12 January 2021. in press. [Google Scholar]
- Guidi, B.; Michienzi, A.; Ricci, L. A Graph-Based Socioeconomic Analysis of Steemit. IEEE Trans. Comput. Soc. Syst. 2020, 1–12. [Google Scholar] [CrossRef]
- De Salve, A.; Guidi, B.; Michienzi, A. Studying Micro-communities in Facebook Communities. In Proceedings of the 4th EAI International Conference on Smart Objects and Technologies for Social Good, Goodtechs ’18, Bologna, Italy, 28–30 November 2018; pp. 165–170. [Google Scholar]
- Girvan, M.; Newman, M.E. Community structure in social and biological networks. Proc. Natl. Acad. Sci. USA 2002, 99, 7821–7826. [Google Scholar] [CrossRef] [Green Version]
- Guidi, B.; Michienzi, A.; Rossetti, G. Dynamic Community Analysis in Decentralized Online Social Networks. In Euro-Par 2017: Parallel Processing Workshops; Springer: Berlin, Germany, 2018; pp. 517–528. [Google Scholar]
- Guidi, B.; Michienzi, A.; Rossetti, G. Towards the Dynamic Community Discovery in Decentralized Online Social Networks. J. Grid Comput. 2019, 17, 23–44. [Google Scholar] [CrossRef]
- Preece, J. Sociability and usability in online communities: Determining and measuring success. Behav. Inf. Technol. 2001, 20, 347–356. [Google Scholar] [CrossRef]
- Norris, P. The Bridging and Bonding Role of Online Communities. Harv. Int. J. Press Politics 2002, 7, 3–13. [Google Scholar] [CrossRef]
- Forsyth, D.R. Group Dynamics; Cengage Learning: Boston, MA, USA, 2018. [Google Scholar]
- Anwar, M.M.; Liu, C.; Li, J.; Anwar, T. Discovering and Tracking Active Online Social Groups. In Proceedings of the WISE 2017: 18th International Conference, Puschino, Russia, 7–11 October 2017. [Google Scholar]
- Kietzmann, J.H.; Hermkens, K.; McCarthy, I.P.; Silvestre, B.S. Social media? Get serious! Understanding the functional building blocks of social media. Bus. Horiz. 2011, 54, 241–251. [Google Scholar] [CrossRef] [Green Version]
- Tsur, O.; Rappoport, A. What’s in a hashtag? Content based prediction of the spread of ideas in microblogging communities. In Proceedings of the Fifth ACM International Conference on Web Search and Data Mining, Seattle, WA, USA, 8–12 February 2012; pp. 643–652. [Google Scholar]
- Lorenz-Spreen, P.; Wolf, F.; Braun, J.; Ghoshal, G.; Conrad, N.D.; Hövel, P. Tracking online topics over time: Understanding dynamic hashtag communities. Comput. Soc. Netw. 2018, 5, 1–18. [Google Scholar] [CrossRef] [Green Version]
- DeMasi, O.; Mason, D.; Ma, J. Understanding communities via hashtag engagement: A clustering based approach. In Proceedings of the International AAAI Conference on Web and Social Media, Cologne, Germany, 17–20 May 2016; Volume 10. [Google Scholar]
- Horne, B.D.; Adali, S.; Sikdar, S. Identifying the social signals that drive online discussions: A case study of reddit communities. In Proceedings of the 2017 26th International Conference on Computer Communication and Networks (ICCCN), Vancouver, BC, Canada, 31 July–3 August 2017; IEEE: Piscataway, NJ, USA, 2017; pp. 1–9. [Google Scholar]
- Welser, H.T.; Gleave, E.; Fisher, D.; Smith, M. Visualizing the signatures of social roles in online discussion groups. J. Soc. Struct. 2007, 8, 1–32. [Google Scholar]
- Panek, E.; Hollenbach, C.; Yang, J.; Rhodes, T. The effects of group size and time on the formation of online communities: Evidence from reddit. Soc. Med. Soc. 2018, 4, 2056305118815908. [Google Scholar] [CrossRef]
- Butler, B.S. Membership size, communication activity, and sustainability: A resource-based model of online social structures. Inf. Syst. Res. 2001, 12, 346–362. [Google Scholar] [CrossRef]
- De Salve, A.; Mori, P.; Guidi, B.; Ricci, L. An analysis of the internal organization of facebook groups. IEEE Trans. Comput. Soc. Syst. 2019, 6, 1245–1256. [Google Scholar] [CrossRef]
- Chu, S.C. Viral advertising in social media: Participation in Facebook groups and responses among college-aged users. J. Interact. Advert. 2011, 12, 30–43. [Google Scholar] [CrossRef]
- Bender, J.L.; Jimenez-Marroquin, M.C.; Jadad, A.R. Seeking support on facebook: A content analysis of breast cancer groups. J. Med. Internet Res. 2011, 13, e16. [Google Scholar] [CrossRef]
- Abedin, T.; Al Mamun, M.; Lasker, M.A.; Ahmed, S.W.; Shommu, N.; Rumana, N.; Turin, T.C. Social media as a platform for information about diabetes foot care: A study of Facebook groups. Can. J. Diabetes 2017, 41, 97–101. [Google Scholar] [CrossRef] [PubMed] [Green Version]
- Partridge, S.R.; Gallagher, P.; Freeman, B.; Gallagher, R. Facebook groups for the management of chronic diseases. J. Med. Internet Res. 2018, 20. [Google Scholar] [CrossRef] [PubMed] [Green Version]
- Meishar-Tal, H.; Kurtz, G.; Pieterse, E. Facebook groups as LMS: A case study. Int. Rev. Res. Open Distrib. Learn. 2012, 13, 33–48. [Google Scholar] [CrossRef] [Green Version]
- Miron, E.; Ravid, G. Facebook groups as an academic teaching aid: Case study and recommendations for educators. J. Educ. Technol. Soc. 2015, 18, 371–384. [Google Scholar]
- Chou, C.H.; Pi, S.M. The effectiveness of Facebook groups for e-learning. Int. J. Inf. Educ. Technol. 2015, 5, 477. [Google Scholar]
- Barabási, A.L. Network Science; Cambridge University Press: Cambridge, UK, 2016. [Google Scholar]
- Martin-Borregon, D.; Aiello, L.M.; Grabowicz, P.; Jaimes, A.; Baeza-Yates, R. Characterization of online groups along space, time, and social dimensions. EPJ Data Sci. 2014, 3, 8. [Google Scholar] [CrossRef] [Green Version]
- Mislove, A.; Marcon, M.; Gummadi, K.P.; Druschel, P.; Bhattacharjee, B. Measurement and analysis of online social networks. In Proceedings of the 7th ACM SIGCOMM Conference on Internet Measurement, San Diego, CA, USA, 24–26 October 2007; ACM: New York, NY, USA, 2007; pp. 29–42. [Google Scholar]
- Laine, M.S.S.; Ercal, G.; Luo, B. User groups in social networks: An experimental study on Youtube. In Proceedings of the 2011 44th Hawaii International Conference on System Sciences (HICSS), Kauai, HI, USA, 4–7 January 2011; IEEE: Piscataway, NJ, USA, 2011; pp. 1–10. [Google Scholar]
- Fortunato, S. Community detection in graphs. Phys. Rep. 2010, 486, 75–174. [Google Scholar] [CrossRef] [Green Version]
- Fortunato, S.; Barthelemy, M. Resolution limit in community detection. Proc. Natl. Acad. Sci. USA 2007, 104, 36–41. [Google Scholar] [CrossRef] [PubMed] [Green Version]
- Leskovec, J.; Kleinberg, J.; Faloutsos, C. Graphs over time: Densification laws, shrinking diameters and possible explanations. In Proceedings of the Eleventh ACM SIGKDD International Conference on Knowledge Discovery in Data Mining, Chicago, IL, USA, 21–24 August 2005; pp. 177–187. [Google Scholar]
- Papadopoulos, S.; Kompatsiaris, Y.; Vakali, A.; Spyridonos, P. Community detection in social media. Data Min. Knowl. Discov. 2012, 24, 515–554. [Google Scholar] [CrossRef]
- Rossetti, G.; Pappalardo, L.; Pedreschi, D.; Giannotti, F. Tiles: An online algorithm for community discovery in dynamic social networks. Mach. Learn. 2017, 106, 1213–1241. [Google Scholar] [CrossRef] [Green Version]
- Dakiche, N.; Tayeb, F.B.S.; Slimani, Y.; Benatchba, K. Tracking community evolution in social networks: A survey. Inf. Process. Manag. 2019, 56, 1084–1102. [Google Scholar] [CrossRef]
- Guidi, B.; Michienzi, A.; Ricci, L. Sonic-man: A distributed protocol for dynamic community detection and management. In Proceedings of the IFIP International Conference on Distributed Applications and Interoperable Systems, Madrid, Spain, 18–21 June 2018; Springer: Berlin, Germany, 2018; pp. 93–109. [Google Scholar]
- Sani, L.; Lombardo, G.; Pecori, R.; Fornacciari, P.; Mordonini, M.; Cagnoni, S. Social Relevance Index for Studying Communities in a Facebook Group of Patients. In Proceedings of the Applications of Evolutionary Computation, Parma, Italy, 4–6 April 2018; pp. 125–140. [Google Scholar]
- Guidi, B.; Michienzi, A.; Salve, A.D. Community evaluation in Facebook groups. Multim. Tools Appl. 2020, 79, 33603–33622. [Google Scholar] [CrossRef]
- Rossetti, G.; Cazabet, R. Community discovery in dynamic networks: A survey. ACM Comput. Surv. (CSUR) 2018, 51, 35. [Google Scholar] [CrossRef] [Green Version]
- Coscia, M.; Rossetti, G.; Giannotti, F.; Pedreschi, D. Demon: A local-first discovery method for overlapping communities. In Proceedings of the 18th ACM SIGKDD International Conference on Knowledge Discovery and Data Mining, Beijing, China, 12–16 August 2012; ACM: New York, NY, USA, 2012; pp. 615–623. [Google Scholar]
- Coscia, M.; Rossetti, G.; Giannotti, F.; Pedreschi, D. Uncovering hierarchical and overlapping communities with a local-first approach. ACM Trans. Knowl. Discov. Data 2014, 9, 6. [Google Scholar] [CrossRef] [Green Version]
- Raghavan, U.N.; Albert, R.; Kumara, S. Near linear time algorithm to detect community structures in large-scale networks. Phys. Rev. E 2007, 76, 036106. [Google Scholar] [CrossRef] [PubMed] [Green Version]
- Clauset, A.; Newman, M.E.J.; Moore, C. Finding community structure in very large networks. Phys. Rev. E 2004, 70, 066111. [Google Scholar] [CrossRef] [PubMed] [Green Version]
- Blondel, V.D.; Guillaume, J.L.; Lambiotte, R.; Lefebvre, E. Fast unfolding of communities in large networks. J. Stat. Mech. Theory Exp. 2008, 2008, P10008. [Google Scholar] [CrossRef] [Green Version]
- Pons, P.; Latapy, M. Computing Communities in Large Networks Using Random Walks. In Proceedings of the Computer and Information Sciences—ISCIS 2005, Istanbul, Turkey, 26–28 October 2005; Springer: Berlin/Heidelberg, Germany, 2005; pp. 284–293. [Google Scholar]
- Rosvall, M.; Bergstrom, C.T. Maps of random walks on complex networks reveal community structure. Proc. Natl. Acad. Sci. USA 2008, 105, 1118–1123. [Google Scholar] [CrossRef] [PubMed] [Green Version]
- Rosvall, M.; Axelsson, D.; Bergstrom, C.T. The map equation. Eur. Phys. J. Spec. Top. 2009, 178, 13–23. [Google Scholar] [CrossRef]
- Guidi, B.; Conti, M.; Passarella, A.; Ricci, L. Managing social contents in Decentralized Online Social Networks: A survey. Online Soc. Netw. Media 2018, 7, 12–29. [Google Scholar] [CrossRef]
- Khaouid, W.; Barsky, M.; Srinivasan, V.; Thomo, A. K-core decomposition of large networks on a single pc. Proc. VLDB Endow. 2015, 9, 13–23. [Google Scholar] [CrossRef] [Green Version]
- Chakraborty, A.; Ghosh, S. Clustering hypergraphs for discovery of overlapping communities in folksonomies. In Dynamics On and Of Complex Networks; Springer: Berlin, Germany, 2013; Volume 2, pp. 201–220. [Google Scholar]
- Brandes, U. A faster algorithm for betweenness centrality. J. Math. Sociol. 2001, 25, 163–177. [Google Scholar] [CrossRef]
Figure 1.
A small example to showcase how the dynamic User Interaction Temporal Graph (d-UITG) is built.
Figure 1.
A small example to showcase how the dynamic User Interaction Temporal Graph (d-UITG) is built.

Figure 2.
Number of communities detected by Democratic Estimator of the Modular Organization of a Network (DEMON).
Figure 2.
Number of communities detected by Democratic Estimator of the Modular Organization of a Network (DEMON).

Figure 3.
Number of communities detected by Fast Greedy.

Figure 4.
Number of communities detected by Infomap.

Figure 5.
Number of communities detected by K-core.

Figure 6.
Number of communities detected by label propagation.

Figure 7.
Number of communities detected by Multilevel.

Figure 8.
Number of communities detected by TILES.

Figure 9.
Number of communities detected by Walktrap.

Figure 10.
Number of active nodes detected by DEMON.

Figure 11.
Number of active nodes detected by Fast Greedy.

Figure 12.
Number of active nodes detected by Infomap.

Figure 13.
Number of active nodes detected by K-core.

Figure 14.
Number of active nodes detected by label propagation.

Figure 15.
Number of active nodes detected by Multilevel.

Figure 16.
Number of active nodes detected by TILES.

Figure 17.
Number of active nodes detected by Walktrap.

Figure 18.
Growth rate of communities detected by DEMON.

Figure 19.
Growth rate of communities detected by Fast Greedy.

Figure 20.
Growth rate of communities detected by K-core.

Figure 21.
Growth rate of communities detected by TILES.

Figure 22.
Modularity of communities detected by DEMON.

Figure 23.
Modularity of communities detected by Fast Greedy.

Figure 24.
Modularity of communities detected by K-core.

Figure 25.
Modularity of communities detected by TILES.

Figure 26.
Conductance of communities detected by DEMON.

Figure 27.
Conductance of communities detected by Fast Greedy.

Figure 28.
Conductance of communities detected by K-core.

Figure 29.
Conductance of communities detected by TILES.

Figure 30.
Internal density of communities detected by DEMON.

Figure 31.
Internal density of communities detected by Fast Greedy.

Figure 32.
Internal density of communities detected by K-core.

Figure 33.
Internal density of communities detected by TILES.


Table 1.
General description of the Facebook Groups.
| Group | Cat. | Days | Users | Min Date | Max Date | Posts |
|---|---|---|---|---|---|---|
| Edu1 | Edu | 388 | 10,643 | 01/01/17 | 24/01/18 | 3555 |
| Edu2 | Edu | 317 | 46,016 | 06/04/17 | 18/02/18 | 5271 |
| Edu3 | Edu | 393 | 21,195 | 25/01/17 | 22/02/18 | 5060 |
| Sport1 | Sport | 249 | 35,671 | 27/08/17 | 03/05/18 | 5588 |
| Sport2 | Sport | 370 | 3589 | 04/02/17 | 09/02/18 | 708 |
| Sport3 | Sport | 28 | 107,459 | 13/02/18 | 14/03/18 | 6353 |
| Work1 | Work | 406 | 26,901 | 02/01/17 | 12/02/18 | 1444 |
| Work2 | Work | 418 | 4925 | 04/01/17 | 26/02/18 | 945 |
| Work3 | Work | 318 | 25,257 | 13/06/17 | 27/04/18 | 4809 |
| Work4 | Work | 485 | 12,151 | 03/01/17 | 04/05/18 | 2651 |
| Ent1 | Ent | 130 | 6941 | 30/09/17 | 08/02/18 | 5009 |
| Ent2 | Ent | 123 | 15,028 | 22/10/17 | 23/02/18 | 3777 |
| Ent3 | Ent | 120 | 39,079 | 02/01/18 | 03/05/18 | 4904 |
| Ent4 | Ent | 178 | 9392 | 09/09/17 | 06/03/18 | 3543 |
| News1 | News | 111 | 49,761 | 07/10/17 | 26/01/18 | 155 |
| News2 | News | 91 | 37,253 | 08/11/17 | 07/02/18 | 3397 |
| News3 | News | 406 | 5083 | 02/01/17 | 12/02/18 | 1133 |
Publisher’s Note: MDPI stays neutral with regard to jurisdictional claims in published maps and institutional affiliations. |
© 2021 by the authors. Licensee MDPI, Basel, Switzerland. This article is an open access article distributed under the terms and conditions of the Creative Commons Attribution (CC BY) license (http://creativecommons.org/licenses/by/4.0/).
Share and Cite
MDPI and ACS Style
Guidi, B.; Michienzi, A. Dynamic Community Structure in Online Social Groups. Information 2021, 12, 113. https://0-doi-org.brum.beds.ac.uk/10.3390/info12030113
AMA Style
Guidi B, Michienzi A. Dynamic Community Structure in Online Social Groups. Information. 2021; 12(3):113. https://0-doi-org.brum.beds.ac.uk/10.3390/info12030113
Chicago/Turabian StyleGuidi, Barbara, and Andrea Michienzi. 2021. "Dynamic Community Structure in Online Social Groups" Information 12, no. 3: 113. https://0-doi-org.brum.beds.ac.uk/10.3390/info12030113
Note that from the first issue of 2016, this journal uses article numbers instead of page numbers. See further details here.