
Maximizing Image Information Using Multi-Chimera Transform Applied on Face Biometric Modality


Computer Engineering Department, College of Engineering-Mustansiriyah University, Baghdad 10047, Iraq
*
Author to whom correspondence should be addressed.
Information 2021, 12(3), 115; https://0-doi-org.brum.beds.ac.uk/10.3390/info12030115
Submission received: 20 January 2021
/
Revised: 15 February 2021
/
Accepted: 25 February 2021
/
Published: 8 March 2021
(This article belongs to the Section Information Applications)
Abstract
:With the development of mobile technology, the usage of media data has increased dramatically. Therefore, data reduction represents a research field to maintain valuable information. In this paper, a new scheme called Multi Chimera Transform (MCT) based on data reduction with high information preservation, which aims to improve the reconstructed data by producing three parameters from each block of data, is proposed. MCT is a 2D transform that depends on constructing a codebook of 256 picked blocks from some selected images which have a low similarity. The proposed transformation was applied on solid and soft biometric modalities of AR database, giving high information preservation with small resulted file size. The proposed method produced outstanding performance compared with KLT and WT in terms of SSIM and PSNR. The highest SSIM was for the proposed scheme MCT of the full image of AR database, while the existed method KLT and WT had and , respectively. In addition, the highest PSNR was dB for the proposed scheme on warp facial image of AR database, while the existed methods KLT and WT had dB and dB, respectively.
1. Introduction
Feature detection is considered a major step of image processing and computer vision for image compression, pattern recognition, image classification, and image registration. These features have to be invariant to specific spatial transformations such as rotation, translation, and scaling [1]. The concept of feature detection has been used in different fields and different applications such as medical images [2], remote sensing [3], face recognition [4], human shape recognition [5], indexing and image retrieval [6]. Feature detection builds the feature representation for any image and searches for the corresponding similarity between the pixels for the same scene depending on the salient features that are extracted from the image to increase the valuable information with reduced data [7].
Many transformations are used in image processing and data analysis, e.g., Karhunen-Loeve Transform (KLT), Wavelet Transform (WT), Discrete Cosine Transform (DCT), Discrete Fourier Transform (DFT), and Chimera Transform (CT), which reduce the amount of the raw data or extract low level features to be used for further processing and detection [8,9,10,11,12]. KLT is considered a representation of a stochastic process for an infinite linear combination of orthogonal functions; it creates the most precise illustration (with the assumption that the error has the same power in all dimension) of the original data. This transform spreads an input data in terms of a set of basis, which is called “eigenvalues”, where it uses only few KLT coefficients to represent the most amount of the data [8]. Therefore, KLT can be used for features dimensionality reduction, while it could not cope with clusterization tasks [13]. WT decomposes the image sub-blocks into different levels of resolution, by taking only the low frequency band to introduce a new feature set; by doing this, the wavelet coefficient size is reduced, and a compressed size of feature vector is produced that can be applied for any classification tool [14]. However, the number of computations increased dramatically when a multi-level WT is applied on the data. DCT demonstrates a finite sequence of data points as a sum of cosine functions oscillating at different frequencies; as the frequency increases, the coefficient’s value decreases, and vice versa. Applying DCT for the input image and taking only some coefficients, since the DC component and low frequency components carrying the maximum information, this compressed vector can represent the original image, and any classification model can be applied to this reduced size vector [15]. Fractal coding is an effective tool for describing image textures. This transformation extracts the DC component of each image block, and then calculates the contrast coefficients recursively to find the best geometric shape of the block. For each range block, the corresponding best matching of domain block can be estimated from the pool of domain block using self-similarity technique. On the fractal decoding side, the contrast coefficients and DC component are recursively applied to reconstruct the image (blocks), and consequently, the original image is constructed [16,17].
Hence, most image processing fields try to achieve maximum information with minimum data using different schemes. Lossless image compression techniques aim for maximizing the information rather than minimizing the data, while lossy image compression approaches trying to optimize these two factors [18]. Image data reduction techniques such as PCA, KLT, and feature detection target are considered a preprocessing step that is used to minimize the data rather than maximize the information [19].
Some other factors are used to measure the efficiency of the transform, such as complexity and execution time; however, other metrics need to be calculated such as the content of minimum data metric, which is the ratio between the input ( or blocks) and the output (a small number of integer values) of the process, and maximum information metric, which represents Peak Signal to Noise Ratio (PSNR) and/or Structure Similarity Index Measure (SSIM).
In this article, a scheme is proposed to obtain the maximum information from only a small amount of image data using similarity and statistical operations. This scheme is called Multi-Chimera Transform (MCT), which is used to represent each input data of a block using 3 integer values (output) with a valuable information contents (PSNR and SSIM). To show the effectiveness of the proposed scheme (MCT), we applied it to biometric database for extracting useful information from facial image. The method was compared with KLT, which is considered as a powerful transform for information extraction, and WT, which is the most used transform for information compression.
Kukharev et al. presented a two-step approach that utilized as a first step Karhunen-Loeve Transform (KLT) because it gives a good approximation of input data but with large number of eigenvalues and as the second step Linear Discriminant Analysis (LDA) to reduce the data dimensionality. To show the useful advantage of their method, they applied it on some image data and proved the method has a high compression level and optimal representation in feature-space for image recognition and browsing large graphical databases [13]. In [20], Haar-like features are used as a detection technique, whereas the recognition stage of the system is based on eigenimages and principle component analysis. Hafed and Levine confirmed the effectiveness and robustness of using the discrete cosine transform for feature extraction and showed that the KLT is more computationally expensive in comparison with DCT regarding training [15]. Hui and Zak arranged the magnitudes coefficients of the Fourier transform, which is applied to the patterns of the data base, in a vector in descending order and selected the first P largest coefficients for use in further processing instead of the original patterns. P is defined as a design parameter, and the vector of P descending coefficients is referred to as the signature vector of the corresponding pattern [11]. Aznaveh et al. decreased the large amount of memory required to save the face database by applying KLT (also called Hotelling transform) to each block of the image database separately [21].
This work proposes a robust scheme for maintaining valuable information with data reduction, which can be applied on different applications such as object recognition, and biometric verification system. However, for evaluation purposes, our study focuses on face biometric modality with the existence of occlusion using the proposed data reduction transform MCT. The following four contributions are made:
- We suggest a novel scheme for image transform, which can be used for data reduction with maximum information.
- A large-scale evaluation of the proposed scheme using 5913 facial images was performed. The warp faces of AR had (2600) images, the full image of AR had (3315) images, and the full image from websites had (16) images.
- Implement a proposed scheme, which is invariant for subject diversities (142 persons), light conditions (right side, left side, and both sides), facial expression (neutral, smile, anger, scream), and facial occlusions (prescription eyeglasses, sunglasses, scarf, and hat) within different sessions (two sessions 14 days apart).
- The proposed scheme successfully maintained the information for solid biometric such as face and ocular biometric modalities, and it could be applied to preserve the information of soft biometric modalities such as eyebrow, eyeglasses, sunglasses, scraf, and hat.
2. Problem Statement of Image Data Reduction
A new strategy to transfer an image from spatial domain to a new innovator (Chimera) domain is called Multi-Chimera Transform (MCT). In general, traditional transforms such as DCT and WT, transform the image data from spatial domain to its domain using a set of orthogonal functions and the inverse of this process. These are shown in Equations (1) and (2), respectively.
where, is a vector of input data (data in spatial domain) and is a vector of coefficient (data in innovator domain). is a set of orthogonal function and its inverse (also a set of orthogonal function) and is the convolution process.
The orthogonality of any transform, constraints it to use a unified type of function and therefore a limited number of useful patterns in 2D images will be resulted. Chimera Transform overcame this challenge by proposing a hybrid set of patterns in form of small image blocks called code-book to increase the information in Chimera domain [12].
2.1. The Concept of Multi-Chimera Transform (MCT)
Chimera Transform (CT) generated only one coefficient for each block. This could be considered as a weakness issue of Chimera Transform as it used a small block size of . This small block size is beneficial for image compression; however, it generates a large amount of redundant information for feature detection. Therefore, a large block size of could reduce the number of features; however, the reconstructed image would be degraded. To enhance the reconstructed image, the Chimera Transform can be applied many times to generate what is called a Multi-Chimera Transform (MCT).
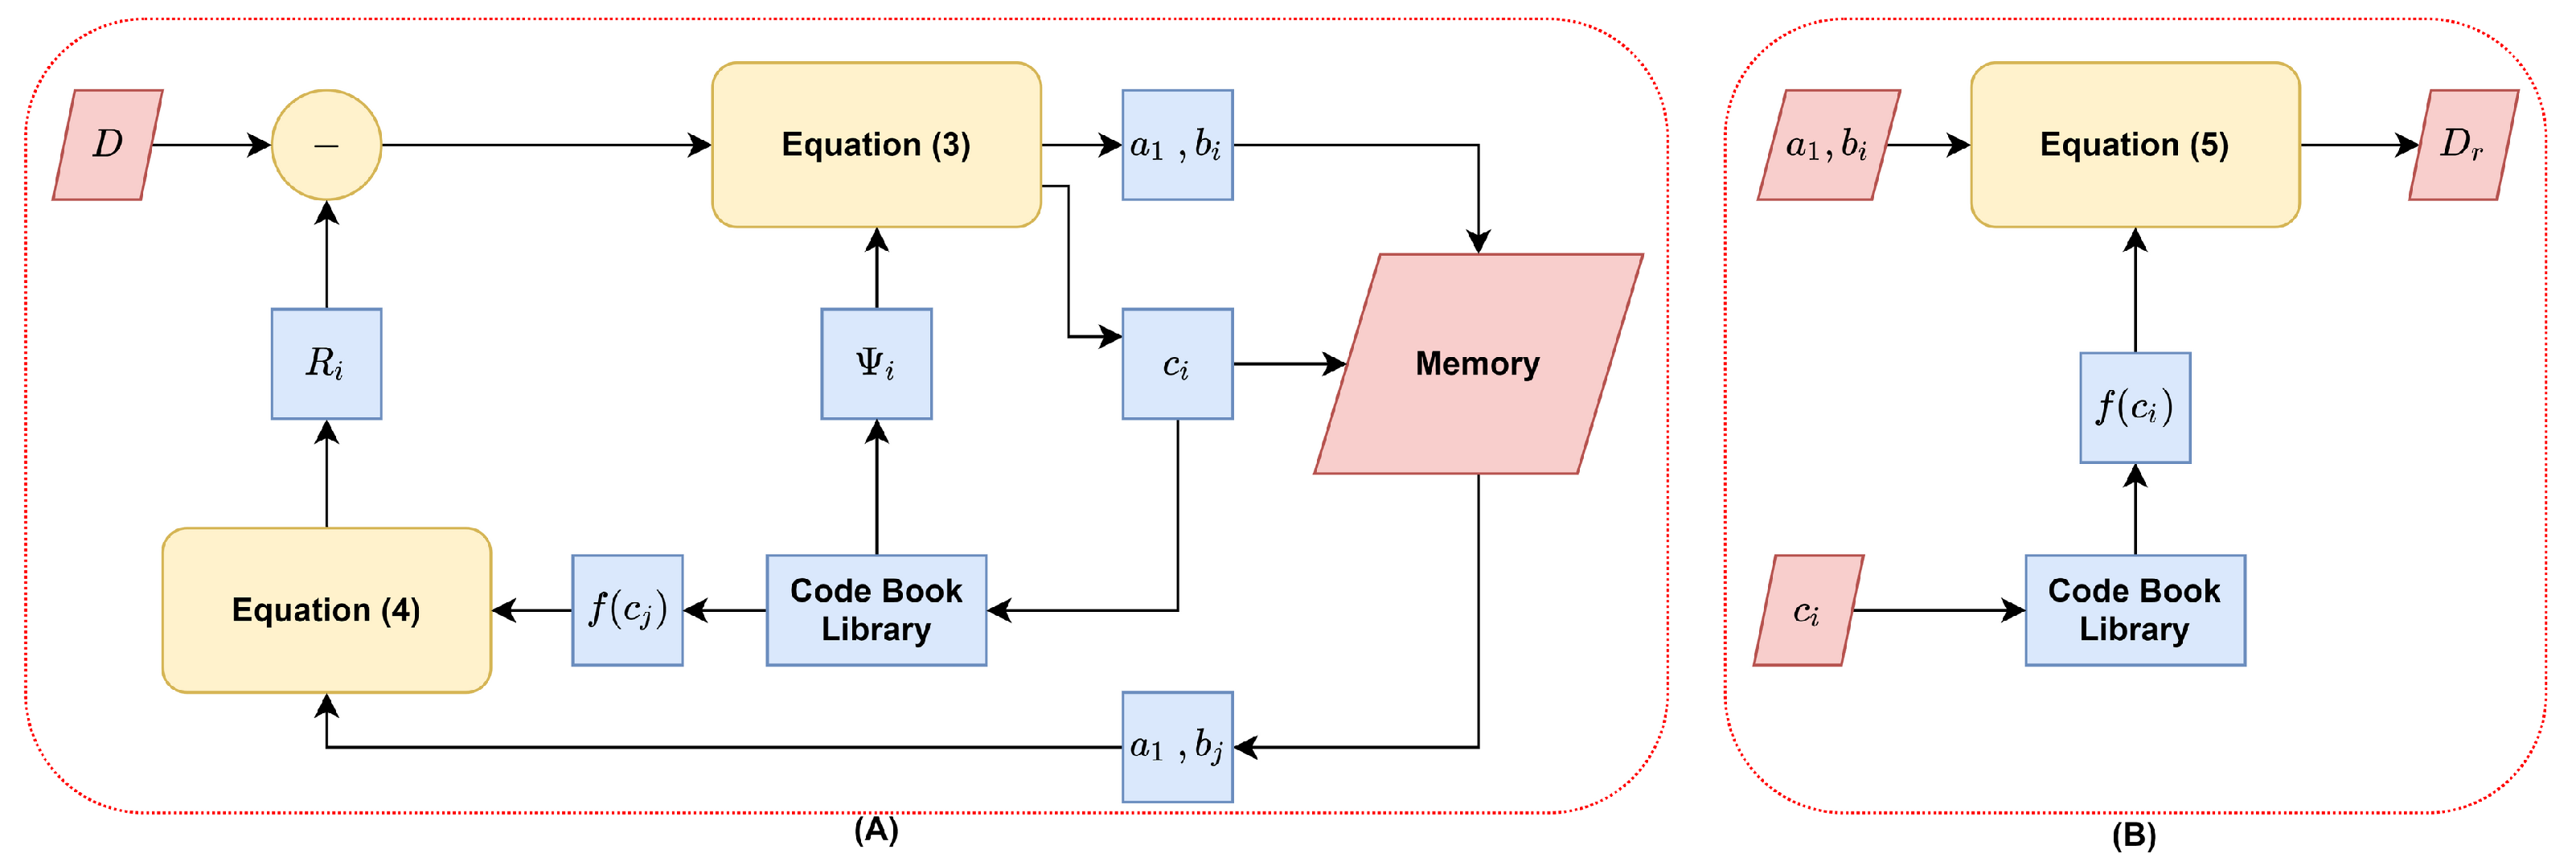
Equations (3) and (4) are the forward process, while, Equation (5) represents the inverse process.
where , , and are the MCT parameters, D is input sub-image (block), is the intended function of the codebook library for the index , and is the reconstructed block, is the codebook library, and n is the number of iterations in which two or three iterations were used. Figure 1 shows the whole process of the proposed scheme of a Multi-Chimera Transform (MCT).
2.2. Codebook Generation of MCT
The codebook library () is a set of functions , which were stated in Equations (3)–(5). These equations represent the core of MCT. Consequently, this library determines the tendency of the MCT field. The essential concept of generating these function sets are the Vector Coding (VC) technique. VC selects some samples of blocks from a set of images to generate the codebook. This approach selects the most repeated patterns of standard images. Thereafter, some blocks will be reconstructed without error while the majority of the blocks will be approximated and replaced with the most similar available pattern in the codebook. In general, VC is considered a simple approach but with high error in the reconstructed image; thus, it needs a large codebook library to reduce the aforementioned error.
MCT introduces a novel technique to generate new patterns for optimizing the output error in the reconstructed image. The codebook was generated from 16 selected images of the same field. A total of 16 facial images were collected from different ethnicity and light conditions to construct the codebook which was used for facial biometric modality. A large set of data was composed from these selected images to obtain a small subsets of data. These subsets contain the most similar patterns, with one pattern kept from each subset. As a result, a diverse pattern is maintained in the codebook. This process will be discussed in the following section.
3. The Proposed Approach
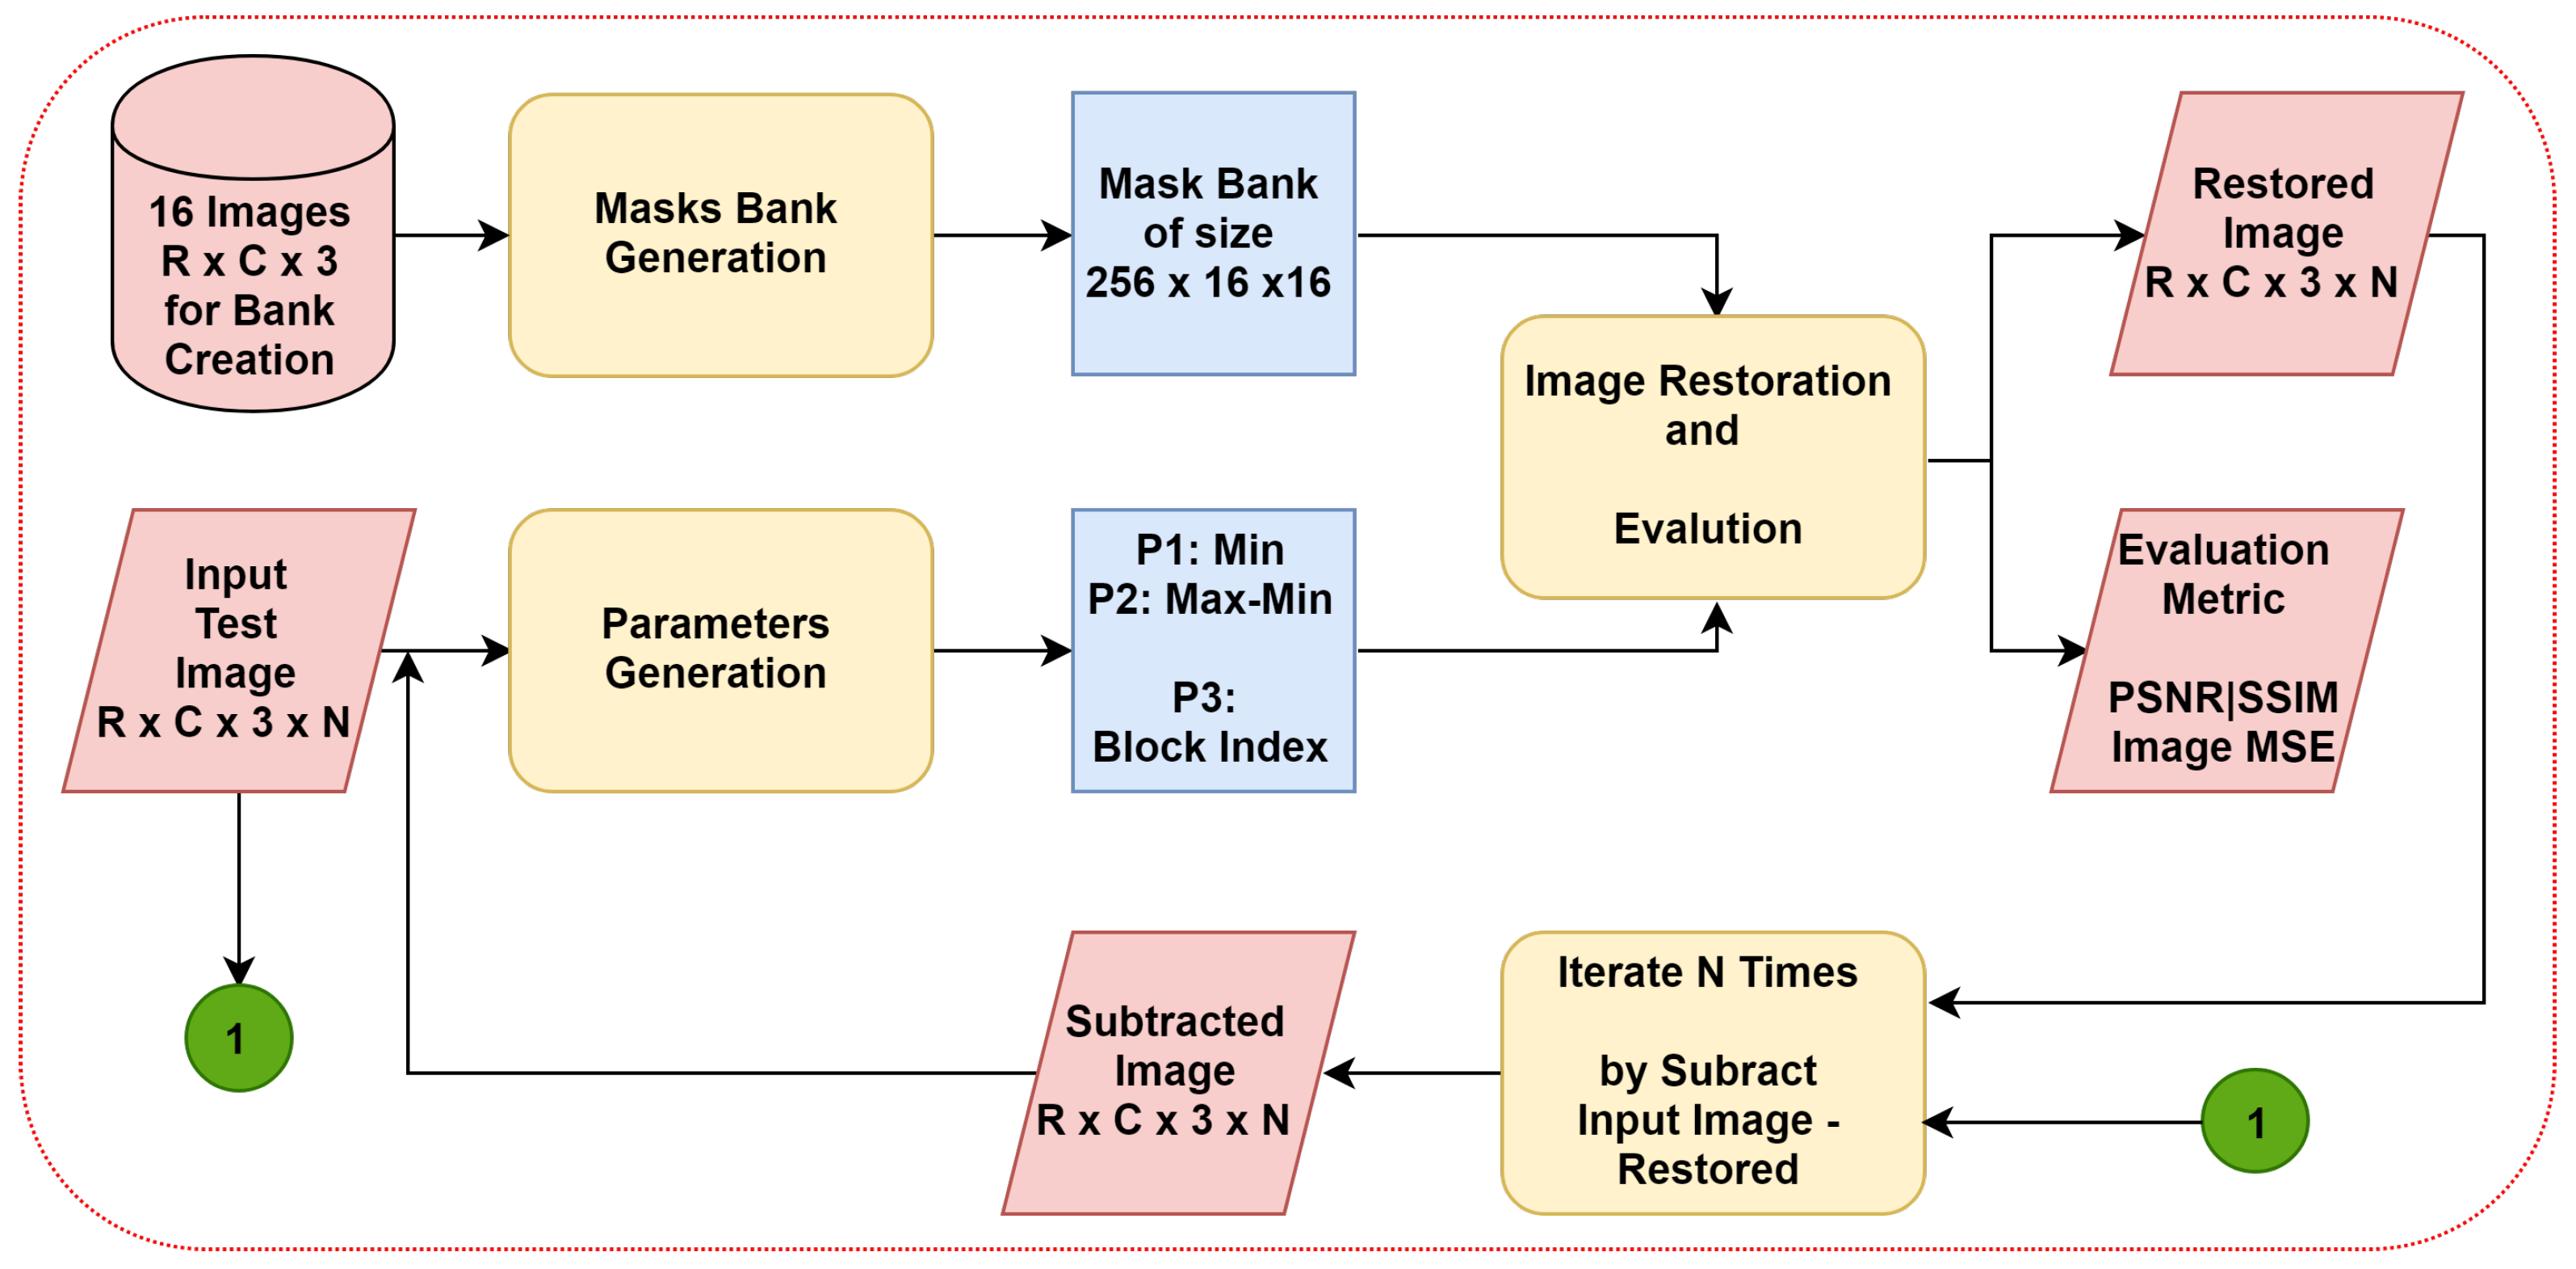
The overall steps within the proposed work are shown in Figure 2. These consist of mask bank generation, parameter generation, and image restoration, which will be explained in the next sections.
3.1. Mask Bank Generation
The first stage in the proposed approach is mask bank creation. This stage involves progressive steps to create a mask bank, which is used to generate the required parameters for the proposed work in the next stage. The steps are block generation, similarity score creation, and mask bank implementation. Figure 3 shows the steps of the mask bank generation stage, where R1 × C1 is the image dimension, and Ch1 is the gray value of colored image.
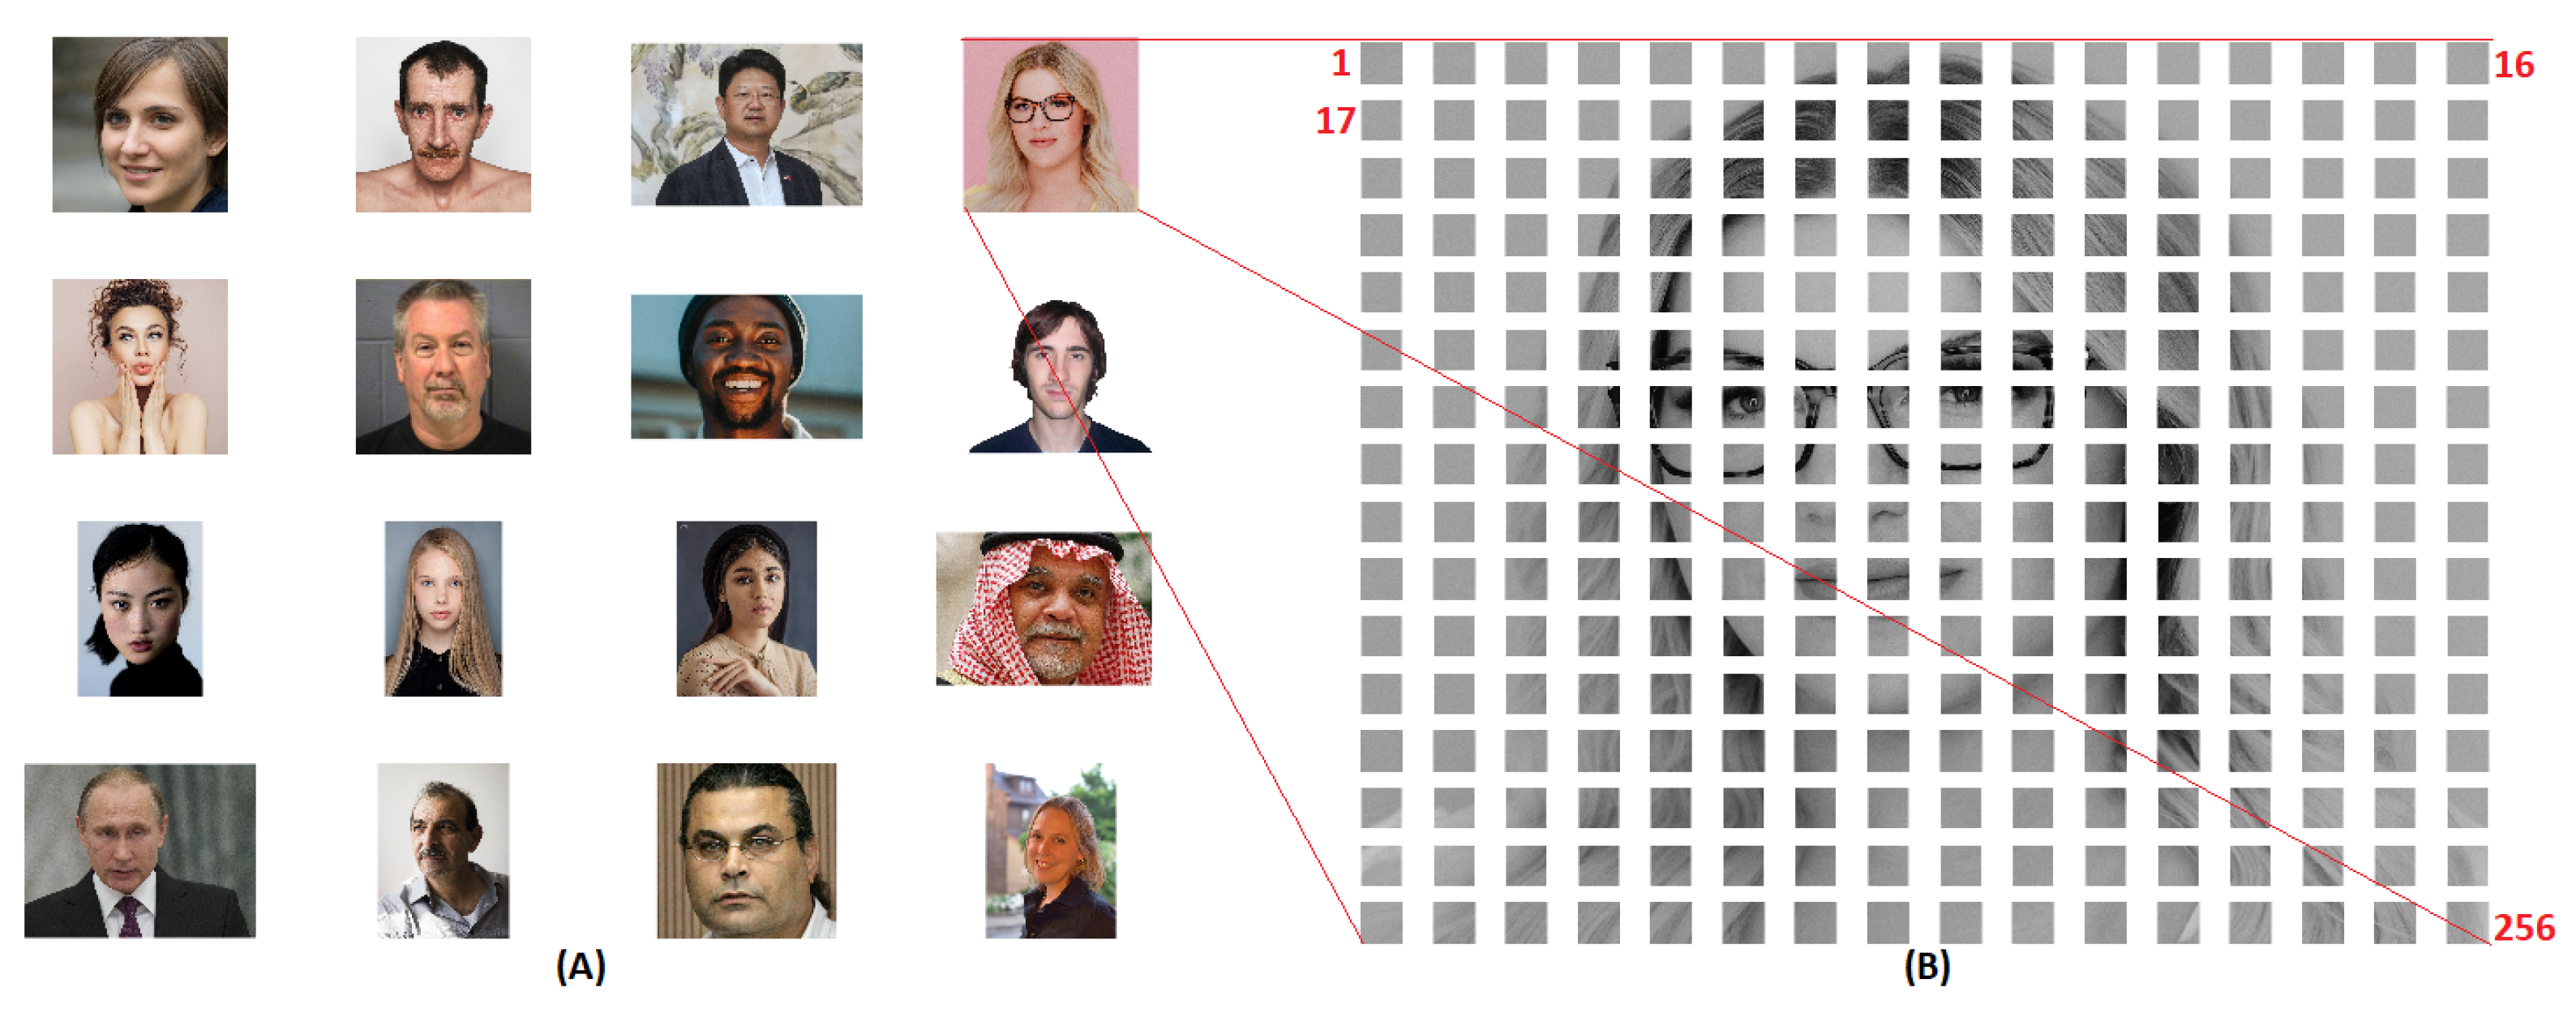
Initially, sixteen images of human faces of different ethnicity and varying light conditions were read (as shown in Figure 4A) and resized to to generate three masks bank of size by end of this stage. The entire human face image was divided into 256 blocks of size , as shown in Figure 4B. This procedure was repeated on the sixteen facial images to obtain a generated block of size . The 4096 generated blocks were collected from these 16 facial images as a result. Consequently, a 256 blocks were constructed from each image as shown in Figure 4. Then, a Gaussian low pass filter was applied on each created block to smooth each individual entity. Then, the filtered blocks were normalized using min-max normalization according to the Equation (6).
where is the input block, is the output normalized block and is the block.
Subsequently, a Mean Absolute Error (MAE) was calculated for these 4096 normalized generated blocks of size , in order to build the MAE matrix of size (), as outlined in the Equation (7). The MAE matrix was implemented to allocate the similarity between the generated blocks which were acquired from these sixteen facial images.
where is the generated mean absolute error, and are block vector of size (), and is the number of blocks.
A total of three masks of size () were selected for each row in MAE matrix. The 16 most similar values out of 4096 were selected according to the following strategies:
- The most similar (minimum MAE) value was kept in the first mask bank while the other 15 values were excluded.
- The most similar (minimum MAE) value was subtracted from the most dissimilar (maximum MAE) value; thereafter, the normalized subtracted value was kept in the second mask bank while the other 14 values were excluded.
- The seventh similar value was subtracted from eighth similar value then the subtracted value was kept in the third mask bank and the other 14 values were excluded.
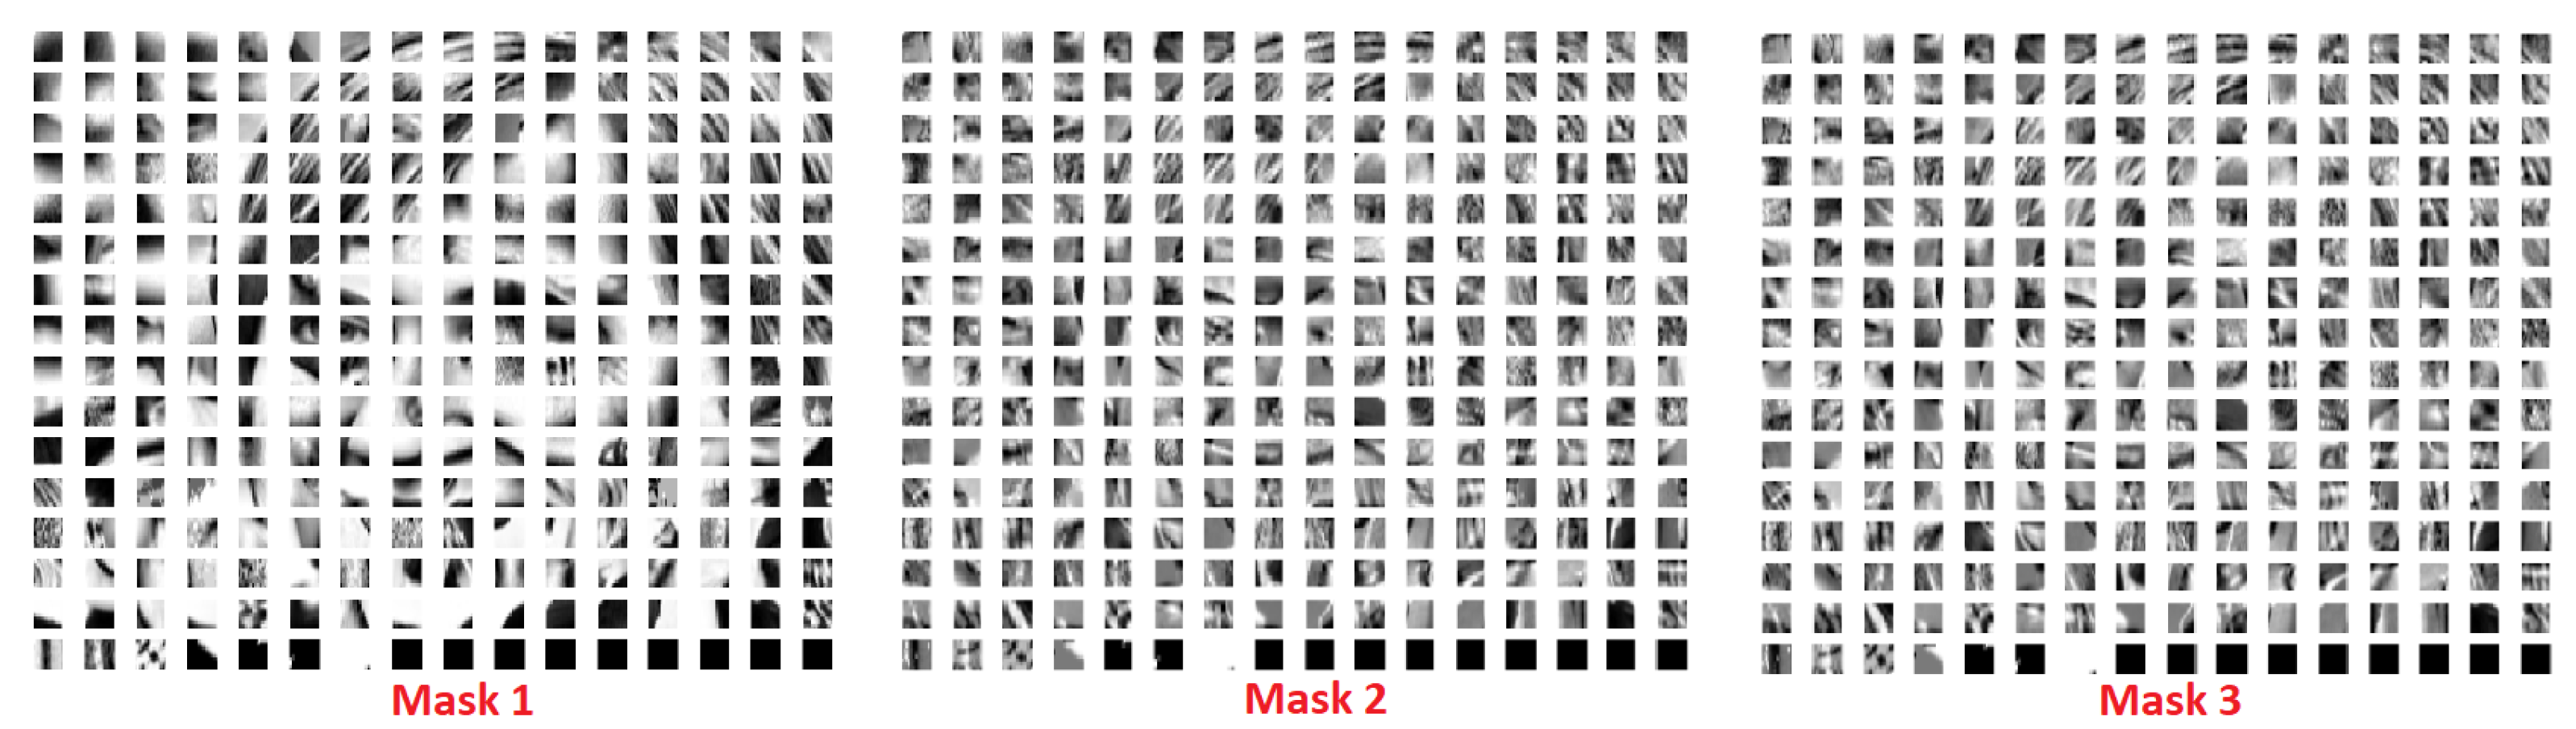
Figure 5 shows these three masks of size , which were concatenated into a matrix of size , to form the resultant mask bank which was utilized by the next two successive stages.
3.2. Parameter Generation
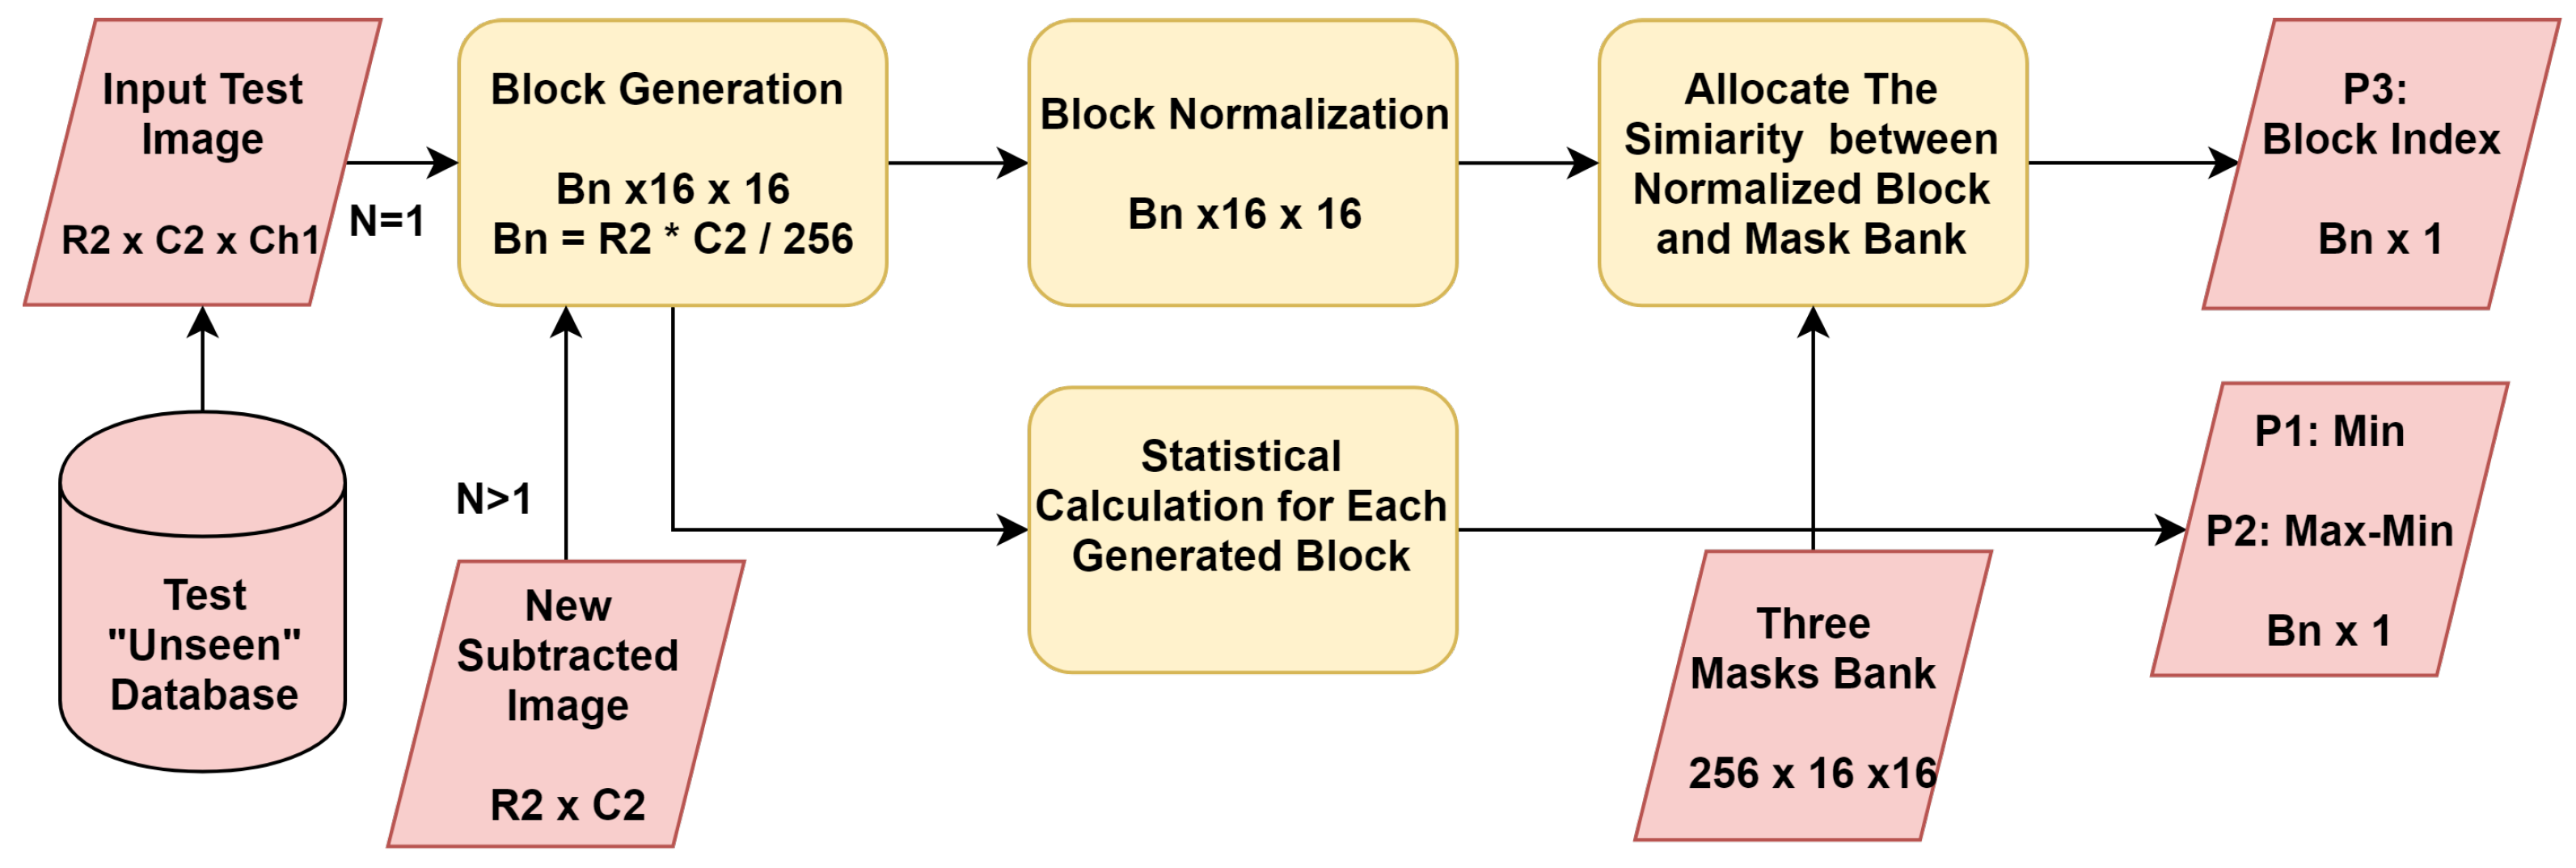
The second stage of MCT is the parameter generation, which is shown in Figure 6 (the second stage of multi-chimera scheme). This stage consists of four steps which are; block generation, block normalization, similarity allocation, and statistical calculation. To this end, three parameters were generated from each acquired block of the input test image. These parameters are minimum value (P1), maximum value (P2), and the index (P3) of most similar block of the mask bank, where P1 is the matrix of , P2 is the matrix of , and P3 is the matrix of .
In this stage, the test facial images were obtained from the AR database [22] with two different image size sets, which were the warp faces (2599 facial images) and full faces (3313 facial images). Firstly, the test image of size was converted into blocks of size , then the generated blocks were normalized. Then, the similarity was allocated between the mask bank and the recently generated normalized block. Finally, the column index of most similar blocks which had the lowest value of MAE among other values, was saved into the P3 parameter.
On the other side, a statistical calculation was applied on the generated blocks. Two statistical calculations were used in this stage which firstly included the minimum value of each block of size (to obtain P1 parameter). A second statistical calculation considered the maximum of each block which was subtracted from the minimum applied on the same block to get the P2 parameter.
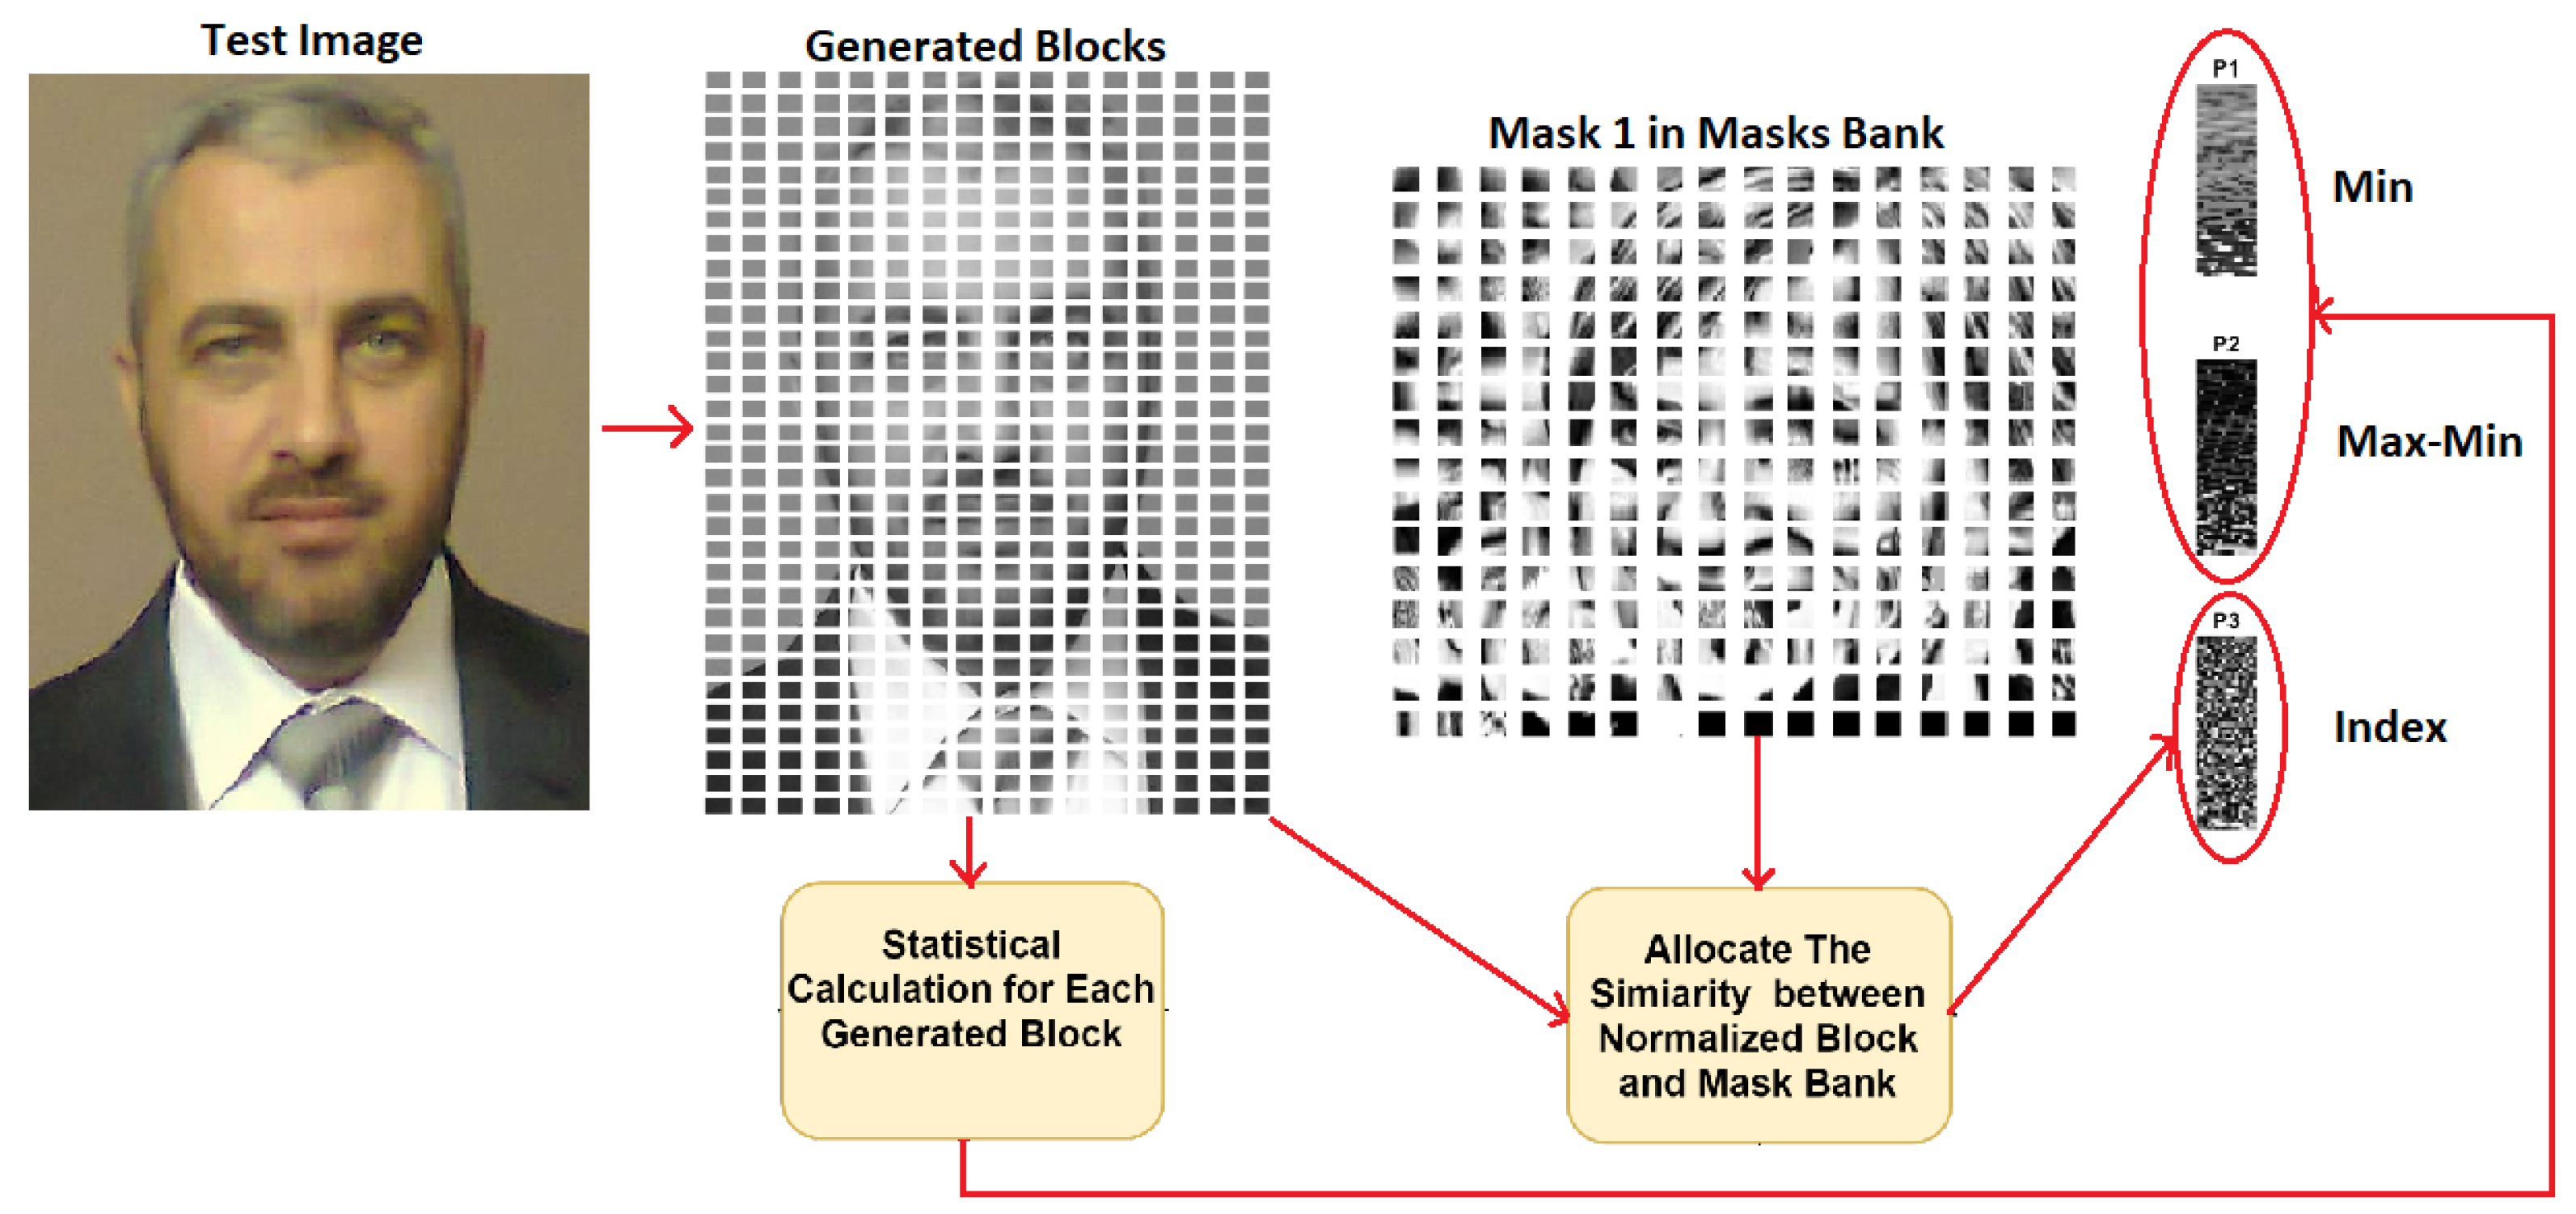
Typically, the procedure of this stage could be repeated N times. However, the procedure was repeated three times for this proposed scheme, and for each iteration a certain mask bank of size was used. For instance, for the first iteration, the first mask (out of three masks that were stored in the bank) was used with the test image to allocate the similarity between the input image and the saved mask bank. In the same manner, for the second iteration, the second mask bank was used with the new subtracted image instead of the test image to allocate the similarity between the new subtracted image and the stored mask bank. This subtracted image was obtained from the next stage (explained in the next section). Figure 7 shows the processes of parameter generation with the first iteration.
3.3. Image Restoration
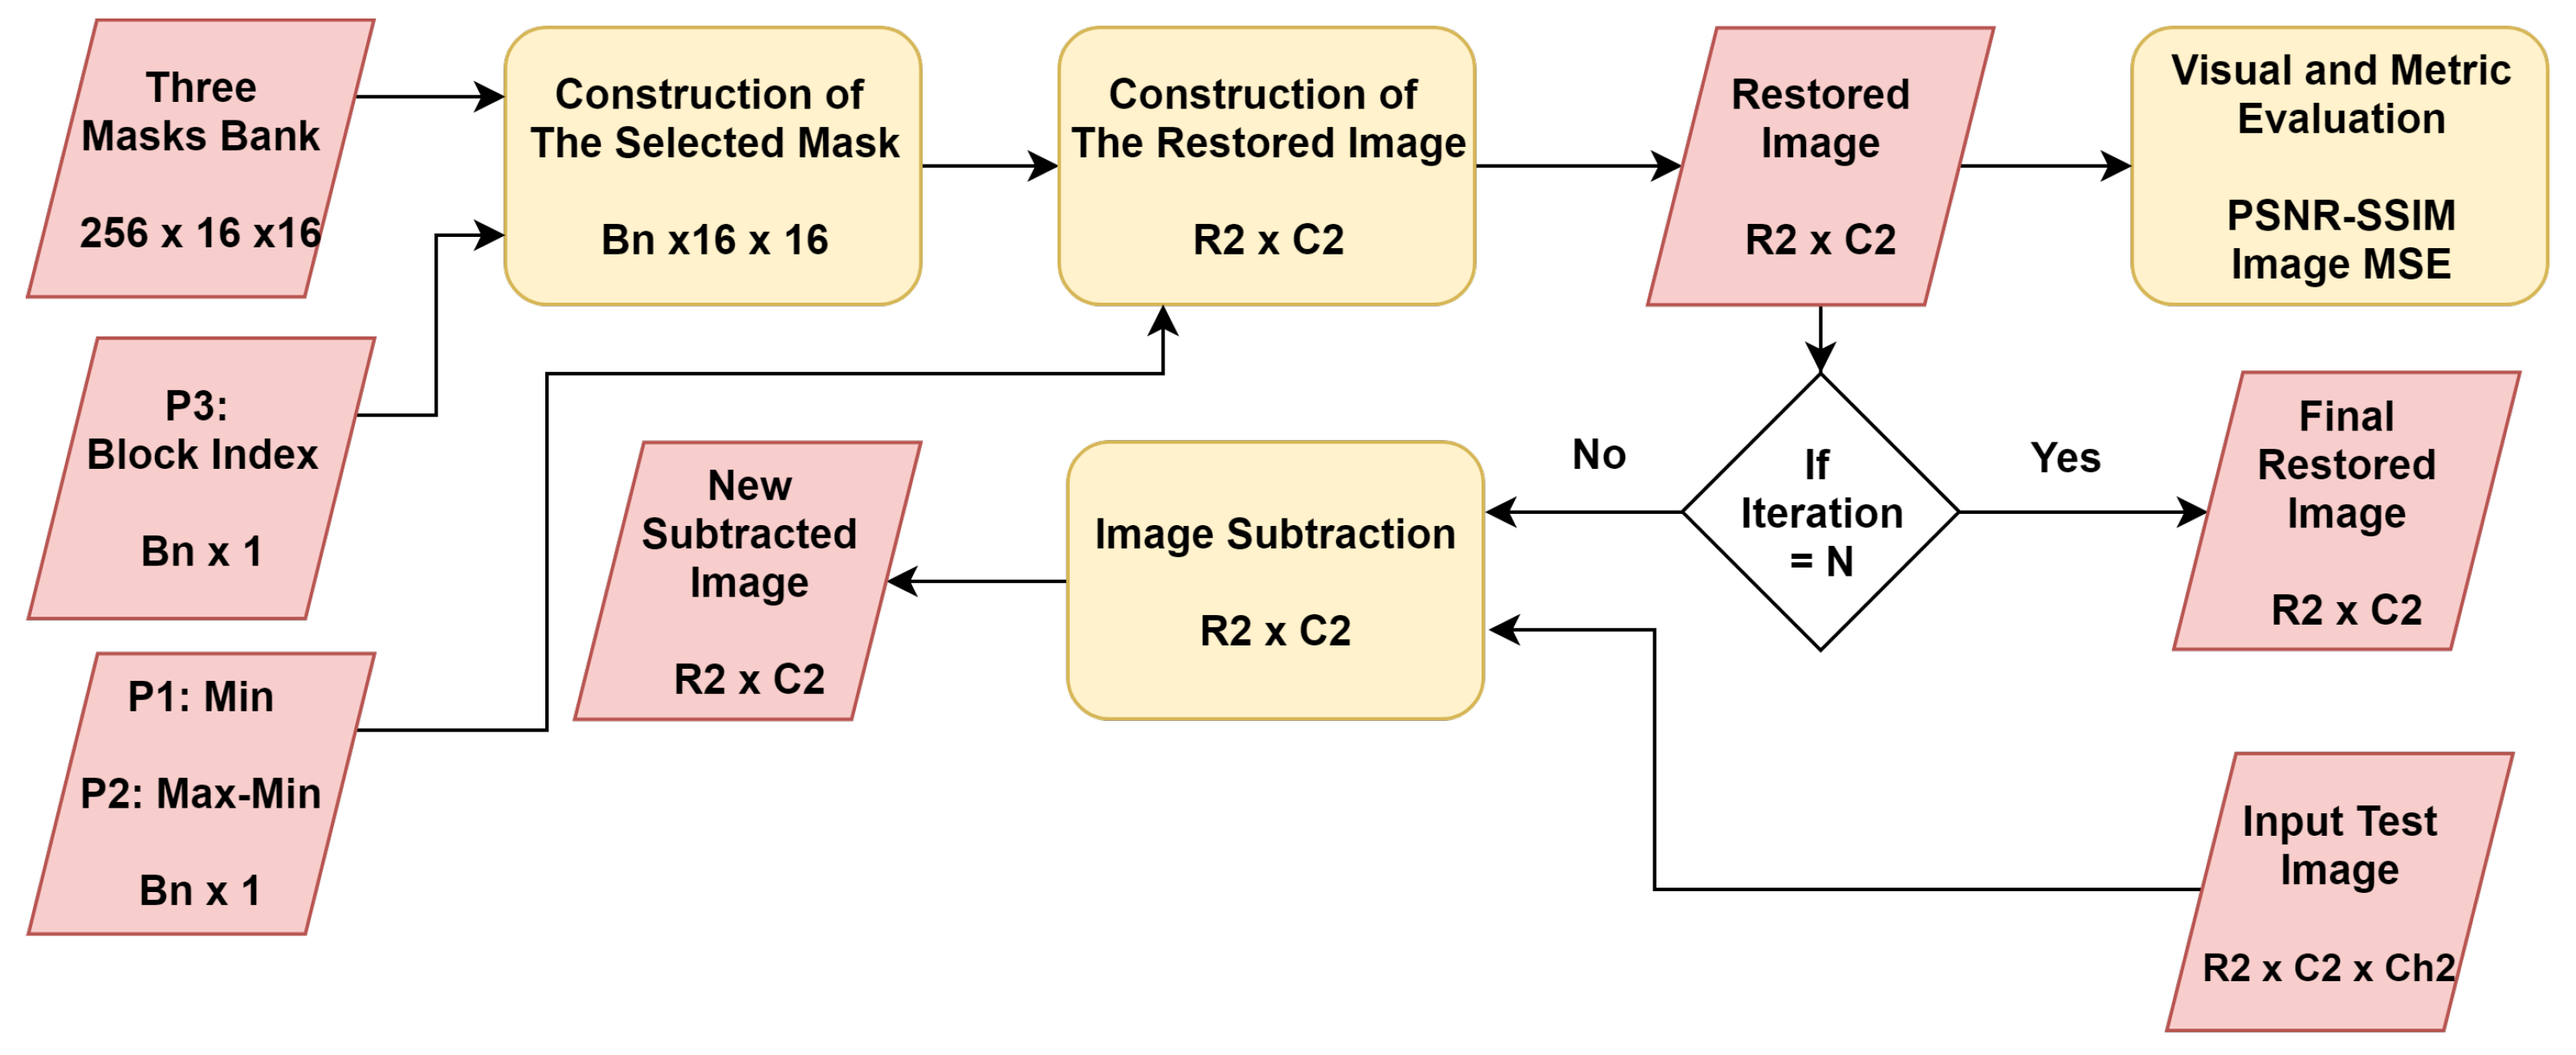
The final stage of the proposed method was the image restoration, as shown in Figure 8. This stage involved a number of subsequent steps to achieve two goals. The first goal was to restore the test image, and the second one was to evaluate the proposed method.
The first step of image restoration was the construction of the selected mask. To this end, the block index parameter P3 allocated to the most similar block in the mask bank of size . Then, this picked block of size , was repeatedly accumulated to obtain the selected blocks of size , where, represents the number of collected blocks and the calculation of was outlined in Equation (8).
where R2 and C2 are the number of rows and columns of the input image, respectively.
Thereafter, the resultant blocks of size were restored using the selected mask. , P1, and P2 are as outlined in Equation (9). Consequently, the restored blocks of size were arranged into the original size of the input image (R1 × C1).
The restored image was evaluated visually using two metrics; namely, Peak Signal to Noise Ratio (PSNR) and Structural Similarity Index Measure (SSIM). The evaluation process will be explained in detail in the next section.
As outlined in the previous stage (parameter generation), the image restoration stage was repeated N times. However, this stage was designed to be repeated three times. For each iteration, the recent restored image was subtracted from original image; then, the resultant image was normalized and sent to previous stage to generate new parameters (, , and ). Figure 9 shows a visual sample for this process. In addition, the coded image was constructed using Equation (9).
4. Experiments
This section describes the AR database [22] that was used for evaluation. A comparative evaluation was applied between the proposed approach and the standard transforms such as Karhunen–Loève Transform (KLT) [23] and Wavelet Transform (WT) [24]. Further, two matrices were used to measure the performance of our proposed method and to compare the proposed MCT with the aforementioned transforms. All the experiments have been implemented by dividing each image of size into input blocks. Only three parameters of size were used to obtain the reconstructed blocks.
4.1. Databases
The AR database [22] contains over 4000 colored facial images. These images include different facial expressions which were collected from 126 subjects (70 men and 56 women) during different illumination conditions and occlusions. A total of three occlusions were involved in this database; namely, prescription eyeglasses, sunglasses, and scarf. These occlusions represent the main challenge for facial biometric modality since they represent important parts of the human face. In addition, four facial expressions were captured including neutral expression, smile, anger, and scream. Additionally, three light conditions were applied to the database; namely, left light, right light, and all side light. This database was collected in two sessions separated by 14 days. Two subset were included in this database, firstly, 2600 warp facial images of size as (bmp) image format. The second subset was 3315 facial images of size as (raw) image format. Moreover, 16 images of different sizes and image formats were collected randomly, to expand the visual evaluation.
4.2. Visual Comparative Evaluation
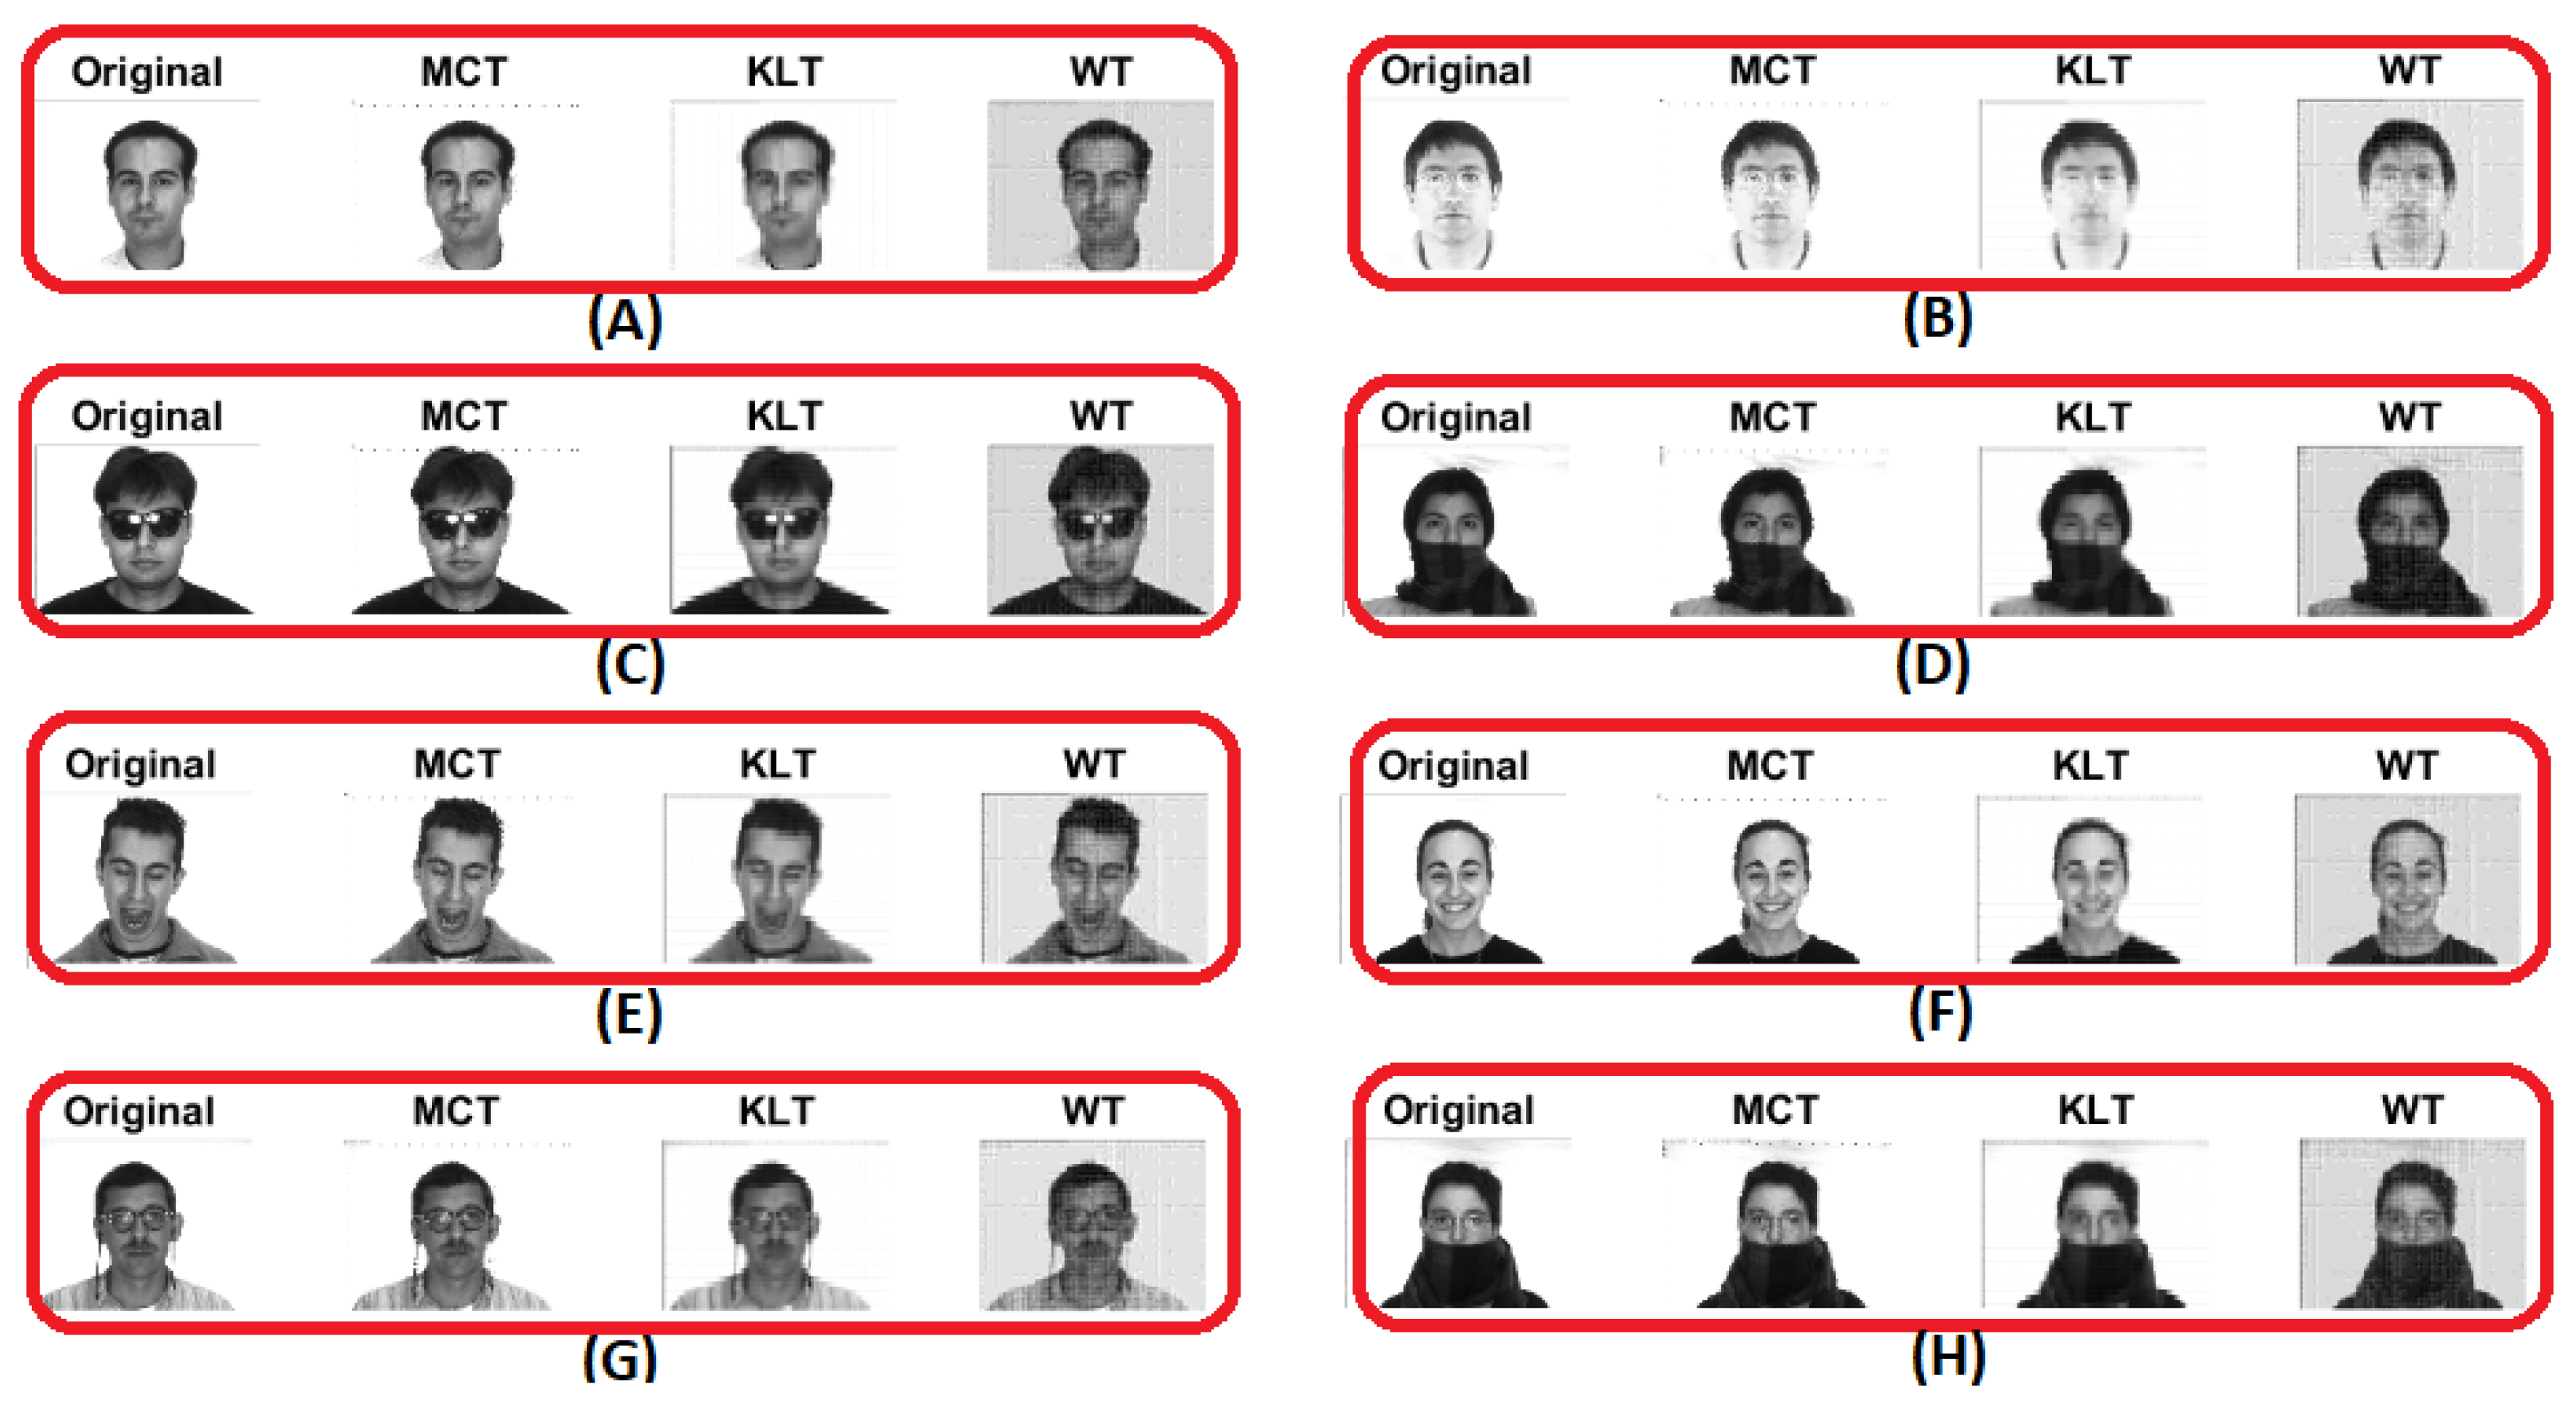
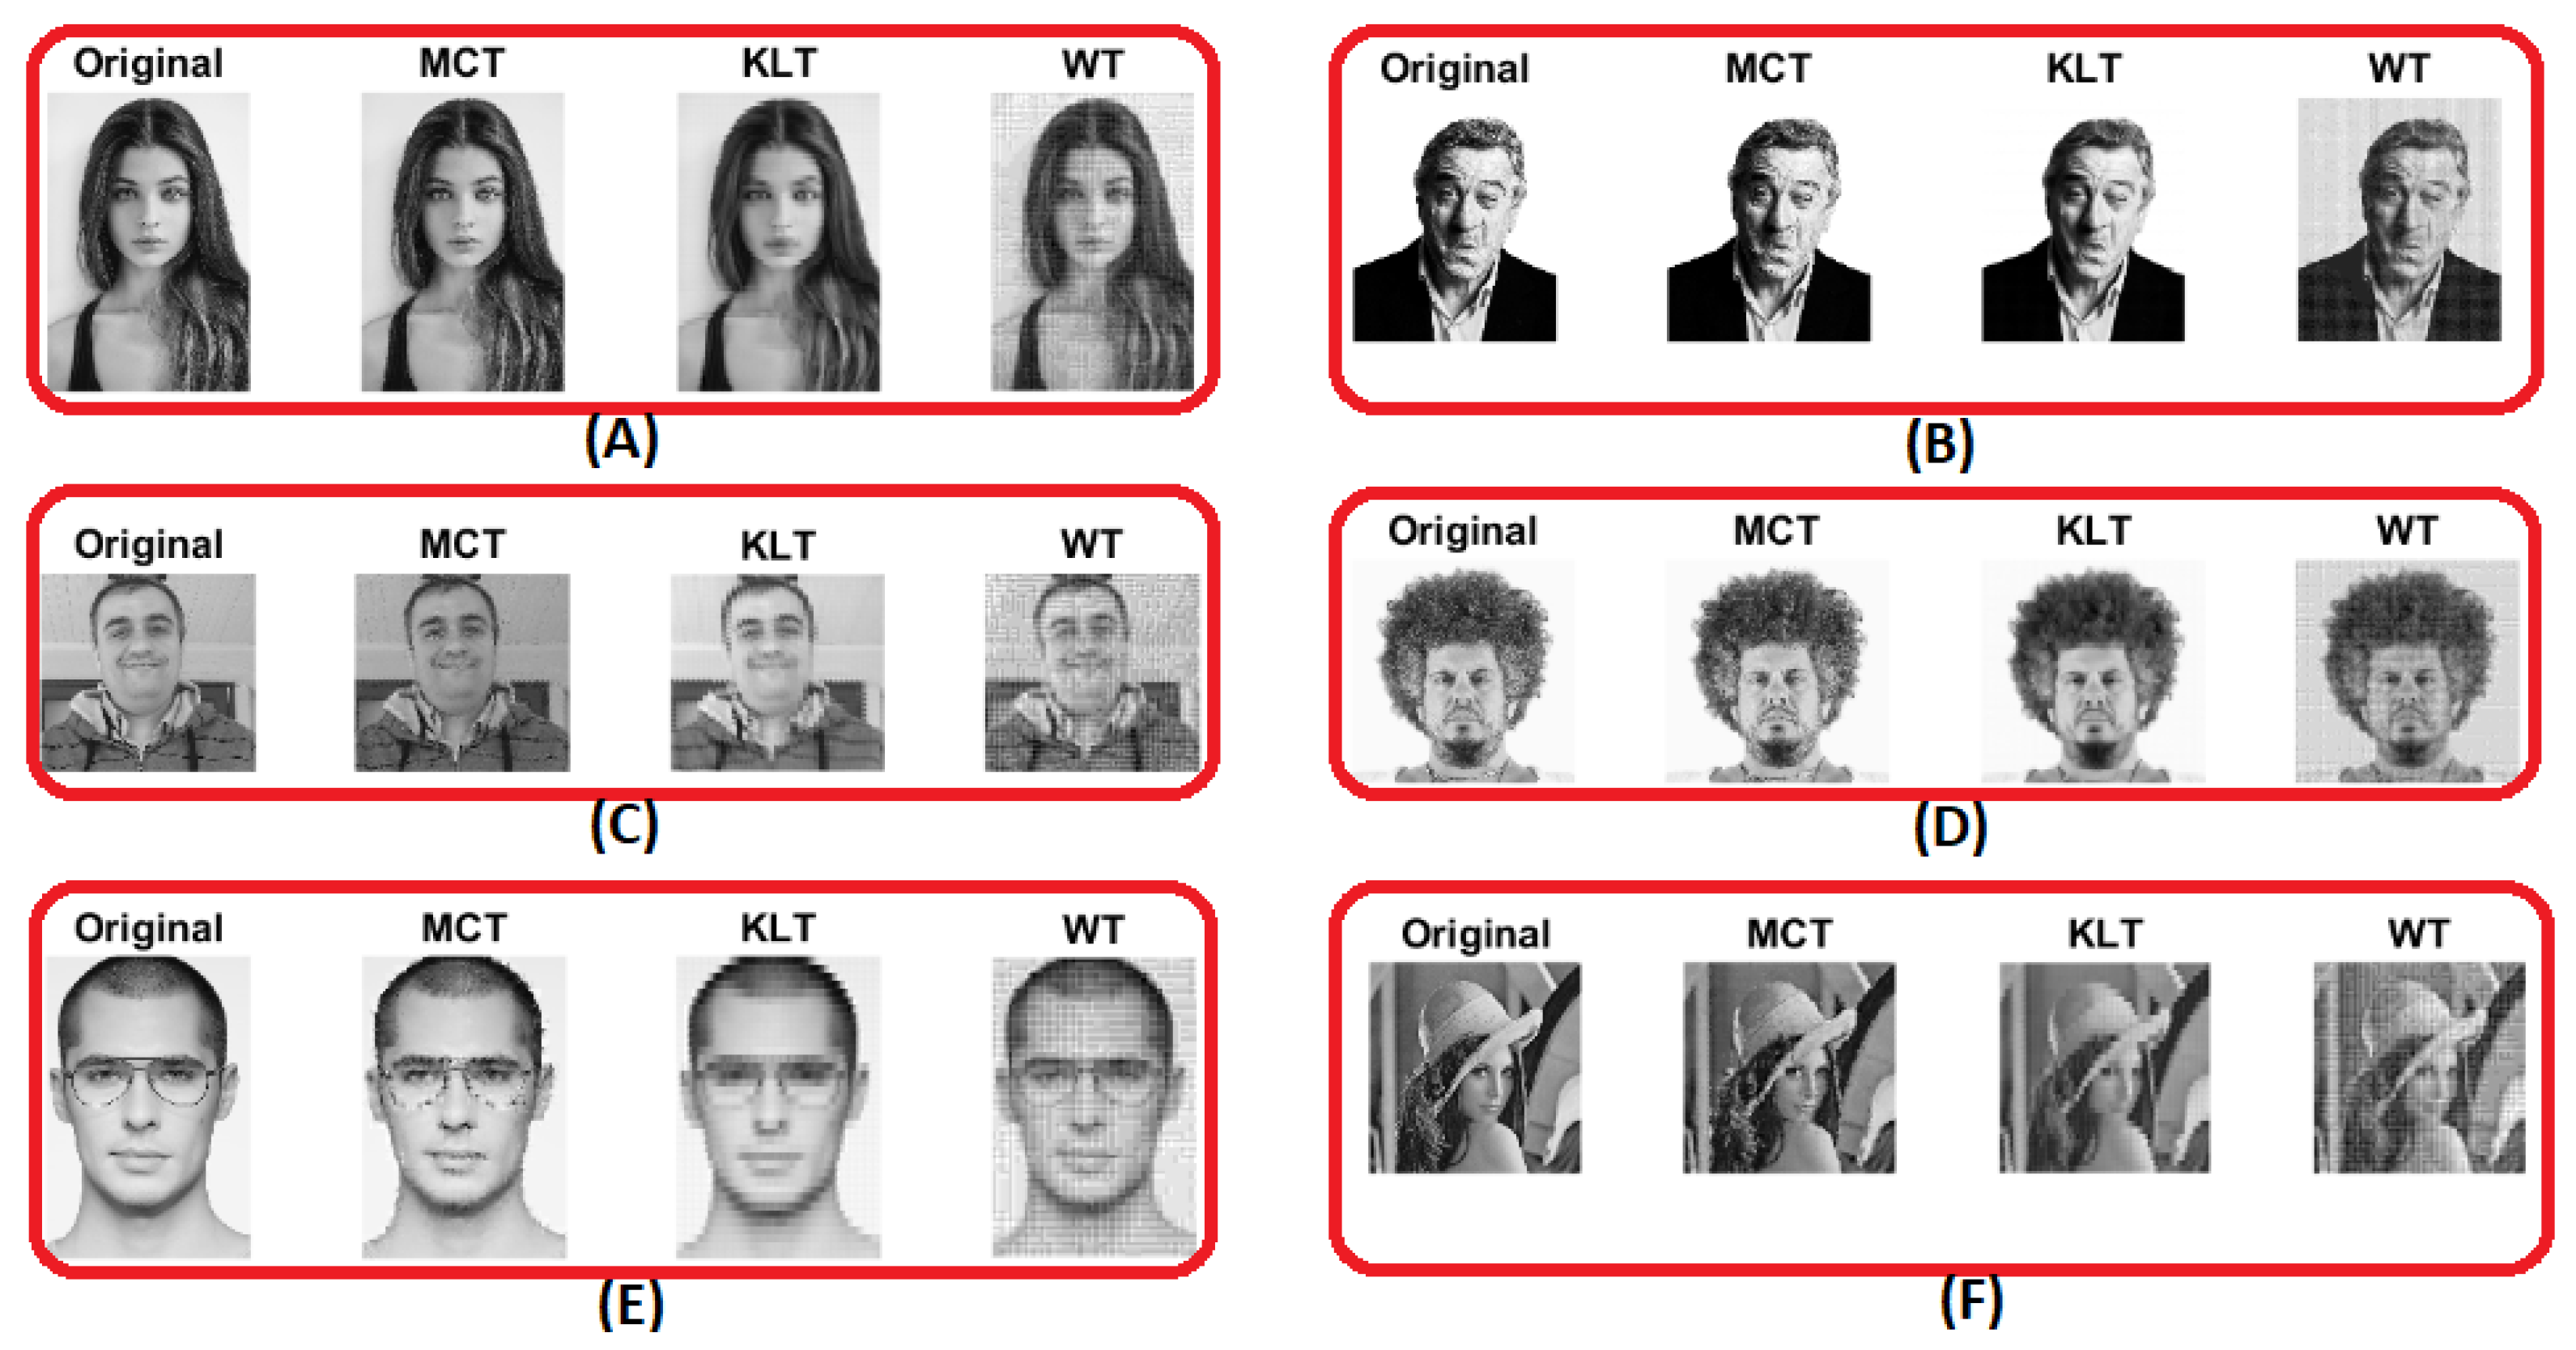
A visual comparative evaluation was applied on the warp subset of AR database as shown in Figure 10. This evaluation involved different subjects (people), facial expressions, occlusions, sessions and light conditions. The proposed scheme (MCT) demonstrates powerful visual reconstruction versus the KLT and WT transforms.
Figure 10A shows an evaluation of the scheme, which was applied to neutral facial expression without any occlusion. Similarly, Figure 10B involves a prescription eyeglass occlusion while Figure 10C,D show other types of occlusion including sunglasses and scarf. Figure 10E–G show evaluations which were applied on three facial expressions—screaming, smiling, and anger, respectively. Figure 10H was applied on two types of occlusion; namely, prescription eyeglasses and scarf.
The suggested scheme shows a reasonable visual performance on the solid biometric modalities such as human face and ocular region. In addition, the suggested scheme maintains the visual features of the soft biometric modalities such as eyebrows, prescription eyeglasses, sunglasses, and scarf. As result, the suggested scheme could be applied as an information extractor method for solid and soft biometric identification.
In the same manner, Figure 11 shows a visual comparative evaluation applied on the full image of the AR database. This evaluation included the similar diversity shown in Figure 10; that is, different people, facial expressions, occlusions, sessions, and light conditions. It is felt that the proposed scheme (MCT) shows a visual robustness in comparison with KLT and WT transforms.
Figure 11A shows a reconstruction for a neutral face expression, while Figure 11B–D show a reconstruction for an occluded face with thin prescription eyeglasses, sunglasses and scarf, respectively. Figure 11E–G show a reconstruction for three facial expressions, namely, screaming, smiling, and anger, respectively. Finally, Figure 11H shows a reconstruction for double occlusions, prescription eyeglasses and scarf.
In the a similar manner, Figure 12 shows a visual comparative evaluation was applied to the random full image selected from websites. This evaluation included four facial expressions that are mentioned in previous figures (Figure 10 and Figure 11). In addition, two occlusions were included in this evaluation that were prescription eyeglasses and hat.
Figure 12A shows a reconstruction for neutral face expression, while Figure 12B–D shows a reconstruction for three facial expressions; namely, screaming, smiling, and anger face. Figure 12E,F shows a construction for two occluded faces by thin prescription eyeglasses and head hat, respectively.
The suggested scheme (MCT) indicates the superiority of reconstruction for solid biometric modalities (face and ocular region) and for soft biometric modalities (eyebrow, prescription eyeglasses, sunglasses, scarf, and head hat) over the KLT and WT. Meanwhile, the aforementioned evaluations were applied on 5931 facial images which included 2600 warp faces of AR database, 3315 full images of AR database, and 16 random full images from different websites.
4.3. Metric Comparative Evaluation
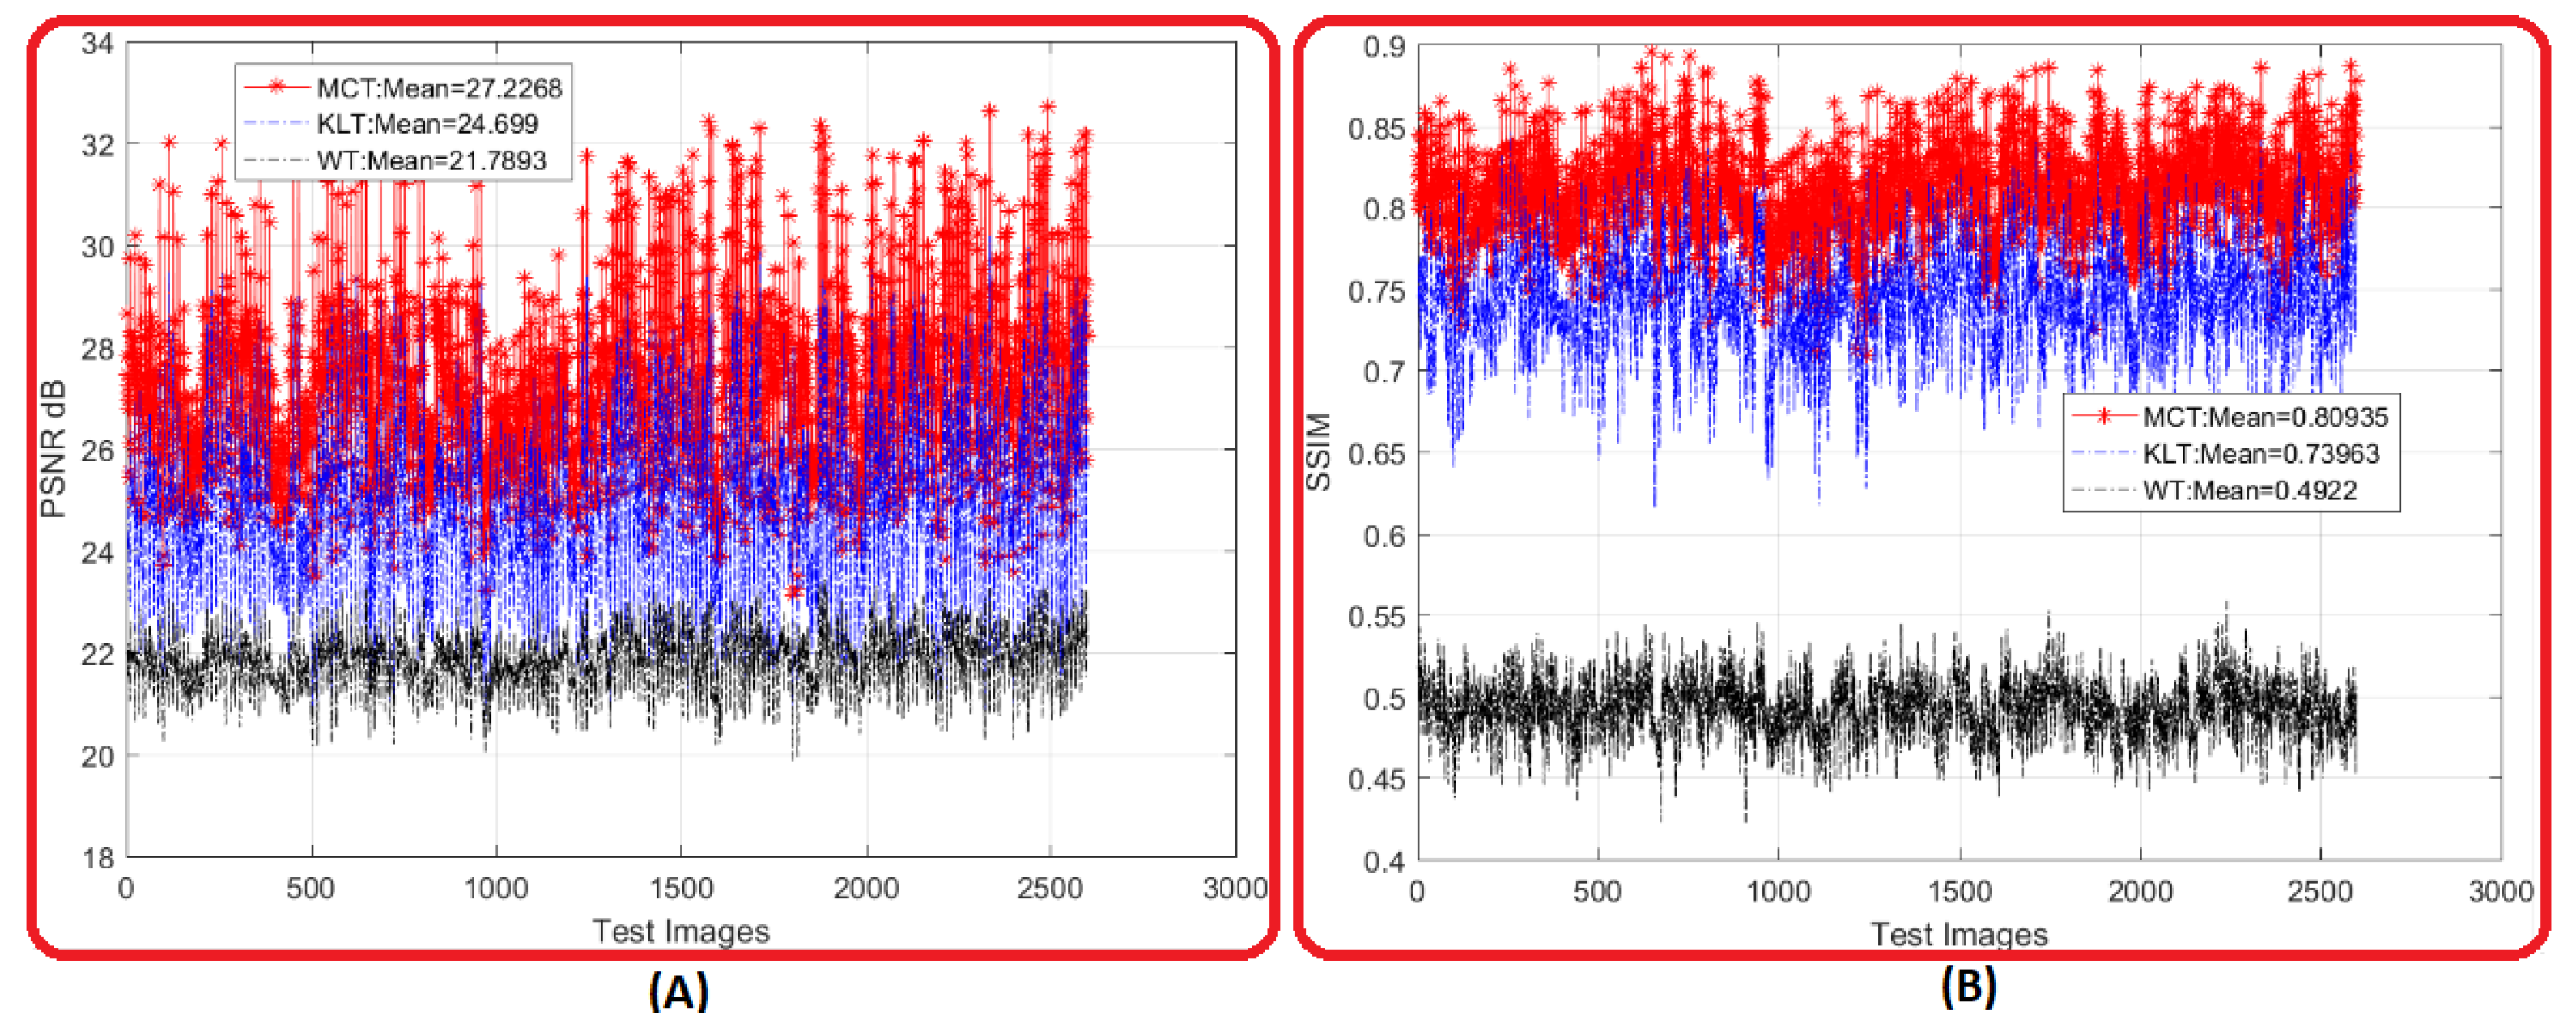
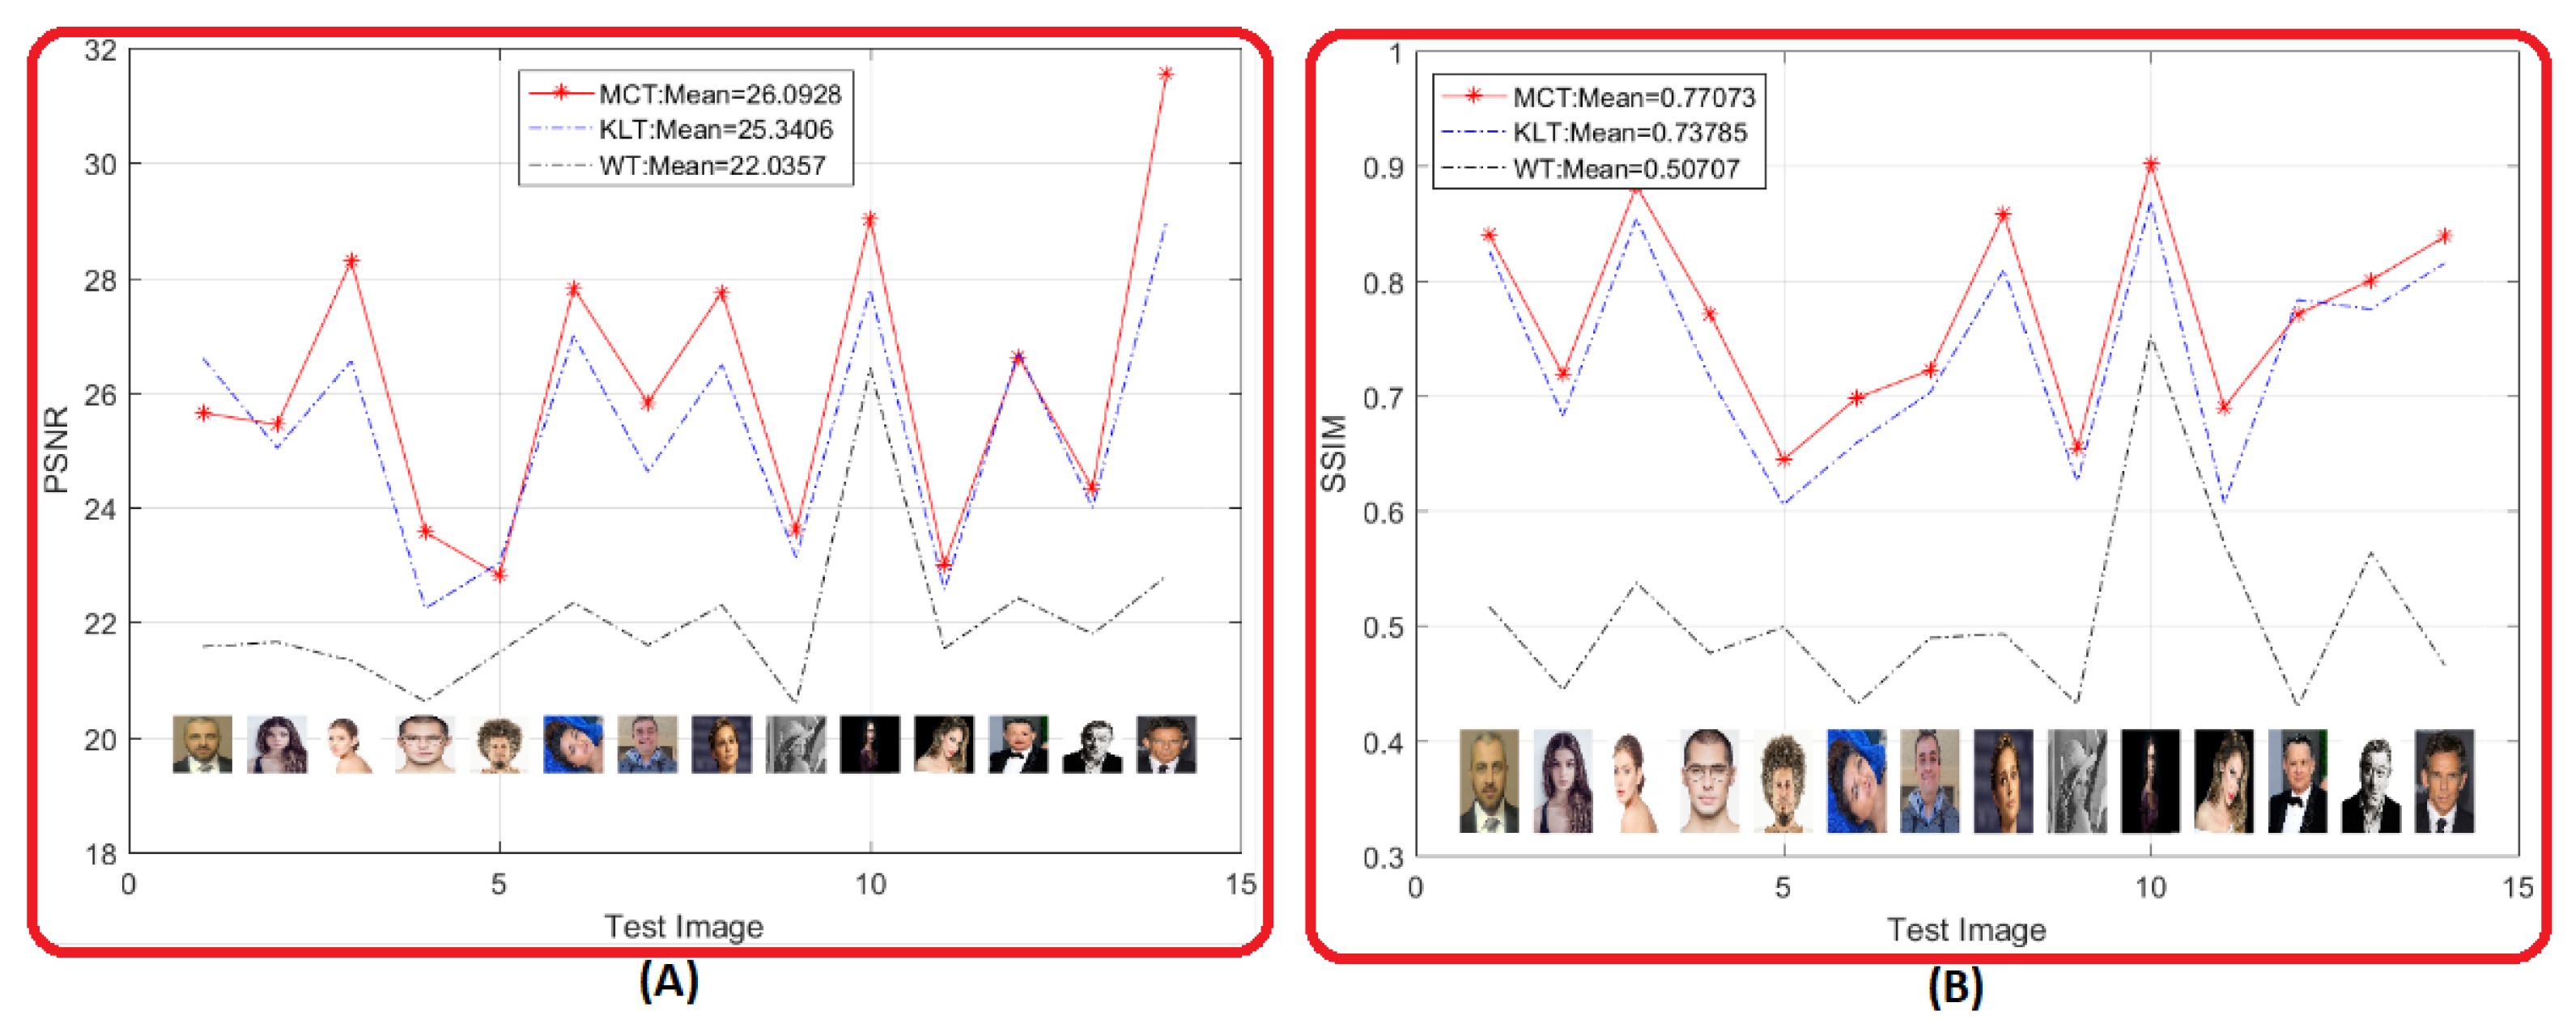
Figure 13 shows an evaluation applied on 2600 warp facial images inside the AR database. In this evaluation, two metrics were used to measure the transforms performance which were Peak Signal to Noise Ratio (PSNR) and Structure Similar Index Measure (SSIM). In Figure 13A, the PSNR for MCT of the 2600 warp facial images surpassed the existed methods of KLT and WT for all images. Also, the average PSNR for MCT was while the average PSNR for KLT and WT was and , respectively.
On the other hand, Figure 13B shows a powerful structure similarity for MCT between the 2600 reconstructed warp facial images and the original images with an average SSIM of . In comparison, the average SSIM for the existing KLT and WT methods was and , respectively. Further, the reconstructed MCT kept about of warp facial information, while the KLT and WT kept about and of facial information, respectively.
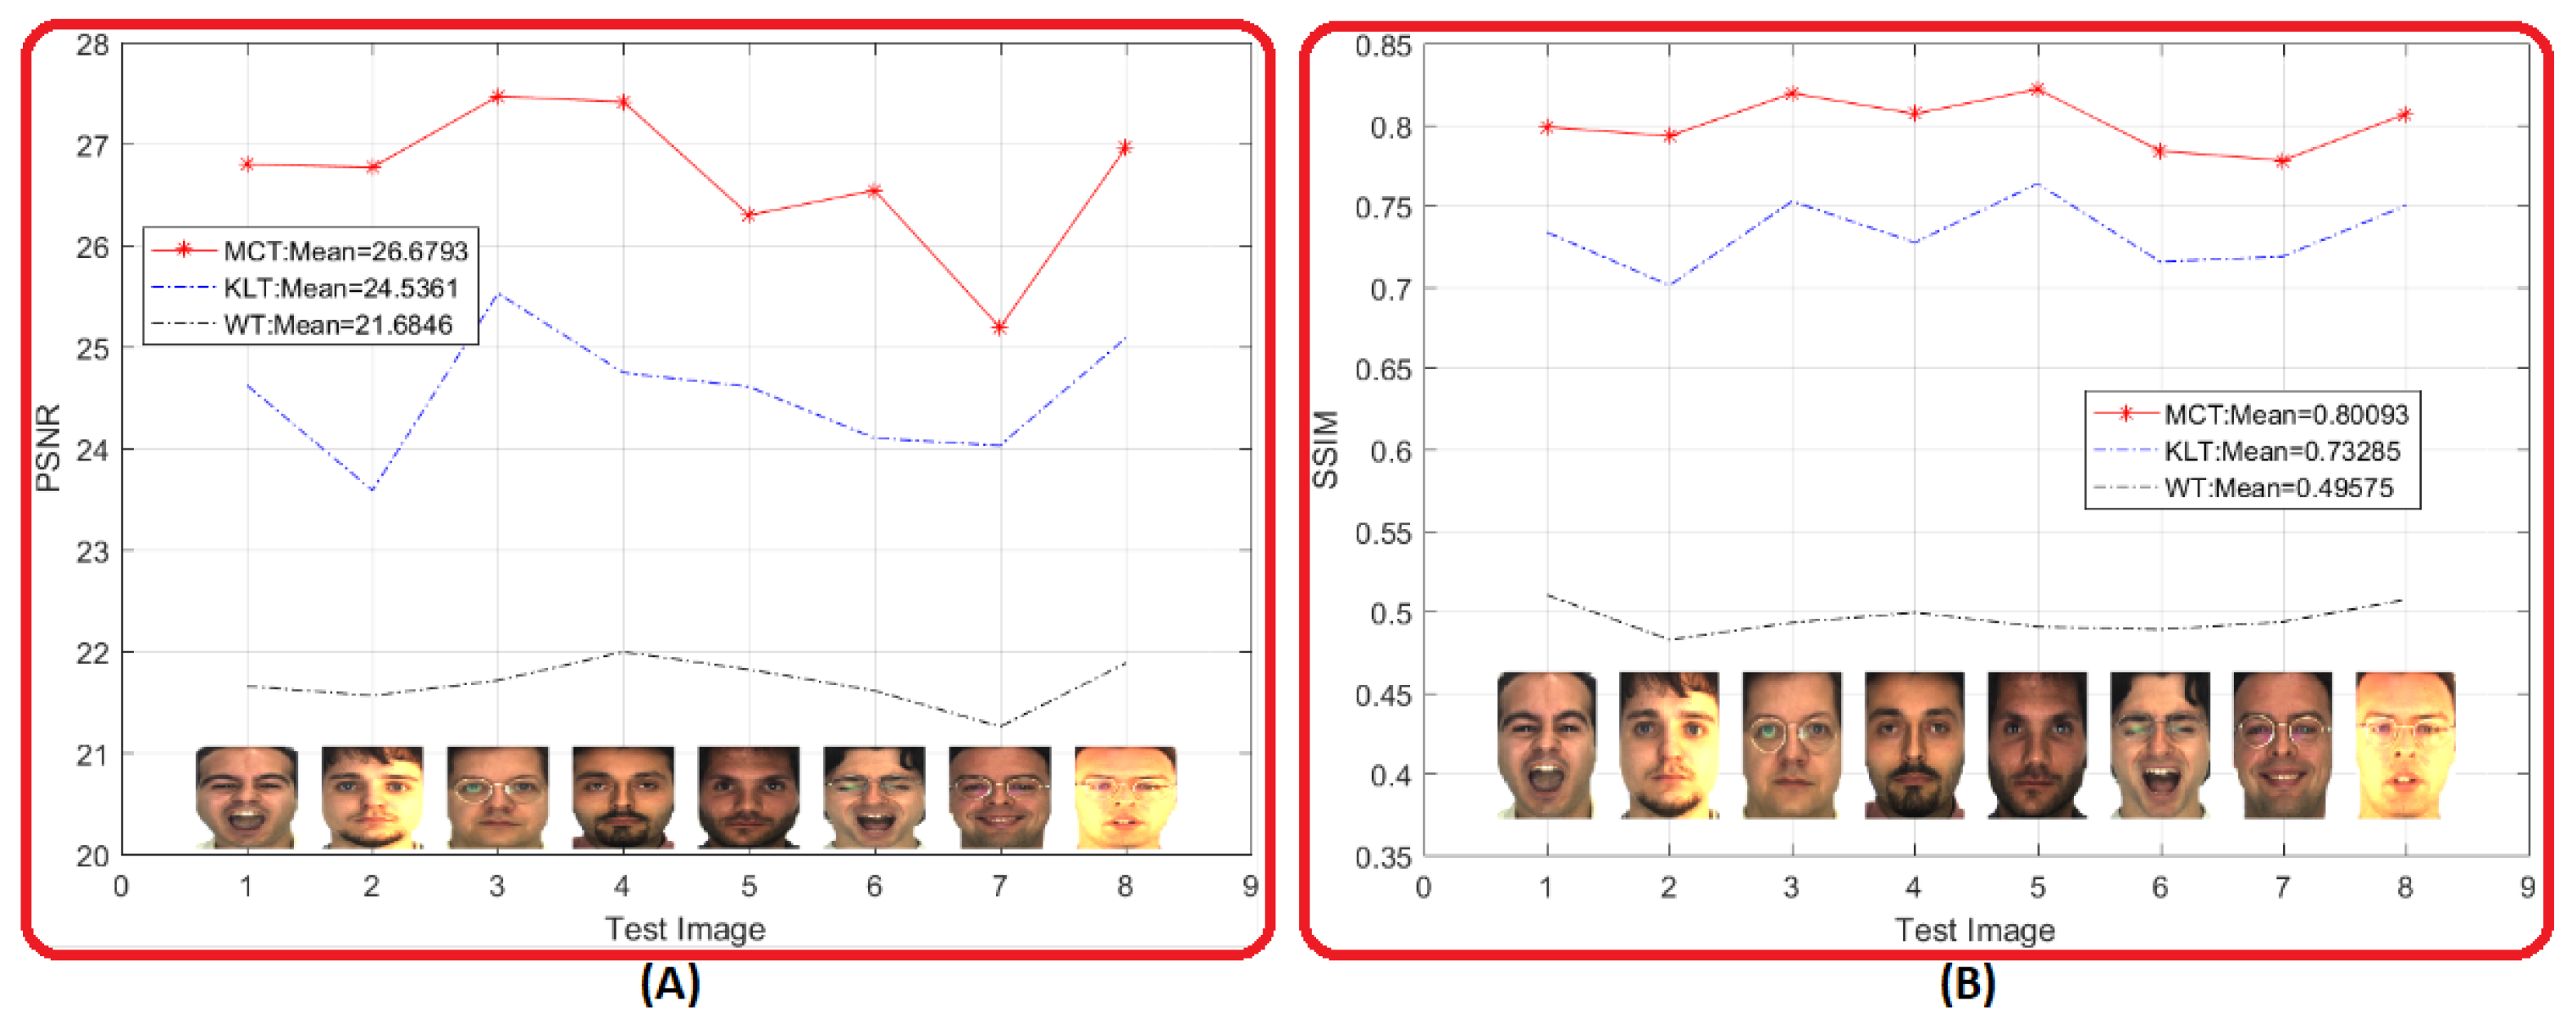
Figure 14 shows a random view from the previous evaluation shown in Figure 13. Eight random warp facial images were selected out of 2600 facial images of the AR database to show a representative view of the difference between the proposed MCT and the existing KLT and WT methods in respect to PSNR and SSIM. Additionally, sensitivity of PSNR and SSIM for different facial expression and facial occlusion are shown. Images 1, 2, 5, and 7 show the metric sensitivity for screaming, neutral, anger, and smile face. Meanwhile, images 3 and 8, show the metric sensitivity for persons wearing a prescription eyeglasses as a software biometric.
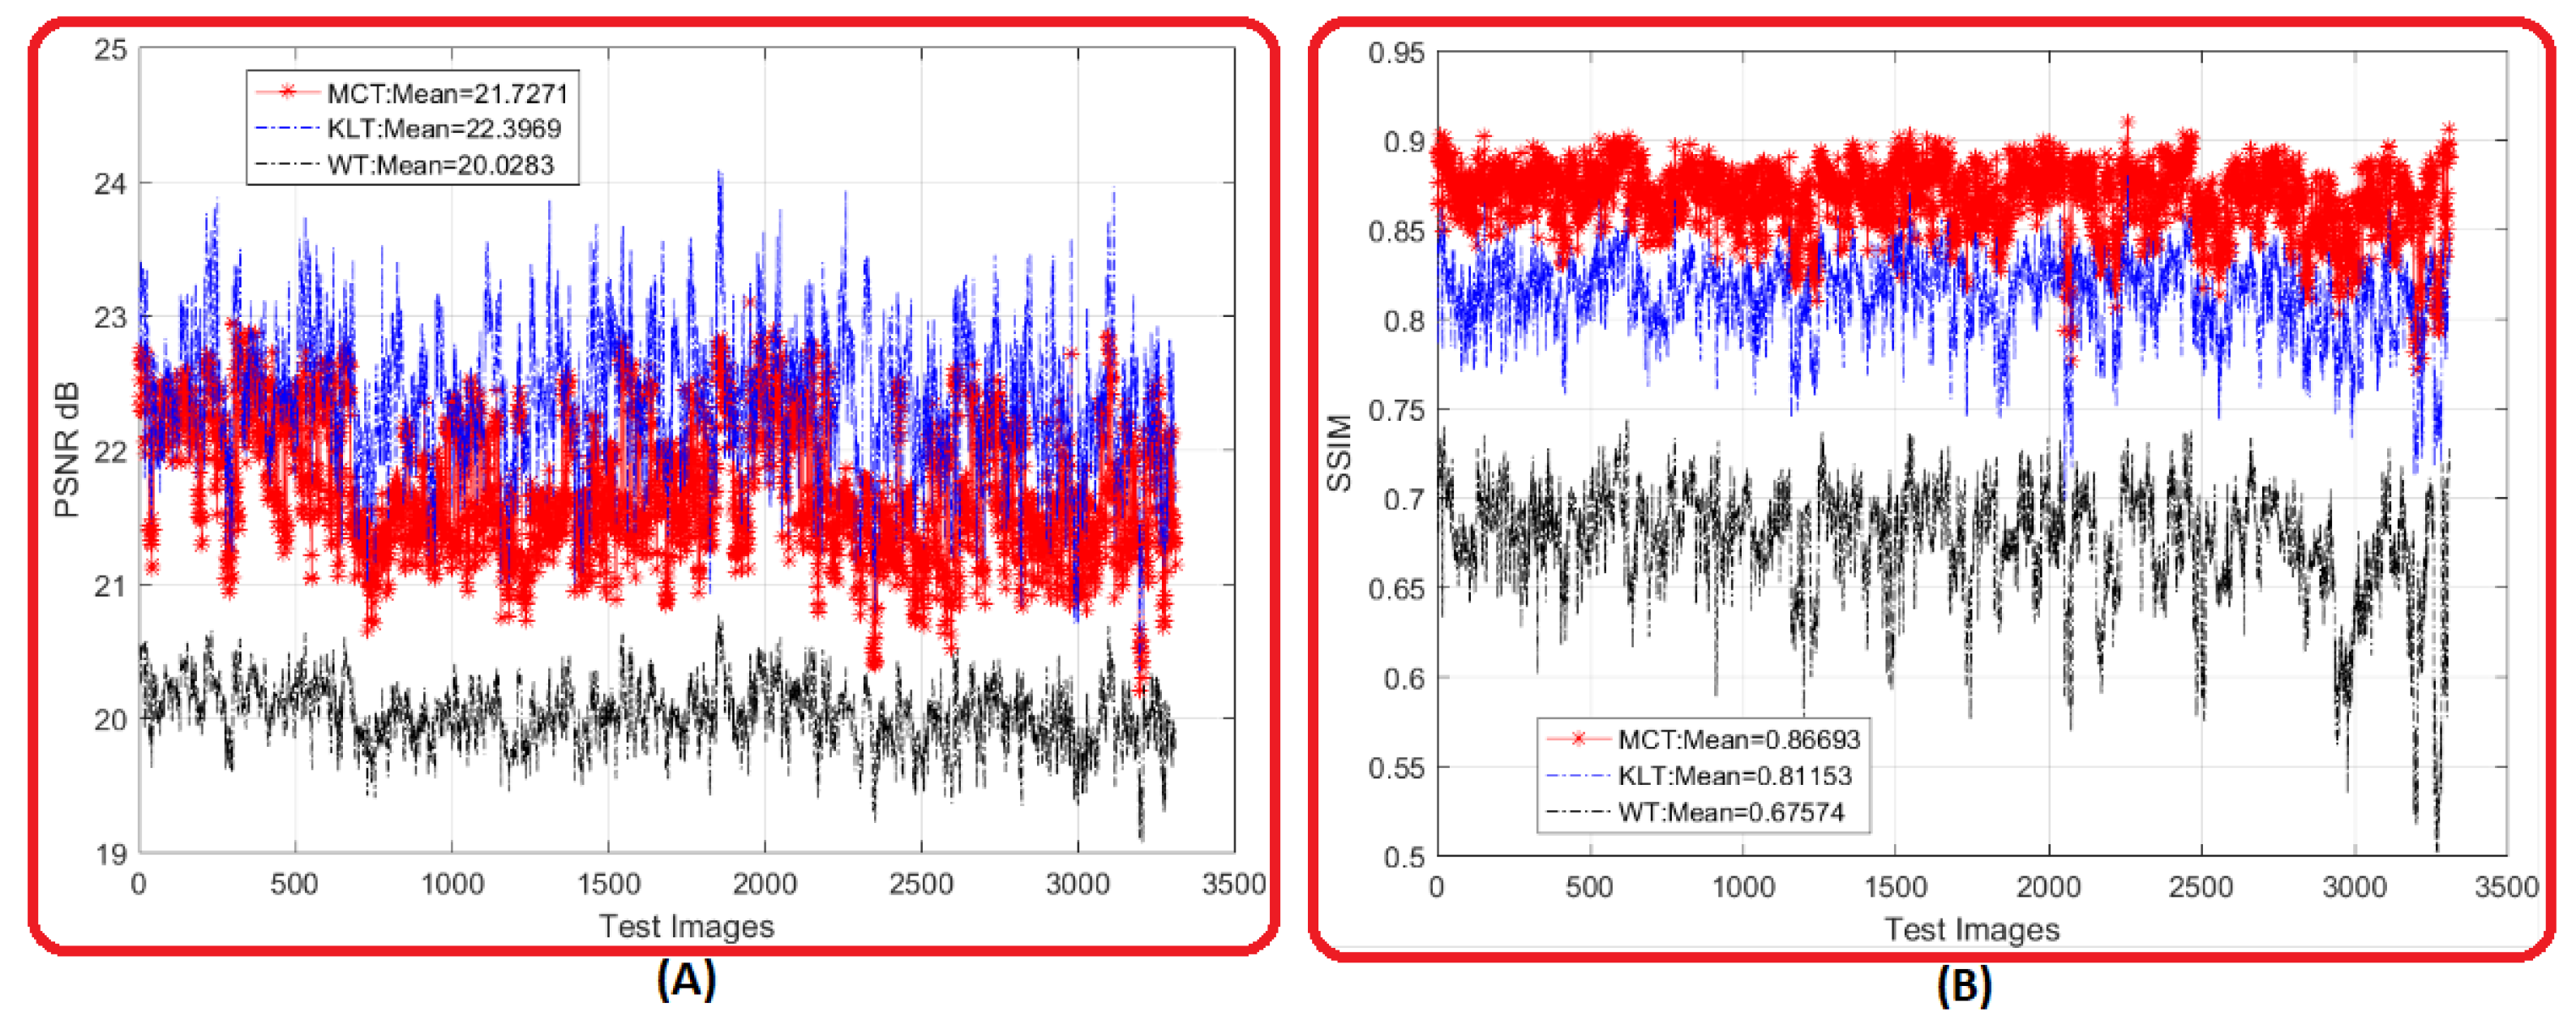
Figure 15 shows an evaluation applied on the 3315 full facial images inside the AR database. Two metrics were used; namely, PSNR and SSIM. PSNR evaluation is shown in Figure 15A in which the KLT outperforms MCT and WT with a PSNR average of while the other two methods had values of and , respectively. However, the structure similarity of the proposed MCT still had the highest SSIM over the other two existing methods for the entire 3315 full facial images. In Figure 15B, MCT had an average SSIM of while KLT and WT had a SSIM of and , respectively. Therefore, the reconstructed full facial images kept about of the original facial information under the proposed method, while the KLT and WT kept about and , respectively.
Figure 16 shows an evaluation applied on 16 random full facial images selected from different websites. A similar manner of evaluation which was applied as per Figure 14; this demonstrates a close sensitivity of PSNR and SSIM for different facial expressions and facial occlusions in the full facial images. For instance, images 2, 5, 7, and 15 show sensitivity for PSNR and SSIM for different facial expressions; namely, neutral, anger, smile, and screaming face. Meanwhile, the images 4 and 9 show sensitivity to PSNR and SSIM for two facial occlusion; namely, prescription eyeglasses and head hat. In most cases shown in Figure 16, the proposed MCT shows superior outstanding performance over KLT and WT.
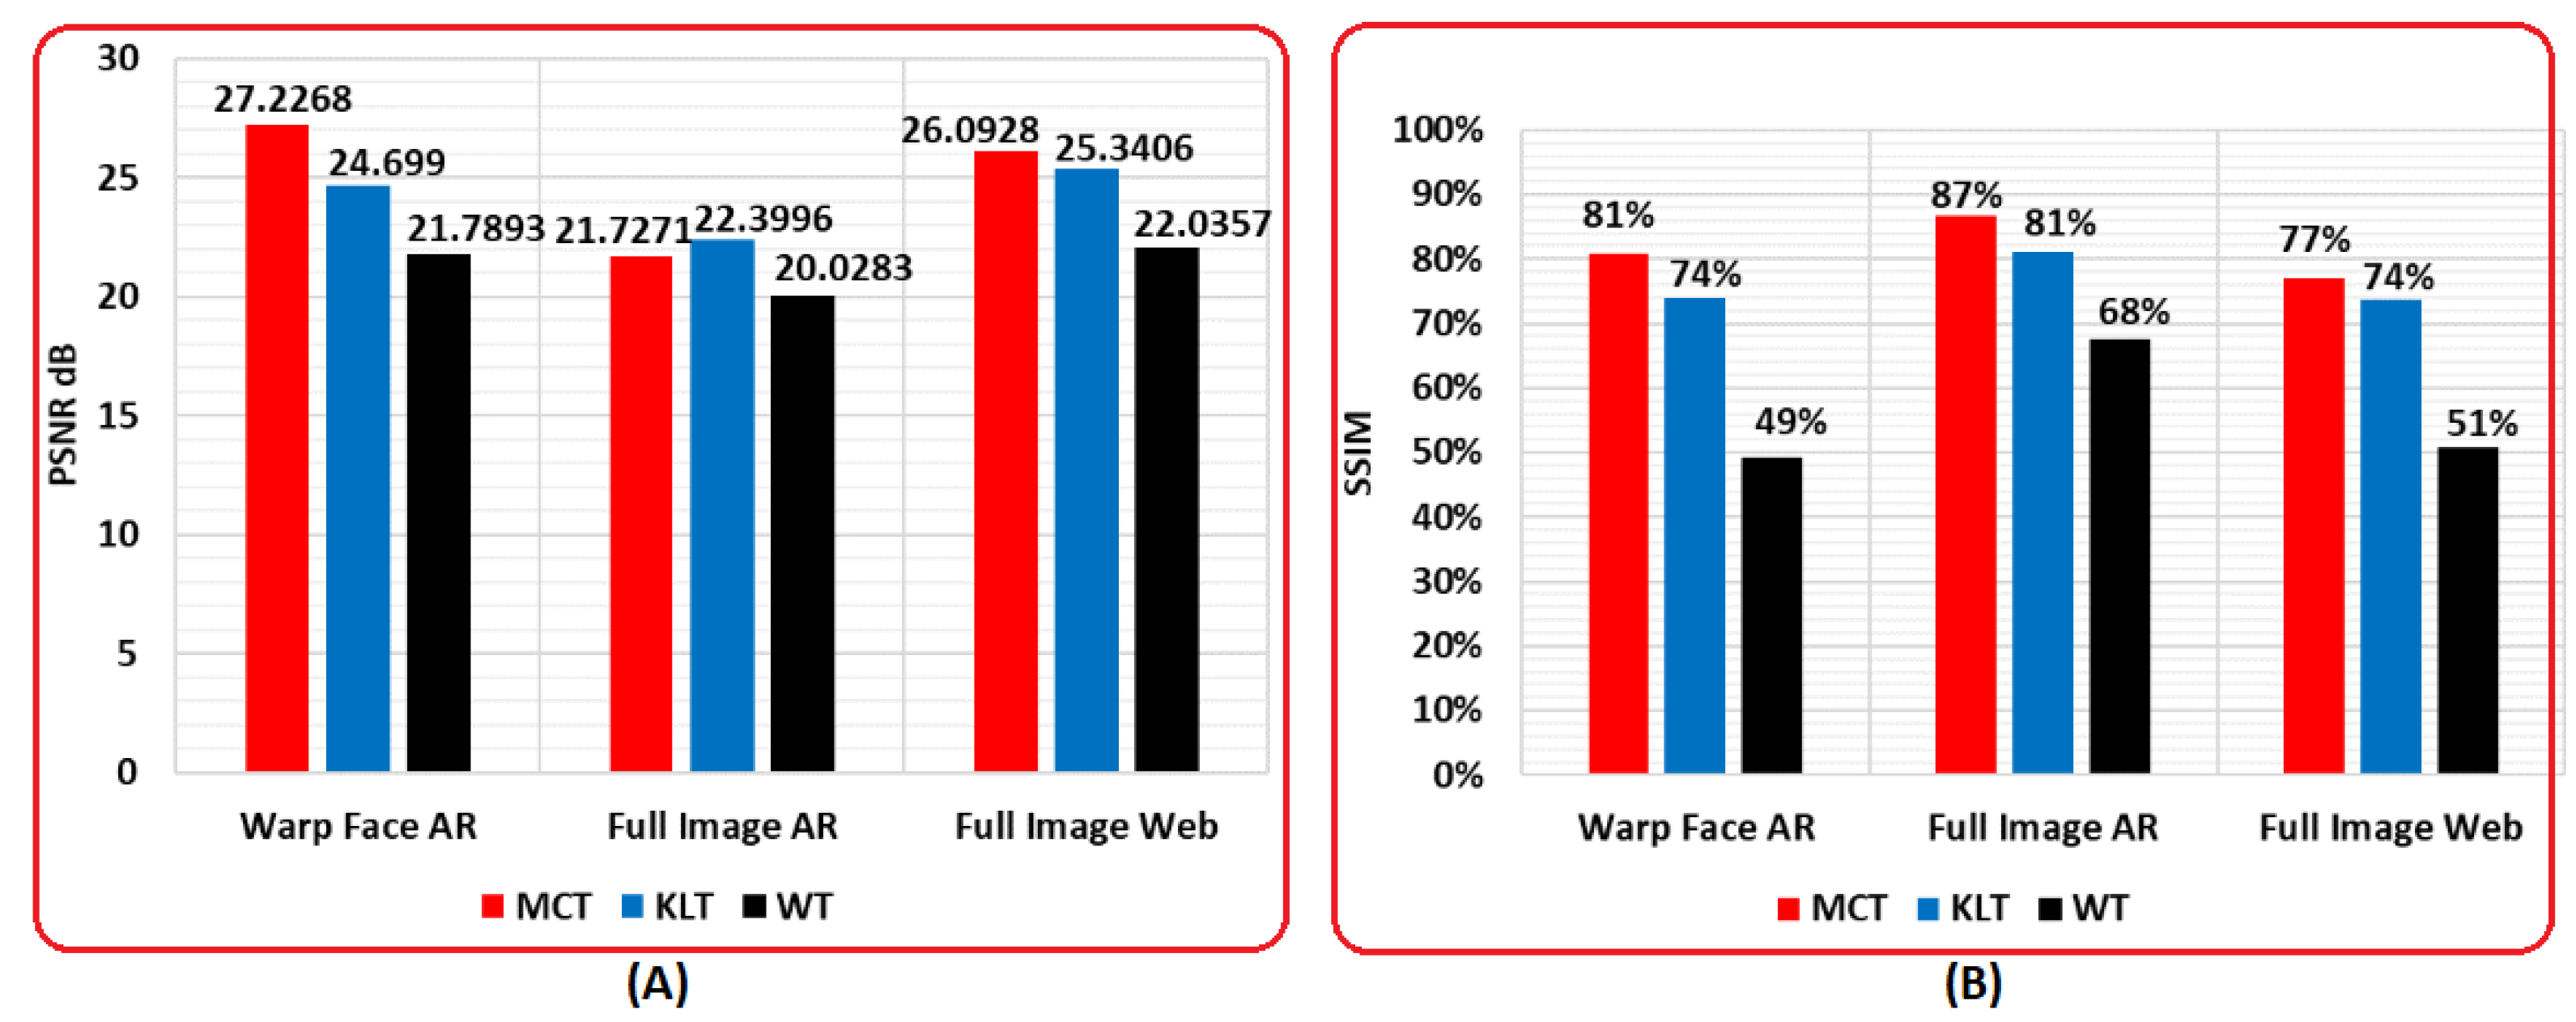
Figure 17 shows a metric comparative evaluation for datasets with respect to PSNR and SSIM. Figure 17A shows a PSNR comparison between three datasets in which the proposed MCT of warp facial images got a highest value of . The MCT, which was applied on full images of the AR database and websites, obtained values of and , respectively. The MCT application to warp facial images overcame the KLT and WT of warp facial images within the same dataset. However, the MCT of the full images of AR database was dropped by in comparison with KLT of the full images of AR database. This was affected by the image background, which could be similar in some cases to human skin color and to fabrics of some clothes (these two parameters do not exist in the warp or the AR database for the same subjects). Additionally, the MCT was superior in comparison to both KLT and WT for full images of websites.
In addition, Figure 17B shows the superiority of the proposed MCT over KLT and WT in respect of SSIM. Therefore, the structural similarity between reconstructed images of MCT and the original images in the entire used datasets was the highest for all methods. It was noted, for the warp face of AR, the SSIM for MCT was , while KLT and WT were and , respectively. In respect of the full images of AR, SSIM for MCT was while it was and for KLT and WT. Finally, the MCT of full images from websites had , while KLT and WT had and , respectively.
4.4. Complexity and Time Comparative Evaluation
In general, the calculation of the transform complexity is manifold and ambiguous; so, in this work, the complexity metric will be summarized as a number of the mathematical operations. This factor is ambiguous since it comprises mathematical operations such as addition and multiplication, and the input of these operations could be an integer or floating numbers. As a result, the number of mathematical operations is not an even-handed evaluation metric however, it can be considered as an acceptable metric for transform complexity [25].
At this point, the complexity could be estimated for each block of size as follows, for four levels, Haar WT the complexity (C(WT)) has and the KLT complexity (C(KLT)) has for coding and decoding sides. The coding complexity of MCT (C(MCTc)) has and the decoding complexity of MCT (C(MCTd)) has . To recap, the complexity of coding operation is sorted as C(MCTd) < C(WT) < C(KLT) < C(MCTc).
However, because modern computers use parallel processing to execute the block operation simultaneously, the transform, which is dependent on block operation (which both MCT and KLT and are dependent on), could be time superior.
On the other side, some transforms that depend on point operation (such as WT) rather than block operation could be inferior. Therefore, the time execution of MCT and KLT would be faster than WT. Table 1 shows the coding, decoding, and the total time for the proposed MCT, KLT, and WT transforms on three datasets. It was calculated using an Intel(R) Core(TM) CPU Ghz, and 16 GB of RAM.
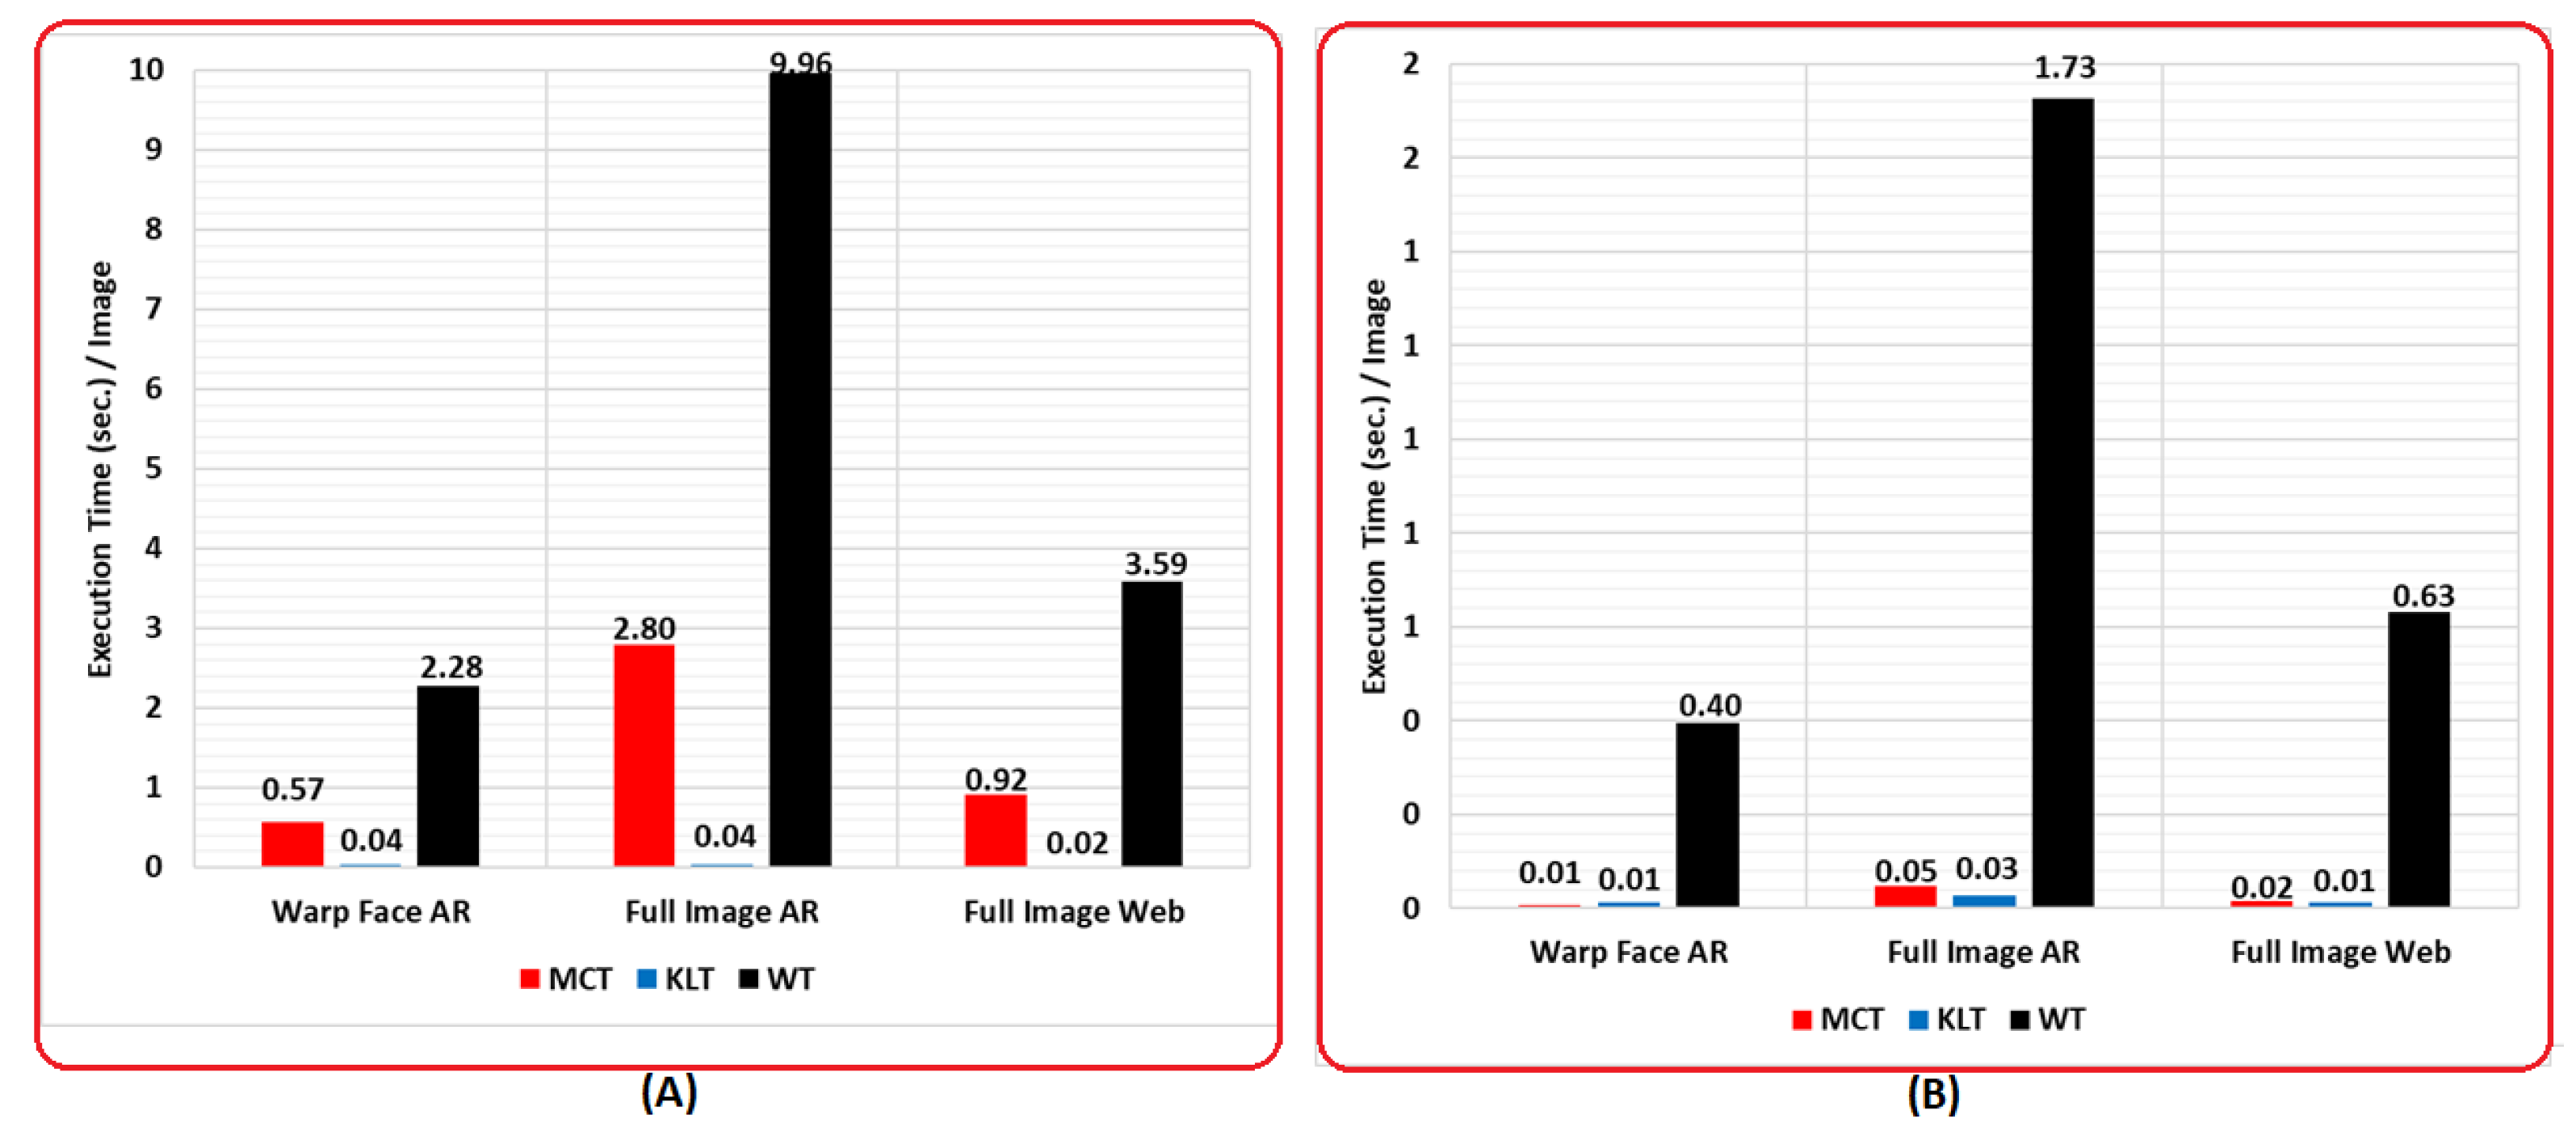
Figure 18A shows the execution time of coding processes with an average of execution time for WT which was higher than the MCT by 4 times. The average execution time of MCT was higher than the KLT by 40 times. Figure 18B shows the execution time of the decoding processes for which the average of execution time for WT was higher than the MCT by 38 times, while the average execution time of MCT was higher than the KLT by times. Moreover, the decoding time is considered more valuable than the coding time, since the decoding operation could be used more frequently whilst the coding operation could be used just once.
5. Conclusions and Future Work
In this paper, a new transform was proposed for data reduction and was applied on large evaluation of the AR database (warp face and full image face) along with selected facial images from websites. The reconstructed images from the proposed transform have a higher SSIM and PSNR values over the KLT and WT methods.
A large set of data was represented by a small number of parameters with valuable information preserved. The proposed MCT can be used as an initial stage evaluation for different applications such as biometric verification system, object recognition, semantic segmentation, and image retrieval.
MCT is considered superior to other ranking transforms such as KLT and WT within appointed pattern (warp faces), since KLT and WT are general transforms, whilst MCT is a transform that depends on a particular codebook that is related to a particular field. Specifically, the proposed scheme could be improved through the constructed codebook unique to operation, in contrast with KLT and WT which have a stationary process.
Author Contributions
All the authors made significant contributions to this work. Conceptualization, D.Z. and A.S.M.; methodology, D.Z.; software, A.S.M.; validation, D.Z. and A.S.M.; formal analysis, W.K.; investigation, A.S.M. and D.Z.; resources, W.K.; data curation, W.K. and A.S.M.; writing–original draft preparation, A.S.M. and D.Z.; writing–review and editing, W.K.; visualization, A.S.M.; supervision, D.Z. All authors have read and agreed to the published version of the manuscript.
Funding
This research received no external funding.
Acknowledgments
We would like to present our thanks to Mustansiriyah university for supporting our experiments in providing us all the necessary data and software.
Conflicts of Interest
The authors declare no conflict of interest.
Abbreviations
The following abbreviations are used in this manuscript:
| MCT | Multi Chimera Transform |
| KLT | Karhunen–Loeve Transform |
| WT | Wavelet Transform |
| DCT | Discrete Cosine Transform |
| DFT | Discrete Fourier Transform |
| CT | Chimera Transform |
| PSNR | Peak Signal to Noise Ratio |
| SSIM | Structure Similarity Index Measure |
References
- Oliver, K.; Hou, W.; Wang, S. Image feature detection and matching in underwater conditions. In Proceedings of the SPIE Ocean Sensing and Monitoring II, Orlando, FL, USA, 20 April 2010; Volume 7678, p. 76780N. [Google Scholar]
- Lecron, F.; Benjelloun, M.; Mahmoudi, S. Descriptive image feature for object detection in medical images. In Proceedings of the International Conference Image Analysis and Recognition, Aveiro, Portugal, 25–27 June 2012; pp. 331–338. [Google Scholar]
- Kumawat, A.; Panda, S. Feature detection and description in remote sensing images using a hybrid feature detector. Procedia Comput. Sci. 2018, 132, 277–287. [Google Scholar] [CrossRef]
- Kam-art, R.; Raicharoen, T.; Khera, V. Face recognition using feature extraction based on descriptive statistics of a face image. In Proceedings of the 2009 International Conference on Machine Learning and Cybernetics, Baoding, China, 12–15 July 2009; Volume 1, pp. 193–197. [Google Scholar]
- Tahir, N.M.; Hussain, A.; Samad, S.A.; Husain, H.; Rahman, R. Human shape recognition using Fourier descriptor. J. Electr. Electron. Syst. Res. 2009, 2, 19–25. [Google Scholar]
- Guedri, B.; Zaied, M.; Amar, C.B. Indexing and images retrieval by content. In Proceedings of the 2011 International Conference on High Performance Computing & Simulation, Istanbul, Turkey, 4–8 July 2011; pp. 369–375. [Google Scholar]
- Fareed, M.M.S.; Chun, Q.; Ahmed, G.; Murtaza, A.; Rizwan Asif, M.; Fareed, M.Z. Salient region detection through salient and non-salient dictionaries. PLoS ONE 2019, 14, e0213433. [Google Scholar] [CrossRef] [PubMed]
- Bouganis, C.S.; Pournara, I.; Cheung, P.Y. Efficient mapping of dimensionality reduction designs onto heterogeneous FPGAs. In Proceedings of the 15th Annual IEEE Symposium on Field-Programmable Custom Computing Machines (FCCM 2007), Napa, CA, USA, 23–25 April 2007; pp. 141–150. [Google Scholar]
- Divya, A.; Raja, K.; Venugopal, K. Sorting Pixels based Face Recognition Using Discrete Wavelet Transform and Statistical Features. In Proceedings of the 2019 3rd International Conference on Imaging, Signal Processing and Communication (ICISPC), Singapore, 27–29 July 2019; pp. 150–154. [Google Scholar]
- Manikantan, K.; Govindarajan, V.; Kiran, V.S.; Ramachandran, S. Face recognition using block-based DCT feature extraction. J. Adv. Comput. Sci. Technol. 2012, 1, 266–283. [Google Scholar]
- Hui, S.; Żak, S. Discrete Fourier transform based pattern classifiers. Bull. Pol. Acad. Sci. Tech. Sci. 2014, 62, 15–22. [Google Scholar] [CrossRef] [Green Version]
- Khalaf, W.; Mohammad, A.S.; Zaghar, D. Chimera: A New Efficient Transform for High Quality Lossy Image Compression. Symmetry 2020, 12, 378. [Google Scholar] [CrossRef] [Green Version]
- Georgy, K.; Forczmański, P. Data Dimensionality Reduction for Face Recognition. MGV 2004, 13, 99–121. [Google Scholar]
- Ghazali, K.H.; Mansor, M.F.; Mustafa, M.M.; Hussain, A. Feature extraction technique using discrete wavelet transform for image classification. In Proceedings of the 2007 5th Student Conference on Research and Development, Selangor, Malaysia, 11–12 December 2007; pp. 1–4. [Google Scholar]
- Hafed, Z.M.; Levine, M.D. Face recognition using the discrete cosine transform. Int. J. Comput. Vis. 2001, 43, 167–188. [Google Scholar] [CrossRef]
- Bi, S.; Wang, Q. Fractal image coding based on a fitting surface. J. Appl. Math. 2014, 2014, 634848. [Google Scholar] [CrossRef]
- Hua, Z.; Zhang, H.; Li, J. Image super resolution using fractal coding and residual network. Complexity 2019, 2019, 9419107. [Google Scholar] [CrossRef]
- Li, S.; Marsaglia, N.; Garth, C.; Woodring, J.; Clyne, J.; Childs, H. Data reduction techniques for simulation, visualization and data analysis. In Computer Graphics Forum; Wiley Online Library: Hoboken, NJ, USA, 2018; Volume 37, pp. 422–447. [Google Scholar]
- Chaturvedi, S.; Chaturvedi, A.; Tiwari, A.; Agarwal, S. Design Pattern Detection using Machine Learning Techniques. In Proceedings of the 2018 7th International Conference on Reliability, Infocom Technologies and Optimization (Trends and Future Directions) (ICRITO), Noida, India, 29–31 August 2018; pp. 1–6. [Google Scholar]
- Barreto, J.; Menezes, P.; Dias, J. Human-robot interaction based on haar-like features and eigenfaces. In Proceedings of the IEEE International Conference on Robotics and Automation, 2004, ICRA’04, New Orleans, LA, USA, 26 April–1 May 2004; Volume 2, pp. 1888–1893. [Google Scholar]
- Aznaveh, A.M.; Azar, F.T.; Mansouri, A. Face data base compression by hotelling transform using segmentation. In Proceedings of the 2007 9th International Symposium on Signal Processing and Its Applications, Sharjah, United Arab Emirates, 12–15 February 2007; pp. 1–4. [Google Scholar]
- Martinez, A.M.; Benavente, R. The AR face database. CVC 1998, 24, 24. [Google Scholar]
- Gastpar, M.; Dragotti, P.L.; Vetterli, M. The distributed karhunen–loeve transform. IEEE Trans. Inf. Theory 2006, 52, 5177–5196. [Google Scholar] [CrossRef] [Green Version]
- Pathak, R.S. The Wavelet Transform; Atlantic Press/World Scientific: Paris, France, 2009. [Google Scholar]
- Thompson, A. The cascading Haar wavelet algorithm for computing the Walsh–Hadamard transform. IEEE Signal Process. Lett. 2017, 24, 1020–1023. [Google Scholar] [CrossRef] [Green Version]
Figure 1.
The block diagram of the proposed Multi-Chimera Transform (MCT). (A) Coding process and (B) Decoding process.
Figure 1.
The block diagram of the proposed Multi-Chimera Transform (MCT). (A) Coding process and (B) Decoding process.

Figure 2.
The diagram of the overall Multi-Chimera Transform.

Figure 3.
The multi-chimera mask bank generation.

Figure 4.
Blocks generation: (A) the 16 facial images for masks bank, and (B) the 256 generated blocks.
Figure 4.
Blocks generation: (A) the 16 facial images for masks bank, and (B) the 256 generated blocks.

Figure 5.
The three generated masks.

Figure 6.
The parameter generation stage.

Figure 7.
An example of the processes of parameter generation in the first iteration.

Figure 8.
The image restoration stage.

Figure 9.
A visual sample for image restoration: (A) Original image, (B) Restored image, (C) Filtered restored image, and (D) Coded Chimera image.
Figure 9.
A visual sample for image restoration: (A) Original image, (B) Restored image, (C) Filtered restored image, and (D) Coded Chimera image.

Figure 10.
A visual comparative evaluation applied on warp face of AR database: (A) neutral expression face during first session, (B) wearing prescription eyeglass with right light on during first session, (C) wearing sunglasses during second session, (D) wearing scarf and right light on during first session, (E) scream during second session, (F) smile face wearing prescription eyeglassduring second session, (G) anger face during first session, (H) anger face wearing scarf and prescription eyeglasses during second session.

Figure 11.
A visual comparative evaluation applied on full image of AR database: (A) Neutral expression face during first session, (B) wearing prescription eyeglass with both side light on during first session, (C) wearing sunglasses during second session, (D) wearing scarf and right light on during second session, (E) Scream during first session, (F) Smile face wearing prescription eyeglassduring first session, (G) Anger face during first session, (H) Anger face wearing scarf and prescription eyeglasses during first session.

Figure 12.
A visual comparative evaluation applied on full image from websites: (A) Neutral expression face, (B) Screaming face, (C) Smiling face, (D) Anger face, (E) wearing prescription eyeglass, (F) Face occlusion by hat.
Figure 12.
A visual comparative evaluation applied on full image from websites: (A) Neutral expression face, (B) Screaming face, (C) Smiling face, (D) Anger face, (E) wearing prescription eyeglass, (F) Face occlusion by hat.

Figure 13.
A metric comparative evaluation applied on 2600 facial images of warp face dataset of AR database. (A) PSNR and (B) SSIM.
Figure 13.
A metric comparative evaluation applied on 2600 facial images of warp face dataset of AR database. (A) PSNR and (B) SSIM.

Figure 14.
A metric comparative evaluation applied on 8 random facial images of warp face dataset of AR database. (A) PSNR and (B) SSIM.
Figure 14.
A metric comparative evaluation applied on 8 random facial images of warp face dataset of AR database. (A) PSNR and (B) SSIM.

Figure 15.
A metric comparative evaluation applied on 3315 facial images of full face dataset of AR database. (A) PSNR and (B) SSIM.
Figure 15.
A metric comparative evaluation applied on 3315 facial images of full face dataset of AR database. (A) PSNR and (B) SSIM.

Figure 16.
A metric comparative evaluation applied on 16 facial images of full face dataset of AR database. (A) PSNR and (B) SSIM.
Figure 16.
A metric comparative evaluation applied on 16 facial images of full face dataset of AR database. (A) PSNR and (B) SSIM.

Figure 17.
A comparative evaluation using (A) PSNR and (B) SSIM across all used datasets.

Figure 18.
The execution time of (A) Coding operation and (B) Decoding operation for the proposed MCT, and the other existed method KLT and WT across all used datasets.
Figure 18.
The execution time of (A) Coding operation and (B) Decoding operation for the proposed MCT, and the other existed method KLT and WT across all used datasets.


Table 1.
Execution time for the proposed MCT and the existed methods KLT and WT.
| Dataset | Coding Time | Decoding Time | ||||
|---|---|---|---|---|---|---|
| MCT | KLT | WT | MCT | KLT | WT | |
| Warp Face AR | 0.574 | 0.041 | 2.284 | 0.008 | 0.013 | 0.395 |
| Full Image AR | 2.801 | 0.040 | 9.959 | 0.048 | 0.027 | 1.728 |
| Full Image Web | 0.918 | 0.023 | 3.591 | 0.015 | 0.013 | 0.633 |
| Average | 1.431 | 0.035 | 5.278 | 0.024 | 0.018 | 0.919 |
Publisher’s Note: MDPI stays neutral with regard to jurisdictional claims in published maps and institutional affiliations. |
© 2021 by the authors. Licensee MDPI, Basel, Switzerland. This article is an open access article distributed under the terms and conditions of the Creative Commons Attribution (CC BY) license (http://creativecommons.org/licenses/by/4.0/).
Share and Cite
MDPI and ACS Style
Mohammad, A.S.; Zaghar, D.; Khalaf, W. Maximizing Image Information Using Multi-Chimera Transform Applied on Face Biometric Modality. Information 2021, 12, 115. https://0-doi-org.brum.beds.ac.uk/10.3390/info12030115
AMA Style
Mohammad AS, Zaghar D, Khalaf W. Maximizing Image Information Using Multi-Chimera Transform Applied on Face Biometric Modality. Information. 2021; 12(3):115. https://0-doi-org.brum.beds.ac.uk/10.3390/info12030115
Chicago/Turabian StyleMohammad, Ahmad Saeed, Dhafer Zaghar, and Walaa Khalaf. 2021. "Maximizing Image Information Using Multi-Chimera Transform Applied on Face Biometric Modality" Information 12, no. 3: 115. https://0-doi-org.brum.beds.ac.uk/10.3390/info12030115
Note that from the first issue of 2016, this journal uses article numbers instead of page numbers. See further details here.