
Collective and Informal Learning in the ViewpointS Interactive Medium
by
 , , ,
, , ,
Philippe Lemoisson
1,2,* ,
,
Stefano A. Cerri
3,4,5,
Vincent Douzal
2,
Pascal Dugénie
6 and
Jean-Philippe Tonneau
1,2 1
CIRAD, UMR TETIS, 34398 Montpellier, France
2
TETIS, University Montpellier, AgroParisTech, CIRAD, CNRS, INRAE, 34398 Montpellier, France
3
DKTS—Digital Knowledge Technologies Services SRL, 20131 Milano, Italy
4
FBK—Fondazione Bruno Kessler, 38122 Trento, Italy
5
LIRMM, University Montpellier & CNRS, 161 Rue Ada, 34095 Montpellier, France
6
AlgoSolutions, 25 Rue de Sauvielle, 34730 Prades-le-Lez, France
*
Author to whom correspondence should be addressed.
Information 2021, 12(5), 183; https://0-doi-org.brum.beds.ac.uk/10.3390/info12050183
Submission received: 5 March 2021
/
Revised: 14 April 2021
/
Accepted: 21 April 2021
/
Published: 23 April 2021
(This article belongs to the Collection Knowledge Graphs for Search and Recommendation)
Abstract
:Collective learning has been advocated to be at the source for innovation, particularly as serendipity seems historically to have been the driving force not only behind innovation, but also behind scientific discovery and artistic creation. Informal learning is well known to represent the most significant learning effects in humans, far better than its complement: formal learning with predefined objectives. We have designed an approach—ViewpointS—based on a digital medium—the ViewpointS Web Application—that enables and enhances the processes for sharing knowledge within a group and is equipped with metrics aimed at assessing collective and informal learning. In this article, we introduce by giving a brief state of the art about collective and informal learning, then outline our approach and medium, and finally, present and exploit a real-life experiment aimed at evaluating the ViewpointS approach and metrics.
1. Introduction
Collective and informal learning have been advocated to be a significant source for innovation, particularly as serendipity seems historically to have been a driving force not only behind innovation, but also behind scientific discovery and artistic creation. Informal learning is well known to represent the most significant learning effects in humans, far better than its complement: formal learning with predefined objectives. These matters are, however, considered to cover the utmost difficult and debated aspects of human learning.
Collective and informal learning are both in the foreground of research issues as a consequence of the availability of the Web in the globalization of knowledge. Business as well as leisure communities have emerged with an unprecedented impact, deserving a concrete priority for any effort trying to optimize the construction of knowledge and the acquisition of the corresponding skills. However, the assessment and enhancement of learning effects in communities interacting on the Web is still in its infancy: researchers—from very different disciplines—have not yet acquired a common lexicon or a minimal set of shared principles and practices that enable or facilitate reuse in order to capitalize from the previous experiences. Consequently, there is no cumulative scientific construction in the domain: each attempt seems to be independent.
We conjecture that the leap from a set of hypotheses, conjectures, and theories about human learning to a real science of learning is an evolving process very much influenced by the availability of new means for measuring learning phenomena. We argue that what is called the digital revolution will provide these new means and help to measure, and maybe one day to forecast, human learning phenomena.
We decided years ago to conceive, design and experiment a “medium” that would address the goal of enhancing and providing means to assess informal learning in the Web paradigm. Up to now, we have designed, developed, and empirically evaluated an approach—called ViewpointS—based on a digital medium favoring knowledge acquisition as a side effect of interaction within a community and providing means to assess knowledge acquisition. By favoring knowledge acquisition as a side effect of interaction within a community we mean: on the one hand, to enable people to interact through the medium, i.e., discovery and access, input, and recommendation of documents and topics, and on the other hand, to favor the emergence of “knowledge trails” reifying the collective knowledge. By providing means to assess knowledge acquisition, we mean considering qualitative and quantitative indicators of the proximities between people and knowledge resources, so that we may interpret their evolution in terms of knowledge acquisition.
Our approach is innovative in many aspects:
- We immerge each member of the community inside the medium where s/he plays a double role: (i) the role of knowledge resource together with his/her own context of documents and topics and (ii) the role of agent interconnecting knowledge resources.
- We equip the medium with a topology based on a metric distance, in such that “knowledge trails” and “knowledge maps” emerge from the flow of interactions and guide the discovery of useful knowledge resources.
- We set a perspective mechanism allowing each user to tune his/her serendipity, for instance, by privileging or discarding his/her personal trails in the medium, or by privileging subjective versus factual connections among all the connections weaved by the community between all the knowledge resources.
- Finally, we rely on the topology of the medium for building indicators measuring the proximities between the community members and the knowledge resources.
Section 2 is a state of the art about collective and informal learning, recommendation and serendipity, the recommending power of the medium, and finally, the challenge of informal learning assessment.
Section 3 is firstly a presentation of the ViewpointS approach, model, and medium, and secondly, a description of the real-life experiment named “Garden-party” with its expected output in terms of data collection and measures.
Section 4 presents and analyzes the experimental data and measures issued from the Garden-party.
Section 5 is a discussion of the above results facing the double goal of our research: to enhance and to assess a process of collective and informal learning.
Section 6 concludes on the findings and limits of our Garden-party experiment and opens to short-term perspectives, such as studying the correlation between individual and collective learning results.
2. State of the Art
In this section, we go through four successive questions, which introduce our approach:
- How does informal learning occur in communities sharing a medium?
- How can members of a community discover useful and unexpected resources for knowledge acquisition?
- Can the medium itself enhance the recommending process?
- What are the means for assessing informal learning?
2.1. How Does Informal Learning Occur in Communities Sharing a Medium?
The conjecture that creation and learning of a group is superior to that of isolated individuals is not new; nor is this idea of using data for building knowledge. By the end of World War II, Bush [1] disclosed his dream of a working environment based on microfilms that would allow browsing through a corpus of a very large size, many times the volume of an encyclopedia. The corpus not only would be searchable through an index, but the user would also enter new content as well as record trails of his/her wandering through documents. Bush’s essay details quite thoroughly what we now call hypertext and hypermedia; he directly inspired Engelbart [1,2] into his computer project to “augment the human intellect”, with text in windows on a graphical display, the mouse pointer, and many other inventions, which spawned the birth of the hypertext. In Engelbart’s vision, the trails of the wanderings reflected the associative way our mind operates. He forecasted that there would be a profession of trail makers, providing guides through the huge common record and, thus, had in mind a continuous process of collective knowledge building.
Di Castri identifies in [3] community as a context enabling local empowerment by bidirectional access to information. In the case of research communities, the community brings together individuals engaged in the production, proposal, and sharing of ideas and knowledge around a theme of common interests [4]. In most other cases, the community builds up around relational affinities empowered by social media [5]. The bidirectional flows of information between members of a community allow them to structure knowledge, to link new knowledge together, and to relate this new knowledge to prior knowledge: this is where some “informal” learning, in the sense of “transmission and absorption of knowledge through non-educational social interaction at informal times and places of self-initiated, self-regulated, and self-responsive learning by learners”, occurs [6]. In other words, “informal” learning happens most of the time as a side effect of interaction: “Informal learning is self-directed learning or learning from experience. Informal learning … has no set objective in terms of learning outcomes and is never intentional from the learner’s standpoint” [7].
2.2. How Can Members of a Community Discover Useful and Unexpected Resources for Knowledge Acquisition?
Interaction within a group brings in the notions of recommendation and serendipity. In the strong sense of Van Andel [8]: “Serendipity can be defined as the supposed capacity to discover, invent, create or imagine something important without deliberately being in quest for it … If I define true serendipity as the art of making an ‘unsought finding’, what do I mean by a ‘finding’? I speak of a ‘finding’ when two or more elements (observations, hypotheses, ideas, facts, relations or insights) are combined originally, for the finder or anybody, to something new and true (science), new and useful (technology), or new and fascinating (arts).” Herlocker [9], however, uses the word in a weaker sense in the context of recommendation: “novelty occurs when the system suggests to the user an unknown item that s/he might have autonomously discovered. A serendipitous recommendation helps the user to find a surprisingly interesting item that s/he might not have otherwise discovered (or it would have been really hard to discover).” In [10], we read: “The most common definitions of the concept of serendipity include three components: relevance, novelty and unexpectedness; there are two main reasons for collaborative recommender systems to suggest serendipitous items: they broaden user preferences and increase user satisfaction”. In the Web paradigm, learning communities may interact asynchronously through a shared corpus of documents and topics, e.g., wikis or fora [11]. This asynchronous sharing consists of writing into a corpus, reading from it, and as soon as one copes with a corpus large enough that reading in extenso is no longer possible, discovering a given fragment.
In the context of communities, “discovery” may be the result of information searching (pull mode), or the result of recommendations by others (push mode); however, each of these modes may involve sophisticated techniques. On the pull side, there are three kinds of information searching: (i) seeking information about a well-defined object, (ii) seeking information about an object that cannot be fully described, but that will be recognized at first sight, and (iii) acquiring information in an accidental, incidental, or serendipitous manner [12]. On the push side, we enter the complex world of recommender systems: “The problem of recommending items has been studied extensively, and two main paradigms have emerged. Content-based recommendation systems try to recommend items similar to those a given user has liked in the past, whereas systems designed according to the collaborative recommendation paradigm identify users whose preferences are similar to those of the given user and recommend items they have liked … Each paradigm has its advantages and drawbacks … Content-based recommenders have no inherent method for finding something unexpected (over-specialization or serendipity problem) …. Collaborative recommenders suffer from the first-rater problem (cold start): until a new item is rated by a substantial number of users, the system would not be able to recommend it [13].” One the most challenging aspects for recommender systems is to be aware of the context of the user. In [14], the authors propose a network analysis technique (based on clustering), performed on the personal tags of a user to identify her different interests. Whereas, in [15], the authors attempt to capture explicitly the interests or the knowledge levels of the user through rating modules; they also propose explicit approaches to capture social relations that rely on a manual representation of the group structure.
2.3. Can the Medium Itself Enhance the Recommending Process?
A learning community sharing a corpus can be viewed as a network of actor/nodes. Pioneering research, such as that of Jacob Moreno [16], focuses on the structuring of the network, by analyzing the relations (links) between the members (actor/nodes). Actors/nodes may be linked through subjective relationships. In Moreno’s sociogram, two actors/nodes may be linked through three relationships: sympathy, antipathy, and indifference; these relationships can be measured using more or less specific questionnaires, depending on the objectives of the community: Who do you like to work with? To make a decision, who do you seek advice from? Who do you think is the most capable of explaining? What is at stake? Who can impose a decision on you that you do not like? The distances between the actors are, therefore, estimated according to their social ties.
Actors/nodes may also be linked through computed relationships, such as csauthors.net [17], a network where the nodes are computer scientists who have or not co-authored at least a paper; an algorithm computes the shortest co-authorship path between two authors.
An important line of research in the area of recommender systems is the use of visualization techniques to provide users with insights in the recommendation process. As an example, social visualizations can help to explain recommendation results by explicitly exposing relationships among content and people [18,19].
2.4. What Are the Means for Assessing Informal Learning?
Rather than actually measuring learning, it is the acquisition of knowledge that is most often evaluated [20]. In the case of formal learning, i.e., with an explicit objective, various approaches relying on logics, exploit models of the learner, and of his knowledge. In [21], for instance, the authors use fuzzy weight-based decision making, which defines the knowledge level of students based on their scores in domain concepts and infers the material for learning. Yet, when we come to informal learning, there is no possible differential measure of distance to a “learning objective”, so that the approach to measure acquisition and use of knowledge is usually qualitative and declarative. For example, Coudel et al. [22] have asked the members of a learning community to distinguish four skill levels: knows; knows how to analyze; knows how to apply; knows how to develop learning. In complement to assessment methods that require individual feedback from the subjects, the medium itself recording the individual interactions can provide useful measures by extracting indicators at various times of the learning process.
Facing all the previous questions, we address the question of informal learning by setting the following principles, detailed in Section 3:
- We consider a community of users where new knowledge resources may enter in a continuous flow and start by putting each user inside the medium where s/he plays a double role: (i) the role of knowledge resource together with his/her own context of documents and topics and (ii) the role of agent interconnecting knowledge resources. Doing so, we set the conditions for collaborative context-aware recommendation.
- We then equip the medium with a topology and a metrics, in such a way that metric knowledge maps reflecting the community structure emerge and guide the discovery of useful knowledge resources.
- We set a perspective mechanism allowing each user to tune his/her serendipity, for instance, by privileging or discarding his/her personal trails in the medium, or by privileging subjective versus factual connections.
- Finally, we rely on the topology of the medium for building indicators measuring the proximities between the community members and the knowledge resources, based on the recording of the individual interactions.
3. Materials and Methods
Our questions are about knowledge acquisition occurring as a side effect of interacting with a medium, when there are no pre-defined learning goals.
In this section, we firstly outline an approach addressing our questions, then we describe the core of the model underlying the approach, and finally, we go through the features of the medium we have designed and implemented. This medium—the ViewpointS Web Application—enables and facilitates sharing a corpus within a group; it embeds metrics measuring proximities between the members of a community and other knowledge resources such as documents, topics, and events.
3.1. The Approach
Our approach has been inspired by the socio-constructivism of Vygotsky [23], based on the ideas that human development is socially situated and that knowledge is constructed through interaction with others. We also have been influenced by Muthukrishna and Henrich [24] that synthetically explains innovation by serendipity, recombination, and incremental improvement, all of them being variants of learning.
We consider a group where the members are involved in stable information and communication processes yielding knowledge acquisition, starting with the hypothesis that the faculty of learning of a group is superior to that of isolated individuals. In the current context of widespread information and communication technologies (ICTs), the flows of information allow the members of the learning community to relate new knowledge to prior knowledge by evolving a shared collection of digital traces.
Our approach explicitly builds upon the multiplicity of “viewpoints” expressed by the members of a community engaged in the construction of knowledge. In this subsection, we outline the important steps we took when designing and prototyping the ViewpointS Web Application (VWA) medium.
A first and decisive step has been to embed the members of a community with the medium through their avatars: not only do they subscribe to a network, but they become visible nodes in the knowledge maps and keep the ownership of each connection they emit. As “guests” invited to participate in collective learning, they constitute resources within the medium that include the documents (i.e., the digital knowledge supports) and the topics (i.e., the linguistic expressions describing the needs and queries of the members as well as the contents of the documents). The guests are the proactive “resources” engaged in interactions with the shared medium, mostly by creating, connecting themselves to, and interconnecting other “resources”, e.g., connecting a guest to a document or a document to a topic. The previous section has emphasized how the available means for creating, discovering, and reading resources are decisive with respect to the potential cognitive effects of the community interactions.
It has been emphasized in the introduction that, as soon as the medium reaches a level of complexity where a global view is out of reach, the presence of “trails” guiding the discovery of resources becomes crucial with respect to the effectiveness of the knowledge acquisition processes. Starting from this concern, we chose in a second step to rely on topology rather than logics. Querying a target automatically yields a “knowledge map”, which exhibits all the resources in the neighborhood of the target. These maps display measurable “trails” emerging from the dynamics of the community. Maps and trails rely on the computation of a distance between the resources, so that the discovery of knowledge may prioritize the closest resources to the target. These metrics will prove very useful also for assessing the collective learning within the network of guests, documents, and topics.
A final step has been to set a mechanism where the metrics governing the knowledge maps are neither fixed nor imposed, but instead flexible and influenced by the preferences of the guests, members of the group. Before querying the medium, each guest tunes a set of rules, which weights and eventually filters the connections established by the community (e.g., subjective versus factual versus serendipitous connections; e.g., recent versus old connections; e.g., connections established by a subgroup). We call “perspective” each tuning of the set of rules. Each “knowledge map” is a temporary and personalized interpretation of the “knowledge graph” resulting from a “perspective”. The clear separation between the storing of the traces in the knowledge graph (KG) and their interpretation within a knowledge map (KM) through a chosen perspective enhances individual autonomy with respect to the others’ opinions. For more details, the reader may refer to Lemoisson et al. [25,26,27].
3.2. The ViewpointS Model
The ViewpointS model is that of a bipartite knowledge graph (KG) consisting of resources (the entity nodes) interconnected by beams of viewpoints (the relation nodes). We call resources the fragments of the medium, e.g., documents, which participate in the knowledge acquisition processes. We call viewpoint each time stamped connection emitted by one resource guest between two resources.
We consider six types of resources:
- Human agent;
- Guest: a human agent who has a login and a password for interacting with the medium, meaning that the person has been invited to participate to collective learning;
- Document: any digital object (text, image, video, …) with a content that might support a knowledge acquisition process; a document is accessible through a local url or a web url;
- Topic: a linguistic expression used for describing the needs and queries of the members as well as the contents offered by the documents. In some way, the evolving set of all topics is the language of the community. It should be noted that this language is not administered; instead, it is continuously enriched by spontaneous contributions;
- Topic hub: a resource aimed at gathering similar topics;
- Event: a resource featuring anything ranging from a quick conversation, to a project or a business. Events aim at gathering guests (participating in the event) as well as documents (related to the event) or topics (related to the event).
The resources are interconnected via viewpoints emitted by the guests. We consider five types of viewpoints:
- Factual: when the connection reflects a fact that can be proven true by its emitter, e.g., a factual connection between a guest and a document s/he authors or between a guest and an event s/he participates in;
- Subjective: when the connection reflects the beliefs or emotions or opinions of its emitter, e.g., when the guest A likes the resource B, or when the guest A believes that B is relevant with respect to C;
- Extractive: this type will be implemented later when artificial agents will automatically generate viewpoints;
- Normative: when a topic is semantically close to a topic hub according to the belief of the emitter;
- Serendip: these viewpoints are automatic traces summarizing the trails leading to “happy encounters” by the guests. If, for example, a guest searches around resource 1, finds resource 2, and reacts positively to it, then searches around resource 3, two serendip viewpoints “belonging to this guest” are automatically created: one linking resource 1 to resource 2, the other linking resource 2 to resource 3.
Figure 1 illustrates an extract of the KG supporting the Garden-party experiment; each line is a viewpoint emitted by the guest “adefa”. Col. 1 displays the name of the knowledge graph; col. 2 displays the resource emitting the viewpoint; col. 3 and 4 display the two resources connected via the viewpoint; col. 5 displays the type, and col. 6 the time stamp of the viewpoint.
In Figure 1, each line stands for a viewpoint. Line 2046: “adefa” has interconnected “Humour au travail” and “adefa” by a factual viewpoint meaning that s/he is the contact resource for the document. Line 2057: s/he has interconnected “Philosophies …” and “Extrait de …” by a subjective viewpoint meaning that s/he believes this document and that topic match. Line 2058: s/he has interconnected “adefa” and “Extrait de …” by a subjective viewpoint meaning that s/he likes the document. Line 2059: s/he has interconnected “covid …” and “Alimentation …” by a subjective viewpoint meaning that s/he has searched or given feedback for these two resources at two contiguous moments of the interaction with the medium.
In the ViewpointS model, the discovery of knowledge obeys a “perspective” mechanism expressing the preferences of the guest making the request. In Figure 2, the choice of the perspective consists of tuning the values of the five sliders expressing the weights of the viewpoints according to their types. The request illustrated here is targeting the topic “data, information”, through the perspective “P” defined by: [factual = 1; subjective = 1; extractive = 0; normative = 2; serendip = 0]. All the distances displayed in the KM answering the request are based on these weights.
3.3. The ViewpointS Web Application
The ViewpointS Web Application consists of a Java kernel based on the Spring Framework® model–view–controller, in synchronization with a PostgreSql database implementing the persistence.
Figure 2 illustrates the GUI providing the Perspective ⊗ Search mechanism. The left part of the figure (in grey) illustrates a small extract of the KG itself (a possibly huge bipartite graph) that the guests do not see. The rest of the figure shows a perspective “P1” chosen by the current guest as well as the KM resulting from a search around the target resource “Francesco Di Castri”, according to this perspective. The KM is displayed through two complementary views: the tabular view and the graphical view.
Choosing a perspective consists of:
- Tuning the 5 sliders in order to attribute relative weights to the respective viewpoints’ types; these weights will be computed when aggregating the viewpoints into the links labelled with distances that appear in the graphical view;
- Selecting a temporal range, if needed;
- Filtering the viewpoints by emitters, if needed; the green button is used for restraining the emitters to a group; the red button is used for excluding a group of emitters.
In Figure 2, the same distances displayed in the graphical view on the right appear in the column “SP-distance” of the tabular view in the center. SP-distance stands for shortest path distance.
SP-distance is a metric distance between resources, providing a value as soon as they are directly or indirectly connected. Let us consider, for instance, the two trails in Figure 2 going from “Francesco Di Castri” to “Maître, Professeur …”, the first trail goes through “les TICS” and its length is 1.0 = 0.5 + 0.5, the second trail goes through “apprentissage”; its length is 0.66 = 0.33 + 0.33. The shortest path distance between “Francesco Di Castri” and “Maître, Professeur …” is: SP-distance (“Francesco Di Castri”; “Maître, Professeur …”; “P1”) = 0.66.
An alternative measure, called K-distance [26], is displayed in the right column of the tabular view; its computation integrates all the paths of bounded length (see the bound parameter in red in Figure 2) between two resources. For instance, the two trails of respective lengths 1.0 and 0.66 above yield the K-distance (“Francesco Di Castri”; “Maître, Professeur …”; “P1”) = 0.40 = 1/(1/1.0 + 1/0.66). The inverse of the K-distance provides a useful notion of multi paths proximity between resources; we call it K-proximity.
An important remark: The K-distance aggregate multiple paths including the shortest path; it provides by construction a smaller result than the SP-distance. If, for instance, “n” paths of length 1 would link guest “x” to topic hub “h”, then SP-distance (x; h) = 1, whereas K-distance (x; h) = 1/n. Let us suppose “a” and “b” two guests verifying SP-distance (a; h) = SP-distance (b; h) = L. Let us suppose “a” is linked to “h” through “n” paths of length L, whereas “b” is linked to “h” through only one path of length L; the SP-distance does not distinguish “a” from “b”, whereas the K-distance does. This is the reason why the K-distance will be preferred when analyzing the knowledge acquisition.
Figure 3 illustrates the means for reading from the medium. A right click on any resource displays a preview: label, short description, and preview image; clicking on the preview image opens the resource in a separate tab of the browser.
Figure 4 illustrates the means for writing in the medium. On the left, we can see the menu allowing a guest to create new resources, to select a KG and to scan viewpoints (see Figure 1 for a scan). On the right, we can see the means for updating a resource, reacting to it or connecting it to other resources after a right click (in order to create new viewpoints, the user must start from one of the resources he wishes to connect). In the example illustrated in Figure 4:
- Button 1 will generate a positive subjective viewpoint between the emitter (guest) and the resource “CollectiveBrain”.
- Button 2 will generate a positive subjective viewpoint between the target of the search (here: “data, information”) and the resource “CollectiveBrain”; this connection means that the emitter believes that the document “CollectiveBrain” is relevant with respect to the search “data, information”.
- Button 3 will generate a negative subjective viewpoint between the target of the search (here: “data, information”) and the resource “CollectiveBrain”; this connection means that the emitter believes the document “CollectiveBrain” to be irrelevant with respect to the search “data, information”.
- Button 4 will open a “Resource update” interface for updating the description and url, under the condition that the guest was the creator of the resource.
- Button 5 will allow the update of the preview image under the condition that the guest was the creator of the resource.
- Button 6 will allow the guest to connect the current resource to another resource via a factual viewpoint.
- Button 7 will allow the guest to connect the current resource to another resource via a subjective viewpoint.
Figure 5 illustrates how the interactions of the collective with the medium, i.e., the viewpoints emitted by a guest versus the viewpoints emitted by the others, and the perspective chosen by a given guest, influence the knowledge maps viewed in answer to requests.
The case is based on an imaginary KG with the following resources:
- Two guests “adu” and “ace” and a third human agent “Francesco Di Castri”;
- One event “Santiago …”;
- One document “Development …” and one topic “empowerment”;
- Seven numbered viewpoints denoted by their emitter and type: n°1 and n°2 emitted by “x”, n°3 and n°4 emitted by “adu” (3, 4) and n°5, 6, 7 emitted by “ace”.
We suppose a request targeting “Francesco Di Castri” with radius = 2 and analyze which resources will appear connected to this target in the knowledge map, depending on the chosen perspective.
Perspective PX is defined by [subjective = factual = 1; all viewpoints]. The connectivity is maximal, the map will display all the resources.
Perspective acePA is defined by [subjective = factual = 1; only the viewpoints emitted by “ace”]. The map will display “Santiago …”, “empowerment”, and “ace”.
Perspective acePB is defined by [subjective = factual = 1; all viewpoints except those emitted by “ace”]. The map will display all the resources except “Santiago …”.
Perspective aduPA is defined by [subjective = factual = 1; only the viewpoints emitted by “adu”]. The map will display only the document and the topic.
Perspective aduPB is defined by [subjective = factual = 1; all viewpoints except those emitted by “adu”]. The map will display “Santiago …”, “empowerment”, and “ace”.
The knowledge maps (KM) play the role of “search and recommend systems” for the guests and simultaneously invite them to feedback and update the underlying knowledge graph (KG). As a consequence, the KG evolves over the individual loops of discovery/update in a selection process analogue to that occurring in human brains [27,28]. The bunch of viewpoints interlinking two resources evolves along the dynamics of the community by aggregating facts (exploitation of the factual viewpoints), beliefs (exploitation of the subjective and normative viewpoints), and serendipity (exploitation of the serendip viewpoints). Bunches of aggregated viewpoints behave like synapses.
Following the metaphor of the human brain, we interpret the “trails” resulting from the computation of these synapses as collective knowledge paths emerging from the interactions of the guests; these trails are the core of the discovery processes.
Our hypothesis is that the KG evolution is interpretable in terms of informal learning; the authors of this paper have organized and launched the Garden-party experiment in order to test this hypothesis.
3.4. The Garden-Party Experiment
The Garden-party experiment aims at testing whether the evolution of a medium/knowledge graph reflects and enhances collective and informal learning. In this section, the people invited in the Garden-party, including the authors, are called guests; the KG sustaining the Garden-party experiment is simply called KG.
Given the collective of guests interacting with the medium in the absence of any pre-defined learning goal (informal learning), we wish to analyze:
- The dynamics of the community;
- The final structure of the medium;
- The mutual influence between the collective and the individual in terms of exploration and knowledge acquisition.
One hundred and twenty people were initially invited among colleagues, partners, and friends of the authors. All of them are relatively close to at least one of the authors. Very few are keen on knowledge management supported by digital tools. The great majority were already engaged in a demanding full-time job. The first invitation message exposed four prerequisites for embarking in the experiment:
- To feel concerned by the issue of “learning from each other”; to be curious about what others would contribute;
- Not to be “allergic” to the Web;
- To have a “priority topic”, i.e., a topic of interest for which they would have at least one good document (image, text, audio, video, slide show, etc.) to share;
- To accept to dedicate to the experiment approximately half an hour a week for six weeks, at freely chosen pace times, without any reward.
Fifty-five people accepted to participate among the 120 initially contacted. They were in a first step invited to learn about the medium within a special “Sandbox-KG”. The Sandbox-KG has been populated with pedagogical documents explaining how to create resources and viewpoints, how to discover resources through perspectives, how to read, update, and react to resources. This preliminary phase of “learning by acting inside the medium” lasted for approximately one month. Among the 55 initial participants, 30 completed this learning and remained until the end; these 30 persons became the “guests” of the Garden-party.
Nine topic hubs aiming as gathering the great variety of potential topics have been pre-defined by the authors; they are listed in Table 1.
Before conveying the guests to the Garden-party, we initialized a KG with the following resources and viewpoints:
- The 30 confirmed guests;
- The nine topic hubs defined by the authors;
- The priority topics brought in by the guests;
- Subjective viewpoints between each guest and her/his priority topic;
- Normative viewpoints between each priority topic and the appropriate topic hub(s);
- A set of events reflecting the real-life connections between the guests;
- Factual viewpoints reflecting the participation of guests to events.
After completing the “Sandbox” initiation, the 30 guests were invited to start and interact within the KG: to freely navigate, create learning topics and documents, visualize, download resources, enjoy, and eventually get bored or even frustrated. A weekly updated document authoring useful tips, aimed at sustaining individual motivations, was both sent by mail to all guests and presented as a resource document in the KG. Among the useful tips, several exploring strategies were proposed:
- Strategy #1: Human first. Choose the following perspective: [“normative” slider = 0; other sliders = 1]. Search for the topic “group photo”, select a resource guest, double-click for search, and explore his/her neighborhood.
- Strategy #2: Topic first. Choose the following perspective: [“normative” slider = 2; other sliders = 1]. Start from one of the nine topic hubs, select one, and explore its neighborhood.
- Strategy #3: Any resource. Choose the following perspective: [all sliders = 1]. Start typing a word that inspires you in the search bar, wait for auto-completion to display a resource (if any), click on search, and explore its immediate neighborhood.
- Strategy #4: Most recent. Use the “scan viewpoints” feature while ordering from the most recent to the oldest one and memorize a resource of interest. Choose the following perspective: [all sliders = 1]. Explore the immediate neighborhood of the resource of interest.
The experiment lasted for 78 days from 16 November 2020 to 31 January 2021. At the beginning and at the end of the experiment, all guests were asked to complete a short self-evaluation survey. They had to answer nine questions, each associated to one of the nine topic hubs: “Would you be ready to write a (small) text or recommend a written document on the following theme? [no|rather no|rather yes|yes]”.
The self-evaluation surveys were intended to play the role of complement to the data collection issued from VWA and the set of measures offered by the prototype.
3.5. The Data Collection and Measures
The ViewpointS Web Application (VWA) is equipped with two instruments enabling the KG analyses:
Firstly, the time-stamped viewpoints of the knowledge graph can be extracted on demand via the “Scan viewpoints” menu item and exported to .csv (see an example in Figure 1). The exhaustive set of all the viewpoints emitted during the 78 days of the experiment have been extracted and compiled; they form the Garden-party knowledge graph.
Secondly, each perspective-dependent KM resulting from a search can be exported under its tabular view to .csv. We have undertaken three series of searches under specific perspectives; each search results in a Garden-party knowledge map. The first series exploits all viewpoints of the 30 guests; we call them the complete maps. The second and third series exploit complementary sets of viewpoints and yield stereoscopic maps. All of them are detailed in Table 2.
It must be noted that the complexity of the search algorithm is O(|W|2|R|2), where |W|= number of viewpoints and |R|= number of resources. To break this complexity, each search answering a given perspective is bounded, i.e., the algorithm stops as soon as the length of the explored path exceeds a pre-defined bound (see Figure 2) called “radius”. As mentioned in Table 2, the radius has been fixed to 2 for the guest-a and guest-b series; it has been fixed to 1.5 for the th-x series.
Figure 6 illustrates how the interactions of the collective with the medium, i.e., the viewpoints emitted by a guest versus the viewpoints emitted by the others, and the perspective chosen by a given guest, influence the knowledge maps viewed in answer to requests.
The case is based on an imaginary KG with the following resources:
- Two guests “adu” and “ace” and a third human agent “Francesco Di Castri”;
- One event “Santiago …”;
- One document “Development …” and one topic “empowerment”;
- Seven viewpoints denoted “emitter: type & number”: two emitted by “x” (1, 2), two emitted by “adu” (3, 4), and three emitted by “ace” (5, 6, 7).
We suppose a request targeting “Francesco Di Castri” with radius = 2 and analyze which resources will appear connected to this target in the knowledge map, depending on the chosen perspective.
Perspective PX is defined by [subjective = factual = 1; all viewpoints]. The connectivity is maximal; the map will display all the resources.
Perspective acePA is defined by [subjective = factual = 1; only the viewpoints emitted by “ace”]. The map will display “Santiago …”, “empowerment”, and “ace”.
Perspective acePB is defined by [subjective = factual = 1; all viewpoints except those emitted by “ace”]. The map will display all the resources except “Santiago …”.
Perspective aduPA is defined by [subjective = factual = 1; only the viewpoints emitted by “adu”]. The map will display only the document and the topic.
Perspective aduPB is defined by [subjective = factual = 1; all viewpoints except those emitted by “adu”]. The map will display “Santiago …”, “empowerment”, and “ace”.
Table 3 provides the definitions of the four indicators that will be used in the next section.
4. Results
In this section, we exploit the experimental data by splitting our analyses in three parts. The first subsection exploits the extraction of all viewpoints in order to analyze the dynamics of the community. The second subsection exploit the topic hubs (TH-X) series of extractions to analyze the final structure of the medium. The third subsection exploits the guests’ trail (GUEST-A) and other guests’ trail (GUEST-B) series of extractions to analyze the mutual influence between the collective and the individual in terms of interactions with the medium and knowledge acquisition.
Our analysis is purely descriptive: the main goal of the analysis is to gain a better and deeper insight in the interaction phenomena that occurred in the Garden-party experiment in order to design future experiments including statistical inferences.
4.1. Analyzing the Dynamics of the Community
The dynamics of the community is analyzed by exploiting all viewpoints in the Garden-party knowledge graph.
All resources and viewpoints are stored together with their corresponding emitters and time stamps. An exhaustive extraction of the viewpoints allows us to follow and monitor all and each of the interactions with the medium.
At the beginning of the experiment, 156 resources were already present in the KG:
- Nine topic hubs;
- Sixty-three topics (the priority topics chosen by the guests);
- Twenty-nine events;
- Fifty-five human agents (expected guests), among which 30 guests participated up to the end.
During the experiment, the 30 guests produced 628 resources that yielded a total number of resources of 784. To give an order of magnitude, each guest input an average of 12 documents, nine topics, one human agent, and no event.
The created resources detail as follows:
- Three hundred and seventy-four input documents;
- Two hundred and seventeen input topics, which yielded a total of 280 topics;
- Thirty-seven input human agents (authors of documents or referees for topics), which yielded a total of 92 human agents (30 guests + 25 too-busy + 37 people outside the experiment).
Simultaneously with the dynamics of resource creation, the 30 guests emitted 8828 viewpoints:
- Five thousand two hundred and ninety-five viewpoints of type serendip;
- Two thousand six hundred and two viewpoints of type subjective;
- Nine hundred and thirty-one viewpoints of type factual.
To give an order of magnitude, each guest emitted an average of 180 serendip viewpoints, 90 subjective viewpoints, and 30 factual viewpoints.
Figure 7 shows a great disparity, both in rhythm and in intensity between the guests, with more viewpoints emitted during the first half of the experiment.
4.2. Analyzing the Final Structure of the Medium
The final structure of the medium is analyzed by exploiting the topic hub-X (TH-X) extractions in the complete knowledge map.
The TH-X series of extractions, based on the perspective PX [all sliders = 1; all viewpoints], provide for each of the nine topic hubs a list of resources at SP-distance <= 1.5, with the computation of the SP-distance and the K-distance. They allow an analysis of the topology of the KG relatively to the topic hubs.
In the following, we firstly present an overview of the extracted data, then analyze the distribution of the distances between the documents (respectively, the topics) and the topic hubs, and finally, analyze the positions of a sample of 11 guests with respect to the topic hubs.
4.2.1. Overview of the Extracted Data
The TH-X series exploits the trails by all the guests around the topic hubs. The chosen radius is 1.5. Figure 8 summarizes the neighborhood of each topic hub in terms of respective populations of agents, documents, events, topics, and topic hubs.
It must be noted that the topic hubs do not operate a partition of the resources; each resource can be directly or indirectly connected to several topic hubs.
It appears on Figure 8 that each extraction captures an average of 592 and a maximum of 667 resources among the 784 potentially reachable resources.
It must be noted that the topic hubs do not operate a partition of the resources; each resource can be directly or indirectly connected to and, therefore, found in the neighborhood of several topic hubs.
4.2.2. Distribution of the Documents and Topics with Respect to the Topic Hubs
The following computations have been operated on the 374 documents:
- Collection of the K-distances between all documents and the nine topic hubs.
- Computation, for each document “x” of the average A(x) and the standard deviation Sd(x) of the nine K-distances to the topic hubs. Absent distances (greater than the radius) have been discarded in the average. The “standard deviation of the population” formula has been used.
- Computation of the respective quartiles for A(x) and Sd(x) along the 374 documents.
- Classification of each document from 1 to 4 according to its A-quartile: “1” means high average, “4” means low average, in such a way that this ranking is an indicator of the “centrality” of the document. A “central” document is close to all the topic hubs and, therefore, has a low average distance and, therefore, is ranked 4.
- Classification of each document from 1 to 4 according to its Sd-quartile: “1” means low standard deviation, “4” means high standard deviation, in such a way that this ranking is an indicator of the “specificity” of the document. A “specific” document has a high standard deviation among distances and, therefore, is ranked 4.
- Computation of the distribution of the 374 documents according to this 4*4 classification; the result is illustrated in Figure 9.
A first comment is that 49 documents are neither central nor specific: they are far from all topic hubs. These 49 documents may be suspected to be poor candidates for knowledge acquisition that would be targeted to a topic hub; we must remember, however, that no learning objective has been given to the guests; any document may, therefore, lead to new knowledge when encountered by serendipity. Investigation of the fine-grained effect these documents may have had would require deeper analyses. The rest of the distribution reflects a relative antinomy between centrality and specificity. There are, however, 38 + 14 + 23 + 3 = 78 documents that have a high centrality and remain specific; those may be suspected to be good candidates for knowledge acquisition with respect to at least one topic hub. Among those, three documents are both very central and very specific, a possible explanation being that they are very close to at least one topic hub.
The same computations have been operated on the 280 topics; the result is illustrated in Figure 10 where the distribution reflects a more pronounced antinomy between centrality and specificity. This was quite expectable; whereas a document can be multi-topics, a topic should remain a topic. There are only 24 + 3 + 6 = 33 topics with a high specificity, which remain central, i.e., close to at least one topic hub; those might be suspected to be good candidates for knowledge qualification.
4.2.3. Positions of the Guests Relatively to the Topic Hubs
Although the extracted data relate to the thirty guests, only a sub-collection of them can be analyzed relatively to the nine topic hubs; the reason for this is explained in Section 4.3.1. This leads to analyzing a sample of 11 guests, as presented in Figure 11, where they are ordered by growing pro-activity, from 101 viewpoints emitted (“xau”) to 2046 viewpoints emitted (“eto”).
The computation of the ratio K-distance/SP-distance in the TH-X series gives values varying between 0.2 and 0.43 along the nine topic hubs for all the guests, with an average value of 0.28, which gives an indication of the “path-density” of the KG.
Each of the eleven “web-diagrams” in Figure 12 gives the position of one guest, in the referential of the nine topic hubs (one for each of the nine angles). The pro-activity of the guests increases when reading Figure 12 from left to right and top-down, i.e., in the usual reading mode. In order to compare the SP-profiles to the K-profiles, the SP-distances have been divided by 0.28 (normalization of average values); the contact points or even crossing between the curves have no signification!
Figure 12 shows that the more proactive guests (“ace”, “ucl”, “ale”, “eto”) have the smallest polygons; they have visited the neighborhoods of the topic hubs more frequently than the others. We also observe that the K-profiles tend to be smoother than the SP-profiles. However, there is a general coherence between the SP peaks and the K peaks, which leads to a relative similarity in the diagrams between the two measures.
The K-distances between guests and topics are all smaller than 0.5, which means the K-proximities (inverse of the K-distances) are all greater than 2. The detailed discussion of the K-proximities between guests and topic hubs is given in Section 4.3.3 when using the so-called “stereoscopic maps”, i.e., the couple of maps using complementary perspectives. The reader should remember that the change in perspective impacts the distances: the stereoscopic maps are based on partial sets of viewpoints, and therefore, the distances between guests and topic hubs will be larger.
4.3. Analyzing the Medium-Enhanced Serendipity by Exploiting the Stereoscopic Knowledge Maps
The mutual influence between the collective and the individual learning is analyzed by exploiting the GUEST-A and GUEST-B series of extractions.
In this subsection, we start by giving an overview of the extracted data in order to select a sample of eleven guests allowing in-depth analysis. Then, we discuss the possibility of a diachronic analysis leading to the assessment of knowledge acquisition. We finally focus on the mutual influence between the collective and the individual, in order to discuss whether the VWA medium enhances serendipity and favors the encounter of valuable knowledge supports.
4.3.1. Overview of the Extracted Data and Selection of a Sample
An overview of the guest-a and guest-b series is presented in Figure 13, which analyses the neighborhood of each guest in terms of respective populations of events, agents, documents, topics, and topic hubs.
As it is explained above (see Table 2), the guest-a series exploits only the targeted guests’ trails (example given in the guest-a series: 40 agents in the neighborhood of “ale” means that “ale” alone has opened trails (of length <= 2) leading from himself to 40 agents). The guest-b series is complementary: it exploits only the other guests’ trails (example given in the guest-b series: 61 agents in the neighborhood of “ale” means that the other guests have collectively opened trails (of length <= 2) leading from “ale” to 61 agents).
In the guest-a series, the average number of resources reached is 110 and the maximum is 397. In the guest-b series, the average number of resources reached is 414 and the maximum is 682. These figures can be compared with the 784 potentially reachable resources.
In order to analyze in-depth the interactions with the medium, we have firstly limited the sample to the only emitters of more than 100 viewpoints during the experiment. Only 17 guests satisfied this condition; they constitute the lines of the matrices in Figure 14, which presents the KDNA values (normalized K-proximities based on the targeted guests’ trails only) and KDNB values (normalized K-proximities excluding the targeted guests’ trails and keeping all the others).
An important technical remark: Figure 14 shows missing cells. The reason is the following: in the case of too small activity from a guest, his K-distances to (at least some) topic hubs are superior to the bound expressed by the radius in the search. For example, the hole at the position (guest “ado”; topic hub TH6) means that when exploring the trails of length <= 2 starting from “ado”, TH6 has not been reached. In such a case, the K-distance cannot be computed; it does not mean it is infinite, however, and therefore, we may not consider the K-proximity is zero.
In order to dispose from a fully exploitable sample, we have eliminated the rows and columns colored in grey in such a way that the matrix has no more holes. Our definitive sample consists of 11 guests and seven topic hubs. This sample will be exploited in Section 4.3.3 when analyzing the mutual influence between the results of individual interactions with the medium (reached through KDNA) and the results of collective interactions with the medium (reached through KDNB).
4.3.2. Discussing the Possibility of a Diachronic Analysis of the Interactions with the Medium
In the self-evaluation surveys prior to and after the Garden-party, the guests had to answer the question: “Would you be ready to write a (small) text or recommend a written document on the following theme (topic hub)? [no|rather no|rather yes|yes]”.
The SEAa indicator exploits the results of these self-evaluations by computing the difference between the self-evaluations at the beginning and at the end of the experiment.
It is illustrated in Figure 15.
We firstly observe that SEAa = 0 for most of the guests’ answers: they evaluate no evolution in their ability to “write a (small) text or recommend a written document” about the given topic hub between the beginning and the end of the Garden-party.
Interestingly, some of the guests have expressed in their replies that in the end, they felt less prone to give a short lecture, yielding negative values for SEAa. This might be interpreted as a somewhat unexpected “unlearning”. However, whereas the first answer was given a priori, the second answer was given after a confrontation with various documents contributed by others, somewhat destabilizing that member’s initial view, thus, feeling less comfortable at giving a fair account of the subject. What at face value might appear as unlearning, may be interpreted as actual learning a much broader context, hence, perceiving more complexity regarding the subject. This is known as the Dunning–Kruger effect [29].
Since the SEAa indicator cannot be interpreted easily in terms of knowledge acquisition, we chose instead the SEAc indicator (average between the self-evaluations at the beginning and at the end of the experiment) as the external reference for Section 4.3.3. Doing so, we discard the possibility of a diachronic analysis.
Another reason for discarding this possibility appears in Figure 16, where we observe that each guest has had his own dynamics, with sometimes short and intense activity periods separated by long silences. This lack of synchronicity between the guests of the sample makes any diachronic analysis quite problematic. Not to be able to take advantage of the time-stamped viewpoints has been our major disappointment; our next experiment will have a different setting and last much longer, in order to compare successive pictures of the knowledge graph.
4.3.3. Mutual Influence between the Individual and the Collective
In this section, we exploit the features of VWA in order to study the mutual influence between the individual interactions with the medium and the traces left by the others (the collective).
We firstly expose an imaginary case intended to explain how VWA works, i.e., how the ViewpointS enhances this mutual influence. We show how trails opened by others open the way for encounters and progressively yield a knowledge graph where most of the guests are connected to most of the topic hubs, firstly, thanks to the others’ viewpoints, then as a consequence of their own connections.
Then, we exploit the stereoscopic maps of the Garden-party and track this mutual influence through the KDNA and KDNB indicators, i.e., the normalized proximities according to individual versus collective trails.
Finally, we compare, for each of the 11 guests of the sample, his/her TH-profiles (proximities to the topic hubs) according to KDNA, KDNB, and the self-assessment evaluation SEAc.
An Imaginary Case
To start with, Figure 17 illustrates an imaginary case, prototypical of the Garden-party experiment. guest stands for a given guest; th stands for a given topic hub. We suppose that all the searches occurring during the following eight steps—whoever the requester—use the perspective PX, taking into account the viewpoints of all guests. Links resulting from connections emitted by guest appear in dark blue; links resulting from connections emitted by the others appear in light blue. At the beginning, guest and th are disconnected.
- Initial state: guest has connected himself (dark blue link) to his/her priority topic: Topic1. Other guests have input their own respective priority topics: Topic2 and Topic3, and connected them to th.
- Some other guests input Doc1, Doc2, and Doc3 and connect these documents (light blue links) to topics by viewpoints of type subjective (see Section 2.2).
- One other guest searches on Topic1, finds guest then searches on guest; this results in a new viewpoint (light blue link) of type serendip between guest and Topic1. guest is now connected to th via viewpoints emitted by others (light blue links). We may, therefore, compute KDNB (guest; th) = 0.45.
- guest searches on Topic1, finds Doc1 and Doc3, reads them, and agrees they are relevant with respect to Topic1; this results in new subjective connections (dark blue links) between Topic1 and these documents.
- guest searches on Doc1, finds Topic2, and searches on Topic2; this results in a new serendip connection between Doc1 and Topic2.
- When searching on Topic2, guest finds th and then searches on th; this results in a new serendip connection between Topic2 and th.
- When searching on th, guest finds Topic3 and then searches on Topic3; this results in a new serendip connection between th and Topic3.
- When searching on Topic3, guest meets Doc3 for the second time; he/she agrees that Doc3 is also relevant with respect to Topic3. This results in a new subjective connection between Topic3 and Doc3. Finally, guest is connected to th via viewpoints emitted by himself (dark blue). We may, therefore, compute KDNA (guest; th) = 0.40.
Along the eight steps of this case, the trails opened by the other guests have opened the way for encounters between guest, Doc1, and Doc3 and progressively connected guest to th. This connection is visible through the PX perspective (all viewpoints) starting from step b., then through the PB perspective (only the others’ viewpoints) starting from step c., and finally, through the PA perspective (only guest’s viewpoints) at step h.
Exploiting the Stereoscopic Maps
The expression “stereoscopic maps” stands for the couples of extracted neighborhoods of each guest allowing comparison between proximities issued from the PA perspective (only the guest’s viewpoints) and those issued from the PB perspective (only the others’ viewpoints), when simultaneously exploiting the guest-a and guest-b series. This comparison is represented in Figure 18, where KDNA and KDNB both exploit, though under different perspectives, the bunches of trails connecting the guests to the topic hubs.
The KDNA proximities are computed by using only the targeted guests’ trails; for instance: “the proximity between ‘ale’ and ‘TH1’ is 0.21” means that “ale” has through his own viewpoints opened trails leading from himself to “TH1”, which results in yielding a K-proximity of 0.21.
The KDNB proximities are computed by using only the other guests’ trails; for instance: “the proximity between ‘ale’ and ‘TH1’ is 0.40” means that all the other guests’ viewpoints have opened trails leading from “ale” to “TH1”, which results in yielding a K-proximity of 0.40.
A first result is that KDNA and KDNB have almost the same average values (0.30 versus 0.29): the trail leading from a guest to a topic hub opened by himself and the trail with same extremities opened by the others are, on average, of the same length. When comparing cell by cell in the |KDNB-KDNA| matrix providing the difference in absolute value, we observe most values <= 0.10 (the white cells), with an average of 0.11.
Secondly, when observing the cells in the KDNB matrix, we note that KDNA is alternatively smaller and bigger than KDNB: the blue cells correspond to KDNA < KDNB, whereas the white cells correspond to KDNA > KDNB. Depending on the guest and the topic hub, the bunch of personal trails may be either stronger (i.e., yielding higher proximity) or weaker than the collective trail.
Remark: the guests using VWA have most of the time chosen the PX perspective taking into account all the viewpoints (their own viewpoints as well as the viewpoints emitted by the others). We may rephrase our results in the following way: the individual versus collective contributions to the trails are (on average) of same importance, one slightly higher than the other depending on the guest and the topic hub.
Cross Analysis of KDNA, KDNB and SEAc
The SEAc indicator illustrated in Figure 19 displays proximities between guests and topic hubs computed in the following way: the average value of the self-evaluation at the beginning and the self-evaluation at the end of the experiment. This indicator has been normalized in order to provide values in the same range as KDNA/KDNB; a direct comparison between the SEAc values and the KDNA/KDNB values would be meaningless.
In order to go through the cross analysis of the KDNA and KDNB indicators (issued from the built-in metrics of the ViewpointS medium; they use the same scaling reference) on one side and SEAc indicator (issued from the self-evaluations; it uses a specific scaling reference) on the other side, we have drawn the series of curves in Figure 20.
The colors of the curves match the colors of the indicators exposed in the matrices above (Figure 18 and Figure 19): for each guest, the KDNA profile is drawn in dark blue, the KDNB-profile in light blue, and the SEAc profile in red. The series of curves have been ordered by growing proactivity of the guests according to Figure 11 as well as Figure 16.
A first observation results from comparing KDNA and SEAc. If we consider “xau”, “aba”, “ade”, “ace”, and “eto”, and with less evidence “udo”, “adu”, and “ale”, i.e., most of the guests with the exception of “udu”, “ado”, and “ucl”, we observe a similarity of shape between the two curves. This may be interpreted according to the teachings of Vygotsky: we learn (we establish proximity through our own trails) in the neighborhood of the themes (topic hubs) that we already know (according to our self-evaluations). The case of “eto”, for instance, shows a huge proactivity centered on the two main “skills” TH2 and TH7, as well as a significant proactivity on the third “skill” TH5.
A second round of observations leads us to scan different types of typical, contrasted behaviors, expressive of different personalities, with respect to the question raised in this section: “may we assess the mutual influence between the individual and the collective?” We must remember that the Garden-party experiment placed no constraints on its members, just invited to an informal learning party, with only the initial, and not limiting, incentive of topic hubs, with no stated purpose or stakes besides enjoying the party. In some cases, the guests have been invited to add their own comments to the curves; those are reported below.
Some members show a marked interest, and activity, on specific topics they have stuck to all along the experiment: the three curves are highly similar in shape. This is the case for “ace”, “ale”, and “adu”. They can be said to have received little perceivable influence from the interaction in the garden. The last one, “adu”, has, however, shown dawning interest for TH9; he has let the collective influence his interest. When interviewed about this particular aspect, he agreed on the influence of the collective upon his own “serendipity”.
The guest “aba” also displays a correlated profile in a less apparent way, because, overall, his curves are low, with only two expressed topics of interest, and low correlated level of activity.
Another member has a similar, correlated but much accented profile: “eto” has deployed intense activity, by inputting many documents and focusing primarily on two main topics, with lesser investment on two other ones. However, in his case, the proximities resulting from the others’ trails do not follow his own ones as closely: he has not been alone, preaching in the wilderness, but the contrast between his dedication and that of the others is apparent. When interviewed about his overall attitude with respect to the experiment, he explained that his main motivation had been to interconnect resources (documents to topics or documents to documents); to do so, he had successively explored three of the proposed strategies (see Section 2.4), i.e., “human first”, “topic first”, and “any resource”. This intense proactivity has yielded a KDNA curve high above the KDNB curve.
All these guests have had the tendency to stick to their pet subjects. Guest ucl’s profile displays a marked contrast on TH8: her curve of interest is relatively high, if flat, but her activity has focused on one topic, which comparatively has retained less interest from the others. However, she has let the influence of the group attract her to TH1, TH9, and to a lesser extent, TH2.
Other guests such as “ade” showed a uniform profile of interest (red curve) and a sustained, similar, low personal proximity to the topics. The proximity as reflected by the others, which is distinct, seems to result from the average general profile of activity on the topic hubs: “ade” has received low influence, but his position is modified because the whole cloud, which is the frame of reference, or the general context, has shifted. This is perhaps, paradoxically, the most legible effect of a global, collective informal learning, although evidently, it cannot affect every subject.
In another style, “udu” expressed overall low interest in the topics, with mild affinity with some, and her activity profile is low, but surprisingly, quite even: this one has not found a motivating topic of conversation through the interaction in the garden, even on those declared more interesting.
Guest “xau” expressed similar difficulty to enter the party, though with a marked higher motivation on the topics. This guest was the one with the lower dynamics.
According to his own comments, guest “ado” rated a rather high a priori interest in many topics; however, he did not stick only to his own pet subjects (in contrast to ace or eto), but apparently went about all the others, seemingly trying to have a syncretic party; his singular, relatively lower score on TH7 does not reflect lesser interest—compared with the similar TH2, on which he was, nevertheless, active—but only that some other guests had populated this topic so much that it deserved less investment.
5. Discussion
The Garden-party experiment has been the first real-life experiment based on the ViewpointS approach and medium; in this section, we discuss its results facing the double goal of our research: enhancing and assessing collective informal learning. We start by considering the lessons learnt regarding the questions that introduced our approach:
- Did informal learning occur among the guests of the Garden-party?
- Did the guests discover useful and unexpected resources for knowledge acquisition?
- Does the ViewpointS medium enhance the recommending process?
- Do the ViewpointS metrics allow a form of assessment for informal learning?
5.1. May We Consider the Guests of the Garden-party as the Members of a Community?
The Garden-party experiment has gathered thirty volunteers among friends and colleagues of the first author—we called them guests—most of them being senior researchers with heavy workloads. As it happens in real garden parties, each of them knew quite few of the others at the beginning. The guests were given neither a specific purpose nor a priority subject of inquiry; as it happens in real garden parties, the only incentive was to visit, contribute, and enjoy; any subject/topic was welcome, from “food” to “philosophy”, including “data &information”, “science”, “emotions”, and “governance”. Moreover, the guests could not actually meet within the medium, nor could they engage conversational processes; instead, each guest could only discover the others through the context they brought with them (documents and topics) or through their reactions to the resources of the medium (people, documents, and topics). Regarding the question of the “community”, our context was neither that of a research community, nor that of a social network.
Nevertheless, the thirty guests spontaneously built together and browsed through a digital corpus of about eight hundred resources including forty external authors, four hundred documents, and three hundred topics. On the suggested basis of thirty minutes per week of benevolent activity, the 30 guests have contributed 628 resources: each guest inputting an average of 12 documents, nine topics, and one external author.
It is plausible that the dynamics would have been stronger and different in the case of a group gathered around an issue such as a collective action goal. Besides, the community would have become stronger with a longer experiment; we might say that the Garden-party experiment started a process of community building.
5.2. Did the Guests Discover Useful and Unexpected Resources for Knowledge Acquisition?
For two and a half months, the thirty guests of the Garden-party have interacted with and enriched the ViewpointS medium, by browsing through collective knowledge maps reflecting the proactivity and serendipity of the group. They have emitted 8828 viewpoints (signed connections between resources) during the experiment:
- Five thousand two hundred and ninety-five viewpoints of type serendip, acknowledging interesting encounters (these viewpoints are automatically generated as soon as a guest undertakes a search or reacts positively to a finding);
- Two thousand six hundred and two viewpoints of type subjective, acknowledging either emotional or rational reactions of their emitters to what they have encountered;
- Nine hundred and thirty-one viewpoints of type factual, acknowledging new logical links weaved by their emitters between the resources of the corpus.
Although the simple counting of serendip viewpoints is not a proof of the unexpectedness of the encounters, the fact that most guests were initially strangers to each other seems a good argument in favor of true serendipity offered by the medium. We might also say that without the effectiveness of serendipity, the Garden-party would have deflated very quickly.
5.3. Does the ViewpointS Medium Enhance the Recommending Process?
As it has been explained in Section 3.3, the knowledge maps (KM) play the role of “search and recommend systems” for the guests and simultaneously invite them to feedback and update the underlying knowledge graph (KG), which evolves in a selection process analogue to that occurring in human brains. The bunches of aggregated viewpoints behave like synapses. The ViewpointS medium is by design an immersive recommender system; the community building process as well as the dynamics of the experiment plead in favor of the efficiency of this design and seem to us strong encouragements for improving it.
The SP-distance and K-distance provide useful proximity measurements leading to topology-driven recommendations. Figure 12 shows coherence between these measurements. Whereas the SP-distance is expected to vary slowly along time, the K-distance is more sensitive to the dynamics of the community, since it is directly impacted by every new viewpoint connecting a resource. A study of the evolution of the proximities issued from the K-distance might assess the impact of the recommendations by the collective in a longer experiment.
The question of scaling up is still under study. The limits due to the complexity of the multi-paths search algorithm have constrained us to limit the radius of the search to 2 in the context of an experiment at a modest scale (30 guests, 800 resources shared, 9000 viewpoints emitted). This confirms that in case of a larger KG, an exhaustive exploration may quickly become impossible. This is not alarming, however, since the approach is based on local explorations around targets: the limiting factor is not the size of the KG but its density in connections. Further analyses should help us evaluate better the conditions and limits for scaling up.
5.4. Do the ViewpointS Metrics Allow a Form of Assessment for Informal Learning?
It should firstly be noted that the symmetry of the ViewpointS model (where people, documents, and topics are resources) and the simplicity of the metrics embedded in the medium allow many more analyses than those included in the present study. We have profiled guests along topics hubs, we may as well compute guests’ proximities, profile documents along topic hubs, and profile topics along guests. We may also add here that VWA also allows (i) to consider “artificial agents” for automatically feeding (semi) the KG and (ii) to enrich the “perspective” mechanism, i.e., the preference selection with sophisticated rule-based algorithms [30]. All these aspects have not yet been explored in depth.
The KDNA and SEAa measurements have exemplified how the ViewpointS medium allows the testing of the Vygotsky hypothesis: we learn (we establish proximity through our own trails) in the neighborhood of the themes (topic hubs) that we already know (according to our self-evaluations); a future experiment, involving a large number of learners, might be dedicated to this issue.
The KDNA and KDNB measurements have proved useful for identifying personal styles of guests browsing the knowledge graph and, more importantly, for evaluating the interdependence between individual and collective search for knowledge. It turned out that the informal learning we were pursuing was best reflected in the contrasts and singularities that appear in the activity patterns of the various members. This couple of indicators, which provide at no cost “individual profiles”, seems quite promising with respect to the assessment of informal learning when integrated in diachronic analyses. Five exploring strategies, among many potential strategies, had been proposed initially (see Section 3.5): “human first”, i.e., watch the trails of chosen guests, “topic hub first”, “random”, or most “recent”, i.e., watch the fresh trails opened by the most proactive. A next possible step would consist of testing these strategies in a controlled experiment in order to study whether they have a visible signature in the profiles of the guests.
Unfortunately, we have not been able to undertake diachronic analyses; these would require a longer experiment with more homogeneous dynamics. Besides, a fine-tuned counter-measure through diachronic self-evaluation should be required in order to prove a learning effect. Nevertheless, under the light of the Garden-party experiment, the ViewpointS model of a collective brain, where individual serendipity is moderated by the community [31], seems to us relevant for addressing the question of informal learning.
6. Conclusions
The experiment presented and discussed in this article is the first real-life experiment testing the ViewpointS interactive medium, through which we address the goal of enhancing and assessing a collective process of knowledge acquisition through informal learning.
The underlying model is based on the multiplicity of signed and time-stamped connections between shared knowledge resources established by the members of a community of trust; these connections are aggregated and yield trails that enhance the knowledge discovery and its structuring, in the metaphor of a collective brain. Moreover, this model includes metrics allowing the measurement of perspective-dependent proximities between resources (humans, documents, topics, events) as well as the evolution of these proximities along the emerging knowledge trails.
The Garden-party experiment gathered thirty volunteers called guests who spontaneously, for two and a half months, built together and browsed through a digital corpus of about eight hundred resources including forty external authors, four hundred documents, and three hundred topics. Interlinking these resources, the guests have weaved a web of nine thousand connections reflecting logical links, emotional or rational reactions as well as happy encounters.
The experimental data issued from the Garden-party are analyzed through two comparisons bearing on the proximities measured between the guests and the topic hubs (themes of interest). Both comparisons focus on a sample of eleven guests and seven topic hubs (aggregators of topics). The first comparison is between the KDNA proximities (computed along the personal trails) and the SEAc proximities (self-evaluated proximities); in seven cases, we observe a similarity between KDNA profiles and SEAc profiles. This phenomenon might be interpreted as a confirmation of Vygotsky’s teachings: we learn (we establish proximity through our own trails) in the neighborhood of the themes of interest (topic hubs) that we already know about. The second comparison is between the KDNA proximities (computed along the personal trails) and the KDNB proximities (computed along the trails opened by the other members of the community); it allows us to illustrate the difference of browsing style between the participants and opens the way to interpretation as collective informal learning in a few cases.
The descriptive analysis we have conducted in this paper will hopefully play the role of preparatory work for a future inferential statistical analysis, when we have improved the experimental protocol in such a way that we may undertake significance tests and diachronic analyses.
The current results do not allow us to rigorously assess a learning process; nevertheless, the dynamics of the experiment plead in favor of the efficiency of the ViewpointS medium as an immersive recommender system enhancing knowledge acquisition. Moreover, we believe the ViewpointS medium proposes innovative means for measuring informal and collective learning.
Our next task will consist of improving the medium by taking into account the feedback the guests have provided about the interface. We then envisage a next experiment, lasting longer, based on a community gathered around a collective action goal favoring stable dynamics, such as a multi partners project in which the Cirad is engaged. In a future step, a controlled experiment aimed at studying the correlation between “individual exploring profiles” and KDNA/KDNB comparisons is envisaged. We hope that our approach and medium may help the community to progress on the challenging trail of understanding and forecasting the highly complex matter of collective and informal learning, on the Web as well as in real life.
Author Contributions
Conceptualization, P.L. and S.A.C.; data curation, P.L. and P.D.; methodology, P.L., S.A.C., V.D., P.D., and J.-P.T.; software, P.L.; validation, P.L., S.A.C., and J.-P.T.; writing—original draft, P.L., S.A.C., V.D., and J.-P.T.; writing—review and editing, J.-P.T. All authors have read and agreed to the published version of the manuscript.
Funding
The development of the ViewpointS Web Application has been sustained by several international project contexts focusing on knowledge management, including the PACTE-Plateformes project founded by AFD (Association Française pour le Développement).
Institutional Review Board Statement
Not applicable.
Informed Consent Statement
Informed consent was obtained from all subjects involved in the study.
Data Availability Statement
The data presented in this study are available on request from the corresponding author. The data are not publicly available due to the necessity of the ViewpontS medium to interpret them.
Conflicts of Interest
The authors declare no conflict of interest.
References
- Nyce, J.M.; Kahn, P. (Eds.) From Memex to Hypertext: Vannevar Bush and the Mind’s Machine; Academic Press Professional, Inc.: Cambridge, MA, USA, 1991; ISBN 978-0-12-523270-8. [Google Scholar]
- Engelbart, D.C.; Engelbart, C. Bootstrapping Organizations into the 21st Century: A Strategic Framework, Bootstrap Institute, December 1991 (AUGMENT 132803). Available online: https://www.dougengelbart.org/content/view/115/000/ (accessed on 10 January 2021).
- Di Castri, F. Access to information and e-learning for local empowerment: The requisite for human development and environmental protection. In Towards the Learning Grid: Advances in Human Learning Services; Frontiers in Artificial Intelligence and Applications; Ritrovato, P., Allison, C., Cerri, S.A., Dimitrakos, T., Gaeta, M., Salerno, S., Eds.; IOS Press: Amsterdam The Netherlands, 2005; Volume 127, pp. 12–21. [Google Scholar]
- Scardamalia, M. Can schools enter a Knowledge Society? In Educational Technology and the Impact on Teaching and Learning; Selinger, M., Wynn, J., Eds.; RM: Abingdon, UK, 2000; pp. 5–10. [Google Scholar]
- De Cindio, F.; Peraboni, C.; Cerri, S.A. Network Communities. In Encyclopedia of the Sciences of Learning; Seel, N.M., Ed.; Springer: Boston, MA, USA, 2012. [Google Scholar]
- Schneider, M.; Stern, E. L’apprentissage dans une perspective cognitive. In Comment Apprend-On? La Recherche au Service de la Pratique; Dumont, H., Istance, D., Benavides, F., Eds.; Éditions OCDE: Paris, France, 2010; pp. 73–95. [Google Scholar]
- Breuker, J.; Cerri, S.A. Learning as a Side Effect. In Encyclopedia of the Sciences of Learning; Seel, N.M., Ed.; Springer: Boston, MA, USA, 2012. [Google Scholar]
- Van Andel, P. Anatomy of the unsought finding. Serendipity: Origin, history, domains, traditions, appearances, patterns and programmability. Br. J. Philos. Sci. 1994, 45, 631–648. [Google Scholar] [CrossRef]
- Herlocker, L.; Konstan, J.A.; Terveen, L.G.; Riedl, J.T. Evaluating Collaborative Filtering Recommender Systems. ACM Trans. Inf. Syst. 2004, 22, 5–53. [Google Scholar] [CrossRef]
- Kotkov, D.; Konstan, J.A.; Zhao, Q.; Veijalainen, J. Investi-gating Serendipity in Recommender Systems Based on Real User Feedback. In Proceedings of the SAC 2018: Symposium on Applied Computing, Pau, France, 9–13 April 2018. [Google Scholar]
- Adamic, L.; Zhang, J.; Bakshy, E.; Ackerman, M. Knowledge sharing and Yahoo Answers: Everyone knows something. In Proceedings of the 17th International Conference on World Wide Web, Beijing, China, 21–25 April 2008; pp. 665–674. [Google Scholar]
- Toms, E. Serendipitous Information Retrieval. Proceedings of DELOS Workshop: Information Seeking, Searching and Querying in Digital Libraries. 2000. Available online: https://delosnetwork.com/workshops/ (accessed on 13 February 2021).
- Lops, P.; de Gemmis, M.; Semeraro, G. Content-based Recommender Systems: State of the Art and Trends. In Recommender Systems Handbook; Ricci, F., Rokach, L., Shapira, B., Kantor, P., Eds.; Springer: Boston, MA, USA, 2011. [Google Scholar]
- Yeung, C.M.A.; Gibbins, N.; Shadbolt, N. A Study of User Profile Generation from Folksonomies. In Proceedings of the Workshop on Social Web and Knowledge Management, Social Web 2008 Workshop at WWW2008, Beijing, China, 20–24 April 2008. [Google Scholar]
- Verbert, K.; Manouselis, N.; Ochoa, X.; Wolpers, M.; Drachsler, H.; Bosnic, I.; Duval, E. Context-aware recommender systems for learning: A survey and future challenges. IEEE Trans. Learn Technol. 2012, 5, 318–335. [Google Scholar] [CrossRef]
- Moreno, J.L. Who Shall Survive? A New Approach to the Problem of Human Interrelations; Nervous and Mental Disease Monograph Series; Nervous and Mental Disease Publishing Co.: Washington, DC, USA, 1934. [Google Scholar] [CrossRef]
- Csauthors.net. Available online: https://www.csauthors.net/distance (accessed on 13 February 2021).
- Klerkx, J.; Duval, E. Visualising Social Bookmarks. Soc. Inf. Retr. Technol. Enhanc. Learn 2009, 10, 2. [Google Scholar]
- Jivet, J.; Scheffel, M.; Specht, M.; Drachsler, H.Y. License to Evaluate: Preparing Learning Analytics Dashboards for Educational Practice. In Proceedings of the LAK’18: International Conference on Learning Analytics and Knowledge, Sydney, Australia, 7–9 March 2018; ACM: New York, NY, USA, 2018. [Google Scholar] [CrossRef]
- Jaffé, A.; Trajtenberg, M. Flows of knowledge from universities and federal laboratories: Modeling the flow of patent citations over time and across institutional and geographic boundaries. Proc. Natl. Acad. Sci. USA 1996, 93, 12671–12677. [Google Scholar] [CrossRef] [PubMed] [Green Version]
- Troussas, C.; Krouska, A.; Sgouropoulou, C. A Novel Teaching Strategy through Adaptive Learning Activities for Computer Programming. IEEE Trans. Educ. 2020. [Google Scholar] [CrossRef]
- Coudel, E.; Rey-Valette, H.; Tonneau, J.P. Which competencies and learning facilitate the involvement of local actors in territorial governance? The example of a Fatmer University in Brazil. Int. J. Sustain. Dev. 2008, 11, 206–225. [Google Scholar] [CrossRef]
- Vygotsky, L.S. Mind in society. In The Development of Higher Psychological Functions; Cole, M., John-Steiner, V., Scribner, S., Souberman, E., Eds.; Harvard University Press: Cambridge, MA, USA, 1978. [Google Scholar]
- Muthukrishna, M.; Henrich, J. Innovation in the Collective Brain. Philos. Trans. R. Soc. B 2016, 371. [Google Scholar] [CrossRef] [PubMed] [Green Version]
- Lemoisson, P.; Surroca, G.; Jonquet, C.; Cerri, S.A. ViewpointS: Capturing formal data and informal contributions into an adaptive knowledge graph. Int. J. Knowl. Learn. 2018, 12, 119–145. [Google Scholar] [CrossRef] [Green Version]
- Lemoisson, P.; Cerri, S.A.; Rakotondrahaja, C.; Andriamialison, A.S.P.; Sankar, H. VWA: ViewpointS Web Application to Assess Collective Knowledge Building. In Proceedings of the 11th International Conference on Computational Collective Intelligence (ICCCI), Hendaye, France, 4–6 September 2019; pp. 3–15. [Google Scholar]
- Lemoisson, P.; Cerri, S.A. ViewpointS: Towards a Collective Brain. In Proceedings of the ICCCI: International Conference on Computational Collective Intelligence, Bristol, UK, 5–7 September 2018; pp. 3–12. [Google Scholar]
- Edelman, G.M.; Tononi, G. A Universe of Consciousness: How Matter Becomes Imagination; Basic Books: New York, NY, USA, 2000. [Google Scholar]
- Dunning, D. Chapter five—The Dunning–Kruger Effect: On Being Ig-norant of One’s Own Ignorance. Adv. Exp. Soc. Psychol. 2011, 44, 247–296. [Google Scholar] [CrossRef]
- Cerri, S.A.; Lemoisson, P. Sovereignty by personalization of information search: How collective wisdom may influence my knowledge. In Intelligent Tutoring Systems 2021; Springer: Berlin/Heidelberg, Germany, 2021; in press. [Google Scholar]
- Cerri, S.A.; Lemoisson, P. Serendipitous Learning Fostered by Brain State Assessment and Collective Wisdom. In Proceedings of the 2nd International Conference on Brain Function Assessment in Learning (BFAL), Heraklion, Greece, 9–11 October 2020. [Google Scholar]
Figure 1.
Five viewpoints extracted from the Garden-party experiment.

Figure 2.
How the community members discover knowledge resources in the medium: the tabular and graphical views of a knowledge map resulting from the query “Francesco Di Castri” under a chosen perspective. In grey on the left: a small extract of the knowledge graph.
Figure 2.
How the community members discover knowledge resources in the medium: the tabular and graphical views of a knowledge map resulting from the query “Francesco Di Castri” under a chosen perspective. In grey on the left: a small extract of the knowledge graph.

Figure 3.
How the community members read in the medium: preview before access.

Figure 4.
How the community members read in the medium. Left part: creating resources via the VWA menu. Right part: interconnecting resources via dedicated buttons.
Figure 4.
How the community members read in the medium. Left part: creating resources via the VWA menu. Right part: interconnecting resources via dedicated buttons.

Figure 5.
Given a knowledge graph, five distinct perspectives yield five different knowledge maps.

Figure 6.
How the dynamics of the community and the chosen perspectives both influence the connectivity and the distances between resources in the KMs.
Figure 6.
How the dynamics of the community and the chosen perspectives both influence the connectivity and the distances between resources in the KMs.

Figure 7.
The viewpoints emitted by the 30 guests during the 78 days of the experiment. Each colored square illustrates the number of viewpoints emitted by a guest (anonymized pseudo on the vertical axis) for one day (number of the day on the horizontal time line): “blue” means 1 or more viewpoints emitted, orange means 20 or more, violet means 60 or more.

Figure 8.
The resources collected in TH-X series.

Figure 9.
Classification of the documents in terms of centrality and specificity with respect to the nine topic hubs.
Figure 9.
Classification of the documents in terms of centrality and specificity with respect to the nine topic hubs.

Figure 10.
Classification of the topics in terms of relevance and specificity with respect to the nine topic hubs.
Figure 10.
Classification of the topics in terms of relevance and specificity with respect to the nine topic hubs.

Figure 11.
Summary of the dynamics for 11 guests.

Figure 12.
SP-distances/0.28 and K-distances between the guests and the topic hubs; the maximum on each axis is 0.5.
Figure 12.
SP-distances/0.28 and K-distances between the guests and the topic hubs; the maximum on each axis is 0.5.

Figure 13.
An overview of the guest-a and guest-b series.

Figure 14.
KDNA and KDNB proximities between 17 guests and the 9 topic hubs. KDNA (on the left, dark blue) exploits the trails of the targeted guest whereas KDNB (on the right, light blue) excludes the targeted guests’ trails but exploits all the trails of the others. Both these proximities have been normalized by max (KDNA, KDNB).

Figure 15.
The normalized difference between final and initial self-evaluations by the guests of their proximities to the topic hubs (SEAa).
Figure 15.
The normalized difference between final and initial self-evaluations by the guests of their proximities to the topic hubs (SEAa).

Figure 16.
The dynamics of the eleven guests in the sample.

Figure 17.
An imaginary case illustrating how trails opened by others progressively connect a guest to a topic hub.
Figure 17.
An imaginary case illustrating how trails opened by others progressively connect a guest to a topic hub.

Figure 18.
Comparison of the proximities with topic hubs for 11 guests. KDNA = proximities measured through the guests’ trails. KDNB = proximities measured through the others’ trails.
Figure 18.
Comparison of the proximities with topic hubs for 11 guests. KDNA = proximities measured through the guests’ trails. KDNB = proximities measured through the others’ trails.

Figure 19.
SEAc computes the normalized average value of self-evaluated proximities measured at the beginning and at the end of the experiment; the average value of the whole matrix = 0.27; values above 0.27 appear on a red background.
Figure 19.
SEAc computes the normalized average value of self-evaluated proximities measured at the beginning and at the end of the experiment; the average value of the whole matrix = 0.27; values above 0.27 appear on a red background.

Figure 20.
Graphical comparison of the proximities with topic hubs for 11 guests measured through three complementary indicators. KDNA = proximities measured through the guests’ trails. KDNB = proximities measured through the others’ trails. SEAc = self-evaluated proximities.
Figure 20.
Graphical comparison of the proximities with topic hubs for 11 guests measured through three complementary indicators. KDNA = proximities measured through the guests’ trails. KDNB = proximities measured through the others’ trails. SEAc = self-evaluated proximities.


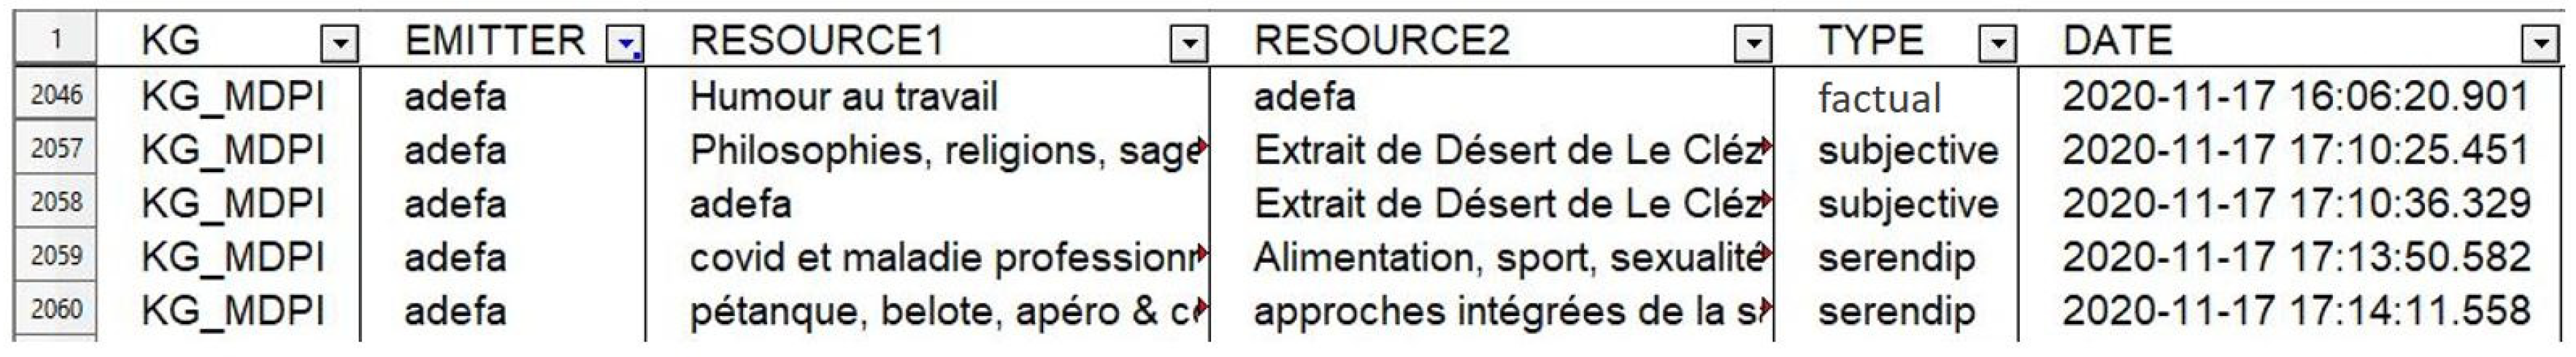
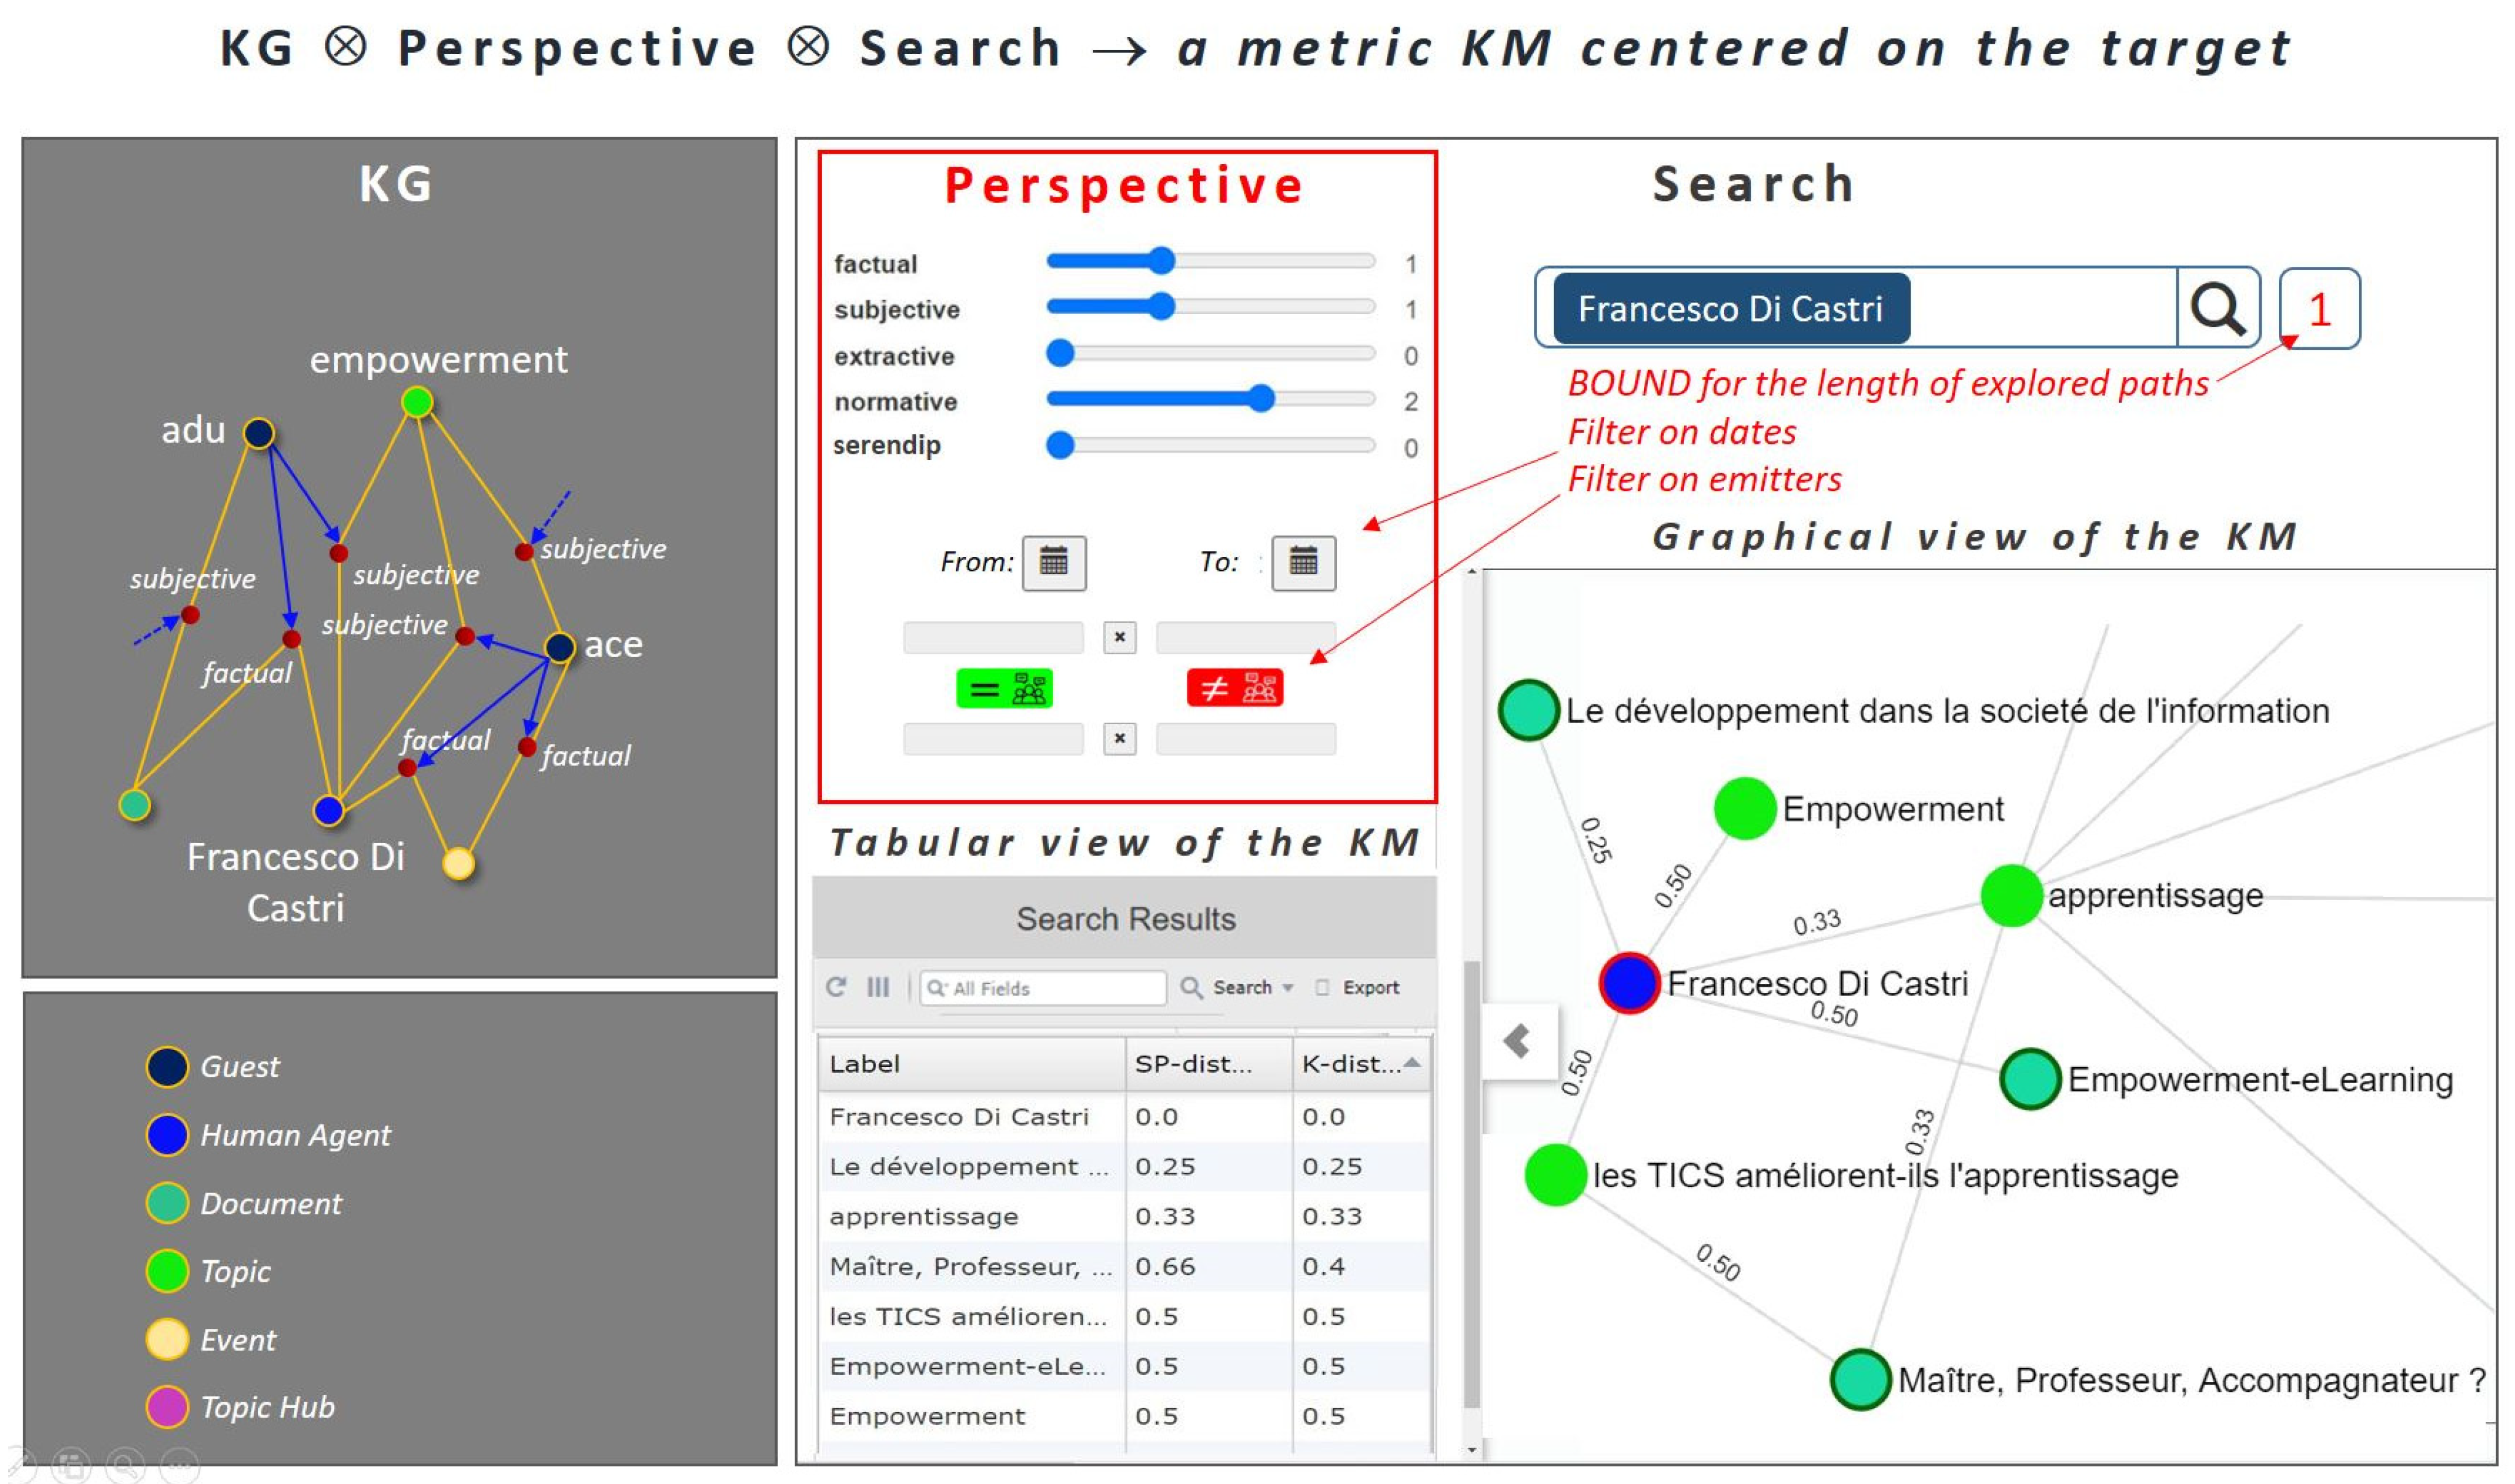
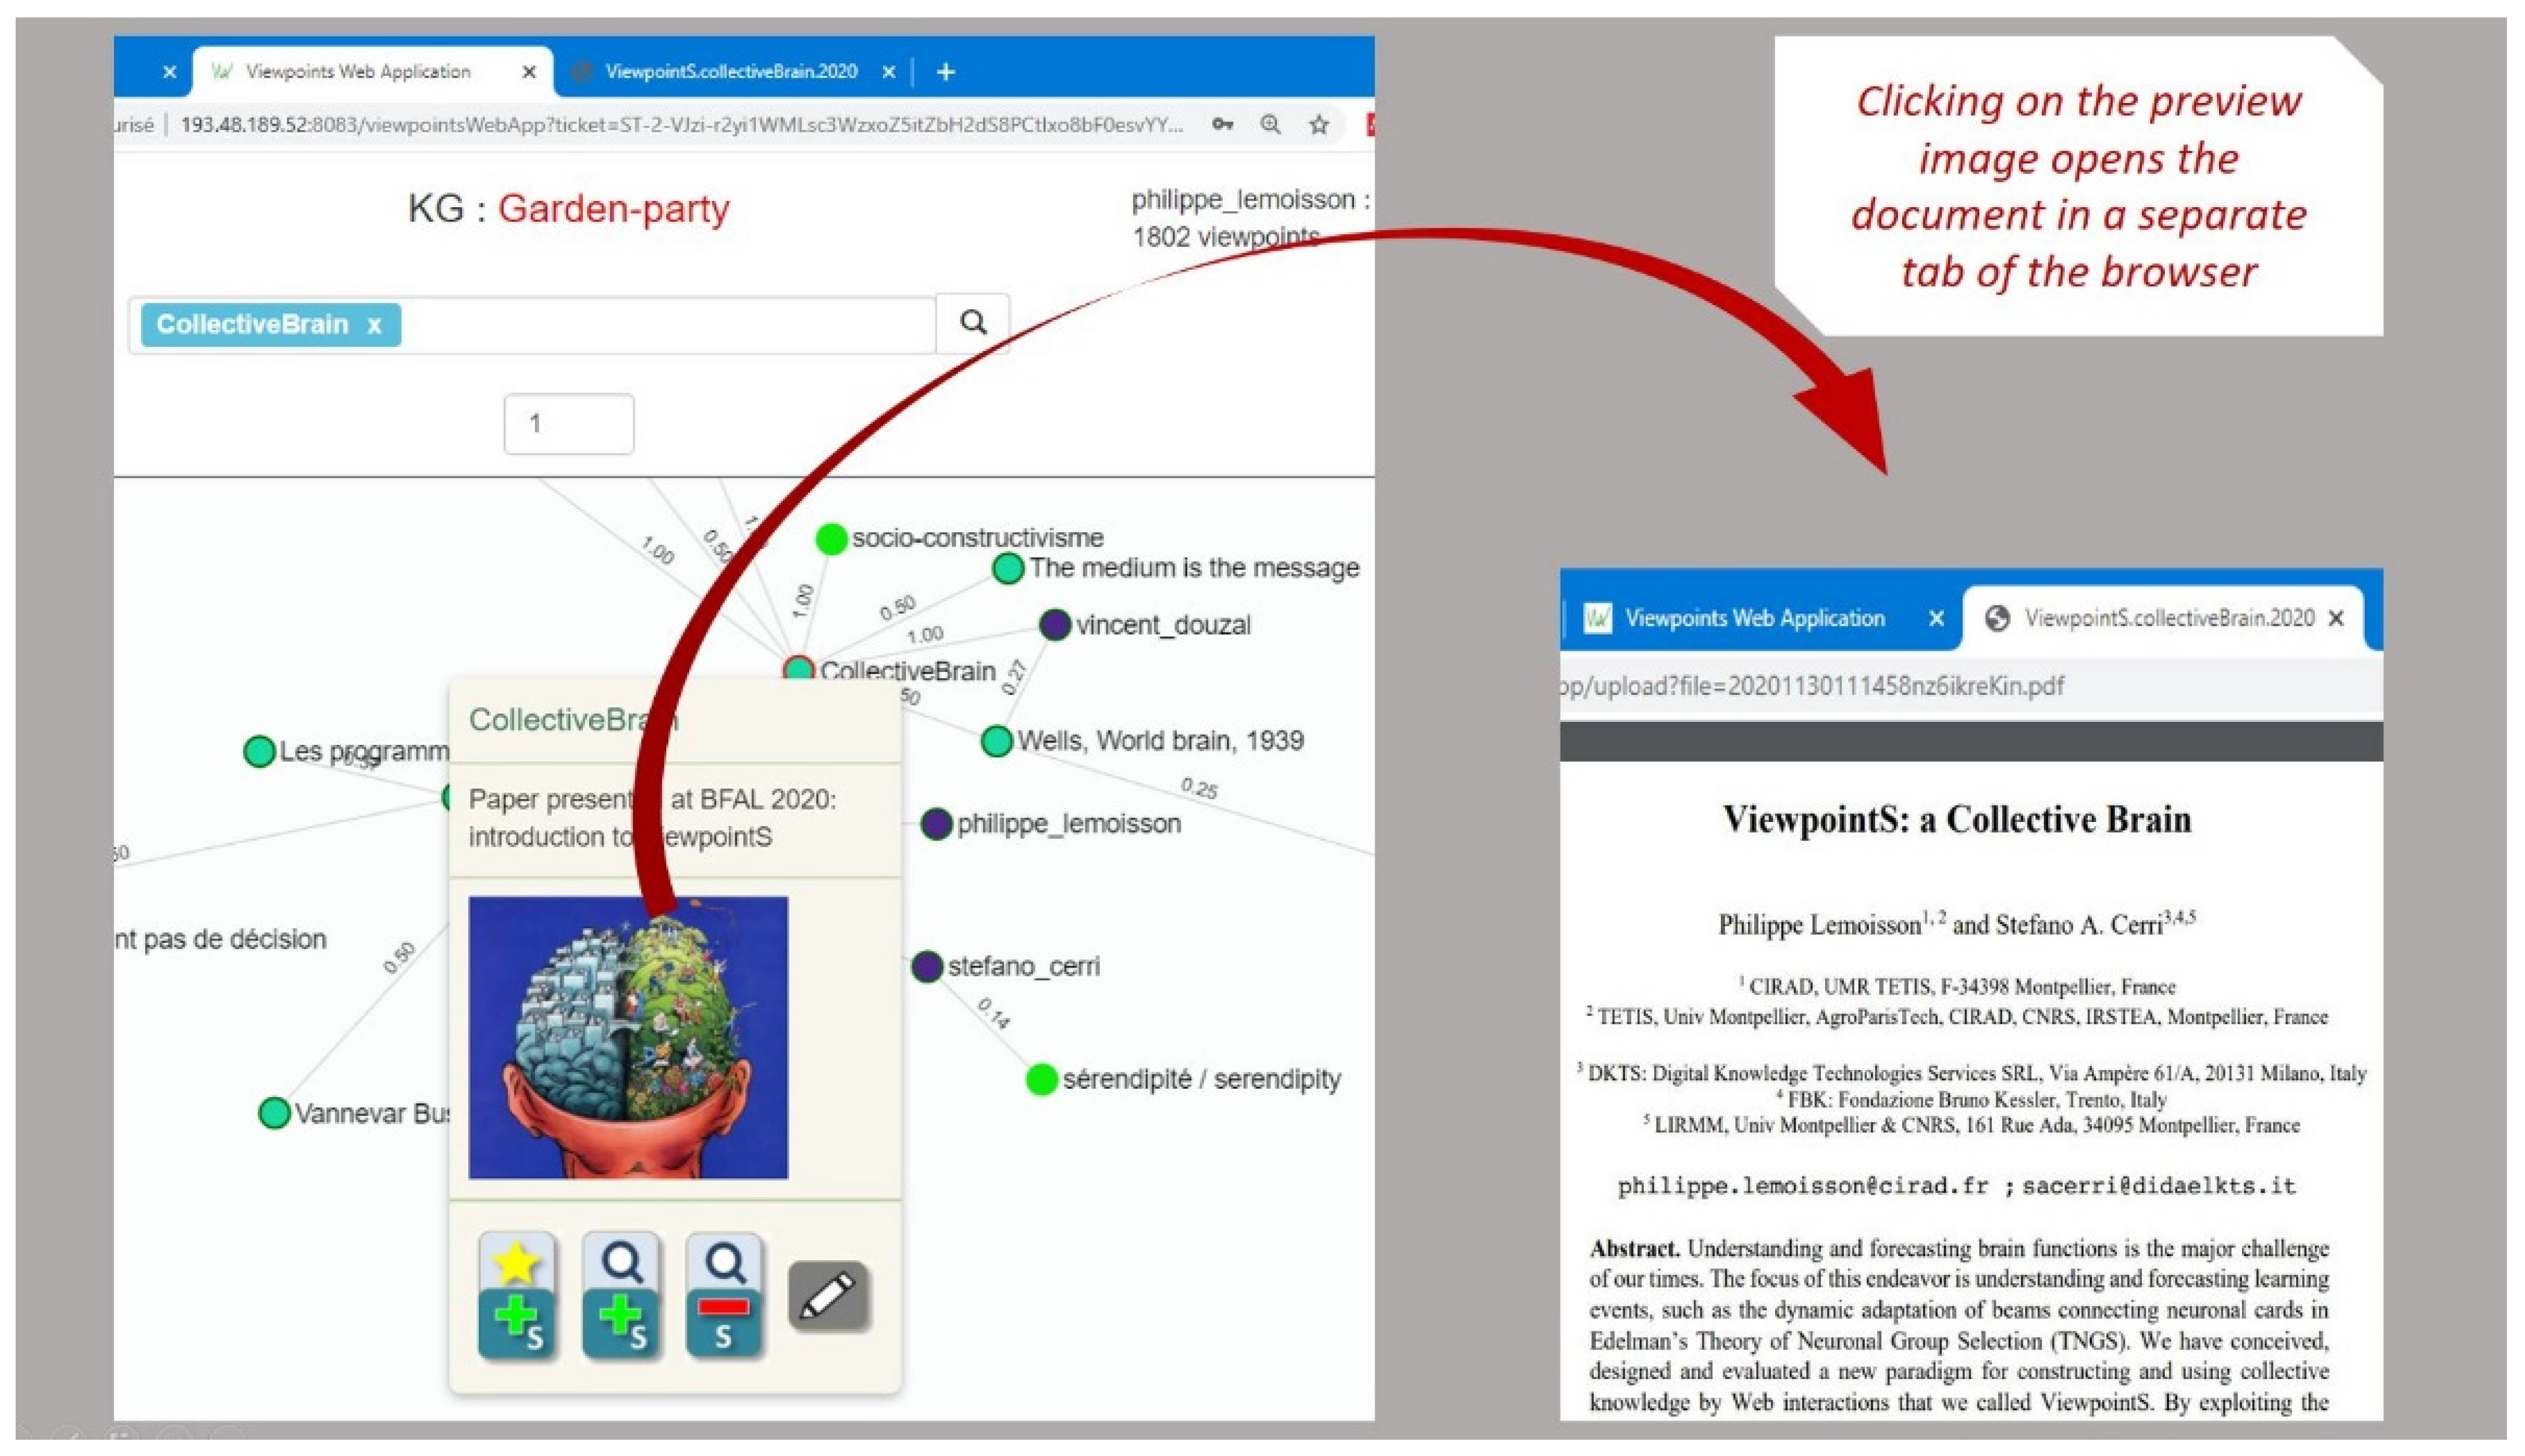
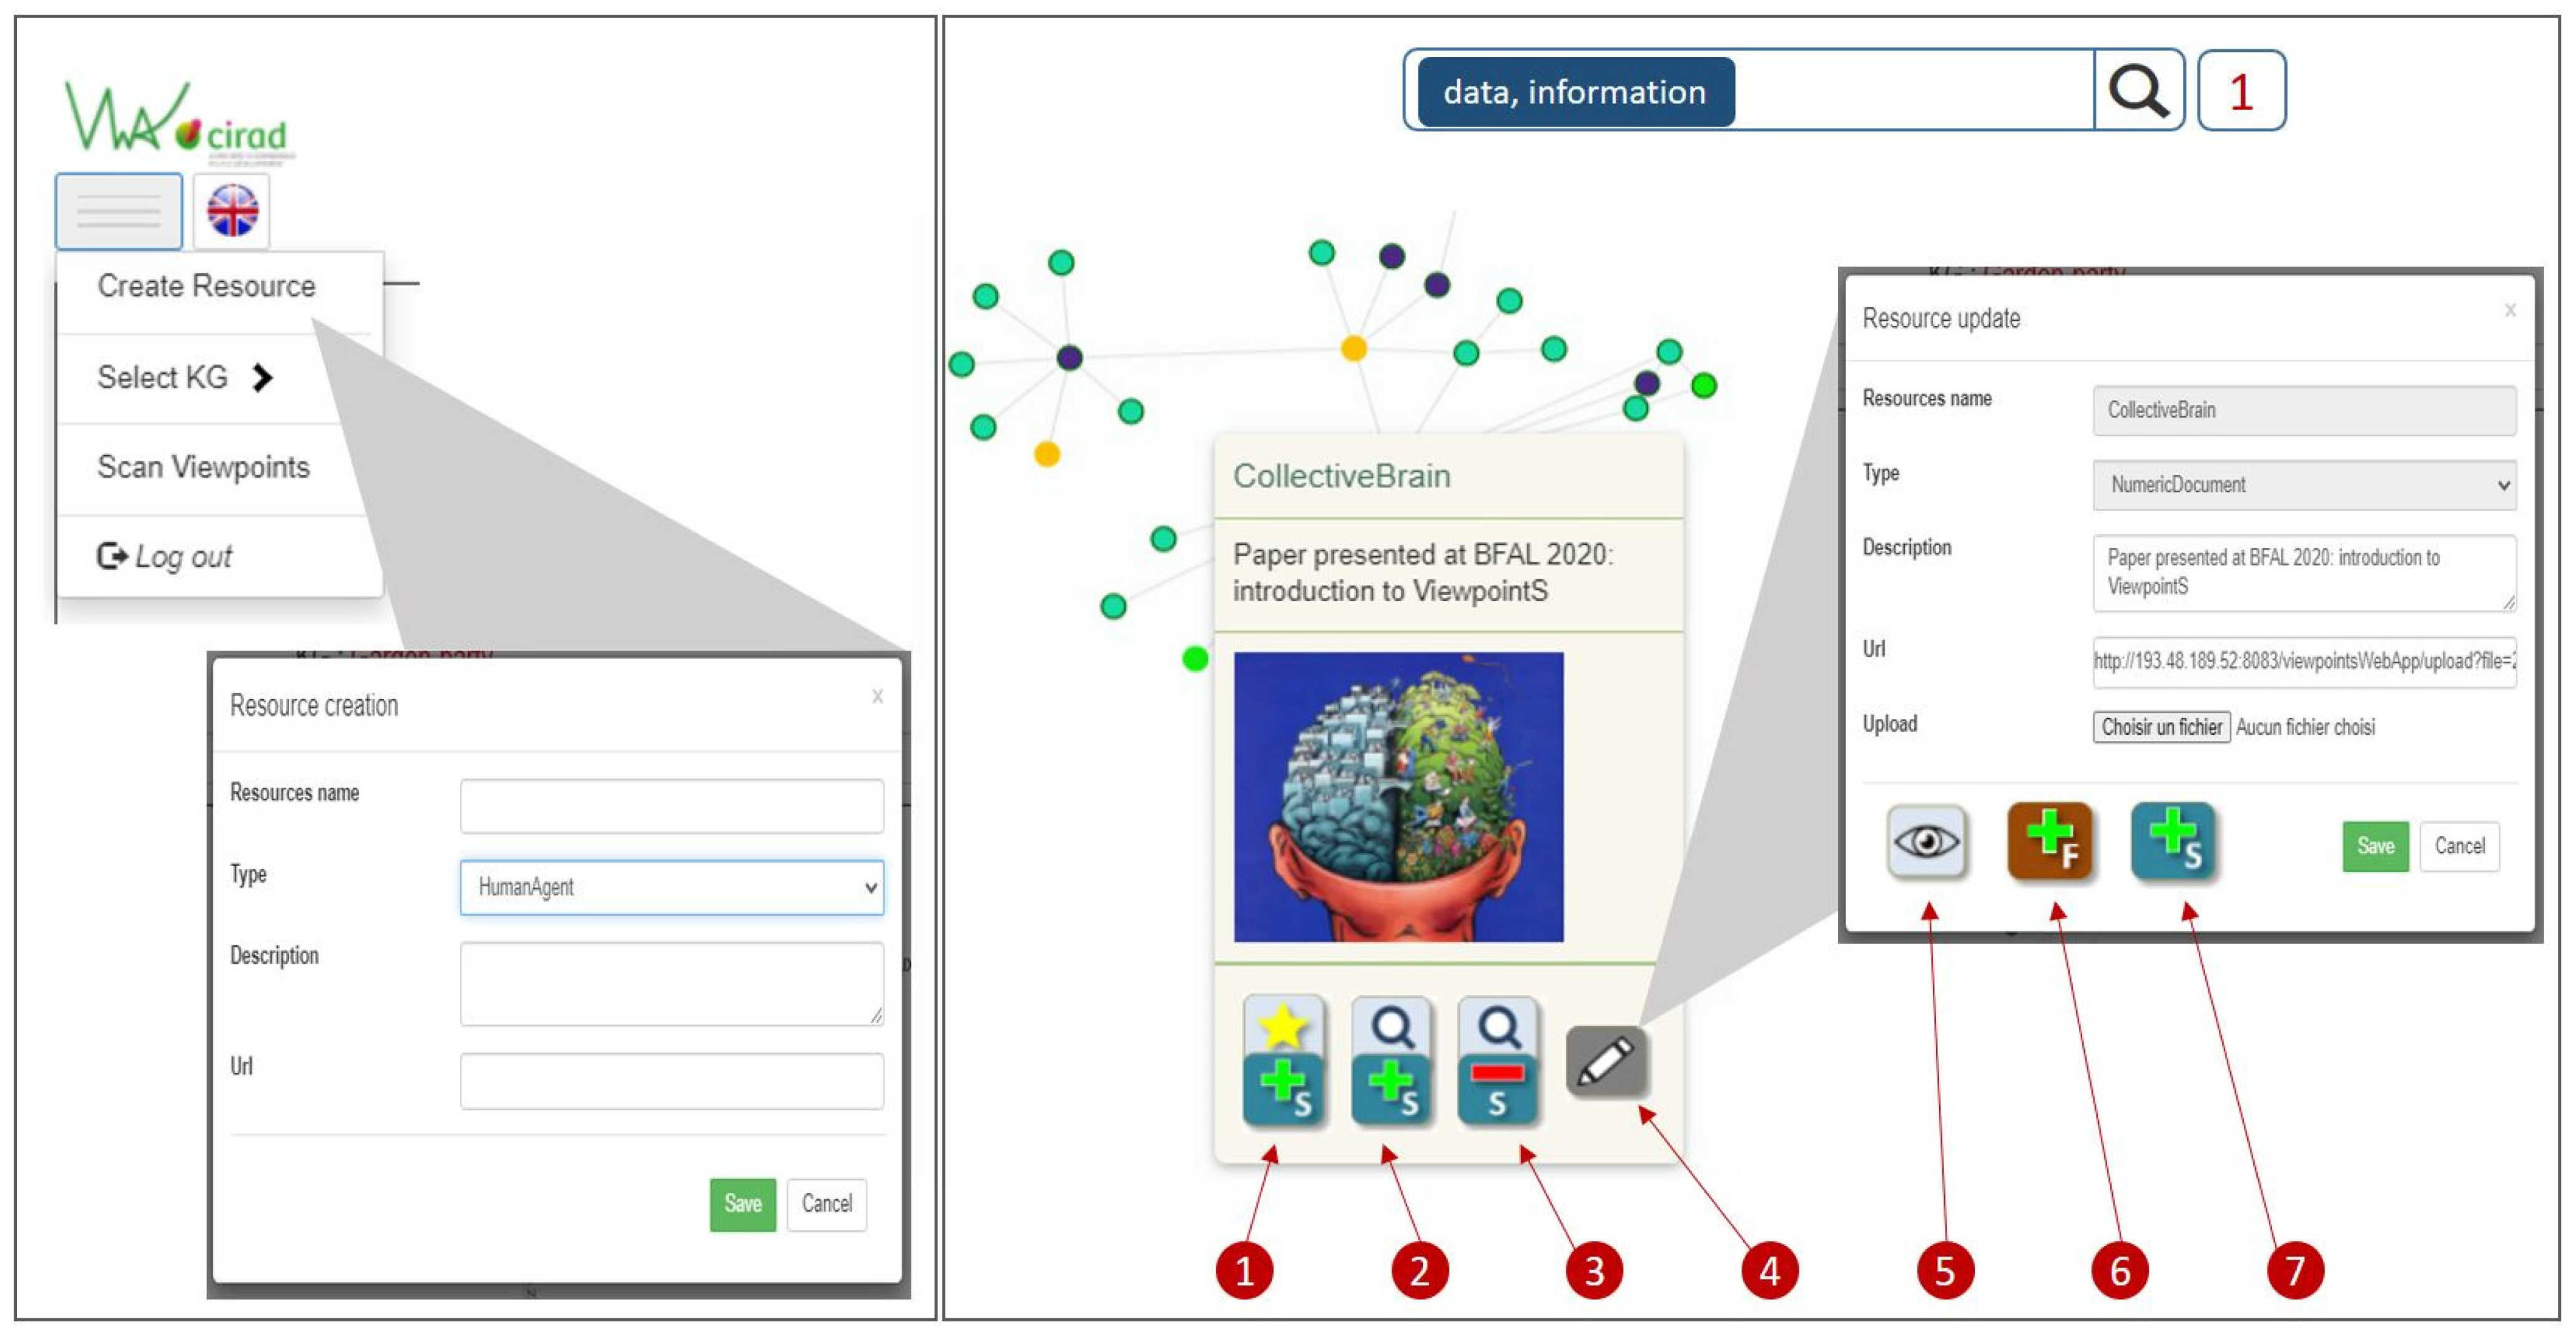
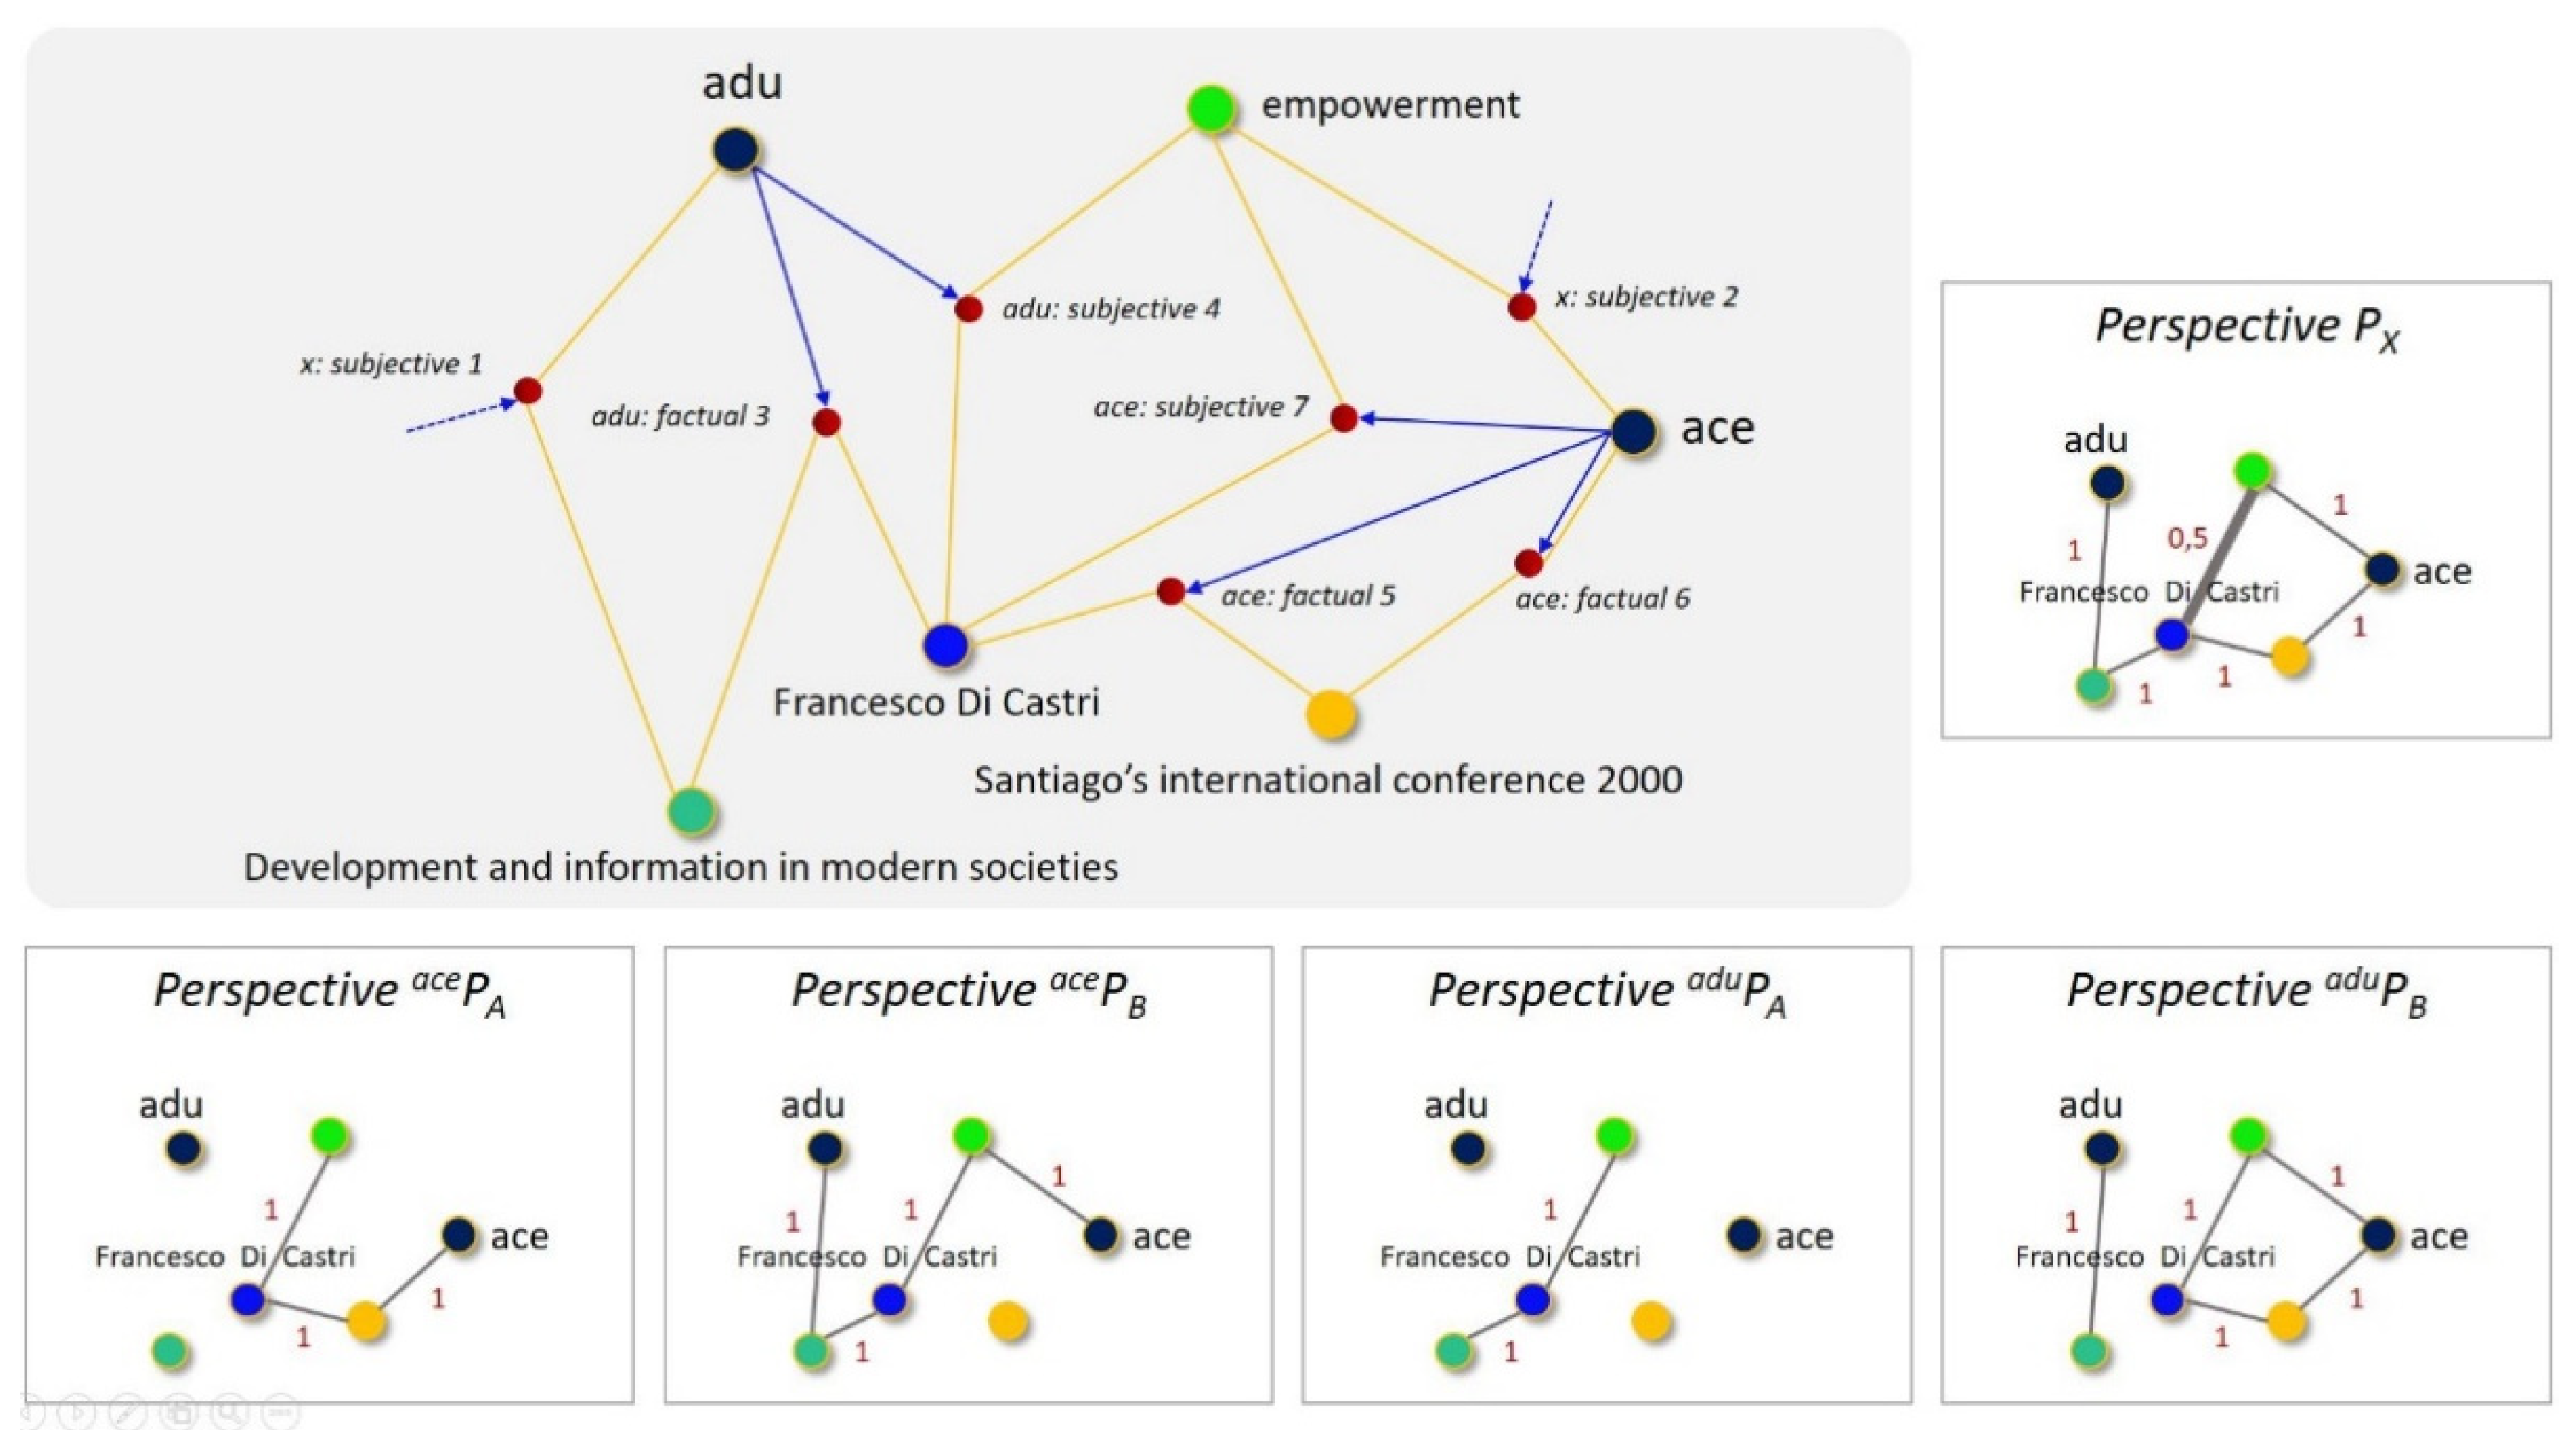
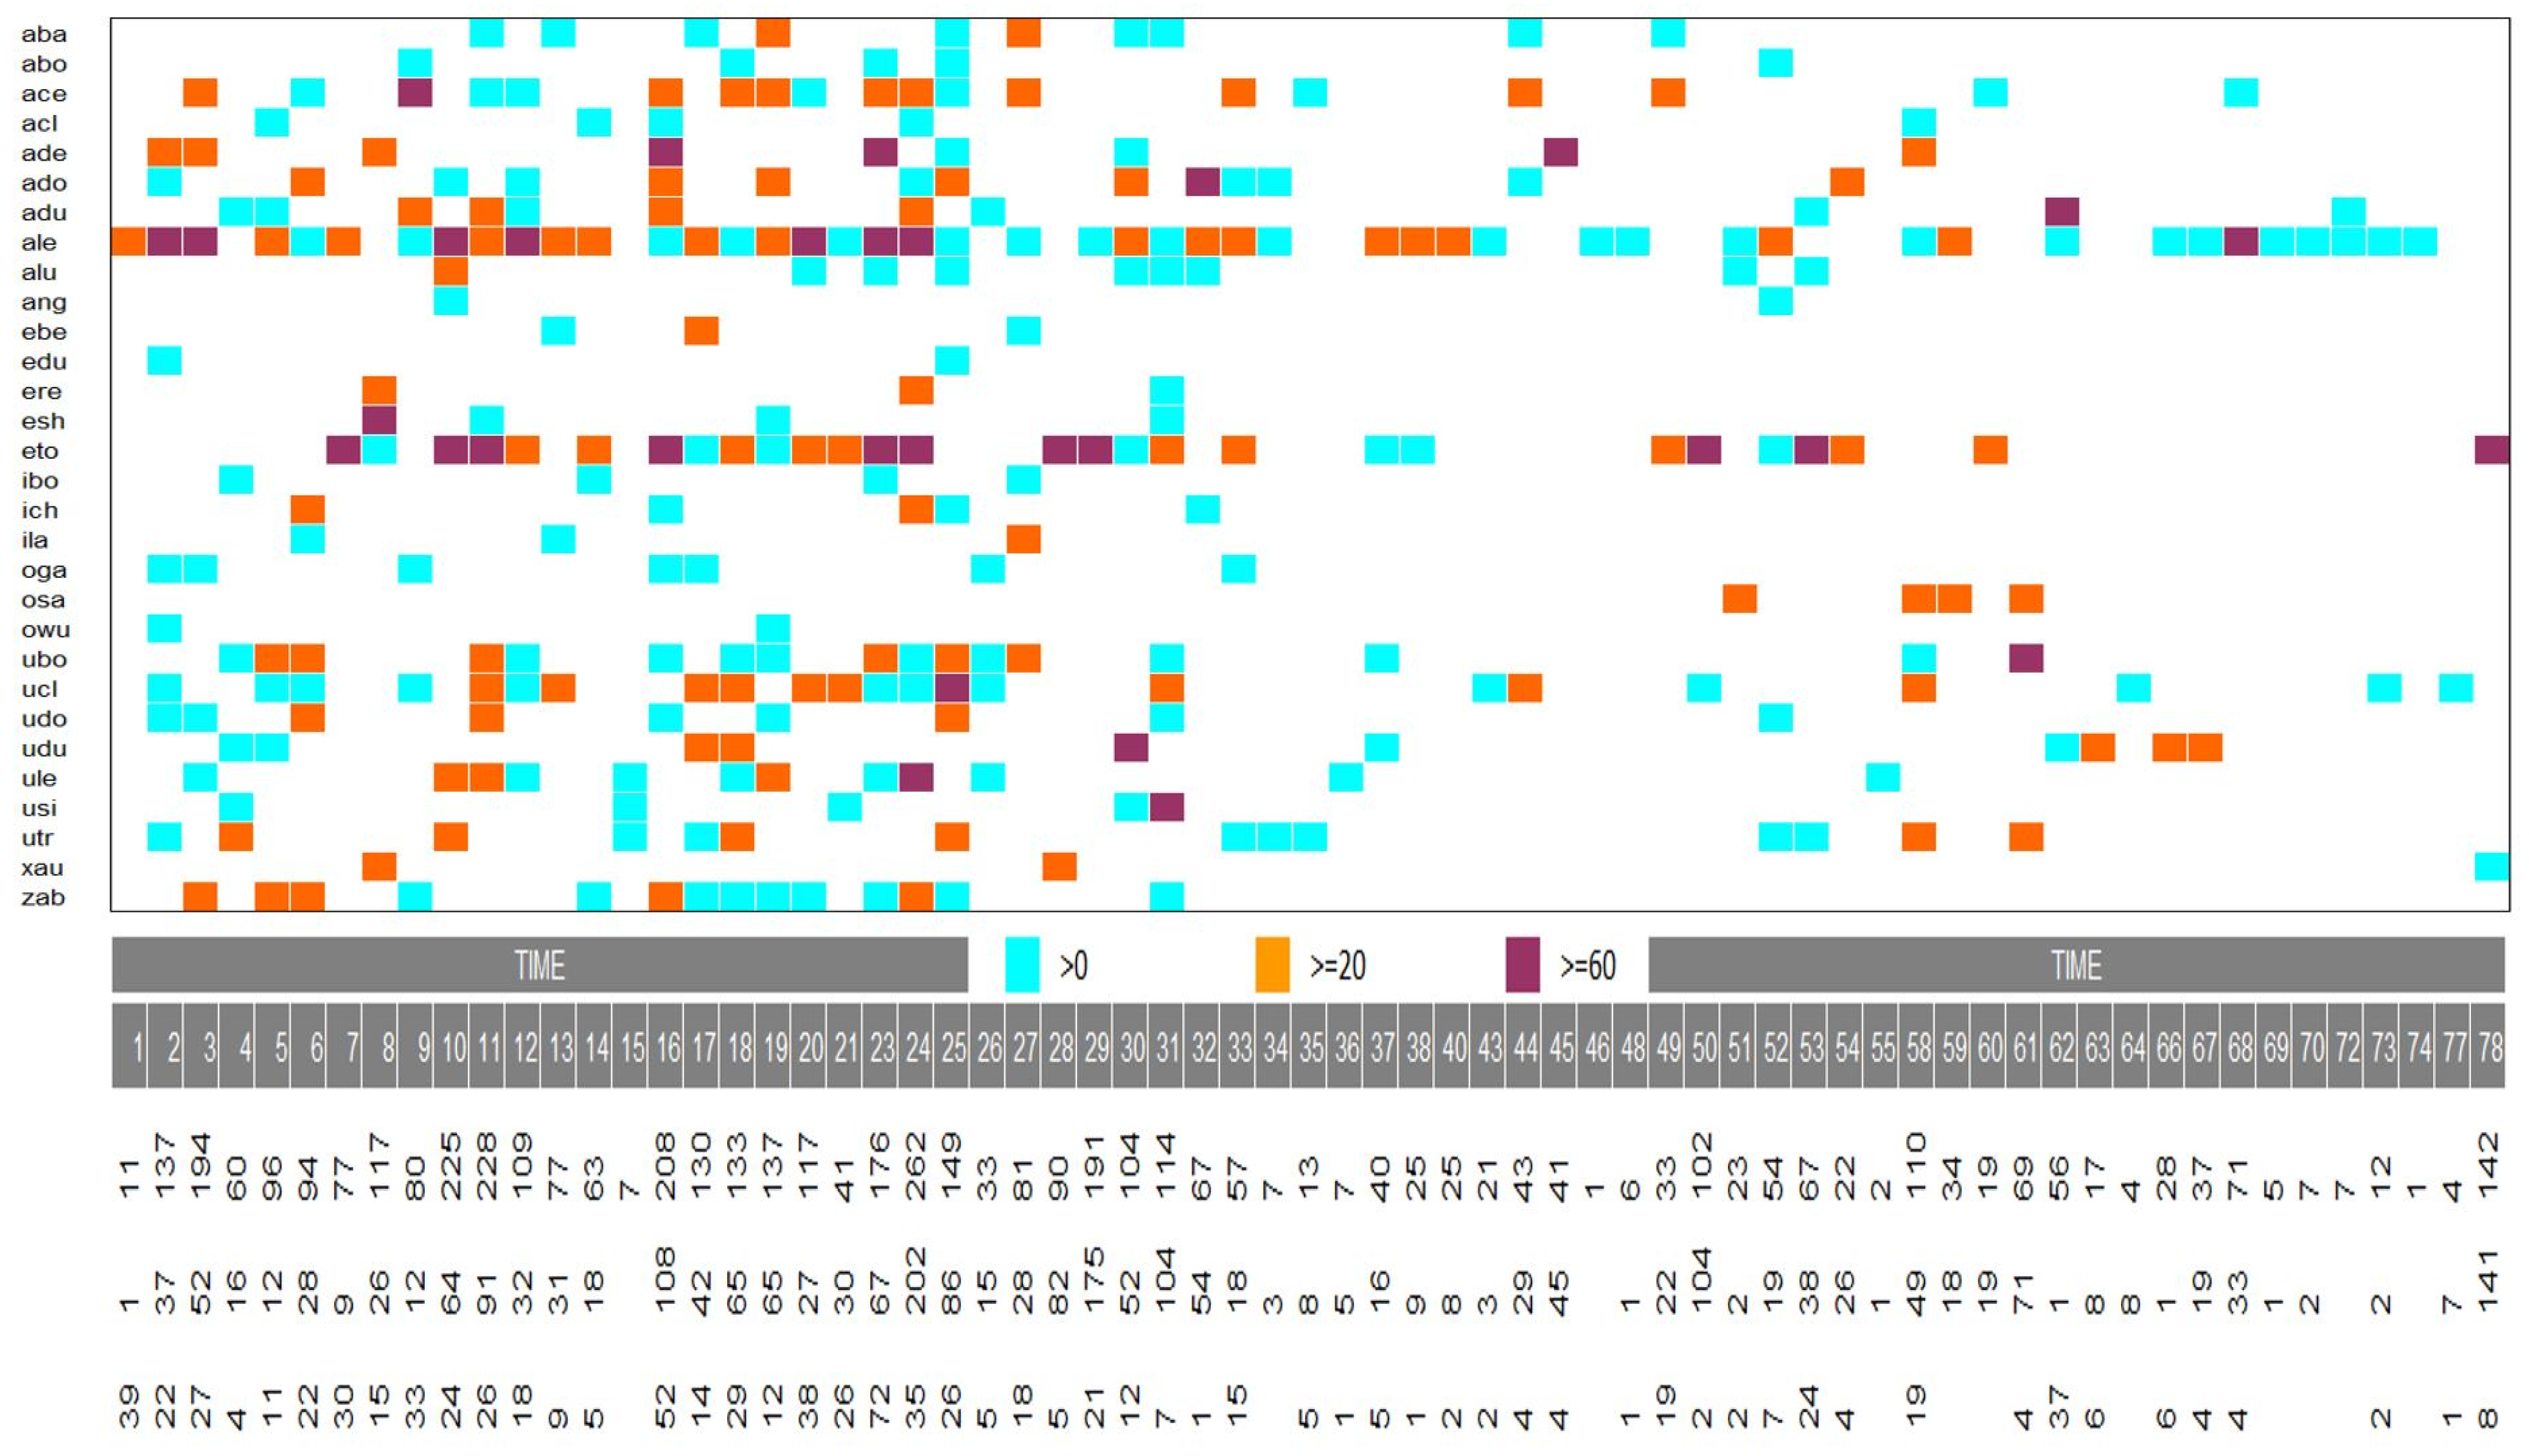
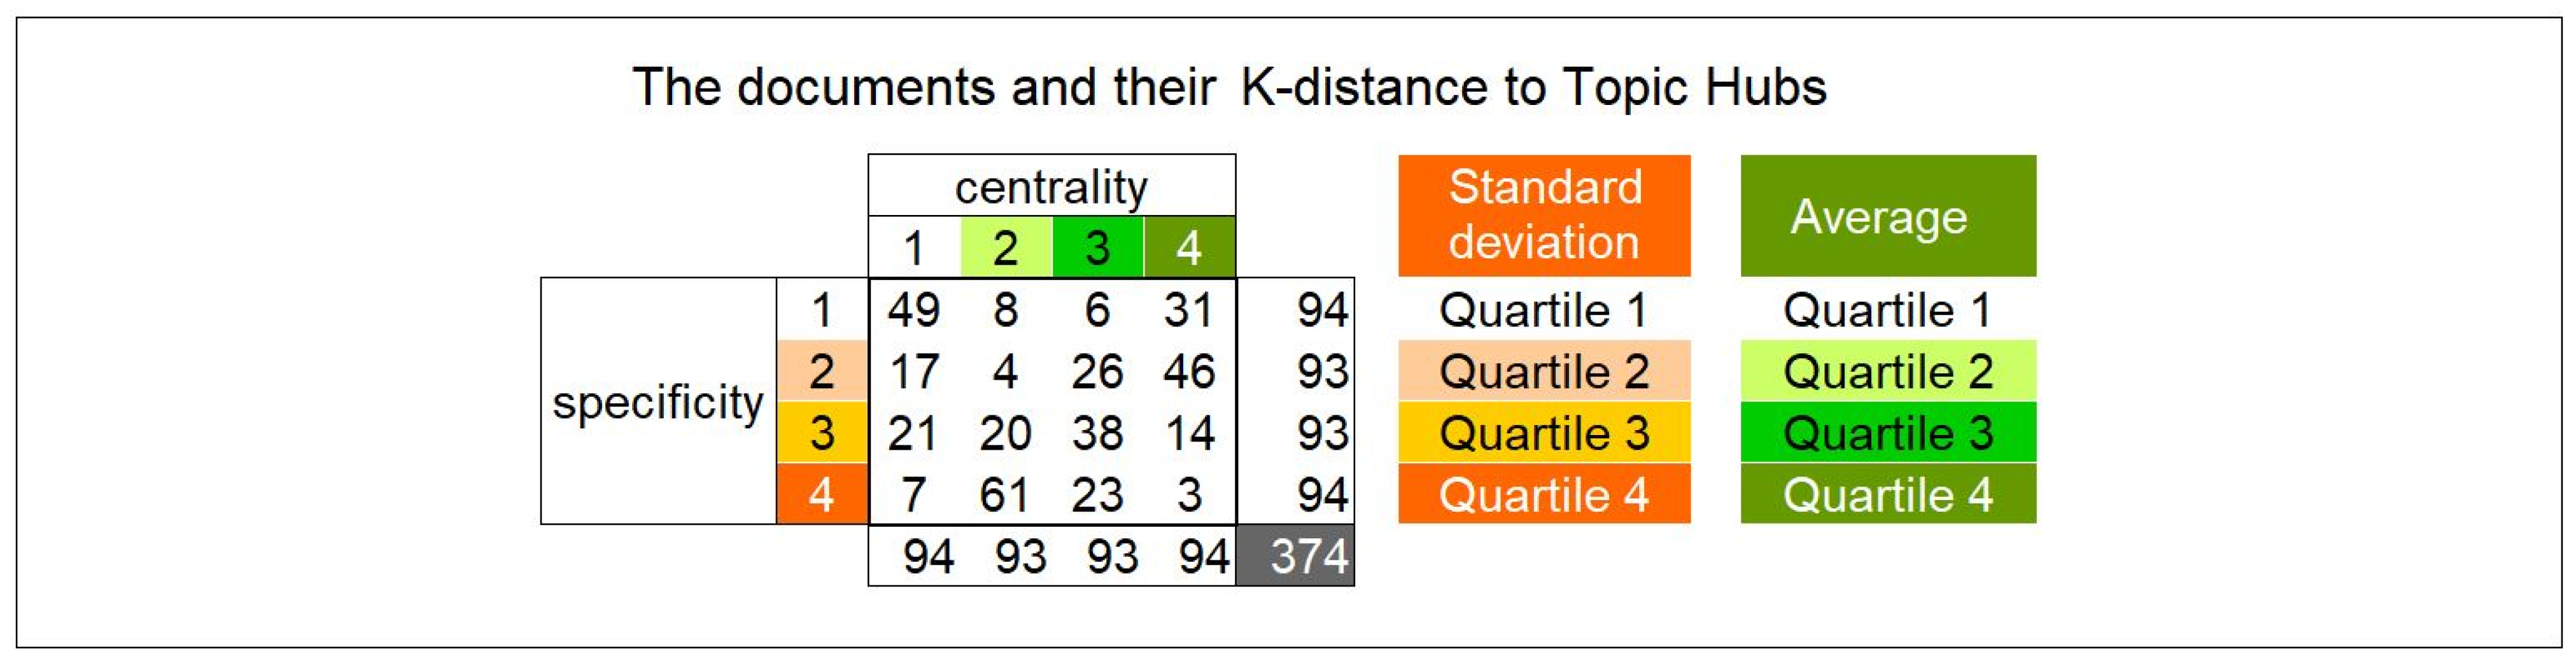
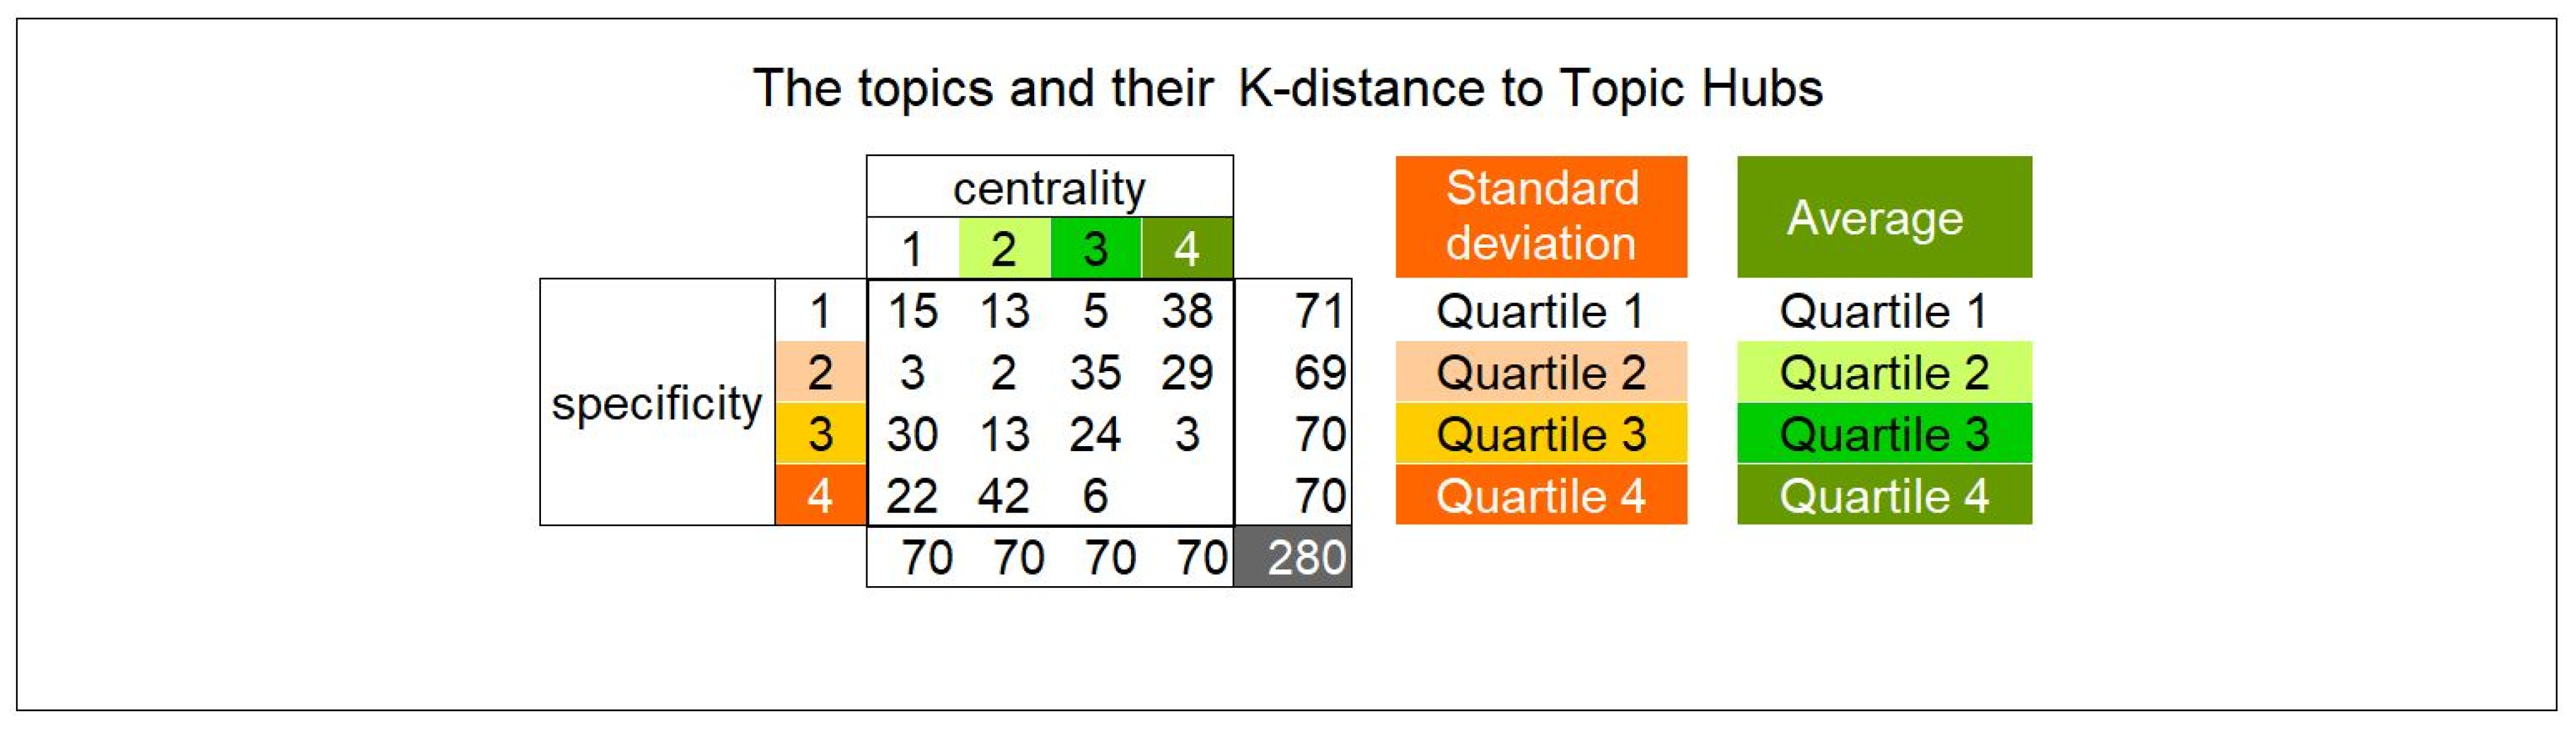
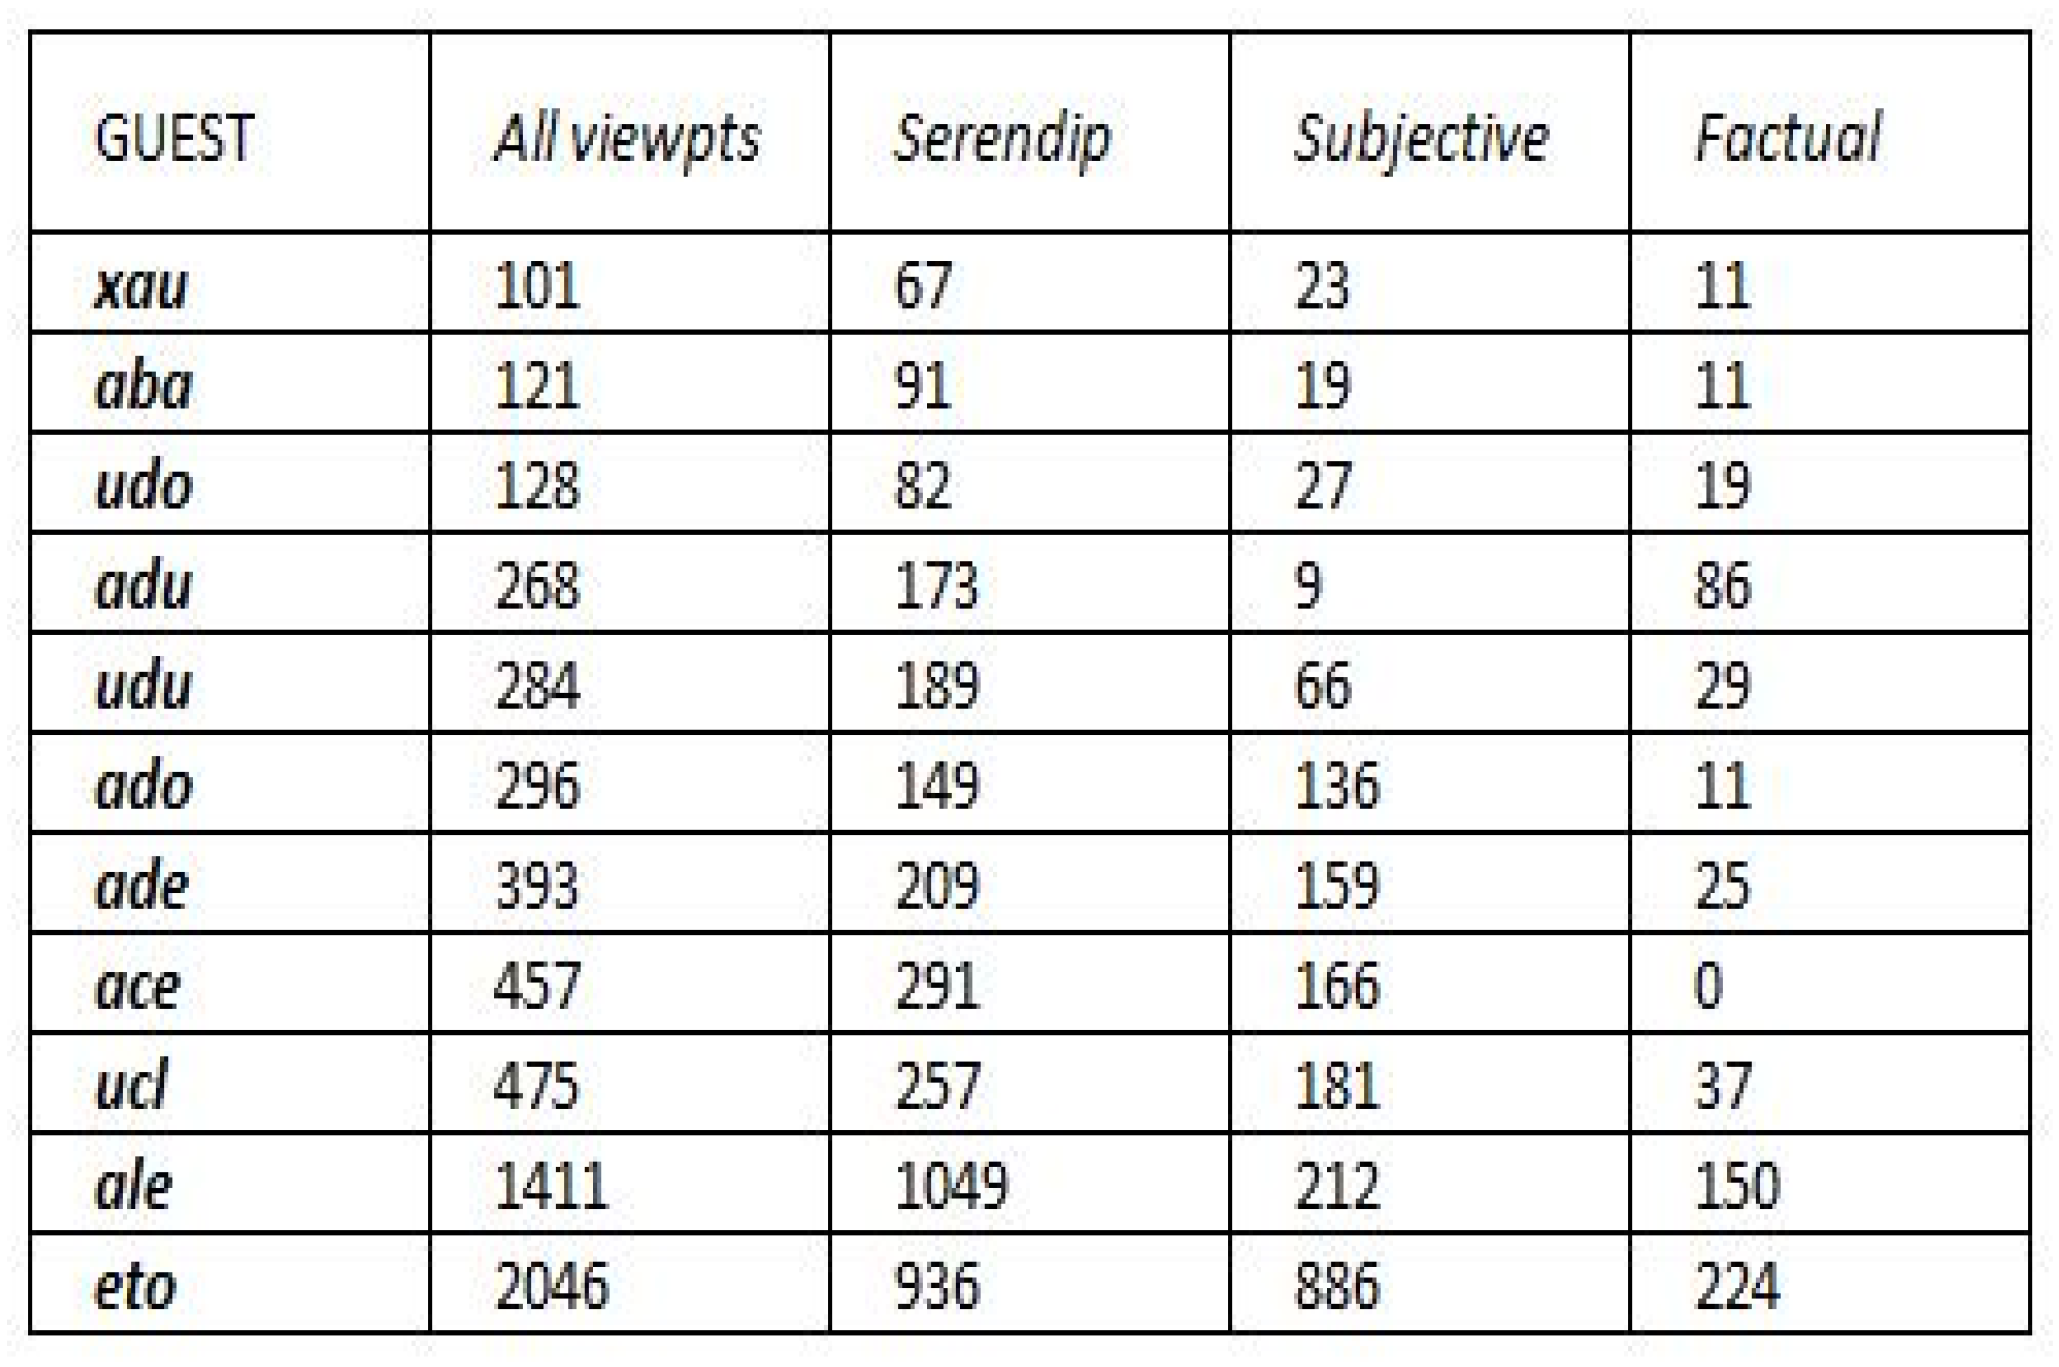
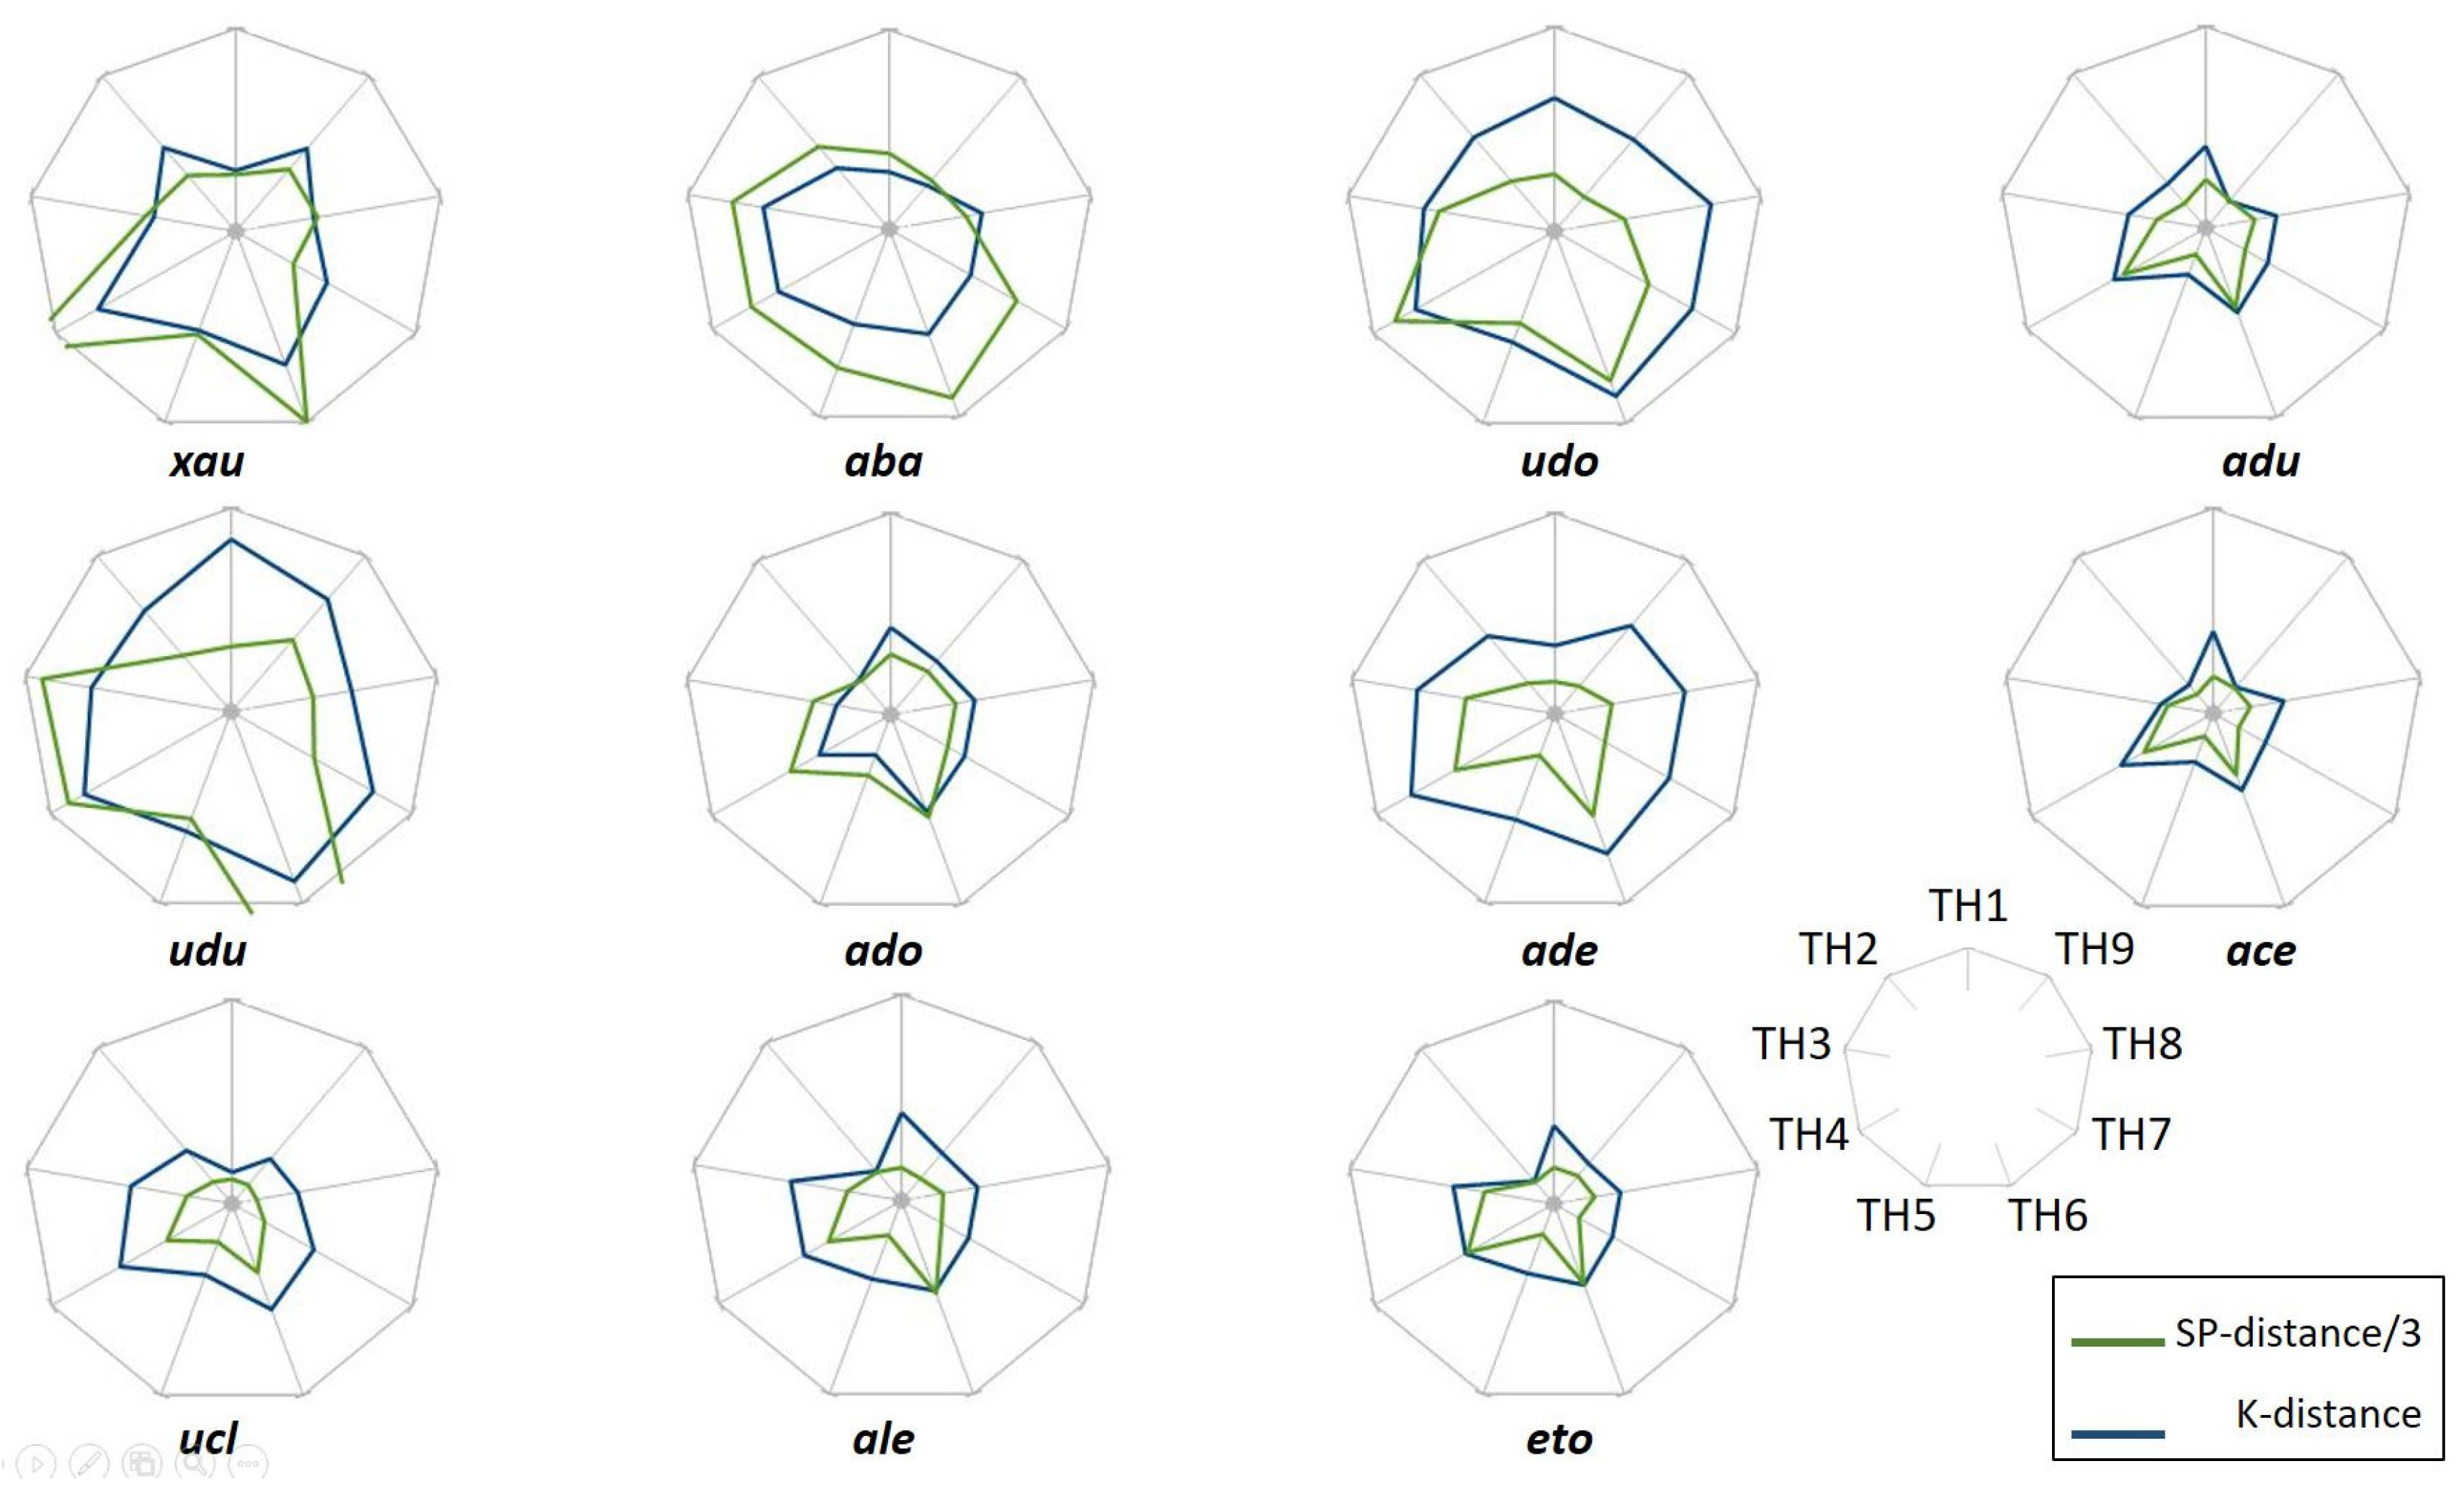
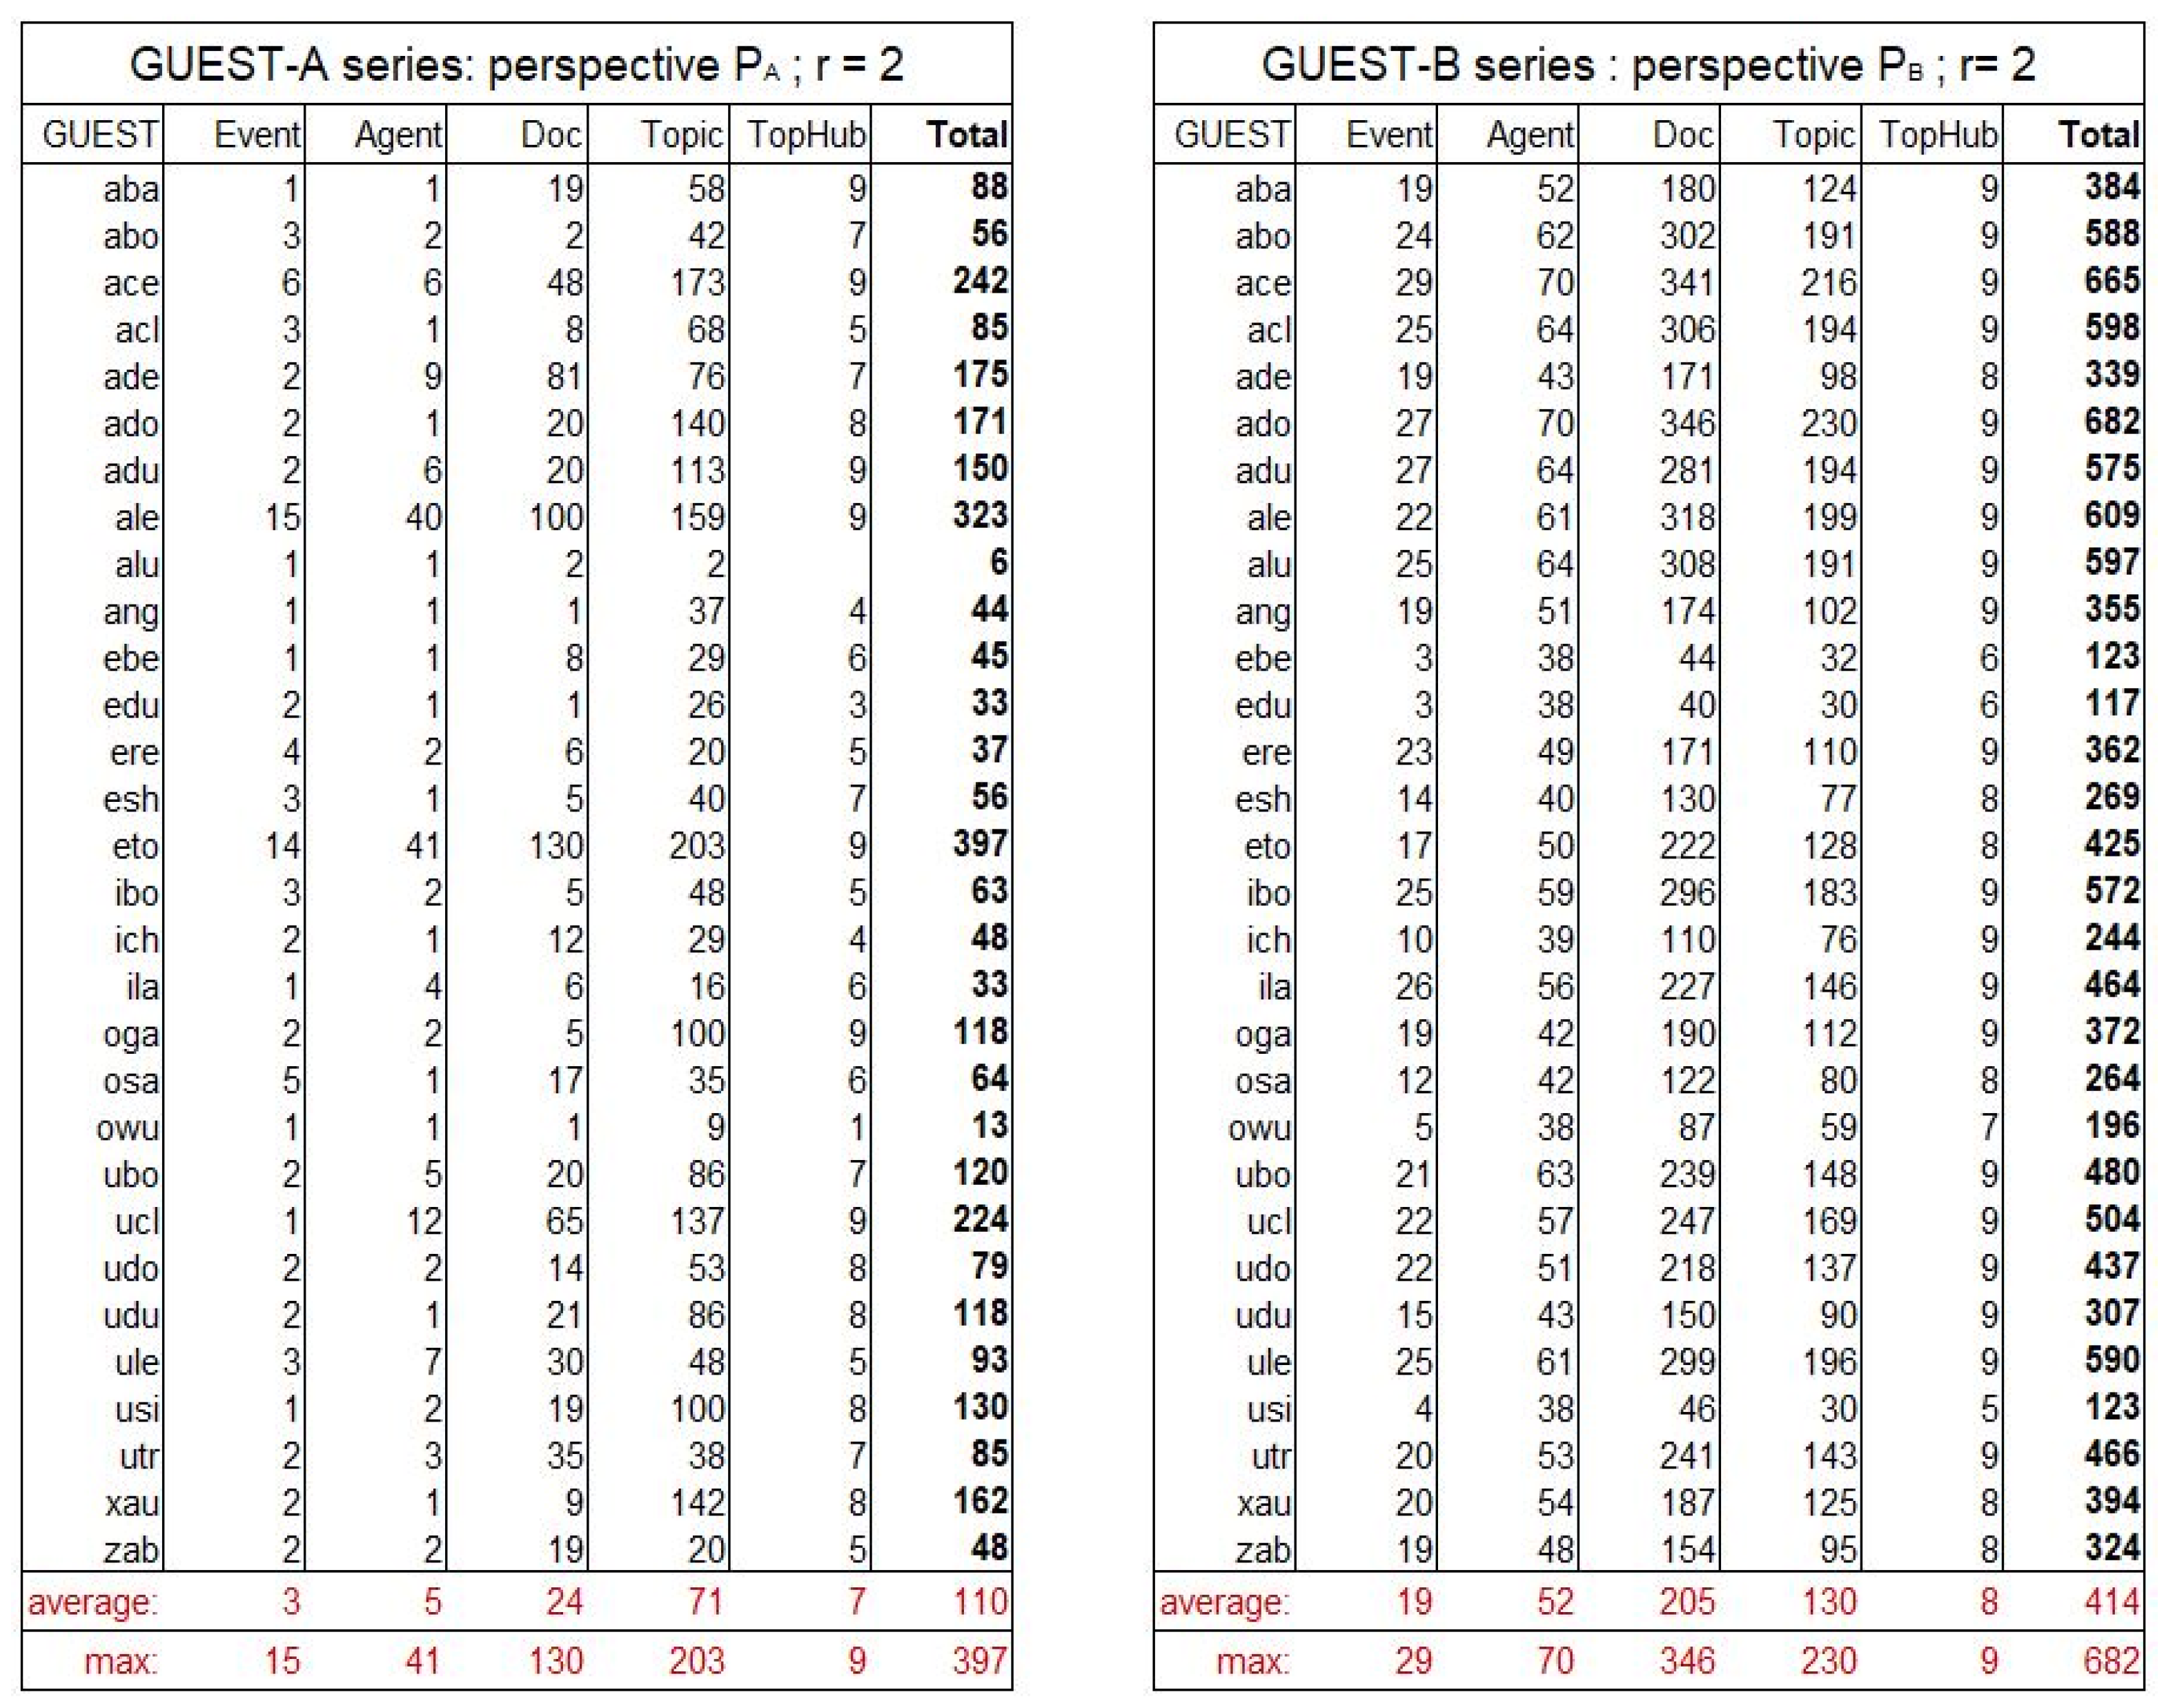
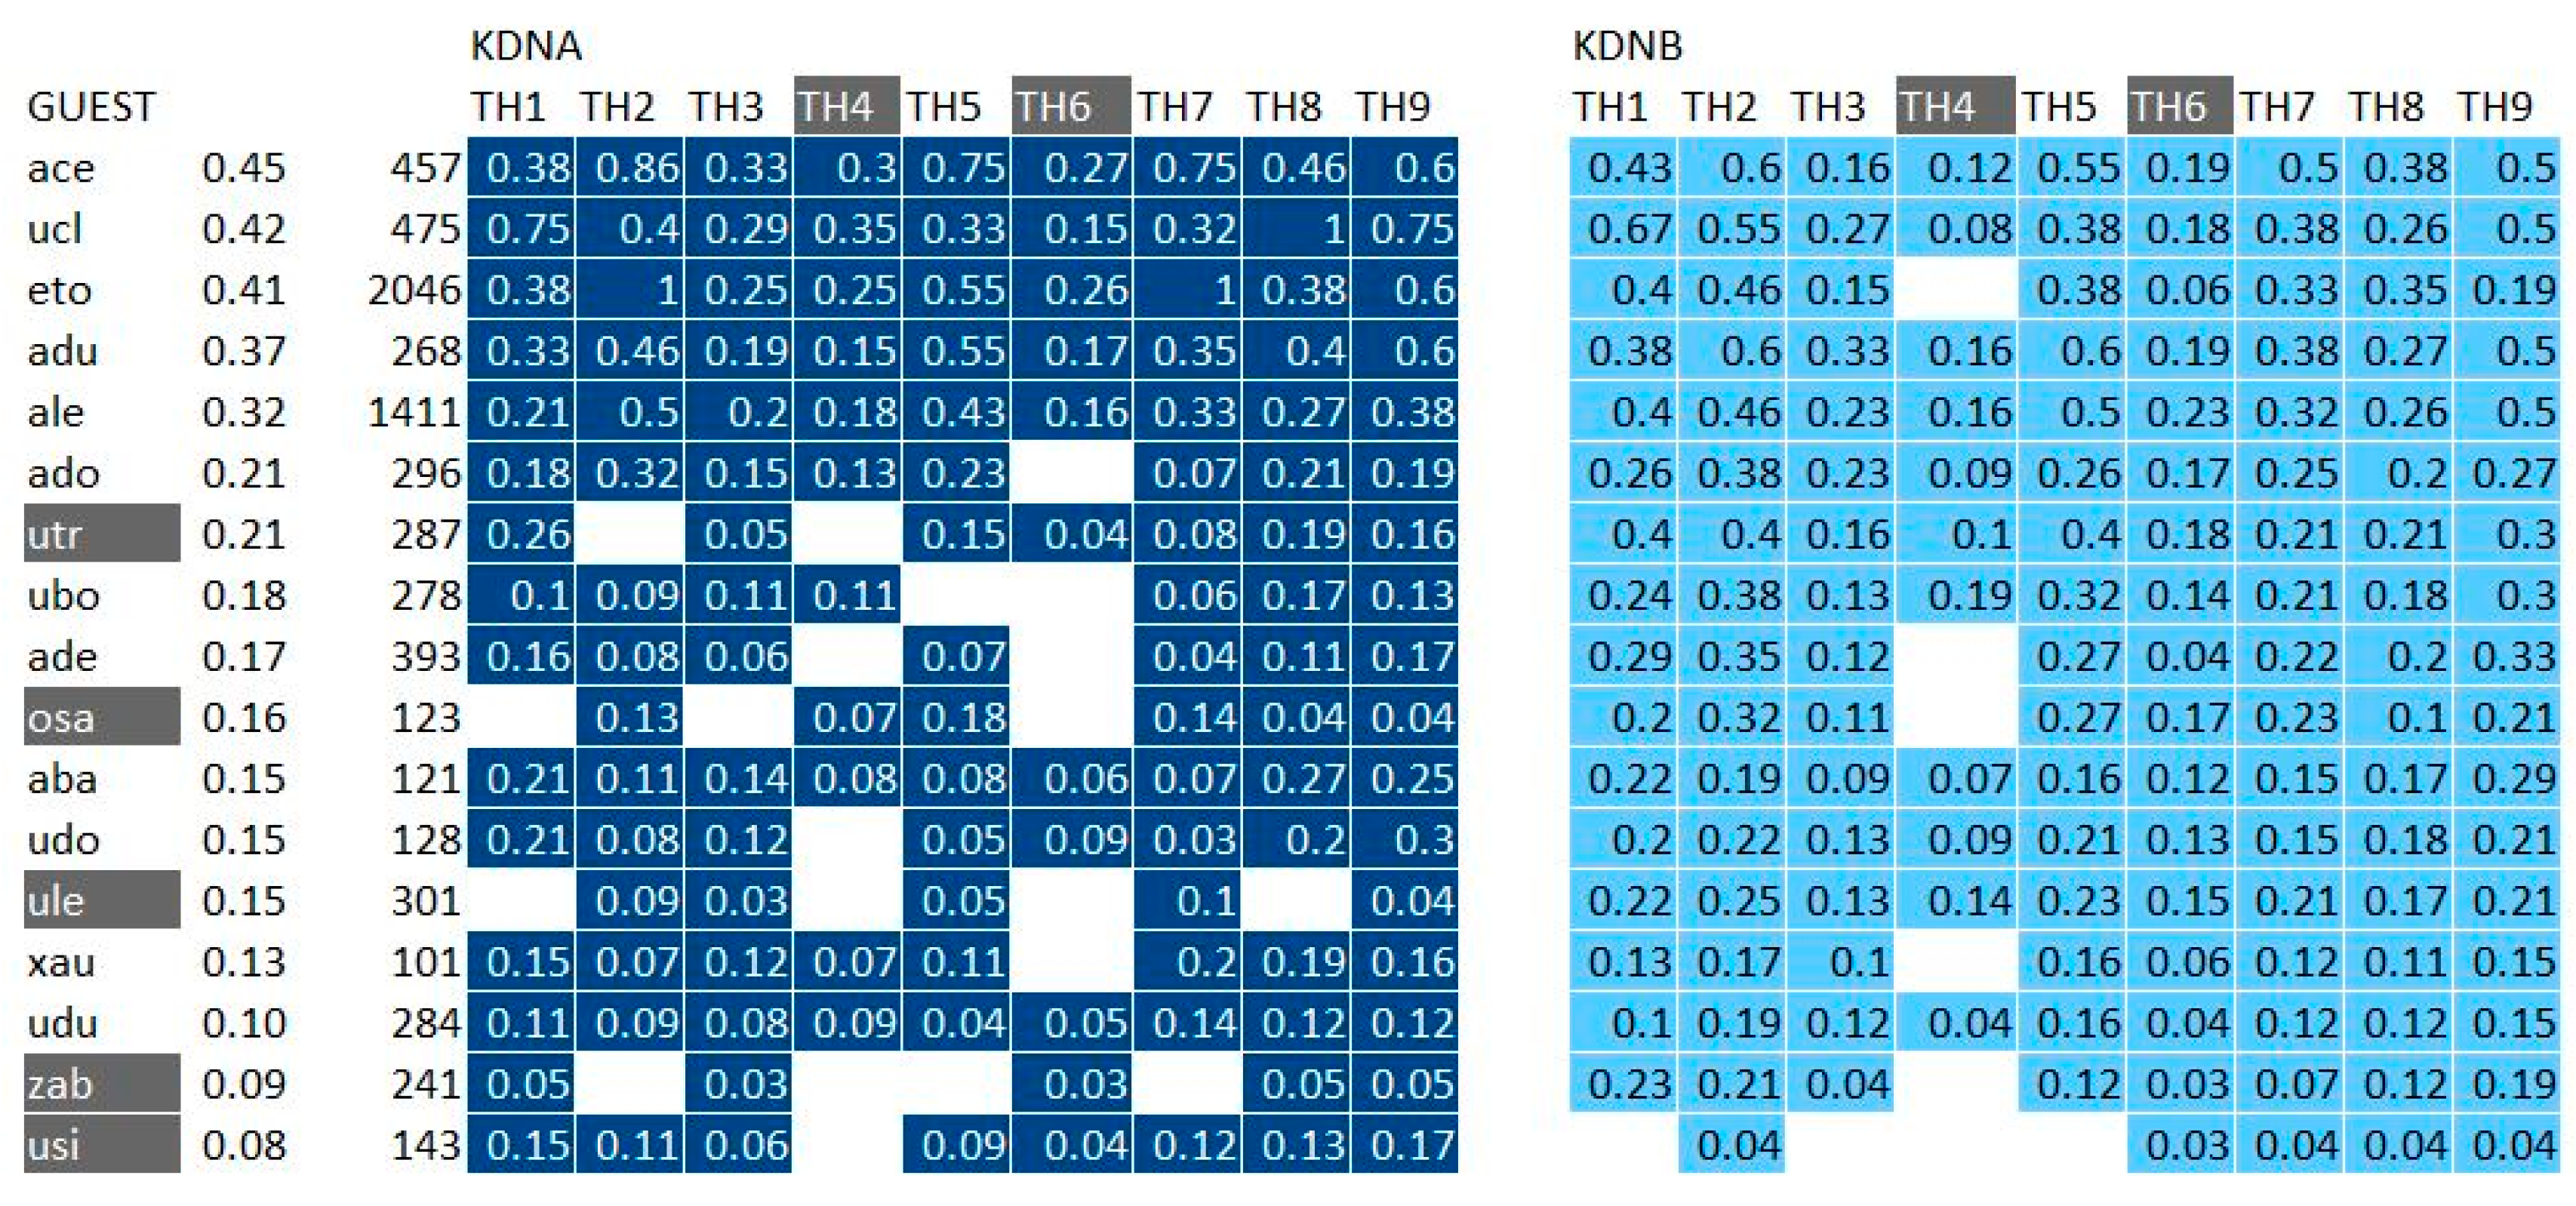
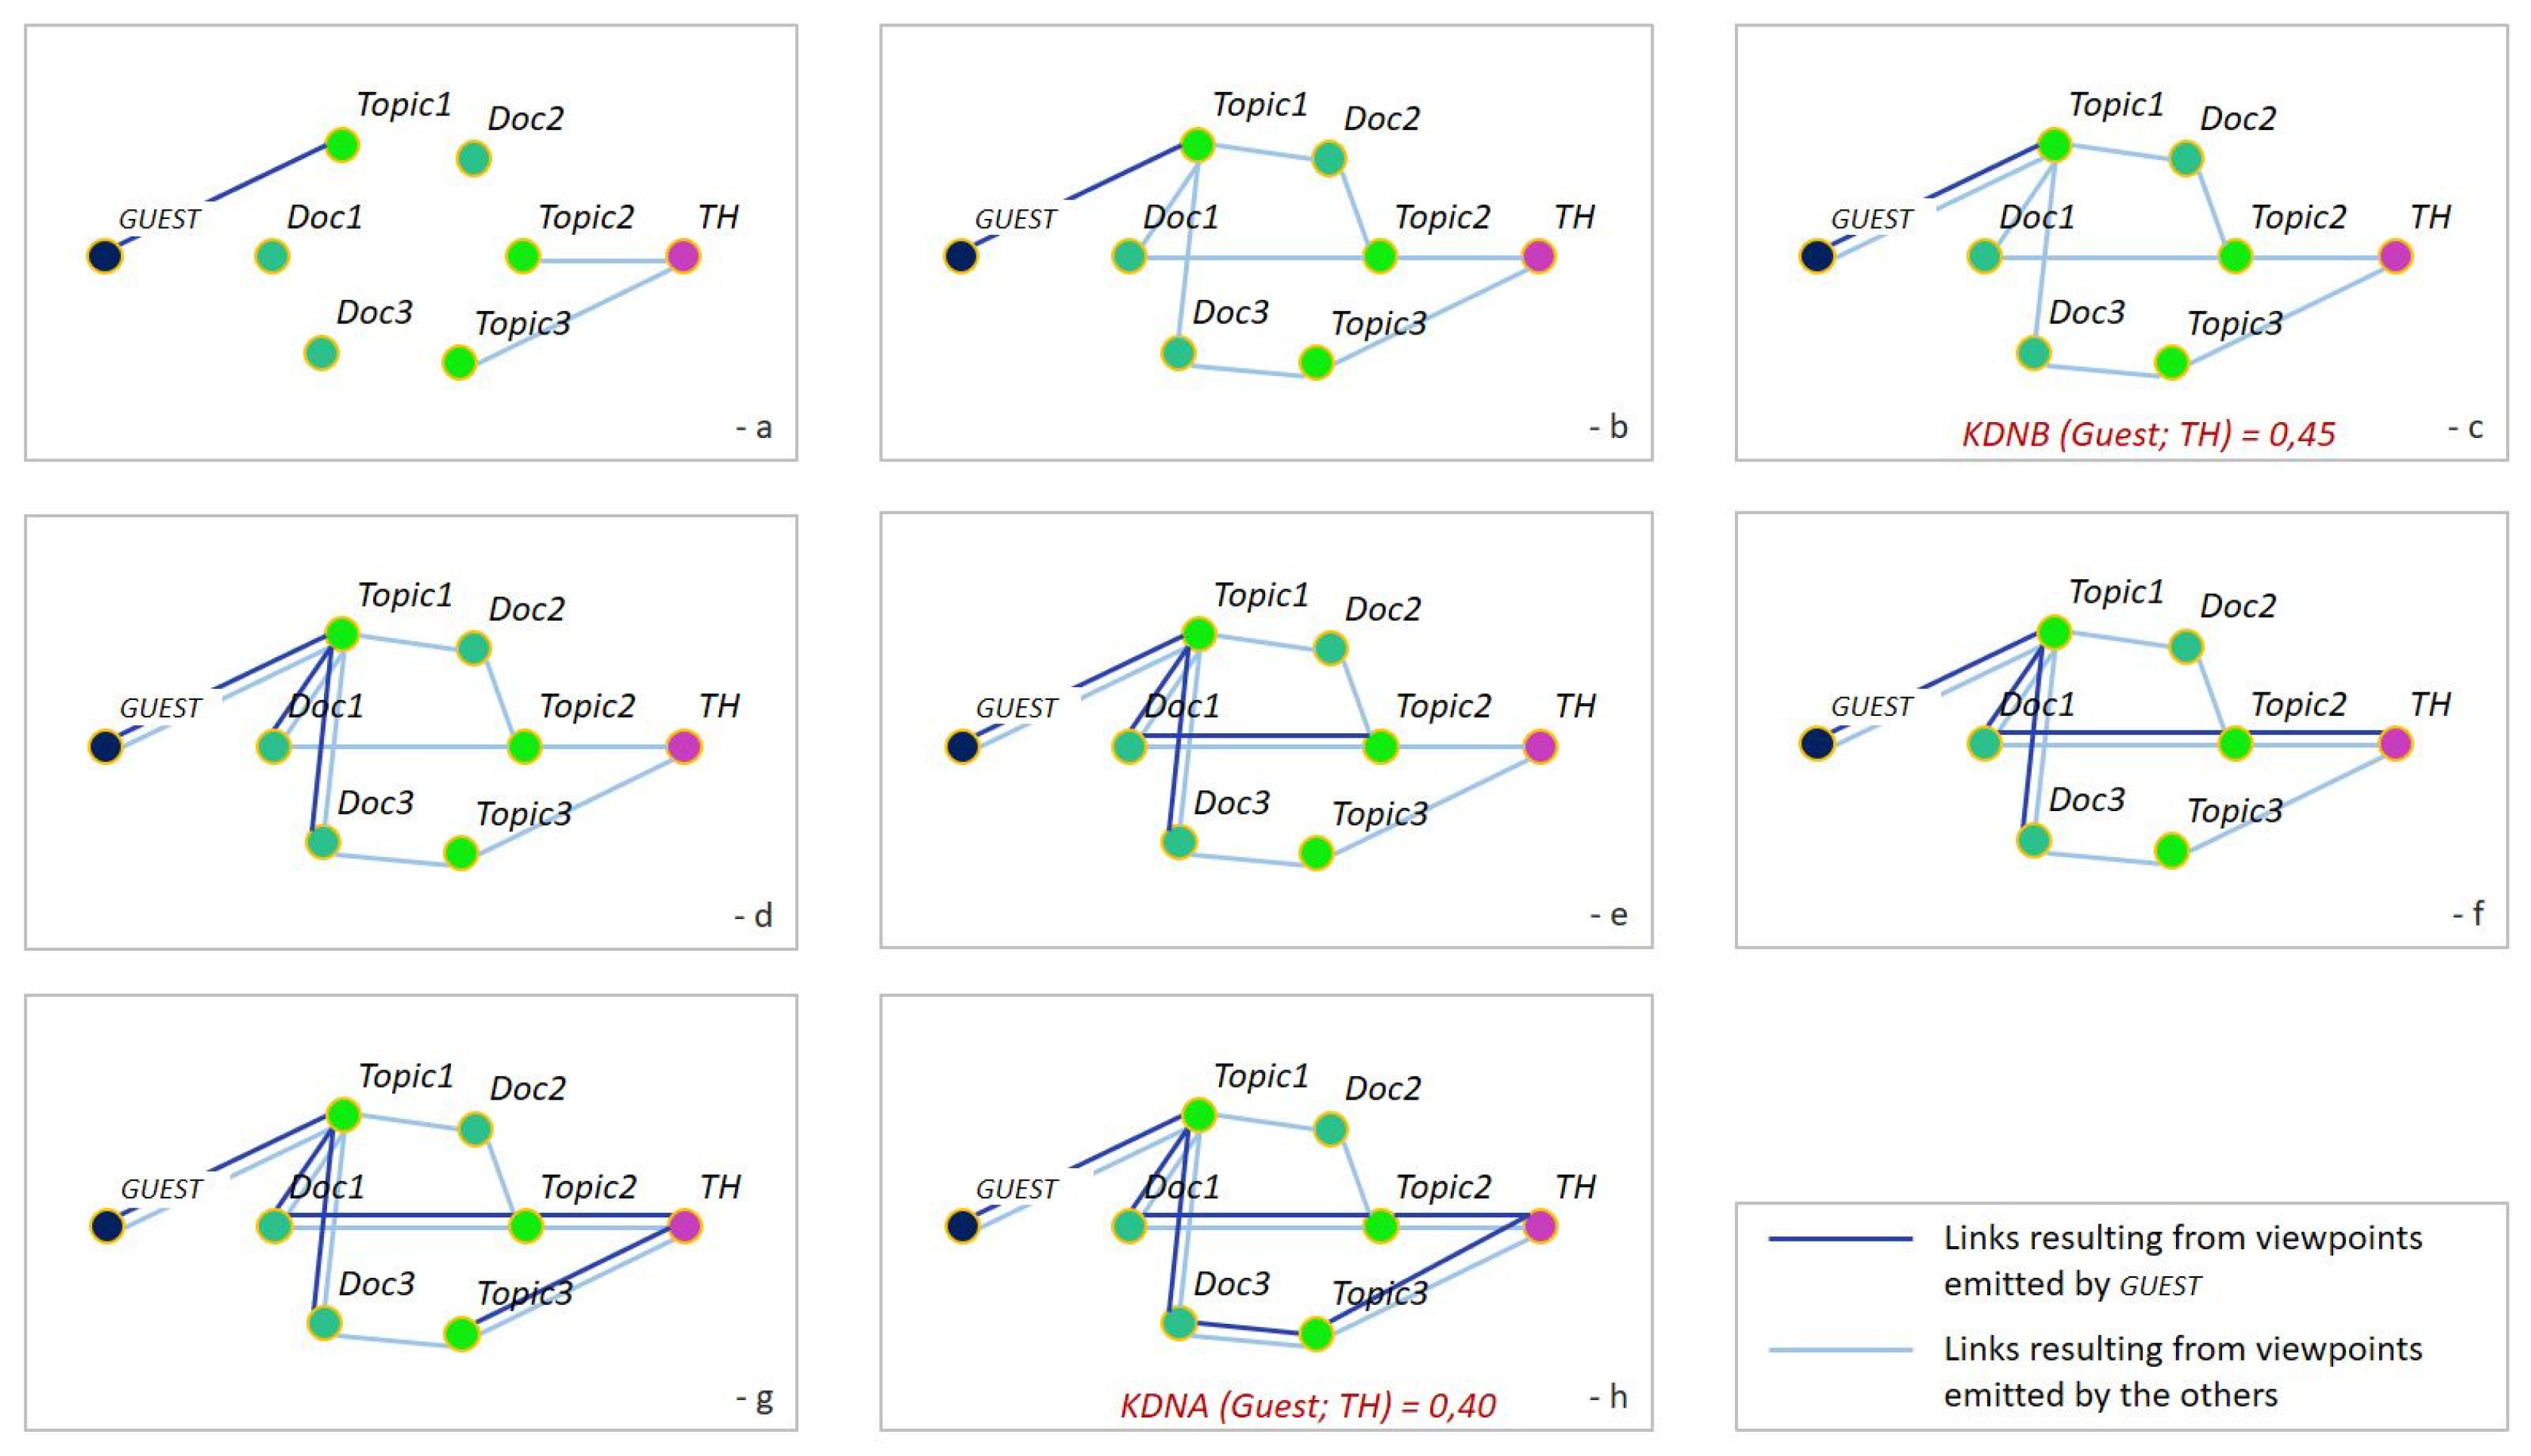
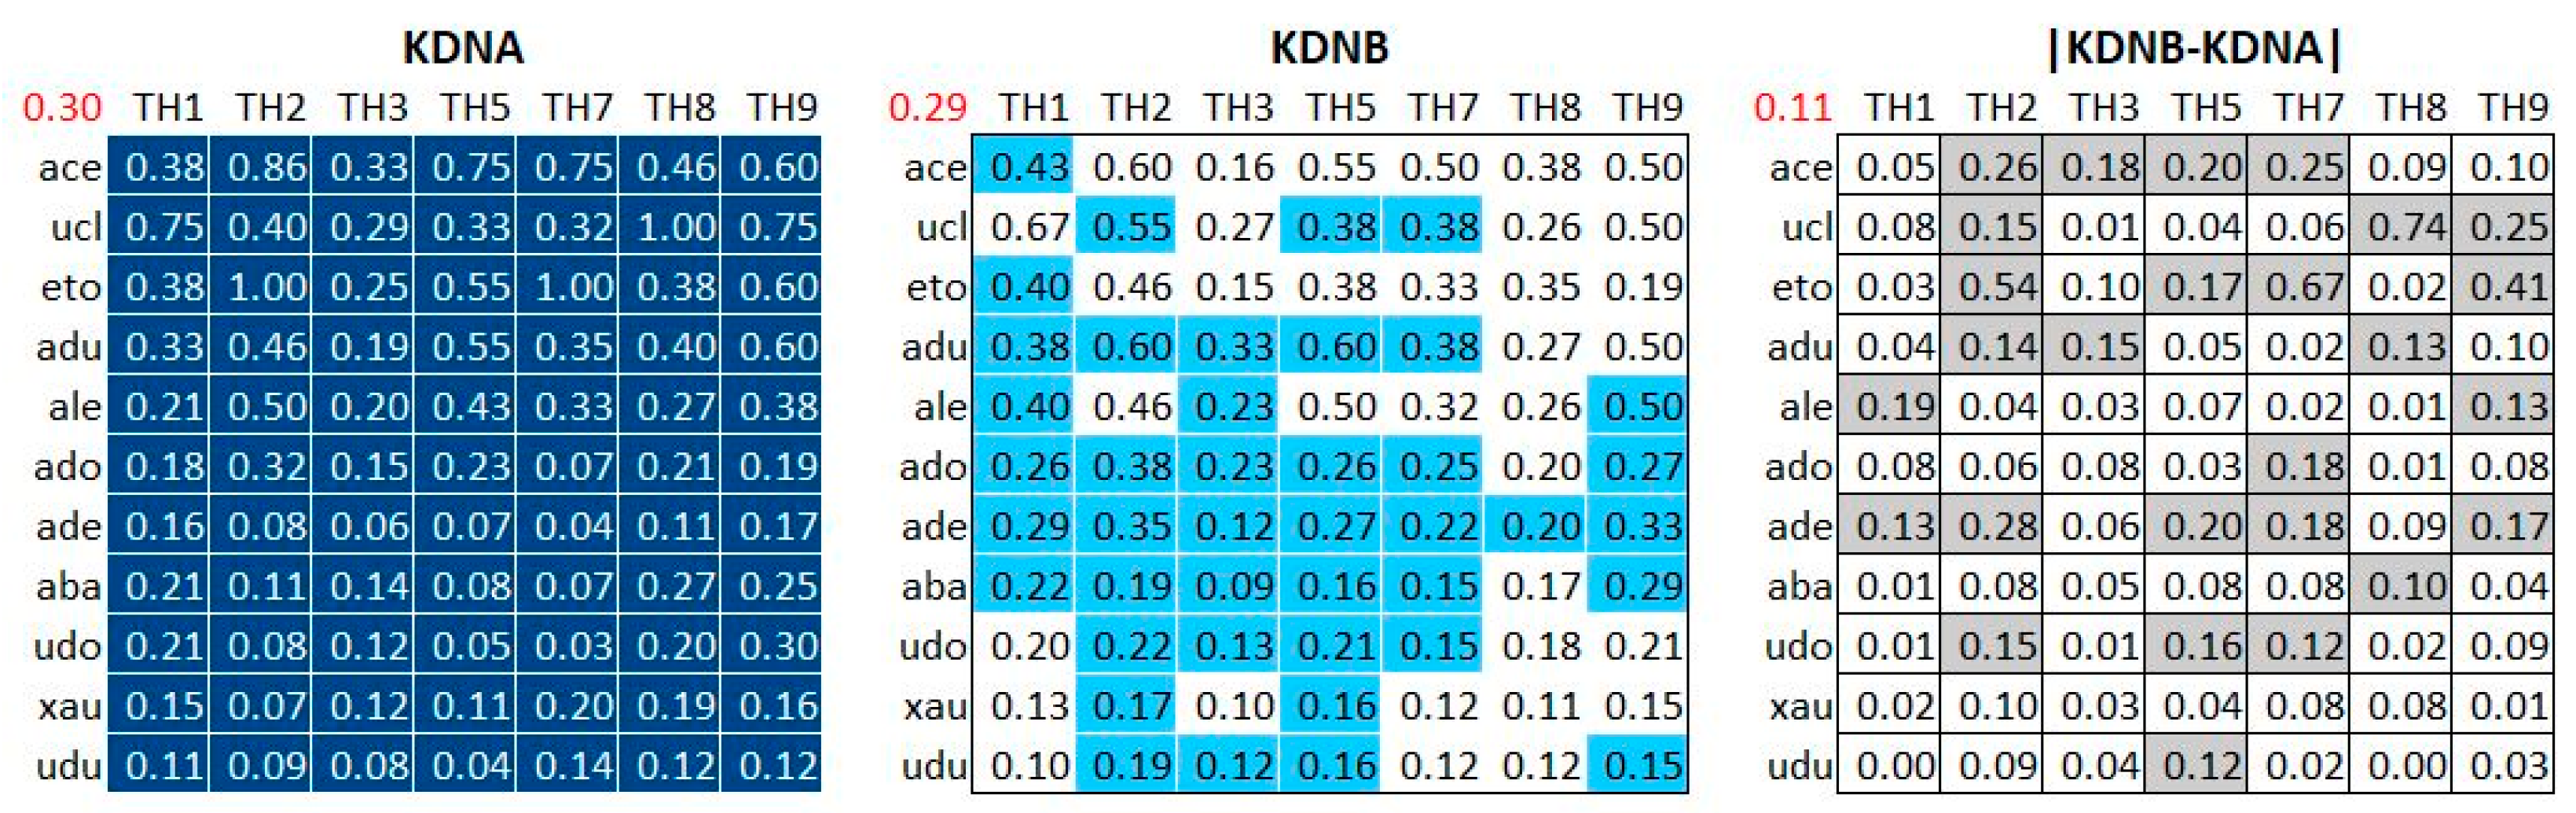
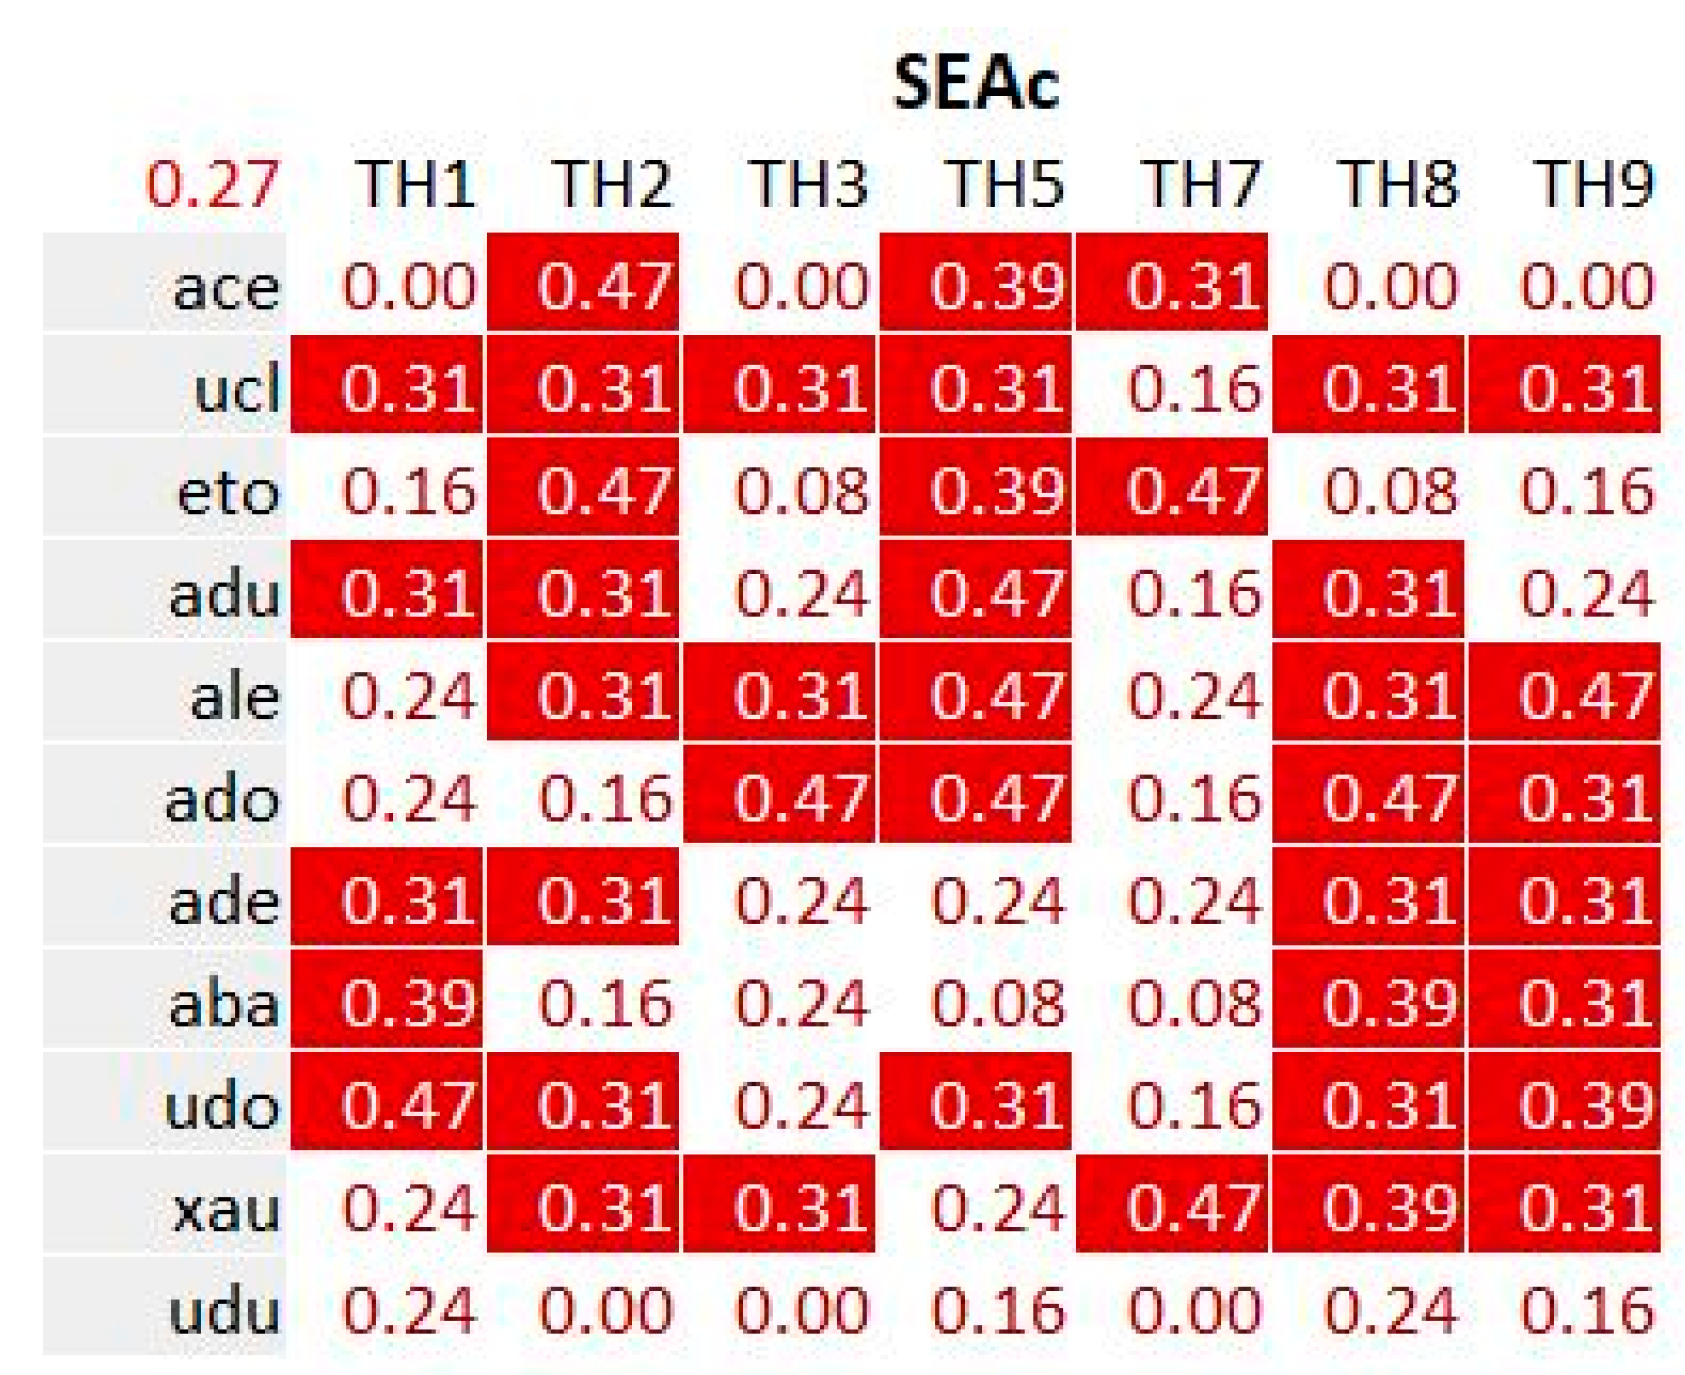
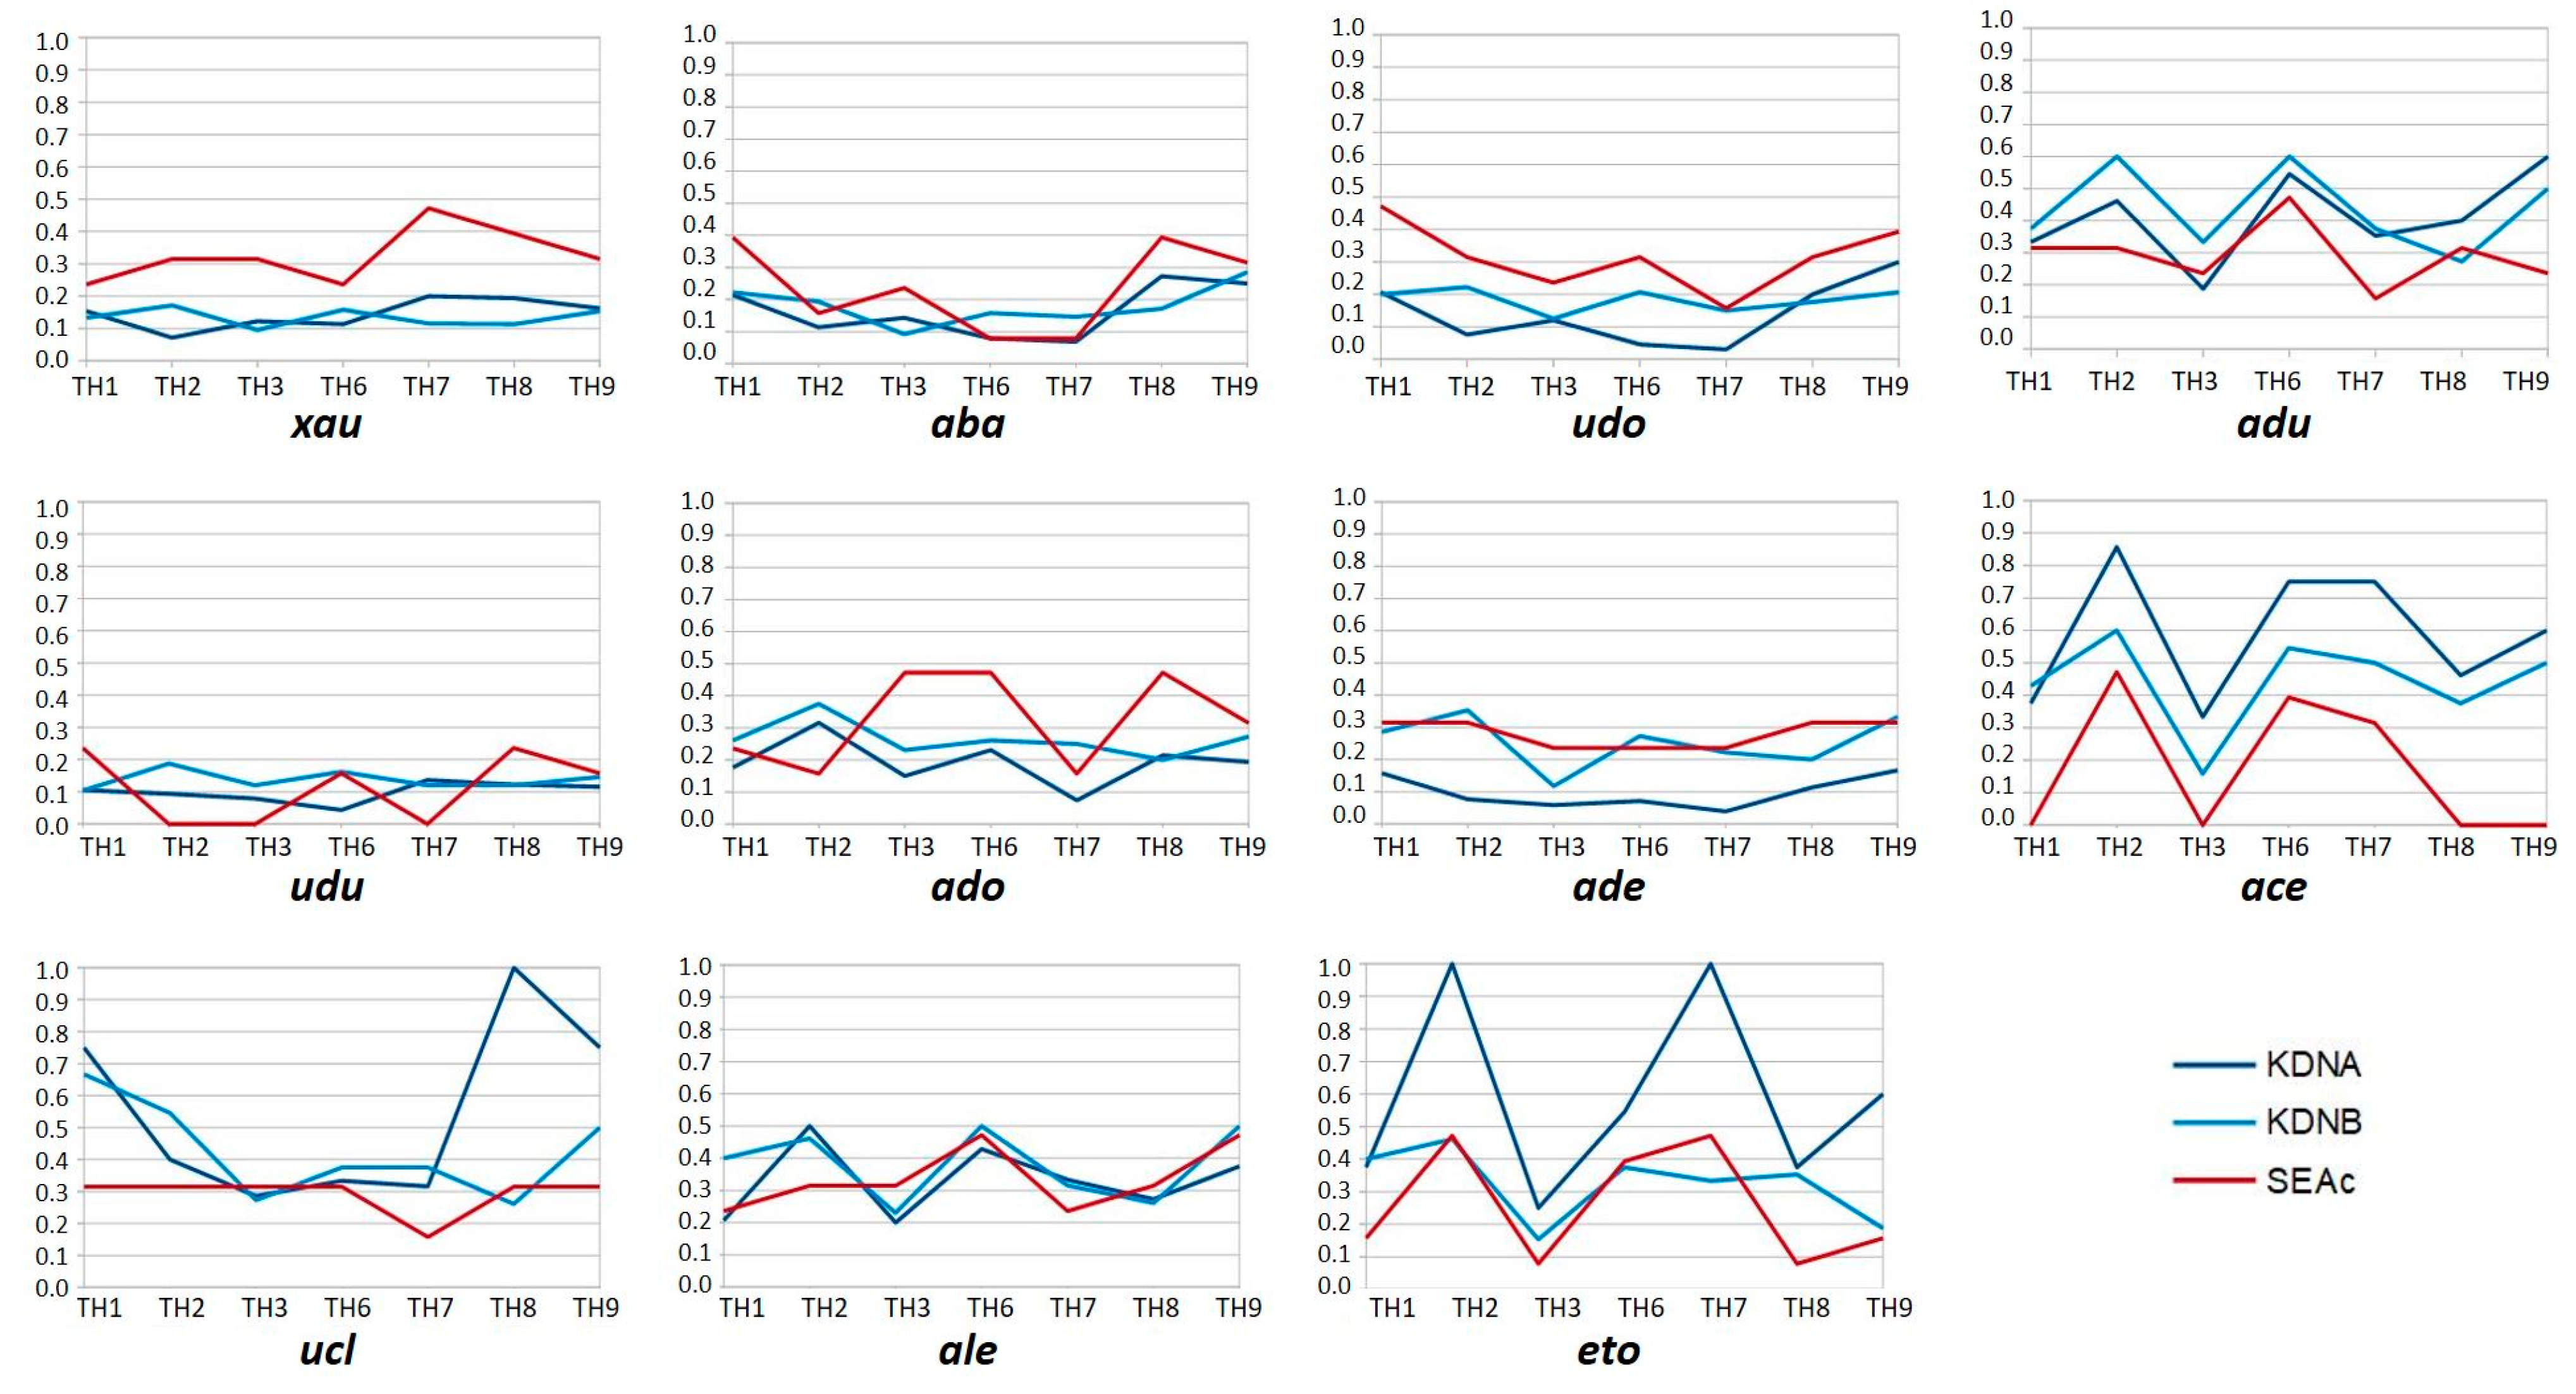
Table 1.
The 9 topic hubs for the Garden-party experiment.
| TH1 | Food, sports, sexuality, health, body life |
| TH2 | Learning |
| TH3 | Arts, cultures, views about the world |
| TH4 | Scientific knowledge and media coverage |
| TH5 | Data, information, collective intelligence, action |
| TH6 | Emotions, feelings and opinions, values, conscience |
| TH7 | Governance, intervention approaches, public action |
| TH8 | The humans on the planet, yesterday, today, and tomorrow |
| TH9 | Philosophy, religions, wisdoms, daily life |
Table 2.
The series of Garden-party knowledge maps.
| The series of complete maps | The th-x series of maps exploit the trails of the 30 guests. Each th-x map results from a request exploring the neighborhood of one topic hub, with radius = 1.5, under the perspective PX [all sliders = 1; all viewpoints]. |
| The series of stereoscopic maps | The guest-a series of maps exclusively exploit the targeted guests’ trails; they reflect the intensity of interaction by the guest with all the resources present in his/her neighborhood. Each guest-a map results from a request exploring the neighborhood of one guest, with radius = 2, under the perspective guestPA [all sliders = 1; only the viewpoints emitted by the guest]. The guest-b series of maps exclude the targeted guests’ trails and exploit the other guests’ trails; they reflect the intensity of interaction by the others with the resources present in the guests’ neighborhood. Each guest-b request map results from a request exploring the neighborhood of one guest, with radius = 2, under the perspective guestPB [all sliders = 1; all viewpoints except the viewpoints emitted by the guest]. |
Table 3.
The indicators.
| SEAa | Based on the self-evaluated proximities between each guest and each topic hub; computes the difference of self-evaluated proximities between the beginning and end of the experiment. Uses a linear scale [no = 0|rather no = 3|rather yes = 6|yes = 9] Normalized by the maximum absolute value of all self-evaluations. |
| SEAc | Based on the self-evaluated proximities between each guest and each topic hub; computes the average self-evaluated proximity between the beginning and end of the experiment. Uses a linear scale [no = 0|rather no = 3|rather yes = 6|yes = 9] Normalized by the maximum absolute value of all self-evaluations. |
| KDNA | Computes the k-proximity (inverse of the k-distance) between resources when using the perspective PA (the guests’ trails). Normalized by the maximum value obtained when computing KDNA and KDNB. |
| KDNB | Computes the k-proximity (inverse of the k-distance) between resources when using the perspective PB (the other guests’ trails). Normalized by the maximum value obtained when computing KDNA and KDNB. |
Publisher’s Note: MDPI stays neutral with regard to jurisdictional claims in published maps and institutional affiliations. |
© 2021 by the authors. Licensee MDPI, Basel, Switzerland. This article is an open access article distributed under the terms and conditions of the Creative Commons Attribution (CC BY) license (https://creativecommons.org/licenses/by/4.0/).
Share and Cite
MDPI and ACS Style
Lemoisson, P.; Cerri, S.A.; Douzal, V.; Dugénie, P.; Tonneau, J.-P. Collective and Informal Learning in the ViewpointS Interactive Medium. Information 2021, 12, 183. https://0-doi-org.brum.beds.ac.uk/10.3390/info12050183
AMA Style
Lemoisson P, Cerri SA, Douzal V, Dugénie P, Tonneau J-P. Collective and Informal Learning in the ViewpointS Interactive Medium. Information. 2021; 12(5):183. https://0-doi-org.brum.beds.ac.uk/10.3390/info12050183
Chicago/Turabian StyleLemoisson, Philippe, Stefano A. Cerri, Vincent Douzal, Pascal Dugénie, and Jean-Philippe Tonneau. 2021. "Collective and Informal Learning in the ViewpointS Interactive Medium" Information 12, no. 5: 183. https://0-doi-org.brum.beds.ac.uk/10.3390/info12050183
Note that from the first issue of 2016, this journal uses article numbers instead of page numbers. See further details here.