
Edge-Based Missing Data Imputation in Large-Scale Environments


1
Institut de Recherche en Informatique de Toulouse, Université de Toulouse III—Paul Sabatier, 31062 Toulouse, France
2
Dipartimento di Matematica e Informatica, Università degli Studi di Palermo, 90123 Palermo, Italy
*
Author to whom correspondence should be addressed.
Information 2021, 12(5), 195; https://0-doi-org.brum.beds.ac.uk/10.3390/info12050195
Submission received: 11 April 2021
/
Revised: 27 April 2021
/
Accepted: 28 April 2021
/
Published: 29 April 2021
(This article belongs to the Special Issue Smart IoT Systems)
Abstract
:Smart cities leverage large amounts of data acquired in the urban environment in the context of decision support tools. These tools enable monitoring the environment to improve the quality of services offered to citizens. The increasing diffusion of personal Internet of things devices capable of sensing the physical environment allows for low-cost solutions to acquire a large amount of information within the urban environment. On the one hand, the use of mobile and intermittent sensors implies new scenarios of large-scale data analysis; on the other hand, it involves different challenges such as intermittent sensors and integrity of acquired data. To this effect, edge computing emerges as a methodology to distribute computation among different IoT devices to analyze data locally. We present here a new methodology for imputing environmental information during the acquisition step, due to missing or otherwise out of order sensors, by distributing the computation among a variety of fixed and mobile devices. Numerous experiments have been carried out on real data to confirm the validity of the proposed method.
1. Introduction
The spreading of the Internet of things (IoT) enabled cities to become urban data sensing platforms where a huge quantity of devices, connected to the Internet, are capable of providing various information about the environment [1]. Data collected from IoT devices can be used for different purposes. A non-exhaustive list includes: improving road infrastructure and urban traffic, understanding energy consumption patterns, and studying social and community dynamics [2]. Data analysis is also important in the context of decision support systems, where the information is used not only to provide optimized services to citizens but also to predict their behavior and to act opportunely to ensure both security and a better quality of life. The increasing quantity of data produced by sensing devices leads to challenges regarding large-scale data analysis, privacy issues, autonomous learning and integration of noisy and heterogeneous info [3].
Edge computing is an emerging paradigm that pushes cloud services from the network core to the network edges in closer proximity to IoT devices and data sources [4]. Physical proximity between the information sources is the most crucial characteristic emphasized by edge computing; this promises several benefits compared to the traditional cloud-based computing paradigm, including low latency, energy efficiency, privacy protection, reduced bandwidth consumption and context awareness [4]. Distributed computing among IoT devices allows edge computing to reduce traffic data and bottlenecks in network transmissions [5]. Edge computing overcomes the limits of traditional and cloud computing: Artificial Intelligence (AI) methods do not run anymore on the cloud, rather on the edge nodes that are computational entities, spatially close to the core computation nodes (e.g., providers) to respond more quickly and with less bandwidth requirement [6]. Edge Intelligence (EI) meets the need for providing AI techniques in edge computing and is used in a wide spectrum of AI applications, spanning from cognitive assistance to precision agriculture, smart home and industrial IoT [4].
Bringing AI to edge and core computational nodes, it is possible to leverage the potential of data, learn the evolutionary dynamics of the urban context and supply optimized services. In a large-scale context, learning can be done by AI techniques to extract knowledge from data acquired over time in local parts of the physical environment. Using a global AI approach would lead to inaccurate results: an AI evaluation in a local part of the environment can be considered correct or incorrect depending on the data acquired from different parts of the physical environment. Therefore, in this context edge computing is a pertinent way for distributing AI mechanisms at large-scale.
Mobility is a key aspect to build a better and sustainable future. Typically, urban planning is done in a top-down fashion, where decisions are made on sampled observations of the physical environment. However, joint use of personal and mobile IoT devices with proper sensors, such as smartphones or connected vehicles, allows acquiring data in a participatory manner, thus involving citizens and their sensing devices; this has the advantage of leveraging a significant quantity of data from both ad hoc and personal sensors. However, using personal sensing devices opens new challenges concerning their temporary availability and mobility.
We aim to motivate the use of Multi-Agent Systems (MAS) within EI as a key enabler to develop large-scale data analysis solutions. The proposed MAS-based approach imputes missing environmental data due to intermittent mobile devices (e.g., smartphones). The advantages of our proposal lie in:
- a technique to impute missing values where sensors are missing or not available considering mobile and intermittent IoT devices;
- the use of simple, fast and yet effective calculation that can be done directly by IoT devices;
- the local computation in parts of the environment where sensors perceive similar dynamics.
This paper is organized as follows: Section 2 reviews different state-of-the-art techniques that use IoT devices to pursue large-scale data analysis; Section 3 motivates the need for efficient techniques to impute missing information at large-scale; Section 4 presents our technique on both ad hoc sensors and mobile devices. Section 5 shows and discusses the obtained results; Section 6 concludes our work.
2. Related Work
In this section, we describe different state-of-the-art edge computing solutions to perform data analysis at large-scale by using IoT.
In [7] it was proposed to use both edge and fog computing paradigms with IoT technologies:
- to facilitate the integration of new intelligent and interoperable services in automated and nonautomated buildings;
- to allow the distribution of smart services among the building’s subsystems.
The difference between edge and fog computing lies in the place of computation: a fog environment homes intelligence at the local area network (LAN), whereas the edge computing chairs processing power and intelligence in edge devices [8].
The proposed computing model was based on a two-level architecture, namely edge and fog layers, which interoperability allows developing new services through the information acquired from a great variety of devices (i.e., sensors, controllers, actuators). The edge layer contains different devices with limited computational capabilities that process data using AI algorithms. The fog layer includes computational nodes that process data in IoT gateways, server facilities, or other devices with processing, communication and storage capabilities. This latter layer can also perform the edge node functions in services with a few units.
An IoT-cloud healthcare system was presented in [9]: it automates patients’ vital data collection, delivery and elaboration by Raspberry PI [10] as edge devices to optimize the analysis of data with little energy consumption. Moreover, an advantage of this approach is the reduction of network latency and bandwidth. This is of great interest because the number of sensors is increasing, as well as the amount of information generated, resulting in a significant amount of data traffic. This architecture was defined into different components:
- Sensing Network—this module includes devices capable of acquiring health-related information and communicating these data through a wireless channel to the IoT-Cloud;
- IoT-Cloud—this component comprises the database and edge devices. The edge devices are capable of performing data analysis tasks through AI techniques;
- Graphical user interface—this element offers users simple access to information.
An intelligent Edge-IoT design for smart farming was described in [11]. That solution collects information from IoT devices to monitor cow health and state, milk production, or transport safety. The acquired data is shared through a reliable and transparent platform to provide valuable news to stakeholders, who manage activities through AI-assisted support and to customers, who know the health status of the animals. The proposed technique includes the following sources inside barns: temperature, humidity, hazardous gas such as methane, hydrogen sulfide, ammonia and formaldehyde.
An intelligent intrusion detection system that relies on IoT devices and machine learning to detect anomalous events in the incoming network traffic was described in [12]. The proposed technique is capable of learning the dynamics of network traffic flow and identifying anomalies. Detection of anomalies is performed endogenously, that is, based on the data feedback acquired from IoT devices only. This allows one to avoid the intervention of external users.
The above techniques have been applied in different, heterogeneous contexts. An important insight is pointed out: the techniques discussed can benefit from AI mechanisms to extract knowledge for use in decision making from information acquired over time. Moreover, data collection tasks and AI processing can be done directly by IoT devices, thus delivering a breakthrough in EI.
3. Motivations
AI-based decision support systems can use data from different input data sources to make a prediction. However, the lack of information compromises the functionality of these approaches, as they cannot guarantee results in such a case [13]. Several reasons can lead to the absence of information: communication instability, missing sources or intermittent sensors. The intermittence of sensors can be due to malfunctions or the presence of personal smartphones or connected vehicles: the availability of such sensors mainly depends on the wish of their owner.
The use of statistical techniques proves to be efficient to fill the info gaps [14]. In particular, imputation in statistics is the process of replacing missing data with substituted values, thus addressing the pitfalls caused by the presence of missing data [13]. This difficulty is mainly related to installation and maintenance costs and the use of statistical techniques proves to be efficient to fill the info gaps [14]. In particular, imputation in statistics is the process of replacing missing data with substituted values, thus addressing the pitfalls caused by the presence of missing data [13]. These statistical techniques have two advantages:
- provide estimates in case sensors are not present or temporarily unavailable due to unpredictable malfunctions;
- presence of sparse data. In this case, we suppose that working IoT devices cannot perceive the physical environment because they may not embed specific sensors (such as temperature, humidity, CO2, etc.).
Considering the properties of the physical environment is still a scientific challenge [15], even if many techniques to impute missing data have been developed. These properties regard information heterogeneity, mobile and intermittent sensors and the unpredictable evolutionary dynamics of the environment.
4. Multi-Agent Systems for Edge-Based Data Imputation
We present a new approach for estimating missing environmental information by considering both mobile devices and custom sensors. With respect to the state of the art, our proposal is based on the MAS approach that allows distributing the computation among agents operating locally. The local computation by agents allows reducing network traffic and deploying the solution in a large-scale environment where a high number of devices can be present [16]. This enables the development of edge computing applications.
MAS are composed of multiple interacting and autonomous entities known as agents, with the following characteristics:
- an agent has a partial view of the environment in which it is located; as a result, it has limited control and it can influence just part of the environment (including other agents) through its actions;
- an autonomous agent does not need external interventions to modify its behavior;
- agents can operate jointly to achieve a global objective that cannot be pursued individually [17];
- agents can enter or leave the environment at any time without any reconfiguration.
We intend that a device is a hardware equipment with sensors whose data is processed by its software counterpart known as an agent. Coupling agents and IoT allows devices to become “light” computational entities so to reduce both centralized overhead and network communications.
The novelty of our contribution lies in an MAS for EI considering the following challenges [14]:
- the system operates regardless of the number of devices, these can enter or leave the system without any external intervention;
- delays in the transmission of information between devices do not affect the functioning of the system: agents evaluate imputed values using the available information which is geolocalized and provided with time-stamps;
- mobility does not affect the functioning of the system: agents perform a local computation in the part of the environment where they are situated.
The proposed MAS consider eventual mobile devices such as smartphones or connected vehicles during the data imputation process. The computation is done close to sensors which acquired information from a direct observation of the physical environment. Figure 1 shows the main steps of our methodology, which is based on two types of agents:
- type 1 has fixed perceiving devices and it is associated to a Voronoi region which delimits the rough relevance area of the devices [18];
- type 2 has devices not capable of perceiving the environment for some reason and it needs to cooperate with close working devices to provide information [14].
In general, a Voronoi tessellation separates a space into nonoverlapping regions according to a given metrics [19]. The Voronoi tessellation can be calculated efficiently by an Euclidean distance map through mathematical morphology [20,21]. In particular, we used the Voronoi tessellation so that the agents within each region perceive information with similar dynamics; this allows delimiting the data imputation inside the regions. Let A be a type 2 agent, associated with a mobile device not capable of perceiving the environment, therefore not associated with any Voronoi region. To provide environmental information, A cooperates with the agents that are situated in the same Voronoi region.
To impute a missing value, we used the two-dimensional inverse distance weighting (IDW) interpolation for irregularly spaced data [22] (step ❶). Let be a control point, defined as a point of the space where the information is certain. In its basic form, IDW is represented by the following function for n control points :
where Z is the interpolated value in a point P with an unknown observation, where a type 1 agent is located, the weighting function that determines the relative importance of each control point with respect to P and is the observed value at [23]. Each value is calculated as the Euclidean distance between P and .
Once Z has been calculated, it is compared to the value perceived by the agents in the same Voronoi region and the value perceived by one of the closest devices (associated with an adjacent Voronoi region). The smaller the absolute difference between these values, the greater the probability of these two Voronoi regions being merged (step ❷). The overall Voronoi tessellation needs to be updated only if the configuration of sensors changes.
If the imputed value is not considered as an outlier with respect to the values perceived by the agents inside the regions, then those regions are merged. Outlier values are detected if they lie outside the range of where and are respectively the mean and standard deviation of the values (step ❸). Assuming a normal distribution this represents 95.5% of the values.
Because environmental information changes over time, the validity of the current Voronoi partitioning is tested at each iteration. If necessary, a new Voronoi tessellation is calculated and then some of its regions may be merged.
5. Experimental Results
To evaluate the correctness of the proposed technique we considered a real dataset of environmental information provided by Arpae-SIMC, the weather service of the Emilia-Romagna region in Italy which provides weather warnings to the Italian Civil Protection Department. Beyond climatological data, Arpae-SIMC provides tools, products and indicators to evaluate the impact of storms on the coast [24].
About 48% of this region consists of plains while 27% is hilly and 25% is mountainous. We considered the average daily air temperatures at 2 meters of altitude, collected in 196 days from 8 September 2017 by 80 weather stations. The exact geographic locations of these stations were corrected to the Cartesian plane through the Mercator projection [25].
We performed 1000 simulations, involving 80 weather stations and 20 mobile devices (corresponding to 20% of the total number of measurements). Both weather stations and mobile devices are “agentified” as described in Section 4: the weather stations are fixed in space and are associated with agents that have a Voronoi region; the mobile devices are not associated with any Voronoi region.
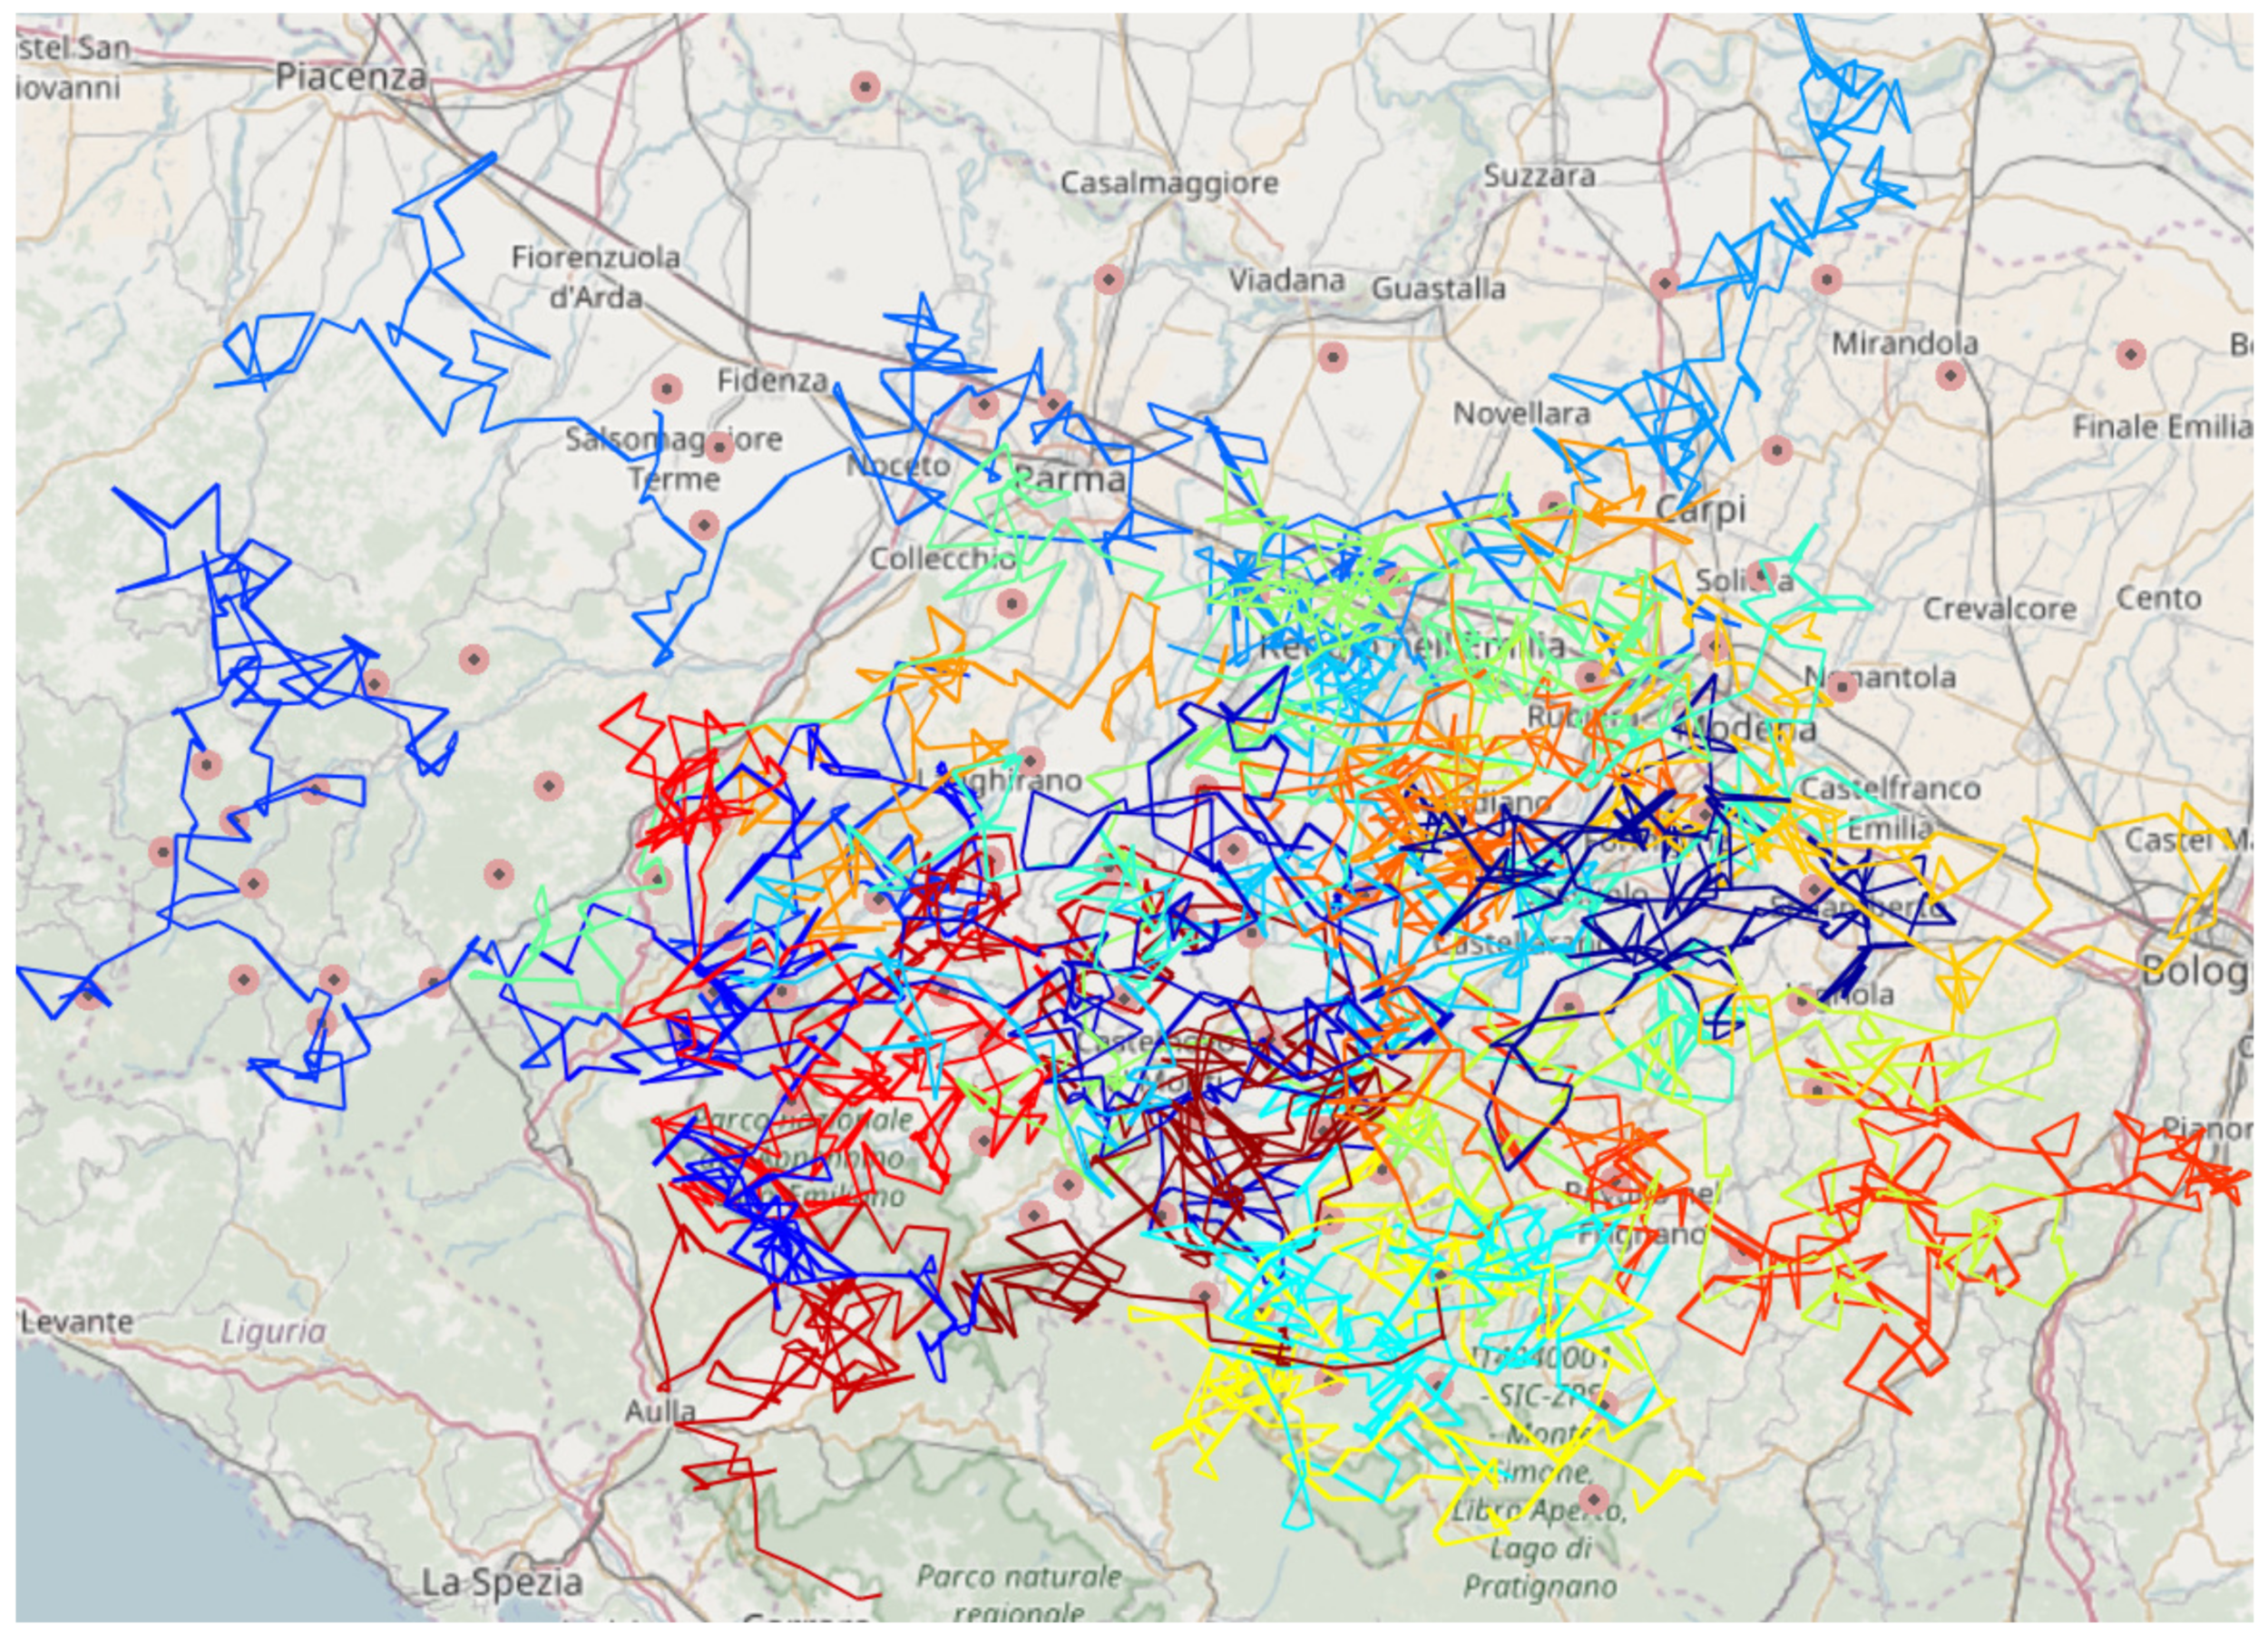
For each simulation, the mobile devices follow a different random trajectory. These paths have been generated by a random walk algorithm: a simple process of visiting the nodes of a graph in some random order [26]. The walk starts at some random node and at each step; it moves daily to a neighbor of the current node chosen at random (Figure 2).
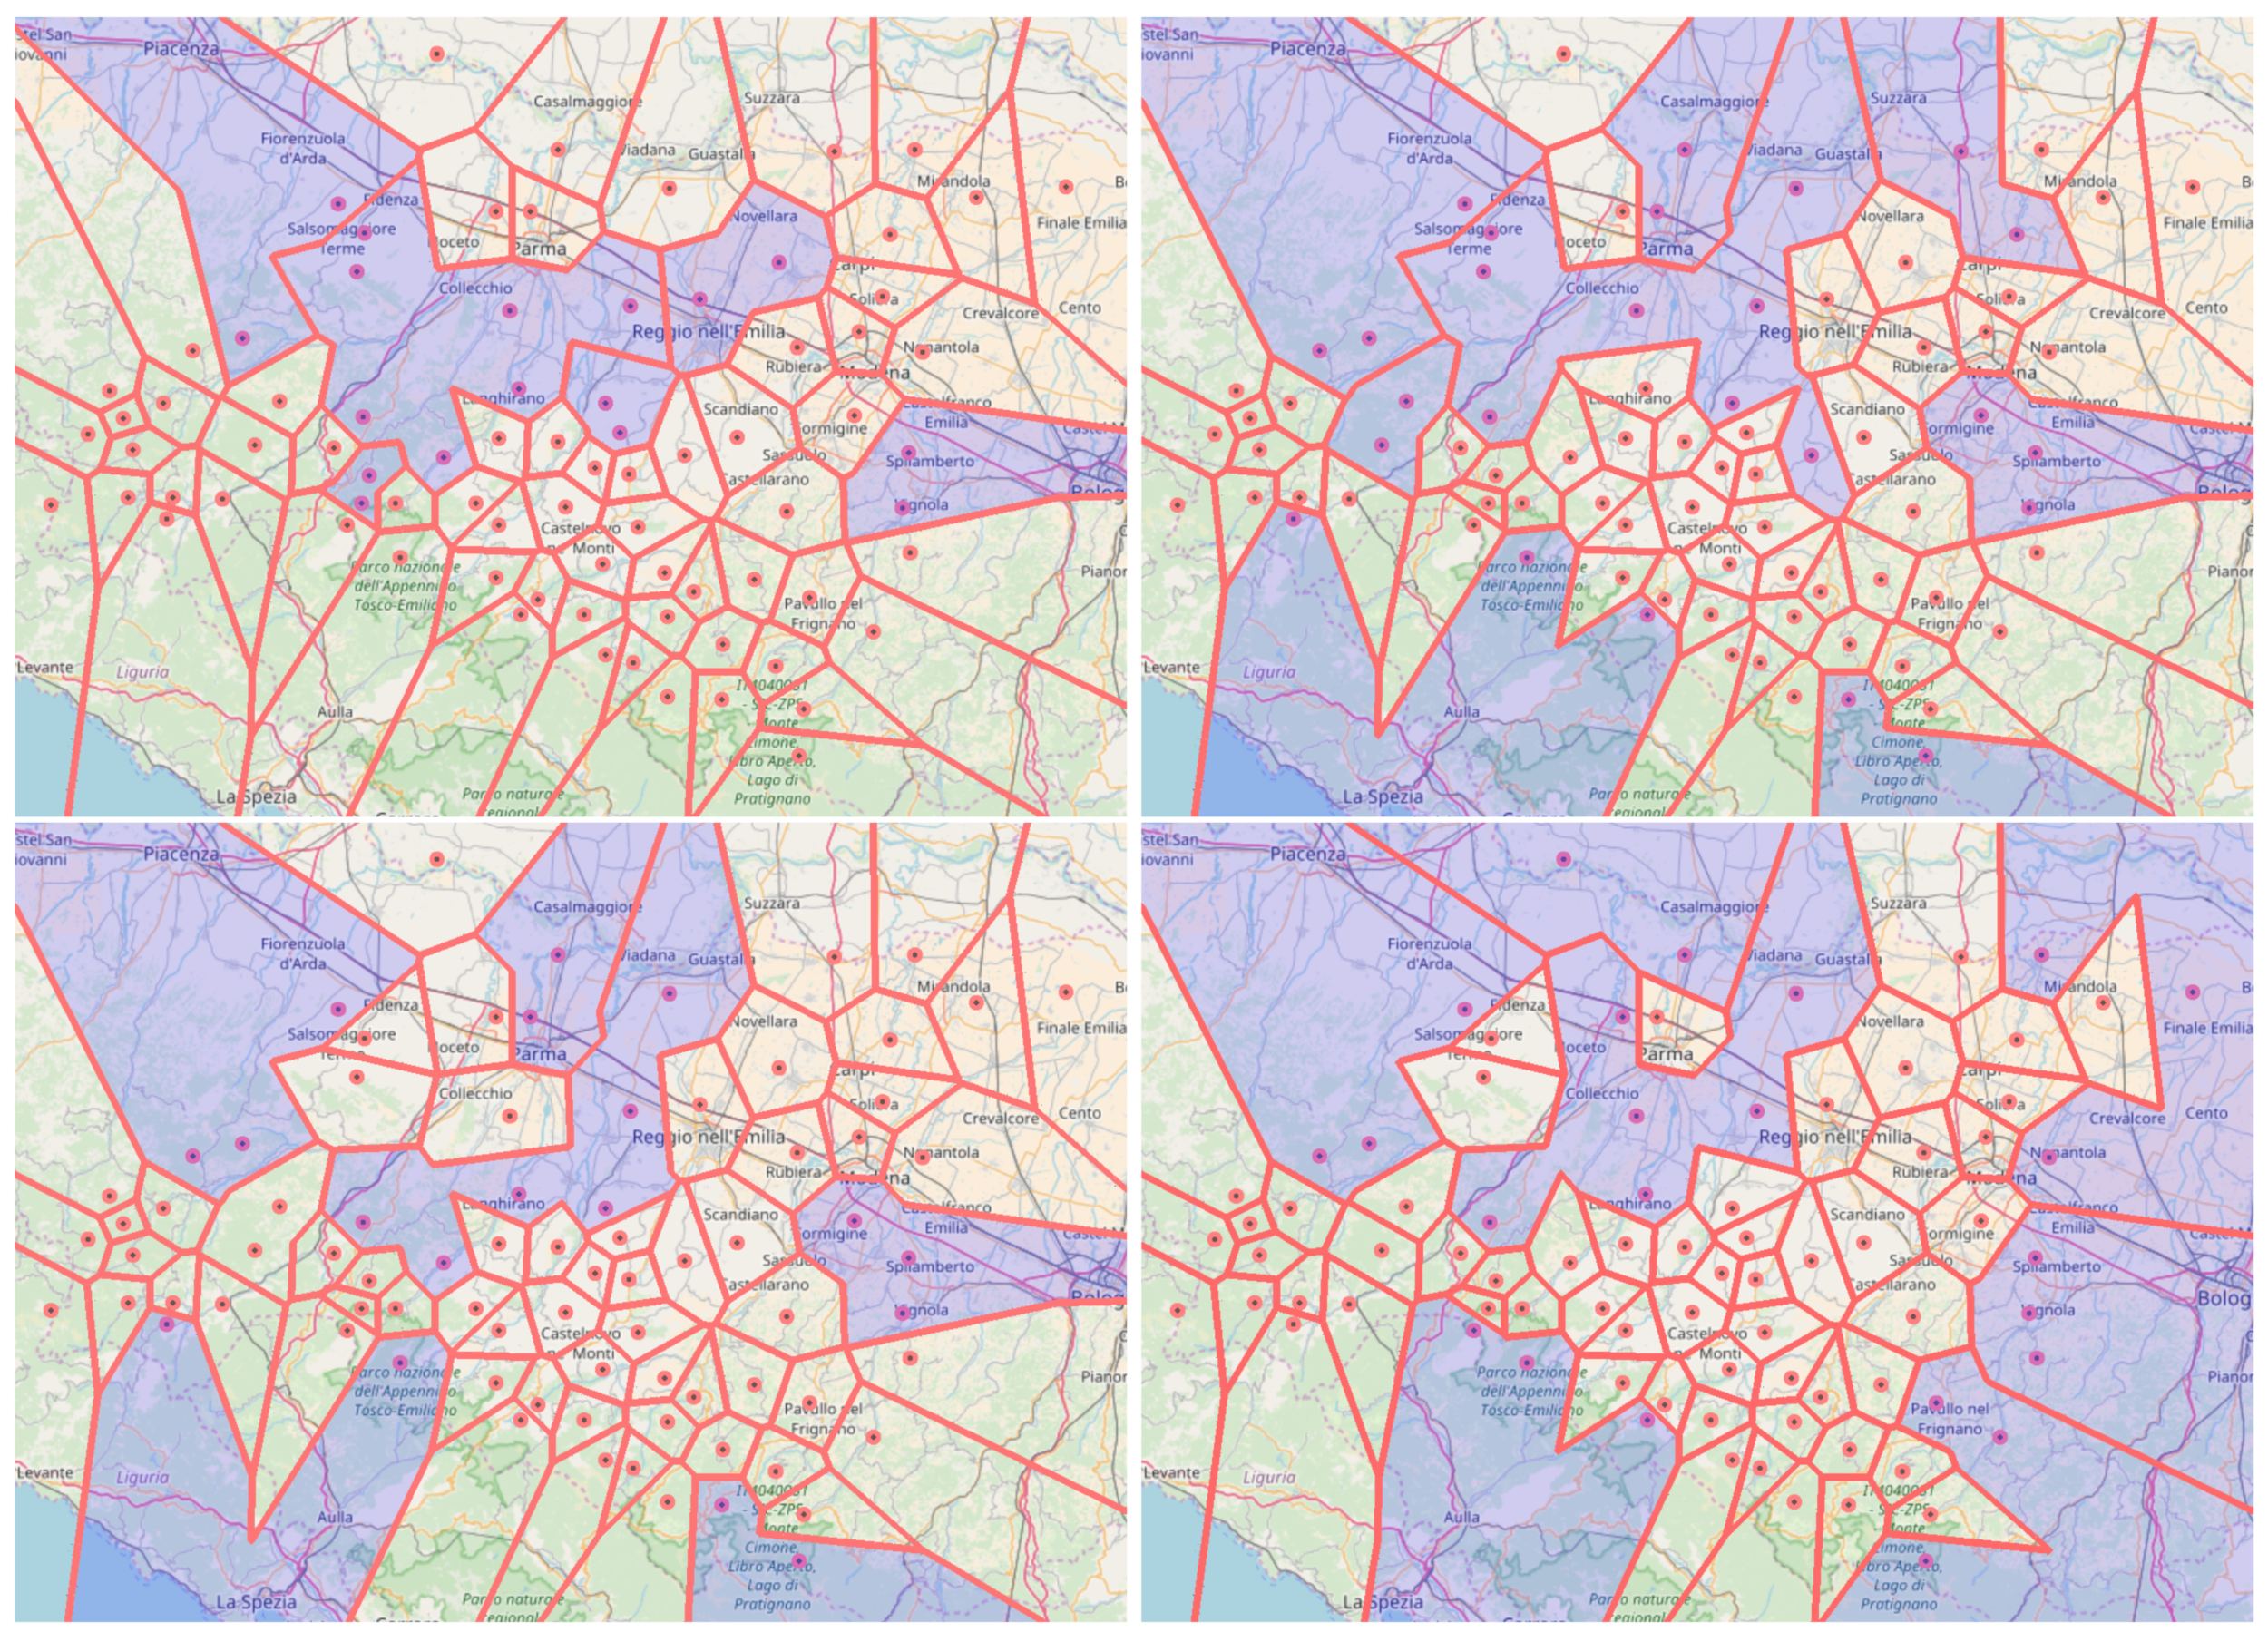
Figure 3 shows the resulting regions after multiple iterations of the proposed technique. The regions highlighted in blue contain two or more stations. This figure shows how the Voronoi regions change over time according to the values perceived by the fixed stations and the imputed values they provide to mobile devices.
We carried out all the experiments on a machine equipped with i7-7820HQ, 32GB RAM, and Windows 10. With such a configuration, imputing a value requires less than a second. We developed the proposed approach in MATLAB language without any particular agent-based technology. We did not consider additional computational overhead such as communication costs between agents.
In particular, we carried out the following evaluation:
- for each random walk, consider how many times the mobile device stationed in each region;
- for each mobile device, retrieve the three stations related to the Voronoi regions in which the mobile device has passed most of its time;
- evaluate the average mean error of the difference between the data of the fixed stations and the imputed values of the mobile device.
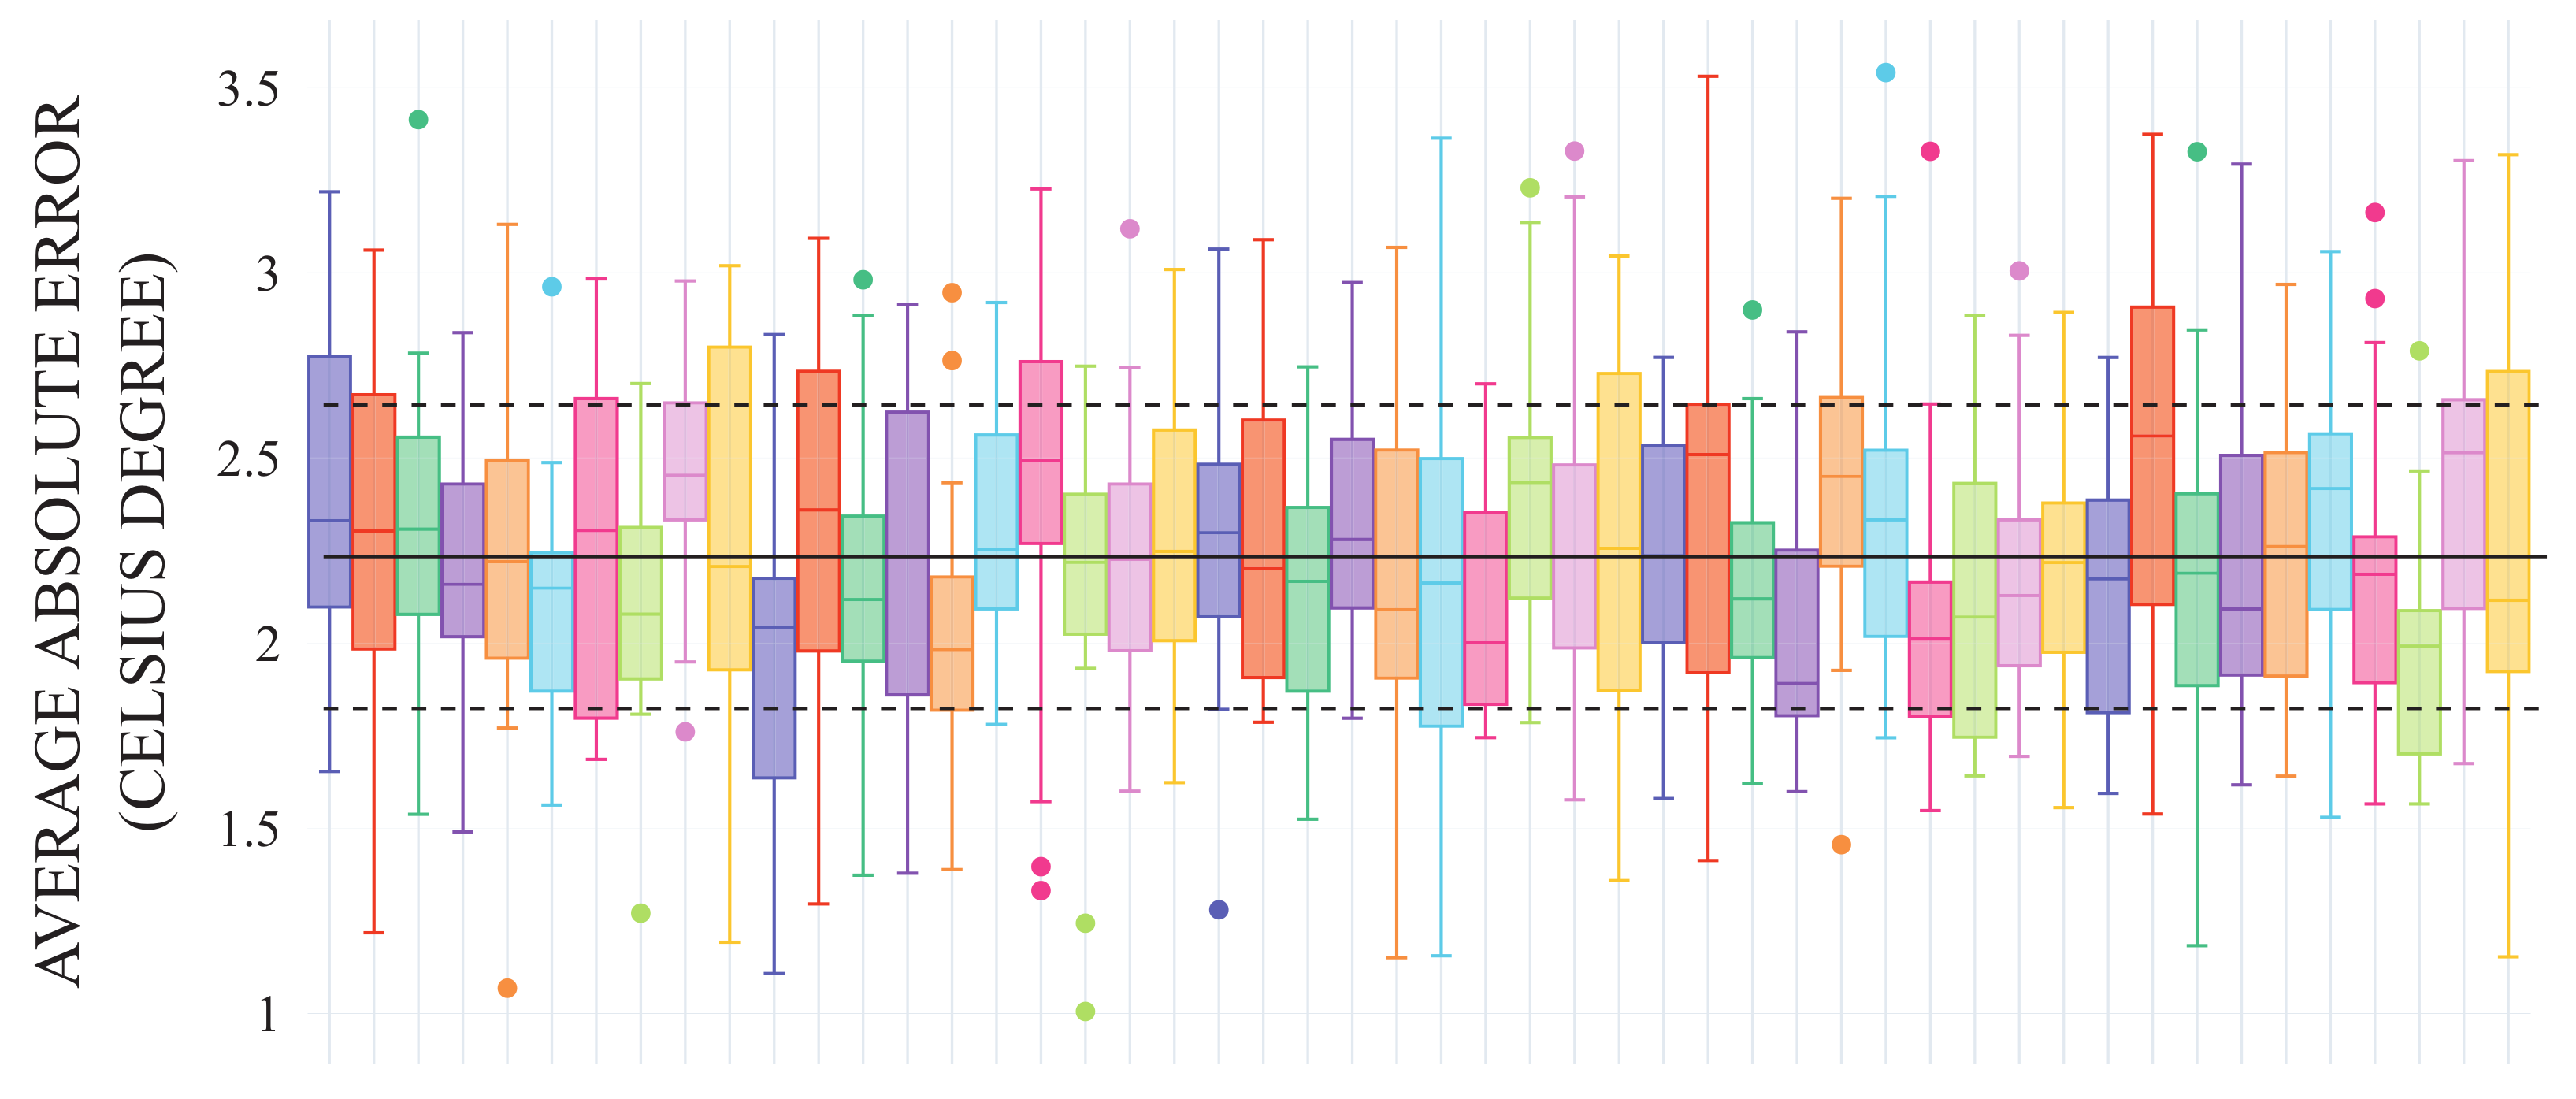
Figure 4 shows the absolute average error for 50 random samples among the 1000 simulations. Each box plot relates to a specific simulation involving 20 mobile devices during the considered 196 days.
Although the imputed values are calculated in points where no sensors are available, the error between the values provided by the fixed stations and the imputed values is quite low: the absolute average error among all simulations is 2.24 °C, the standard deviation 0.43 °C. Moreover, no particular configuration of the system is required: this is a significant advantage of the proposed technique as it can be used in different environmental contexts without specifying any parameter on the orography of the environment.
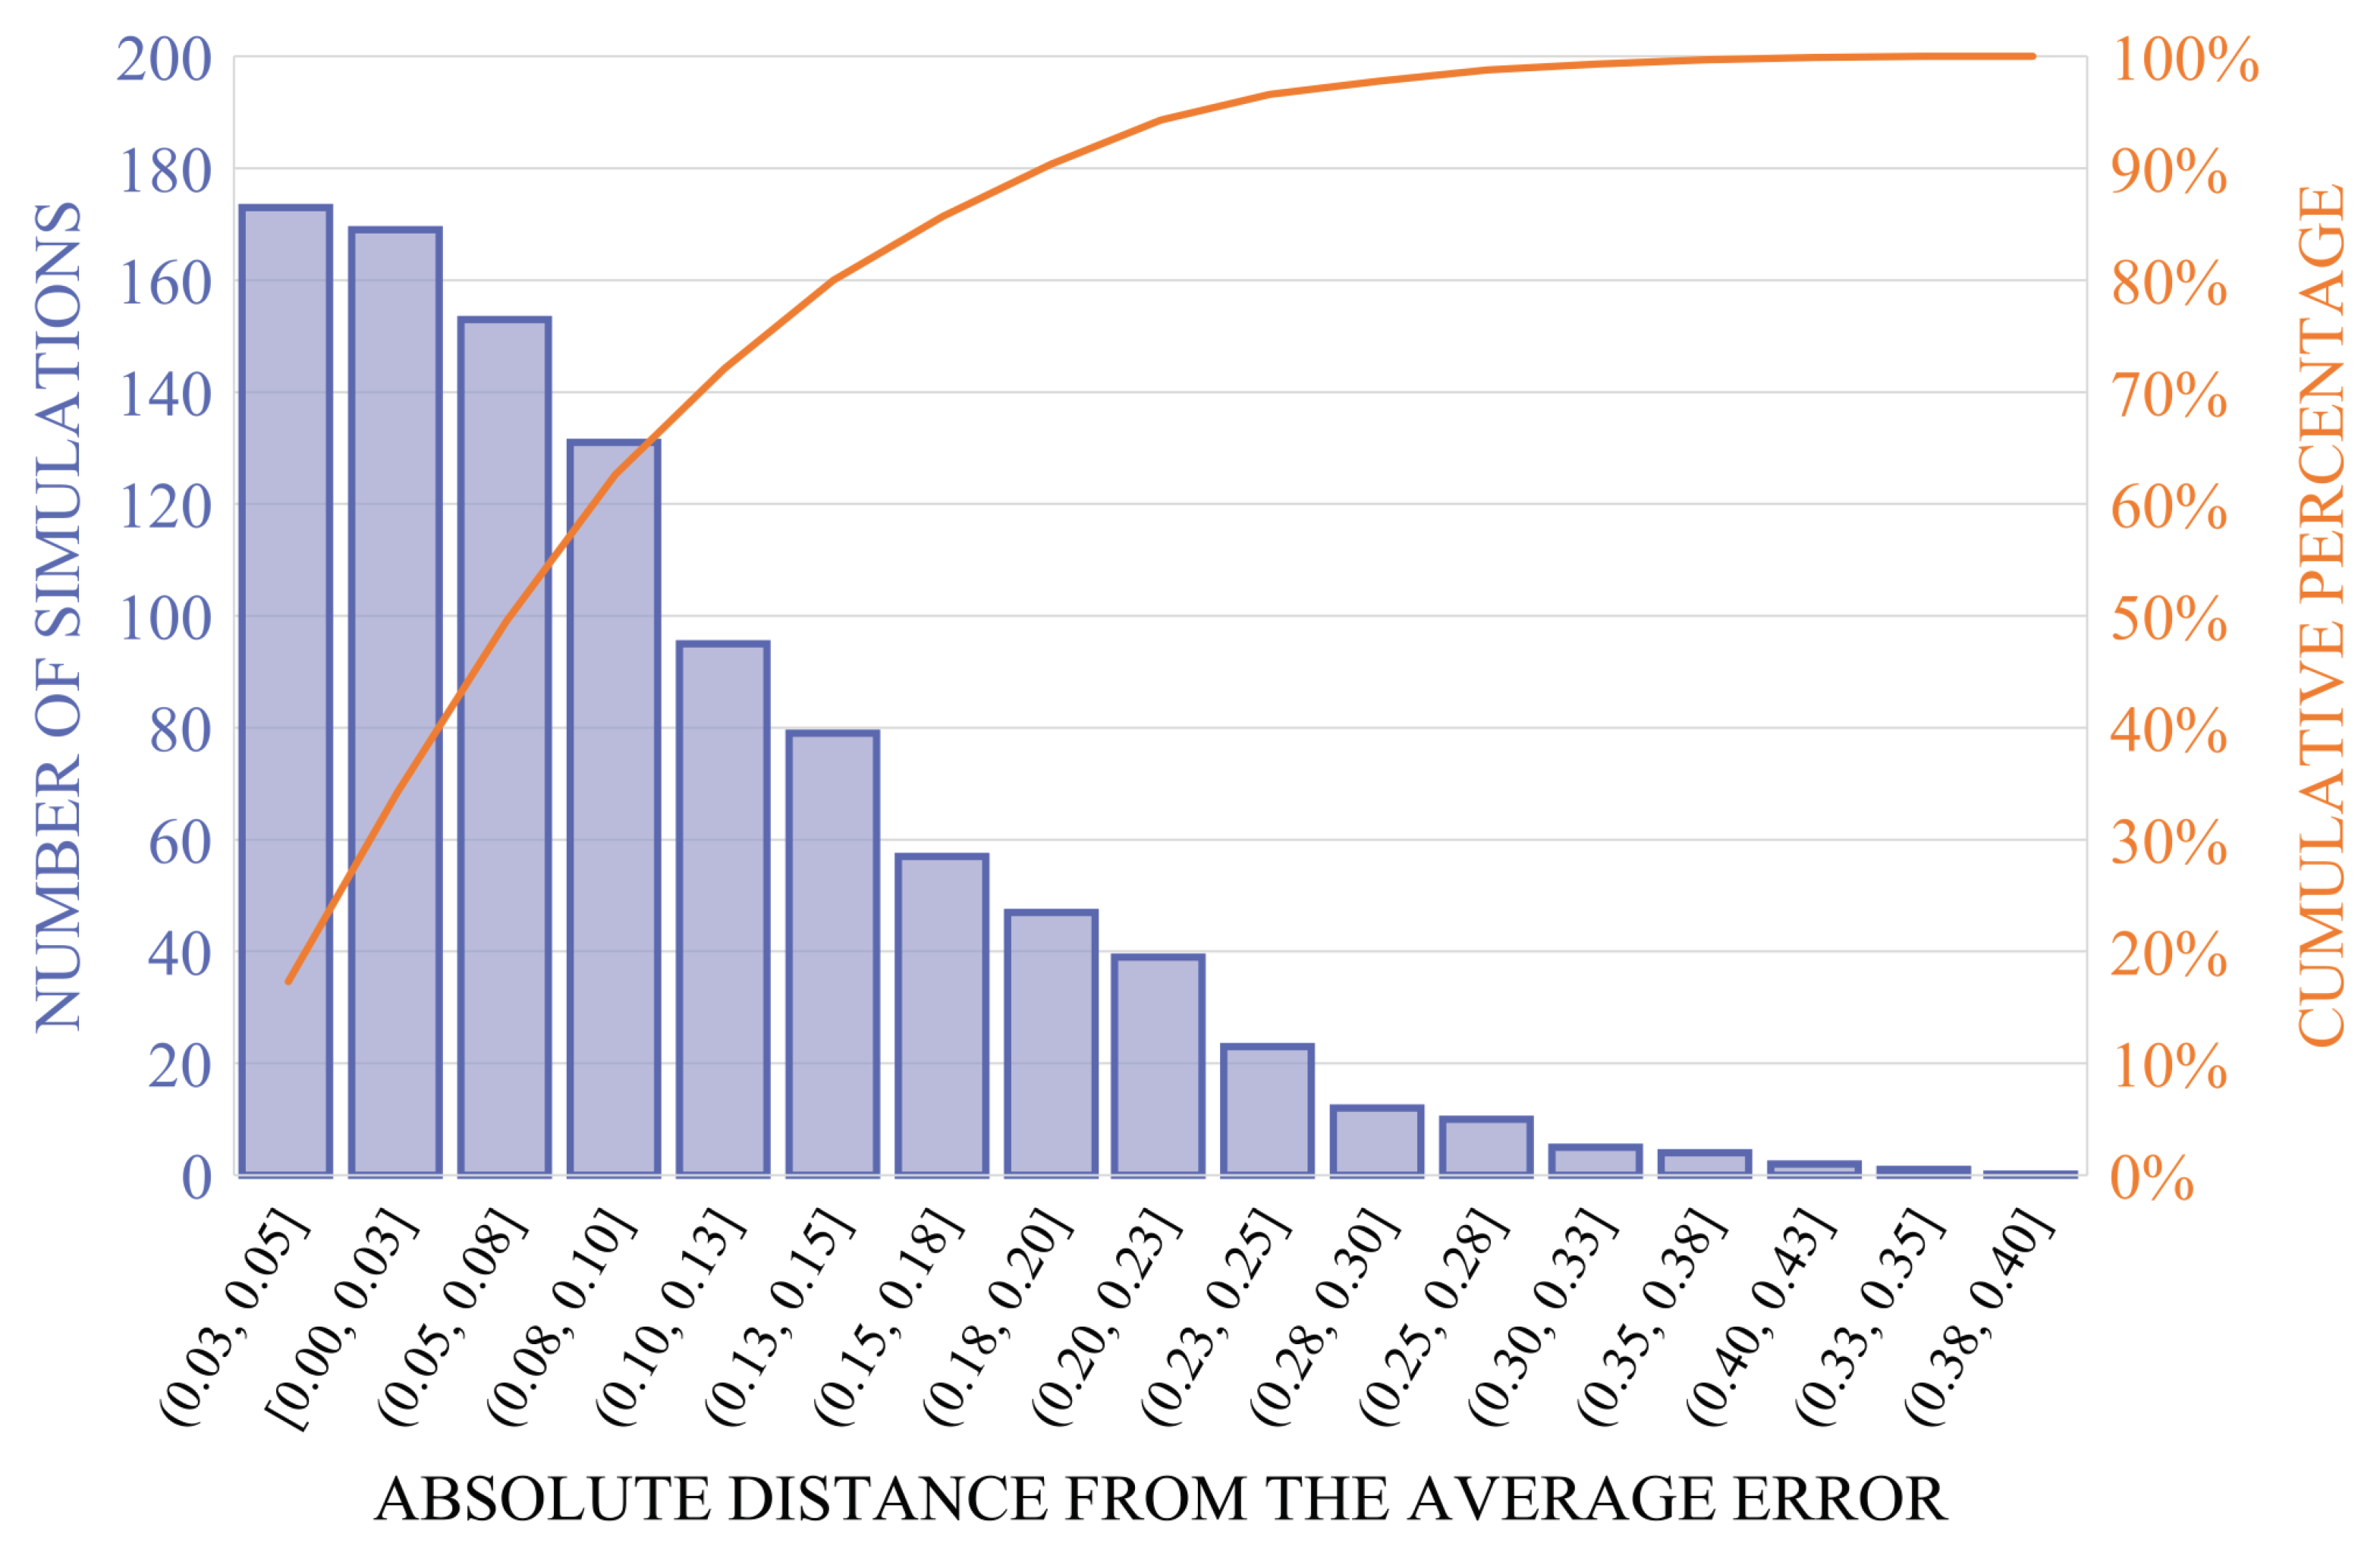
Figure 5 shows the Pareto chart obtained from the calculated errors. The bars, referring to the left axis, indicate the frequency of occurrence of the errors of the simulations, weighted by the distance from the average error calculated among all the simulations. The line indicates the cumulative percentage of the total number of occurrences of the errors and refers to the right axis. The majority of the errors obtained by the proposed techniques are situated in the leftmost bars, which constitute more than 70% of all the simulations. Moreover, less than 30% of the simulations produced imputed values whose average error is distant from the average one of more than 0.13 °C.
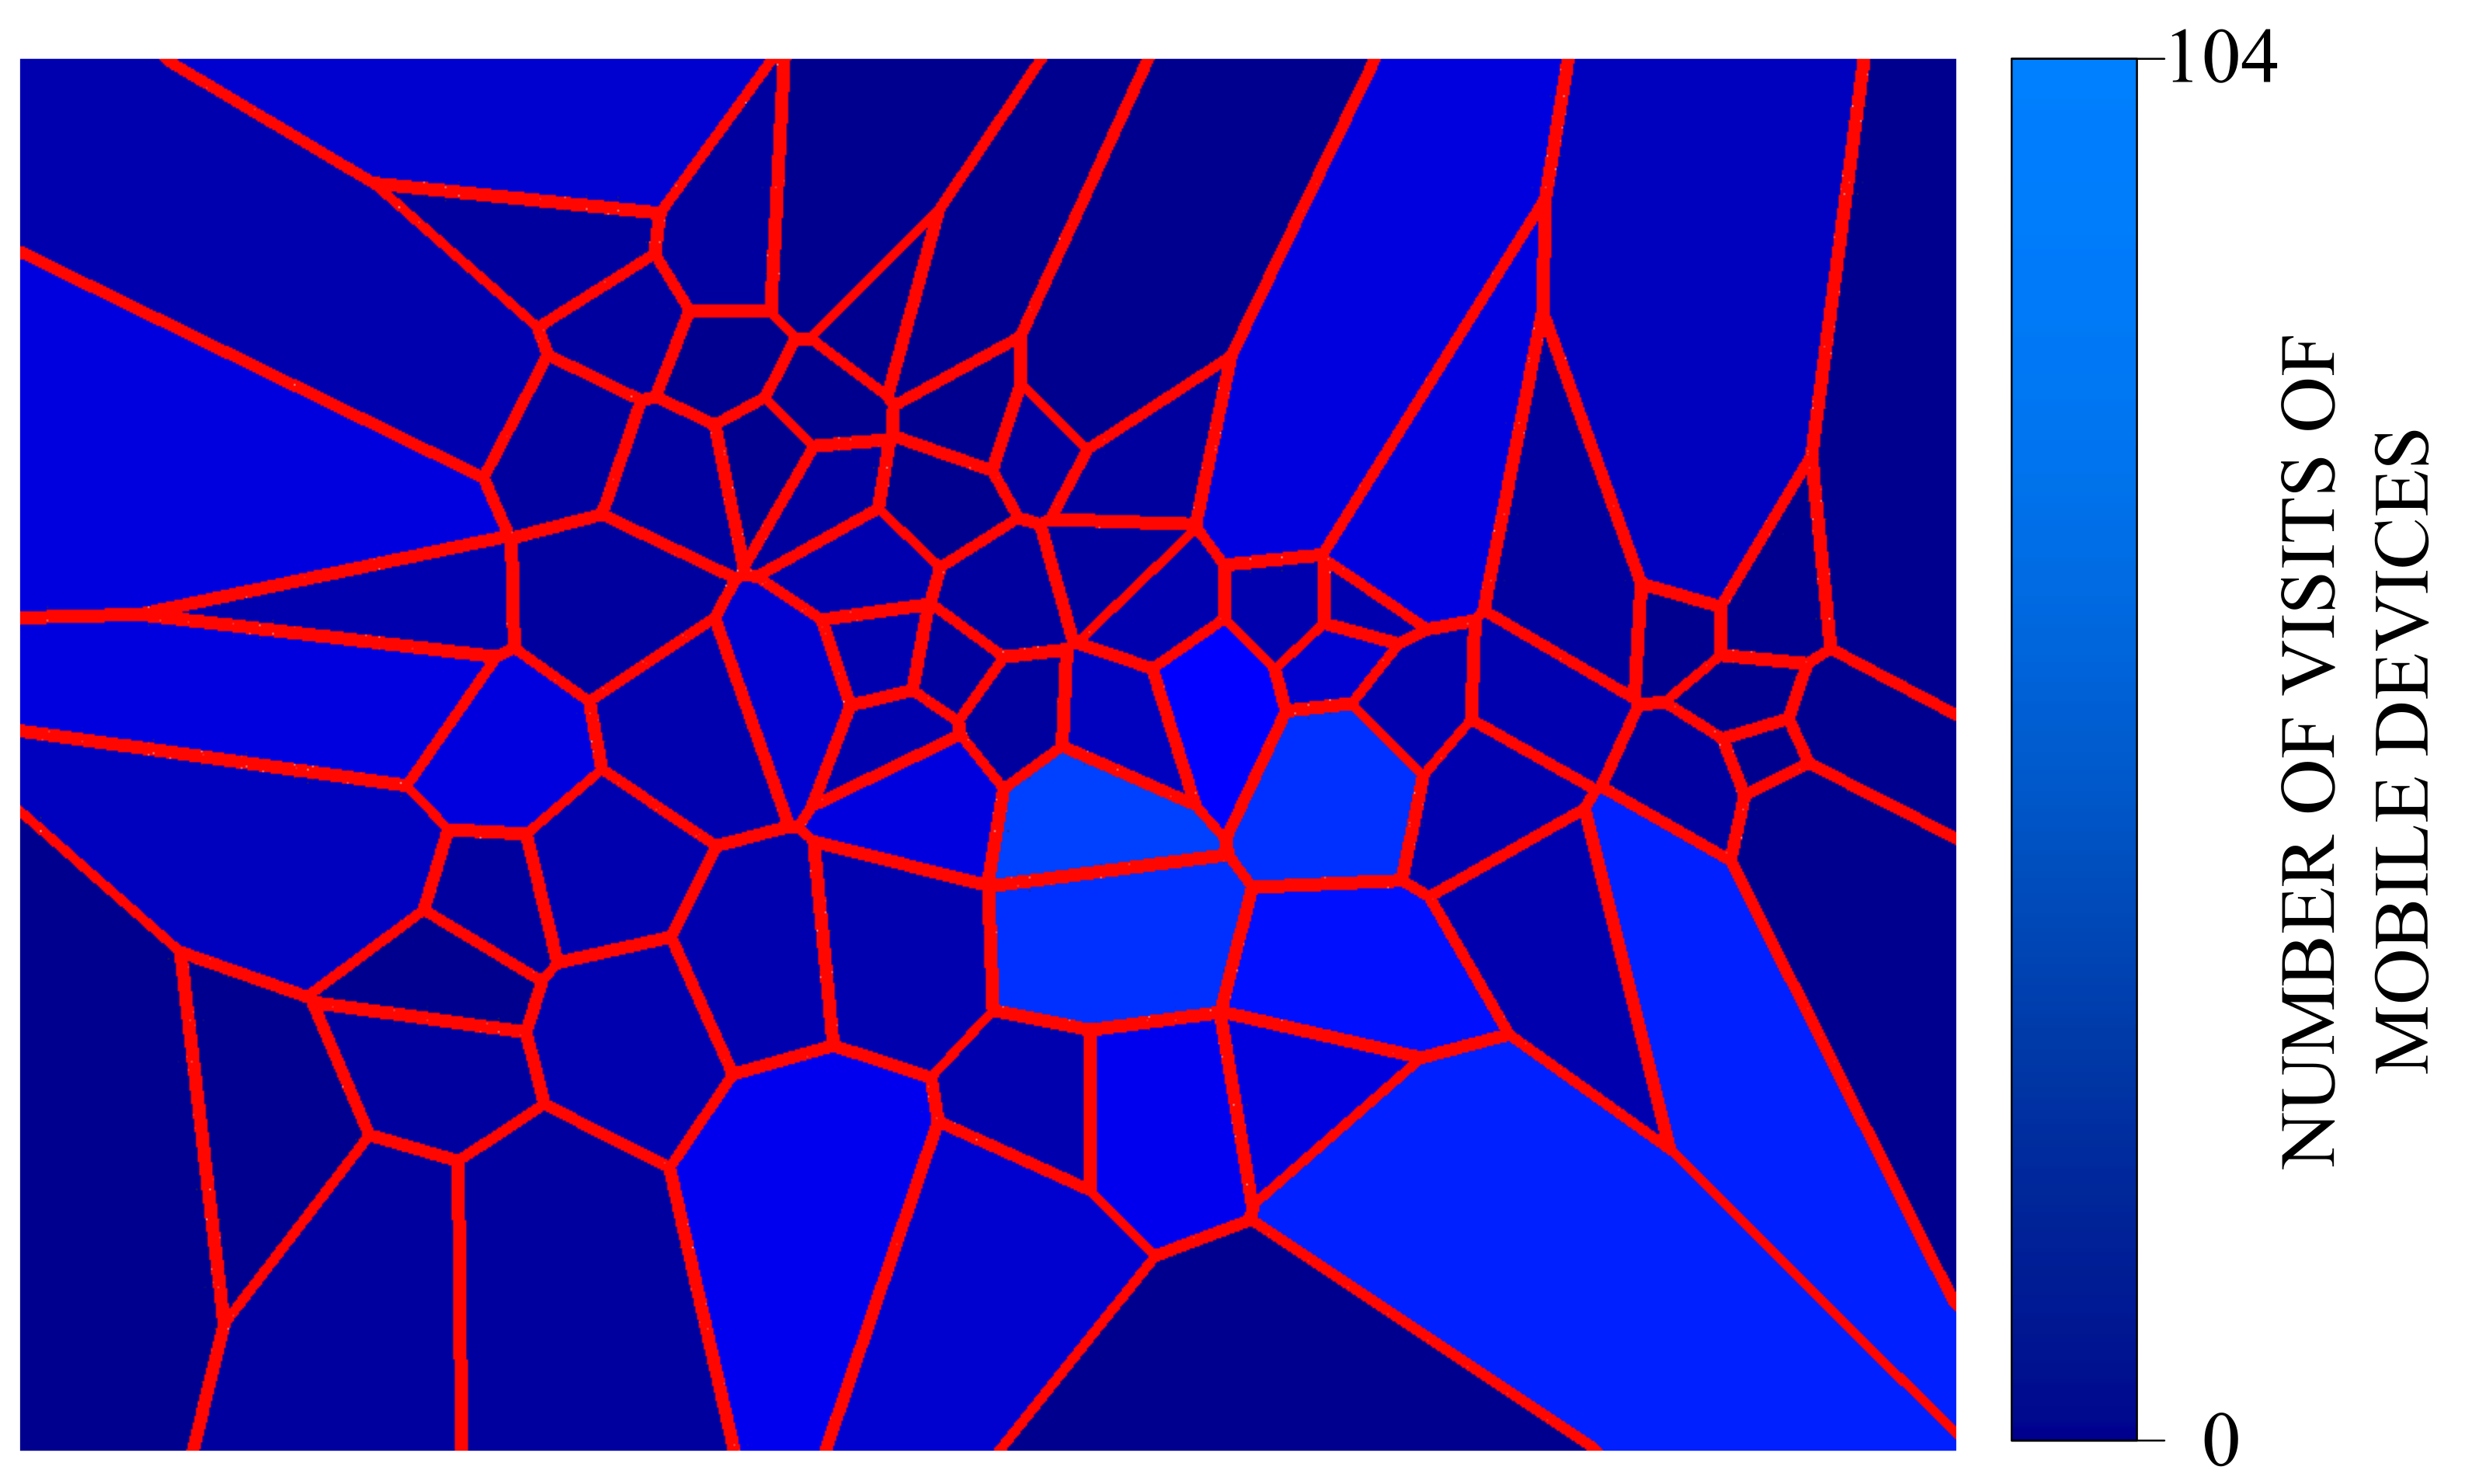
Figure 6 shows the resulting cumulative persistence map obtained with respect to one of the simulations. The regions are colored according to the total number of devices that have passed through them.
6. Conclusions and Future Perspectives
A growing number of AI solutions deal with huge quantities of data generated from IoT sensors with the aim of collecting, processing, and analyzing data. Edge computing is an emerging computational paradigm capable of dealing with such challenges by distributing the computation among the available IoT devices, which are more and more powerful and low-cost.
Our goal is to provide an efficient and simple way to address the objective of edge computing through the use of intelligent agents associated with IoT devices. MAS lets our approach be scaled horizontally by adding new sensing devices without any particular reconfiguration. Moreover, the local computation by the agents allows for the reduction of bottlenecks in network transmissions.
In this paper, we showed how MAS and IoT can be coupled to impute missing values at a large-scale through intermittent mobile devices. The results obtained on real meteorological data show the validity of our methodology. The deployment of the proposed technique in a real context has no consequence on the nominal operation of the system:
- it operates regardless of the number of devices, which can enter or leave the system without any external intervention;
- delays in transmissions that may happen do not affect the functioning because agents impute missing values by using the available information which is geolocalized and provided with time-stamps;
- mobility does not affect the functioning because agents perform a local computation within the zone of the environment where they are situated.
In our future work, we plan to apply the proposed approach in a real physical environment using mobile devices such as smartphones or connected vehicles. Furthermore, we intend to consider the integration of heterogeneous information. The final objective would be the realization of accurate cartographies of the physical environment via a reduced number of sensors.
Author Contributions
Conceptualization, G.M.; data curation, D.A.G. and C.V.; investigation, D.A.G.; methodology, G.M. and C.V.; software, D.A.G.; validation, G.M. and C.V.; writing—original draft, D.A.G. and C.V. All authors have read and agreed to the published version of the manuscript.
Funding
This research received no external funding.
Institutional Review Board Statement
Not applicable.
Informed Consent Statement
Not applicable.
Data Availability Statement
Publicly available datasets were analyzed in this study. This data can be found here: https://simc.arpae.it/dext3r/.
Conflicts of Interest
The authors declare no conflict of interest.
References
- Rocher, G.; Tigli, J.Y.; Lavirotte, S. Probabilistic Models Toward Controlling Smart-* Environments. IEEE Access 2017, 5, 12338–12352. [Google Scholar] [CrossRef]
- Vargas-Solar, G.; Castillo-Camporro, A.; Zechinelli-Martini, J.L.; Espinosa-Oviedo, J.A. From Data Harvesting to Querying for Making Urban Territories Smart. In Innovative Applications in Smart Cities; Ochoa, C.A., Ed.; Taylor and Francis: Germantown, NY, USA, 2020. [Google Scholar]
- Marjani, M.; Nasaruddin, F.; Gani, A.; Karim, A.; Hashem, I.A.T.; Siddiqa, A.; Yaqoob, I. Big IoT Data Analytics: Architecture, Opportunities, and Open Research Challenges. IEEE Access 2017, 5, 5247–5261. [Google Scholar]
- Zhou, Z.; Chen, X.; Li, E.; Zeng, M.; Luo, K.; Zhang, J. Edge Intelligence: Paving the Last Mile of Artificial Intelligence With Edge Computing. Proc. IEEE 2019, 107, 1738–1762. [Google Scholar] [CrossRef] [Green Version]
- Barthélemy, J.; Verstaevel, N.; Forehead, H.; Perez, P. Edge-Computing Video Analytics for Real-Time Traffic Monitoring in a Smart City. Sensors 2019, 19, 2048. [Google Scholar] [CrossRef] [PubMed] [Green Version]
- Jiang, C.; Fan, T.; Gao, H.; Shi, W.; Liu, L.; Cérin, C.; Wan, J. Energy aware edge computing: A survey. Comput. Commun. 2020, 151, 556–580. [Google Scholar] [CrossRef]
- Ferrández-Pastor, F.J.; Mora, H.; Jimeno-Morenilla, A.; Volckaert, B. Deployment of IoT Edge and Fog Computing Technologies to Develop Smart Building Services. Sustainability 2018, 10, 3832. [Google Scholar] [CrossRef] [Green Version]
- Prasad, V.K.; Bhavsar, M.D.; Tanwar, S. Influence of Montoring: Fog and Edge Computing. Scalable Comput. Pract. Exp. 2019, 20, 365–376. [Google Scholar] [CrossRef] [Green Version]
- Jaiswal, K.; Sobhanayak, S.; Turuk, A.K.; Bibhudatta, S.L.; Mohanta, B.K.; Jena, D. An IoT-Cloud Based Smart Healthcare Monitoring System Using Container Based Virtual Environment in Edge Device. In Proceedings of the 2018 International Conference on Emerging Trends and Innovations In Engineering And Technological Research (ICETIETR), Arakkunnam, Kerala, 11–13 July 2018; pp. 1–7. [Google Scholar]
- Raspberry Pi. 2021. Available online: www.raspberrypi.org (accessed on 10 April 2021).
- Alonso, R.S.; Sittón-Candanedo, I.; García, O.; Prieto, J.; Rodríguez-González, S. An intelligent Edge-IoT platform for monitoring livestock and crops in a dairy farming scenario. Ad Hoc Networks 2020, 98, 102047. [Google Scholar] [CrossRef]
- Eskandari, M.; Janjua, Z.H.; Vecchio, M.; Antonelli, F. Passban IDS: An Intelligent Anomaly-Based Intrusion Detection System for IoT Edge Devices. IEEE Internet Things J. 2020, 7, 6882–6897. [Google Scholar] [CrossRef]
- Leke, C.A.; Marwala, T. Introduction to Missing Data Estimation; Springer: Cham, Switzerland, 2019. [Google Scholar]
- Guastella, D.A.; Camps, V.; Gleizes, M.P. A Cooperative Multi-Agent System for Crowd Sensing Based Estimation in Smart Cities. IEEE Access 2020, 8, 183051–183070. [Google Scholar] [CrossRef]
- Guastella, D.; Camps, V.; Gleizes, M.P. Multi-agent Systems for Estimating Missing Information in Smart Cities. In Proceedings of the 11th International Conference on Agents and Artificial Intelligence—Volume 2: ICAART, Prague, Czech Republic, 19–21 February 2019; pp. 214–223. [Google Scholar]
- Guastella, D.A.; Camps, V.; Gleizes, M.P. Estimating Missing Environmental Information by Contextual Data Cooperation. In PRIMA 2019: Principles and Practice of Multi-Agent Systems; Springer: Cham, Switzerland, 2019; pp. 523–531. [Google Scholar]
- Dorri, A.; Kanhere, S.S.; Jurdak, R. Multi-Agent Systems: A Survey. IEEE Access 2018, 6, 28573–28593. [Google Scholar] [CrossRef]
- Guastella, D.A.; Valenti, C. Estimating Missing Information by Cluster Analysis and Normalized Convolution. In Proceedings of the 2018 IEEE 4th International Forum on Research and Technology for Society and Industry (RTSI), Palermo, Italy, 10–13 September 2018; pp. 1–6. [Google Scholar]
- Okabe, A.; Boots, B.; Sugihara, K.; Chiu, S. Spatial Tessellations—Concepts and Applications of Voronoi Diagrams; Probability and Statistics; John Wiley: Hoboken, NJ, USA, 2000. [Google Scholar]
- Guastella, D.A.; Valenti, C. Cartoon filter via adaptive abstraction. J. Vis. Commun. Image Represent. 2016, 36, 149–158. [Google Scholar] [CrossRef]
- Lo Castro, D.; Tegolo, D.; Valenti, C. A visual framework to create photorealistic retinal vessels for diagnosis purposes. J. Biomed. Informat. 2020, 108, 103490. [Google Scholar] [CrossRef] [PubMed]
- Mei, G. Evaluating the Power of GPU Acceleration for IDW Interpolation Algorithm. Sci. World J. 2014, 2014, 171574. [Google Scholar] [CrossRef] [PubMed]
- Huang, F.; Liu, D.; Tan, X.; Wang, J.; Chen, Y.; He, B. Explorations of the implementation of a parallel IDW interpolation algorithm in a Linux cluster-based parallel GIS. Comput. Geosci. 2011, 37, 426–434. [Google Scholar] [CrossRef]
- Bressan, L.; Valentini, A.; Paccagnella, T.; Montani, A.; Marsigli, C.; Tesini, M. Sensitivity of sea-level forecasting to the horizontal resolution and sea surface forcing for different configurations of an oceanographic model of the Adriatic Sea. Adv. Sci. Res. 2017, 14, 77–84. [Google Scholar] [CrossRef] [Green Version]
- Monmonier, M. Rhumb Lines and Map Wars: A Social History of the Mercator Projection; University of Chicago Press: Chicago, IL, USA, 2010. [Google Scholar]
- Avin, C.; Koucký, M.; Lotker, Z. Cover time and mixing time of random walks on dynamic graphs. Random Struct. Algorithms 2018, 52, 576–596. [Google Scholar] [CrossRef]
- OpenStreetMap Contributors. Planet Dump Retrieved from https://planet.osm.org. 2017. Available online: https://www.openstreetmap.org (accessed on 10 April 2021).
Figure 1.
Sketch of the proposed approach.

Figure 2.
An example of 20 colored random walks together with the weather stations (pink dots) in Emilia-Romagna, Italy (obtained through OpenStreetMap [27]). The reader is referred to the electronic version of the article for interpretation of the colors in the figures.
Figure 2.
An example of 20 colored random walks together with the weather stations (pink dots) in Emilia-Romagna, Italy (obtained through OpenStreetMap [27]). The reader is referred to the electronic version of the article for interpretation of the colors in the figures.

Figure 3.
Merged Voronoi regions (in blue) obtained during four different iterations.

Figure 4.
Average absolute error obtained on 50 simulations. The solid black line depicts the average absolute error; the dashed lines represent the standard deviation.
Figure 4.
Average absolute error obtained on 50 simulations. The solid black line depicts the average absolute error; the dashed lines represent the standard deviation.

Figure 5.
Pareto chart obtained from the absolute distance between the average errors of individual simulations and the average error among all the simulations. Occurrence bars are in descending order.
Figure 5.
Pareto chart obtained from the absolute distance between the average errors of individual simulations and the average error among all the simulations. Occurrence bars are in descending order.

Figure 6.
Cumulative persistence map related to a specific simulation. Brighter regions are those where mobile agents passed most often. Darker regions were visited sporadically.
Figure 6.
Cumulative persistence map related to a specific simulation. Brighter regions are those where mobile agents passed most often. Darker regions were visited sporadically.

Publisher’s Note: MDPI stays neutral with regard to jurisdictional claims in published maps and institutional affiliations. |
© 2021 by the authors. Licensee MDPI, Basel, Switzerland. This article is an open access article distributed under the terms and conditions of the Creative Commons Attribution (CC BY) license (https://creativecommons.org/licenses/by/4.0/).
Share and Cite
MDPI and ACS Style
Guastella, D.A.; Marcillaud, G.; Valenti, C. Edge-Based Missing Data Imputation in Large-Scale Environments. Information 2021, 12, 195. https://0-doi-org.brum.beds.ac.uk/10.3390/info12050195
AMA Style
Guastella DA, Marcillaud G, Valenti C. Edge-Based Missing Data Imputation in Large-Scale Environments. Information. 2021; 12(5):195. https://0-doi-org.brum.beds.ac.uk/10.3390/info12050195
Chicago/Turabian StyleGuastella, Davide Andrea, Guilhem Marcillaud, and Cesare Valenti. 2021. "Edge-Based Missing Data Imputation in Large-Scale Environments" Information 12, no. 5: 195. https://0-doi-org.brum.beds.ac.uk/10.3390/info12050195
Note that from the first issue of 2016, this journal uses article numbers instead of page numbers. See further details here.