
Combatting Visual Fake News with a Professional Fact-Checking Tool in Education in France, Romania, Spain and Sweden


Abstract
:1. Introduction
1.1. Educational Interventions to Support Fact-Checking in a Post-Truth Era
1.2. Design-Based Research
1.3. The Present Study
- a
- The total post-test score will be significantly better than the total pre-test score.
- b
- The ability to debunk false and true items separately will also be significantly better in the post-test.
- Q1
- How do media attitudes and digital information attitudes vary across countries?
- Q2
- How does performance on pre- and post-test vary across countries?
2. Materials and Methods
2.1. Participants
2.2. Material
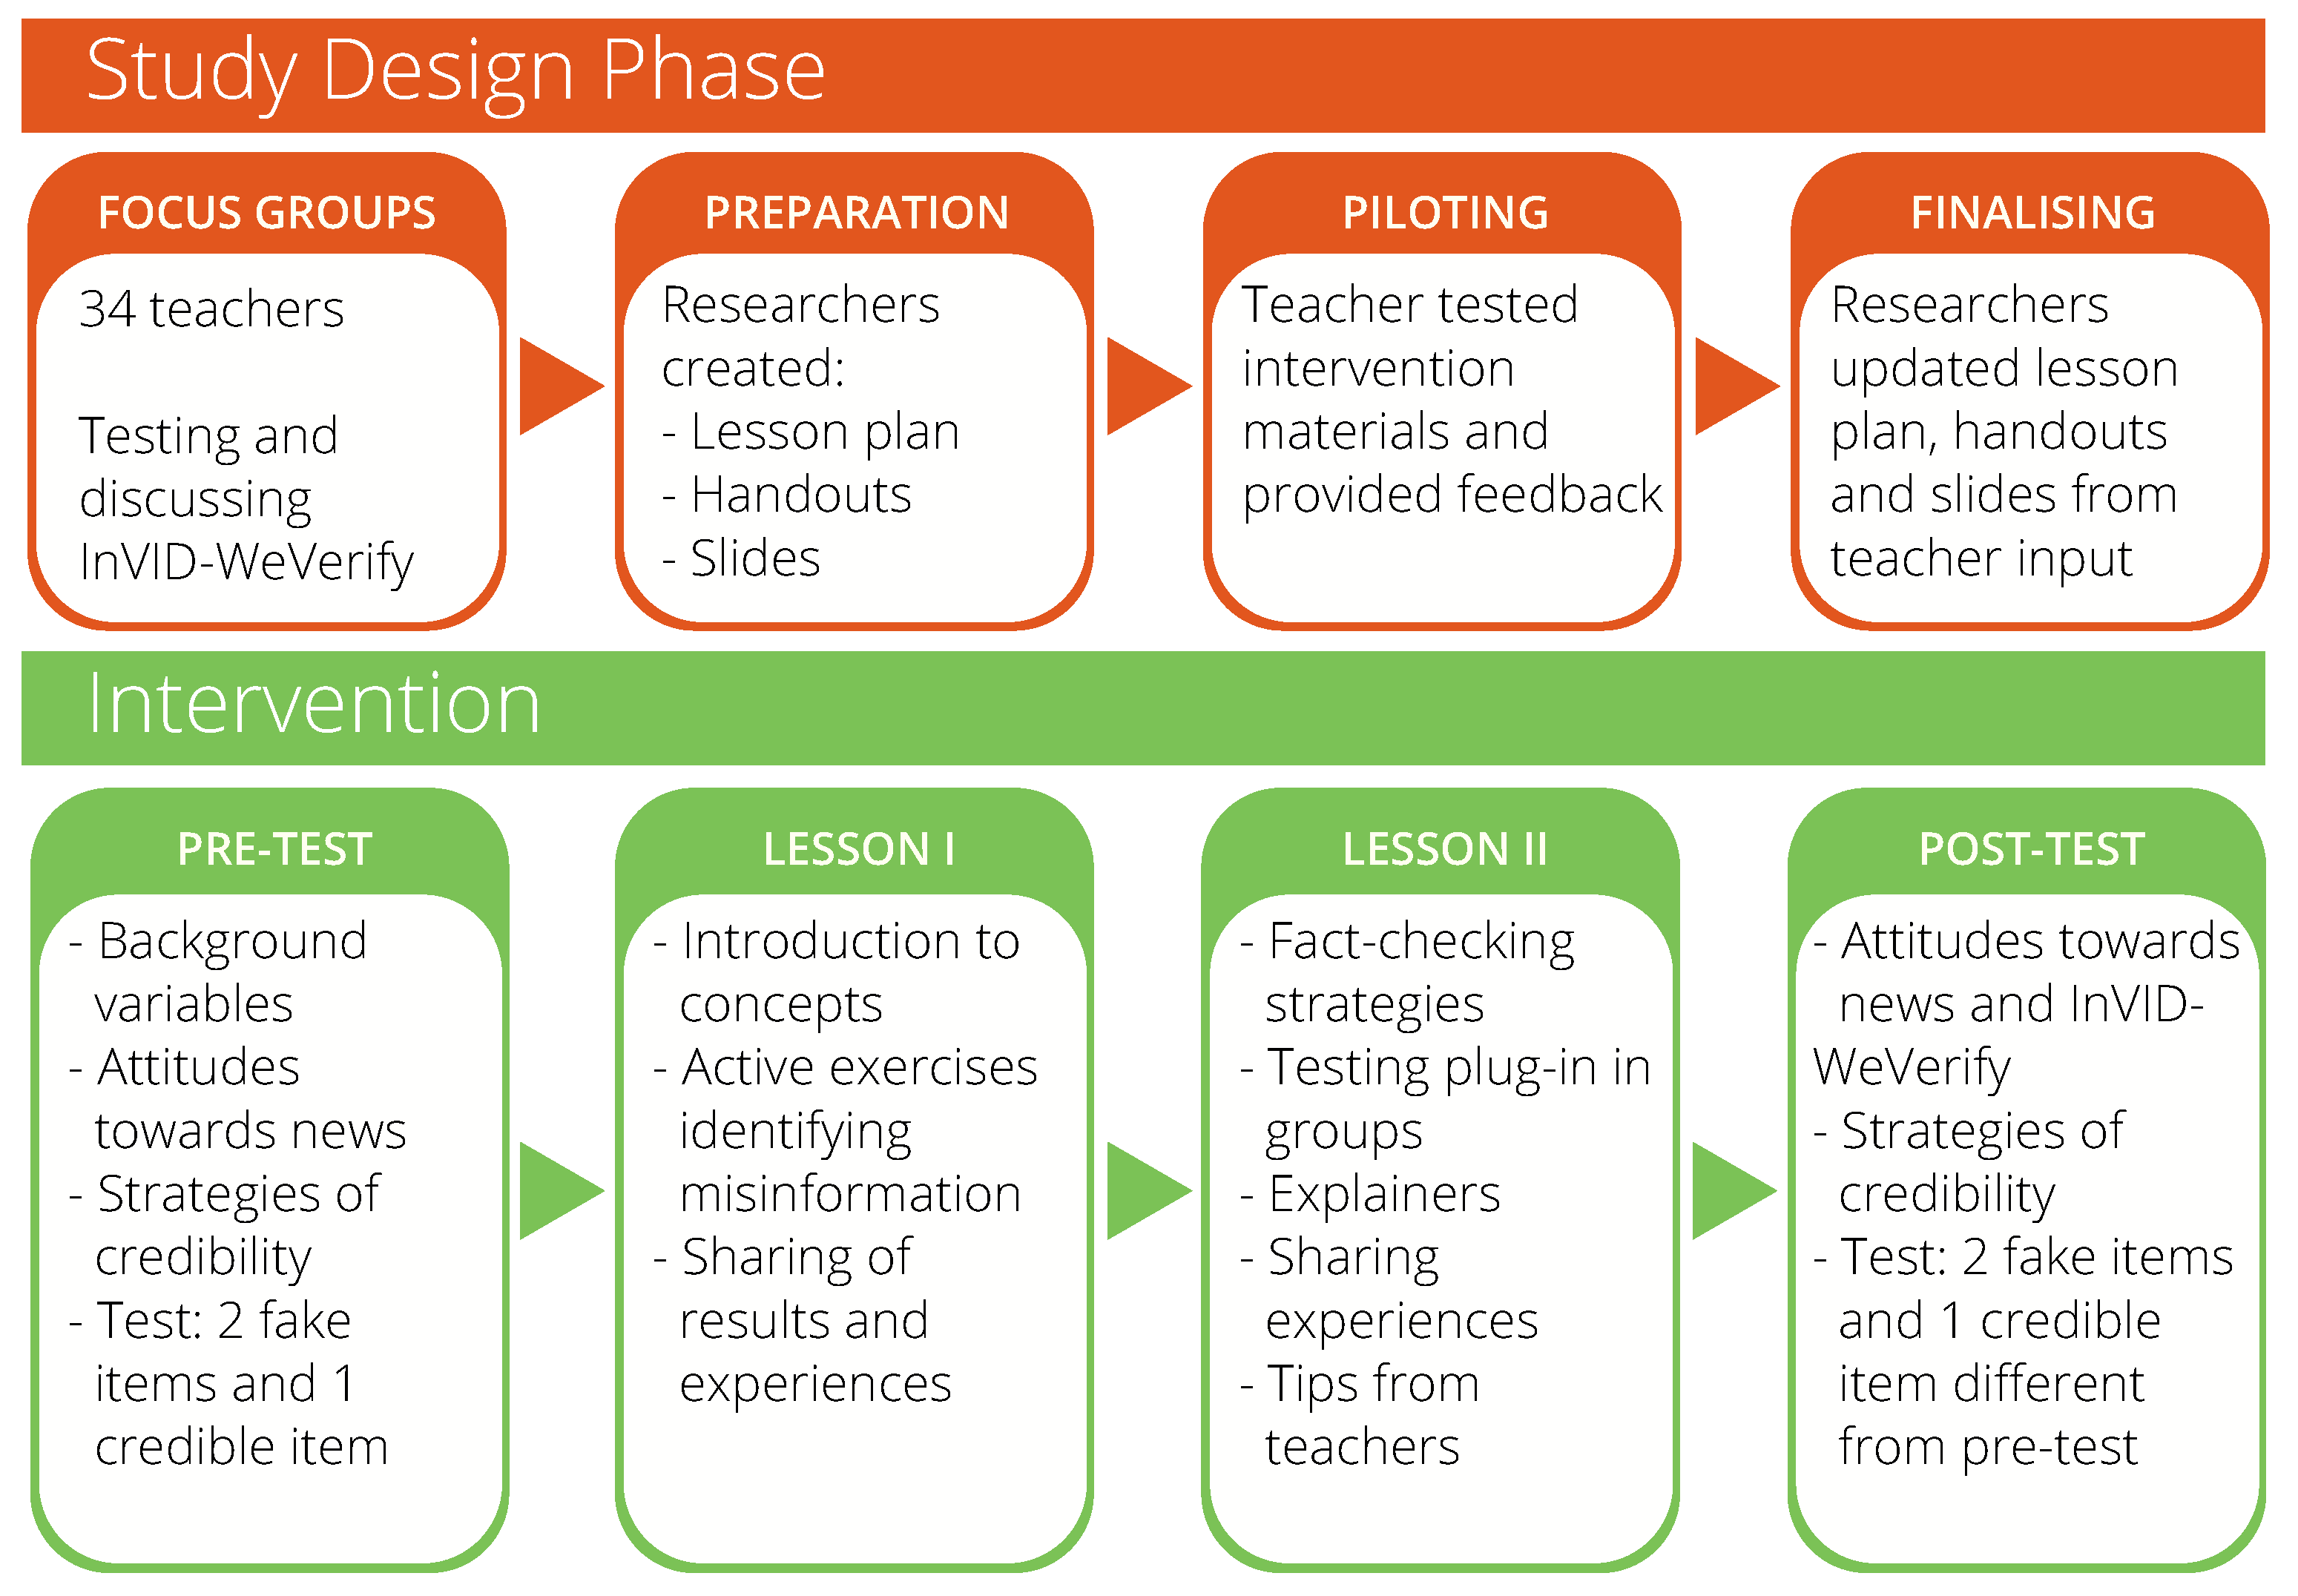
2.3. Procedure
2.4. Design
2.5. Analysis
3. Results
3.1. Performance Test
3.2. Differences in Pre- and Post-Test Scores in Relation to Use of Digital Tools and Language
3.3. Post-Test Scores on True and False Items When Using Digital Tools
3.4. Attitudes
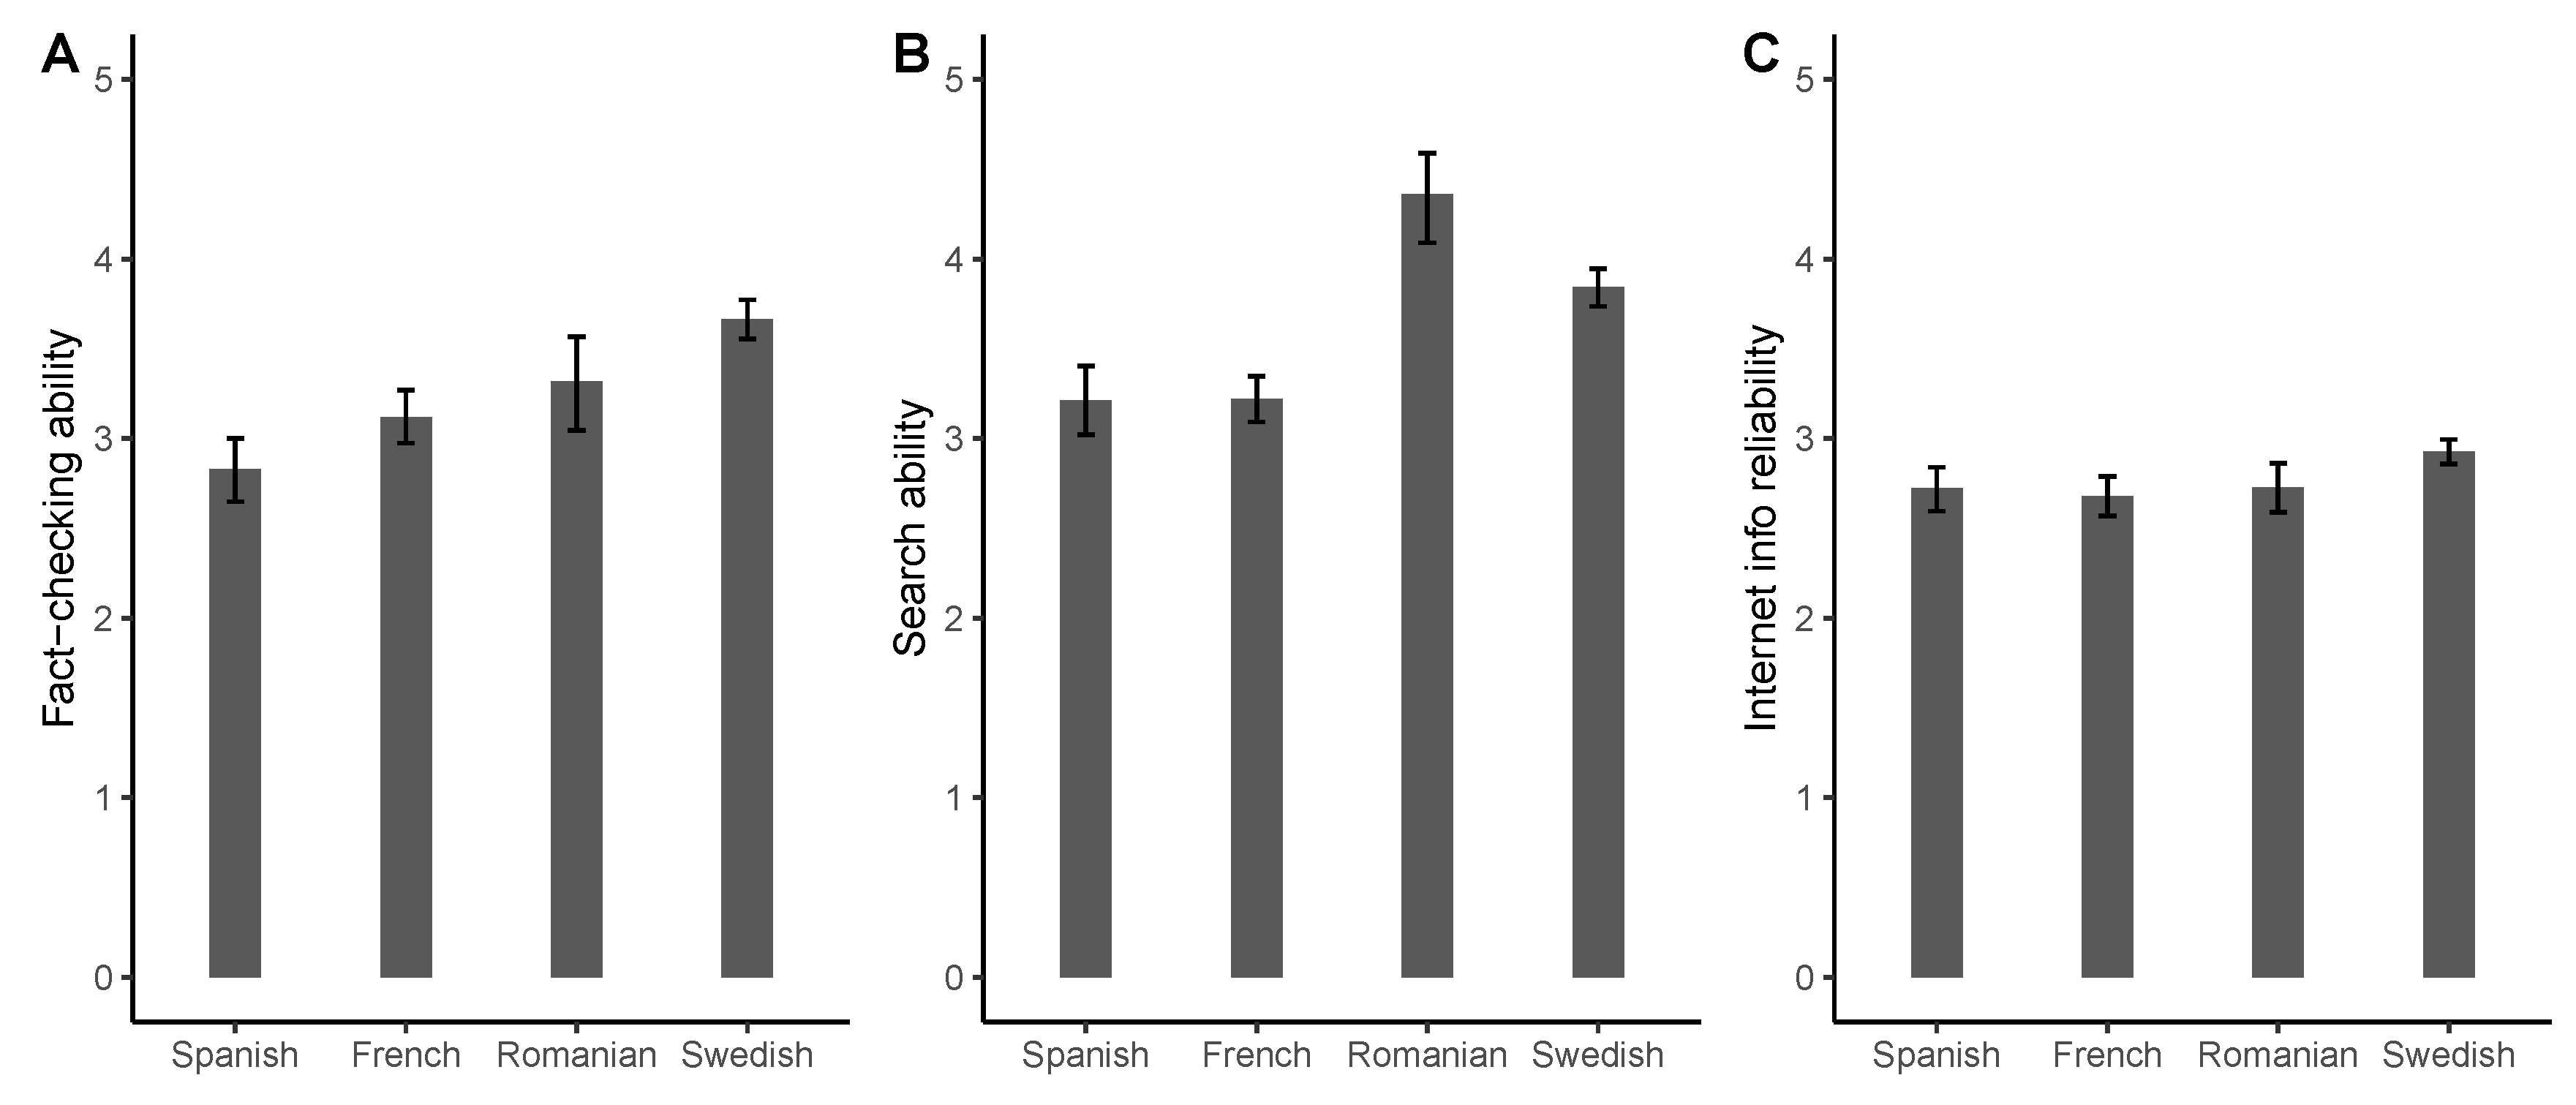
3.5. Self-Rated Attitudes and Skills
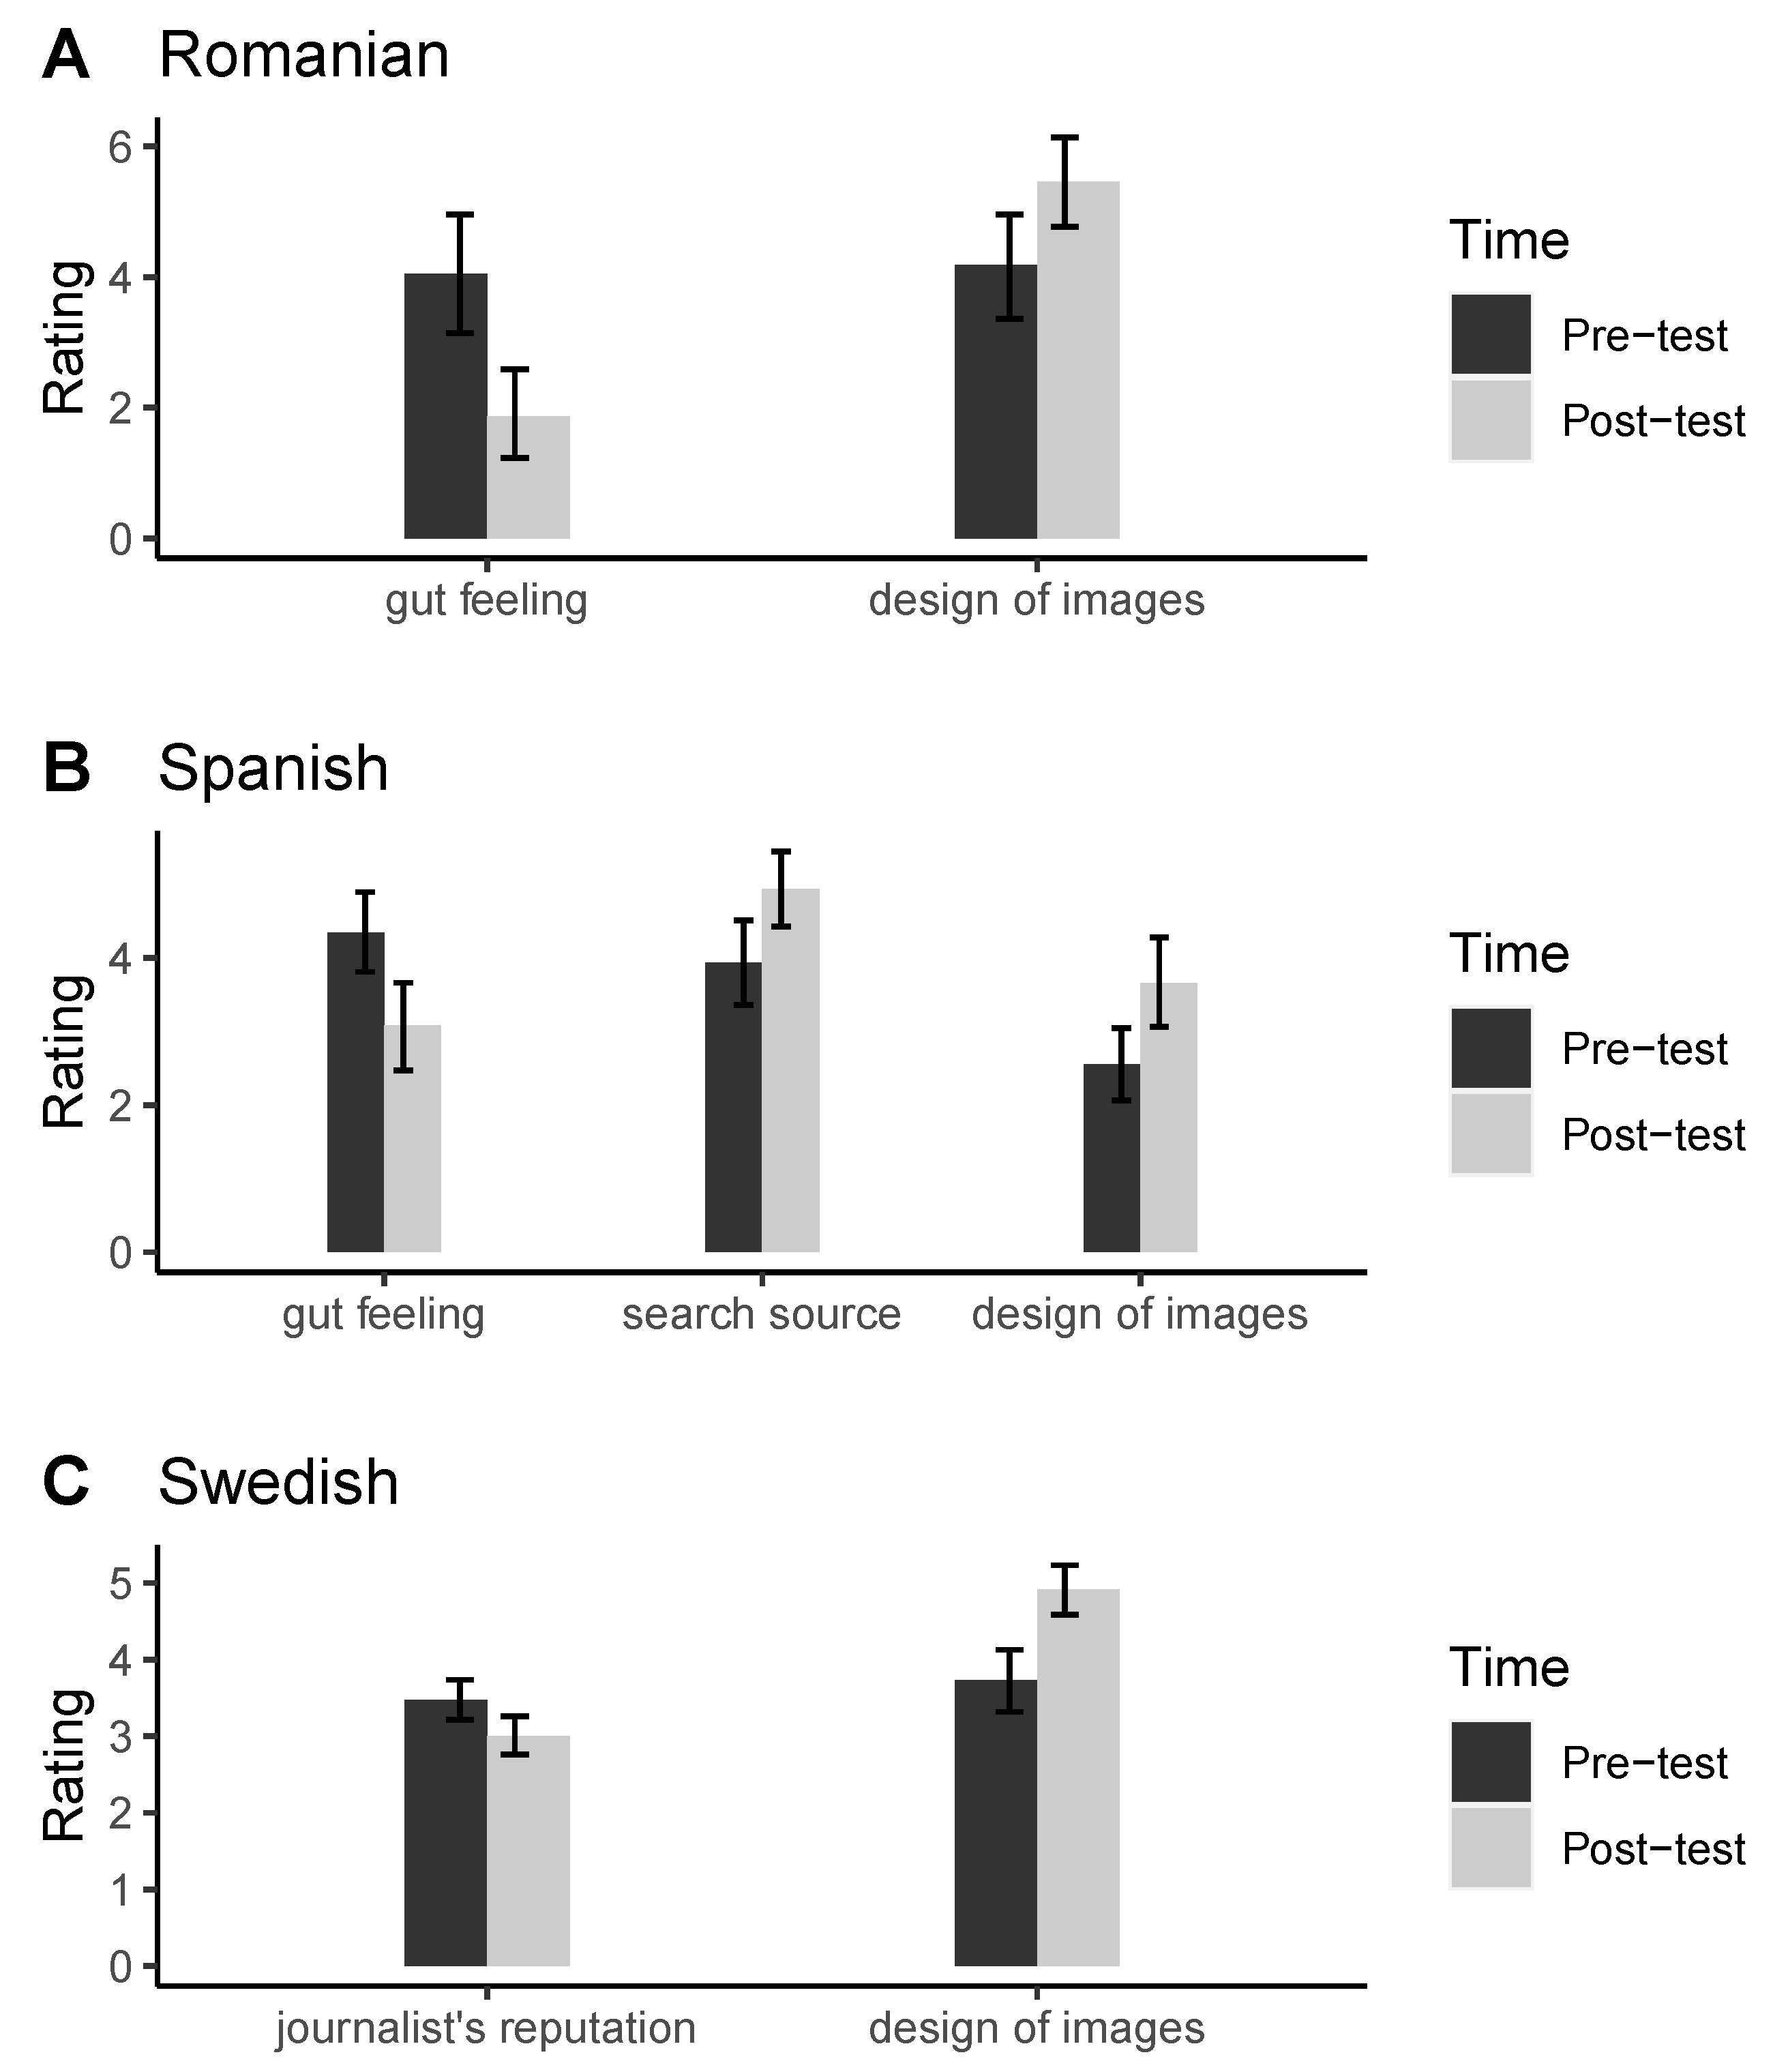
3.6. News Evaluation Ratings
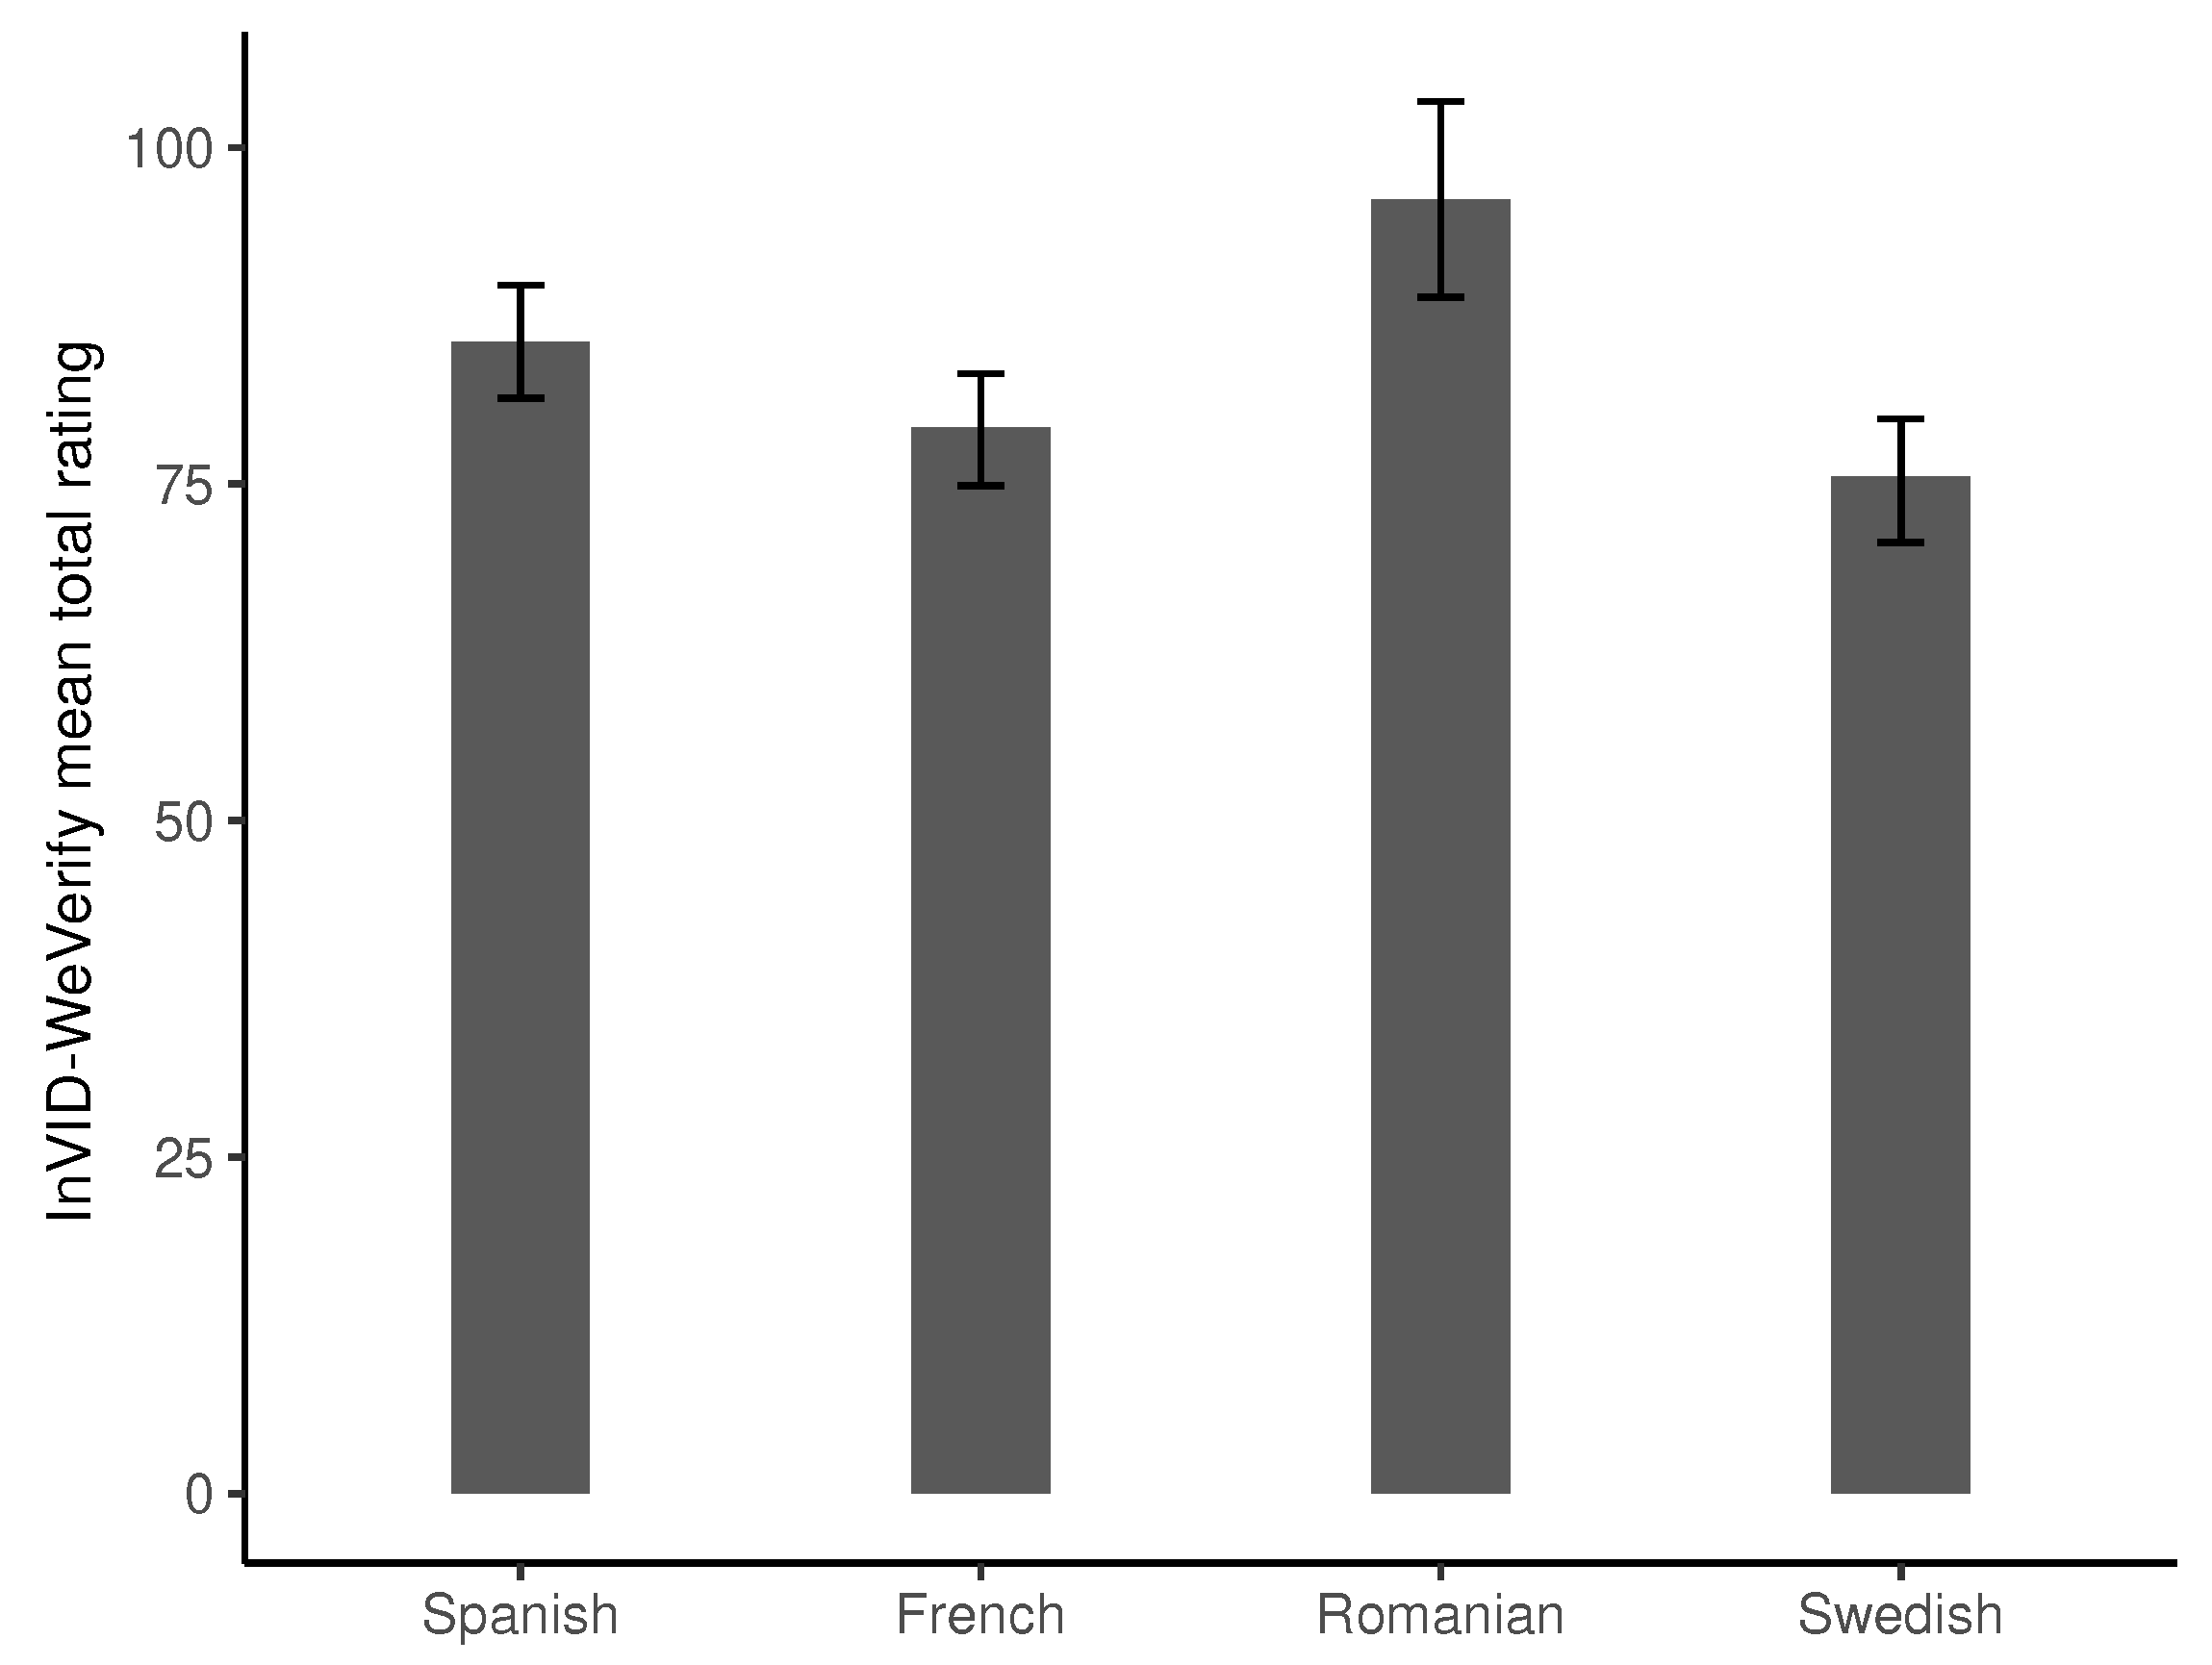
3.7. InVID-WeVerify Ratings
3.8. Teachers’ Impressions from Teaching
3.9. Summary of Results
4. Discussion
4.1. Total Performance Highlights the Importance of Technocognition and Transliteracy
4.2. Variations across Countries, Performances and Attitudes
4.3. Limitations
5. Conclusions
Author Contributions
Funding
Institutional Review Board Statement
Informed Consent Statement
Data Availability Statement
Acknowledgments
Conflicts of Interest
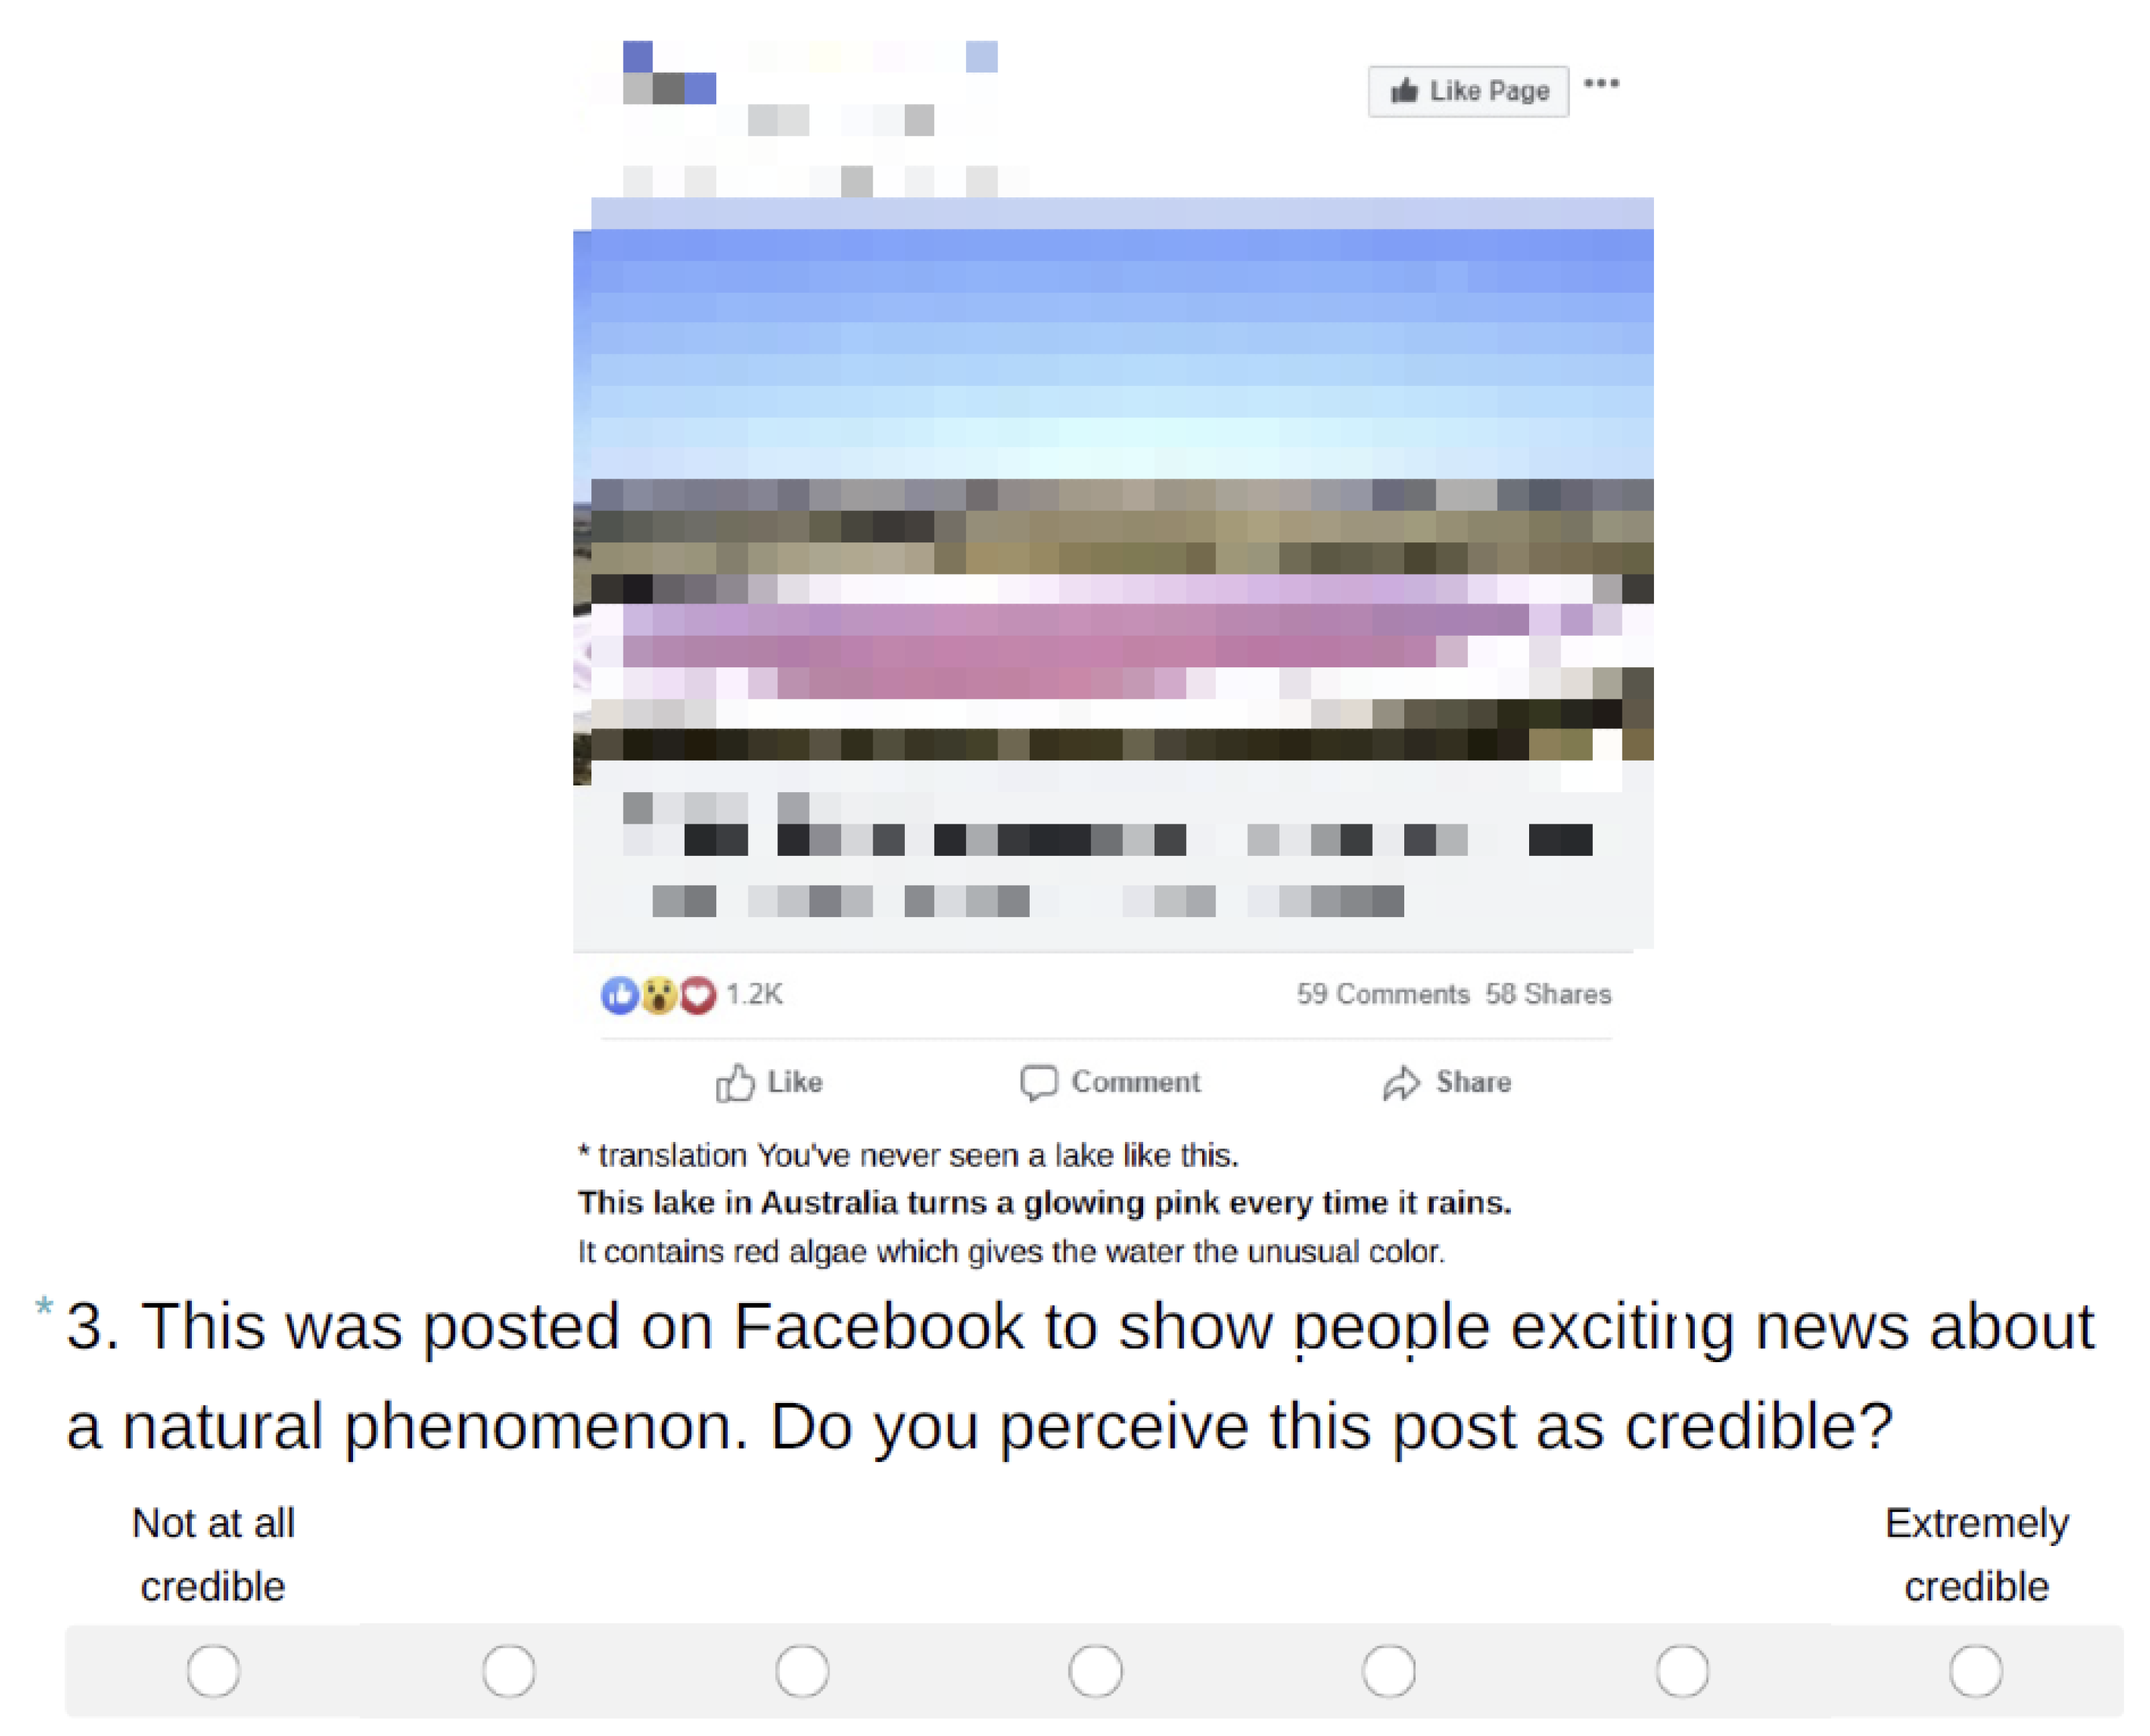
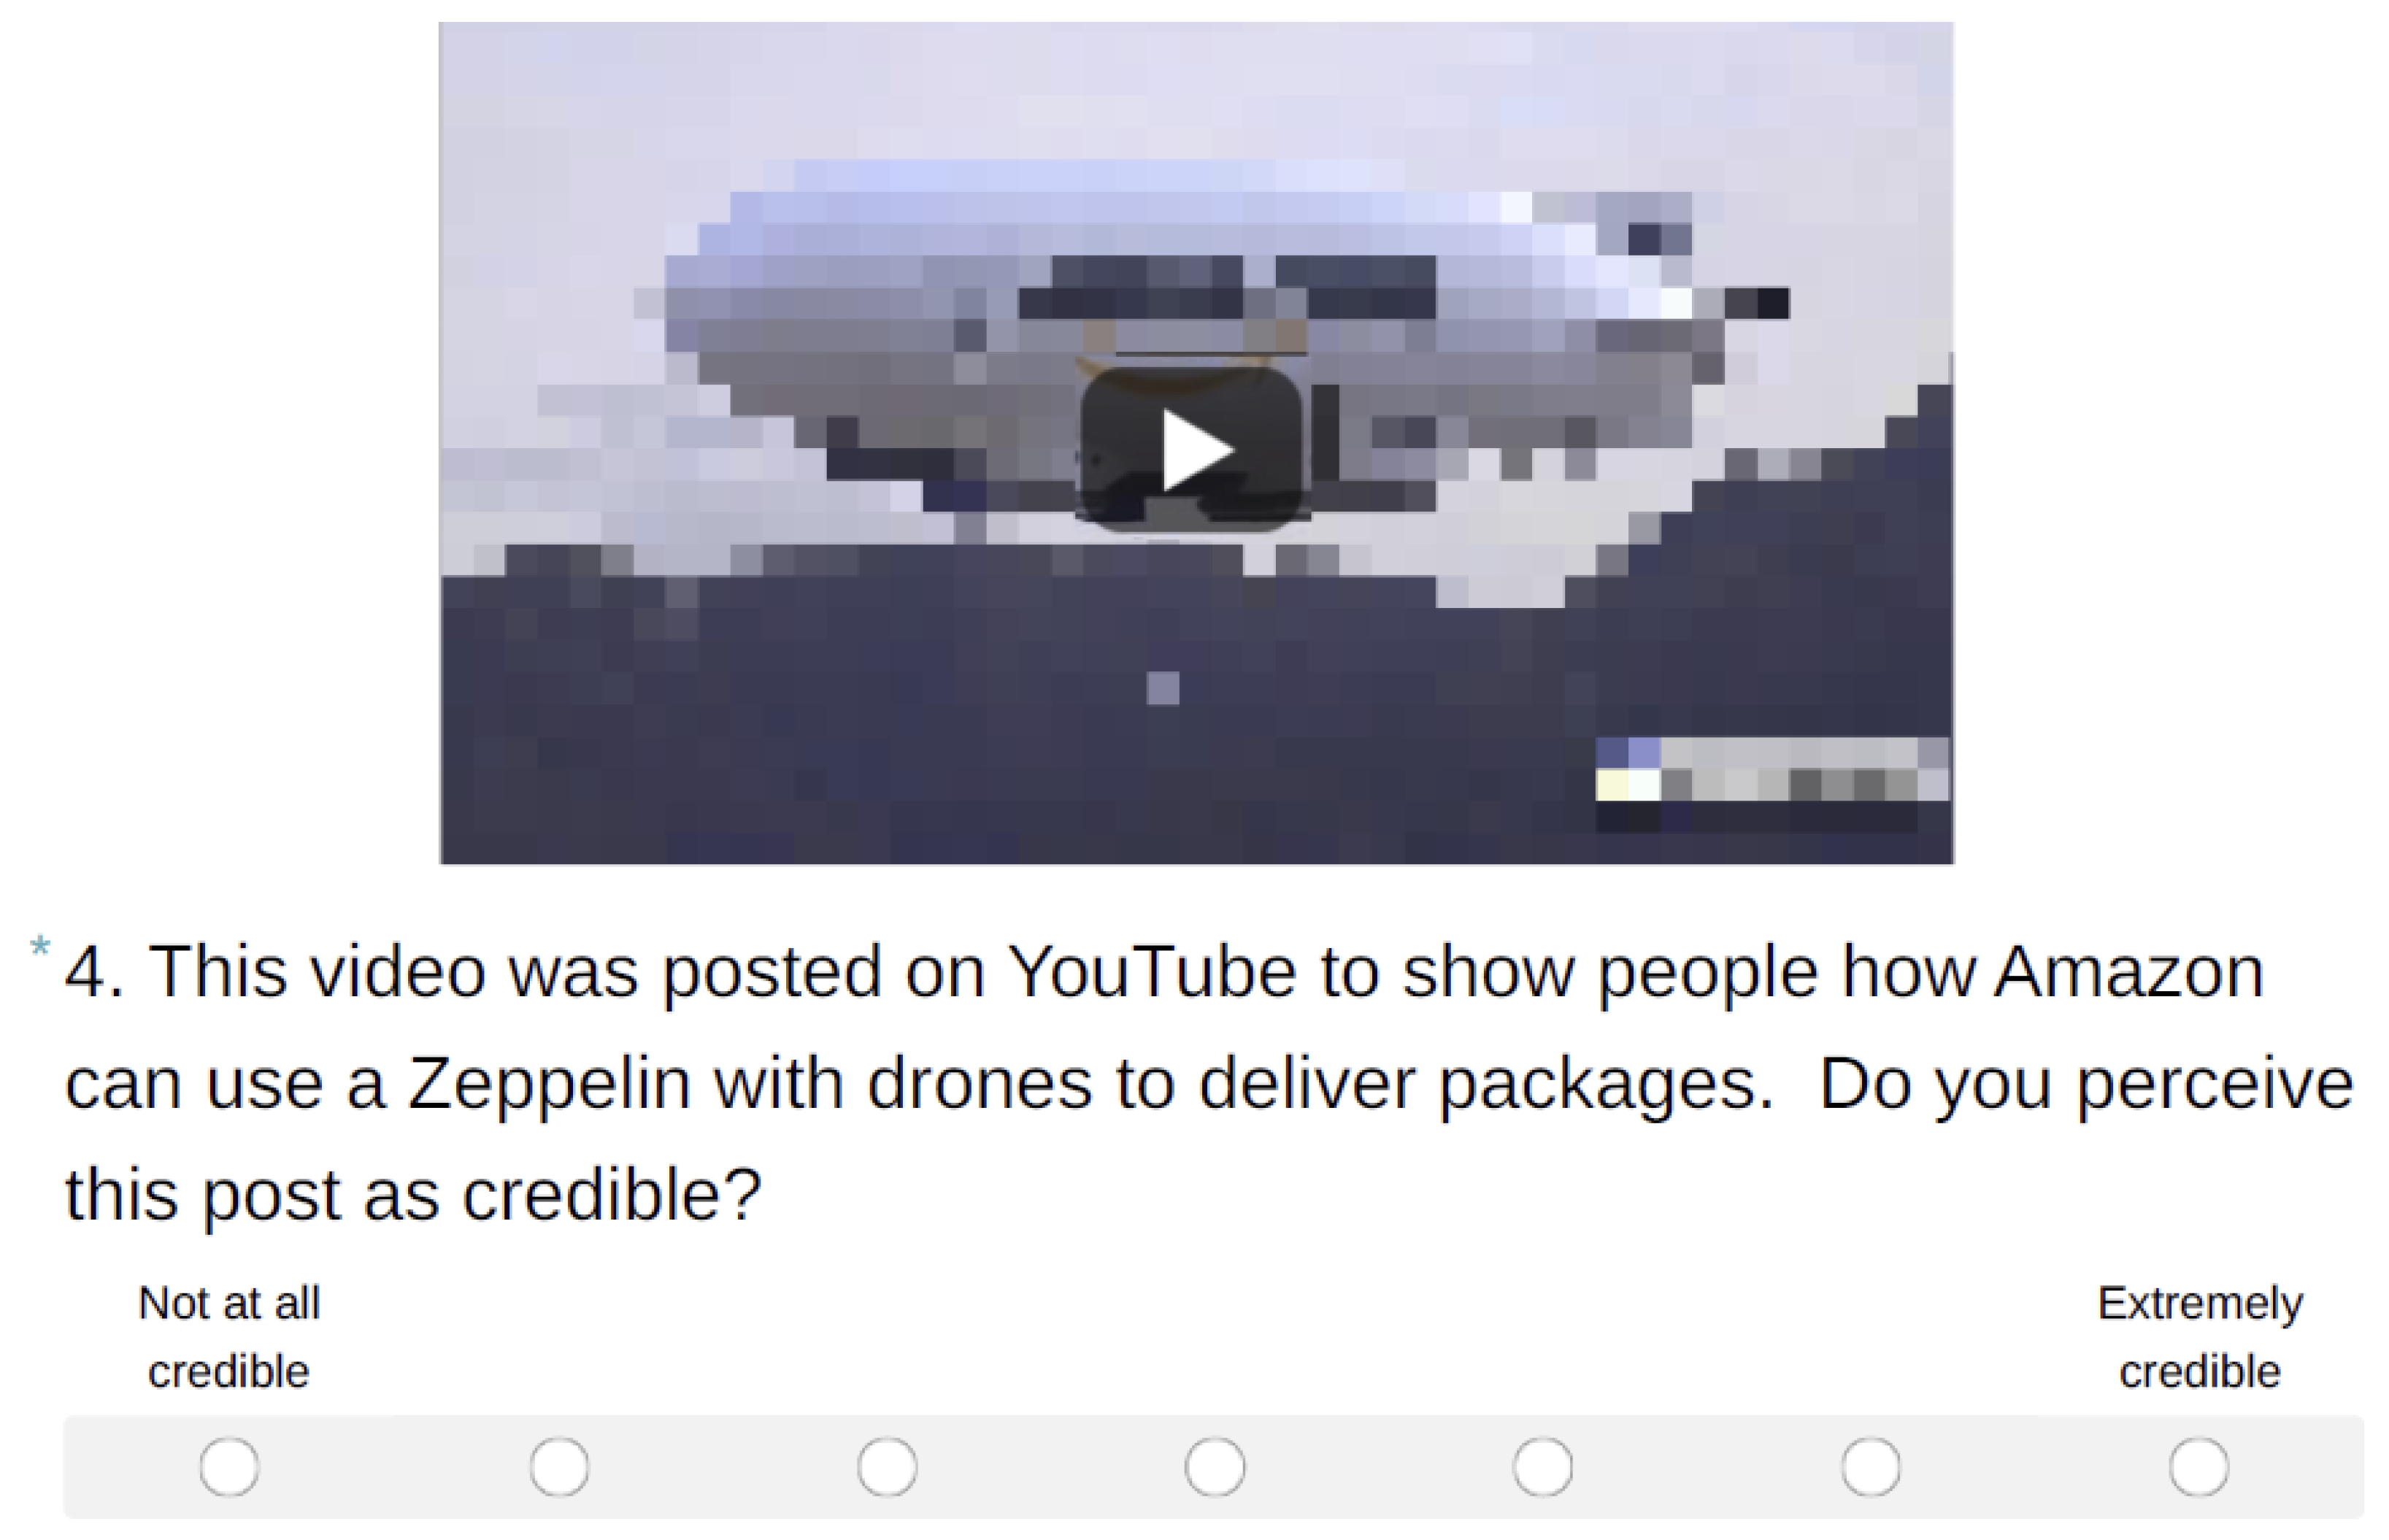
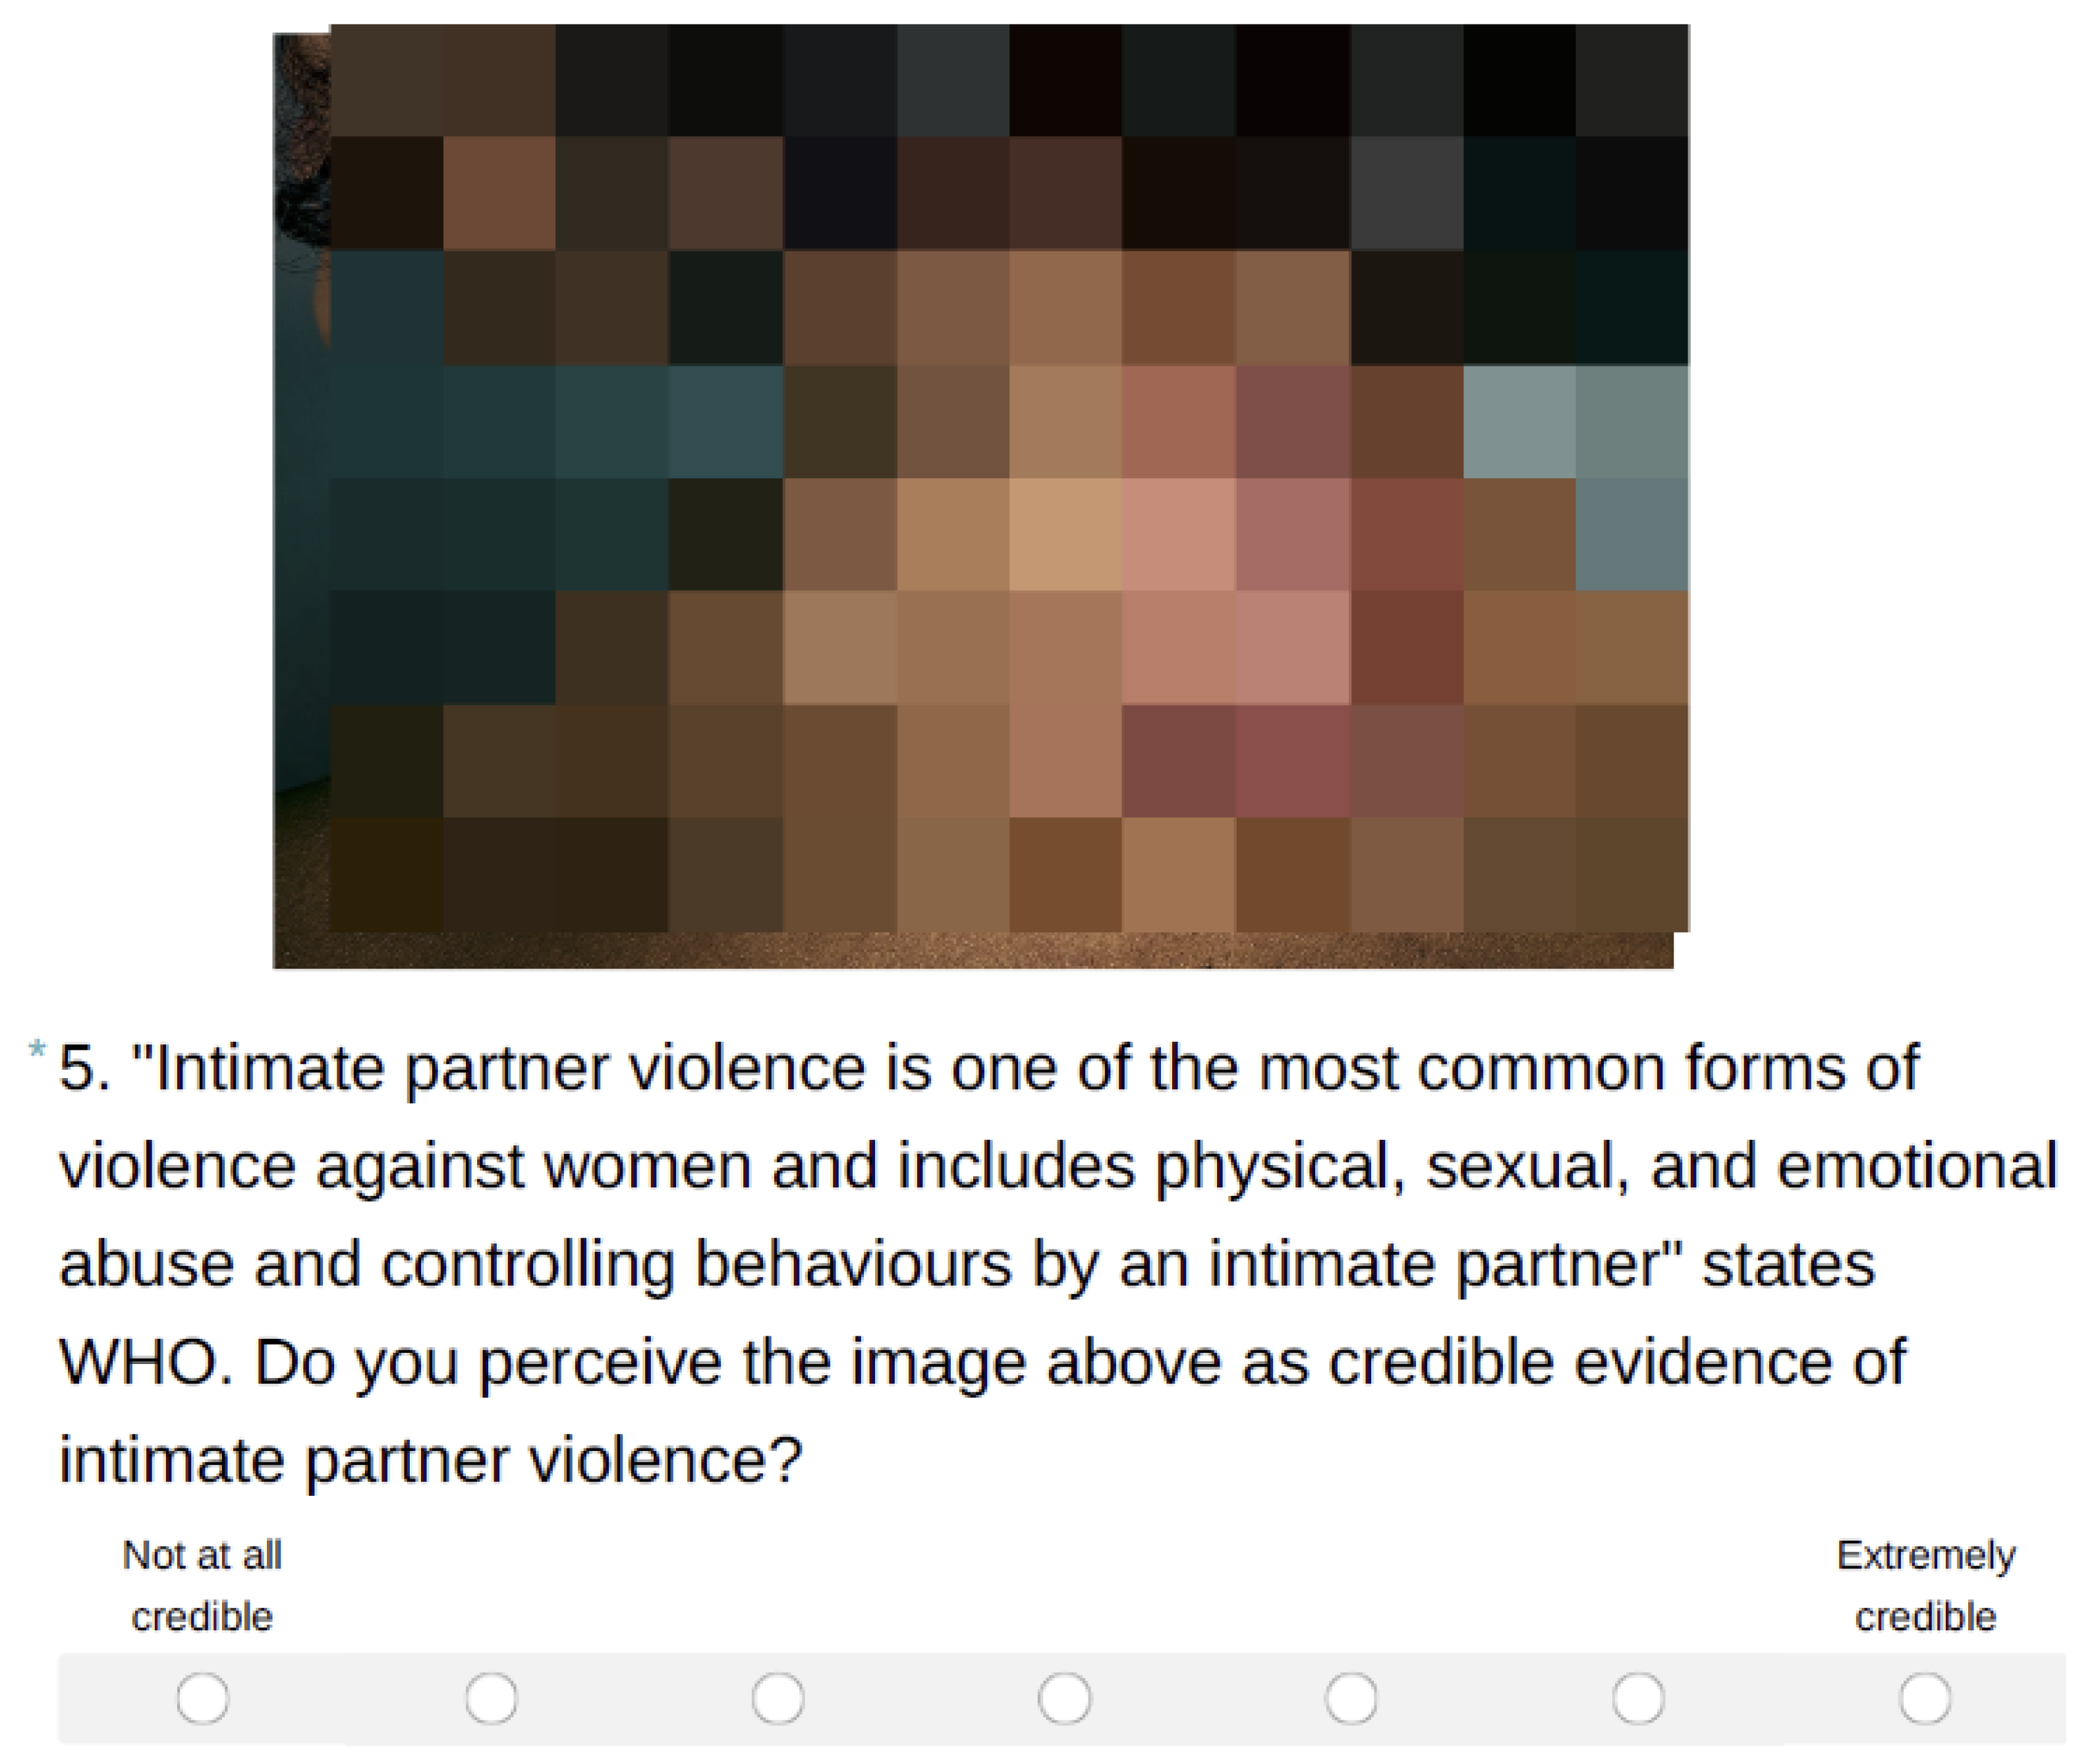
Appendix A. Examples of Test-Items


Appendix B. Background and Evaluative Questions
Appendix B.1. Questions about Background, Attitudes towards Digital News, Perceptions of Credibility and Digital Fact-Checking Tools
- What is your gender? (Man/Woman/Non-binary/Other alternative/Unsure/Prefer not to answer)
- Do you follow news in multiple languages? (Yes/No)
- How skilled are you at finding information online? (Very good—Very poor)
- How skilled are you at critically evaluating online information? (Very good—Very poor)
- How much of the information on the internet do you perceive as credible? (None—All)
- How important is it for you to consume credible news? (Not at all important—Very important)
- How do you discern factually correct information from information that is false? Please evaluate each of the following statements, on a scale from 1 (never) to 7 (very often)
- I rely on journalist’s reputation
- I rely on news source/brand’s reputation
- I search for the source of the information
- I compare different news sources to corroborate the facts
- I consult factchecking websites in case of doubt
- I check that the design of images and/or videos have good quality
- I check what people say about the story online (e.g., on blogs, social media, opinion makers’ websites)
- I rely on my own knowledge and/or expertise on the subject
- I rely on my gut feeling
- I use digital tools (reverse image search, tineye, etc.)
- I confront my impressions with friends and peers
Appendix B.2. Additional Questions after the Intervention
- 8.
- Please rate the use of InVID-WeVerify, on various dimensions, on a scale from 1 (Not at all) to 7 (Very much):
- enjoyable
- pleasing
- attractive
- friendly
- fast
- efficient
- practical
- organized
- understandable
- easy to learn
- clear
- exciting
- valuable
- motivating
- creative
- leading edge
- innovative
- 9.
- Will you use digital tools like InVID-WeVerify in the future to fact-check online information? (Definitely not—Definitely)
Appendix C. News Evaluation Attitudes

| Language | Pre | Post | ||
|---|---|---|---|---|
| French | 3.1 | 1.9 | 3.5 | 1.8 |
| Romanian | 2.9 | 2.0 | 3.1 | 2.1 |
| Spanish | 2.6 | 1.8 | 3.4 | 2.1 |
| Swedish | 3.5 | 1.4 | 3.0 | 1.4 |
| Language | Pre | Post | ||
|---|---|---|---|---|
| French | 3.6 | 1.8 | 3.4 | 2.0 |
| Romanian | 4.0 | 2.0 | 1.9 | 1.7 |
| Spanish | 4.3 | 1.9 | 3.1 | 2.3 |
| Swedish | 3.4 | 1.7 | 3.0 | 1.6 |
| Language | Pre | Post | ||
|---|---|---|---|---|
| French | 5.0 | 1.8 | 4.5 | 1.7 |
| Romanian | 4.4 | 1.8 | 4.1 | 1.8 |
| Spanish | 4.9 | 1.6 | 4.8 | 1.6 |
| Swedish | 3.8 | 2.0 | 4.1 | 1.9 |
| Language | Pre | Post | ||
|---|---|---|---|---|
| French | 5.0 | 1.6 | 4.4 | 2.0 |
| Romanian | 4.8 | 1.9 | 4.9 | 1.8 |
| Spanish | 5.0 | 1.9 | 5.3 | 1.6 |
| Swedish | 4.3 | 1.7 | 4.4 | 1.5 |
| Language | Pre | Post | ||
|---|---|---|---|---|
| French | 4.6 | 1.9 | 4.5 | 2.0 |
| Romanian | 5.2 | 1.7 | 5.7 | 1.3 |
| Spanish | 3.9 | 2.1 | 4.9 | 1.8 |
| Swedish | 4.5 | 1.7 | 4.4 | 1.8 |
| Language | Pre | Post | ||
|---|---|---|---|---|
| French | 4.5 | 1.7 | 4.4 | 1.9 |
| Romanian | 5.3 | 1.8 | 5.7 | 1.6 |
| Spanish | 4.5 | 2.0 | 5.0 | 1.8 |
| Swedish | 5.3 | 1.7 | 5.4 | 1.5 |
| Language | Pre | Post | ||
|---|---|---|---|---|
| French | 2.6 | 1.8 | 3.1 | 1.9 |
| Romanian | 4.2 | 2.1 | 5.5 | 1.7 |
| Spanish | 2.6 | 1.8 | 3.7 | 2.1 |
| Swedish | 3.7 | 2.1 | 4.9 | 1.7 |
| Language | Pre | Post | ||
|---|---|---|---|---|
| French | 4.2 | 1.8 | 4.6 | 1.8 |
| Romanian | 5.3 | 1.5 | 5.5 | 1.7 |
| Spanish | 4.3 | 1.8 | 5.0 | 1.7 |
| Swedish | 4.2 | 1.8 | 4.1 | 2.0 |
| Language | Pre | Post | ||
|---|---|---|---|---|
| French | 4.4 | 1.6 | 4.4 | 1.8 |
| Romanian | 4.6 | 1.9 | 4.9 | 1.9 |
| Spanish | 3.8 | 1.8 | 3.8 | 1.7 |
| Swedish | 4.6 | 1.7 | 4.5 | 1.6 |
| Language | Pre | Post | ||
|---|---|---|---|---|
| French | 4.6 | 1.7 | 4.5 | 1.5 |
| Romanian | 4.5 | 1.7 | 4.0 | 2.2 |
| Spanish | 4.9 | 1.5 | 4.8 | 1.7 |
| Swedish | 4.2 | 1.9 | 4.4 | 1.8 |
| Language | Pre | Post | ||
|---|---|---|---|---|
| French | 2.8 | 1.7 | 2.7 | 2.0 |
| Romanian | 2.9 | 1.8 | 3.2 | 2.2 |
| Spanish | 2.8 | 1.9 | 2.4 | 2.0 |
| Swedish | 2.6 | 1.5 | 2.5 | 1.4 |
| Attitude | French | Romanian | Spanish | Swedish | ||||
|---|---|---|---|---|---|---|---|---|
| Appealing | 4.8 | 1.4 | 5.8 | 1.2 | 4.8 | 1.5 | 4.3 | 1.6 |
| Clear | 4.6 | 1.5 | 5.6 | 1.4 | 4.4 | 1.6 | 4.5 | 1.7 |
| Creative | 4.4 | 1.6 | 5.4 | 1.6 | 5.4 | 1.2 | 4.3 | 1.6 |
| Cutting edge | 4.5 | 1.5 | 5.4 | 1.4 | 5.8 | 1.2 | 4.4 | 1.5 |
| Easily learned | 4.5 | 1.5 | 5.7 | 1.3 | 5.1 | 1.7 | 4.5 | 1.7 |
| Efficient | 5.4 | 1.4 | 5.7 | 1.4 | 5.6 | 1.3 | 5.0 | 1.6 |
| Elegant | 4.0 | 1.5 | 5.7 | 1.4 | 4.7 | 1.5 | 4.0 | 1.5 |
| Exciting | 4.3 | 1.6 | 4.5 | 2.0 | 4.4 | 1.8 | 4.0 | 1.7 |
| Fast | 4.9 | 1.4 | 5.8 | 1.4 | 5.1 | 1.5 | 4.8 | 1.7 |
| Friendly | 4.5 | 1.6 | 5.7 | 1.2 | 4.4 | 1.9 | 4.5 | 1.5 |
| Innovative | 5.3 | 1.5 | 6.0 | 1.3 | 6.0 | 1.0 | 4.3 | 1.7 |
| Motivating | 3.9 | 1.6 | 4.6 | 1.8 | 4.3 | 1.8 | 3.8 | 1.6 |
| Practical | 5.1 | 1.4 | 5.8 | 1.5 | 5.7 | 1.5 | 5.1 | 1.6 |
| Simple | 4.4 | 1.3 | 5.9 | 1.3 | 4.9 | 1.6 | 4.5 | 1.7 |
| Unambiguous | 4.6 | 1.5 | 5.7 | 1.4 | 4.6 | 1.6 | 4.3 | 1.7 |
| Unorganised | 4.9 | 1.5 | 6.1 | 1.0 | 4.9 | 1.7 | 4.5 | 1.6 |
| Valuable | 5.1 | 1.6 | 5.4 | 1.6 | 5.7 | 1.5 | 4.9 | 1.6 |
| Effect | F | p | Partial | |||
|---|---|---|---|---|---|---|
| Use of digital tools (1) | 87 | 1 | ||||
| Language (2) | 44 | 3 | ||||
| Error (subject) | 229 | |||||
| Time (3) | 116 | 1 | ||||
| 14 | 1 | |||||
| 54 | 3 | |||||
| Error | 229 |
References
- European Commission. Action Plan against Disinformation: Joint Communication to the European Parliament, the European Council, the Council, the European Economic and Social Committee and the Committee of the Regions. 2018. JOIN/2018/36 Final. Available online: https://op.europa.eu/en/publication-detail/-/publication/8a94fd8f-8e92-11e9-9369-01aa75ed71a1/language-en (accessed on 30 April 2021).
- World Health Organization. Responding to Community Spread of COVID-19: Interim Guidance, 7 March 2020; World Health Organization: Geneva, Switzerland, 2020. [Google Scholar]
- Wardle, C.; Derakhshan, H. Information Disorder: Toward an Interdisciplinary Framework for Research and Policy Making. 2017. DGI(2017)09. Available online: http://tverezo.info/wp-content/uploads/2017/11/PREMS-162317-GBR-2018-Report-desinformation-A4-BAT.pdf (accessed on 30 April 2021).
- García Lozano, M.; Brynielsson, J.; Franke, U.; Rosell, M.; Tjörnhammar, E.; Varga, S.; Vlassov, V. Veracity assessment of online data. Decis. Support Syst. 2020, 129, 113132. [Google Scholar] [CrossRef]
- Hussain, S.; Neekhara, P.; Jere, M.; Koushanfar, F.; McAuley, J. Adversarial deepfakes: Evaluating vulnerability of deepfake detectors to adversarial examples. In Proceedings of the IEEE/CVF Winter Conference on Applications of Computer Vision, Waikola, HI, USA, 5–9 January 2021; pp. 3348–3357. [Google Scholar]
- Scott, M. Facebook’s private groups are abuzz with coronavirus fake news. Politico, 30 March 2020. [Google Scholar]
- Guess, A.M.; Lerner, M.; Lyons, B.; Montgomery, J.M.; Nyhan, B.; Reifler, J.; Sircar, N. A digital media literacy intervention increases discernment between mainstream and false news in the United States and India. Proc. Natl. Acad. Sci. USA 2020, 117, 15536. [Google Scholar] [CrossRef] [PubMed]
- Lewandowsky, S.; Ecker, U.K.H.; Cook, J. Beyond Misinformation: Understanding and Coping with the “Post-Truth” Era. J. Appl. Res. Mem. Cogn. 2017, 6, 353–369. [Google Scholar] [CrossRef] [Green Version]
- Wineburg, S.; McGrew, S. Lateral Reading and the Nature of Expertise: Reading Less and Learning More When Evaluating Digital Information. Teach. Coll. Rec. 2019, 121, 1–40. [Google Scholar]
- Kim, H.; Garrido, P.; Tewari, A.; Xu, W.; Thies, J.; Niessner, M.; Pérez, P.; Richardt, C.; Zollhöfer, M.; Theobalt, C. Deep video portraits. ACM Trans. Graph. 2018, 37, 1–14. [Google Scholar] [CrossRef]
- Shen, C.; Kasra, M.; Pan, W.; Bassett, G.A.; Malloch, Y.; O’Brien, J.F. Fake images: The effects of source, intermediary, and digital media literacy on contextual assessment of image credibility online. N. Media Soc. 2019, 21, 438–463. [Google Scholar] [CrossRef]
- Breakstone, J.; Smith, M.; Wineburg, S.; Rapaport, A.; Carle, J.; Garland, M.; Saavedra, A. Students’ Civic Online Reasoning: A National Portrait; Stanford History Education Group & Gibson Consulting: Stanford, CA, USA, 2019; Available online: https://purl.stanford.edu/gf151tb4868 (accessed on 30 April 2021).
- Nygren, T.; Guath, M. Swedish teenagers’ difficulties and abilities to determine digital news credibility. Nord. Rev. 2019, 40, 23–42. [Google Scholar] [CrossRef] [Green Version]
- Nygren, T.; Guath, M. Students Evaluating and Corroborating Digital News. Scand. J. Educ. Res. 2021, 1–17. [Google Scholar] [CrossRef]
- Frau-Meigs, D. Transliteracy: Sense-making mechanisms for establishing e-presence. In Media and Information Literacy and Intercultural Dialogue; Hope Culver, S., Carlsson, U., Eds.; Nordicom: Gothenburg, Sweden, 2013; pp. 175–189. [Google Scholar]
- Axelsson, C.A.W.; Guath, M.; Nygren, T. Learning How to Separate Fake From Real News: Scalable Digital Tutorials Promoting Students’ Civic Online Reasoning. Future Internet 2021, 13, 60. [Google Scholar] [CrossRef]
- Ku, K.Y.; Kong, Q.; Song, Y.; Deng, L.; Kang, Y.; Hu, A. What predicts adolescents’ critical thinking about real-life news? The roles of social media news consumption and news media literacy. Think. Skills Creat. 2019, 33, 100570. [Google Scholar] [CrossRef]
- McGrew, S.; Breakstone, J.; Ortega, T.; Smith, M.; Wineburg, S. Can students evaluate online sources? Learning from assessments of civic online reasoning. Theory Res. Soc. Educ. 2018, 46, 1–29. [Google Scholar] [CrossRef]
- Porat, E.; Blau, I.; Barak, A. Measuring digital literacies: Junior high-school students’ perceived competencies versus actual performance. Comput. Educ. 2018, 126, 23–36. [Google Scholar] [CrossRef]
- McGrew, S. Learning to evaluate: An intervention in civic online reasoning. Comput. Educ. 2020, 145, 103711. [Google Scholar] [CrossRef]
- McGrew, S.; Byrne, V.L. Who Is behind this? Preparing high school students to evaluate online content. J. Res. Technol. Educ. 2020, 1–19. [Google Scholar] [CrossRef]
- Hargittai, E. Second-level digital divide: Mapping differences in people’s online skills. arXiv 2001, arXiv:cs/0109068. [Google Scholar] [CrossRef]
- Hargittai, E. Digital na(t)ives? Variation in internet skills and uses among members of the “net generation”. Sociol. Inq. 2010, 80, 92–113. [Google Scholar] [CrossRef]
- Hargittai, E.; Hinnant, A. Digital inequality: Differences in young adults’ use of the Internet. Commun. Res. 2008, 35, 602–621. [Google Scholar] [CrossRef] [Green Version]
- Van Dijk, J. The Digital Divide; Polity Press: Cambridge, UK, 2020. [Google Scholar]
- Van Deursen, A.J.; Van Dijk, J.A. The digital divide shifts to differences in usage. N. Media Soc. 2014, 16, 507–526. [Google Scholar] [CrossRef]
- Hatlevik, O.E.; Ottestad, G.; Throndsen, I. Predictors of digital competence in 7th grade: A multilevel analysis. J. Comput. Assist. Learn. 2015, 31, 220–231. [Google Scholar] [CrossRef]
- Nygren, T.; Wiksten Folkeryd, J.; Liberg, C.; Guath, M. Students Assessing Digital News and Misinformation. In Disinformation in Open Online Media; van Duijn, M., Preuss, M., Spaiser, V., Takes, F., Verberne, S., Eds.; Springer International Publishing: Leiden, The Netherlands, 2020; pp. 63–79. [Google Scholar]
- Sundar, S.S.; Knobloch-Westerwick, S.; Hastall, M.R. News cues: Information scent and cognitive heuristics. J. Am. Soc. Inf. Sci. Technol. 2007, 58, 366–378. [Google Scholar] [CrossRef]
- Roozenbeek, J.; van der Linden, S. Fake news game confers psychological resistance against online misinformation. Palgrave Commun. 2019, 5, 1–10. [Google Scholar] [CrossRef] [Green Version]
- Breakstone, J.; Smith, M.; Connors, P.; Ortega, T.; Kerr, D.; Wineburg, S. Lateral reading: College students learn to critically evaluate internet sources in an online course. Harv. Kennedy Sch. Misinf. Rev. 2021. Available online: https://misinforeview.hks.harvard.edu/article/lateral-reading-college-students-learn-to-critically-evaluate-internet-sources-in-an-online-course/ (accessed on 30 April 2021).
- Bontcheva, K. WeVerify Technology Helps Fight Coronavirus Misinformation. 2020. Available online: https://weverify.eu/news/weverify-technology-helps-fight-coronavirus-misinformation/ (accessed on 30 April 2021).
- Carlsson, U. Understanding Media and Information Literacy (MIL) in the Digital Age: A Question of Democracy; University of Gothenburg: Gothenburg, Sweden, 2019. [Google Scholar]
- Koltay, T. The media and the literacies: Media literacy, information literacy, digital literacy. Media Cult. Soc. 2011, 33, 211–221. [Google Scholar] [CrossRef]
- Tibor, K. New media and literacies: Amateurs vs. Professionals. First Monday 2011, 16. Available online: https://journals.uic.edu/ojs/index.php/fm/article/download/3206/2748 (accessed on 30 April 2021).
- Eshet, Y. Digital literacy: A conceptual framework for survival skills in the digital era. J. Educ. Multimed. Hypermedia 2004, 13, 93–106. [Google Scholar]
- Aufderheide, P. Media Literacy; A Report of the National Leadership Conference on Media Literacy; ERIC: Washington, DC, USA, 1993. [Google Scholar]
- Hobbs, R. Digital and Media Literacy: A Plan of Action; A White Paper on the Digital and Media Literacy Recommendations of the Knight Commission on the Information Needs of Communities in a Democracy; ERIC: Washington, DC, USA, 2010. [Google Scholar]
- Livingstone, S. Media literacy and the challenge of new information and communication technologies. Commun. Rev. 2004, 7, 3–14. [Google Scholar] [CrossRef] [Green Version]
- Thomas, S.; Joseph, C.; Laccetti, J.; Mason, B.; Mills, S.; Perril, S.; Pullinger, K. Transliteracy: Crossing Divides. First Monday 2007. [Google Scholar] [CrossRef]
- Frau-Meigs, D. Transliteracy as the new research horizon for media and information literacy. Media Stud. 2012, 3, 14–27. [Google Scholar]
- McGrew, S.; Ortega, T.; Breakstone, J.; Wineburg, S. The Challenge That’s Bigger than Fake News: Civic Reasoning in a Social Media Environment. Am. Educ. 2017, 41, 4. [Google Scholar]
- Jones-Jang, S.M.; Mortensen, T.; Liu, J. Does media literacy help identification of fake news? Information literacy helps, but other literacies don’t. Am. Behav. Sci. 2021, 65, 371–388. [Google Scholar] [CrossRef]
- Roozenbeek, J.; van der Linden, S.; Nygren, T. Prebunking interventions based on ‘inoculation’ theory can reduce susceptibility to misinformation across cultures. Harv. Kennedy Sch. Misinf. Rev. 2020, 1. [Google Scholar] [CrossRef] [Green Version]
- Kahne, J.; Hodgin, E.; Eidman-Aadahl, E. Redesigning civic education for the digital age: Participatory politics and the pursuit of democratic engagement. Theory Res. Soc. Educ. 2016, 44, 1–35. [Google Scholar] [CrossRef]
- OECD. Students, Computers and Learning; Organisation for Economic Co-operation and Development: Paris, France, 2015; p. 204. [Google Scholar] [CrossRef]
- Kirschner, P.A.; De Bruyckere, P. The myths of the digital native and the multitasker. Teach. Teach. Educ. 2017, 67, 135–142. [Google Scholar] [CrossRef]
- Kirschner, P.A.; Sweller, J.; Clark, R.E. Why Minimal Guidance During Instruction Does Not Work: An Analysis of the Failure of Constructivist, Discovery, Problem-Based, Experiential, and Inquiry-Based Teaching. Educ. Psychol. 2006, 41, 75–86. [Google Scholar] [CrossRef]
- Mason, L.; Junyent, A.A.; Tornatora, M.C. Epistemic evaluation and comprehension of web-source information on controversial science-related topics: Effects of a short-term instructional intervention. Comput. Educ. 2014, 76, 143–157. [Google Scholar] [CrossRef]
- Pérez, A.; Potocki, A.; Stadtler, M.; Macedo-Rouet, M.; Paul, J.; Salmerón, L.; Rouet, J.F. Fostering teenagers’ assessment of information reliability: Effects of a classroom intervention focused on critical source dimensions. Learn. Instr. 2018, 58, 53–64. [Google Scholar] [CrossRef]
- Saye, J.W.; Brush, T. Scaffolding critical reasoning about history and social issues in multimedia-supported learning environments. Educ. Technol. Res. Dev. 2002, 50, 77–96. [Google Scholar] [CrossRef]
- Walraven, A.; Brand-Gruwel, S.; Boshuizen, H.P.A. How students evaluate information and sources when searching the World Wide Web for information. Comput. Educ. 2009, 52, 234–246. [Google Scholar] [CrossRef] [Green Version]
- McGrew, S.; Smith, M.; Breakstone, J.; Ortega, T.; Wineburg, S. Improving university students’ web savvy: An intervention study. Br. J. Educ. Psychol. 2019, 89, 485–500. [Google Scholar] [CrossRef]
- Nygren, T.; Sandberg, K.; Vikström, L. Digitala primärkällor i historieundervisningen: En utmaning för elevers historiska tänkande och historiska empati. Nordidactica J. Hum. Soc. Sci. Educ. 2014, 4, 208–245. [Google Scholar]
- Nygren, T.; Vikström, L. Treading old paths in new ways: Upper secondary students using a digital tool of the professional historian. Educ. Sci. 2013, 3, 50–73. [Google Scholar] [CrossRef] [Green Version]
- Anderson, T.; Shattuck, J. Design-based research: A decade of progress in education research? Educ. Res. 2012, 41, 16–25. [Google Scholar] [CrossRef] [Green Version]
- Shavelson, R.J.; Phillips, D.C.; Towne, L.; Feuer, M.J. On the science of education design studies. Educ. Res. 2003, 32, 25–28. [Google Scholar] [CrossRef]
- Andersson, B. Design och utvärdering av undervisningssekvenser. Forsk. Om Undervis. Och Lärande 2011, 1, 19–27. [Google Scholar]
- Edelson, D.C. Design research: What we learn when we engage in design. J. Learn. Sci. 2002, 11, 105–121. [Google Scholar] [CrossRef]
- Ormel, B.J.; Roblin, N.N.P.; McKenney, S.E.; Voogt, J.M.; Pieters, J.M. Research–practice interactions as reported in recent design studies: Still promising, still hazy. Educ. Technol. Res. Dev. 2012, 60, 967–986. [Google Scholar] [CrossRef] [Green Version]
- Akkerman, S.F.; Bronkhorst, L.H.; Zitter, I. The complexity of educational design research. Qual. Quant. 2013, 47, 421–439. [Google Scholar] [CrossRef]
- Brown, A.L. Design experiments: Theoretical and methodological challenges in creating complex interventions in classroom settings. J. Learn. Sci. 1992, 2, 141–178. [Google Scholar] [CrossRef]
- Design-Based Research Collective. Design-based research: An emerging paradigm for educational inquiry. Educ. Res. 2003, 32, 5–8. [Google Scholar] [CrossRef]
- Kelly, A. Design research in education: Yes, but is it methodological? J. Learn. Sci. 2004, 13, 115–128. [Google Scholar] [CrossRef]
- Collins, A.; Joseph, D.; Bielaczyc, K. Design research: Theoretical and methodological issues. J. Learn. Sci. 2004, 13, 15–42. [Google Scholar] [CrossRef]
- Teyssou, D.; Leung, J.M.; Apostolidis, E.; Apostolidis, K.; Papadopoulos, S.; Zampoglou, M.; Papadopoulou, O.; Mezaris, V. The InVID plug-in: Web video verification on the browser. In Proceedings of the First International Workshop on Multimedia Verification, Mountain View, CA, USA, 23–27 October 2017; pp. 23–30. [Google Scholar]
- InVID. InVID Verification Plugin. 2019. Available online: https://www.invid-project.eu/tools-and-services/invid-verification-plugin/ (accessed on 30 April 2021).
- Nygren, T.; Frau-Meigs, D.; Corbu, N.; Santoveña-Casal, S. Teachers’ views on disinformation and media literacy supported by a tool designed for professional fact-checkers: Perspectives from France, Romania, Spain and Sweden. Under Review.
- Chesney, B.; Citron, D. Deep fakes: A looming challenge for privacy, democracy, and national security. Calif. Law Rev. 2019, 107, 1753. [Google Scholar] [CrossRef] [Green Version]
- Frunzaru, V.; Corbu, N. Students’ attitudes towards knowledge and the future of work. Kybernetes 2020, 49, 1987–2002. [Google Scholar] [CrossRef]
- Langsrud, Ø. ANOVA for unbalanced data: Use Type II instead of Type III sums of squares. Stat. Comput. 2003, 13, 163–167. [Google Scholar] [CrossRef]
- Frau-Meigs, D. Information Disorders: Risks and Opportunities for Digital Media and Information Literacy? Medijske Studije 2019, 10, 10–28. [Google Scholar] [CrossRef]
- Garrett, R.K.; Weeks, B.E. Epistemic beliefs’ role in promoting misperceptions and conspiracist ideation. PLoS ONE 2017, 12, e0184733. [Google Scholar] [CrossRef]
- Martel, C.; Pennycook, G.; Rand, D.G. Reliance on emotion promotes belief in fake news. Cogn. Res. Princ. Implic. 2020, 5, 1–20. [Google Scholar] [CrossRef]
- Kurosu, M.; Kashimura, K. Apparent usability vs. inherent usability: Experimental analysis on the determinants of the apparent usability. In Proceedings of the Conference Companion on Human Factors in Computing Systems, Denver, CO, USA, 7–11 May 1995; pp. 292–293. [Google Scholar]
- Schenkman, B.N.; Jönsson, F.U. Aesthetics and preferences of web pages. Behav. Inf. Technol. 2000, 19, 367–377. [Google Scholar] [CrossRef]
- Shin, D.H. Cross-analysis of usability and aesthetic in smart devices: What influences users’ preferences? Cross Cult. Manag. Int. J. 2012. [Google Scholar] [CrossRef]


| Measure | French | Romanian | Spanish | Swedish |
|---|---|---|---|---|
| Pre-test score | 12.1 (3.2) | 10.5 (4.5) | 12.1 (3.1) | 12.5 (2.8) |
| Post-test score | 13.1 (2.6) | 13.7 (3.4) | 13.9 (3.4) | 12.7 (2.7) |
| Measure | French | Romanian | Spanish | Swedish |
|---|---|---|---|---|
| Pre-test digital tool use | 29% | 23% | 8.5% | 8.1% |
| Post-test digital tool use | 42% | 91% | 64% | 27% |
| Type of Items | No Digital Tools | Digital Tools |
|---|---|---|
| Total false post-test | ||
| True post-test |
| Attitude Measure | |
|---|---|
| Fact-checking ability | |
| Search ability | |
| Internet info reliability | |
| Credibility importance |
Publisher’s Note: MDPI stays neutral with regard to jurisdictional claims in published maps and institutional affiliations. |
© 2021 by the authors. Licensee MDPI, Basel, Switzerland. This article is an open access article distributed under the terms and conditions of the Creative Commons Attribution (CC BY) license (https://creativecommons.org/licenses/by/4.0/).
Share and Cite
Nygren, T.; Guath, M.; Axelsson, C.-A.W.; Frau-Meigs, D. Combatting Visual Fake News with a Professional Fact-Checking Tool in Education in France, Romania, Spain and Sweden. Information 2021, 12, 201. https://0-doi-org.brum.beds.ac.uk/10.3390/info12050201
Nygren T, Guath M, Axelsson C-AW, Frau-Meigs D. Combatting Visual Fake News with a Professional Fact-Checking Tool in Education in France, Romania, Spain and Sweden. Information. 2021; 12(5):201. https://0-doi-org.brum.beds.ac.uk/10.3390/info12050201
Chicago/Turabian StyleNygren, Thomas, Mona Guath, Carl-Anton Werner Axelsson, and Divina Frau-Meigs. 2021. "Combatting Visual Fake News with a Professional Fact-Checking Tool in Education in France, Romania, Spain and Sweden" Information 12, no. 5: 201. https://0-doi-org.brum.beds.ac.uk/10.3390/info12050201