
Missing Link Prediction Using Non-Overlapped Features and Multiple Sources of Social Networks


Faculty of Science and Technology, Thammasat University, Pathumthani 12121, Thailand
*
Authors to whom correspondence should be addressed.
Information 2021, 12(5), 214; https://0-doi-org.brum.beds.ac.uk/10.3390/info12050214
Submission received: 23 March 2021
/
Revised: 12 May 2021
/
Accepted: 16 May 2021
/
Published: 18 May 2021
(This article belongs to the Special Issue Data Mining & Machine Learning Techniques for the Analysis of Stream Data)
Abstract
:The current methods for missing link prediction in social networks focus on using data from overlapping users from two social network sources to recommend links between unconnected users. To improve prediction of the missing link, this paper presents the use of information from non-overlapping users as additional features in training a prediction model using a machine-learning approach. The proposed features are designed to use together with the common features as extra features to help in tuning up for a better classification model. The social network data sources used in this paper are Twitter and Facebook where Twitter is a main data for prediction and Facebook is a supporting data. For evaluations, a comparison using different machine-learning techniques, feature settings, and different network-density level of data source is studied. The experimental results can be concluded that the prediction model using a combination of the proposed features and the common features with Random Forest technique gained the best efficiency using percentage amount of recovering missing links and F1 score. The model of combined features yields higher percentage of recovering link by an average of 23.25% and the F1-measure by an average of 19.80% than the baseline of multi-social network source.
1. Introduction
A Social Network (SN) is an online service enables users to interact and communicate with each other free of charge. With the increasing number of usages of social media platforms, the large amount of data associated with social networks has been used in research for many topics such as studying user relationships for product recommendation [1,2], mental disorder analysis via user interaction [3,4], sentimental analysis [5,6,7], and analysis for social relationship [8,9]. Among the topics in social network analysis, link prediction, which is a task to identify missing links (or future links) between users, has been studied to recommend a social interaction between social network users. The task is to estimate the likelihood of link formation between each pair of users for those users who yet relate. The task thus is used to recommend for friend relationships in online SN platforms. For linking prediction in SN, relationships and users are defined into a structure of links and nodes while nodes refer to SN users, and links indicate a relationship between users.
The task of social network link prediction has been studied and developed categorizable into two main approaches as matrix-calculation and machine learning. For the works [2,10] from the matrix-calculation approach, they represent the link from a node to another node in a form of a matrix. Then, a calculation is made to predict the missing link using the data of links between nodes within a generated matrix. These works however did not apply information from node profile features to support the link prediction. The machine-learning approach applies the existing relationship between nodes and links from a dataset to create a classification model. There are several works [11,12,13,14,15,16,17,18,19,20,21] in this approach but with different machine-learning techniques and SN sources. To increase an efficiency of the link prediction, some works exploit user profile features such as age, gender, and current city along with graph-based relationships as training features.
Unfortunately, the limited information from a single SN source may not be sufficient to cover all possible missing links. In addition, there is a study result [18] indicating that using a single SN source with a low network-density could lower a prediction performance. Hence, some studies [10,15,17,20] suggested to use multiple SN sources to increase amount of informative data resulting in the higher efficiency of predicting the missing links. Commonly in using multiple SN sources, only overlapping nodes referring to the same users in two or more SN are considered in classification process while information from the non-overlapping nodes is ignored. However, these non-overlapping nodes contain informative data that may improve the prediction results.
This paper thus aims to improve the efficiency of the linking prediction using multiple SN sources for both overlapping and non-overlapping data. Various features from non-overlapping nodes are designed to widen the scope informative feature resulting in higher performance to the link prediction. In this work, the targeted SN for link prediction is Twitter while the selected SN sources for training are Facebook and Twitter. The rest of the paper is organized as follows. Section 2 provides a summary of related works. Section 3 describes the proposed methodology including data source description, and the design of features for training a link prediction model. Then, experimental results and discussion are provided in Section 4. Last, Section 5 gives conclusions and remarks of the paper.
2. Literature Reviews
Since the aim of this paper is to improve the task of linking prediction using a machine-learning method from multiple SN sources, we review and provide a summary of existing works in the same approach.
Hristova et al. [15] proposed a method to solve link prediction from Twitter and Foursquare data. The work considered the social relationship and geographical data as features of the users that existed in both SN sources. In their experiments, comparison between applying single and multiple SN sources was studied. The results of this study signify that using data from multiple SN sources could noticeably improve the performance of the missing link prediction.
As with the aforementioned work, Jalili et al. [17] developed a link prediction method using multiple social media networks by considering user data that appear from both Twitter and Foursquare. Three machine-learning techniques including Bayes classification (BC), Support Vector Machine (SVM), and k-nearest neighbor (kNN) were applied to compare the prediction performance to predict the links in Foursquare network. Their prediction results show that the cross-SN information significantly improves the prediction performance for all used techniques, and their SVM classifier yielded the best performance with 89.
Mendal et al. [20] performed a link prediction task using multiple SN sources with data from common users on Twitter and Foursquare. They compared the efficiency of several predictive techniques using graph-based features. The study results indicated that many common neighbors or a high ratio of common neighbors increase the efficiency of a link prediction. Thus, their results can be concluded that considering the similarities in geography could increase the accuracy of the link prediction.
Sirisup and Songmuang [18] investigated the performance of link prediction techniques by comparing various widely used prediction techniques including SVM, kNN, Decision Tree, Artificial Neural Networks (ANN), Naïve Bayes (NB), Logistic Regression (LR), and Random Forest (RF). The work used two OSN datasets which representing high-density and low density of network. Their results show that RF gave the best performance in predicting missing links. Furthermore, the experimental results also pointed out that a training data with a network with low density may cause the relatively lower performance of the prediction.
From the results of these work, we learn that using multiple SN sources can significantly improve the performance of predicting missing links in a social network. Unfortunately, the considered data for [15,17,20] were those overlapping user data in both applied SN sources, and the non-overlapping data were discarded. Furthermore, the result from [18] indicates that the network-density of the source plays a crucial part in prediction performance. Thus, further investigation of an effect on network-density from SN sources should be studied and analyzed. In this work, we hence focus on making use of non-overlapping data as additional features to improve a prediction performance and analyzing an effect of network-density from SN sources towards a prediction performance.
3. Research Methodology
The main aims of this work are to exploit non-overlapping nodes from multiple SN sources to improve the efficiency of missing link prediction in SNs. Additionally, we plan to study an effect of the density of network in SN sources in terms of link prediction efficiency. This section thus provides details of data sources using for training the prediction model, a design of features in training, measurement methods, and experimental design.
3.1. Data Sources
Two popular SNs including Facebook and Twitter are used as our dataset. The Twitter data are the main SN for both training and predicting while the Facebook data are used to support the prediction. We gather the data sources from their provided data access service through an Application Programming Interface (API). The collected data sources consist of data features and data structures as follows.
- Facebook network structure can be divided into two parts as follows:
- (a)
- A node represents a user with features including personal information.
- (b)
- Non-directional link shows friends in the network.
- Twitter structure of the network is divided into two parts as follows:
- (a)
- A node represents a user with features including personal information, tweet messages, hashtags, and referring node.
- (b)
- Directional link shows the user following status and followed status in the network.
With two different SN sources, we assimilate the data from both networks to become uniformed. A transformation of a directional link in Twitter into a non-directional link in Facebook is conducted by applying a criterion that if two nodes follow each other on Twitter, they are considered to be friends and are assigned with a non-directional link [15].
3.2. Basic Link Prediction Features
From the literature reviews, several features are used in the studies [15,17,20] for link prediction, and they are capable of providing reasonable efficiency. Hence, we consider using the features as our basic features. The basic features are categorized into two types as graph-based features and node features. Their details are as follows.
3.2.1. Graph-Based Features
Graph-based features denote features for network data in a form of a graph. The graph is represented by the symbol , where G refers to a graph, V refers to a set of nodes or users of an SN, and E refers to a set of links between nodes. If node i connects to node j with a link, node j is considered to be a neighbor of node i. The set of neighbors () of each node i is considered to be shown in Equation (1),
where V is the set of nodes, E is the set of links, and is the link between i and j.
The graph-based features in this work are:
(1) Common Neighbors () between two nodes are defined as the number of neighbors that are common to both nodes. Two nodes with many common neighbors are considered to be linked or known [14]. This can be calculated from Equation (2),
where is the set of neighbors of node i and is the set of neighbors of node j.
(2) Jaccard similarity () is applied to calculate the similarity between two nodes, considering the ratio of the number of common neighbors between the two nodes to the total number of neighbors of the two nodes [20], where i and j are the nodes considered, as shown in Equation (3),
(3) Adamic/Adar similarity () is a calculation for the similarity between nodes, considering the popularity of common neighbors between the two nodes [15,22]. The concept is that many common neighbors are likely to show a low probability of there being a missing link between the considering nodes. On the other hand, a smaller number of common neighbors may be considered for a higher probability of missing links, as shown in Equation (4),
where is the set of neighbors of Node z.
(4) Friend measure () is the consideration that when two considered nodes have more connections to their common neighbors, there is a higher possibility that the two nodes have a link [23]. This can be calculated using Equation (5):
where x is a member in the neighbor set of node i, y is a member in the neighbor set of node j, and can be calculated as shown in Equation (6):
where is the link between x and y.
(5) Friend Of Similar () is a concept to detect nodes that share a set of common neighbors. When the considered nodes i and j have many common neighbors, node i may likely be friends with other friends of node j, and node j might also likely be friends with other friends of node i.
When we have a large SN dataset, we might have many nodes that link to a few nodes and may become a noise-causing ambiguity to the prediction model. We thus apply Ahmed et al. [14]’s method to reduce the number of nodes that might provide information for calculation by setting a threshold of 10 as a minimum number of common neighbors. () feature can be calculated from Equation (7):
where , , , and is the number of common neighbors between nodes i and node x. This means that node j is the common neighbor of node x. When the two considered nodes share many nodes x, increases and the probability of a relationship between the two nodes also increases.
3.2.2. Qualitative Features
The qualitative features of nodes are based on the selected SN source, with each SN source using different features. There are two considered data sources in this paper, including Facebook and Twitter. Therefore, the features of the nodes are divided into two sections as follows.
(1) Features for each node on Facebook, including personal features, are described as follows.
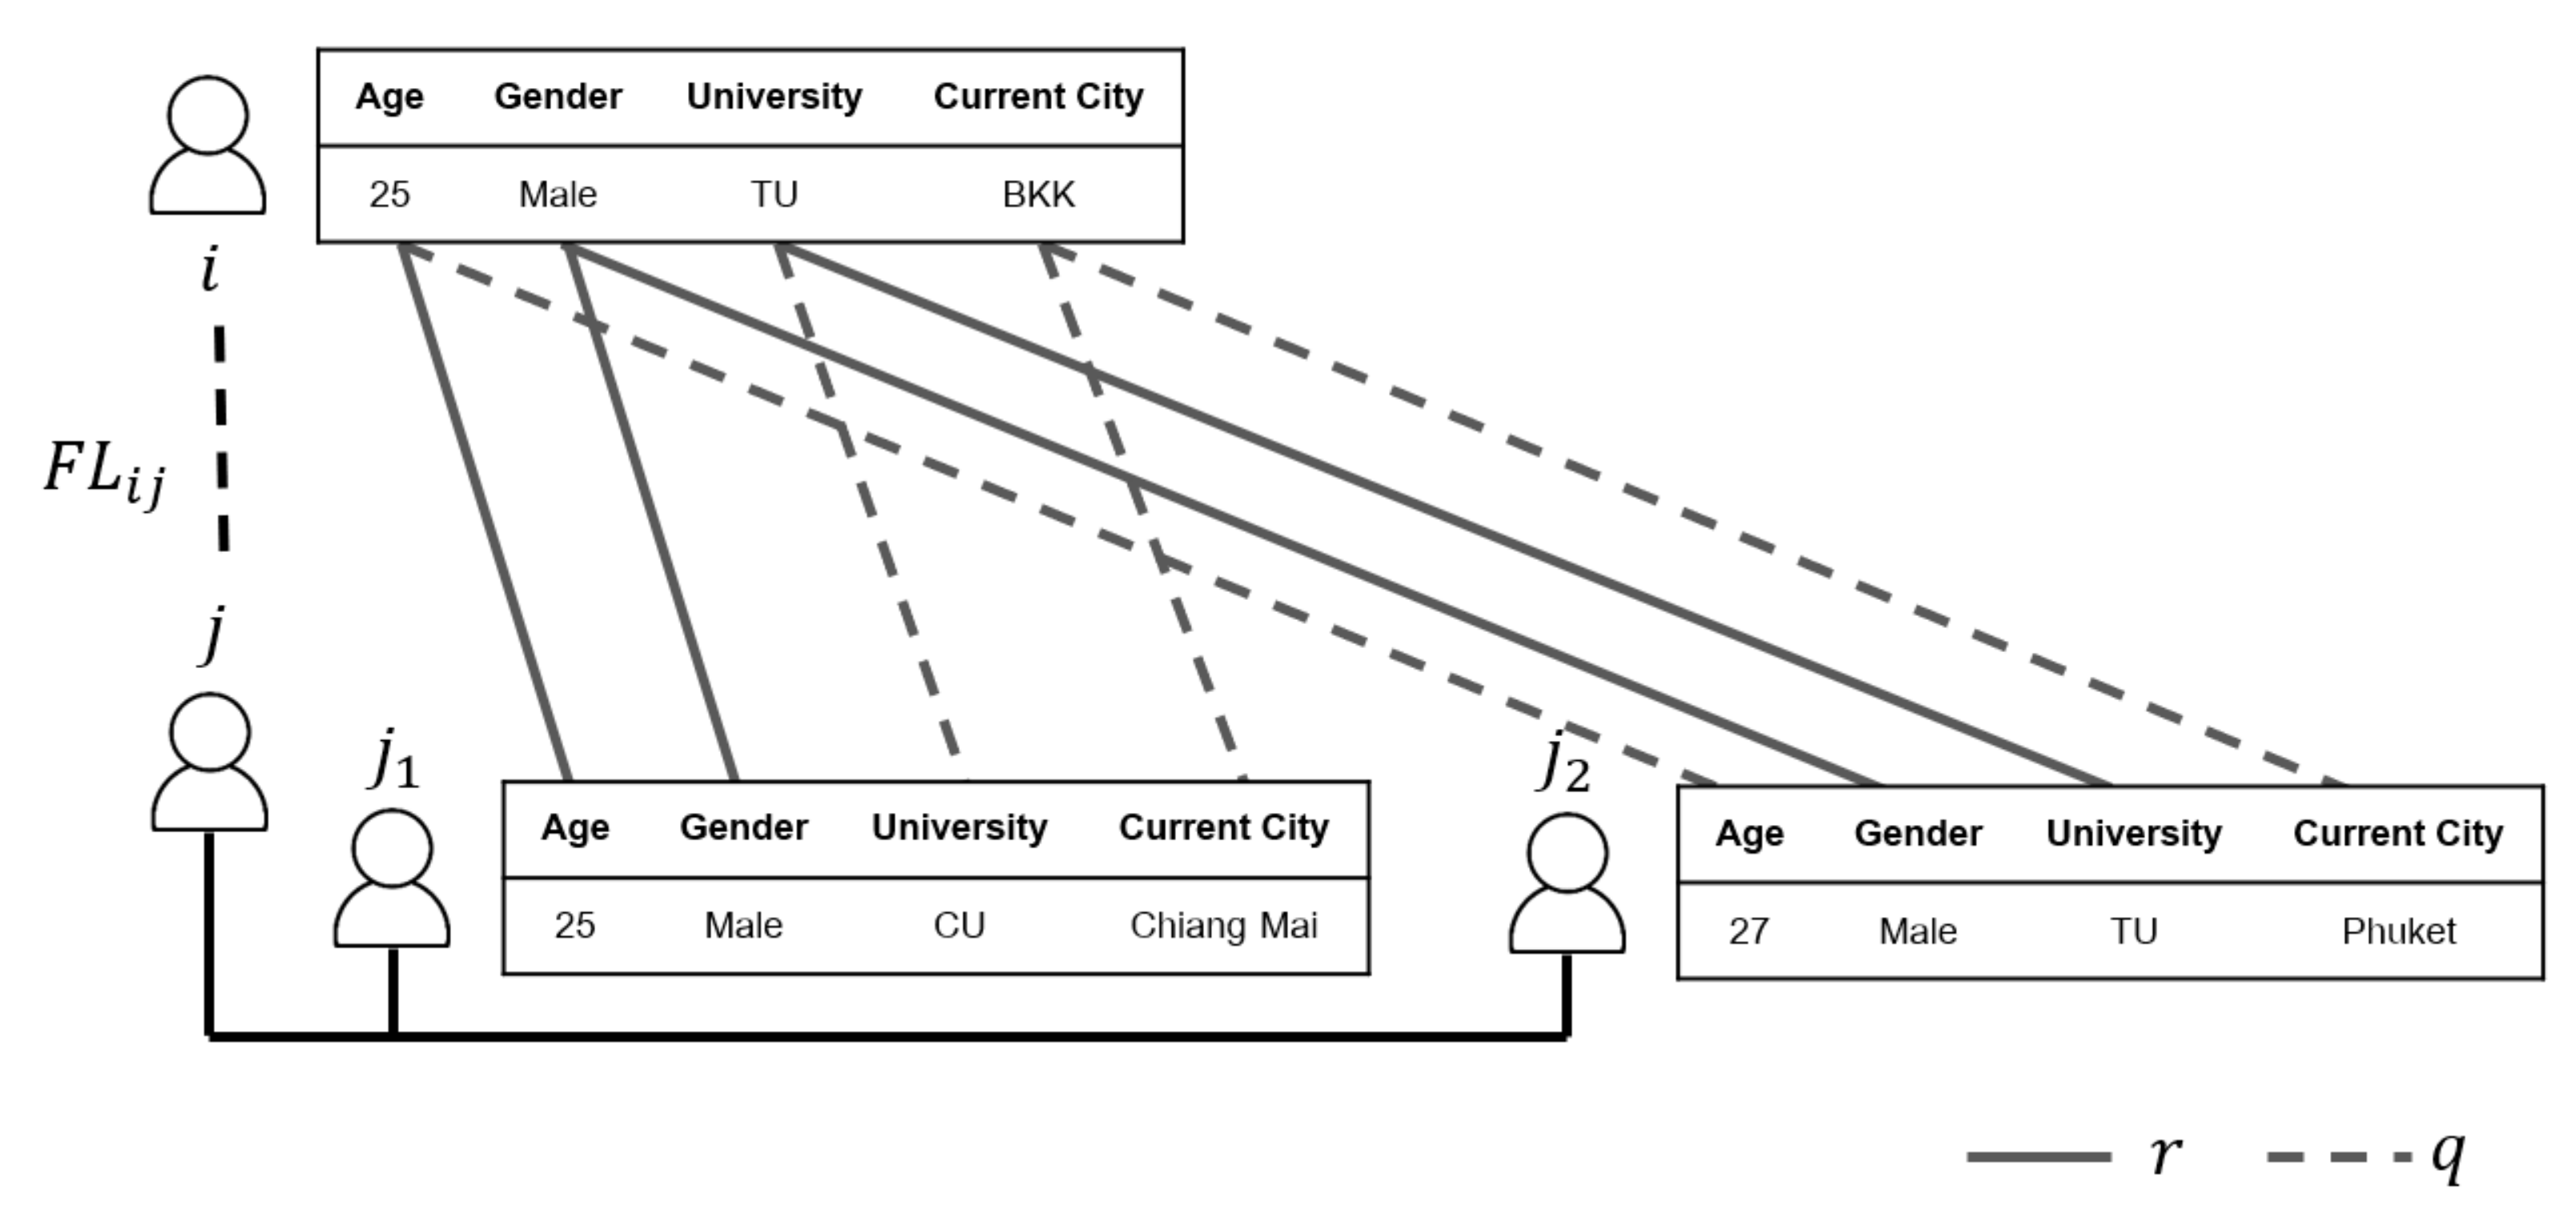
Facebook latent () is the most effective feature from the linking prediction research proposed by Han et al. [12]. The principle of this feature is to consider the possibility of a relationship between two nodes by considering the profile features from the first-order neighbors compared with the profile features of the other considered nodes. The profile features include age, gender, school, university, hometown, current location, workplace, favorite music, movies, and television programs. If the latent relationship score is high, both nodes would have a high probability of being friends.
Figure 1 shows the example of user i and user j being friends if user i and users and , who are friends of user j, have many similar profile features. The figure shows four similarities (solid line) and four different profile features (dashed line). The Facebook latent relationship between nodes i and j can be calculated using Equation (8),
where r is the number of similar features (the number of latent links), q is the number of different features (the number of disconnections), is an exponential regulator, and is a regulator for punishing value [24]. According to Han et al. [12], equals 0.05 and equals 0.05.
(2) When considering the qualitative features of nodes on Twitter, the features of each node on Twitter consist of data that each node tweets, which contains hashtag data and the mentioned users. Previous studies [14,15] have suggested guidelines for considering features on Twitter as follows:
- Hashtag overlap () is the similarity between nodes on Twitter that is detected through interest topics in the form of hashtags. The number of hashtags commonly used between two users on Twitter [15] is calculated as shown in Equation (9),where is the set of tweeted hashtags of node i and is the set of tweeted hashtags of node j.
- The mention frequency () between the two considering nodes is used to indicate the relationship. Many mentions between two nodes are considered to be a high probability that the two nodes will know each other [14]. This can be calculated from Equation (11),where =1, in case when node i mentions node j.
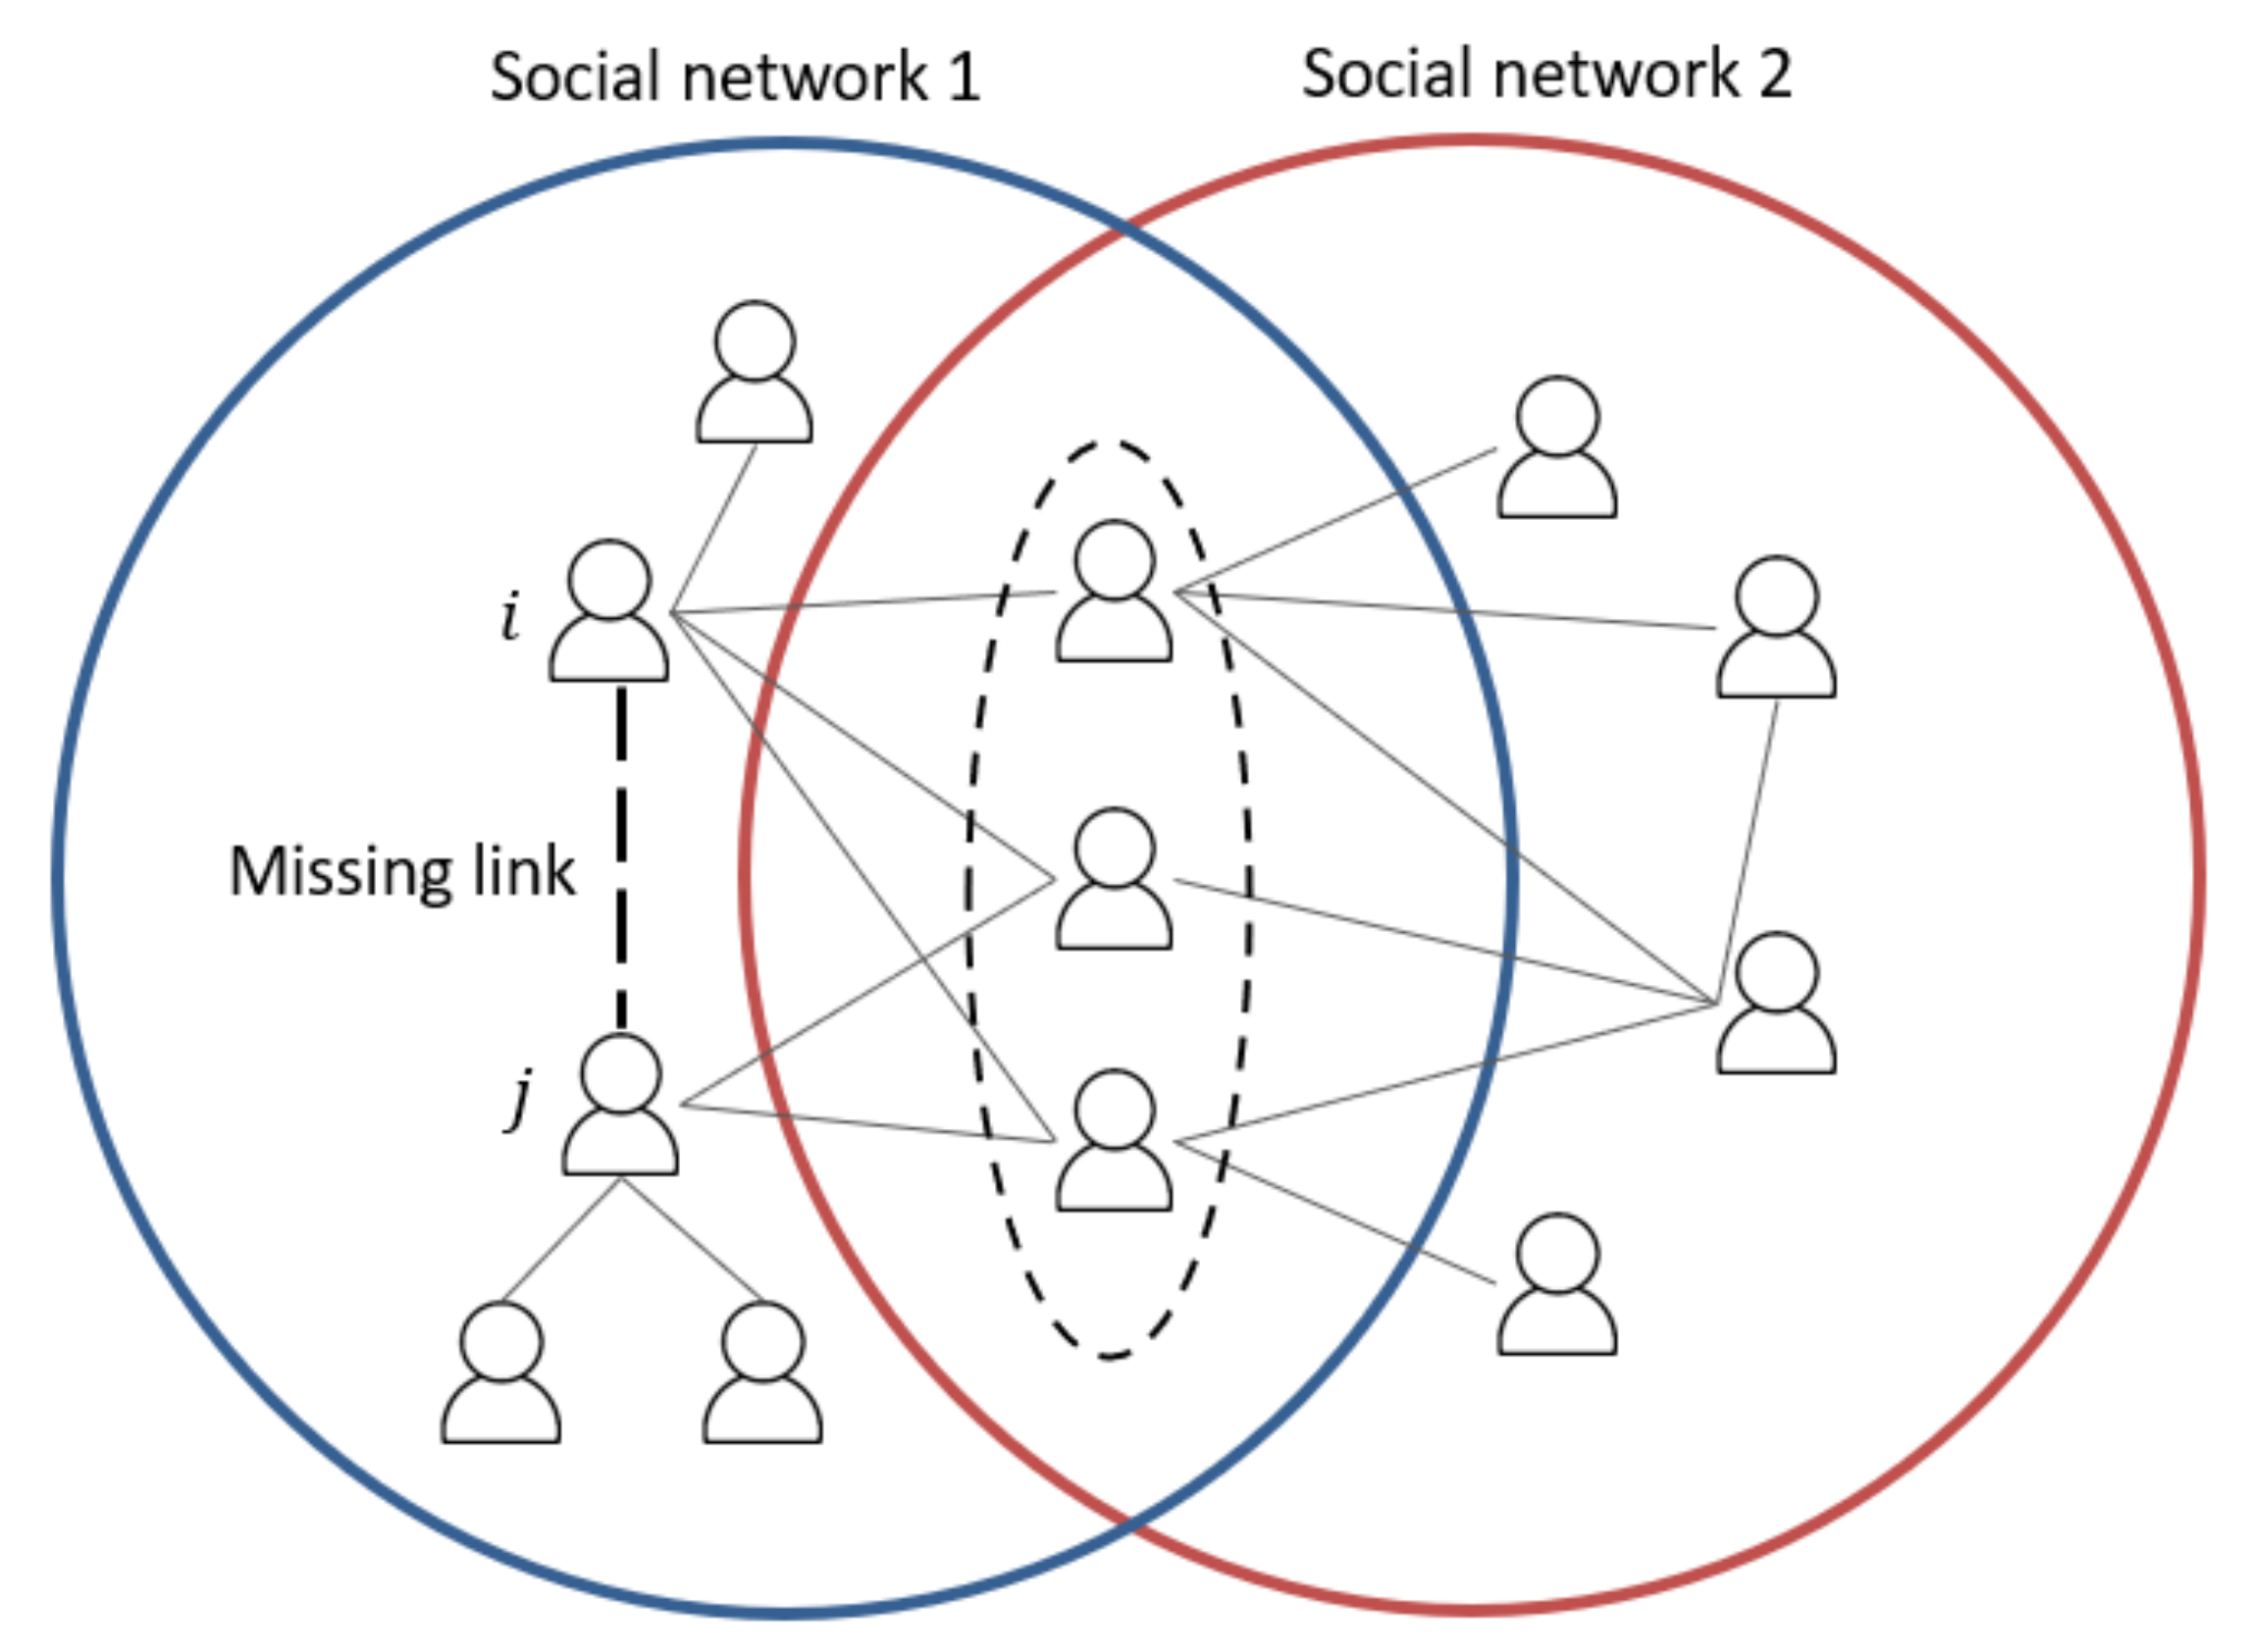
These basic features are from overlapping nodes of two SN sources, as shown in the dotted circle in Figure 2, to predict a missing link in SN1. The remaining information from non-overlapping nodes in SN2 then will be explained in the later section as this work newly designed features.
4. Proposed Features
This set of features is newly invented features aiming to improve link prediction using more information from non-overlapping nodes to predict the missing link. As shown in Figure 2, when we predict a missing link in SN1, we use the information from overlapping nodes represented in the dotted circle and non-overlapping nodes from SN1 and SN2. However, the remaining non-overlapping nodes from SN2 are not treated as first-order neighbors of the considering nodes i and j in SN1.
Therefore, we propose two new features for improving link prediction using non-overlapping nodes which concern second-order neighbors. Moreover, we improve the to increase the information from several types of datasets, and we propose a latent feature for gathering more information from Twitter data. The proposed features are divided into graph-based features and qualitative node features with the following details.
4.1. Graph-Based Features
Graph-based features are applied from the latent relationship features. We apply the mentioned equation with the graph-based features by changing the profile features of the considering nodes to graph-based features as follows.
4.1.1. Node Latent
Node latent () relationship is used to apply the latent relationships by considering the common neighbors between the first-order neighbors of the considering node and the second-order neighbors of the other considering node. For example, Figure 3 presents the node latent relationship between users i and j where nodes and are the first-order neighbors of node j. Neighbors of nodes and , excluding node j, are the second-order neighbors of node j. We use the information from the common neighbors between node i and nodes or to calculate NL. The latent relationship is shown in Equation (13):
where and are numerical controls set equal to 0.05 and 0.05 according to our empirical investigation. is a node relationship which is the similarities of friend members calculated from the sum of common neighbor ratios between node i and first-order neighbors of node j, as shown in Equation (14):
where is calculated using Equation (3), which is the Jaccard similarity between node i and node y, and Q is the sum of the different neighbor ratios between node i and first-order neighbors of node j, which is calculated from Equation (15):
4.1.2. Jaccard Similarity of Second-Order Neighbor
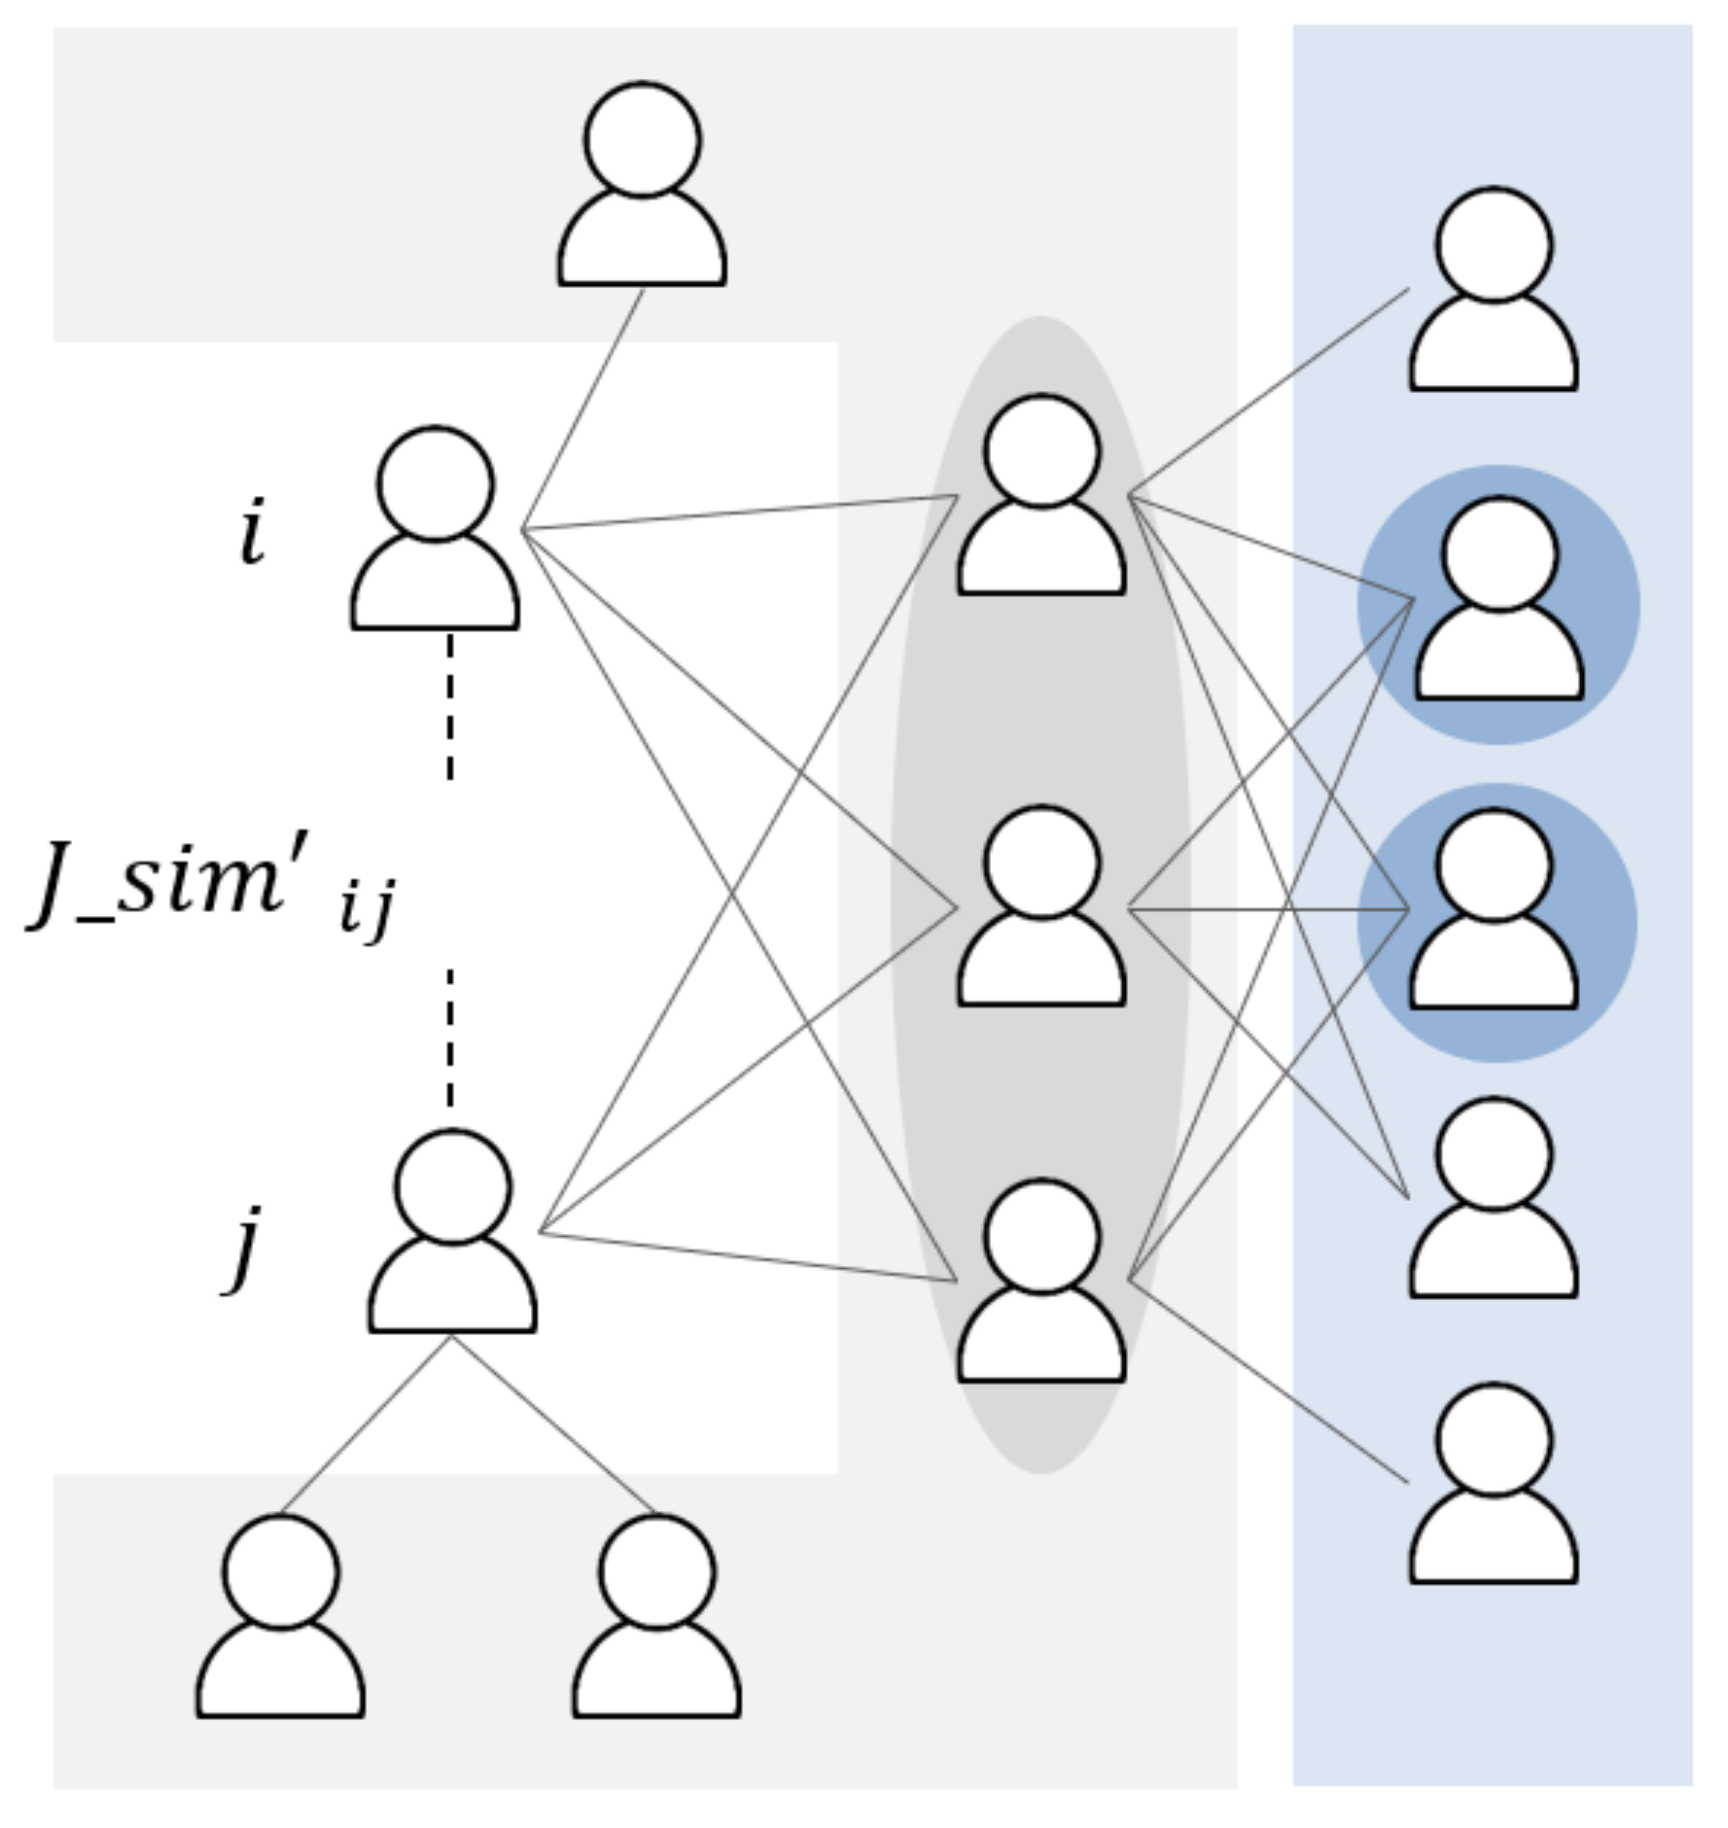
The Jaccard similarity of the second-order neighbor () is developed from Equation (3), which considers only the common neighbors of the first-order considered node. However, we propose the equation considering the Jaccard similarity of the second-order neighbors as shown on the right-hand side of Figure 4. Many common friends in the second-order neighbors are assumed to have a higher possibility of being friends as well, which can be calculated from Equation (16):
where is the set of common friends of , excluding i and j.
4.1.3. Enhanced Friend of Similar
Enhanced friend of similar () is an adjustment to the friend similarities from Equation (7) as the original equation requires more than ten common neighbor nodes to pass the defined threshold before calculating friend similarities. In case of low network-density, the threshold thus lower the trainable data and may affect the prediction efficiency.
To sensibly adjust the amount of information to be calculated in , we change the fix threshold conditions from in Equation (7) to , where v is a variable parameter setting based on network-density level. For SN source with a very high network-density, v can be set to a high number to help in control feeding amount of data to calculate for friend similarities. On the other hand, v should be set to a low number to allow some data to be fed to calculation. From preliminary testing, v is set to 1 in this work since the chosen SN sources in this work lacking common neighbors for calculating for friend similarities.
4.2. Node Qualitative Feature
The node qualitative feature from the Facebook latent relationship is a feature that affects prediction performance and can also be applied with Twitter data for increased prediction efficiency. Thus, we present the features as follows.
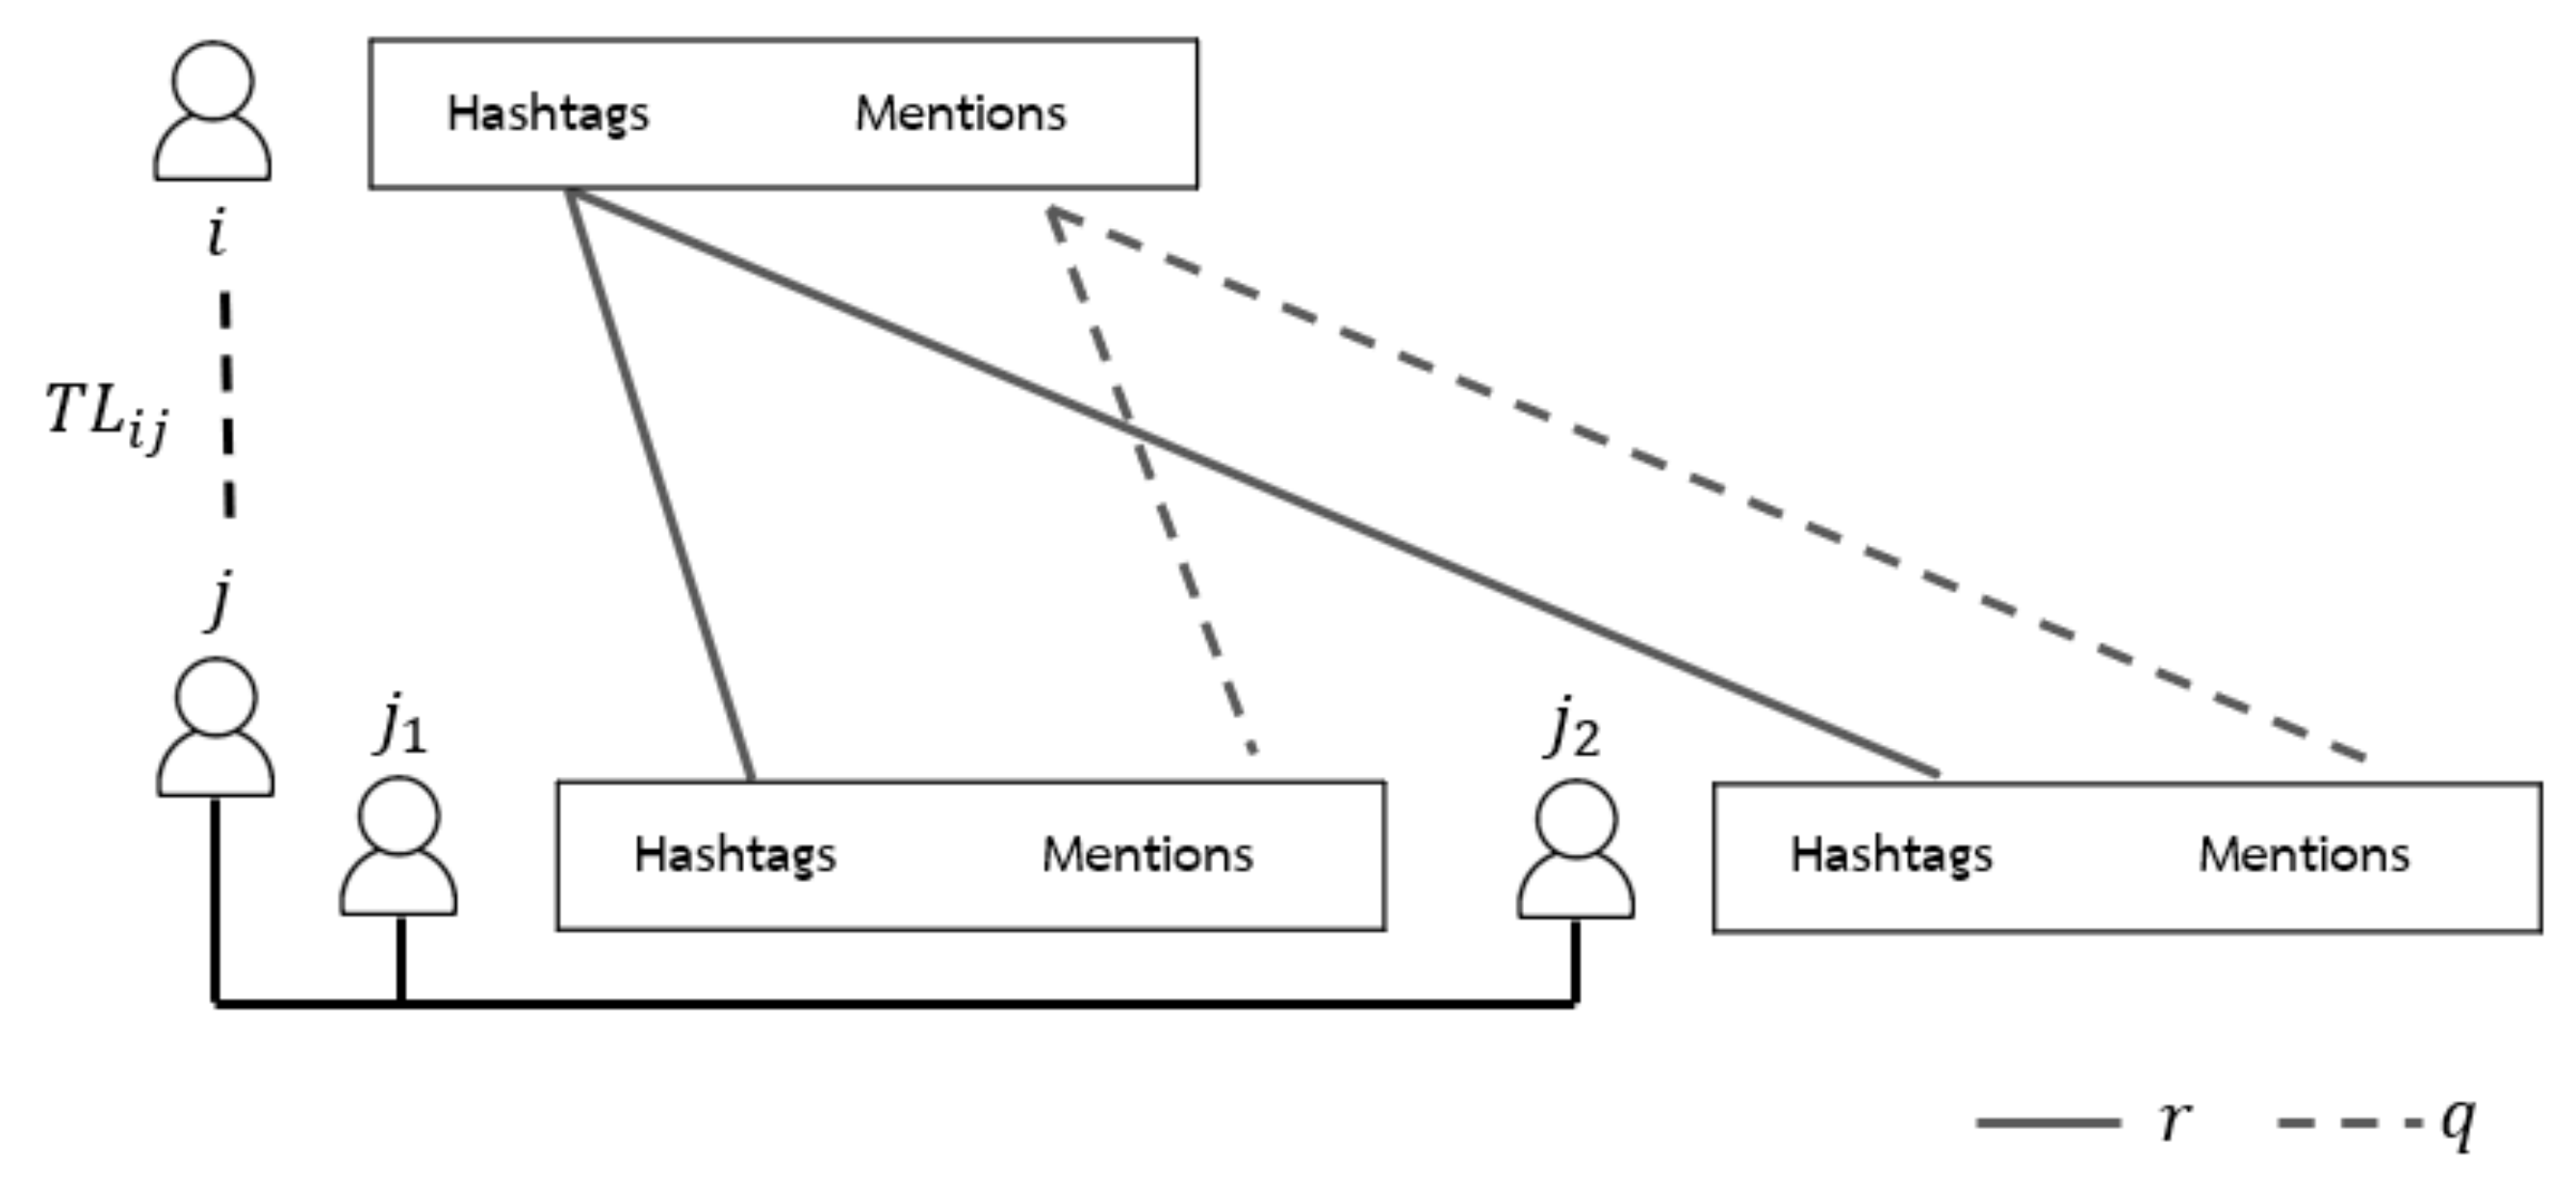
Twitter latent () is the relationship between the two nodes of Twitter considering two features as hashtags and the mentioned users with common friends as illustrated in Figure 5.
Figure 5 presents the example of the possibility that user i and user j will be friends if user i and friends of user j have two features of similarities. The features on Twitter that can be considered to be latent relationships consist of hashtags and mentioned nodes, and can be used to calculate the latent relationship from Equation (17):
where is a numerical control, and is the numerical control. We set and to be equal to 0.05 according to empirical investigation, and is the similarities of friends that can be calculated from Equation (18),
is the non-similarities of friends that can be calculated from Equation (19):
where can be calculated as shown in Equation (20), and can be calculated as shown in Equation (21):
where is the hashtag set that node i tweets, is the hashtag set that node y tweets.
where is the set of nodes that node i mentions and is the set of nodes that node y mentions.
5. Experiment
To test the potential of the proposed method, we design an experiment to compare the prediction efficiency from three setups as (1) data from a single SN source, (2) data from multiple SN sources without the newly proposed features, and (3) data from multiple SN sources without the newly proposed features. Furthermore, we also plan to study an effect of the network-density of SN as low density and high density by comparing the performance using different density of SN sources.
5.1. Network Density
To realize network-density of a data source, we calculate to find the ratio between the number of nodes in the network and the number of links [25,26], which range from 0 to 1, and the network-density (D) can be calculated as presented in Equation (22):
where M is the number of links, and N is the number of nodes.
5.2. Data Collection
Although there are several opened datasets of SNs available for training [27,28,29], they contain only nodes and links representing network structures without profile information which is a necessary feature in the proposed method. Therefore, we collect datasets including node links and profile information from Twitter and Facebook specifically for this experiment. To inform of overlapping nodes and non-overlapping nodes, we specifically annotate the data of users who belong to both SNs and who belong to one SN.
The details of the collected datasets from two sources are as follows.
- Dataset from Facebook: two datasets with different network densities. Dataset 1 contains a low network-density of 0.01, and dataset 2 contains a high network-density of 0.03, which is three times higher than the density of dataset 1.
- Dataset from Twitter: one dataset with a network-density of 0.01.
In the prediction, the dataset from Twitter is the main SN while one of the datasets from Facebook is acted as the support SN source in prediction process. For experiment setting, details are given in Table 1.
Experiment setting with different datasets are as follows:
- Dataset 1, Twitter dataset, which represents a single SN source with a network-density of 0.01 (Single-SN);
- Dataset 2, Twitter and Facebook datasets with a low network-density that represent multiple SN sources with a low network-density of 0.01 (Multi-SN-low); and
- Dataset 3, Twitter and Facebook datasets with a high network-density represent multiple SN sources with a high network-density of 0.02 (Multi-SN-high).
5.3. Evaluation Metrics
Two efficiency measures as the percentage of recovered links and F1-measure are used to evaluate the prediction results. The percentage of the recovered links indicates the missing link prediction efficiency, which is the number of recovered links compared to the total number of deleted links. The percentage of covered links can be calculated as shown in Equation (23):
F1-measure is chosen as another measurement metric. F1-measure is the harmonic mean of Precision and Recall in which represents as a good measure of the incorrectly classified cases. F1-measure is calculated using TP (True Positive), FP (False Positive), and FN (False Negative). TP refers to a case that the method returns a link matching to the link given in the reference SN dataset. FP refers to when the method returns a link, but the link does not exist in the reference SN dataset. On the other hand, FN refers the method does not return a link, but the link exists in the reference SN dataset. In this classification problem, TN (true negative) is not applied for measurement calculation. With the imbalance nature of training SN datasets, a number of negative items are much higher as they will result in the extreme values of TN compared to TP, FP, and FN. Thus, this will lower the importance of found FP and FN that are a crucial error in classification measurement metric.
5.4. Link Prediction Techniques and Features
For training the prediction model, three commonly used classification technique, k-nearest neighbor (kNN), Artificial Neural Networks (ANN), and Random Forest (RF) are used.
We divide the experiment into two parts as follows.
- For each technique, it is necessary to specify the parameters for model creation. Therefore, we conduct an experiment to find the suitable parameters for data classification techniques. There are three classification techniques used in the experiment: specifying parameter k for kNN [30,31], specifying hidden layer parameters and hidden node for ANN [32,33], and specifying parameters of the number of trees for RF [34,35]. We develop the program for this experiment to train and test the prediction models written using Scikit-learn and Python.
- An experiment is set to compare the prediction efficiency between data usage from a single SN source and multiple SN sources by considering overlapping and non-overlapping nodes via three data classification techniques: kNN, RF, and ANN.
We develop the experiment program for training and testing the prediction models using Scikit-learn and Python. The parameters are set following the results from previous experiment results.
Moreover, we also experimented to compare the network-density of the considered social networks to see the effects on link prediction efficiency. We use three datasets, as shown in Table 1. This paper compares the efficiency of the features when used for data classification, where the feature sets used in the experiment consist of ten basic features and combined features including nine basic features and four proposed features, as shown in Table 2.
To create the missing link in SNs, we randomly delete 15% of the links that appeared in all three testing datasets. 10-fold cross-validation is applied, and we calculate the percentage to measure the number of returned links generated from the method and F1-Measure to compare the link prediction efficiency. Additionally, we repeat the experiment 100 times to confirm the measurement results. The experimental results are described in the next section.
6. Results
6.1. Prediction Model Parameter Investigation Result
In this experiment, we aim to find the suitable parameters with data classification techniques. The experimental results indicate that kNN with parameter k equal to 3 gave the highest F1-Measure efficiency. For ANN, the experimental result shows that the first hiding layer of 10 hidden nodes yielded the highest F1-Measure efficiency. Lastly, RF with 100 trees generated the classification with the highest F1-Measure efficiency.
6.2. Link Prediction Techniques and Features Evaluation Result
This experiment is to test a potential of the proposed features of non-overlapping data. The comparison is made to show prediction performance of applying a single SN source, multiple SN sources with only basic features (Basic features), and multiple SN sources with combining basic features with the proposed features (Combined features). For training techniques, the three techniques for dataset classification, kNN, RF, and ANN are used for classification.
Table 3 shows the percentage of the number of recovered links of data classification techniques in each setting. From Table 3, RF gains the highest percentage of recovered links for all datasets and all features. When considered the percentage trend of recovered links, compared with the overall datasets, RF is the most effective technique.
In terms of applying the basic features with kNN and RF, the percentage of recovered links tends to decrease when using multiple SN sources with low network-density compared to using a single SN source. On the other hand, the percentage of recovered links tends to decrease when using multiple SN sources with high network-density in the case of kNN, but the results are similar to using a single SN source for ANN and RF.
This shows that using the basic features regardless of multiple SN sources returned lower performance than using a single SN resource. According to the result in Table 3, we can conclude that the basic features with multiple SN sources are well-aligned for the task.
For the results of using the combined features for all prediction techniques, multiple SN sources with high network-density obtained the highest percentages, followed by a single SN source, and finally, multi-sources SN with low network-density has the lowest percentages.
According to the 100 repeated experiments to confirm the efficiency measurement, when statistically tested with Student’s t-test, the percentage of recovered links tend to increase with a statistical significance at 0.05.
From the result in Table 3, we can say that the combined basic and proposed features are suitable for using multiple SN sources.
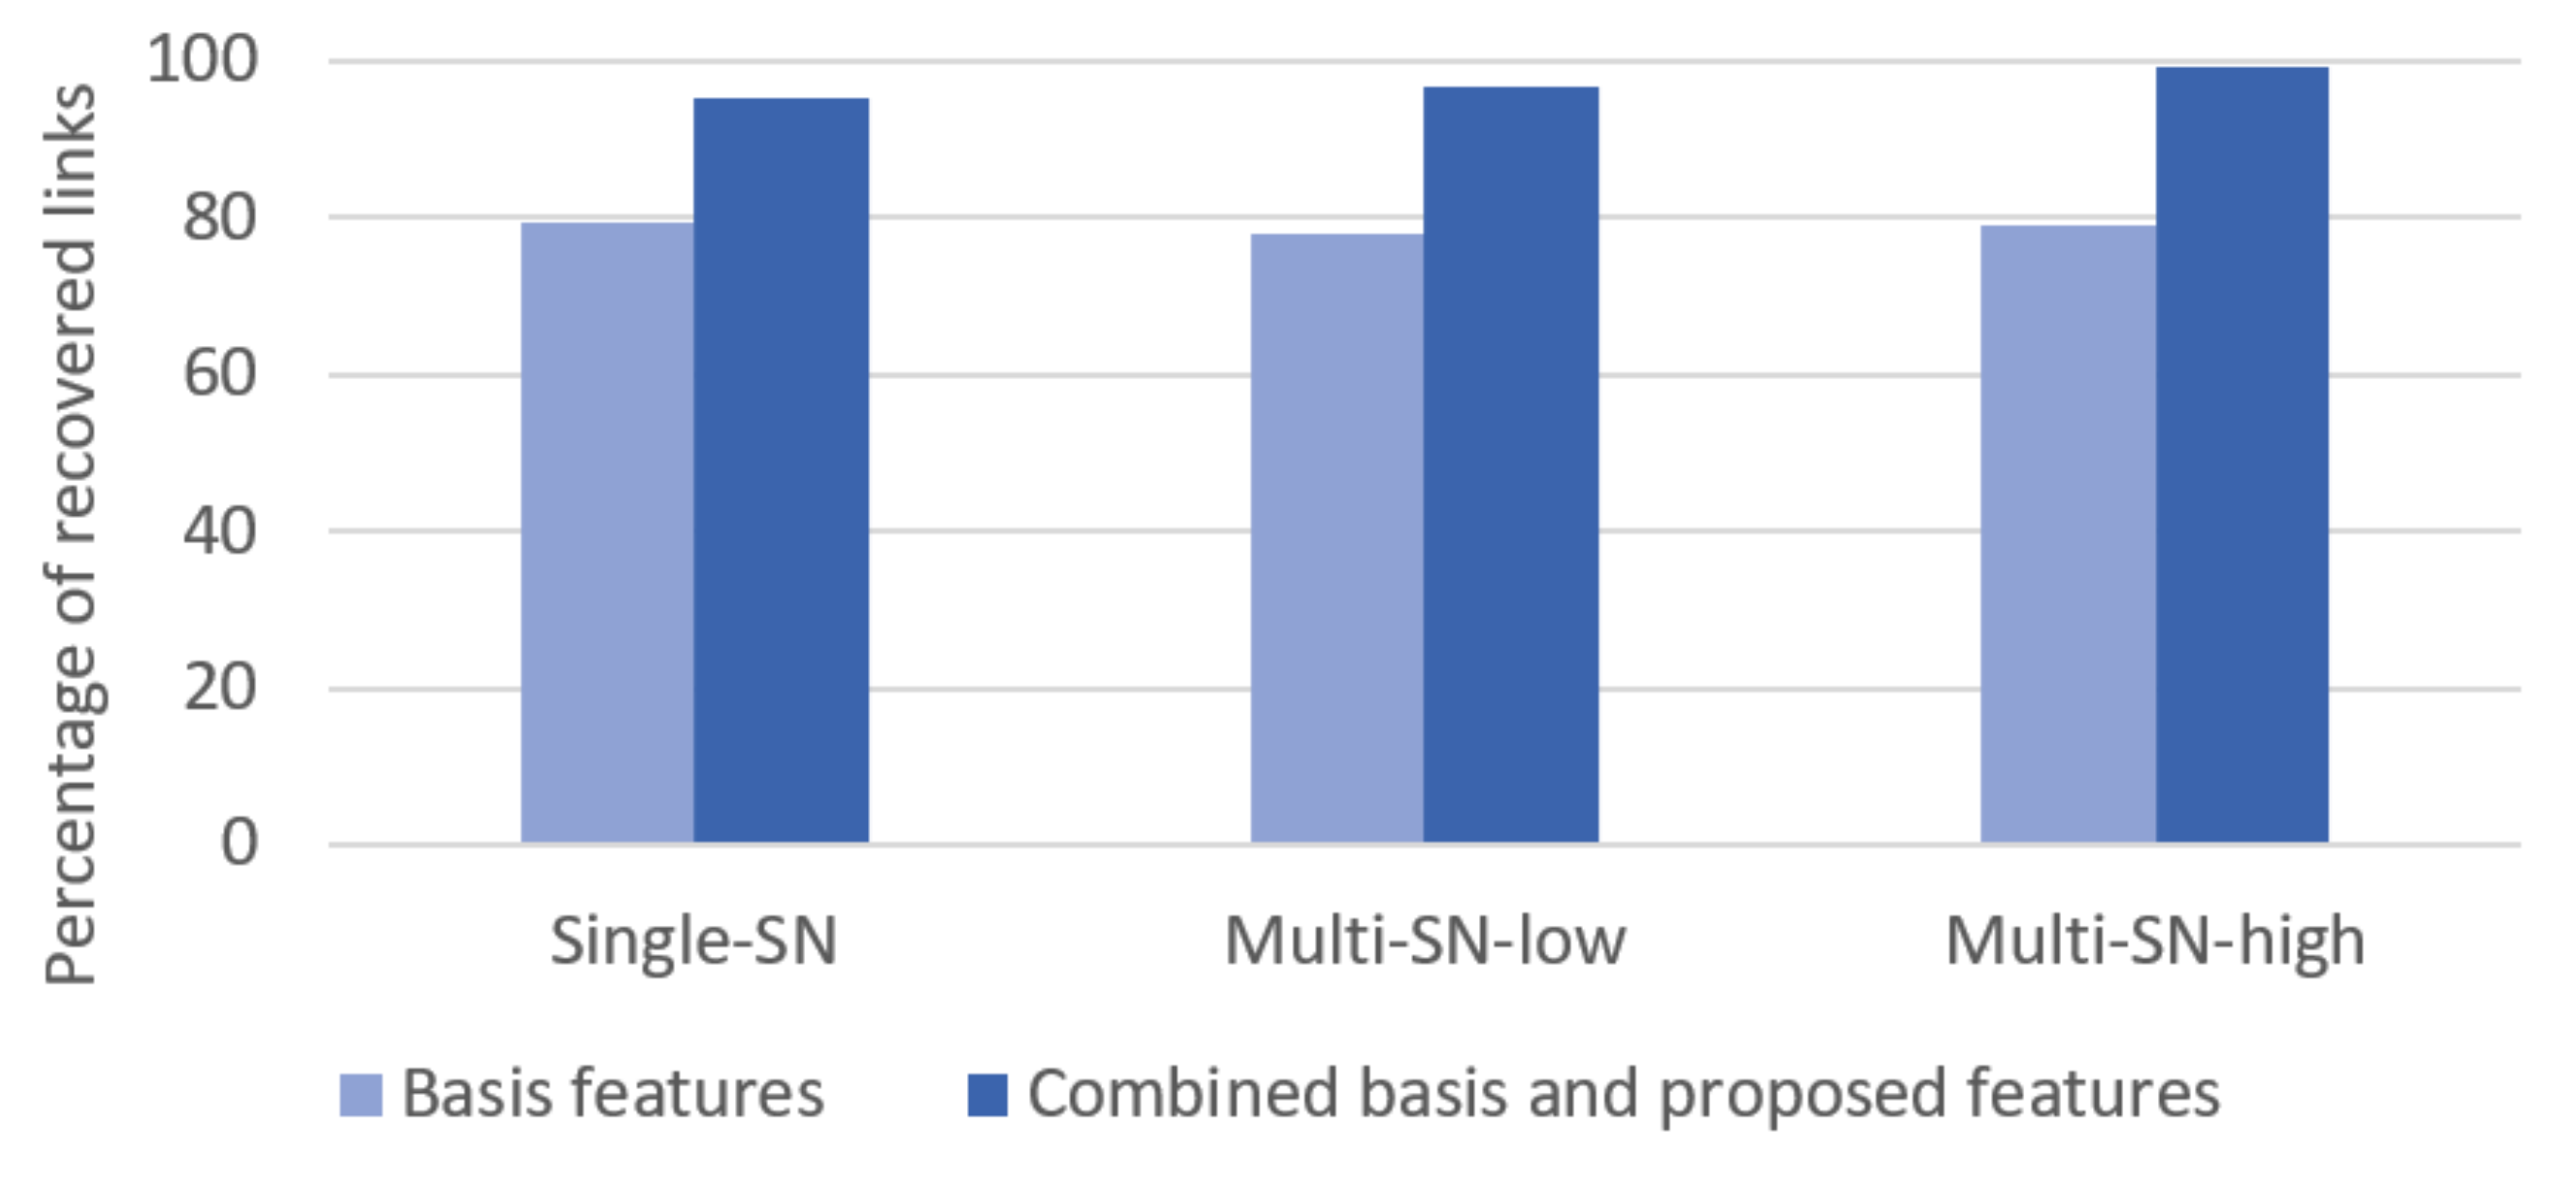
Figure 6 shows that considering the percentage of recovered links via RF using the combined basic and proposed features is more efficient than RF using the basic features in every dataset. When considering the increasing percentage of recovered links of each dataset, we can conclude that RF using the combined features is more efficient than using the basic features alone, with an average percentage of 23.25%. This verified the usefulness of the combined features and showed that the proposed features help to improve the efficiency of the basic features.
Table 4 presents the F1-Measure of data classification techniques in each dataset using different features. From Table 4, we can notice that RF gains the highest F1-Measure in all datasets and all features. When comparing the trend of F1-Measure with all datasets by considering only RF as the most effective technique, in both cases using basic features and the case using the combined features, F1-Measure tends to increase continuously in each dataset. For more details, multiple SN sources with high network-density have the highest efficiency percentage, followed by multiple SN sources with low network-density, and finally, a single SN source has the lowest efficiency value.
When we use multiple SN sources with a high network-density, kNN and ANN using the combined basic and proposed features perform well in predicting links compared to using the basic features. However, when considering the use of multiple SN sources with a low network-density, although kNN and ANN are applied with the combined basic and proposed features, the results of F1-Measure are lower than those found using a single SN source. Since a multiple SN source with low network-density is the most imbalanced dataset with the lowest ratio between the numbers of link and non-link relationships, the efficient prediction technique must be tolerant with this problem, such as RF.
Additionally, the results from 100-repeated experiments to confirm efficiency measurements after statistically tested with Student’s t-test found that with the combined basic and proposed features for every dataset of RF, F1-Measure tends to increase with a statistical significance of 0.05.
According to Figure 7, when considering the trends of F1-Measure, the efficiency of RF using the combined basic and proposed features is more effective than RF using the basic features in every dataset. When considering the percentage of the F1-Measure of each dataset, it could be concluded that RF using the combined basic and proposed features is more effective than RF using the basic features, with an average percentage of 19.80%.
7. Conclusions
This paper presents newly invented features of non-overlapping node data in using multiple social network sources to improve a performance of the missing link prediction. The invented features are designed to obtain information from the data appearing only on supporting source in which are normally ignored in the existing methods. The proposed features together with basic features commonly used in the task show the promising results in predicting missing link in terms of recovering missing link and F1 measurement. Moreover, we also study an effect of network-density from the training social media sources towards performance of the prediction.
For evaluation, we set experiments to compare results in various aspects. The first aspect is three machine-learning techniques including k-nearest neighbor (kNN), Artificial Neural Networks (ANN), and Random Forest (RF). Second aspect is three data source settings as single SN source, multiple SN sources with low network-density, and multiple SN sources with high-network-density. Last, third aspect is the used features as commonly used features and combination of the features and newly invent features. The evaluation results indicate that RF gives the highest link prediction efficiency in all datasets and all features in both measurement of the percentage of recovered links and F-Measure. When focusing on the RF classifier as the most effective technique, the model from using the combined basic and proposed features on multiple SN sources with high-network-density yields the best percentage of recovering missing links and highest F1-Measure in all testing dataset with a statistical significance of 0.05. This signifies that the proposed non-overlapping node features assist the classification task to become more efficient in predict missing links using two different SN sources as the combined features increase the efficiency percentage of recovering link by an average of 23.25% compared to using basic features alone. Furthermore, the model from the combined features also increases the F1-Measure by an average of 19.80% compared to the multi-source baseline.
Therefore, we conclude that the prediction model trained with multiple SN sources by considering overlapping and non-overlapping nodes between networks with the combined basic and proposed features through RF yields the best link prediction efficiency. The prediction efficiency can also be further enhanced by the sources of SN data with a high network-density. For future works, more features from non-overlapping data will be invented. Moreover, a solution to improve efficiency for imbalanced social network data that may affect classification problem will be developed. Last, a method for predicting missing links from at least three SN sources will be studied since they are expectable that the complexity of graph-based features will be exponent.
Author Contributions
Conceptualization, P.S. and C.S.; methodology, P.S. and C.S.; software, C.S.; validation, P.S. and C.S.; formal analysis, P.S., C.S. and A.S.; investigation, P.S., C.S. and A.S.; resources, P.S. and C.S.; writing—original draft preparation, P.S. and C.S.; writing—review and editing, P.S. and A.S. All authors have read and agreed to the published version of the manuscript.
Funding
This research received no external funding.
Institutional Review Board Statement
Not applicable.
Informed Consent Statement
Not applicable.
Data Availability Statement
Data sharing not applicable.
Acknowledgments
We would like to extend our sincere thanks to our family members and the members of AI Lab at Thammasat University for their support and encouragement.
Conflicts of Interest
The authors declare no conflict of interest.
References
- Long, J.; Wang, Y.; Yuan, X.; Li, T.; Liu, Q. A Recommendation Model Based on Multi-Emotion Similarity in the Social Networks. Information 2019, 10, 18. [Google Scholar] [CrossRef] [Green Version]
- Zhou, J.; Kwan, C. Missing Link Prediction in Social Networks. In Advances in Neural Networks—ISNN 2018; Springer International Publishing: Cham, Switzerland, 2018; pp. 346–354. [Google Scholar] [CrossRef]
- Yazdavar, A.H.; Mahdavinejad, M.S.; Bajaj, G.; Thirunarayan, K.; Pathak, J.; Sheth, A. Mental Health Analysis Via Social Media Data. In Proceedings of the 2018 IEEE International Conference on Healthcare Informatics (ICHI), New York, NY, USA, 4–7 June 2018. [Google Scholar] [CrossRef]
- Pantic, I. Online Social Networking and Mental Health. Cyberpsychol. Behav. Soc. Netw. 2014, 17, 652–657. [Google Scholar] [CrossRef] [PubMed] [Green Version]
- Tanantong, T.; Sanglerdsinlapachai, N.; Donkhampai, U. Sentiment Classification on Thai Social Media Using a Domain-Specific Trained Lexicon. In Proceedings of the 2020 17th International Conference on Electrical Engineering/Electronics, Computer, Telecommunications and Information Technology (ECTI-CON), Phuket, Thailand, 24–27 June 2020; pp. 580–583. [Google Scholar] [CrossRef]
- Tanantong, T.; Kreangkriwanich, S.; Laosen, N. Extraction of Trend Keywords from Thai Twitters using N-Gram Word Combination. In Proceedings of the 2020 17th International Conference on Electrical Engineering/Electronics, Computer, Telecommunications and Information Technology (ECTI-CON), Phuket, Thailand, 24–27 June 2020; pp. 320–323. [Google Scholar] [CrossRef]
- Yi, S.; Liu, X. Machine learning based customer sentiment analysis for recommending shoppers, shops based on customers’ review. Complex Intell. Syst. 2020, 6, 621–634. [Google Scholar] [CrossRef]
- Mercorio, F.; Mezzanzanica, M.; Moscato, V.; Picariello, A.; Sperli, G. DICO: A Graph-DB Framework for Community Detection on Big Scholarly Data. IEEE Trans. Emerg. Top. Comput. 2019. [Google Scholar] [CrossRef]
- Ouyang, G.; Dey, D.K.; Zhang, P. Clique-Based Method for Social Network Clustering. J. Classif. 2020, 37, 254–274. [Google Scholar] [CrossRef] [Green Version]
- Abdolhosseini-Qomi, A.M.; Yazdani, N.; Asadpour, M. Overlapping communities and the prediction of missing links in multiplex networks. Phys. A Stat. Mech. Its Appl. 2020, 554, 124650. [Google Scholar] [CrossRef]
- Wang, P.; Xu, B.; Wu, Y.; Zhou, X. Link Prediction in Social Networks: The State-of-the-Art. arXiv 2014, arXiv:1411.5118. [Google Scholar] [CrossRef] [Green Version]
- Han, X.; Wang, L.; Han, S.N.; Chen, C.; Crespi, N.; Farahbakhsh, R. Link prediction for new users in Social Networks. In Proceedings of the 2015 IEEE International Conference on Communications (ICC), London, UK, 8–12 June 2015; pp. 1250–1255. [Google Scholar] [CrossRef]
- Berlusconi, G.; Calderoni, F.; Parolini, N.; Verani, M.; Piccardi, C. Link Prediction in Criminal Networks: A Tool for Criminal Intelligence Analysis. PLoS ONE 2016, 11, e0154244. [Google Scholar] [CrossRef]
- Ahmed, C.; ElKorany, A.; Bahgat, R. A supervised learning approach to link prediction in Twitter. Soc. Netw. Anal. Min. 2016, 6, 24. [Google Scholar] [CrossRef]
- Hristova, D.; Noulas, A.; Brown, C.; Musolesi, M.; Mascolo, C. A multilayer approach to multiplexity and link prediction in online geo-social networks. EPJ Data Sci. 2016, 5, 24. [Google Scholar] [CrossRef] [PubMed] [Green Version]
- Martinčić-Ipšić, S.; Močibob, E.; Perc, M. Link prediction on Twitter. PLoS ONE 2017, 12, e0181079. [Google Scholar] [CrossRef] [PubMed] [Green Version]
- Jalili, M.; Orouskhani, Y.; Asgari, M.; Alipourfard, N.; Perc, M. Link prediction in multiplex online social networks. R. Soc. Open Sci. 2017, 4, 160863. [Google Scholar] [CrossRef] [PubMed] [Green Version]
- Sirisup, C.; Songmuang, P. Exploring Efficiency of Data Mining Techniques for Missing Link in Online Social Network. In Proceedings of the 2018 International Joint Symposium on Artificial Intelligence and Natural Language Processing (iSAI-NLP), Pattaya, Thailand, 15–17 November 2018; pp. 1–6. [Google Scholar] [CrossRef]
- Akhtar, M.U.; Ahmad, I.; Khalil, M.I.K.; Ahmed, S. Missing Link Prediction in Complex Networks. Int. J. Sci. Eng. Res. 2018, 9, 82–87. [Google Scholar]
- Mandal, H.; Mirchev, M.; Gramatikov, S.; Mishkovski, I. Multilayer Link Prediction in Online Social Networks. In Proceedings of the 2018 26th Telecommunications Forum (TELFOR), Belgrade, Serbia, 20–21 November 2018; pp. 1–4. [Google Scholar] [CrossRef]
- Ahmad, I.; Akhtar, M.U.; Noor, S.; Shahnaz, A. Missing Link Prediction using Common Neighbor and Centrality based Parameterized Algorithm. Sci. Rep. 2020, 10, 364. [Google Scholar] [CrossRef] [PubMed]
- Adamic, L.A.; Adar, E. Friends and Neighbors on the Web. Soc. Netw. 2001, 25, 211–230. [Google Scholar] [CrossRef] [Green Version]
- Fire, M.; Tenenboim, L.; Lesser, O.; Puzis, R.; Rokach, L.; Elovici, Y. Link Prediction in Social Networks Using Computationally Efficient Topological Features. In Proceedings of the 2011 IEEE Third International Conference on Privacy, Security, Risk and Trust and 2011 IEEE Third International Conference on Social Computing, Boston, MA, USA, 9–11 October 2011; pp. 73–80. [Google Scholar] [CrossRef] [Green Version]
- McAuley, J.; Leskovec, J. Discovering Social Circles in Ego Networks. arXiv 2013, arXiv:1210.8182. [Google Scholar] [CrossRef] [Green Version]
- Pujari, M. Link Prediction in Large-Scale Complex Networks (Application to Bibliographical Networks). Ph.D. Thesis, Université Paris 13, Villetaneuse, France, 2015. [Google Scholar]
- Hoppe, B.; Reinelt, C. Social network analysis and the evaluation of leadership networks. Leadersh. Q. 2010, 21, 600–619. [Google Scholar] [CrossRef]
- Silva, T.; Zhao, L. Semi-supervised learning guided by the modularity measure in complex networks. Neurocomputing 2012, 78, 30–37. [Google Scholar] [CrossRef]
- Guimerà, R.; Danon, L.; Díaz-Guilera, A.; Giralt, F.; Arenas, A. Self-similar community structure in a network of human interactions. Phys. Rev. E 2003, 68. [Google Scholar] [CrossRef] [Green Version]
- McAuley, J.; Leskovec, J. Learning to Discover Social Circles in Ego Networks. In Proceedings of the 25th International Conference on Neural Information Processing Systems (NIPS’12)—Volume 1; Curran Associates Inc.: Red Hook, NY, USA, 2012; pp. 539–547. [Google Scholar]
- Ma, C.M.; Yang, W.S.; Cheng, B.W. How the Parameters of K-nearest Neighbor Algorithm Impact on the Best Classification Accuracy: In Case of Parkinson Dataset. J. Appl. Sci. 2014, 14, 171–176. [Google Scholar] [CrossRef] [Green Version]
- Wang, J.; Neskovic, P.; Cooper, L.N. Improving Nearest Neighbor Rule with a Simple Adaptive Distance Measure. Pattern Recogn. Lett. 2007, 28, 207–213. [Google Scholar] [CrossRef]
- Thomas, A.J.; Petridis, M.; Walters, S.D.; Gheytassi, S.M.; Morgan, R.E. On Predicting the Optimal Number of Hidden Nodes. In Proceedings of the 2015 International Conference on Computational Science and Computational Intelligence (CSCI), Las Vegas, NV, USA, 7–9 December 2015; pp. 565–570. [Google Scholar] [CrossRef]
- Panchal, F.S.; Panchal, M. Review on Methods of Selecting Number of Hidden Nodes in Artificial Neural Network. Int. J. Comput. Sci. Mob. Comput. 2014, 3, 455–464. [Google Scholar]
- Norouzi, M.; Collins, M.D.; Fleet, D.J.; Kohli, P. CO2 Forest: Improved Random Forest by Continuous Optimization of Oblique Splits. arXiv 2015, arXiv:1506.06155. [Google Scholar]
- Cuzzocrea, A.; Francis, S.L.; Gaber, M.M. An Information-Theoretic Approach for Setting the Optimal Number of Decision Trees in Random Forests. In Proceedings of the 2013 IEEE International Conference on Systems, Man, and Cybernetics, Manchester, UK, 13–16 October 2013; pp. 1013–1019. [Google Scholar] [CrossRef]
Figure 1.
Facebook latent feature.

Figure 2.
Social networks with overlapping nodes.

Figure 3.
Node latent relationship.

Figure 4.
Jaccard similarity of the second-order neighbor.

Figure 5.
Twitter latent.

Figure 6.
The relationship between datasets and percentage of recovered links via the link prediction features.
Figure 6.
The relationship between datasets and percentage of recovered links via the link prediction features.

Figure 7.
The relationship between datasets and F1-Measure of link prediction features.


Table 1.
Experiment setting with different datasets and their network-density details.
| Dataset | SN Sources | N | M | D |
|---|---|---|---|---|
| 1 | Twitter (Single-SN) | 200 | 265 | 0.01 |
| 2 | Twitter and Facebook with low density (Multi-SN-low) | 305 | 449 | 0.01 |
| 3 | Twitter and Facebook with high density (Multi-SN-high) | 305 | 823 | 0.02 |
Table 2.
The set of features used in the experiment.
| No. | Basic Features | Combined Features |
|---|---|---|
| 1 | Common neighbor | Common neighbor |
| 2 | Jaccard similarity | Jaccard similarity |
| 3 | Adamic/Adar similarity | Adamic/Adar similarity |
| 4 | Friend measure | Friend measure |
| 5 | Friend of similarity | Enhanced friend of similarity * |
| 6 | Facebook latent | Facebook latent |
| 7 | Common hashtag | Common hashtag |
| 8 | Common user mentioned | Common user mentioned |
| 9 | Frequency of user mentioned | Frequency of user mentioned |
| 10 | Response frequency | Response frequency |
| 11 | Node latent * | |
| 12 | Jaccard similarity of the second-order neighbor * | |
| 13 | Twitter latent * |
* The proposed features.
Table 3.
The percentage of the recovered links of data classification techniques in each dataset using different features.
Table 3.
The percentage of the recovered links of data classification techniques in each dataset using different features.
| Data Classification Techniques | Single-SN | Multi-SN-Low | Multi-SN-High | |||
|---|---|---|---|---|---|---|
| Basic Features | Combined Features | Basic Features | Combined Features | Basic Features | Combined Features | |
| kNN | 73.23 | 68.31 | 71.41 | 74.46 | 70.95 | 91.79 |
| ANN | 75.38 | 66.67 | 77.36 | 81.18 | 75.46 | 90.03 |
| RF | 79.38 | 95.46 | 77.85 | 96.62 | 79.08 | 99.15 |
Table 4.
F1-Measure of data classification techniques in each dataset using different sets of features.
Table 4.
F1-Measure of data classification techniques in each dataset using different sets of features.
| Data Classification Techniques | Single-SN | Multi-SN-Low | Multi-SN-High | |||
|---|---|---|---|---|---|---|
| Basic Features | Combined Features | Basic Features | Combined Features | Basic Features | Combined Features | |
| kNN | 0.66 | 0.67 | 0.69 | 0.63 | 0.69 | 0.86 |
| ANN | 0.73 | 0.74 | 0.73 | 0.63 | 0.76 | 0.84 |
| RF | 0.73 | 0.74 | 0.75 | 0.86 | 0.89 | 0.91 |
Publisher’s Note: MDPI stays neutral with regard to jurisdictional claims in published maps and institutional affiliations. |
© 2021 by the authors. Licensee MDPI, Basel, Switzerland. This article is an open access article distributed under the terms and conditions of the Creative Commons Attribution (CC BY) license (https://creativecommons.org/licenses/by/4.0/).
Share and Cite
MDPI and ACS Style
Songmuang, P.; Sirisup, C.; Suebsriwichai, A. Missing Link Prediction Using Non-Overlapped Features and Multiple Sources of Social Networks. Information 2021, 12, 214. https://0-doi-org.brum.beds.ac.uk/10.3390/info12050214
AMA Style
Songmuang P, Sirisup C, Suebsriwichai A. Missing Link Prediction Using Non-Overlapped Features and Multiple Sources of Social Networks. Information. 2021; 12(5):214. https://0-doi-org.brum.beds.ac.uk/10.3390/info12050214
Chicago/Turabian StyleSongmuang, Pokpong, Chainarong Sirisup, and Aroonwan Suebsriwichai. 2021. "Missing Link Prediction Using Non-Overlapped Features and Multiple Sources of Social Networks" Information 12, no. 5: 214. https://0-doi-org.brum.beds.ac.uk/10.3390/info12050214
Note that from the first issue of 2016, this journal uses article numbers instead of page numbers. See further details here.