
Moderating Effect of Gender on the Relationship between Technology Readiness Index and Consumers’ Continuous Use Intention of Self-Service Restaurant Kiosks


Abstract
:1. Introduction
2. Theoretical Background
2.1. Technology Readiness Index (TRI)
2.2. Continuous Use Intention
2.3. Gender
3. Materials and Methods
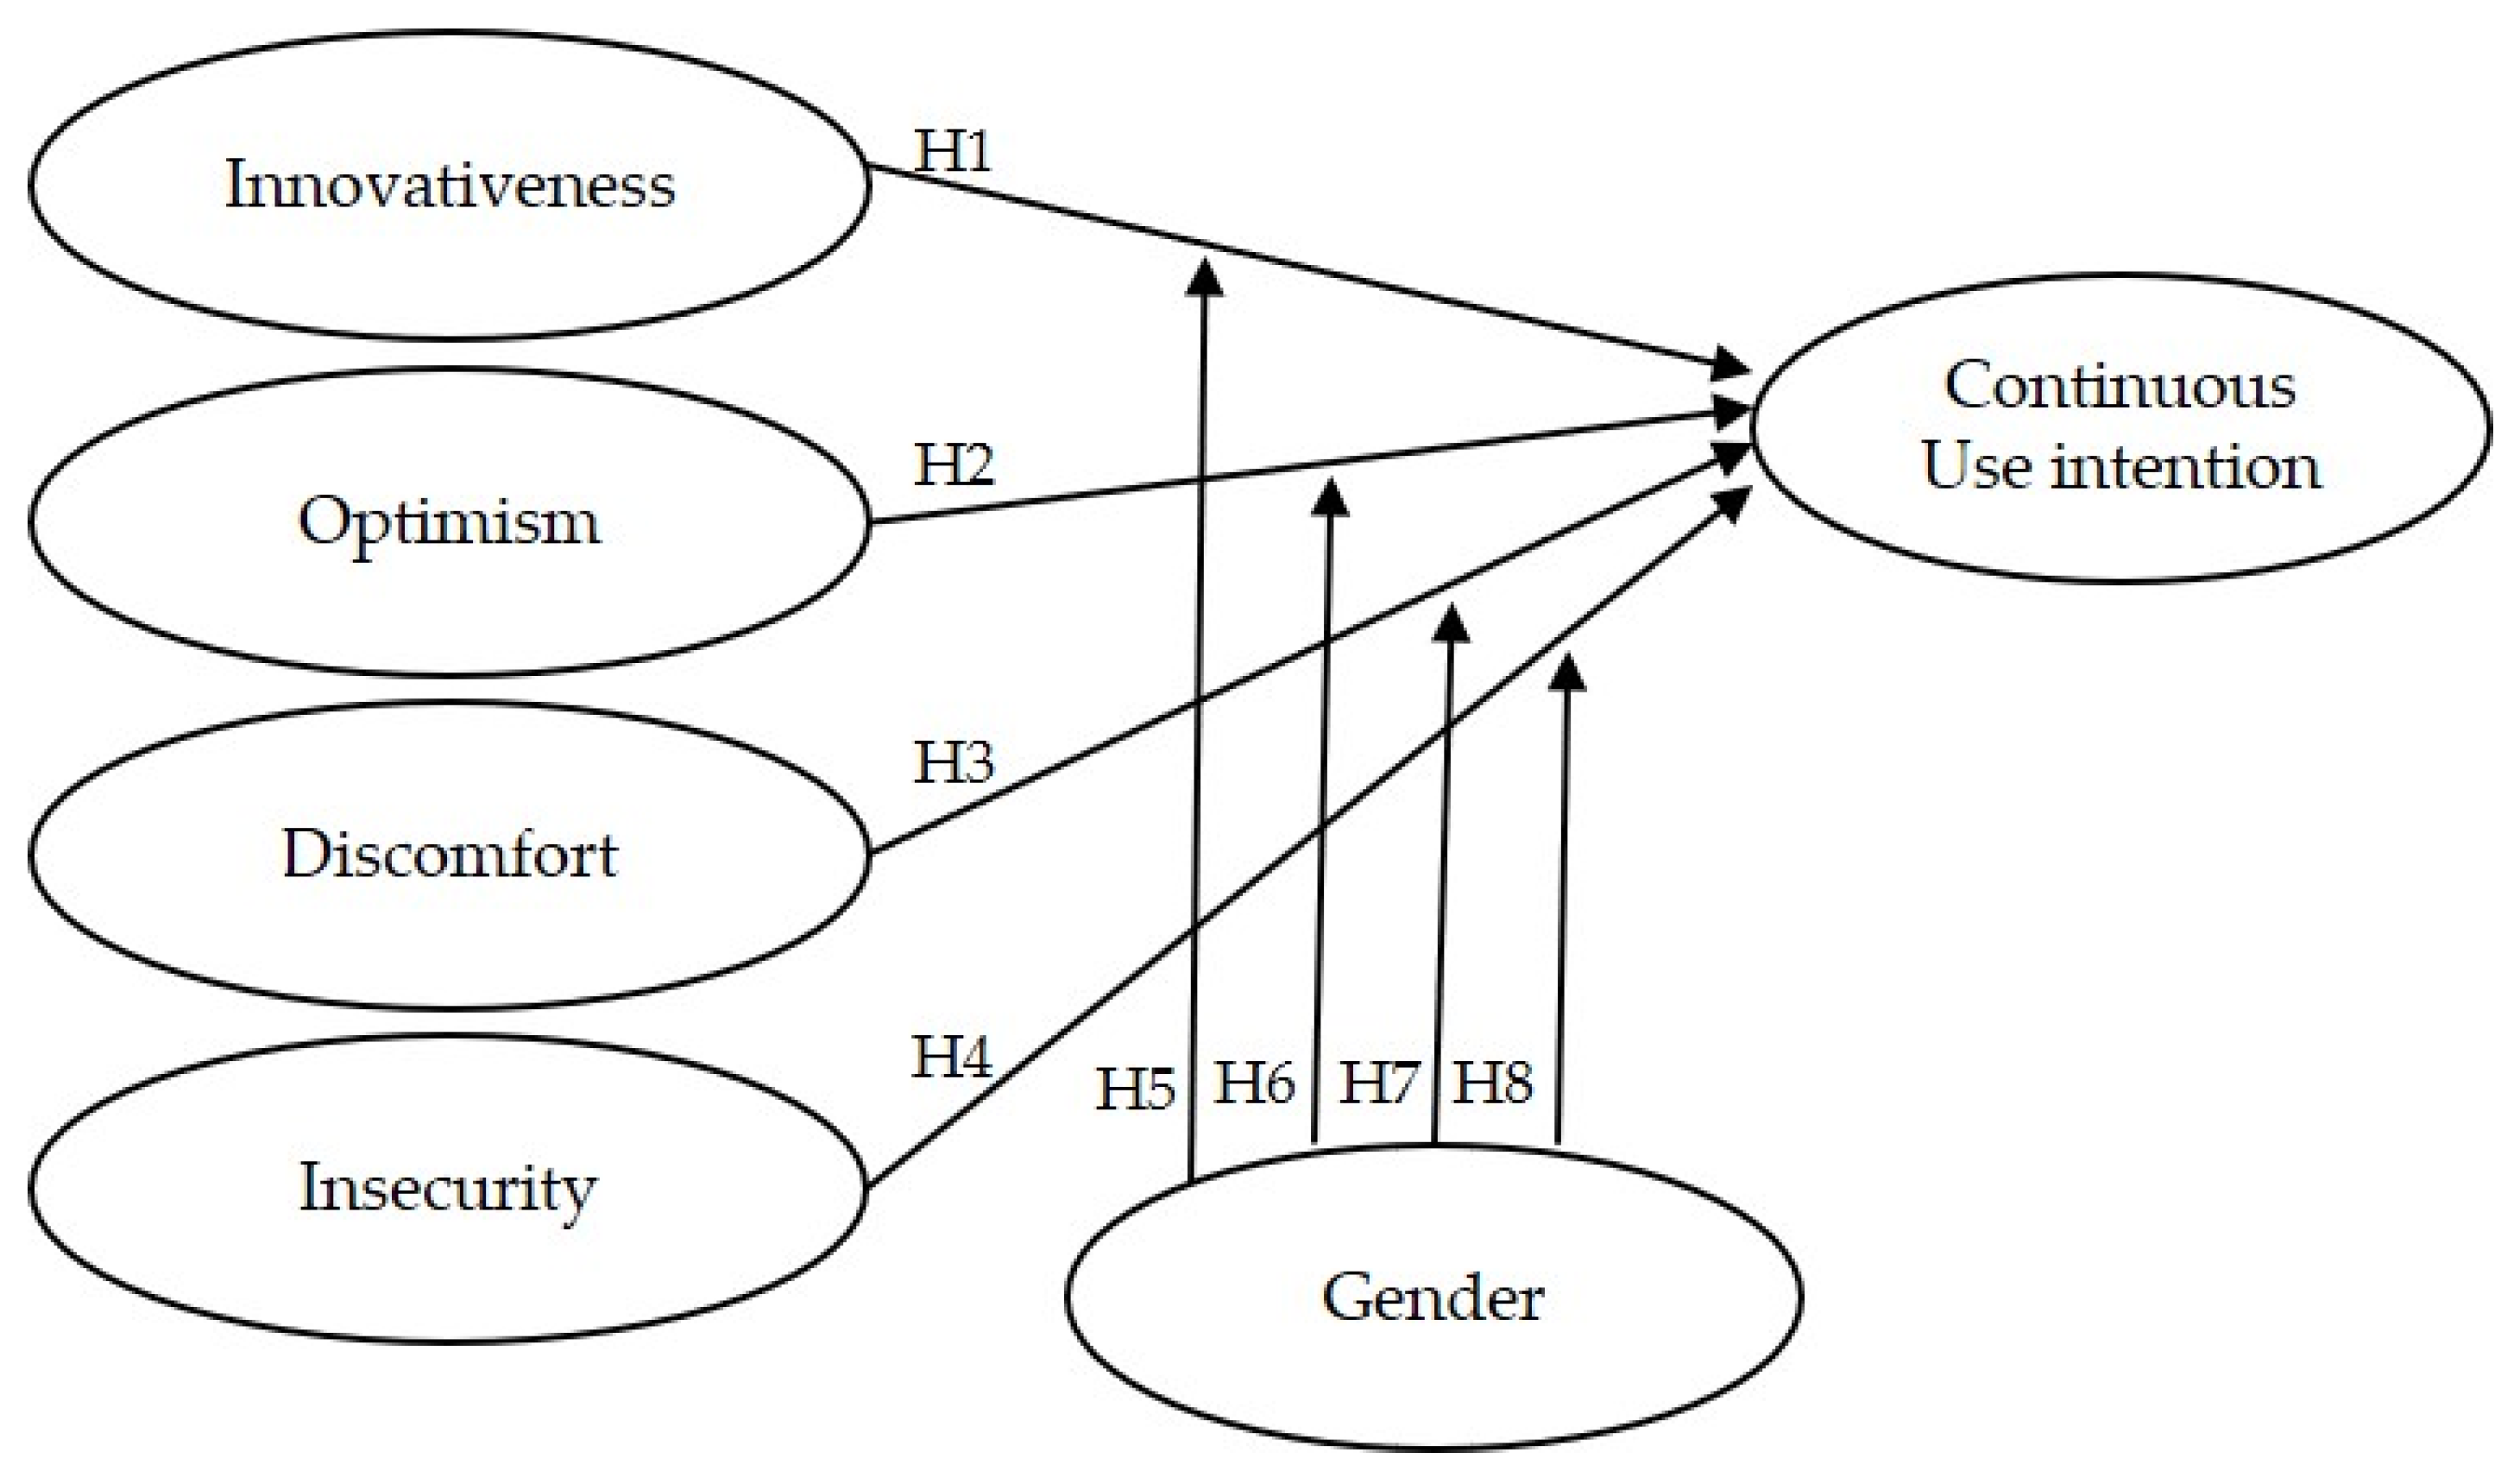
3.1. Measurement Model
3.2. Research Instruments
3.3. Data Collection
3.4. Data Analysis
4. Results
4.1. Participant Characteristics
4.2. Results of Reliability and Validity Analyses
4.3. Descriptive Statistics and Correlation Analysis
4.4. Results of Independent t-Test
4.5. Results of Hypothesis Testing
5. Discussion
Author Contributions
Funding
Institutional Review Board Statement
Informed Consent Statement
Data Availability Statement
Conflicts of Interest
References
- Dabholkar, P.A. Incorporating Choice into an Attitudinal Framework: Analyzing Models of Mental Comparison Processes. J. Consum. Res. 1994, 21, 100–118. [Google Scholar] [CrossRef]
- Jeon, H.A.; Kim, K.A.; Kim, S.H. The Effects of Customer’s Relational Benefits on Continuous Usage Intention of Technology-Based Self-Service: Focusing on Types of Technology-Based Self-Service. J. Mark. Manag. Res. 2018, 23, 27–49. [Google Scholar]
- Chagang, H.J. Impacts of Universal Design Components on Perceived Service Quality and Service Value in Technology-Based Self-Service Environments. Arch. Des. Res. 2010, 23, 115–125. [Google Scholar]
- Korea Agro-Fisheries & Food Trade Corporation. 2019 Food Service Trend Survey; Korea Agro-Fisheries & Food Trade Corporation: Naju, Korea, 2020. [Google Scholar]
- Liljander, V.; Gillberg, F.; Gummerus, J.; Van Riel, A. Technology Readiness and the Evaluation and Adoption of Self-Service Technologies. J. Retail. Consum. Serv. 2006, 13, 177–191. [Google Scholar] [CrossRef]
- Jang, S.J. Examining Factors Affecting the Digital Divide of the Elderly. Media Perform. Arts 2016, 11, 146–170. [Google Scholar]
- Kim, S.W. Past and Future of the Digital Divide: A Bibliometric Analysis and Review. Informatiz. Policy 2011, 18, 103–137. [Google Scholar]
- Seo, J.Y.; Kim, S.I.; Jeong, C. Effects of Technology Readiness on Usage Intention of Smart-Phone Tourism Applications: An Application of the Technology Readiness and Acceptance Model. J. Tour. Sci. 2018, 42, 109–127. [Google Scholar]
- Parasuraman, A. Technology Readiness Index (TRI) a Multiple-Item Scale to Measure Readiness to Embrace New Technologies. J. Serv. Res. 2000, 2, 307–320. [Google Scholar] [CrossRef]
- Lin, C.H.; Shih, H.Y.; Sher, P.J. Integrating Technology Readiness into Technology Acceptance: The TRAM Model. Psychol. Mark. 2007, 24, 641–657. [Google Scholar] [CrossRef]
- Lin, J.S.C.; Chang, H.C. The Role of Technology Readiness in Self-service Technology Acceptance. Manag. Serv. Qual. Int. J. 2011, 21, 424–444. [Google Scholar] [CrossRef]
- Moon, H.Y.; Moon, H.S. Effects of Technology Readiness on Behavioral Intention toward Technology-Based Self-Service: Comparison of Superiority of Construct and Measurement Model for Technology Readiness. J. Hosp. Tour. Stud. 2019, 21, 275–289. [Google Scholar] [CrossRef]
- Livingstone, S.; Van Couvering, E.; Thumim, N. Adult Media Literacy: A Review of the Research Literature; Office of Communications (Ofcom): London, UK, 2005.
- Ozturk, A.B.; Hancer, M. The Effects of Demographics and Past Experience on RFID Technology Acceptance in the Hospitality Industry. Int. J. Hosp. Tour. Adm. 2015, 16, 275–289. [Google Scholar] [CrossRef]
- Venkatesh, V.; Thong, J.Y.; Xu, X. Consumer Acceptance and Use of Information Technology: Extending the Unified Theory of Acceptance and Use of Technology. MIS Q. 2012, 157–178. [Google Scholar] [CrossRef] [Green Version]
- Zhang, L.; Nyheim, P.; Mattila, A.S. The Effect of Power and Gender on Technology Acceptance. J. Hosp. Tour. Technol. 2014, 5, 299–314. [Google Scholar] [CrossRef]
- Ju, K.H.; Kim, D.S.; Kim, J.H. Analysis of Factors Influencing Digital Divide on Elderly and Difference of Gender. Soc. Welf. Policy 2018, 45, 95–121. [Google Scholar]
- Choi, J.E.; Yoo, D.H. The Effects of Consumers’ Gender and Perceived Risk on Their Mobile App Use Intention in Tourism Industry: The Mediating Role of Technology Readiness. Korean Corp. Manag. Rev. 2020, 27, 23–43. [Google Scholar]
- Kim, H.J.; Oh, S.G. Effects of Gender Difference and Perceived Risk on Acceptance Intention of Mobile Easy Payment Service. J. Manag. Econ. 2019, 41, 145–165. [Google Scholar]
- Kim, K.M.; Kim, N.J. Analysis of Food Consumers of Usage Attitude and Usage Intention towards Technology-Based Self-Service (TBSS): Focused on TRAM (Integrated Technology Readiness and Acceptance Model). J. Tour. Leis. Res. 2019, 31, 237–257. [Google Scholar] [CrossRef]
- Lee, S.H. The Effects of Customers’ Technology Readiness on Intention to Use of Technology Based Self Service (TBSS) in Hotel Industry. J. Hotel Resort 2020, 19, 23–43. [Google Scholar]
- Parasuraman, A.; Colby, C.L. An Updated and Streamlined Technology Readiness Index: TRI 2.0. J. Serv. Res. 2015, 18, 59–74. [Google Scholar] [CrossRef]
- An, U.S. A Study on Factors of Determining Continuous Use of SNS: Based on Technology Readiness Acceptance Model. J. Korea Serv. Manag. Soc. 2016, 17, 257–280. [Google Scholar]
- Meng, F.; Park, K.S.; Oh, S.W. The Moderating Effects of Technology Readiness, User Traits and Situational Factors on Usage Attitude and Intention to Technology-Based Self-Service. J. Korea Serv. Manag. Soc. 2017, 18, 69–104. [Google Scholar]
- Tsourela, M.; Roumeliotis, M. The Moderating Role of Technology Readiness, Gender, and Sex in Consumer Acceptance and Actual Use of Technology-Based Services. J. High Technol. Manag. Res. 2015, 26, 124–136. [Google Scholar] [CrossRef]
- Ab Halim, N. Technology Readiness and Users Satisfaction towards Self-Service Technology at Malaysian Airport. Inf. Manag. Bus. Rev. 2012, 4, 453–460. [Google Scholar] [CrossRef] [Green Version]
- Pradhan, M.K.; Oh, J.J.; Lee, H.S. Understanding Travelers’ Behavior for Sustainable Smart Tourism: A Technology Readiness Perspective. Sustainability 2018, 10, 4259. [Google Scholar] [CrossRef] [Green Version]
- Lee, M.H. The Acceptance of Self-Service Technology and Word-of-Mouth Intend According to Individual Traits of Technology Readiness in the Food Franchise Industry. J. Foodserv. Manag. 2019, 22, 7–33. [Google Scholar]
- Lee, W.; Castellanos, C.; Choi, H.S.C. The Effect of Technology Readiness on Customers’ Attitudes toward Self-Service Technology and Its Adoption; the Empirical Study of US Airline Self-Service Check-in Kiosks. J. Travel Tour. Mark. 2012, 29, 731–743. [Google Scholar] [CrossRef]
- Han, S.L.; Park, S.M. Effects of Technology Readiness on the Attitude and Usage Intention of Self Service Technology. Entrue J. Inf. Technol. 2009, 8, 51–63. [Google Scholar]
- Sun, S.; Lee, P.; Law, R. Impact of Cultural Values on Technology Acceptance and Technology Readiness. Int. J. Hosp. Manag. 2019, 77, 89–96. [Google Scholar] [CrossRef]
- Kim, B.G.; Kim, K.W.; Seo, H.I. Effects of Mobile App Service Characteristics on User Satisfaction and Continuance Usage Intention. J. Inf. Technol. Appl. 2019, 26, 99–120. [Google Scholar]
- Park, J.W.; Lee, H.R. The Effect of Fast Food Restaurant Customers’ Kiosk Use on Acceptance Intention and Continuous Use Intention: Applying UTAUT2 Model and Moderating Effect of Familiarity. J. Tour. Sci. 2020, 44, 207–228. [Google Scholar]
- Choi, J.E.; Yoo, D.H.; Choi, S.A. The Effect of Technology Readiness Gap by Tourists’ Age and Risk Perception on Their Mobile Tourism App Use Intention. Tour. Leis. Study 2014, 26, 387–405. [Google Scholar]
- Ahuja, M.K.; Thatcher, J.B. Moving beyond Intentions and toward the Theory of Trying: Effects of Work Environment and Gender on Post-Adoption Information Technology Use. MIS Q. 2005, 427–459. [Google Scholar] [CrossRef]
- Victorino, L.; Karniouchina, E.; Verma, R. Exploring the Use of the Abbreviated Technology Readiness Index for Hotel Customer Segmentation. Cornell Hosp. Q. 2009, 50, 342–359. [Google Scholar] [CrossRef] [Green Version]
- Wang, Y.; Sparks, B. Technology-Enabled Services: Importance and Role of Technology Readiness. Tour. Anal. 2014, 19, 19–33. [Google Scholar] [CrossRef] [Green Version]
- Venkatesh, V.; Morris, M.G.; Davis, G.B.; Davis, F.D. User Acceptance of Information Technology: Toward a Unified View. MIS Q. 2003, 27, 425–478. [Google Scholar] [CrossRef] [Green Version]
- Huang, W.-H.D.; Hood, D.W.; Yoo, S.J. Gender Divide and Acceptance of Collaborative Web 2.0 Applications for Learning in Higher Education. Internet High. Educ. 2013, 16, 57–65. [Google Scholar] [CrossRef]
- Tarhini, A.; Hone, K.; Liu, X. Measuring the Moderating Effect of Gender and Age on E-Learning Acceptance in England: A Structural Equation Modeling Approach for an Extended Technology Acceptance Model. J. Educ. Comput. Res. 2014, 51, 163–184. [Google Scholar] [CrossRef]
- Humbani, M.; Wiese, M. A Cashless Society for All: Determining Consumers’ Readiness to Adopt Mobile Payment Services. J. Afr. Bus. 2018, 19, 409–429. [Google Scholar] [CrossRef] [Green Version]
- Shao, Z.; Zhang, L.; Li, X.; Guo, Y. Antecedents of Trust and Continuance Intention in Mobile Payment Platforms: The Moderating Effect of Gender. Electron. Commer. Res. Appl. 2019, 33, 100823. [Google Scholar] [CrossRef]
- Chawla, D.; Joshi, H. The Moderating Role of Gender and Age in the Adoption of Mobile Wallet. Foresight 2020, 4, 483–504. [Google Scholar] [CrossRef]
- Cheng, Y.; Sharma, S.; Sharma, P.; Kulathunga, K. Role of Personalization in Continuous Use Intention of Mobile News Apps in India: Extending the UTAUT2 Model. Information 2020, 11, 33. [Google Scholar] [CrossRef] [Green Version]
- Prensky, M. Digital Natives, Digital Immigrants. Horiz. 2001, 9, 1–6. [Google Scholar]
- Cho, W.H.; Jeon, H.M. Consumer’s Acceptance Intention on Introduction of Technology-Based Self Service (TBSS) of Fast Food Restaurant: Focused on Value-Based Acceptance Model. J. Foodserv. Manag. 2020, 23, 105–129. [Google Scholar]
- Baron, R.M.; Kenny, D.A. The Moderator–Mediator Variable Distinction in Social Psychological Research: Conceptual, Strategic, and Statistical Considerations. J. Pers. Soc. Psychol. 1986, 51, 1173. [Google Scholar] [CrossRef] [PubMed]
- Hong, S.H.; Jung, S. Testing the Interaction Effects in Regression and Structural Equation Models: Theories and Procedures. Korean J. Hum. Dev. 2014, 21, 1–24. [Google Scholar] [CrossRef]


| Characteristics | Frequency | Percentage (%) | |
|---|---|---|---|
| Gender | Female | 155 | 48.4 |
| Male | 165 | 51.6 | |
| Age | 40 s | 146 | 45.6 |
| 50 s | 102 | 31.9 | |
| 60 s and older | 72 | 22.5 | |
| Marital status | Single | 46 | 14.4 |
| Married | 243 | 75.9 | |
| Other | 31 | 9.7 | |
| Educational level | High school | 44 | 13.8 |
| College degree | 107 | 33.4 | |
| Bachelor’s degree | 118 | 36.9 | |
| Master’s or doctoral degree | 51 | 15.9 | |
| Frequency of using the self-service kiosk per week | 1–3 times | 207 | 64.7 |
| 4–6 times | 96 | 30.0 | |
| More than 7 times | 17 | 5.3 | |
| Total | 320 | 100.0 | |
| Scale Items | Loading | Eigenvalue |
|---|---|---|
| Innovativeness (Variance = 15.817%, Cronbach’s α = 0.832) | 3.005 | |
| In general, I am among the first in my circle of friends to adopt new technology when it appears | 0.884 | |
| Other people come to me for advice on new technologies | 0.835 | |
| I can usually figure out new high-tech products and services without help from others | 0.833 | |
| I keep up with the latest technological developments in my areas of interest | 0.560 | |
| Discomfort (Variance = 15.118%, Cronbach’s α = 0.857) | 2.872 | |
| When I get technical support from a provider of a high-tech product or service, I sometimes feel as if I am being exploited by someone who knows more than I do | 0.910 | |
| Technical support lines are not helpful because they do not explain things in terms I understand | 0.844 | |
| Sometimes, I think that technology systems are not designed for usage by ordinary people | 0.826 | |
| There is no such thing as a manual for a high-tech product or service that is written in plain language | 0.729 | |
| Optimism (Variance = 13.623%, Cronbach’s α = 0.791) | 2.588 | |
| Technology gives me more freedom of mobility | 0.884 | |
| Technology makes me more productive in my personal life | 0.842 | |
| New technologies contribute to a better quality of life | 0.674 | |
| Technology gives people more control over their daily lives | 0.600 | |
| Insecurity (Variance = 13.438%, Cronbach’s α = 0.804) | 2.553 | |
| Technology lowers the quality of relationships by reducing personal interaction | 0.875 | |
| Too much technology distracts people to a point that is harmful | 0.800 | |
| I do not feel confident doing business with a place that can only be reached online | 0.756 | |
| People are too dependent on technology to do things for them | 0.701 | |
| Continuous use intention (Variance = 10.321%, Cronbach’s α = 0.755) | 1.961 | |
| I intend to continue using self-service kiosks in the future | 0.845 | |
| I will always try to use self-service kiosks in my daily life | 0.834 | |
| I will keep using self-service kiosks as regularly as I do now | 0.559 | |
| Factor | 1 | 2 | 3 | 4 | 5 | 6 |
|---|---|---|---|---|---|---|
| 1. Innovativeness | 1 | |||||
| 2. Optimism | 0.175 ** | 1 | ||||
| 3. Discomfort | −0.051 | 0.173 ** | 1 | |||
| 4. Insecurity | −0.050 | 0.284 *** | 0.098 | 1 | ||
| 5. Gender | 0.246 *** | 0.226 *** | −0.133 * | 0.009 | 1 | |
| 6. Continuous use intention | 0.535 *** | 0.203 *** | −0.127 * | −0.017 | 0.312 *** | 1 |
| Mean | 3.09 | 3.19 | 3.20 | 3.67 | 1.52 | 3.35 |
| SD | 0.51 | 0.50 | 0.48 | 0.44 | 0.50 | 0.47 |
| Mean | SD | t | ||
|---|---|---|---|---|
| Innovativeness | Female | 3.07 | 0.51 | −4.134 ** |
| Male | 3.30 | 0.47 | ||
| Optimism | Female | 2.96 | 0.57 | −4.483 ** |
| Male | 3.21 | 0.41 | ||
| Discomfort | Female | 3.27 | 0.51 | 2.394 * |
| Male | 3.14 | 0.44 | ||
| Insecurity | Female | 3.67 | 0.44 | −0.166 |
| Male | 3.66 | 0.44 | ||
| Model 1 | Model 2 | Model 3 | |||||||
|---|---|---|---|---|---|---|---|---|---|
| B | β | t | B | β | t | B | Β | t | |
| (Constant) | 3.352 | 154.193 *** | 3.352 | 156.501 *** | 3.325 | 146.608 *** | |||
| Innovativeness(A) | 0.46 | 0.503 | 10.517 *** | 0.431 | 0.472 | 9.808 *** | 0.494 | 0.54 | 10.639 *** |
| Optimism(B) | 0.132 | 0.142 | 2.822 ** | 0.098 | 0.106 | 2.081 * | 0.12 | 0.129 | 2.553 * |
| Discomfort(C) | −0.12 | −0.124 | −2.604 * | −0.095 | −0.099 | −2.073 * | −0.129 | −0.133 | −2.751 ** |
| Insecurity(D) | −0.021 | −0.02 | −0.407 | −0.016 | −0.015 | −0.315 | −0.003 | −0.003 | −0.054 |
| Gender(E) | 0.148 | 0.159 | 3.241 *** | 0.127 | 0.136 | 2.792 ** | |||
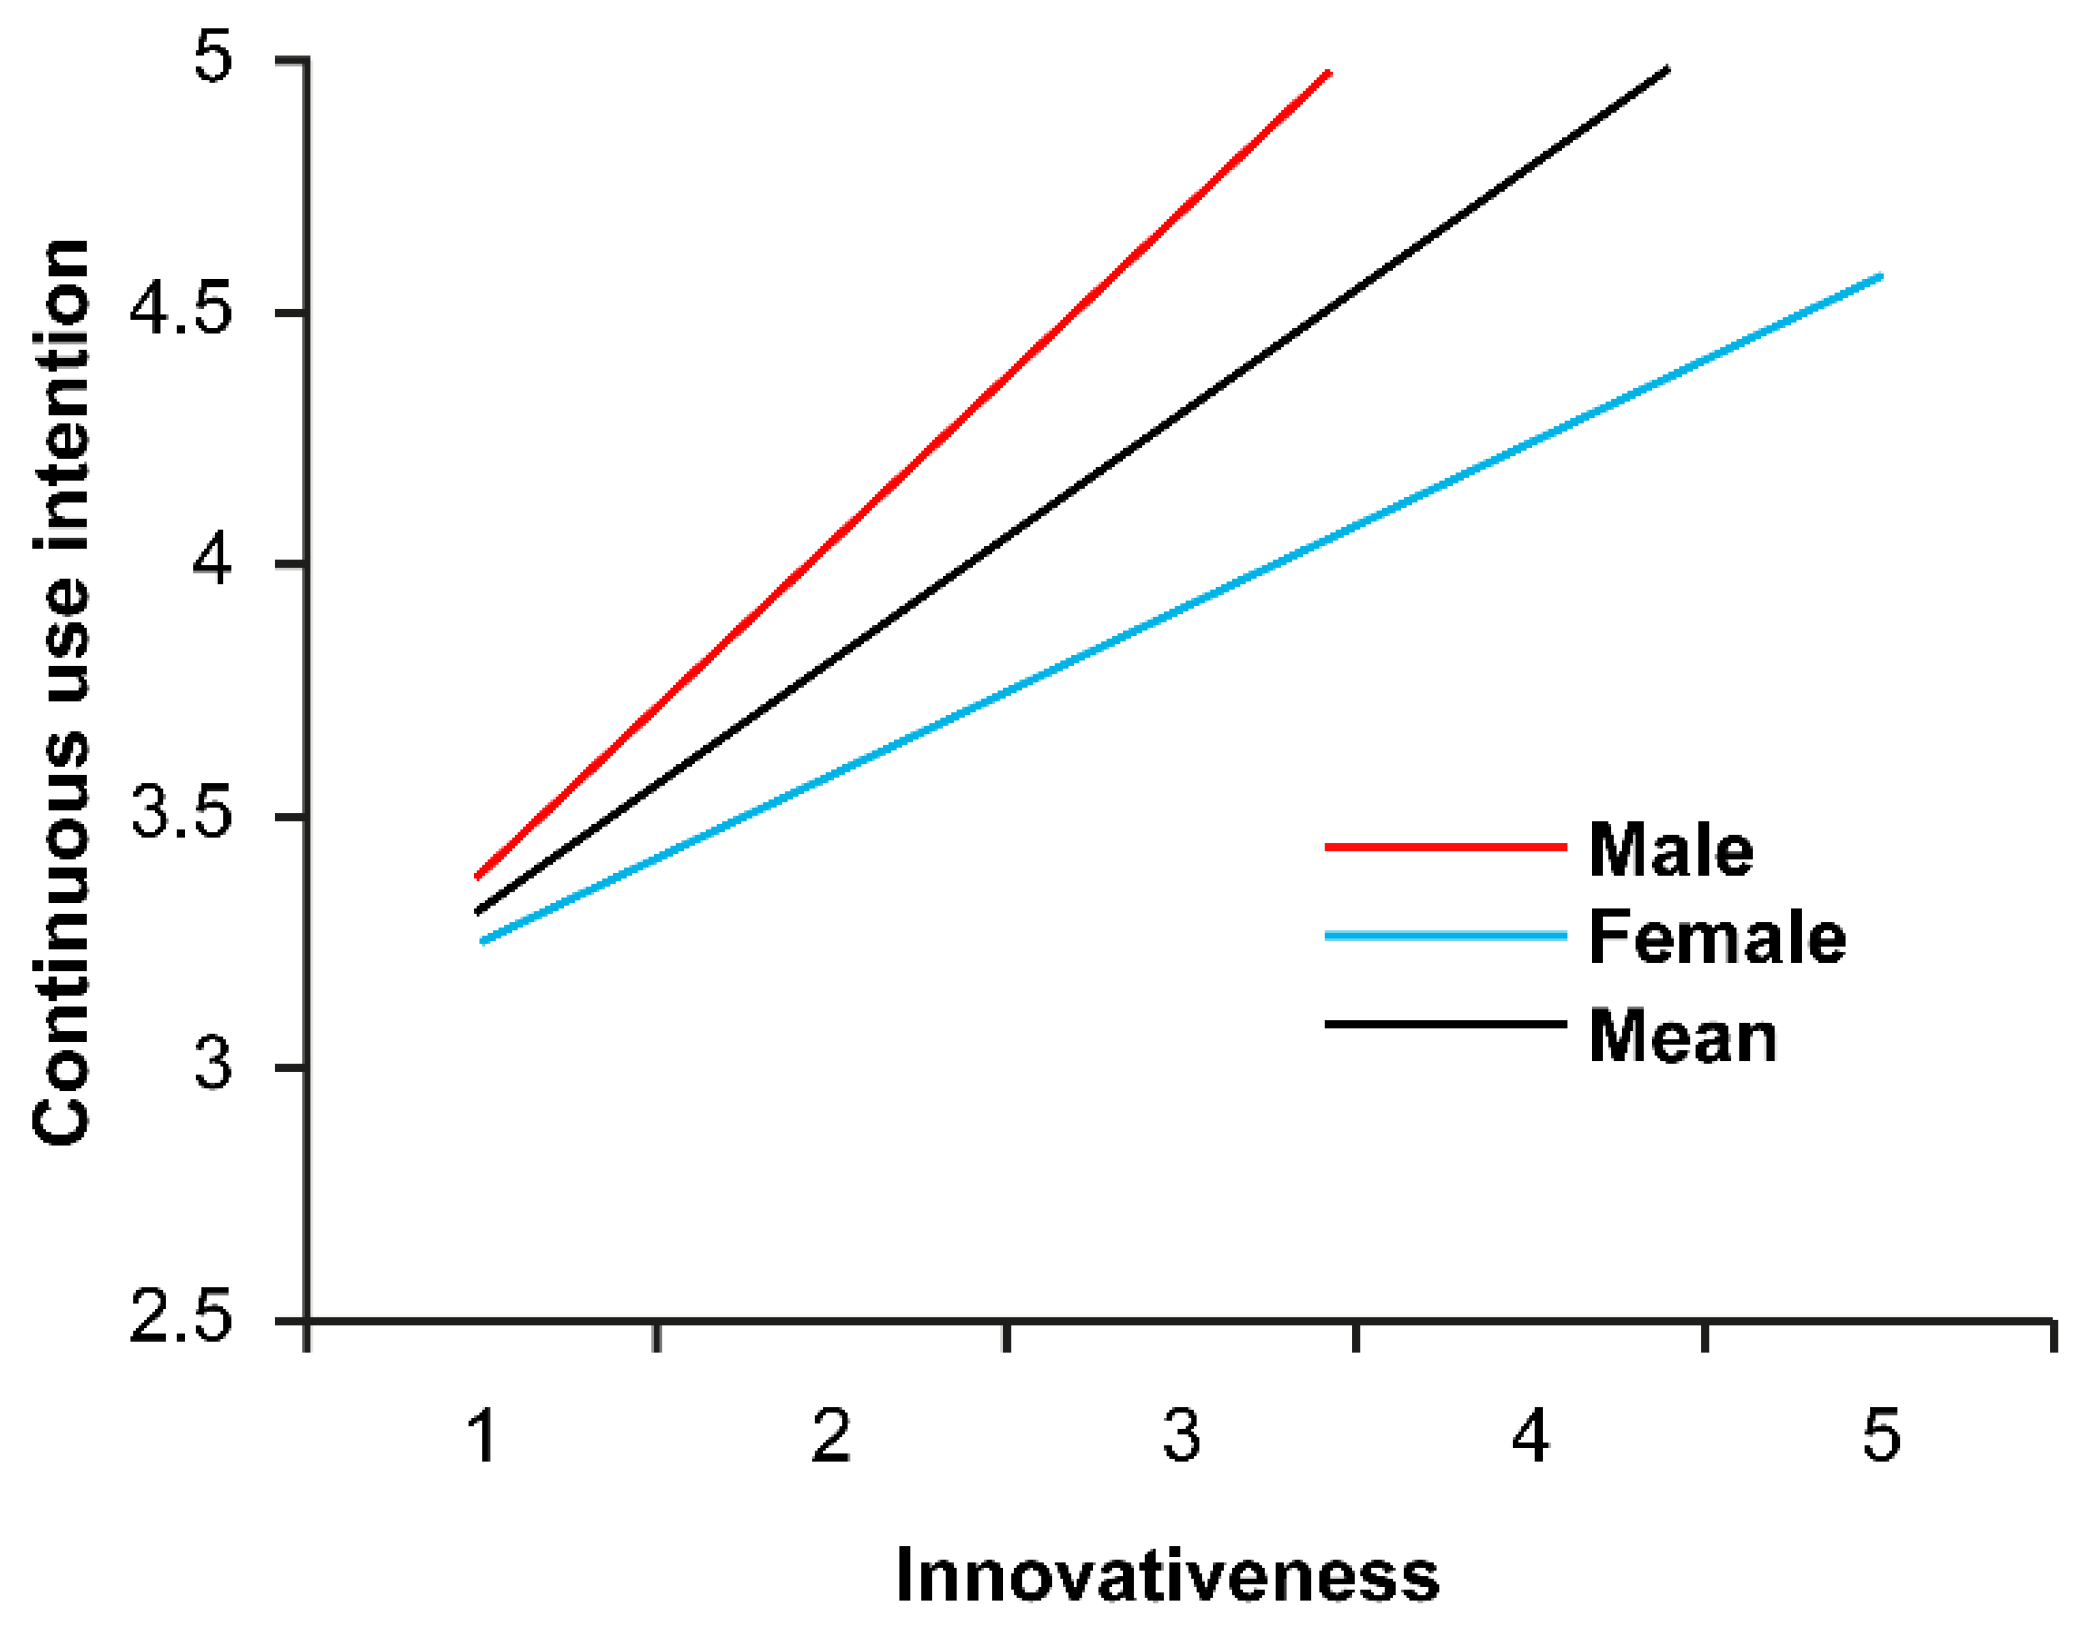
| A × E | 0.33 | 0.177 | 3.588 *** | ||||||
| B × E | 0.069 | 0.036 | 0.737 | ||||||
| C × E | −0.055 | −0.028 | −0.594 | ||||||
| D × E | 0.119 | 0.055 | 1.163 | ||||||
| R2(adj.R2) | 0.314 (0.305) | 0.336 (0.326) | 0.36 8 (0.349) | ||||||
| ∆R2 | 0.314 | 0.022 | 0.031 | ||||||
| F | 36.044 *** | 31.806 *** | 20.027 *** | ||||||
| F variation | 36.044 *** | 10.503 *** | 3.856 ** | ||||||
Publisher’s Note: MDPI stays neutral with regard to jurisdictional claims in published maps and institutional affiliations. |
© 2021 by the authors. Licensee MDPI, Basel, Switzerland. This article is an open access article distributed under the terms and conditions of the Creative Commons Attribution (CC BY) license (https://creativecommons.org/licenses/by/4.0/).
Share and Cite
Na, T.-K.; Lee, S.-H.; Yang, J.-Y. Moderating Effect of Gender on the Relationship between Technology Readiness Index and Consumers’ Continuous Use Intention of Self-Service Restaurant Kiosks. Information 2021, 12, 280. https://0-doi-org.brum.beds.ac.uk/10.3390/info12070280
Na T-K, Lee S-H, Yang J-Y. Moderating Effect of Gender on the Relationship between Technology Readiness Index and Consumers’ Continuous Use Intention of Self-Service Restaurant Kiosks. Information. 2021; 12(7):280. https://0-doi-org.brum.beds.ac.uk/10.3390/info12070280
Chicago/Turabian StyleNa, Tae-Kyun, Sun-Ho Lee, and Jae-Yeon Yang. 2021. "Moderating Effect of Gender on the Relationship between Technology Readiness Index and Consumers’ Continuous Use Intention of Self-Service Restaurant Kiosks" Information 12, no. 7: 280. https://0-doi-org.brum.beds.ac.uk/10.3390/info12070280